Attached files
Table of Contents
Index to Financial Statements
As filed with the Securities and Exchange Commission on November 14, 2011
Registration No. 333-
UNITED STATES
SECURITIES AND EXCHANGE COMMISSION
Washington, D.C. 20549
FORM S-1
REGISTRATION STATEMENT
UNDER
THE SECURITIES ACT OF 1933
Midstates Petroleum Company, Inc.
(Exact name of registrant as specified in its charter)
| Delaware | 1311 | 45-3691816 | ||
| (State or other jurisdiction of incorporation or organization) |
(Primary Standard Industrial Classification Code Number) |
(I.R.S. Employer Identification No.) |
4400 Post Oak Parkway, Suite 1900
Houston, Texas 77027
(713) 595-9400
(Address, including zip code, and telephone number, including area code, of registrant’s principal executive offices)
John Foley
Corporate Counsel
4400 Post Oak Parkway, Suite 1900
Houston, Texas 77027
(713) 595-9400
(Name, address, including zip code, and telephone number, including area code, of agent for service)
Copies to:
| David P. Oelman Matthew R. Pacey Vinson & Elkins L.L.P. 1001 Fannin, Suite 2500 Houston, Texas 77002-6760 (713) 758-2222 |
Joshua Davidson Kelly B. Rose Baker Botts L.L.P. One Shell Plaza Houston, Texas 77002-4995 (713) 229-1234 |
Approximate date of commencement of proposed sale to the public: As soon as practicable after the effective date of this Registration Statement.
If any of the securities being registered on this Form are to be offered on a delayed or continuous basis pursuant to Rule 415 under the Securities Act of 1933 check the following box: ¨
If this Form is filed to register additional securities for an offering pursuant to Rule 462(b) under the Securities Act, please check the following box and list the Securities Act registration statement number of the earlier effective registration statement for the same offering. ¨
If this Form is a post-effective amendment filed pursuant to Rule 462(c) under the Securities Act, check the following box and list the Securities Act registration statement number of the earlier effective registration statement for the same offering. ¨
If this Form is a post-effective amendment filed pursuant to Rule 462(d) under the Securities Act, check the following box and list the Securities Act registration statement number of the earlier effective registration statement for the same offering. ¨
Indicate by check mark whether the registrant is a large accelerated filer, an accelerated filer, a non-accelerated filer, or a smaller reporting company. See the definitions of “large accelerated filer,” “accelerated filer” and “smaller reporting company” in Rule 12b-2 of the Exchange Act.
| Large accelerated filer | ¨ | Accelerated filer | ¨ | |||||
| Non-accelerated filer | x | (Do not check if a smaller reporting company) | Smaller reporting company | ¨ |
CALCULATION OF REGISTRATION FEE
|
| ||||
| Title of Each Class of Securities to Be Registered |
Proposed Maximum Aggregate Offering Price (1)(2) |
Amount of Registration Fee | ||
| Common Stock, par value $0.01 per share |
$ 400,000,000 | $ 45,840 | ||
|
| ||||
|
| ||||
| (1) | Includes shares of common stock issuable upon exercise of the underwriters’ option to purchase additional shares of common stock. |
| (2) | Estimated solely for the purpose of calculating the registration fee pursuant to Rule 457(o) under the Securities Act of 1933. |
The registrant hereby amends this Registration Statement on such date or dates as may be necessary to delay its effective date until the registrant shall file a further amendment which specifically states that this Registration Statement shall thereafter become effective in accordance with Section 8(a) of the Securities Act of 1933 or until this Registration Statement shall become effective on such date as the Securities and Exchange Commission, acting pursuant to said Section 8(a), may determine.
Table of Contents
Index to Financial Statements
The information in this preliminary prospectus is not complete and may be changed. These securities may not be sold until the registration statement filed with the Securities and Exchange Commission is effective. This preliminary prospectus is not an offer to sell nor does it seek an offer to buy these securities in any jurisdiction where the offer or sale is not permitted.
Subject to Completion. Dated November 14, 2011
PROSPECTUS
Shares

Midstates Petroleum Company, Inc.
COMMON STOCK
Midstates Petroleum Company, Inc. is offering shares of its common stock and the selling stockholders named in this prospectus are offering shares of common stock. We will not receive any proceeds from the sale of shares by the selling stockholders.
This is our initial public offering, and no public market currently exists for our shares. We anticipate that the initial public offering price of our common stock will be between $ and $ per share.
We intend to apply to list our common stock on the New York Stock Exchange under the symbol “MPO.”
Investing in our common stock involves risks. See “Risk Factors” beginning on page 16.
The Securities and Exchange Commission and state securities regulators have not approved or disapproved of these securities, or determined if this prospectus is truthful or complete. Any representation to the contrary is a criminal offense.
PRICE $ PER SHARE
| Price to Public | Underwriting Discounts and Commissions |
Proceeds to Company |
Proceeds to Selling Stockholder | |||||
| Per Share |
||||||||
| Total |
Midstates Petroleum Company, Inc. and the selling stockholders have granted the underwriters the right to purchase up to an additional shares of common stock.
The underwriters expect to deliver the shares of common stock to purchasers on or about , 2012.
Joint Book-Running Managers
| Goldman, Sachs & Co. | ||||||
| Morgan Stanley | ||||||
| Wells Fargo Securities | ||||||
Prospectus dated , 2012
Table of Contents
Index to Financial Statements

Table of Contents
Index to Financial Statements
You should rely only on the information contained in this prospectus and any free writing prospectus prepared by or on behalf of us or to which we have referred you. Neither we nor the selling stockholders have authorized anyone to provide you with information different from that contained in this prospectus and any free writing prospectus. We take no responsibility for, and can provide no assurance as to the reliability of, any other information that others may give you. We and the selling stockholders are offering to sell shares of common stock and seeking offers to buy shares of common stock only in jurisdictions where offers and sales are permitted. The information in this prospectus is accurate only as of the date of this prospectus, regardless of the time of delivery of this prospectus or any sale of the common stock. Our business, financial condition, results of operations and prospects may have changed since that date.
Through and including , 2012 (the 25th day after the date of this prospectus), all dealers effecting transactions in these securities, whether or not participating in this offering, may be required to deliver a prospectus. This is in addition to a dealer’s obligation to deliver a prospectus when acting as an underwriter and with respect to an unsold allotment or subscription.
This prospectus contains forward-looking statements that are subject to a number of risks and uncertainties, many of which are beyond our control. See “Risk Factors” and “Cautionary Note Regarding Forward-Looking Statements.”
Industry and Market Data
The market data and certain other statistical information used throughout this prospectus are based on independent industry publications, government publications or other published independent sources. Some data is also based on our good faith estimates. Although we believe these third-party sources are reliable as of their respective dates, neither we nor the underwriters have independently verified the accuracy or completeness of this information. The industry in which we operate is subject to a high degree of uncertainty and risk due to a variety of factors, including those described in the section entitled “Risk Factors.” These and other factors could cause results to differ materially from those expressed in these publications.
i
Table of Contents
Index to Financial Statements
This summary provides a brief overview of information contained elsewhere in this prospectus and is qualified in its entirety by the more detailed information and financial statements included elsewhere in this prospectus. Because it is abbreviated, this summary does not contain all of the information that you should consider before investing in our common stock. You should read the entire prospectus carefully before making an investment decision, including the information presented under the headings “Risk Factors,” “Cautionary Note Regarding Forward-Looking Statements” and “Management’s Discussion and Analysis of Financial Condition and Results of Operations” and the historical consolidated financial statements and the related notes to those financial statements included elsewhere in this prospectus. Unless otherwise indicated, the information presented in this prospectus assumes that the underwriters’ option to purchase additional shares of common stock is not exercised. We have provided definitions for certain oil and natural gas terms used in this prospectus in the “Glossary of Oil and Natural Gas Terms” beginning on page A-1 of this prospectus.
In this prospectus, unless the context otherwise requires, the terms “we,” “us,” “our,” and the “Company” refer to Midstates Petroleum Holdings LLC and its subsidiaries before the completion of our corporate reorganization and Midstates Petroleum Company, Inc. and its subsidiaries as of the completion of our corporate reorganization and thereafter. See “Corporate Reorganization” beginning on page 106.
MIDSTATES PETROLEUM COMPANY, INC.
Overview
We are an independent exploration and production company focused on the application of modern drilling and completion techniques to oil-prone resources in previously discovered yet underdeveloped hydrocarbon trends. We were founded in 1993 to focus on oilfields in the Upper Gulf Coast Tertiary trend onshore in central Louisiana. The Upper Gulf Coast Tertiary trend extends from south Texas to Mississippi across our current operating areas in central Louisiana and is characterized by well-defined geology, including tight sands featuring multiple productive zones typically located within large geologic traps. Many of the oilfields in this trend were discovered by major oil companies in the 1940’s and 1950’s, but were not fully developed due to then-prevailing oil prices, the adoption of a state-level severance tax in Louisiana, restrictive production allowables and other regulatory limitations. We have applied modern formation evaluation and drilling and completion techniques to the trend, and, as a result, we have identified a large inventory of development drilling opportunities that we believe will provide strong economic returns. Our early entry and relatively long history in the trend have positioned us as a first-mover. We have accumulated approximately 64,700 net acres in the trend and have options to acquire an aggregate of approximately 31,700 additional targeted net acres.
Our development operations are currently focused in the Wilcox interval of the trend, drilling vertical wells and commingling production from multi-stage hydraulically fractured completions across stacked oil-producing intervals. Our strategy has been validated by the 42 gross wells we have drilled in the trend, approximately 90% of which produced commercially, since the third quarter of 2008. Over the past three years, we have increased our average daily production at a compound annual growth rate of 99%, from 1,024 Boe/d in the month ended September 30, 2008 to 8,033 Boe/d in the month ended September 30, 2011. We believe that, based on the results of our drilling program and our understanding of the geology underlying our acreage, we have a total of 601 specifically identified gross vertical drilling locations in the trend. In addition, we believe this trend may further benefit from the application of horizontal drilling and completion techniques. We intend to test this concept by drilling our first horizontal well by the end of 2011.
1
Table of Contents
Index to Financial Statements
Netherland, Sewell & Associates, Inc. (“NSAI”), our independent reserve engineers, estimated our net proved reserves to be 24.3 MMBoe as of September 30, 2011, 74% of which were comprised of oil and natural gas liquids (“NGLs”). As of September 30, 2011, our properties included approximately 86 gross active producing wells, 94% of which we operate, and in which we held an average working interest of approximately 99% across our 64,700 net acre leasehold. The following table presents summary data regarding our reserves and production for each of our four primary operating areas as well as other acreage we hold that we have identified as having significant hydrocarbon structures, as measured by either production tests or well log analysis, which we refer to as our expansion areas. The information in the table is as of September 30, 2011, unless otherwise indicated:
| Average Daily Production (1) |
Estimated Net Proved Reserves |
Acreage | Identified Vertical Drilling Locations (3) |
Budget | ||||||||||||||||||||||||||||||||
| 2011 Wells (4) |
2012 Wells |
2012 D&C (5) |
||||||||||||||||||||||||||||||||||
| (Boe/d) | (% Oil) (2) | (MMBoe) | (Gross) | (Net) | (Gross) | (Gross) | (Gross) | (In millions) | ||||||||||||||||||||||||||||
| Pine Prairie |
3,728 | 68 | % | 10.0 | 2,957 | 2,940 | 149 | 20 | 13 | $ | 50 | |||||||||||||||||||||||||
| South Bearhead Creek/Oretta |
2,908 | 70 | % | 6.0 | 3,646 | 3,560 | 38 | 8 | 10 | 56 | ||||||||||||||||||||||||||
| West Gordon |
516 | 70 | % | 5.0 | 12,896 | 12,686 | 75 | 9 | 13 | 72 | ||||||||||||||||||||||||||
| North Cowards Gully |
167 | 79 | % | 2.8 | 7,042 | 7,042 | 75 | 1 | 3 | 10 | ||||||||||||||||||||||||||
| Expansion Areas (6): |
||||||||||||||||||||||||||||||||||||
| Acreage under lease |
57 | 100 | % | 0.5 | 39,188 | 38,464 | 264 | 4 | 21 | 105 | ||||||||||||||||||||||||||
| Acreage under option |
— | — | — | 32,067 | 31,669 | — | — | — | — | |||||||||||||||||||||||||||
|
|
|
|
|
|
|
|
|
|
|
|
|
|
|
|
|
|||||||||||||||||||||
| Total |
7,376 | 70 | % | 24.3 | 97,796 | 96,361 | 601 | 42 | 60 | $ | 293 | |||||||||||||||||||||||||
|
|
|
|
|
|
|
|
|
|
|
|
|
|
|
|
|
|||||||||||||||||||||
| (1) | Average daily production for the three months ended September 30, 2011. |
| (2) | Includes volumes attributable to oil and NGLs. |
| (3) | Our drilling locations are specifically identified based on our interpretation of 2D and 3D seismic data, study of previously drilled wells and analogous well performance. We have selected our drilling locations to optimize the initial testing and subsequent delineation of all potential reservoirs in a given field or geologic structure. Drilling locations in our Pine Prairie area are primarily based on 10-acre spacing, while other drilling locations are primarily based on 40-acre spacing or greater. Of our 601 specifically identified gross vertical drilling locations, approximately 83 are classified as proved undeveloped according to NSAI’s September 30, 2011 reserve report. |
| (4) | Includes wells spud or expected to be spud between January 1, 2011 and December 31, 2011. |
| (5) | Represents drilling and completion expenditures. |
| (6) | For a description of our expansion areas, see “Business — Our Areas of Operation — Expansion Areas Within the Trend.” |
Our total 2011 capital expenditure budget is $275 million. Through September 30, 2011, approximately $179 million of our 2011 budget has been spent, and we have drilled or spud 27 wells out of 42 wells in our 2011 drilling plan. Our total 2012 capital expenditure budget is $353 million, approximately 30% of which will be spent developing acreage currently under lease in our expansion areas. Our 2012 budget consists of:
| • | $293 million for drilling and completion capital; |
| • | $52 million for acquisition of acreage and seismic data; and |
| • | $8 million in unallocated funds which are available for facilities. |
While we have budgeted $353 million for these purposes, the ultimate amount of capital we will expend may fluctuate materially based on market conditions and the success of our drilling results as the year progresses. Please see “Management’s Discussion and Analysis of Financial Condition and Results of Operations — Liquidity and Capital Resources” beginning on page 52.
2
Table of Contents
Index to Financial Statements
Our Business Strategy
Our goal is to increase stockholder value by growing reserves, production and cash flows at an attractive return on invested capital. We seek to achieve this goal through the following strategies:
| • | Accelerate development of our multi-year drilling inventory. We intend to drill and develop our current acreage position to maximize the value of our resource potential. Our assets are characterized by easily identifiable, thick geologic sections of tight sands featuring multiple productive zones typically located within large geologic traps. Our primary operating areas have well-established production histories and relatively low terminal production decline rates. We have identified an inventory of 601 gross vertical drilling locations targeting large, well-defined geologic structures that we believe will increase our reserves, production and cash flow. Since the third quarter of 2008, we have drilled 42 gross wells in the trend, approximately 90% of which produced commercially, making us the most active driller in the trend during that period. Our 2011 drilling plan contemplates using three drilling rigs to drill approximately 42 gross wells, 27 of which we had drilled or spud as of September 30, 2011. We expect to operate up to six drilling rigs by the end of 2012, which would enable us to drill as many as 60 gross operated wells during that year, 21 of which we anticipate drilling in our expansion areas. |
| • | Utilize our technical and operating expertise to enhance returns. Our management team is focused on the application of modern reservoir evaluation and drilling and completion techniques to reduce risk and enhance returns. We utilize relatively inexpensive 2D seismic data and existing sub-surface well control data to identify large, undeveloped or under-developed geologic traps that we believe have significant development potential as targets for our leasing activity. Once we have identified a potential target, we attempt to efficiently verify the economic viability of the target reservoir utilizing existing wellbores and techniques such as sidetracking and slim-hole drilling. Once the development potential of the target reservoir has been established, we seek to economically develop the opportunity by incorporating 3D seismic data and reservoir evaluation methods such as conventional and rotary sidewall coring, pressure sampling and other reservoir description techniques. We have accumulated 3D seismic data covering 90% of the acreage in our primary operating areas and 60% of our total acreage. We believe our primary operating areas represent the successful execution of this exploration to development approach. We are applying this same approach to our expansion areas, where we have recently leased approximately 38,000 net acres and have also entered into lease option agreements covering approximately 31,700 additional net targeted acres. We believe future development across our entire acreage position may be further optimized through specialized completion techniques, infill drilling, horizontal drilling and other enhanced recovery methods. |
| • | Strategically increase our acreage position. While we believe our existing inventory of specifically identified drilling locations provides significant growth opportunities, we continue to use the in-depth knowledge that we have gained as a first mover in the region to increase our leasehold position in the oil-prone portion of the Upper Gulf Coast Tertiary trend. We believe that this portion of the trend extends from east Texas through central Louisiana and into southern Mississippi and offers us significant opportunities to acquire additional acreage. We have screened more than 300 geologic structures in the oil-prone portion of the trend. Our current acreage position, including acreage under option, has captured 18 of these structures. We have specifically identified approximately 40 additional geologic structures throughout the trend that we believe have characteristics similar to our existing operating areas. In addition to increasing our acreage position through leasing, we may selectively pursue potential acquisitions of strategic assets or operating companies in the trend. Over time, we also |
3
Table of Contents
Index to Financial Statements
| expect to selectively target additional onshore basins in North America that would allow us to extend our competencies to large undeveloped acreage positions in hydrocarbon trends similar to our existing core area. |
| • | Apply rigorous investment analysis to capital allocation decisions. We employ rigorous investment analysis to determine the allocation of capital across our many drilling opportunities. We are focused on maximizing the internal rate of return on our investment capital and screen drilling opportunities by measuring risk and financial return, among other factors. We continually evaluate and rank our inventory of potential investments by these measures, incorporating past drilling results and new information we have gathered. This approach has allowed us to maintain attractive operational and efficiency metrics, measured by finding and development costs, even as our capital expenditures and drilling activities have significantly increased over the last three years. |
Our Competitive Strengths
We have a number of competitive strengths that we believe will help us to successfully execute our business strategies:
| • | Extensive technical knowledge, history and first-mover advantage in the Upper Gulf Coast Tertiary trend. We have had operations in the Upper Gulf Coast Tertiary trend since 1993. We believe our extensive operating experience in the trend provides us with an expansive technical understanding of the geology underlying our acreage and of the application of completion technologies and infrastructure design and optimization to our properties. We believe our relatively long history in this area and experience interpreting well control data, core data and 2D and 3D seismic data provides us with an information advantage over our competitors in the trend and has allowed us to identify and acquire quality acreage at a relatively low cost. In addition, we have developed amicable and mutually beneficial relationships with acreage owners in our operating areas, which we believe provides us with a competitive advantage with respect to our leasing and development activity. We also benefit from long-term relationships with local service companies and infrastructure providers that we believe contribute to our efficient low-cost operations. |
| • | Louisiana Light Sweet oil-weighted reserves, production and drilling locations with attractive economics. Our reserves, production and drilling locations are primarily oil with associated liquids rich natural gas. For the three months ended September 30, 2011, our production was comprised of approximately 56% oil and 13% NGLs. We benefit from selling our oil production to the Louisiana Light Sweet (“LLS”) market, which has historically commanded a premium to West Texas Intermediate (“NYMEX WTI”) oil prices due to its proximity to U.S. Gulf Coast refiners and the higher quality of the oil production sold in the LLS market. This premium has averaged approximately $6.53 per Bbl in the three years ended September 30, 2011 and has significantly increased in recent months. For the three months ended September 30, 2011, the average realized price before the effect of commodity derivative contracts for our oil production was $107.56 per Bbl, compared to an average NYMEX WTI price of $89.54 per Bbl for the same period, representing a premium of $18.02 per barrel. Our ability to capture a premium for our oil production in the LLS market provides us with a significant competitive advantage over companies with assets in other well known plays, such as the Bakken and Eagle Ford, where oil price realizations are typically at a discount to NYMEX WTI. In addition, our assets are located in an area with developed legacy infrastructure that reduces our development and transportation costs relative to other onshore basins in North America. |
| • | Multi-year drilling inventory with significant upside potential. We have an inventory of approximately 601 specifically identified gross vertical drilling locations. This inventory |
4
Table of Contents
Index to Financial Statements
| includes drilling locations in our expansion areas that have been meaningfully risked given the early stage of development. We believe our expansion areas possess substantially similar characteristics as our primary operating areas, and expect that the execution of our remaining 2011 and 2012 drilling plans will allow us to reduce our risk profile on this acreage and could add materially to our drilling opportunities. We also believe the potential drilling inventory on our existing acreage may increase significantly by targeting additional productive zones and through infill drilling. Based on the results of our development activities in our primary operating areas, we believe that infill drilling within thick geologic sections of tight sands increases the ultimate resource recovery. We have successfully downspaced to 10-acre spacing in portions of our Pine Prairie area. We are currently testing downspacing in our South Bearhead Creek/Oretta and North Cowards Gully areas and intend to apply this concept in our other primary operating areas and our expansion areas. In addition, we may be able to enhance the total recovery in the trend through specialized completion techniques, horizontal drilling and secondary recovery techniques. |
| • | Operating control over 95% of our portfolio. In order to maintain better control over our assets, we have established a leasehold position comprised primarily of properties that we expect to operate. Controlling operations allows us to dictate the pace of development and better manage the cost, type and timing of exploration and development activities. We expect to operate 95% of our 601 specifically identified gross drilling locations. For the three months ended September 30, 2011, approximately 99% of our production was attributable to properties that we operate. |
| • | Experienced management team with extensive operating expertise. Our management team has extensive operating expertise in the oil and gas industry and significant public company executive experience at Apache Corporation, Burlington Resources, ConocoPhillips, Noble Corporation, and SM Energy. Our management team has an average of 30 years of industry experience, including prior experience in the Upper Gulf Coast Tertiary trend and similar trends. We believe our management team is one of our principal competitive strengths relative to our industry peers due to our team’s proven track record of efficiently operating exploration and development programs. |
| • | Conservative financial position. We believe that our capital structure and hedge positions following this offering will allow us to continue our development program and acquire additional acreage even in challenging commodity price environments and periods of capital markets dislocation. Giving effect to the completion of this offering, our liquidity as of September 30, 2011 would have been $ million, consisting of $ million available under our revolving credit facility and $ million in cash and cash equivalents. After the completion of this offering, we believe we will have the liquidity and financial flexibility to more than fund our 2012 drilling program and production growth. In addition, we have an active hedging program in place, with swaps, collars and puts covering approximately 79% and 58% of our remaining budgeted 2011 and 2012 oil production. |
| • | Alignment among management, founders and public stockholders. Upon the completion of this offering, our management team will have a significant direct ownership interest in us. In addition, our management team will also own an indirect economic interest in us through their ownership of incentive units in MPCI Holdings LLC (“MPCI”). MPCI is controlled by funds affiliated with First Reserve Management, L.P. (“First Reserve”). The incentive units entitle our management to a portion of the proceeds to be received by First Reserve upon sales of our common stock by MPCI. Our management may significantly increase the value allocated to their incentive units by increasing the return on investment for First Reserve. We believe our management team’s direct ownership interest and incentive units provide significant incentives to grow the value of our business for the benefit of all stockholders. |
5
Table of Contents
Index to Financial Statements
Risk Factors
Investing in our common stock involves risks that include the speculative nature of oil and natural gas exploration, competition, volatile oil and natural gas prices and other material factors. For a discussion of these risks and other considerations that could negatively affect us, including risks related to this offering and our common stock, see “Risk Factors” beginning on page 16 and “Cautionary Note Regarding Forward-Looking Statements” beginning on page 36.
Conflicts of Interest
Affiliates of Goldman, Sachs & Co., Morgan Stanley & Co. LLC and Wells Fargo Securities, LLC are lenders, and in one case, an agent for the lenders, under our reserve-based revolving credit facility. Because a portion of the proceeds of this offering will be used to repay indebtedness under our revolving credit facility, a “conflict of interest” under Rule 5121 of the Financial Industry Regulatory Authority, or FINRA, is therefore deemed to exist. Accordingly, this offering is being made in compliance with FINRA Rule 5121. Pursuant to FINRA Rule 5121, a “qualified independent underwriter” meeting certain standards must participate in the preparation of the registration statement of which this prospectus forms a part and must exercise the usual standards of due diligence with respect thereto. has assumed the responsibilities of acting as the qualified independent underwriter in this offering. Please read “Underwriting — Conflicts of Interest” beginning on page 121.
Corporate Sponsorship and Structure
We were recently incorporated pursuant to the laws of the State of Delaware as Midstates Petroleum Company, Inc. to become a holding company for Midstates Petroleum Company LLC, a wholly-owned subsidiary of Midstates Petroleum Holdings LLC. Midstates Petroleum Holdings LLC was formed as a Delaware limited liability company on August 13, 2008, by certain members of our senior management and First Reserve. Including First Reserve’s initial investment in August 2008, First Reserve has acquired an approximate 77% aggregate equity interest in us. With over $23 billion of raised capital dedicated exclusively to the energy and natural resources industries, First Reserve is the largest energy focused private investment firm, making both private equity and infrastructure investments throughout the energy value chain. For 28 years, it has invested solely in the global energy industry, utilizing its broad base of specialized energy industry knowledge as a competitive advantage. The firm is currently investing its most recent private equity fund, which closed in 2009 at approximately US $9 billion and its most recent infrastructure fund, which closed in 2011 at approximately US $1.2 billion.
Pursuant to the terms of a corporate reorganization that will be completed simultaneously with the closing of this offering, Midstates Petroleum Company, Inc., will directly own all of the outstanding membership interests in Midstates Petroleum Company LLC. Following the completion of this offering, First Reserve will initially own an approximate % indirect economic interest in us through MPCI, which will initially own approximately % of our outstanding shares of common stock (or % if the underwriters’ option to purchase additional shares is exercised in full).
6
Table of Contents
Index to Financial Statements
The tables below present an overview of our organizational structure before and after the completion of this offering.
Current Organizational Structure
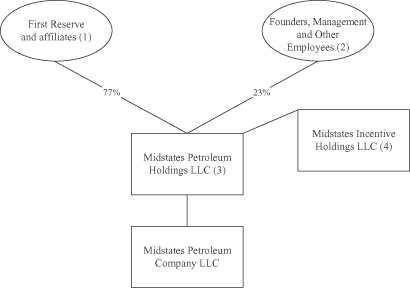
| (1) | Represents membership interests indirectly held by First Reserve through FR Midstates Holdings LLC. |
| (2) | Includes membership interests held directly by certain members of management and Midstates Petroleum Holdings, Inc., a subchapter S corporation, through which our founders, management and certain of our employees hold their equity interest in us. |
| (3) | Midstates Petroleum Holdings LLC is a holding company and its sole material asset is its 100% equity interest in Midstates Petroleum Company LLC, through which we conduct our operations. |
| (4) | Certain members of management and certain of our employees own incentive units through Midstates Incentive Holdings LLC that entitle them to receive a portion of any proceeds to be received by FR Midstates Holdings LLC from any sale of its equity interest in Midstates Petroleum Holdings LLC. |
7
Table of Contents
Index to Financial Statements
Organizational Structure After Giving Effect to this Offering
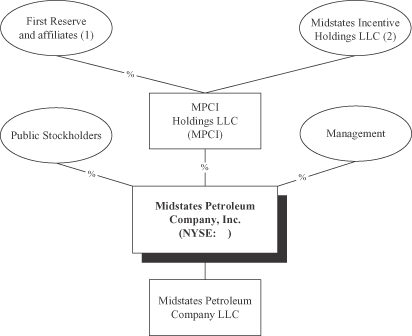
| (1) | Represents membership interests indirectly held by First Reserve through FR Midstates Holdings LLC. |
| (2) | Certain members of management and certain of our employees will own incentive units through Midstates Incentive Holdings LLC that entitle them to receive a portion of the proceeds to be received by First Reserve upon sales of shares of common stock in Midstates Petroleum Company, Inc. by MPCI. |
For more information on our reorganization and the ownership of our common stock by our principal and selling stockholders, see “Corporate Reorganization” beginning on page 106 and “Principal and Selling Stockholders” beginning on page 107.
Corporate Information
Our principal executive offices are located at 4400 Post Oak Parkway, Suite 1900, Houston, Texas 77027, and our telephone number at that address is (713) 595-9400. Our website is located at www.midstatespetroleum.com and will be activated in connection with the closing of this offering. We expect to make our periodic reports and other information filed with or furnished to the Securities and Exchange Commission, or the SEC, available free of charge through our website as soon as reasonably practicable after those reports and other information are electronically filed with or furnished to the SEC. Information on our website or any other website is not incorporated by reference herein and does not constitute a part of this prospectus.
8
Table of Contents
Index to Financial Statements
| Common stock offered by Midstates Petroleum Company, Inc. |
shares ( shares if the underwriters’ option to purchase additional shares is exercised in full). |
| Common stock offered by the selling stockholders |
shares ( shares if the underwriters’ option to purchase additional shares is exercised in full). |
| Total common stock offered |
shares ( shares if the underwriters’ option to purchase additional shares is exercised in full). |
| Common stock to be outstanding after the offering |
shares ( shares if the underwriters’ option to purchase additional shares is exercised in full). |
| Common stock owned by the selling stockholders after the offering |
shares ( shares if the underwriters’ option to purchase additional shares is exercised in full). |
| Option to purchase additional shares |
We and the selling stockholders have granted the underwriters a 30-day option to purchase up to an aggregate of additional shares of our common stock. |
| Use of proceeds |
We expect to receive approximately $ million of net proceeds from the sale of the common stock offered by us, based upon the assumed initial public offering price of $ per share (the midpoint of the price range set forth on the cover page of this prospectus), after deducting underwriting discounts and commissions and estimated offering expenses payable by us. |
| We intend to use $ million of the net proceeds from this offering to repay all outstanding indebtedness under our revolving credit facility. The remaining proceeds of approximately $ million will be used to fund a portion of our exploration and development program. We will not receive any of the proceeds from the sale of shares of our common stock by the selling stockholders. |
| Affiliates of certain of the underwriters are lenders under our revolving credit facility and, accordingly, will receive a portion of the proceeds from this offering. See “Use of Proceeds” and “Underwriting—Conflicts of Interest.” |
| Dividend policy |
We do not anticipate paying any cash dividends on our common stock. In addition, our revolving credit facility prevents us from paying cash dividends. See “Dividend Policy.” |
9
Table of Contents
Index to Financial Statements
| Risk factors |
You should carefully read and consider the information beginning on page 16 of this prospectus set forth under the heading “Risk Factors” and all other information set forth in this prospectus before deciding to invest in our common stock. |
| Listing and trading symbol |
We intend to apply to list our common stock on the New York Stock Exchange under the symbol “MPO.” |
10
Table of Contents
Index to Financial Statements
Summary Historical Consolidated Financial Data
You should read the following summary financial data in conjunction with “Selected Historical Consolidated Financial Data,” “Management’s Discussion and Analysis of Financial Condition and Results of Operations” and our historical consolidated financial statements and unaudited financial information and related notes thereto included elsewhere in this prospectus. The financial information included in this prospectus may not be indicative of our future results of operations, financial position and cash flows.
Set forth below is (i) our summary historical consolidated financial data as of and for the nine months ended September 30, 2011, which has been derived from our audited consolidated financial statements included elsewhere in this prospectus; (ii) our summary historical consolidated financial data for the nine months ended September 30, 2010, which has been derived from our unaudited consolidated financial statements included elsewhere in this prospectus; (iii) our summary historical consolidated financial data as of and for the years ended December 31, 2010 and 2009 and for the period from August 30, 2008 through December 31, 2008, which has been derived from our audited consolidated financial statements included elsewhere in this prospectus; and (iv) the summary historical consolidated financial data for the period from January 1 to August 29, 2008 of Midstates Petroleum Corporation, our accounting predecessor, which has been derived from the audited financial statements of Midstates Petroleum Corporation included elsewhere in this prospectus.
| Successor | Predecessor | |||||||||||||||||||||||||
| Nine Months Ended September 30, |
Year Ended December 31, |
Period from August 30 to December 31, 2008 |
Period from January 1 to August 29, 2008 |
|||||||||||||||||||||||
| 2011 | 2010 | 2010 | 2009 | |||||||||||||||||||||||
| (in thousands) | ||||||||||||||||||||||||||
| Statement of operations data Revenues: |
||||||||||||||||||||||||||
| Oil, gas and natural gas liquids revenues |
$ | 147,579 | $ | 58,296 | $ | 89,111 | $ | 30,133 | $ | 8,689 | $ | 27,458 | ||||||||||||||
| Gains (losses) on commodity derivative contracts-net |
22,442 | (6,453 | ) | (26,268 | ) | (5,987 | ) | 14,062 | (7,678 | ) | ||||||||||||||||
| Other revenue |
260 | 185 | 209 | 108 | 43 | 113 | ||||||||||||||||||||
| Total revenues |
170,281 | 52,028 | 63,052 | 24,254 | 22,794 | 19,893 | ||||||||||||||||||||
| Expenses: |
||||||||||||||||||||||||||
| Lease operating |
9,451 | 5,225 | 8,733 | 5,312 | 1,542 | 2,769 | ||||||||||||||||||||
| Workover |
1,301 | 3,856 | 4,683 | 5,226 | 2,376 | 2,206 | ||||||||||||||||||||
| Severance tax |
8,437 | 4,193 | 6,431 | 2,849 | 805 | 2,354 | ||||||||||||||||||||
| Asset retirement accretion |
205 | 108 | 175 | 120 | 37 | 79 | ||||||||||||||||||||
| General and administrative |
15,519 | 11,820 | 16,847 | 5,886 | 1,402 | 1,816 | ||||||||||||||||||||
| Depreciation, depletion and amortization |
61,640 | 26,924 | 41,827 | 12,322 | 2,995 | 3,117 | ||||||||||||||||||||
| Impairment in carrying value of oil and natural gas properties |
— | — | — | 4,297 | 26,776 | — | ||||||||||||||||||||
| Total expenses |
96,553 | 52,126 | 78,696 | 36,012 | 35,933 | 12,341 | ||||||||||||||||||||
| Income (loss) from operations |
73,728 | (98 | ) | (15,644 | ) | (11,758 | ) | (13,139 | ) | 7,552 | ||||||||||||||||
| Other income (expense): |
||||||||||||||||||||||||||
| Interest income |
15 | 6 | 9 | 6 | 7 | 12 | ||||||||||||||||||||
| Interest expense-net of amounts capitalized |
(735 | ) | — | — | — | — | (854 | ) | ||||||||||||||||||
| Net income (loss) |
$ | 73,008 | $ | (92 | ) | $ | (15,635 | ) | $ | (11,752 | ) | $ | (13,132 | ) | $ | 6,710 | ||||||||||
11
Table of Contents
Index to Financial Statements
| As of September 30, 2011 |
As of December 31, | |||||||||||||||
| 2010 | 2009 | 2008 | ||||||||||||||
| (in thousands) | ||||||||||||||||
| Balance sheet data: |
||||||||||||||||
| Cash and cash equivalents |
$ | 10,220 | $ | 11,917 | $ | 4,353 | $ | 3,214 | ||||||||
| Net property and equipment |
518,708 | 397,126 | 271,726 | 209,939 | ||||||||||||
| Total assets |
565,751 | 427,004 | 284,034 | 222,074 | ||||||||||||
| Long-term debt |
198,600 | 89,600 | 29,800 | 21,800 | ||||||||||||
| Total members’/stockholders’ equity |
277,922 | 255,879 | 235,334 | 192,006 | ||||||||||||
| Successor | Predecessor | |||||||||||||||||||||||||
| Nine Months Ended September 30, |
Year Ended December 31, |
Period from August 30 to December 31, 2008 |
Period from January 1 to August 29, 2008 |
|||||||||||||||||||||||
| 2011 | 2010 | 2010 | 2009 | |||||||||||||||||||||||
| (in thousands) | ||||||||||||||||||||||||||
| Other financial data: |
||||||||||||||||||||||||||
| Net cash provided by operating activities |
$ | 103,311 | $ | 35,795 | $ | 50,768 | $ | 10,595 | $ | 3,670 | $ | 10,046 | ||||||||||||||
| Net cash used in investing activities |
(162,739 | ) | (94,274 | ) | (139,618 | ) | (75,215 | ) | (5,451 | ) | (9,480 | ) | ||||||||||||||
| Net cash provided by financing activities |
57,731 | 65,076 | 96,414 | 65,759 | 4,995 | 1,792 | ||||||||||||||||||||
| Adjusted EBITDA (1) |
102,758 | 34,736 | 53,274 | 12,539 | 3,032 | 15,413 | ||||||||||||||||||||
| (1) | Adjusted EBITDA is a non-GAAP financial measure. For a definition of Adjusted EBITDA and a reconciliation of Adjusted EBITDA to our net loss and net cash provided by operating activities, see “— Non-GAAP Financial Measures and Reconciliations” below. |
Non-GAAP Financial Measures and Reconciliations
Adjusted EBITDA is a supplemental non-GAAP financial measure that is used by management and external users of our consolidated financial statements, such as industry analysts, investors, lenders and rating agencies.
We define Adjusted EBITDA as earnings before interest income and expense, income taxes, depreciation, depletion and amortization, property impairments, asset retirement obligation accretion, unrealized derivative gains and losses and non-cash stock-based compensation expense. Adjusted EBITDA is not a measure of net income or cash flows as determined by United States generally accepted accounting principles, or GAAP.
We believe that Adjusted EBITDA is useful because it allows us to more effectively evaluate our operating performance and compare the results of our operations from period to period without regard to our financing methods or capital structure. We exclude items such as property impairments, asset retirement obligation accretion, unrealized derivative gains and losses and non-cash stock-based compensation expense from net income in arriving at Adjusted EBITDA because these amounts can vary substantially from company to company within our industry depending upon accounting methods and book values of assets, capital structures and the method by which the assets were acquired. Adjusted EBITDA should not be considered as an alternative to, or more meaningful than, net income or cash flows from operating activities as determined in accordance with GAAP or as an indicator of our operating performance or liquidity. Certain items excluded from Adjusted EBITDA are significant components in understanding and assessing a company’s financial performance, such as a company’s cost of capital and tax structure, as well as the historic costs of depreciable assets, none of which are components of Adjusted EBITDA. Our computations of Adjusted EBITDA may not be comparable to other similarly titled measures of other companies. We believe that Adjusted EBITDA is a widely followed measure of operating performance and may also be used by investors to measure our ability to meet debt service requirements.
12
Table of Contents
Index to Financial Statements
The following table presents a reconciliation of the non-GAAP financial measure of Adjusted EBITDA to the GAAP financial measures of net income (loss) and net cash provided by operating activities, respectively.
| Successor | Predecessor | |||||||||||||||||||||||||
| Nine Months Ended September 30, |
Year Ended December 31, |
Period from August 30 to December 31, 2008 |
Period from January 1 to August 29, 2008 |
|||||||||||||||||||||||
| 2011 | 2010 | 2010 | 2009 | |||||||||||||||||||||||
| (in thousands) | ||||||||||||||||||||||||||
| Adjusted EBITDA reconciliation to net income (loss): |
||||||||||||||||||||||||||
| Net income (loss) |
$ | 73,008 | $ | (92 | ) | $ | (15,635 | ) | $ | (11,752 | ) | $ | (13,132 | ) | $ | 6,710 | ||||||||||
| Depreciation, depletion and amortization |
61,640 | 26,924 | 41,827 | 12,363 | 2,995 | 3,117 | ||||||||||||||||||||
| Impairment in carrying value of oil and gas properties |
— | — | — | 4,297 | 26,776 | — | ||||||||||||||||||||
| Change in unrealized (gain) loss on commodity derivative contracts |
(34,587 | ) | 6,737 | 25,398 | 7,283 | (13,637 | ) | 4,665 | ||||||||||||||||||
| Interest income |
(15 | ) | (6 | ) | (9 | ) | (6 | ) | (7 | ) | (12 | ) | ||||||||||||||
| Interest expense-net of amounts capitalized |
735 | — | — | — | — | 854 | ||||||||||||||||||||
| Asset retirement obligation accretion |
205 | 108 | 175 | 120 | 37 | 79 | ||||||||||||||||||||
| Stock-based compensation |
1,772 | 1,065 | 1,518 | 234 | — | — | ||||||||||||||||||||
|
|
|
|
|
|
|
|
|
|
|
|
|
|||||||||||||||
| Adjusted EBITDA |
$ | 102,758 | $ | 34,736 | $ | 53,274 | $ | 12,539 | $ | 3,032 | $ | 15,413 | ||||||||||||||
|
|
|
|
|
|
|
|
|
|
|
|
|
|||||||||||||||
| Successor | Predecessor | |||||||||||||||||||||||||
| Nine Months Ended September 30, |
Year Ended December 31, |
Period from August 30 to December 31, 2008 |
Period from January 1 to August 29, 2008 |
|||||||||||||||||||||||
| 2011 | 2010 | 2010 | 2009 | |||||||||||||||||||||||
| (in thousands) | ||||||||||||||||||||||||||
| Adjusted EBITDA reconciliation to net cash provided by operating activities: |
||||||||||||||||||||||||||
| Net cash provided by operating activities |
$ | 103,311 | $ | 35,795 | $ | 50,768 | $ | 10,595 | $ | 3,670 | $ | 10,046 | ||||||||||||||
| Changes in working capital |
(1,273 | ) | (1,053 | ) | 2,515 | 1,950 | (631 | ) | 4,525 | |||||||||||||||||
| Interest income |
(15 | ) | (6 | ) | (9 | ) | (6 | ) | (7 | ) | (12 | ) | ||||||||||||||
| Interest expense-net of amounts capitalized |
735 | — | — | — | — | 854 | ||||||||||||||||||||
|
|
|
|
|
|
|
|
|
|
|
|
|
|||||||||||||||
| Adjusted EBITDA |
$ | 102,758 | $ | 34,736 | $ | 53,274 | $ | 12,539 | $ | 3,032 | $ | 15,413 | ||||||||||||||
|
|
|
|
|
|
|
|
|
|
|
|
|
|||||||||||||||
13
Table of Contents
Index to Financial Statements
Summary Historical Operating and Reserve Data
The following table presents summary data with respect to our estimated net proved oil and natural gas reserves as of the dates indicated. For additional information regarding our reserves, see “Business” beginning on page 63. The reserve estimates at September 30, 2011 and at December 31, 2010 and 2009 presented in the table below are based on reports prepared by NSAI. NSAI’s reports were prepared consistent with the rules and regulations of the SEC regarding oil and natural gas reserve reporting in effect during such periods. The reserve estimates at December 31, 2008 presented in the table below are based on estimates prepared by our internal engineers, in accordance with the rules and regulations of the SEC regarding oil and natural gas reserve reporting in effect during such period.
| At September 30, | At December 31, | |||||||||||||||
| 2011 | 2010 | 2009 | 2008 | |||||||||||||
| Reserve Data: |
||||||||||||||||
| Estimated proved reserves: |
||||||||||||||||
| Oil (MMBbls) |
14.2 | 11.9 | 7.6 | 4.8 | ||||||||||||
| Natural gas (Bcf) |
38.0 | 27.9 | 13.3 | 5.1 | ||||||||||||
| Natural gas liquids (MMBbls) |
3.8 | 0.3 | 0.1 | 0.0 | ||||||||||||
| Total estimated proved reserves (MMBoe) |
24.3 | 16.9 | 9.9 | 5.6 | ||||||||||||
| Proved developed reserves: |
||||||||||||||||
| Oil (MMBbls) |
6.3 | 5.4 | 2.8 | 2.3 | ||||||||||||
| Natural gas (Bcf) |
18.9 | 14.2 | 4.4 | 1.9 | ||||||||||||
| Natural gas liquids (MMBbls) |
1.9 | 0.1 | 0.0 | — | ||||||||||||
| Total proved developed (MMBoe) |
11.3 | 7.9 | 3.5 | 2.6 | ||||||||||||
| Percent proved developed |
47 | % | 47 | % | 36 | % | 46 | % | ||||||||
| Proved undeveloped reserves: |
||||||||||||||||
| Oil (MMBbls) |
7.9 | 6.5 | 4.8 | 2.5 | ||||||||||||
| Natural gas (Bcf) |
19.1 | 13.7 | 8.9 | 3.2 | ||||||||||||
| Natural gas liquids (MMBbls) |
1.9 | 0.2 | 0.1 | — | ||||||||||||
| Total proved undeveloped (MMBoe) |
13.0 | 9.0 | 6.4 | 3.0 | ||||||||||||
The following table sets forth the benchmark prices used to determine our estimated proved reserves from proved oil and natural gas reserves for the periods indicated.
| At September 30, 2011 |
At December 31, | |||||||||||||||
| 2010 | 2009 | 2008 | ||||||||||||||
| Oil and Natural Gas Prices (1): |
||||||||||||||||
| Oil (per Bbl) |
$ | 91.00 | $ | 75.96 | $ | 57.65 | $ | 44.61 | ||||||||
| Natural gas (per MMBtu) |
$ | 4.160 | $ | 4.376 | $ | 3.866 | $ | 5.710 | ||||||||
| (1) | Benchmark prices for oil and natural gas at September 30, 2011 and at December 31, 2010 and 2009 reflect the unweighted arithmetic average first-day-of-the-month prices for the prior 12 months, using Plains WTI posted prices for oil and NYMEX Henry Hub prices for natural gas. At December 31, 2008, benchmark prices for oil and natural gas reflect NYMEX WTI prices for oil and NYMEX Henry Hub prices for natural gas at such date. |
14
Table of Contents
Index to Financial Statements
The following table sets forth summary data with respect to our production results, average sales prices and production costs on a historical basis for the periods presented:
| Successor | Predecessor | |||||||||||||||||||||||||
| Nine Months Ended September 30, |
Year Ended December 31, |
Period from August 30 to December 31, 2008 |
Period from January 1 to August 29, 2008 |
|||||||||||||||||||||||
| 2011 | 2010 | 2010 | 2009 | |||||||||||||||||||||||
| (in thousands) | ||||||||||||||||||||||||||
| Operating data: |
||||||||||||||||||||||||||
| Net production volumes: |
||||||||||||||||||||||||||
| Oil (MBbls) |
1,136 | 652 | 945 | 497 | 104 | 218 | ||||||||||||||||||||
| Natural gas (Mcf) |
3,154 | 1,446 | 2,253 | 690 | 110 | 131 | ||||||||||||||||||||
| Natural gas liquids (MBbls) |
207 | 4 | 74 | 2 | — | — | ||||||||||||||||||||
| Total oil equivalents (MBoe) |
1,869 | 897 | 1,394 | 614 | 122 | 240 | ||||||||||||||||||||
| Average daily production (Boe/d) |
6,847 | 3,285 | 3,820 | 1,682 | 984 | 996 | ||||||||||||||||||||
| Average sales prices: |
||||||||||||||||||||||||||
| Oil, without realized derivatives (per Bbl) |
$ | 108.08 | $ | 77.57 | $ | 80.29 | $ | 55.07 | $ | 75.68 | $ | 118.95 | ||||||||||||||
| Oil, with realized derivatives (per Bbl) |
97.39 | 78.01 | 79.37 | 57.69 | 79.78 | 105.15 | ||||||||||||||||||||
| Natural gas (per Mcf) |
4.70 | 5.23 | 4.66 | 3.89 | 7.72 | 11.48 | ||||||||||||||||||||
| Natural gas liquids (per Bbl) |
48.02 | 40.42 | 36.92 | 47.66 | — | — | ||||||||||||||||||||
| Cost and expenses (per Boe of production): |
||||||||||||||||||||||||||
| Lease operating |
$ | 5.06 | $ | 5.83 | $ | 6.26 | $ | 8.66 | $ | 12.64 | $ | 11.54 | ||||||||||||||
| Workover |
0.70 | 4.30 | 3.36 | 8.51 | 19.48 | 9.19 | ||||||||||||||||||||
| Severance tax |
4.51 | 4.68 | 4.61 | 4.64 | 6.60 | 9.81 | ||||||||||||||||||||
| Asset retirement accretion |
0.11 | 0.12 | 0.13 | 0.20 | 0.30 | 0.33 | ||||||||||||||||||||
| General and administrative |
8.08 | 12.71 | 11.73 | 9.59 | 11.50 | 7.57 | ||||||||||||||||||||
| Depreciation, depletion and amortization |
32.98 | 30.03 | 30.00 | 20.08 | 24.56 | 12.99 | ||||||||||||||||||||
15
Table of Contents
Index to Financial Statements
Investing in our common stock involves a high degree of risk. You should carefully consider the risks described below together with the other information set forth in this prospectus before making an investment decision. Our business, financial condition or results of operations could be materially adversely affected by any of these risks. The trading price of our common stock could decline due to any of these risks, and you may lose all or part of your investment.
Risks Related to the Oil and Natural Gas Industry and Our Business
A substantial or extended decline in oil and, to a lesser extent, natural gas, prices may adversely affect our business, financial condition or results of operations and our ability to meet our capital expenditure obligations and financial commitments.
The price we receive for our oil and, to a lesser extent, natural gas, heavily influences our revenue, profitability, access to capital and future rate of growth. Oil and natural gas are commodities and, therefore, their prices are subject to wide fluctuations in response to relatively minor changes in supply and demand. Historically, the markets for oil and natural gas have been volatile. These markets will likely continue to be volatile in the future. The prices we receive for our production and the levels of our production depend on numerous factors beyond our control. These factors include the following:
| • | worldwide and regional economic conditions impacting the global supply and demand for oil and natural gas; |
| • | the actions of the Organization of Petroleum Exporting Countries; |
| • | the price and quantity of imports of foreign oil and natural gas; |
| • | political conditions in or affecting other oil and natural gas-producing countries; |
| • | the level of global oil and natural gas exploration and production; |
| • | the level of global oil and natural gas inventories; |
| • | localized supply and demand fundamentals and transportation availability; |
| • | weather conditions and natural disasters; |
| • | domestic, local and foreign governmental regulations and taxes; |
| • | speculation as to the future price of oil and natural gas and the speculative trading of oil and natural gas futures contracts; |
| • | price and availability of competitors’ supplies of oil and natural gas; |
| • | technological advances affecting energy consumption; and |
| • | the price and availability of alternative fuels. |
Substantially all of our production is sold to purchasers under short-term (less than 12-month) contracts at market based prices. Lower oil and natural gas prices will reduce our cash flows, borrowing ability and the present value of our reserves. If oil and natural gas prices deteriorate, we anticipate that the borrowing base under our revolving credit facility, which is revised periodically, may be reduced. Lower oil and natural gas prices may also reduce the amount of oil and natural gas that we can produce economically. Substantial decreases in oil and natural gas prices could render uneconomic a significant portion of our identified drilling locations. This may result in our having to make significant downward adjustments to our estimated proved reserves. As a result, a substantial or extended decline in oil or natural gas prices may materially and adversely affect our future business, financial condition, results of operations, liquidity or ability to finance planned capital expenditures.
16
Table of Contents
Index to Financial Statements
A reduction in the premium to NYMEX WTI oil prices we receive by selling to the LLS market could significantly reduce the relative price advantage we receive for our production.
Because our producing properties are geographically concentrated in central Louisiana, we are vulnerable to fluctuations in pricing in that area. Our oil production is generally sold in the LLS market, which has recently commanded a premium to NYMEX WTI prices due to its proximity to U.S. Gulf Coast refiners and international markets that are typically correlated with Brent oil prices as well as take-away constraints at the Cushing, Oklahoma hub where NYMEX WTI contracts are settled. A reduction in this premium could significantly reduce the relative price advantage we receive for our production. In addition, as a result of this geographic concentration, we may be disproportionately exposed to the impact of regional supply and demand factors, transportation capacity constraints and curtailment or interruption of production from the wells in these areas.
Drilling for and producing oil and natural gas are high risk activities with many uncertainties that could adversely affect our business, financial condition or results of operations.
Our future financial condition and results of operations will depend on the success of our development, drilling and production activities. Our oil and natural gas drilling and production activities are subject to numerous risks beyond our control, including the risk that drilling will not result in commercially viable oil or natural gas production. Our decisions to purchase, explore or develop drilling locations or properties will depend in part on the evaluation of data obtained through 2D and 3D seismic data, geophysical and geological analyses, production data and engineering studies, the results of which are often inconclusive or subject to varying interpretations. While we have operated in the Upper Gulf Coast Tertiary trend since 1993, the production and operating data that is available with respect to this trend based on modern drilling and completion techniques is relatively limited compared to trends where multiple operators have been active for a significant period of time. As a result, we face more uncertainty in evaluating data than operators in more developed trends. For a discussion of the uncertainty involved in these processes, see “— Our estimated proved reserves are based on many assumptions that may turn out to be inaccurate. Any significant inaccuracies in these assumptions will materially affect the quantities and present value of our reserves.” Our costs of drilling, completing and operating wells is often uncertain before drilling commences. In addition, the application of new techniques in this trend, such as high-graded stimulation designs and horizontal completions, some of which we have not previously employed, may make it more difficult to accurately estimate these costs. Overruns in budgeted expenditures are common risks that can make a particular project uneconomical. Further, many factors may curtail, delay or cancel our scheduled drilling projects, including the following:
| • | shortages of, or delays in, obtaining equipment and qualified personnel; |
| • | facility or equipment malfunctions; |
| • | unexpected operational events; |
| • | pressure or irregularities in geological formations; |
| • | adverse weather conditions; |
| • | reductions in oil and natural gas prices; |
| • | delays imposed by or resulting from compliance with regulatory requirements; |
| • | proximity to and capacity of transportation facilities; |
| • | title problems; and |
| • | limitations in the market for oil and natural gas. |
17
Table of Contents
Index to Financial Statements
The standardized measure of discounted future net cash flows from our proved reserves will not be the same as the current market value of our estimated oil and natural gas reserves.
You should not assume that the standardized measure of discounted future net cash flows from our proved reserves is the current market value of our estimated oil and natural gas reserves. In accordance with SEC requirements in effect at September 30, 2011, December 31, 2010 and 2009, we based the discounted future net cash flows from our proved reserves on the 12-month unweighted arithmetic average of the first-day-of-the-month price for the preceding twelve months without giving effect to derivative transactions. As of December 31, 2008, we based the estimated discounted future net cash flows from our proved reserves on prices and costs in effect on the date of the estimate in accordance with SEC requirements then in effect. Actual future net cash flows from our oil and natural gas properties will be affected by factors such as:
| • | actual prices we receive for oil and natural gas; |
| • | actual cost of development and production expenditures; |
| • | the amount and timing of actual production; and |
| • | changes in governmental regulations or taxation. |
The timing of both our production and our incurrence of expenses in connection with the development and production of oil and natural gas properties will affect the timing and amount of actual future net revenues from proved reserves, and thus their actual present value. In addition, the 10% discount factor we use when calculating standardized measure may not be the most appropriate discount factor based on interest rates in effect from time to time and risks associated with us or the oil and natural gas industry in general. Actual future prices and costs may differ materially from those used in the present value estimates included in this prospectus which could have a material effect on the value of our reserves.
If oil and natural gas prices decrease, we may be required to take write-downs of the carrying values of our oil and natural gas properties.
We use the full cost method of accounting for our oil and gas properties. Accordingly, we capitalize and amortize all productive and nonproductive costs directly associated with property acquisition, exploration and development activities. Under the full cost method, the capitalized cost of oil and gas properties, less accumulated amortization and related deferred income taxes may not exceed the “cost center ceiling” which is equal to the sum of the present value of estimated future net revenues from proved reserves, less estimated future expenditures to be incurred in developing and producing the proved reserves computed using a discount factor of 10%, plus the costs of properties not subject to amortization, plus the lower of the cost or estimated fair value of unproved properties included in the costs being amortized, less related income tax effects. If the net capitalized costs exceed the cost center ceiling, we recognize the excess as an impairment of oil and gas properties. This impairment does not impact cash flows from operating activities but does reduce our earnings and shareholders’ equity. The risk that we will be required to recognize impairments of our oil and natural gas properties increases during periods of low commodity prices. In addition, impairments would occur if we were to experience sufficient downward adjustments to our estimated proved reserves or the present value of estimated future net revenues. An impairment recognized in one period may not be reversed in a subsequent period even if higher oil and gas prices increase the cost center ceiling applicable to the subsequent period. We recorded a non-cash ceiling test impairment of approximately $26.8 million for the period ended December 31, 2008 and approximately $4.3 million for the year ended December 31, 2009. We could incur additional impairments of oil and natural gas properties in the future, particularly as a result of a decline in commodity prices.
18
Table of Contents
Index to Financial Statements
We have incurred losses from operations during certain periods since the beginning of 2008 and may continue to do so in the future.
We incurred net losses of $15.6 million and $11.8 million for the years ended December 31, 2010 and 2009, respectively, and $13.1 million for the period from August 30, 2008 to December 31, 2008. Our development of and participation in an increasingly larger number of drilling locations has required and will continue to require substantial capital expenditures. The uncertainty and risks described in this prospectus may impede our ability to economically acquire and develop oil and natural gas reserves. As a result, we may not be able to achieve or sustain profitability or positive cash flows provided by operating activities in the future.
Our estimated proved reserves are based on many assumptions that may turn out to be inaccurate. Any significant inaccuracies in these assumptions will materially affect the quantities and present value of our reserves.
The process of estimating oil and natural gas reserves is complex. It requires interpretations of available technical data and many assumptions, including assumptions relating to current and future economic conditions and commodity prices. Any significant inaccuracies in these assumptions could materially affect the estimated quantities and present value of reserves shown in this prospectus. See “Business — Our Operations” for information about our estimated oil and natural gas reserves.
In order to prepare our estimates, we must estimate production rates and the timing of development expenditures. We must also analyze available geological, geophysical, production and engineering data. The extent, quality and reliability of this data can vary. The process also requires economic assumptions about matters such as oil and natural gas prices, drilling and operating expenses, capital expenditures, taxes and availability of funds. Although the reserve information contained herein as of September 30, 2011, December 31, 2010 and December 31, 2009 was prepared by our independent reserve engineers, estimates of oil and natural gas reserves are inherently imprecise. In addition, reserve estimates for properties that do not have a lengthy production history, including the areas in which we operate, are less reliable than estimates for fields with lengthy production histories. Although we and our independent reserve engineers have analyzed historical production data from wells drilled in the Upper Gulf Coast Tertiary trend, there can be no assurance that this data will accurately predict future production, development expenditures or operating expenses from wells drilled and completed using modern techniques. In addition, this data is based on vertically drilled wells, which may not accurately reflect production, development expenditures or operating expenses that may result from the application of horizontal drilling techniques.
Actual future production, oil and natural gas prices, revenues, taxes, development expenditures, operating expenses and quantities of recoverable oil and natural gas reserves may vary from our estimates. Any significant variance could materially affect the estimated quantities and present value of reserves shown in this prospectus. In addition, we may adjust estimates of proved reserves to reflect production history, results of exploration and development, prevailing oil and natural gas prices and other factors, many of which are beyond our control.
Approximately 53% of our total estimated proved reserves at September 30, 2011 were proved undeveloped reserves.
Recovery of proved undeveloped reserves requires significant capital expenditures and successful drilling operations. The reserve data included in the reserve engineer reports assumes that substantial capital expenditures are required to develop such reserves. Although cost and reserve estimates attributable to our oil and natural gas reserves have been prepared in accordance with industry standards, we cannot be sure that the estimated costs are accurate, that development will occur as scheduled or that the results of such development will be as estimated.
19
Table of Contents
Index to Financial Statements
Unless we replace our oil and natural gas reserves, our reserves and production will decline, which would adversely affect our business, financial condition and results of operations.
Unless we conduct successful development and exploration activities or acquire properties containing proved reserves, our proved reserves will decline as those reserves are produced. Producing oil and natural gas reservoirs generally are characterized by declining production rates that vary depending upon reservoir characteristics and other factors. Our future oil and natural gas reserves and production, and therefore our cash flows and income, are highly dependent on our success in efficiently developing our current reserves and economically finding or acquiring additional recoverable reserves. We may not be able to develop, find or acquire additional reserves to replace our current and future production at acceptable costs. If we are unable to replace our current and future production, the value of our reserves will decrease, and our business, financial condition and results of operations will be adversely affected.
Drilling locations that we have identified may not yield oil or natural gas in commercially viable quantities.
We describe some of our drilling locations and our plans to explore those drilling locations in this prospectus. Our drilling locations are in various stages of evaluation, ranging from a location which is ready to drill to a location that will require substantial additional interpretation. There is no way to predict in advance of drilling and testing whether any particular location will yield oil or natural gas in sufficient quantities to recover drilling or completion costs or to be economically viable. The use of technologies and the study of producing fields in the same area will not enable us to know conclusively prior to drilling whether oil or natural gas will be present or, if present, whether oil or natural gas will be present in sufficient quantities to be economically viable. Even if sufficient amounts of oil or natural gas exist, we may damage the potentially productive hydrocarbon bearing formation or experience mechanical difficulties while drilling or completing the well, resulting in a reduction in production from or abandonment of the well. If we drill additional wells that we identify as dry holes in our current and future drilling locations, our drilling success rate may decline and materially harm our business. We cannot assure you that the analogies we draw from available data from other wells, more fully explored locations or producing fields will be applicable to our identified drilling locations. In sum, the cost of drilling, completing and operating any well is often uncertain, and new wells may not be productive.
Our identified drilling locations are scheduled out over many years, making them susceptible to uncertainties that could materially alter the occurrence or timing of their drilling, which in certain instances could prevent production prior to the expiration date of leases for such locations. In addition, we may not be able to raise the amount of capital that would be necessary to drill a substantial portion of our identified potential drilling locations.
Our management team has specifically identified and scheduled certain drilling locations as an estimation of our future multi-year drilling activities on our existing acreage. These drilling locations represent a significant part of our growth strategy. Our ability to drill and develop these drilling locations depends on a number of uncertainties, including oil and natural gas prices, the availability and cost of capital, drilling and production costs, the availability of drilling services and equipment, drilling results, lease expirations, gathering system, marketing and pipeline transportation constraints, regulatory approvals and other factors. Because of these uncertain factors, we do not know if the numerous drilling locations we have identified will ever be drilled or if we will be able to produce oil or natural gas from these or any other drilling locations. In addition, unless production is established within the spacing units covering the undeveloped acres on which some of the potential locations are obtained, the leases for such acreage will expire. As such, our actual drilling activities may materially differ from those presently identified.
20
Table of Contents
Index to Financial Statements
The unavailability or high cost of additional drilling rigs, equipment, supplies, personnel and oilfield services could adversely affect our ability to execute our exploration and development plans within our budget and on a timely basis.
We utilize third-party services to maximize the efficiency of our organization. The cost of oilfield services may increase or decrease depending on the demand for services by other oil and gas companies. While we currently have excellent relationships with oilfield service companies, there is no assurance that we will be able to contract for such services on a timely basis or that the cost of such services will remain at a satisfactory or affordable level. Shortages or the high cost of frac crews, drilling rigs, equipment, supplies, personnel or oilfield services could delay or adversely affect our development and exploration operations or cause us to incur significant expenditures that are not provided for in our capital budget, which could have a material adverse effect on our business, financial condition or results of operations.
Our business depends on transportation by truck for our oil and condensate production, and our natural gas production depends on transportation facilities that are owned by third parties.
We transport all of our oil and condensate production by truck, which is more expensive and less efficient than transportation via pipeline. Our natural gas production depends in part on the availability, proximity and capacity of pipeline systems and processing facilities owned by third parties. Although we have some contractual control over the transportation of our product, material changes in these business relationships could materially affect our operations. Federal and state regulation of oil and natural gas production and transportation, tax and energy policies, changes in supply and demand, pipeline pressures, damage to or destruction of pipelines and general economic conditions could adversely affect our ability to produce, gather and transport oil and natural gas.
The disruption of third-party facilities due to maintenance or weather could negatively impact our ability to market and deliver our products. We have no control over when or if such facilities are restored or what prices will be charged. A total shut-in of production could materially affect us due to a lack of cash flows, and if a substantial portion of the production is hedged at lower than market prices, those financial hedges would have to be paid from borrowings absent sufficient cash flows.
We may incur substantial losses and be subject to substantial liability claims as a result of our oil and natural gas operations. Additionally we may not be insured for, or our insurance may be inadequate to protect us against, these risks.
We are not insured against all risks. Losses and liabilities arising from uninsured and underinsured events could materially and adversely affect our business, financial condition or results of operations. Our oil and natural gas exploration and production activities are subject to all of the operating risks associated with drilling for and producing oil and natural gas, including the possibility of:
| • | environmental hazards, such as uncontrollable flows of oil, natural gas, brine, well fluids, toxic gas or other pollution into the environment, including groundwater contamination; |
| • | abnormally pressured formations; |
| • | mechanical difficulties, such as stuck oilfield drilling and service tools and casing collapse; |
| • | fires, explosions and ruptures of pipelines; |
| • | personal injuries and death; and |
| • | natural disasters. |
21
Table of Contents
Index to Financial Statements
Any of these risks could adversely affect our ability to conduct operations or result in substantial losses to us as a result of:
| • | injury or loss of life; |
| • | damage to and destruction of property, natural resources and equipment; |
| • | pollution and other environmental damage; |
| • | regulatory investigations and penalties; |
| • | suspension of our operations; and |
| • | repair and remediation costs. |
We may elect not to obtain insurance if we believe that the cost of available insurance is excessive relative to the risks presented. In addition, pollution and environmental risks generally are not fully insurable. The occurrence of an event that is not fully covered by insurance could have a material adverse effect on our business, financial condition and results of operations.
Increased costs of capital could adversely affect our business.
Our business and operating results can be harmed by factors such as the availability, terms and cost of capital, or increases in interest rates. Changes in any one or more of these factors could cause our cost of doing business to increase, limit our access to capital, limit our ability to drill our identified locations and pursue acquisition opportunities, reduce our cash flows available for drilling and place us at a competitive disadvantage. Recent and continuing disruptions and volatility in the global financial markets may lead to an increase in interest rates or a contraction in credit availability impacting our ability to finance our operations. We require continued access to capital. A significant reduction in the availability of credit could materially and adversely affect our ability to achieve our planned growth and operating results.
Our revolving credit facility contains certain covenants that may inhibit our ability to make certain investments, incur additional indebtedness and engage in certain other transactions, which could adversely affect our ability to meet our future goals.
Our revolving credit facility includes certain covenants that, among other things, restrict:
| • | our investments, loans and advances and the payment of dividends and other restricted payments; |
| • | our incurrence of additional indebtedness; |
| • | the granting of liens, other than liens created pursuant to the revolving credit facility and certain permitted liens; |
| • | mergers, consolidations and sales of all or a substantial part of our business or properties; |
| • | the hedging, forward sale or swap of our production of oil or natural gas or other commodities; |
| • | the sale of assets (other than production sold in the ordinary course of business); and |
| • | our capital expenditures. |
Our revolving credit facility requires us to maintain certain financial ratios, such as leverage ratios. All of these restrictive covenants may restrict our ability to expand or pursue our business strategies. Our ability to comply with these and other provisions of our revolving credit facility may be impacted by changes in economic or business conditions, results of operations or events beyond our control. The
22
Table of Contents
Index to Financial Statements
breach of any of these covenants could result in a default under our revolving credit facility, in which case, depending on the actions taken by the lenders thereunder or their successors or assignees, such lenders could elect to declare all amounts borrowed under our revolving credit facility, together with accrued interest, to be due and payable. If we were unable to repay such borrowings or interest, our lenders could proceed against their collateral. If the indebtedness under our revolving credit facility were to be accelerated, our assets may not be sufficient to repay in full such indebtedness.
Our level of indebtedness may increase and reduce our financial flexibility.
Upon the completion of this offering, we expect to have no indebtedness outstanding and a borrowing base of $225 million under our revolving credit facility. In the future, we may incur significant indebtedness in order to make future acquisitions or to develop our properties.
Our level of indebtedness could affect our operations in several ways, including the following:
| • | a significant portion of our cash flows could be used to service our indebtedness; |
| • | a high level of debt would increase our vulnerability to general adverse economic and industry conditions; |
| • | the covenants contained in the agreements governing our outstanding indebtedness will limit our ability to borrow additional funds, dispose of assets, pay dividends and make certain investments; |
| • | a high level of debt may place us at a competitive disadvantage compared to our competitors that are less leveraged and, therefore, such competitors may be able to take advantage of opportunities that our indebtedness would prevent us from pursuing; |
| • | our debt covenants may also affect our flexibility in planning for, and reacting to, changes in the economy and in our industry; |
| • | a high level of debt may make it more likely that a reduction in our borrowing base following a periodic redetermination could require us to repay a portion of our then-outstanding bank borrowings; and |
| • | a high level of debt may impair our ability to obtain additional financing in the future for working capital, capital expenditures, acquisitions, general corporate or other purposes. |
A high level of indebtedness increases the risk that we may default on our debt obligations. Our ability to meet our debt obligations and to reduce our level of indebtedness depends on our future performance. General economic conditions, oil and natural gas prices and financial, business and other factors affect our operations and our future performance. Many of these factors are beyond our control. We may not be able to generate sufficient cash flows to pay the interest on our debt and future working capital, borrowings or equity financing may not be available to pay or refinance such debt. Factors that may affect our ability to raise cash through an offering of our capital stock or a refinancing of our debt include financial market conditions, the value of our assets and our performance at the time we need capital.
In addition, our bank borrowing base is subject to periodic redeterminations on a semi-annual basis, effective September 1 and March 1, beginning September 1, 2011, and up to one additional time per six-month period following each scheduled borrowing base redetermination, as may be requested by either us or the administrative agent under our revolving credit facility. We could be forced to repay a portion of our bank borrowings due to redeterminations of our borrowing base. If we are forced to do so, we may not have sufficient funds to make such repayments. If we do not have sufficient funds and are otherwise unable to negotiate renewals of our borrowings or arrange new financing, we may have to sell significant assets. Any such sale could have a material adverse effect on our business and financial results.
23
Table of Contents
Index to Financial Statements
The inability of our significant customers to meet their obligations to us may adversely affect our financial results.
We are subject to credit risk due to concentration of our oil and natural gas receivables with several significant customers. The largest purchaser of our oil and natural gas during the nine months ended September 30, 2011 and the year ended December 31, 2010 was Chevron, accounting for 44% and 66% of our total revenues for these periods, respectively. We generally do not require our customers to post collateral. The inability or failure of our significant customers to meet their obligations to us or their insolvency or liquidation may adversely affect our financial condition and results of operations.
Our derivative activities could result in financial losses or could reduce our earnings.
To achieve a more predictable cash flow and to reduce our exposure to adverse fluctuations in the prices of oil, we enter into derivative instruments for a portion of our oil production. See “Management’s Discussion and Analysis of Financial Condition and Results of Operations — Quantitative and Qualitative Disclosures About Market Risk” and Note 4 to our audited financial statements for the nine months ended September 30, 2011 for a summary of our oil commodity derivative positions. We did not designate any of our derivative instruments as hedges for accounting purposes, and we record all derivative instruments in our balance sheet at fair value. Changes in the fair value of our derivative instruments are recognized in current earnings. Accordingly, our earnings may fluctuate significantly as a result of changes in the fair value of our derivative instruments.
Derivative instruments expose us to the risk of financial loss in some circumstances, including when:
| • | production is less than the volume covered by the derivative instruments; |
| • | the counter-party to the derivative instrument defaults on its contractual obligations; or |
| • | there is an increase in the differential between the underlying price in the derivative instrument and actual prices received for basis differentials. |
In addition, our derivative arrangements limit the benefit we would receive from increases in the prices for oil.
All of our operations are located in central Louisiana, making us vulnerable to risks associated with operating in one geographic area.
As of September 30, 2011, all of our proved reserves and our annual production were located in central Louisiana. This concentration could disproportionately expose us to operational and regulatory risk or other adverse developments in this area, including, for example, transportation or treatment capacity constraints, curtailment of production or treatment plant closures for scheduled maintenance or weather. These factors could have a significantly greater impact on our financial condition, results of operations and cash flows than if our properties were more diversified.
Large competitors may be attracted to our core operating areas, which may increase our costs.
Our operations in the Upper Gulf Coast tertiary trend may attract companies that have greater resources than we do. These companies may be able to pay more for productive oil and natural gas properties and exploratory prospects or identify, evaluate, bid for and purchase a greater number of properties and prospects than our financial or human resources permit. Their presence in the trend may also restrict our access to, or increase the cost of, oil and natural gas infrastructure, drilling rigs, equipment, supplies, personnel and oilfield services, including fracking equipment and crews. In addition, these companies may have a greater ability to continue exploration activities during periods of
24
Table of Contents
Index to Financial Statements
low oil and natural gas market prices. Our larger competitors may be able to absorb the burden of present and future federal, state, local and other laws and regulations more easily than we can, which would adversely affect our competitive position. Our ability to acquire additional properties and to discover reserves in the future will be dependent upon our ability to evaluate and select suitable properties and to consummate transactions in a highly competitive environment. See “Business — Competition” for additional discussion of the competitive environment in which we operate.
The loss of senior management or technical personnel could adversely affect our operations.
We depend on the services of our senior management and technical personnel. The loss of the services of our senior management or technical personnel, including John Crum, our Chief Executive Officer, could have a material adverse effect on our operations. We do not maintain, nor do we plan to obtain, any insurance against the loss of any of these individuals.
Title to the properties in which we have an interest may be impaired by title defects.
We do not obtain title insurance and have not necessarily obtained drilling title opinions on all of our oil and natural gas properties. The existence of title deficiencies with respect to our oil and natural gas properties could reduce the value or render such properties worthless, which could have a material adverse effect on our business and financial results. A significant portion of our acreage is undeveloped leasehold acreage, which has a greater risk of title defects than developed acreage. Frequently, as a result of title examinations, certain curative work may be required to correct identified title defects, and such curative work entails time and expense. Our inability or failure to cure title defects could render some locations undrillable or cause us to lose our rights to some or all production from some of our oil and natural gas properties, which could have a material adverse effect on our business and financial results if a comparable additional location to drill a development well cannot be identified.
We may be subject to risks in connection with acquisitions, and the integration of significant acquisitions may be difficult.
We periodically evaluate acquisitions of reserves, properties, prospects and leaseholds and other strategic transactions that appear to fit within our overall business strategy. The successful acquisition of producing properties requires an assessment of several factors, including:
| • | recoverable reserves; |
| • | future oil and natural gas prices and their appropriate differentials; |
| • | development and operating costs; and |
| • | potential environmental and other liabilities. |
The accuracy of these assessments is inherently uncertain. In connection with these assessments, we perform a review of the subject properties that we believe to be generally consistent with industry practices. Our review will not reveal all existing or potential problems nor will it permit us to become sufficiently familiar with the properties to fully assess their deficiencies and potential recoverable reserves. Inspections may not always be performed on every well, and environmental problems are not necessarily observable even when an inspection is undertaken. Even when problems are identified, the seller may be unwilling or unable to provide effective contractual protection against all or part of the problems. We often are not entitled to contractual indemnification for environmental liabilities and acquire properties on an “as is” basis.
Significant acquisitions and other strategic transactions may involve other risks, including:
| • | diversion of our management’s attention to evaluating, negotiating and integrating significant acquisitions and strategic transactions; |
25
Table of Contents
Index to Financial Statements
| • | the challenge and cost of integrating acquired operations, information management and other technology systems and business cultures with those of our operations while carrying on our ongoing business; |
| • | difficulty associated with coordinating geographically separate organizations; and |
| • | the challenge of attracting and retaining personnel associated with acquired operations. |
The process of integrating operations could cause an interruption of, or loss of momentum in, the activities of our business. Members of our senior management may be required to devote considerable amounts of time to this integration process, which will decrease the time they will have to manage our business. If our senior management is not able to effectively manage the integration process, or if any significant business activities are interrupted as a result of the integration process, our business could suffer.
In addition, even if we successfully integrate an acquisition, it may not be possible to realize the full benefits we may expect in estimated proved reserves, production volume, cost savings from operating synergies or other benefits anticipated from an acquisition or realize these benefits within the expected time frame. Anticipated benefits of an acquisition may be offset by operating losses relating to changes in commodity prices in oil and natural gas industry conditions, risks and uncertainties relating to the exploratory prospects of the combined assets or operations, or an increase in operating or other costs or other difficulties. If we fail to realize the benefits we anticipate from an acquisition, our results of operations may be adversely affected.
The proposed United States federal budgets for fiscal years 2011 and 2012 and proposed legislation contain certain provisions that, if passed as originally submitted, will have an adverse effect on our financial position, results of operations and cash flows.
The Obama administration’s budget proposals for fiscal years 2011 and 2012 each contain numerous proposed tax changes, and from time to time, legislation has been introduced that would enact many of these proposed changes. The proposed budget and legislation would repeal many tax incentives and deductions that are currently used by U.S. oil and gas companies and impose new fees. Among others, the provisions include: elimination of the ability to fully deduct intangible drilling costs in the year incurred; repeal of the percentage depletion deduction for oil and gas properties; repeal of the domestic manufacturing tax deduction for oil and gas companies; increase in the geological and geophysical amortization period for independent producers; and implementation of a fee on non-producing federal oil and gas leases. Should some or all of these provisions become law our taxes could increase, potentially significantly, after net operating losses are exhausted, which would have a negative impact on our net income and cash flows and could reduce our drilling activities. We do not know the ultimate impact these proposed changes may have on our business.
We are subject to various governmental regulations that may cause us to incur substantial costs.
From time to time, in varying degrees, political developments and federal and state laws and regulations affect our operations. In particular, price controls, taxes and other laws relating to the oil and natural gas industry, changes in these laws and changes in administrative regulations have affected, and in the future could affect, oil and natural gas production, operations and economics. We cannot predict how agencies or courts will interpret existing laws and regulations or the effect of these adoptions and interpretations may have on our business or financial condition.
Our business is subject to laws and regulations promulgated by federal, state and local authorities relating to the exploration for, and the development, production and marketing of, oil and natural gas,
26
Table of Contents
Index to Financial Statements
as well as safety matters. Legal requirements are frequently changed and subject to interpretation, and we are unable to predict the ultimate cost of compliance with these requirements or their effect on our operations. We may be required to make significant expenditures to comply with governmental laws and regulations. The discharge of oil, natural gas or other pollutants into the air, soil or water may give rise to significant liabilities on our part to the government, and third parties and may require us to incur substantial costs of remediation.
Our operations are subject to stringent environmental laws and regulations that may expose us to significant costs and liabilities.
Our oil and natural gas exploration, production and development operations are subject to stringent federal, regional, state and local laws and regulations governing the release or disposal of materials into the environment or otherwise relating to environmental protection. These laws and regulations may, among other things, require the acquisition of a permit before drilling commences, restrict the types, quantities and concentration of substances that can be released into the environment in connection with drilling, completion and production activities, limit or prohibit construction or drilling activities on certain lands lying within wilderness, wetlands, and other protected areas, and impose substantial liabilities for pollution resulting from our operations. We may be required to make significant capital and operating expenditures or perform remedial or other corrective actions at our wells and properties to comply with the requirements of these environmental laws and regulations or the terms or conditions of permits issued pursuant to such requirements. Failure to comply with these laws and regulations may result in the assessment of administrative, civil and criminal penalties, loss of our leases, incurrence of investigatory or remedial obligations and the issuance of orders limiting or prohibiting some or all of our operations.
There is inherent risk of incurring significant environmental costs and liabilities in the performance of our operations due to our handling of petroleum hydrocarbons, other hazardous substances and wastes, as a result of air emissions and wastewater discharges related to our operations, and because of historical operations and waste disposal practices. Spills or other releases of regulated substances, including such spills and releases that occur in the future, could expose us to material losses, expenditures and liabilities under applicable environmental laws and regulations. Under certain of such laws and regulations, we could be held strictly liable for the removal or remediation of previously released materials or property contamination, regardless of whether we were responsible for the release or contamination and even if our operations met previous standards in the industry at the time they were conducted. Changes in environmental laws and regulations occur frequently, and any changes that result in more stringent or costly well drilling, construction, completion or water management activities or waste handling, storage, transport, disposal or cleanup requirements could require us to make significant expenditures to attain and maintain compliance and may otherwise have a material adverse effect on our industry in general in addition to our own results of operations, competitive position or financial condition. We may not be able to recover some or any of these costs from insurance.
Climate change legislation or regulations restricting emissions of greenhouse gases could result in increased operating costs and reduced demand for the oil and natural gas we produce.
In December 2009, the U.S. Environmental Protection Agency, or EPA, determined that emissions of carbon dioxide, methane and other greenhouse gases, or GHGs, present an endangerment to public health and the environment because emissions of such gases are, according to the EPA, contributing to warming of the earth’s atmosphere and other climatic changes. Based on its findings, the EPA has begun adopting and implementing regulations to restrict emissions of GHGs under existing provisions of the federal Clean Air Act, including one regulation that requires a reduction in emissions of GHGs from motor vehicles and another that regulates emissions of GHGs from certain large stationary
27
Table of Contents
Index to Financial Statements
sources, effective January 2, 2011. In addition, in October 2009, the EPA published rules requiring reporting of GHG emissions from specified large GHG emission sources in the United States on an annual basis beginning in 2011 for emissions occurring in 2010. In November 2010, the EPA published new regulations amending this GHG reporting rule to include, among other things, certain onshore and offshore oil and natural gas production facilities on an annual basis, beginning in 2012 for emissions occurring in 2011.
In addition, the U.S. Congress has from time to time considered adopting legislation to reduce emissions of GHGs and almost one-half of the states have already taken legal measures to reduce emissions of GHGs primarily through the planned development of GHG emission inventories and/or regional GHG cap and trade programs. Most of these cap and trade programs work by requiring major sources of emissions to acquire and surrender emission allowances. The number of allowances available for purchase is reduced each year in an effort to achieve the overall GHG emission reduction goal. The adoption of legislation or regulatory programs to reduce emissions of GHGs could require us to incur increased operating costs, such as costs to purchase and operate emissions control systems, to acquire emissions allowances or comply with new regulatory or reporting requirements. Any such legislation or regulatory programs could also increase the cost of consuming, and thereby reduce demand for, the oil and natural gas we produce. Consequently, legislation and regulatory programs to reduce emissions of GHGs could have an adverse effect on our business, financial condition and results of operations.
Federal and state legislative and regulatory initiatives relating to hydraulic fracturing as well as governmental reviews of such activities could result in increased costs, additional operating restrictions or delays, which could adversely affect our production.
Hydraulic fracturing is an important and common practice that is used to stimulate production of natural gas and/or oil from dense subsurface rock formations. The process involves the injection of water, sand and chemicals under pressure into the formation to fracture the surrounding rock and stimulate production. We routinely utilize hydraulic fracturing techniques in many of our oil and natural gas drilling and completion programs. The process is typically regulated by state oil and natural gas commissions. However, the EPA recently asserted federal regulatory authority over certain hydraulic fracturing activities involving diesel under the federal Safe Drinking Water Act, or SDWA, and has begun the process of drafting guidance documents on regulatory requirements for companies that plan to conduct hydraulic fracturing using diesel. In addition, legislation has been introduced before Congress, called the Fracturing Responsibility and Awareness of Chemicals Act, or FRAC Act, to provide for federal regulation of hydraulic fracturing and to require disclosure of the chemicals used in the fracturing process. Also, some states have adopted, and other states are considering adopting, regulations that could impose more stringent permitting, disclosure and well construction requirements on hydraulic fracturing operations under certain circumstances. For instance, on October 20, 2011, Louisiana adopted new regulations for hydraulic fracturing operations in the state. These new regulations require hydraulic fracturing operators to publicly disclose the volume of hydraulic fracturing fluid, the type, trade name, supplier and volume of additives, and a list of chemical compounds contained in the additive, along with its maximum concentration, subject to certain trade secret protections. However, even trade secret chemicals will have to be identified by their chemical family. A mandatory disclosure of information regarding the constituents of hydraulic fracturing fluids could make it easier for third parties opposing the hydraulic fracturing process to initiate legal proceedings based upon allegations that specific chemicals used in the fracturing process could adversely affect the environment.
In addition, there are also certain governmental reviews either underway or being proposed that focus on environmental aspects of hydraulic fracturing practices. The White House Council on Environmental Quality is coordinating an administration-wide review of hydraulic fracturing practices,
28
Table of Contents
Index to Financial Statements
and a committee of the United States House of Representatives has conducted an investigation of hydraulic fracturing practices. Furthermore, a number of federal agencies are analyzing, or have been requested to review, a variety of environmental issues associated with hydraulic fracturing. The EPA has commenced a study of the potential environmental effects of hydraulic fracturing on drinking water and groundwater, with initial results expected to be available by late 2012 and final results by 2014. In addition, the U.S. Department of Energy is conducting an investigation into practices the agency could recommend to better protect the environment from drilling using hydraulic fracturing completion methods. Also, the U.S. Department of the Interior is considering disclosure requirements or other mandates for hydraulic fracturing on federal lands. Only recently, certain members of the Congress have called upon the U.S. Government Accountability Office to investigate how hydraulic fracturing might adversely affect water resources, the SEC to investigate the natural gas industry and any possible misleading of investors or the public regarding the economic feasibility of pursuing natural gas deposits in shales by means of hydraulic fracturing, and the U.S. Energy Information Administration to provide a better understanding of that agency’s estimates regarding natural gas reserves, including reserves from shale formations, as well as uncertainties associated with those estimates. These on-going or proposed studies, depending on their degree of pursuit and any meaningful results obtained, could spur initiatives to further regulate hydraulic fracturing under the SDWA or otherwise.
If new laws or regulations that significantly restrict hydraulic fracturing are adopted, such laws could make it more difficult or costly for us to perform fracturing to stimulate production from tight formations. In addition, if hydraulic fracturing becomes regulated at the federal level as a result of federal legislation or regulatory initiatives by the EPA or other federal agencies, our fracturing activities could become subject to additional permitting requirements and attendant permitting delays as well as potential increases in costs. Restrictions on hydraulic fracturing could also reduce the amount of oil and natural gas that we are ultimately able to produce from our reserves.
Derivatives regulation included in current financial reform legislation could impede our ability to manage business and financial risks by restricting our use of derivative instruments as hedges against fluctuating commodity prices.
Last year, the United States Congress adopted the Dodd-Frank Wall Street Reform and Consumer Protection Act, which contains comprehensive financial reform legislation that changes federal oversight and regulation of the over-the-counter derivatives market and entities, such as us, that participate in that market. The new legislation was signed into law by the President on July 21, 2010 and requires the Commodity Futures Trading Commission, or CFTC, the SEC and other regulators to promulgate rules and regulations implementing the new legislation within 360 days from the date of enactment. In June 2011, this deadline was extended to December 31, 2011. The CFTC recently promulgated regulations to set position limits for certain futures and option contracts in the major energy markets and for swaps that are their economic equivalents. Certain bona fide hedging transactions or positions would be exempt from these position limits. Although the CFTC has promulgated regulations, it is not possible at this time to predict when these regulations will become effective because their effectiveness depends on promulgation of other regulations by the CFTC. The CFTC also has proposed regulations to establish minimum capital requirements, although it is not possible at this time to predict whether or when the CFTC will adopt those rules or include comparable provisions in its rulemaking under the Dodd-Frank Act. The Dodd-Frank Act also calls for the establishment of margin requirements and clearing and trade-execution requirements in connection with certain derivative activities. The CFTC has proposed regulations that would impose both initial and variation margin requirements on certain derivatives instruments that are not cleared by a registered derivatives organization, although whether or when the CFTC will adopt those rules or include comparable provisions in its rulemaking under the Dodd-Frank Act is not possible to predict at this time. The legislation and new regulations may also require the counterparties to our commodity derivative contracts to spinoff some of their derivatives activities to a separate entity, which may not be
29
Table of Contents
Index to Financial Statements
as creditworthy as the current counterparty, or cause the entity to comply with the capital requirements, which could result in increased costs to counterparties such as us.
The new legislation and any new regulations could significantly increase the cost of some commodity derivative contracts (including through requirements to post collateral or provide other credit support, which could adversely affect our available liquidity), materially alter the terms of some commodity derivative contracts, reduce the availability of some derivatives to protect against risks we encounter, reduce our ability to monetize or restructure our existing commodity derivative contracts and increase our exposure to less creditworthy counterparties. If we reduce our use of derivatives as a result of the new legislation and regulations, our results of operations may become more volatile and our cash flows may be less predictable, which could adversely affect our ability to plan for and fund capital expenditures. Increased volatility may make us less attractive to certain types of investors. Finally, the Dodd-Frank Act was intended, in part, to reduce the volatility of oil and natural gas prices, which some legislators attributed to speculative trading in derivatives and commodity instruments related to oil and natural gas. If the new legislation and regulations result in lower commodity prices, our revenues could be adversely affected. Any of these consequences could adversely affect our business, financial condition and results of operations.
Risks Relating to the Offering and our Common Stock
The initial public offering price of our common stock may not be indicative of the market price of our common stock after this offering. In addition, an active, liquid and orderly trading market for our common stock may not develop or be maintained, and our stock price may be volatile.
Prior to this offering, our common stock was not traded on any market. An active, liquid and orderly trading market for our common stock may not develop or be maintained after this offering. Active, liquid and orderly trading markets usually result in less price volatility and more efficiency in carrying out investors’ purchase and sale orders. The market price of our common stock could vary significantly as a result of a number of factors, some of which are beyond our control. In the event of a drop in the market price of our common stock, you could lose a substantial part or all of your investment in our common stock. The initial public offering price will be negotiated between us, the selling stockholders and representatives of the underwriters, based on numerous factors which we discuss in the “Underwriting” section of this prospectus, and may not be indicative of the market price of our common stock after this offering. Consequently, you may not be able to sell shares of our common stock at prices equal to or greater than the price paid by you in this offering.
The following factors could affect our stock price:
| • | our operating and financial performance and drilling locations, including reserve estimates; |
| • | quarterly variations in the rate of growth of our financial indicators, such as net income per share, net income and revenues; |
| • | strategic actions by our competitors; |
| • | changes in revenue or earnings estimates, or changes in recommendations or withdrawal of research coverage, by equity research analysts; |
| • | speculation in the press or investment community; |
| • | sales of our common stock by us, the selling stockholders or other stockholders, or the perception that such sales may occur; |
| • | changes in accounting principles; |
| • | additions or departures of key management personnel; |
| • | actions by our stockholders; |
30
Table of Contents
Index to Financial Statements
| • | general market conditions, including fluctuations in commodity prices; and |
| • | domestic and international economic, legal and regulatory factors unrelated to our performance. |
The stock markets in general have experienced extreme volatility that has often been unrelated to the operating performance of particular companies. These broad market fluctuations may adversely affect the trading price of our common stock. Securities class action litigation has often been instituted against companies following periods of volatility in the overall market and in the market price of a company’s securities. Such litigation, if instituted against us, could result in very substantial costs, divert our management’s attention and resources and harm our business, operating results and financial condition.
Investors in this offering will experience immediate and substantial dilution of $ per share.
Based on an assumed initial public offering price of $ per share, purchasers of our common stock in this offering will experience an immediate and substantial dilution of $ per share in the as adjusted net tangible book value per share of common stock from the initial public offering price, and our as adjusted net tangible book value as of September 30, 2011 after giving effect to this offering would be $ per share. This dilution is due in large part to earlier investors having paid substantially less than the initial public offering price when they purchased their shares. In addition, if the underwriters exercise their option to purchase additional shares from us, investors in this offering will experience additional dilution. See “Dilution” for additional information.
We may invest or spend the proceeds of this offering in ways with which you may not agree or in ways which may not yield a return.
The net proceeds from this offering may be used for general corporate purposes, including working capital. Our management will have considerable discretion in the application of the net proceeds, and you will not have the opportunity, as part of your investment decision, to assess whether the proceeds are being used appropriately. The net proceeds may be used for corporate purposes that do not increase our operating results or market value. Until the net proceeds are used, they may be placed in investments that do not produce significant income or that may lose value.
Because we are a relatively small company, the requirements of being a public company, including compliance with the reporting requirements of the Exchange Act and the requirements of the Sarbanes-Oxley Act of 2002, may strain our resources, increase our costs and distract management, and we may be unable to comply with these requirements in a timely or cost-effective manner.
As a public company with listed equity securities, we will need to comply with new laws, regulations and requirements, certain corporate governance provisions of the Sarbanes-Oxley Act of 2002, related regulations of the SEC, including compliance with the reporting requirements of the Securities Exchange Act of 1934, as amended (the “Exchange Act”), and the requirements of the New York Stock Exchange, or the NYSE, with which we are not required to comply as a private company. Complying with these statutes, regulations and requirements will occupy a significant amount of time of our board of directors and management and will significantly increase our costs and expenses. We will need to:
| • | institute a more comprehensive compliance function; |
| • | design, establish, evaluate and maintain a system of internal controls over financial reporting in compliance with the requirements of Section 404 of the Sarbanes-Oxley Act of 2002 and the related rules and regulations of the SEC and the Public Company Accounting Oversight board of directors; |
31
Table of Contents
Index to Financial Statements
| • | comply with rules promulgated by the NYSE; |
| • | prepare and distribute periodic public reports in compliance with our obligations under the federal securities laws; |
| • | establish new internal policies, such as those relating to disclosure controls and procedures and insider trading; |
| • | involve and retain to a greater degree outside counsel and accountants in the above activities; and |
| • | establish an investor relations function. |
In addition, we also expect that being a public company subject to these rules and regulations will require us to accept less director and officer liability insurance coverage than we desire or to incur substantial costs to obtain coverage. These factors could also make it more difficult for us to attract and retain qualified members of our board of directors, particularly to serve on our audit committee and compensation committee, and qualified executive officers. If our profitability is adversely affected because of these additional costs, it could have a negative effect on the trading price of our common stock.
In connection with audits and reviews of our financial statements, our independent registered public accounting firm identified and reported adjustments to management. Certain of such adjustments were deemed to be the result of internal control deficiencies that constitute material weaknesses in our internal control over financial reporting. If one or more material weaknesses persist or if we fail to establish and maintain effective internal control over financial reporting, our ability to accurately report our financial results could be adversely affected.
Prior to the completion of this offering, we have been a private company with limited accounting personnel to adequately execute our accounting processes and limited other supervisory resources with which to address our internal control over financial reporting. As such, we have not maintained an effective control environment to ensure that the design and execution of our controls has consistently resulted in effective review of our financial statements and supervision by appropriate individuals. The lack of adequate staffing levels resulted in insufficient time spent on review and approval of certain information used to prepare our financial statements. As a result of these factors, certain material misstatements in both our annual and interim period financial statements were discovered and brought to the attention of our management by our independent registered public accounting firm for correction. We and our independent registered public accounting firm have concluded that these control deficiencies constitute a material weakness in our control environment. A material weakness is a control deficiency, or a combination of control deficiencies, in internal control over financial reporting, such that there is a reasonable possibility that a material misstatement of our annual or interim financial statements will not be prevented or detected on a timely basis. The control deficiencies described above, at varying degrees of severity, contributed to the material weaknesses in the control environment as further described in “Management’s Discussion and Analysis of Financial Condition and Results of Operations—Internal Controls and Procedures.”
Although remediation efforts are still in progress, management has taken steps to address the causes of our annual and interim period adjustments and to improve our internal control over financial reporting, including the implementation of new accounting processes and control procedures, the identification of gaps in our skills base and the additional expertise of staff required to meet the financial reporting requirements of a public company.
32
Table of Contents
Index to Financial Statements
We are not currently required to comply with the SEC’s rules implementing Section 404 of the Sarbanes-Oxley Act of 2002 and are therefore not required to make a formal assessment of the effectiveness of our internal control over financial reporting for that purpose. Upon becoming a public company, we will be required to comply with the SEC’s rules implementing Section 302 of the Sarbanes-Oxley Act of 2002, which will require our management to certify financial and other information in our quarterly and annual reports and provide an annual management report on the effectiveness of our internal control over financial reporting. We will not be required to make our first assessment of our internal control over financial reporting until the year following our first annual report required to be filed with the SEC. To comply with the requirements of being a public company, we will need to upgrade our systems, including information technology, implement additional financial and management controls, reporting systems and procedures and hire additional accounting, finance and legal staff.
Our efforts to develop and maintain our internal controls may not be successful, and we may be unable to maintain effective controls over our financial processes and reporting in the future and comply with the certification and reporting obligations under Sections 302 and 404 of the Sarbanes-Oxley Act of 2002. Further, our remediation efforts may not enable us to remedy or avoid material weaknesses or significant deficiencies in the future. Any failure to remediate deficiencies and to develop or maintain effective controls, or any difficulties encountered in our implementation or improvement of our internal controls over financial reporting could result in material misstatements that are not prevented or detected on a timely basis, which could potentially subject us to sanctions or investigations by the SEC, the NYSE or other regulatory authorities. Ineffective internal controls could also cause investors to lose confidence in our reported financial information.
We do not intend to pay, and we are currently prohibited from paying, dividends on our common stock and, consequently, your only opportunity to achieve a return on your investment is if the price of our common stock appreciates.
We do not plan to declare dividends on shares of our common stock in the foreseeable future. Additionally, we are currently prohibited from making any cash dividends pursuant to the terms of our revolving credit facility. Consequently, your only opportunity to achieve a return on your investment in us will be if you sell your common stock at a price greater than you paid for it. There is no guarantee that the price of our common stock that will prevail in the market will ever exceed the price that you pay in this offering.
Future sales of our common stock in the public market could reduce our stock price, and any additional capital raised by us through the sale of equity or convertible securities may dilute your ownership in us.
We may sell additional shares of common stock in subsequent public offerings. We may also issue additional shares of common stock or convertible securities. After the completion of this offering, we will have outstanding shares of common stock. This number includes shares that we and the selling stockholders are selling in this offering (assuming no exercise of the underwriters’ option to purchase additional shares), which may be resold immediately in the public market. Following the completion of this offering and after certain distributions by the selling stockholders, the selling stockholders will own shares, or approximately % of our total outstanding shares, and certain of our affiliates will own shares, or approximately % of our total outstanding shares, all of which are restricted from immediate resale under the federal securities laws and are subject to the lock-up agreements between such parties and the underwriters described in “Underwriting,” but may be sold into the market in the future. We expect that certain stockholders will be parties to a registration rights agreement with us which will require us to effect the registration of their shares in certain circumstances no earlier than the expiration of the lock-up period contained in the underwriting
33
Table of Contents
Index to Financial Statements
agreement entered into in connection with this offering. The holders of the remaining shares and a small portion of shares owned by our affiliates which will be distributed to non-officer employees and other non-affiliates totaling up to approximately shares, or approximately % of our total outstanding shares, are not subject to lock-up agreements and, subject to compliance with Rule 144 under the Securities Act of 1933, as amended (the “Securities Act”), may sell such shares into the public market.
As soon as practicable after this offering, we intend to file a registration statement with the SEC on Form S-8 providing for the registration of shares of our common stock issued or reserved for issuance under our stock incentive plan. Subject to the satisfaction of vesting conditions and the expiration of lock-up agreements, shares registered under this registration statement on Form S-8 will be available for resale immediately in the public market without restriction.
We cannot predict the size of future issuances of our common stock or securities convertible into common stock or the effect, if any, that future issuances and sales of shares of our common stock will have on the market price of our common stock. Sales of substantial amounts of our common stock (including shares issued in connection with an acquisition), or the perception that such sales could occur, may adversely affect prevailing market prices of our common stock.
The underwriters of this offering may waive or release parties to the lock-up agreements entered into in connection with this offering, which could adversely affect the price of our common stock.
Certain of our stockholders, directors and members of our senior management team have entered into lock-up agreements with respect to their common stock, pursuant to which they are subject to certain resale restrictions for a period of 180 days following the effectiveness date of the registration statement this prospectus forms a part. , at any time and without notice, may release all or any portion of the common stock subject to the foregoing lock-up agreements. If the restrictions under the lock-up agreements are waived, then common stock will be available for sale into the public markets, which could cause the market price of our common stock to decline and impair our ability to raise capital.
The concentration of our capital stock ownership among our largest stockholders and their affiliates will limit your ability to influence corporate matters.
Upon completion of this offering (assuming no exercise of the underwriters’ option to purchase additional shares), we anticipate that First Reserve will initially own an approximate % indirect economic interest in us through MPCI, which will initially own approximately % of our shares of common stock. Consequently, First Reserve will continue to have significant influence over all matters that require approval by our stockholders, including the election and removal of directors and approval of significant corporate transactions. This concentration of ownership will limit your ability to influence corporate matters, and as a result, actions may be taken that you may not view as beneficial.
Our amended and restated certificate of incorporation contains a provision renouncing our interest and expectancy in certain corporate opportunities, which could adversely affect our business or prospects.
Conflicts of interest could arise in the future between us, on the one hand, and First Reserve and its affiliates, including its portfolio companies, on the other hand, concerning among other things, potential competitive business activities or business opportunities. First Reserve is a private equity firm in the business of making investments in entities primarily in the global energy sector. As a result, First Reserve’s existing and future portfolio companies which it controls may compete with us for investment or business opportunities. These conflicts of interest may not be resolved in our favor.
34
Table of Contents
Index to Financial Statements
Our amended and restated certificate of incorporation provides that, to the fullest extent permitted by applicable law, we renounce any interest or expectancy in, or in being offered an opportunity to participate in, any business opportunity that may be from time to time presented to First Reserve or its affiliates or any of their respective officers, directors, agents, shareholders, members, partners, affiliates and subsidiaries (other than us and our subsidiaries) or business opportunities that such parties participate in or desire to participate in, even if the opportunity is one that we might reasonably have pursued or had the ability or desire to pursue if granted the opportunity to do so, and no such person shall be liable to us for breach of any fiduciary or other duty, as a director or officer or controlling stockholder or otherwise, by reason of the fact that such person pursues or acquires any such business opportunity, directs any such business opportunity to another person or fails to present any such business opportunity, or information regarding any such business opportunity, to us unless, in the case of any such person who is our director or officer, any such business opportunity is expressly offered to such director or officer solely in his or her capacity as our director or officer.
As a result, First Reserve or its affiliates may become aware, from time to time, of certain business opportunities, such as acquisition opportunities, and may direct such opportunities to other businesses in which they have invested, in which case we may not become aware of or otherwise have the ability to pursue such opportunity. Further, such businesses may choose to compete with us for these opportunities. As a result, our renouncing our interest and expectancy in any business opportunity that may be from time to time presented to First Reserve and its affiliates could adversely impact our business or prospects if attractive business opportunities are procured by such parties for their own benefit rather than for ours. See “Description of Capital Stock.”
We will be a “controlled company” within the meaning of the NYSE rules and, as a result, will qualify for and will rely on exemptions from certain corporate governance requirements.
Upon completion of this offering First Reserve will continue to control a majority of the combined voting power of all classes of our outstanding voting stock and we will be a “controlled company” within the meaning of the NYSE corporate governance standards. Under the NYSE rules, a company of which more than 50% of the voting power is held by another person or group of persons acting together is a “controlled company” and may elect not to comply with certain NYSE corporate governance requirements, including the requirements that:
| • | a majority of the board of directors consist of independent directors; |
| • | the nominating and corporate governance committee be composed entirely of independent directors with a written charter addressing the committee’s purpose and responsibilities; |
| • | the compensation committee be composed entirely of independent directors with a written charter addressing the committee’s purpose and responsibilities; and |
| • | there be an annual performance evaluation of the nominating and corporate governance and compensation committees. |
These requirements will not apply to us as long as we remain a “controlled company.” Following this offering, we may utilize some or all of these exemptions. We will rely on the phase-in rules of the SEC and the NYSE with respect to the independence of our audit committee. These rules permit us to have an audit committee that has one member that is independent upon the effectiveness of the registration statement of which this prospectus forms a part, a majority of members that are independent within 90 days thereafter and all members that are independent within one year thereafter. Accordingly, you may not have the same protections afforded to stockholders of companies that are subject to all of the corporate governance requirements of the NYSE.
35
Table of Contents
Index to Financial Statements
CAUTIONARY NOTE REGARDING FORWARD-LOOKING STATEMENTS
This prospectus, including the sections entitled “Prospectus Summary,” “Risk Factors,” “Use of Proceeds,” “Management’s Discussion and Analysis of Financial Condition and Results of Operations” and “Business,” contains forward-looking statements that are subject to a number of risks and uncertainties, many of which are beyond our control. All statements, other than statements of historical fact included in this prospectus, regarding our strategy, future operations, financial position, estimated revenues and losses, projected costs, prospects, plans and objectives of management are forward-looking statements. When used in this prospectus, the words “could,” “believe,” “anticipate,” “intend,” “estimate,” “expect,” “may,” “continue,” “predict,” “potential,” “project” and similar expressions are intended to identify forward-looking statements, although not all forward-looking statements contain such identifying words.
Forward-looking statements may include statements about our:
| • | business strategy; |
| • | reserves; |
| • | technology; |
| • | cash flows and liquidity; |
| • | financial strategy, budget, projections and operating results; |
| • | oil and natural gas realized prices; |
| • | timing and amount of future production of oil and natural gas; |
| • | availability of drilling and production equipment; |
| • | availability of oilfield labor; |
| • | the amount, nature and timing of capital expenditures, including future development costs; |
| • | availability and terms of capital; |
| • | drilling of wells including our identified drilling locations; |
| • | successful results from our identified drilling locations; |
| • | marketing of oil and natural gas; |
| • | property acquisitions; |
| • | costs of developing our properties and conducting other operations; |
| • | general economic conditions; |
| • | effectiveness of our risk management activities; |
| • | environmental liabilities; |
| • | counterparty credit risk; |
| • | governmental regulation and taxation of the oil and natural gas industry; |
| • | developments in oil-producing and natural gas-producing countries; |
| • | uncertainty regarding our future operating results; |
| • | estimated future net reserves and present value thereof; and |
| • | plans, objectives, expectations and intentions contained in this prospectus that are not historical. |
36
Table of Contents
Index to Financial Statements
All forward-looking statements speak only as of the date of this prospectus. You should not place undue reliance on these forward-looking statements. These forward-looking statements are subject to a number of risks, uncertainties and assumptions. Moreover, we operate in a very competitive and rapidly changing environment. New risks emerge from time to time. It is not possible for our management to predict all risks, nor can we assess the impact of all factors on our business or the extent to which any factor, or combination of factors, may cause actual results to differ materially from those contained in any forward-looking statements we may make. Although we believe that our plans, intentions and expectations reflected in or suggested by the forward-looking statements we make in this prospectus are reasonable, we can give no assurance that these plans, intentions or expectations will be achieved or occur, and actual results could differ materially and adversely from those anticipated or implied in the forward-looking statements. We disclose important factors that could cause our actual results to differ materially from our expectations under “Risk Factors” and “Management’s Discussion and Analysis of Financial Condition and Results of Operations” and elsewhere in this prospectus.
These factors include:
| • | variations in the market demand for, and prices of, oil and natural gas; |
| • | uncertainties about our estimated quantities of oil and natural gas reserves; |
| • | the adequacy of our capital resources and liquidity including, but not limited to, access to additional borrowing capacity under our revolving credit facility; |
| • | access to capital and general economic and business conditions; |
| • | uncertainties about our ability to replace reserves and economically develop our current reserves; |
| • | risks related to the concentration of our operations onshore in central Louisiana; |
| • | drilling results; |
| • | the potential adoption of new governmental regulations; and |
| • | our ability to satisfy future cash obligations and environmental costs. |
These cautionary statements qualify all forward-looking statements attributable to us or persons acting on our behalf.
Reserve engineering is a process of estimating underground accumulations of oil and natural gas that cannot be measured in an exact way. The accuracy of any reserve estimate depends on the quality of available data, the interpretation of such data and price and cost assumptions made by our reserve engineers. In addition, the results of drilling, testing and production activities may justify revisions of estimates that were made previously. If significant, such revisions would change the schedule of any further production and development drilling. Accordingly, reserve estimates may differ from the quantities of oil and natural gas that are ultimately recovered.
37
Table of Contents
Index to Financial Statements
We expect to receive approximately $ million of net proceeds from the sale of the common stock offered by us, based upon the assumed initial public offering price of $ per share (the midpoint of the price range set forth on the cover page of this prospectus), after deducting underwriting discounts and commissions and estimated offering expenses payable by us.
We intend to use $ million of the net proceeds from this offering to repay all outstanding indebtedness under our revolving credit facility. The remaining proceeds of approximately $ million will be used to fund a portion of our exploration and development program.
Our revolving credit facility matures in December 2014 and bears interest at a variable rate, which was approximately 2.9% per annum as of September 30, 2011. Our outstanding borrowings under our revolving credit facility were incurred to fund exploration, development and other capital expenditures. Affiliates of certain of the underwriters are lenders under our revolving credit facility and, accordingly, will receive a portion of the proceeds from this offering. Please read “Underwriting — Conflicts of Interest.”
We will not receive any of the proceeds from the sale of shares of our common stock by the selling stockholders. We will pay all expenses related to this offering, other than underwriting discounts and commissions related to the shares sold by the selling stockholders.
We have never declared and paid, and we do not anticipate declaring or paying, any cash dividends to holders of our common stock in the foreseeable future. We currently intend to retain future earnings, if any, to finance the growth of our business. Our future dividend policy is within the discretion of our board of directors and will depend upon then existing conditions, including our results of operations, financial condition, capital requirements, investment opportunities statutory restrictions on our ability to pay dividends and other factors our board of directors may deem relevant. In addition, our revolving credit facility prohibits us from paying dividends other than for tax purposes.
38
Table of Contents
Index to Financial Statements
The following table sets forth the cash and cash equivalents and capitalization of Midstates Petroleum Holdings LLC and Midstates Petroleum Company, Inc., as applicable, as of September 30, 2011:
| • | on an actual basis; |
| • | on an as adjusted basis to give effect to the transactions described under “Corporate Reorganization” that will occur simultaneously with the closing of this offering; and |
| • | on an as further adjusted basis to give effect to the application of the net proceeds from this offering as set forth under “Use of Proceeds,” assuming an initial public offering price of $ per share (the mid-point of the range set forth on the cover of this prospectus). |
You should read the following table in conjunction with “Use of Proceeds,” “Selected Historical Consolidated Financial Data,” “Management’s Discussion and Analysis of Financial Condition and Results of Operations” and our historical consolidated financial statements and related notes thereto appearing elsewhere in this prospectus.
| As of September 30, 2011 | ||||||||||||
| Actual | As Adjusted |
As Further Adjusted |
||||||||||
| (in thousands) | ||||||||||||
| Cash and cash equivalents |
$ | 10,220 | $ | 10,220 | $ | |||||||
| Long-term debt, including current maturities: |
||||||||||||
| Revolving credit facility (1) |
198,600 | 198,600 | ||||||||||
|
|
|
|
|
|
|
|||||||
| Total long-term debt |
198,600 | 198,600 | ||||||||||
|
|
|
|
|
|
|
|||||||
| Members’ equity / stockholders’ equity: |
||||||||||||
| Members’ equity |
277,922 | — | — | |||||||||
| Common stock, $0.01 par value; no shares authorized, issued and outstanding (actual); shares authorized (as adjusted and as further adjusted); shares issued and outstanding (as adjusted); shares issued and outstanding (as further adjusted) |
— | |||||||||||
| Preferred stock, $0.01 par value; no shares authorized (actual); shares authorized (as adjusted and as further adjusted); no shares issued and outstanding |
— | — | — | |||||||||
| Additional paid-in capital |
— | |||||||||||
| Retained earnings (accumulated loss) |
— | |||||||||||
| Total members’ / stockholders’ equity |
277,922 | |||||||||||
|
|
|
|
|
|
|
|||||||
| Total capitalization |
$ | 476,522 | $ | $ | ||||||||
|
|
|
|
|
|
|
|||||||
| (1) | As of November 14, 2011, we had $221.6 million of indebtedness outstanding under our revolving credit facility. We intend to repay in full all amounts outstanding under our revolving credit facility with a portion of the net proceeds from this offering. |
39
Table of Contents
Index to Financial Statements
Purchasers of the common stock in this offering will experience immediate and substantial dilution in the net tangible book value per share of the common stock for accounting purposes. Our net tangible book value as of September 30, 2011, after giving pro forma effect to the transactions described under “Corporate Reorganization,” was approximately $ million, or $ per share of common stock. Pro forma net tangible book value per share is determined by dividing our pro forma tangible net worth (tangible assets less total liabilities) by the total number of outstanding shares of common stock that will be outstanding immediately prior to the closing of this offering including giving effect to our corporate reorganization. After giving effect to the sale of the shares in this offering and further assuming the receipt of the estimated net proceeds (after deducting estimated discounts and expenses of this offering), our adjusted pro forma net tangible book value as of September 30, 2011 would have been approximately $ million, or $ per share. This represents an immediate increase in the net tangible book value of $ per share to our existing stockholders and an immediate dilution (i.e., the difference between the offering price and the adjusted pro forma net tangible book value after this offering) to new investors purchasing shares in this offering of $ per share. The following table illustrates the per share dilution to new investors purchasing shares in this offering:
| Assumed initial public offering price per share |
$ | |||||||
| Pro forma net tangible book value per share as of September 30, 2011 (after giving effect to our corporate reorganization) |
$ | |||||||
|
|
|
|||||||
| Increase per share attributable to new investors in this offering |
||||||||
| As adjusted pro forma net tangible book value per share after giving effect to our corporate reorganization and this offering |
||||||||
|
|
|
|||||||
| Dilution in pro forma net tangible book value per share to new investors in this offering |
$ | |||||||
|
|
|
The following table summarizes, on an adjusted pro forma basis as of September 30, 2011, the total number of shares of common stock owned by existing stockholders and to be owned by new investors, the total consideration paid, and the average price per share paid by our existing stockholders and to be paid by new investors in this offering at $ , the midpoint of the range of the initial public offering prices set forth on the cover page of this prospectus, calculated before deduction of estimated underwriting discounts and commissions:
| Shares Acquired | Total Consideration | Average Price Per Share |
||||||||||||||||
| Number | Percent | Amount | Percent | |||||||||||||||
| Existing stockholders (1) |
% | $ | % | $ | ||||||||||||||
| New investors (2) |
% | % | ||||||||||||||||
|
|
|
|
|
|
|
|
|
|
||||||||||
| Total |
% | $ | % | $ | ||||||||||||||
|
|
|
|
|
|
|
|
|
|
||||||||||
| (1) | The number of shares disclosed for the existing stockholders includes shares being sold by the selling stockholders in this offering. |
| (2) | The number of shares disclosed for the new investors does not include the shares being purchased by the new investors from the selling stockholders in this offering. |
40
Table of Contents
Index to Financial Statements
SELECTED HISTORICAL CONSOLIDATED FINANCIAL DATA
You should read the following selected financial data in conjunction with “Capitalization,” “Corporate Reorganization,” “Management’s Discussion and Analysis of Financial Condition and Results of Operations” and our historical consolidated financial statements and related notes thereto included elsewhere in this prospectus. We believe that the assumptions underlying the preparation of our historical consolidated financial statements are reasonable. The financial information included in this prospectus may not be indicative of our future results of operations, financial position and cash flows.
Set forth below is (i) our selected historical consolidated financial data as of and for the nine months ended September 30, 2011, which has been derived from our audited consolidated financial statements included elsewhere in this prospectus; (ii) our selected historical consolidated financial data as of and for the nine months ended September 30, 2010, which has been derived from our unaudited consolidated financial statements included elsewhere in this prospectus; (iii) our selected historical consolidated financial data as of and for the years ended December 31, 2010 and 2009 and for the period from August 30, 2008 through December 31, 2008, which has been derived from our audited consolidated financial statements included elsewhere in this prospectus; (iv) selected historical consolidated financial data for the period from January 1 to August 29, 2008 of Midstates Petroleum Corporation, our accounting predecessor, which has been derived from the audited financial statements of Midstates Petroleum Corporation included elsewhere in this prospectus; and (v) selected historical consolidated financial data as of and for the years ended December 31, 2007 and 2006 of Midstates Petroleum Corporation, which has been derived from the unaudited consolidated financial statements of Midstates Petroleum Corporation not included elsewhere in this prospectus.
| Successor | Predecessor | |||||||||||||||||||||||||||||||||
| Nine Months Ended September 30, |
Year Ended December 31, |
Period from August 30 to December 31, 2008 |
Period from January 1 to August 29, 2008 |
Year Ended December 31, |
||||||||||||||||||||||||||||||
| 2011 | 2010 | 2010 | 2009 | 2007 | 2006 | |||||||||||||||||||||||||||||
| (unaudited) |
(in thousands) | (unaudited) |
||||||||||||||||||||||||||||||||
| Statement of operations data |
||||||||||||||||||||||||||||||||||
| Oil, gas and natural gas liquids revenues |
$ | 147,579 | $ | 58,296 | $ | 89,111 | $ | 30,133 | $ | 8,689 | $ | 27,458 | $ | 14,647 | $ | 6,862 | ||||||||||||||||||
| Gains (losses) on commodity derivative contracts - net |
22,442 | (6,453 | ) | (26,268 | ) | (5,987 | ) | 14,062 | (7,678 | ) | (5,363 | ) | 276 | |||||||||||||||||||||
| Other revenue |
260 | 185 | 209 | 108 | 43 | 113 | 234 | 219 | ||||||||||||||||||||||||||
|
|
|
|
|
|
|
|
|
|
|
|
|
|
|
|
|
|||||||||||||||||||
| Total revenues |
170,281 | 52,028 | 63,052 | 24,254 | 22,794 | 19,893 | 9,518 | 7,357 | ||||||||||||||||||||||||||
| Expenses: |
||||||||||||||||||||||||||||||||||
| Lease operating |
9,451 | 5,225 | 8,733 | 5,312 | 1,542 | 2,769 | 1,954 | 1,744 | ||||||||||||||||||||||||||
| Workover |
1,301 | 3,856 | 4,683 | 5,226 | 2,376 | 2,206 | 1,777 | 708 | ||||||||||||||||||||||||||
| Severance tax |
8,437 | 4,193 | 6,431 | 2,849 | 805 | 2,354 | 1,258 | 408 | ||||||||||||||||||||||||||
| Asset retirement accretion |
205 | 108 | 175 | 120 | 37 | 79 | 113 | 99 | ||||||||||||||||||||||||||
| General and administrative |
15,519 | 11,820 | 16,847 | 5,886 | 1,402 | 1,816 | 1,616 | 1,778 | ||||||||||||||||||||||||||
| Depreciation, depletion and amortization |
61,640 | 26,924 | 41,827 | 12,322 | 2,995 | 3,117 | 3,503 | 1,732 | ||||||||||||||||||||||||||
| Impairment in carrying value of oil and gas properties |
— | — | — | 4,297 | 26,776 | — | — | — | ||||||||||||||||||||||||||
|
|
|
|
|
|
|
|
|
|
|
|
|
|
|
|
|
|||||||||||||||||||
| Total expenses |
96,553 | 52,126 | 78,696 | 36,012 | 35,933 | 12,341 | 10,221 | 6,469 | ||||||||||||||||||||||||||
| Income (loss) from operations |
73,728 | (98 | ) | (15,644 | ) | (11,758 | ) | (13,139 | ) | 7,552 | (703 | ) | 888 | |||||||||||||||||||||
| Other income (expense): |
||||||||||||||||||||||||||||||||||
| Interest income |
15 | 6 | 9 | 6 | 7 | 12 | 34 | 20 | ||||||||||||||||||||||||||
| Interest expense - net of amounts capitalized |
(735 | ) | — | — | — | — | (854 | ) | (1,100 | ) | (334 | ) | ||||||||||||||||||||||
|
|
|
|
|
|
|
|
|
|
|
|
|
|
|
|
|
|||||||||||||||||||
| Net income (loss) |
$ | 73,008 | $ | (92 | ) | $ | (15,635 | ) | $ | (11,752 | ) | $ | (13,132 | ) | $ | 6,710 | $ | (1,769 | ) | $ | 574 | |||||||||||||
|
|
|
|
|
|
|
|
|
|
|
|
|
|
|
|
|
|||||||||||||||||||
41
Table of Contents
Index to Financial Statements
| Successor | Predecessor | |||||||||||||||||||||||||
| As of September 30, |
As of December 31, |
Period from August 30 to December 31, 2008 |
As of December 31, |
|||||||||||||||||||||||
| 2011 | 2010 | 2009 | 2007 | 2006 | ||||||||||||||||||||||
| (in thousands) | (unaudited) |
|||||||||||||||||||||||||
| Balance sheet data: |
||||||||||||||||||||||||||
| Cash and cash equivalents |
$ | 10,220 | $ | 11,917 | $ | 4,353 | $ | 3,214 | $ | 1,000 | $ | 1,006 | ||||||||||||||
| Net property and equipment |
518,708 | 397,126 | 271,726 | 209,939 | 30,640 | 17,781 | ||||||||||||||||||||
| Total assets |
565,751 | 427,004 | 284,034 | 222,074 | 35,447 | 21,447 | ||||||||||||||||||||
| Long-term debt |
198,600 | 89,600 | 29,800 | 21,800 | 20,100 | 11,600 | ||||||||||||||||||||
| Total members’/stockholders’ equity |
277,922 | 255,879 | 235,334 | 192,006 | 2,510 | 4,569 | ||||||||||||||||||||
| Successor | Predecessor | |||||||||||||||||||||||||||||||||
| Nine Months Ended September 30, |
Year Ended December 31, |
Period from August 30 to December 31, 2008 |
Period from January 1 to August 29, 2008 |
Year Ended December 31, |
||||||||||||||||||||||||||||||
| 2011 | 2010 | 2010 | 2009 | 2007 | 2006 | |||||||||||||||||||||||||||||
| (unaudited) | (in thousands) | (unaudited) |
||||||||||||||||||||||||||||||||
| Other financial data: |
||||||||||||||||||||||||||||||||||
| Net cash provided by operating activities |
$ | 103,311 | $ | 35,795 | $ | 50,768 | $ | 10,595 | $ | 3,670 | $ | 10,046 | $ | 7,429 | $ | 5,663 | ||||||||||||||||||
| Net cash used in investing activities |
(162,739 | ) | (94,274 | ) | (139,618 | ) | (75,215 | ) | (5,451 | ) | (9,480 | ) | (15,709 | ) | (16,089 | ) | ||||||||||||||||||
| Net cash provided by financing activities |
57,731 | 65,076 | 96,414 | 65,759 | 4,995 | 1,792 | 8,275 | 10,680 | ||||||||||||||||||||||||||
42
Table of Contents
Index to Financial Statements
MANAGEMENT’S DISCUSSION AND ANALYSIS OF
FINANCIAL CONDITION AND RESULTS OF OPERATIONS
The following discussion and analysis of our financial condition and results of operations should be read in conjunction with our consolidated financial statements and related notes appearing elsewhere in this prospectus. The following discussion contains “forward-looking statements” that are based on management’s current expectations, estimates and projections about our business and operations, and involves risks and uncertainties. Our actual results may differ materially from those currently anticipated and expressed in such forward-looking statements as a result of a number of factors, including those we discuss under “Risk Factors,” “Cautionary Note Regarding Forward-Looking Statements” and elsewhere in this prospectus.
Overview
We are an independent exploration and production company focused on the development of oil-prone resources in the Upper Gulf Coast Tertiary trend onshore in central Louisiana. Our current acreage positions and evaluation efforts are concentrated in the Wilcox interval of the trend. We are currently focused on the development of our significant inventory of identified drilling locations, to which we will selectively allocate capital by applying rigorous investment analysis in an effort to maximize our potential returns. We are focused on maximizing the net present value of our drilling opportunities by measuring risk and financial return, among other factors. In addition, we are the operator of the substantial majority of our properties, which enables us to better control timing, costs and drilling and completion techniques. As of September 30, 2011, our properties consisted of approximately 86 gross active producing wells, 94% of which we operate, and in which we held an average working interest of approximately 99% across our 64,700 net acre leasehold.
As of September 30, 2011, our estimated net proved reserves were 24.3 MMBoe, of which 74% was oil or NGLs and 47% was proved developed. During September 2011, our properties had aggregate average net daily production of approximately 8,033 Boe per day.
All of our growth has been driven through the development of our leasehold acreage. We initiated operations in 1993 in our North Cowards Gully project area and slowly aggregated leasehold acreage in that project area and others over the next eighteen years. In August 2008, First Reserve acquired a majority interest in us and, along with members of our senior management, provided a significant amount of growth capital to expand our exploration and development program. As a result of this increase in capital available for our operations, we have increased our average daily production at a compound annual growth rate of 99% from 1,024 Boe/d in the month ended September 30, 2008 to 8,033 Boe/d in the month ended September 30, 2011. Our current activities are focused on evaluating and developing our asset base, optimizing our acreage position, and identifying potential expansion areas across the trend.
Our revenue, profitability and future growth rate depend substantially on factors beyond our control, such as economic, political and regulatory developments, as well as competition from other sources of energy. Oil and natural gas prices historically have been volatile and may fluctuate widely in the future. Sustained periods of low prices for oil or natural gas could materially and adversely affect our financial position, our results of operations, the quantities of oil and natural gas reserves that we can economically produce and our access to capital.
Basis of Presentation
On August 29, 2008, First Reserve purchased an approximate 72% interest in Midstates Petroleum Holdings LLC (the “FR Investment”). For financial reporting purposes, the FR Investment was accounted for as a purchase and resulted in a new basis of accounting reflecting estimated fair values for 100% of our assets and liabilities that were recorded at their estimated fair value as of the
43
Table of Contents
Index to Financial Statements
closing date, based on the purchase price paid in the transaction. Accordingly, the financial statements for the period subsequent to August 29, 2008, are presented on Midstates Petroleum Holdings LLC’s new basis of accounting giving effect to the transaction, while the financial statements for the period ended August 29, 2008, reflect the historical results of Midstates Petroleum Corporation, our accounting predecessor, prior to the FR Investment. Including its initial investment in August 2008, First Reserve has acquired an approximate 77% aggregate equity interest in Midstates Petroleum Holdings LLC.
Sources of Our Revenues
Oil, natural gas and natural gas liquids. Our revenues are derived from the sale of oil and natural gas production, as well as the sale of NGLs that are extracted from our high Btu content natural gas. Our oil and gas revenues do not include the effects of derivatives, and may vary significantly from period to period as a result of changes in production volumes or commodity prices.
Realized and unrealized gain (loss) on commodity derivative financial instruments. We utilize commodity derivatives to reduce our exposure to fluctuations in the prices of oil. In addition, we utilize derivatives to help mitigate our exposure to fluctuations in Louisiana Light Sweet (“LLS”) oil prices as compared to West Texas Intermediate (“NYMEX WTI”) benchmark oil prices. Accordingly, our income statements reflect (i) the recognition of unrealized gains and losses associated with our open derivative contracts as commodity prices change and commodity derivatives contracts expire or new ones are entered into, and (ii) our realized gains or losses on the settlement of these commodity derivative instruments. Unrealized gains and losses result from changes in market valuations of derivatives as future commodity price expectations change compared to the contract prices on the derivatives. If the expected future commodity prices increase compared to the contract prices on the derivatives, unrealized losses are recognized. Conversely, if the expected future commodity prices decrease compared to the contract prices on the derivatives, unrealized gains are recognized. Since we have decided not to apply hedge accounting to our derivatives, we reflect the unrealized and realized gains and losses in our current income statement periods based on the mark-to-market value at the end of each month. Cash flows associated with derivative financial instruments are reflected in cash flow from operations in our consolidated statement of cash flows.
Commodity prices. Our revenues are heavily influenced by commodity prices, which are subject to wide fluctuations in response to changes in supply and demand. For a description of factors that may impact future commodity prices, please read “Risk Factors — Risks Related to the Oil and Natural Gas Industry and Our Business.”
The table below sets forth the prices we received per unit of volume for our oil, natural gas, and NGLs, both including and excluding the effects of our commodity derivative contracts.
| Successor | Predecessor | |||||||||||||||||||||||||
| Nine Months Ended September 30, |
Year Ended December 31, |
August 30
to December 31, 2008 |
January 1
to August 29, 2008 |
|||||||||||||||||||||||
| 2011 | 2010 | 2010 | 2009 | |||||||||||||||||||||||
| (unaudited) | ||||||||||||||||||||||||||
| Average sales prices: |
||||||||||||||||||||||||||
| Oil, without realized derivatives ($/Bbl) |
$ | 108.08 | $ | 77.57 | $ | 80.29 | $ | 55.07 | $ | 75.68 | $ | 118.95 | ||||||||||||||
| Natural gas liquids, without realized derivatives ($/Bbl) |
48.02 | 40.42 | 36.92 | 47.66 | — | — | ||||||||||||||||||||
| Natural gas, without realized derivatives ($/Mcf) |
4.70 | 5.23 | 4.66 | 3.89 | 7.72 | 11.48 | ||||||||||||||||||||
| Oil, with realized derivatives ($/Bbl) |
97.39 | 78.01 | 79.37 | 57.69 | 79.78 | 105.15 | ||||||||||||||||||||
44
Table of Contents
Index to Financial Statements
In general, differentials are adjustments to the benchmark price for oil based on grade and location of the sales point. All of our oil is sold at the market price for LLS, which has recently traded at a significant premium to NYMEX WTI prices. Our oil production benefits from higher pricing differentials relative to many other oil producers in other areas of North America. Moreover, these pricing differentials have been increasing in recent months. For example, for the three months ended September 30, 2011, the average realized price before the effect of commodity derivative contracts for our oil production was $107.56 per Bbl, compared to an average NYMEX WTI settlement price of $89.54 per Bbl for the same time period. In addition, our gas production benefits from relatively rich Btu content. As a result of natural gas processing we benefit from an overall higher realized pricing relative to the Henry Hub benchmark. For example, for the three months ended September 30, 2011, the average realized price for our gas production was $4.70 per Mcf, compared to an average Henry Hub settlement price of $4.13 per MMBtu for the same period.
Other revenue. Other revenue consists of income derived from the recovery of administrative overhead, gas compression charges, saltwater disposal fees and other miscellaneous items from third parties for their share of costs on company owned assets.
Our Expenses
Lease operating expenses. These are daily costs incurred to bring oil and gas out of the ground and to the market, together with the daily costs incurred to maintain our producing properties. Such costs also include natural gas transportation and treating expenses, as well as maintenance and repair expenses related to our oil and gas properties. Lease operating expenses include both a portion of costs that are fixed in nature, such as infrastructure costs, as well as variable costs resulting from additional wells and production. As production increases, our average lease operating expense per barrel of oil equivalent is typically reduced because fixed costs do not increase proportionately with production. Ad valorem taxes are property taxes assessed based on the value of property and are also included in our lease operating expenses.
Workover expense. Workover expense includes major remedial operations on a completed well to restore, maintain, or improve a well’s production and is closely correlated to the levels of workover activity. Because workover projects are pursued on an as needed basis and are not regularly scheduled, workover expense is not necessarily comparable from period to period.
Severance taxes. Severance taxes are paid on produced oil and gas based on a percentage of revenues from products sold at market prices or at fixed rates established by federal, state, or local taxing authorities. We attempt to take full advantage of all credits and exemptions in our various taxing jurisdictions. In general, the severance taxes we pay correlate to the changes in oil and gas revenues.
Depreciation, depletion and amortization. Under the full cost accounting method, we capitalize costs within a cost center and systematically expense those costs on a unit of production basis based on proved oil and natural gas reserve quantities. We calculate depletion on the following types of costs: (i) all capitalized costs, other than the cost of investments in unproved properties for which proved reserves have not yet been assigned, less accumulated amortization; (ii) estimated future expenditures to be incurred in developing proved reserves; and (iii) estimated dismantlement and abandonment costs.
Impairment of oil and gas properties/Ceiling test. Under the existing full-cost method of accounting, a ceiling test is performed at least annually. The test establishes a limit (ceiling) on the book value of oil and gas properties. The capitalized costs of proved oil and gas properties, net of accumulated depreciation, depletion and amortization (DD&A) and the related deferred income taxes, may not exceed this “ceiling.” The ceiling limitation is the estimated after-tax future net cash flows from
45
Table of Contents
Index to Financial Statements
proved oil and gas reserves, discounted at 10%, excluding future cash outflows associated with settling asset retirement obligations accrued on the balance sheet. If capitalized costs exceed this ceiling, the excess is charged to expense and reflected as additional DD&A.
General and administrative expense. General and administrative expense consists of overhead, including payroll and benefits for our corporate staff, non-cash charges for stock-based compensation, costs of maintaining our headquarters, franchise taxes, audit and other professional fees and legal compliance. General and administrative expenses related to being a publicly traded company will include: Exchange Act reporting expenses; expenses associated with Sarbanes-Oxley compliance; expenses associated with listing on the NYSE; legal fees, investor relations expenses, registrar and transfer agent fees, director and officer liability insurance costs; and director compensation. As a publicly-traded company at the closing of this offering, we expect that our general and administrative expenses will increase.
Certain of our employees hold units in Midstates Incentive Holdings LLC that entitle the holders to a portion of the proceeds to be received by First Reserve upon sales of our common stock by MPCI. While these proceeds will not involve any cash payment by us, we will recognize a non-cash compensation expense, which may be material, in the period such payment is made. In addition, certain of our employees hold shares of restricted stock in Midstates Petroleum Holdings, Inc. Upon the vesting of such shares of restricted stock, we will recognize a non-cash compensation expense, which may be material.
Interest expense. We finance a portion of our working capital requirements and capital expenditures with borrowings under our revolving credit facility. As a result, we incur interest expense that is affected by both fluctuations in interest rates and our financing decisions. We reflect interest paid to the lenders under our revolving credit facility in interest expense.
We capitalize a portion of our interest costs on unproved properties. Capitalized interest is depreciated over the useful life of assets in the same manner as the depreciation of the underlying assets.
Income Taxes. Midstates Petroleum Holdings LLC has historically not been subject to U.S. federal and certain state income taxes. After consummation of this offering, Midstates Petroleum Company, Inc. will become subject to U.S. federal, state, local and foreign income taxes and taxed at the prevailing corporate tax rates.
46
Table of Contents
Index to Financial Statements
Results of Operations
The following table summarizes our revenues and production data for the period indicated.
| Successor | Predecessor | |||||||||||||||||||||||||
| Nine Months Ended September 30, |
Year Ended December 31, |
Period from August 30 to December 31, 2008 |
Period from January 1 to August 29, 2008 |
|||||||||||||||||||||||
| 2011 | 2010 | 2010 | 2009 | |||||||||||||||||||||||
| (unaudited) | (in thousands) | |||||||||||||||||||||||||
| Revenues: |
||||||||||||||||||||||||||
| Oil |
$ | 122,817 | $ | 50,592 | $ | 75,875 | $ | 27,347 | $ | 7,836 | $ | 25,956 | ||||||||||||||
| Natural gas |
14,813 | 7,564 | 10,505 | 2,683 | 853 | 1,502 | ||||||||||||||||||||
| Natural gas liquids |
9,949 | 140 | 2,731 | 103 | — | — | ||||||||||||||||||||
| Gains (losses) on commodity derivative contracts - net |
22,442 | (6,453 | ) | (26,268 | ) | (5,987 | ) | 14,062 | (7,678 | ) | ||||||||||||||||
| Other |
260 | 185 | 209 | 108 | 43 | 113 | ||||||||||||||||||||
|
|
|
|
|
|
|
|
|
|
|
|
|
|||||||||||||||
| Total revenues |
$ | 170,281 | $ | 52,028 | $ | 63,052 | $ | 24,254 | $ | 22,794 | $ | 19,893 | ||||||||||||||
|
|
|
|
|
|
|
|
|
|
|
|
|
|||||||||||||||
| Operating Expenses: |
||||||||||||||||||||||||||
| Lease operating |
$ | 9,451 | $ | 5,225 | $ | 8,733 | $ | 5,312 | $ | 1,542 | $ | 2,769 | ||||||||||||||
| Workover |
1,301 | 3,856 | 4,683 | 5,226 | 2,376 | 2,206 | ||||||||||||||||||||
| Severance taxes |
8,437 | 4,193 | 6,431 | 2,849 | 805 | 2,354 | ||||||||||||||||||||
| Asset retirement accretion |
205 | 108 | 175 | 120 | 37 | 79 | ||||||||||||||||||||
| General and administrative |
15,519 | 11,820 | 16,847 | 5,886 | 1,402 | 1,816 | ||||||||||||||||||||
| Depreciation, depletion and amortization |
61,640 | 26,924 | 41,827 | 12,322 | 2,995 | 3,117 | ||||||||||||||||||||
| Impairment in the carrying value of oil and gas properties |
— | — | — | 4,297 | 26,776 | — | ||||||||||||||||||||
|
|
|
|
|
|
|
|
|
|
|
|
|
|||||||||||||||
| Total expenses |
$ | 96,553 | $ | 52,126 | $ | 78,696 | $ | 36,012 | $ | 35,933 | $ | 12,341 | ||||||||||||||
|
|
|
|
|
|
|
|
|
|
|
|
|
|||||||||||||||
| Other Income (Expense): |
||||||||||||||||||||||||||
| Interest income |
15 | 6 | 9 | 6 | 7 | 12 | ||||||||||||||||||||
| Interest expense - net of amounts capitalized |
(735 | ) | — | — | — | — | (854 | ) | ||||||||||||||||||
|
|
|
|
|
|
|
|
|
|
|
|
|
|
||||||||||||||
| Net income (loss) |
$ | 73,008 | $ | (92 | ) | $ | (15,635 | ) | $ | (11,752 | ) | $ | (13,132 | ) | $ | 6,710 | ||||||||||
|
|
|
|
|
|
|
|
|
|
|
|
|
|
||||||||||||||
| Production data: |
||||||||||||||||||||||||||
| Oil (MBbls) |
1,136 | 652 | 945 | 497 | 104 | 218 | ||||||||||||||||||||
| Natural gas (Mcf) |
3,154 | 1,446 | 2,253 | 690 | 110 | 131 | ||||||||||||||||||||
| Natural gas liquids (MBbls) |
207 | 4 | 74 | 2 | — | — | ||||||||||||||||||||
| Oil equivalents (Boe) |
1,869 | 897 | 1,394 | 614 | 122 | 240 | ||||||||||||||||||||
| Average daily production (Boe/d) |
6,847 | 3,285 | 3,820 | 1,682 | 984 | 996 | ||||||||||||||||||||
| Average sales prices: |
||||||||||||||||||||||||||
| Oil, without realized derivatives (per Bbl) |
$ | 108.08 | $ | 77.57 | $ | 80.29 | $ | 55.07 | $ | 75.68 | $ | 118.95 | ||||||||||||||
| Oil, with realized derivatives (per Bbl) |
97.39 | 78.01 | 79.37 | 57.69 | 79.78 | 105.15 | ||||||||||||||||||||
| Natural gas (per Mcf) |
4.70 | 5.23 | 4.66 | 3.89 | 7.72 | 11.48 | ||||||||||||||||||||
| Natural gas liquids (per Bbl) |
48.02 | 40.42 | 36.92 | 47.66 | — | — | ||||||||||||||||||||
47
Table of Contents
Index to Financial Statements
Nine Months Ended September 30, 2011 as Compared to the Nine Months Ended September 30, 2010
Oil, natural gas and natural gas liquids revenues. Our oil, natural gas and NGLs sales revenues increased by $89.3 million, or 153%, to $147.6 million during the nine months ended September 30, 2011 as compared to $58.3 million for the nine months ended September 30, 2010. Our revenues are a function of oil, natural gas, and NGLs production volumes sold and average sales prices received for those volumes. Average daily production sold increased by 3,562 Boe per day, or 108%, to 6,847 Boe per day during the nine months ended September 30, 2011 as compared to the nine months ended September 30, 2010. The increase in average daily production sold was primarily due to increased drilling activity as compared to the prior year period. Average oil sales prices, without realized derivatives, increased by $30.51 per barrel, or 39%, to $108.08 per barrel for the nine months ended September 30, 2011 as compared to $77.57 per barrel for the nine months ended September 30, 2010.
Gains (losses) on commodity derivative contracts — net. Our mark-to-market (“MTM”) derivative positions moved from an unrealized loss of $6.7 million as of September 30, 2010 to a gain of $34.6 million as of September 30, 2011. The MTM change results from our average hedge volumes and prices being higher on September 30, 2011 compared to the positions on September 30, 2010. The NYMEX WTI closing price on September 30, 2011 was $79.20 while the same price for September 30, 2010 was $79.97. The realized loss on derivatives for the nine months ended September 30, 2011 was $12.1 million compared to a realized gain of $0.3 million for the nine months ended September 30, 2010. The loss for the nine months ended September 30, 2011 was a result of realized oil prices rising substantially for the year versus the prices at which we had oil production hedged for the period. Realized oil sales prices averaged $108.08 for the nine months ended September 30, 2011 compared with $77.57 for the nine months ended September 30, 2010.
Expenses.
Lease operating expenses. Lease operating expenses increased $4.2 million, or 81%, to $9.5 million for the nine months ended September 30, 2011 compared to $5.2 million for the nine months ended September 30, 2010. This increase was primarily due to the higher number of producing wells in operation. Lease operating expenses decreased to $5.06 per Boe at September 30, 2011 from $5.83 per Boe at September 30, 2010, a decrease of 13%. This decrease was primarily a result of the 108% increase in production volumes from the nine months ended September 30, 2010 to the nine months ended September 30, 2011 without a commensurate increase in fixed costs.
Workover expenses. Workover expenses decreased $2.6 million, or 66%, to $1.3 million for the nine months ended September 30, 2011 compared to $3.9 million for the nine months ended September 30, 2010. Workover expenses decreased to $0.70 per Boe at September 30, 2011 from $4.30 per Boe at September 30, 2010, a decrease of 84%. This decrease in workover costs per Boe was a result of both lower workover activity in the period ended September 30, 2011 and the previously described substantial growth in production volumes between the two periods.
Severance taxes. Severance taxes increased $4.2 million, or 99%, to $8.4 million for the nine months ended September 30, 2011 compared to $4.2 million for the nine months ended September 30, 2010 primarily due to an increase in production during the same periods. Our severance taxes for the nine months ended September 30, 2011 and 2010 were 5.7% and 7.2%, respectively, as a percentage of oil, natural gas and NGLs sales. The severance tax rate for the nine months ended September 30, 2011 was lower than the severance tax rate for the nine months ended September 30, 2010 due to an increase in production on wells qualifying for severance tax exemptions.
48
Table of Contents
Index to Financial Statements
Depreciation, depletion and amortization (DD&A). Depreciation, depletion and amortization expense increased $34.7 million, or 131%, to $61.6 million for the nine months ended September 30, 2011 compared to $26.9 million for the nine months ended September 30, 2010. The increase in DD&A expense for the nine months ended September 30, 2011 was primarily due to the higher capital expenditures related to increased drilling and completion activities. The DD&A rate for the nine months ended September 30, 2011 was $32.98 per Boe compared to $30.03 per Boe for the nine months ended September 30, 2010. This increase in the DD&A rate was due to an increase in capital expenditures without proportional associated proved reserve additions being booked within the period.
General and administrative. Our general and administrative expenses increased to $15.5 million for the nine months ended September 30, 2011 from $11.8 million for the nine months ended September 30, 2010. The increase in general and administrative expenses of $3.7 million, or 31%, was primarily due to growth in the number of our employees and the expenses related to stock-based compensation, which included a $1.8 million non-cash charge for stock-based compensation for the nine months ended September 30, 2011, compared to a $1.1 million non-cash charge for the nine months ended September 30, 2010. As of September 30, 2011, we had 51 full-time employees compared to 41 employees as of September 30, 2010.
Interest expense. Interest costs for the nine months ended September 30, 2011 and September 30, 2010 were $2.7 million and $1.0 million, respectively. The increase in interest cost is primarily a result of the increase in outstanding balances under our revolving credit facility. Of the total interest costs, $2.0 million and $1.0 million were capitalized and $0.7 million and no interest costs were expensed for the nine months ended September 30, 2011 and 2010, respectively.
Year Ended December 31, 2010 as Compared to the Year Ended December 31, 2009
Oil, natural gas and natural gas liquids revenues. Our oil, natural gas and NGLs sales revenues increased by $59 million, or 196%, to $89.1 million during the year ended December 31, 2010 as compared to $30.1 million for the year ended December 31, 2009. Average daily production sold increased by 2,139 Boe per day, or 127%, to 3,820 Boe per day during the year ended December 31, 2010 as compared to the year ended December 31, 2009. The increase in average daily production sold was primarily due to the increased drilling activity in 2010 versus 2009. Average oil sales prices, without realized derivatives, increased by $25.22 per barrel or 46% to $80.29 per barrel for the year ended December 31, 2010 as compared to $55.07 per barrel the year ended December 31, 2009.
Gains (losses) on commodity derivative contracts — net. Our MTM derivative unrealized loss increased from $7.3 million as of December 31, 2009 to an unrealized loss of $25.4 million as of December 31, 2010. The MTM change results from the increase in NYMEX WTI prices between these two dates and the open volume hedge positions at the end of each period at prices lower than NYMEX WTI. The NYMEX WTI closing price on December 31, 2010 was $91.38 while the same price for December 31, 2009 was $79.36. The realized loss on derivatives for the year ended December 31, 2010 was $0.9 million compared to a realized gain of $1.3 million for the year ended December 31, 2009. The loss for the year ended December 31, 2010 was a result of realized oil prices rising substantially for the year versus the prices at which we had oil production hedged for the period. Realized oil sales prices averaged $80.29 for the year ended December 31, 2010 compared with $55.07 for the year ended December 31, 2009.
49
Table of Contents
Index to Financial Statements
Expenses.
Lease operating expenses. Lease operating expenses increased $3.4 million, or 64%, to $8.7 million for the year ended December 31, 2010 compared to $5.3 million for the year ended December 31, 2009. This increase was primarily due to the increase in our number of operating wells during 2010 versus 2009. Lease operating expenses decreased to $6.26 per Boe at December 31, 2010 from $8.66 per Boe at December 31, 2009, a decrease of 28%. This decrease was primarily a result of the 127% increase in production volumes from the year ended December 31, 2009 to the year ended December 31, 2010.
Workover expenses. Workover expenses decreased $0.5 million, or 10%, to $4.7 million for the year ended December 31, 2010 compared to $5.2 million for the year ended December 31, 2009. This decrease was primarily due to fewer workovers on our active wells and better cost control. Workover expenses decreased to $3.36 per Boe at December 31, 2010 from $8.51 per Boe at December 31, 2009, a decrease of 61%. This decrease was primarily a result of the 127% increase in production volumes from the year ended December 31, 2009 to the year ended December 31, 2010.
Severance taxes. Severance taxes increased $3.5 million, or 125%, to $6.4 million for the year ended December 31, 2010 compared to $2.8 million for the year ended December 31, 2009 primarily due to an increase in production during the same periods. Our severance taxes for the year ended December 31, 2010 and 2009 were 7.2% and 9.5%, respectively, as a percentage of oil, natural gas and NGLs revenues. The severance tax rate for the year ended December 31, 2010 was lower than the severance tax rate for the year ended December 31, 2009 due to an increase in production on wells qualifying for severance tax exemptions.
Depreciation, depletion and amortization (DD&A). Depreciation, depletion and amortization expense increased $29.5 million, or 239%, to $41.8 million for the year ended December 31, 2010 compared to the year ended December 31, 2009. The increase in DD&A expense for the year ended December 31, 2010 was primarily due to both increased production volumes and an increase in the DD&A rate. The DD&A rate for the year ended December 31, 2010 was $30.00 per Boe compared to $20.08 per Boe for the year ended December 31, 2009. This increase in the DD&A rate was due to an increase in capital expenditures without proportional associated proved reserve additions being booked within the period.
Impairment of oil and gas properties/Ceiling test. During the year ended December 31, 2010, we did not record a non-cash impairment charge. For the year ended December 31, 2009, we recorded non-cash impairment charges of $4.3 million as a result of net capitalized costs exceeding the ceiling limit calculated from the reserves data. In determining the amount of the non-cash impairment charges for such periods, we considered the application of the factors described under “— Critical Accounting Policies and Estimates — Impairment of oil and gas properties/Ceiling test.”
General and administrative. Our general and administrative expenses increased to $16.8 million for the year ended December 31, 2010 from $5.9 million for the year ended December 31, 2009, resulting in a change of $10.9 million, or 186%. In the year ended December 31, 2010, we incurred employee bonuses of approximately $4.9 million. In addition, our general and administrative expenses included a $1.5 million non-cash charge for stock-based compensation expense for the year ended December 31, 2010, compared to a $0.2 million non-cash charge for the year ended December 31, 2009. The increase in general and administrative expenses was primarily due the employee bonuses, the addition of a significant number of employees to support our growth and the expenses related to stock-based compensation.
50
Table of Contents
Index to Financial Statements
Interest expense. Interest costs for the years ended December 31, 2010 and 2009 were $1.7 million and $0.8 million, respectively. The increase in interest cost is primarily a result of the increase in outstanding balances under our revolving credit facility. Of the total interest cost, all of the $1.7 million and $0.8 million were capitalized for the years ended December 31, 2010 and 2009.
Year Ended December 31, 2009 as Compared to the Period of August 30 to December 31, 2008
As a result of the August 2008 Reorganization, our discussion and analysis of our historical financial condition and results of operations for the year ended December 31, 2009 may not necessarily by comparable to the period of August 30 to December 31, 2008. See “— Basis of Presentation.”
Oil, natural gas and natural gas liquids revenues. Our oil, natural gas and NGLs sales revenues increased by $21.4 million, or 247%, to $30.1 million during the year ended December 31, 2009 as compared to $8.7 million for the period of August 30 to December 31, 2008. Average daily production sold increased by 698 Boe per day or 71% to 1,682 Boe per day during the year ended December 31, 2009 as compared to the period of August 30 to December 31, 2008. The increase in average daily production sold was primarily due to increased drilling activity in 2009. Average oil sales prices, without realized derivatives, decreased by $20.61 per barrel or 27% to an average of $55.07 per barrel for the year ended December 31, 2009 as compared to the period of August 30 to December 31, 2008.
Gains (losses) on commodity derivative contracts — net. Our MTM derivative unrealized position moved from a gain of $13.6 million as of December 31, 2008 to an unrealized loss of $7.3 million as of December 31, 2009. The MTM change results from the lower average hedge prices that were in place for the 2009 fiscal year as compared to the average hedge prices that were in place for the period of August 30, 2008 to December 31, 2008. As prices rose between the periods on our hedge positions, the MTM resulted in higher unrealized losses. The NYMEX WTI closing price on December 31, 2009 was $79.36 while the same price for December 31, 2008 was $44.60. The realized gain on derivatives for the year ended December 31, 2009 was $1.3 million compared to a realized gain of $0.4 million for the period of August 30 to December 31, 2008. The gains in each period were a result of the relative market price in each period compared to the average hedge price for the same period. The change in these pricing relationships between the two periods resulted in higher gains for the year ended December 31, 2009 as compared to the period from August 30 to December 31, 2008. Realized oil sales prices averaged $55.07 for the year ended December 31, 2009 compared with $75.68 for the period of August 30 to December 31, 2008.
Expenses.
Lease operating expenses. Lease operating expenses increased $3.8 million to $5.3 million for the year ended December 31, 2009 compared to $1.5 million for the period of August 30 to December 31, 2008. This increase was primarily due to having a full year of costs in 2009 versus a partial year in 2008. The relative barrel per day increase in production volumes from the period of August 30 to December 31, 2008 to the year ended December 31, 2009 resulted in a 30% decrease in unit operating costs to $8.66 per Boe.
Workover expenses. Workover expenses increased $2.9 million to $5.2 million for the year ended December 31, 2009 compared to $2.4 million for the period of August 30 to December 31, 2008. This increase was primarily due to having a full year of expenditures in 2009 versus a partial year in 2008. The relative barrel per day increase in production volumes from the period of August 30 to December 31, 2008 to the year ended December 31, 2009 resulted in a 56% decrease in unit operating costs to $8.51 per Boe.
51
Table of Contents
Index to Financial Statements
Severance taxes. Severance taxes increased $2.0 million, or 254%, for the year ended December 31, 2009 to $2.8 million compared to $0.8 million for the period of August 30, 2008 to December 31, 2008 primarily due to an increase in production. Our severance taxes for the year ended December 31, 2009 and the period of August 30 to December 31, 2008 were 9.5% and 9.3%, respectively, as a percentage of oil, natural gas, and NGLs revenues. The severance tax rate for the year ended December 31, 2009 was slightly higher than the severance tax rate for the period of August 30 to December 31, 2008 due to a decrease in production on wells qualifying for severance tax exemptions.
Depreciation, depletion and amortization (DD&A). Depreciation, depletion and amortization expense (excluding asset impairments) increased $9.3 million for the year ended December 31, 2009 compared to $3.0 million for the period of August 30 to December 31, 2008. The increase in DD&A expense for the year ended December 31, 2009 was primarily due to having a full year of expenses versus the partial period in 2008. The DD&A rate for the year ended December 31, 2009 was $20.08 per Boe compared to $24.56 per Boe for the period of August 30 to December 31, 2008. This decrease in the DD&A rate was due to an increase in associated proved reserve additions being booked within the period in proportion to the capital expenditures in the same period.
Impairment of oil and gas properties/Ceiling test. During the year ended December 31, 2009 and the period of August 30 to December 31, 2008, we recorded non-cash impairment charges of $4.3 million and $26.8 million, respectively, as a result of a decline in oil prices and larger capital expenditures without significant increases in reserves post the step-up in value that occurred during 2008. In determining the amount of the non-cash impairment charges for such periods, we considered the application of the factors described under “— Critical Accounting Policies and Estimates — Impairment of oil and gas properties/Ceiling test.”
General and administrative. Our general and administrative expenses increased to $5.9 million for the year ended December 31, 2009 from $1.4 million for the period of August 30 to December 31, 2008. The increase in general and administrative expenses of $4.5 million was primarily due to having a full year of expenses in 2009 versus a partial period in 2008 as well as growth in the number of our employees. As of December 31, 2009, we had 25 full-time employees compared to 18 employees as of December 31, 2008.
Interest expense. Interest costs for the year ended December 31, 2009 and the period of August 30 to December 31, 2008 were $0.8 million and $0.3 million, respectively. The increase in interest cost is primarily a result of the increase in the outstanding balances under our revolving credit facility and a full year of cost in 2009 versus a partial period in 2008. Of the total interest costs, all of the $0.8 million and $0.3 million were capitalized in the year ended December 31, 2009 and the period of August 30 to December 31, 2008, respectively.
Liquidity and Capital Resources
Giving effect to the completion of this offering, our liquidity as of September 30, 2011 would have been $ million, consisting of $ million available under our revolving credit facility and $ million in cash and cash equivalents. Our primary sources of liquidity to date have been equity provided by First Reserve and our management team, borrowings under our revolving credit facility and cash flows from operations. Our primary use of capital has been the acquisition, development and exploration of oil and natural gas properties. We continually monitor potential capital sources, including equity and debt capital markets, in order to meet our planned capital expenditures and liquidity
52
Table of Contents
Index to Financial Statements
requirements. Our future success in growing proved reserves and production will be highly dependent on our ability to access outside sources of capital.
Our total 2011 capital expenditure budget is $275 million, which consists of:
| • | $234 million for drilling and completion capital; |
| • | $31 million for acquisition of acreage and seismic data; and |
| • | $10 million in unallocated funds which are available for facilities. |
Through September 30, 2011, approximately $179 million of our 2011 capital expenditure budget had been spent.
Our total 2012 capital expenditure budget is $353 million, which consists of:
| • | $293 million for drilling and completion capital; |
| • | $52 million for acquisition of acreage and seismic data; and |
| • | $8 million in unallocated funds which are available for facilities. |
While we have budgeted $353 million for these purposes, the ultimate amount of capital we will expend may fluctuate materially based on market conditions and the success of our drilling results as the year progresses. We believe the net proceeds from this offering together with cash flows from operations and additional borrowings under our revolving credit facility should be more than sufficient to fund our 2012 capital expenditure budget and a portion of our 2013 capital expenditure budget. However, because wells funded by our 2012 future drilling plan represent only a small percentage of our gross identified operated drilling locations, we will be required to generate or raise multiples of this amount of capital to develop our entire inventory of identified drilling locations should we elect to do so.
We expect that in the future our commodity derivative positions will help us stabilize a portion of our expected cash flows from operations despite potential declines in the price of oil and natural gas. Please see “Risk Factors — Risks Related to the Oil and Natural Gas Industry and Our Business — A substantial or extended decline in oil and, to a lesser extent, natural gas, prices may adversely affect our business, financial condition or results of operations and our ability to meet our capital expenditure obligations and financial commitments” and “— Quantitative and Qualitative Disclosures About Market Risk.”
We review leasehold acquisition opportunities on an ongoing basis. In addition, we may selectively pursue the acquisition of businesses that may be complimentary to ours. Our ability to make significant additional acquisitions for cash would require us to obtain additional equity or debt financing, which we may not be able to obtain on terms acceptable to us or at all.
53
Table of Contents
Index to Financial Statements
Our cash flows for the nine months ended September 30, 2011 and 2010 and the years ended December 31, 2010, 2009 and 2008 and are presented below:
| Successor | Predecessor | |||||||||||||||||||||||||
| Nine Months Ended September 30, |
Year Ended December 31, | Period from August 30 to December 31, 2008 |
Period from January 1 to August 29, 2008 |
|||||||||||||||||||||||
| 2011 | 2010 | 2010 | 2009 | |||||||||||||||||||||||
| (unaudited) | (in thousands) | |||||||||||||||||||||||||
| Net cash provided by operating activities |
$ | 103,311 | $ | 35,795 | $ | 50,768 | $ | 10,595 | $ | 3,670 | $ | 10,046 | ||||||||||||||
| Net cash used in investing activities |
(162,739 | ) | (94,274 | ) | (139,618 | ) | (75,215 | ) | (5,451 | ) | (9,480 | ) | ||||||||||||||
| Net cash provided by financing activities |
57,731 | 65,076 | 96,414 | 65,759 | 4,995 | 1,792 | ||||||||||||||||||||
|
|
|
|
|
|
|
|
|
|
|
|
|
|||||||||||||||
| Net change in cash |
$ | (1,697 | ) | $ | 6,597 | $ | 7,564 | $ | 1,139 | $ | 3,214 | $ | 2,358 | |||||||||||||
|
|
|
|
|
|
|
|
|
|
|
|
|
|||||||||||||||
Cash flows provided by operating activities
Net cash provided by operating activities was $103.3 million and $35.8 million for the nine months ended September 30, 2011 and 2010, respectively. The increase in cash flows from operations was primarily the result of an increase in oil and natural gas production period over period and the increase in realized oil price between the periods.
Net cash provided by operating activities was $50.8 million, $10.6 million, $3.7 million and $10.0 million for the years ended December 31, 2010 and 2009 and the periods August 30 to December 31, 2008 and January 1 to August 29, 2008, respectively. The increase in net cash provided by operating activities for the year ended December 31, 2010 compared to the year ended December 31, 2009 was primarily the result of an increase in oil, natural gas, and NGLs production as well as an increase in realized oil prices. Cash flows from operations during the year ended December 31, 2009 increased compared to period August 30 to December 31, 2008 primarily as a result of a full year of business activity compared to the partial period.
Our operating cash flows are sensitive to a number of variables, the most significant of which is the volatility of oil and gas prices. Regional and worldwide economic activity, weather, infrastructure capacity to reach markets and other variable factors significantly impact the prices of these commodities. These factors are beyond our control and are difficult to predict. For additional information on the impact of changing prices on our financial position, see “— Quantitative and Qualitative Disclosures About Market Risk” below.
Cash flows used in investing activities
We had cash flows used in investing activities of $162.7 million and $94.3 million during the nine months ended September 30, 2011 and 2010, respectively, as a result of our capital expenditures for drilling and development costs.
We had net cash used in investing activities of $139.6 million, $75.2 million, $5.5 million and $9.5 million during the years ended December 31, 2010 and 2009 and the periods August 30 to December 31, 2008 and January 1 to August 29, 2008, respectively, as a result of our capital expenditures for drilling, development and acquisition costs. The increase in net cash used in investing activities during the year ended December 31, 2010 compared to the year ended December 31, 2009 was attributable to continued expansion of our drilling programs and growth of our business. The
54
Table of Contents
Index to Financial Statements
increase in net cash used in investing activities for the year ended December 31, 2009 compared to the period August 30 to December 31, 2008 was attributable to a full year of business activity compared to the partial period for our accounting predecessor, the expansion of our drilling programs between the periods and the increased deployment of capital resulting from the FR Investment.
We expect our 2012 capital expenditure budget to be $353 million, which is a 28% increase over the $275 million budgeted for 2011. Expenditures for exploration and development of oil and natural gas properties are the primary use of our capital resources. Our capital budget may be adjusted as business conditions warrant. The amount, timing and allocation of capital expenditures is largely discretionary and within our control. If oil and natural gas prices decline or costs increase significantly, we could defer a significant portion of our budgeted capital expenditures until later periods to prioritize capital projects that we believe have the highest expected returns and potential to generate near-term cash flows. We routinely monitor and adjust our capital expenditures in response to changes in prices, availability of financing, drilling and acquisition costs, industry conditions, the timing of regulatory approvals, the availability of rigs, success or lack of success in drilling activities, contractual obligations, internally generated cash flows and other factors both within and outside our control.
Cash flows provided by financing activities
Net cash provided by financing activities was $57.7 million and $65.1 million for the nine months ended September 30, 2011 and 2010, respectively. For the nine months ended September 30, 2011 and 2010, cash sourced through financing activities was primarily provided by borrowings under our revolving credit facility. For the nine months ended September 30, 2010, cash sourced through financing activities was primarily provided by First Reserve and members of our management and borrowings under our revolving credit facility. Our long-term debt was $198.6 million and $76.8 million at September 30, 2011 and September 30, 2010, respectively.
Net cash provided by financing activities was $1.8 million, $5.0 million, $65.8 million and $96.4 million for the periods January 1 to August 29, 2008, August 30 to December 31, 2008, and the years ended December 31, 2009 and 2010, respectively. For these periods and years, cash sourced through financing activities was provided primarily by First Reserve and members of our management and borrowings under our revolving credit facility. Our long-term debt was $21.8 million, $29.8 million and $89.6 million at December 31, 2008, 2009 and 2010, respectively.
Reserve-based credit facility
As of September 30, 2011, we had a $300 million reserve-based revolving credit facility with a borrowing base of $225 million. The facility matures in December 2014. The borrowing base under our revolving credit facility will be subject to redetermination on a semi-annual basis, effective September 1 and March 1, beginning September 1, 2011, and up to one additional time per six month period following each scheduled borrowing base redetermination, as may be requested by either us or the administrative agent, acting at the direction of lenders holding at least two-thirds of the outstanding loans and other obligations. The borrowing base will be determined by the lenders in good faith and consistent with their usual and customary oil and gas lending criteria in existence at that particular time. Our revolving credit facility is available for general corporate purposes, including, without limitation, working capital for exploration and production operations. In addition, in the event we elect to issue senior unsecured notes, the borrowing base will reduce by 25% of the aggregate principal amount of such notes. Our obligations under our revolving credit facility are secured by substantially all of our assets. Our credit agreement is filed as an exhibit to the registration statement of which this prospectus is a part.
55
Table of Contents
Index to Financial Statements
As of September 30, 2011, we had $198.6 million outstanding under our revolving credit facility. In the nine month period ended September 30, 2011, the average amount outstanding under our revolving credit facility was $124.0 million. We anticipate that a portion of the net proceeds from this offering will be used to repay all of our borrowings outstanding as of the closing.
At our election, interest is generally determined by reference to:
| • | the London interbank offered rate, or LIBOR, plus an applicable margin between 2.00% and 2.75% per annum; or |
| • | the higher of (x) a domestic bank prime rate, (y) the federal funds rate plus 0.50% and (z) one-month LIBOR plus 1.00%, plus an applicable margin between 1.00% and 1.75% per annum. |
Interest is generally payable quarterly for domestic bank rate loans and on the last day of the applicable interest period for LIBOR loans, but not less frequently than quarterly.
Our revolving credit facility contains various covenants that limit our ability to:
| • | incur indebtedness; |
| • | grant certain liens; |
| • | make certain loans, advances and investments; |
| • | make dividends, distributions or redemptions; |
| • | merge or consolidate; |
| • | engage in certain asset dispositions, including a sale of all or substantially all of our assets; |
| • | enter into certain sale or leaseback arrangements; |
| • | enter into certain transactions with affiliates; |
| • | grant negative pledges or agree to restrict dividends or distributions from subsidiaries; |
| • | allow gas imbalances, take-or-pay or other prepayments with respect to oil and gas properties that would require us to deliver hydrocarbons in the future without then or thereafter receiving full payment therefor; or |
| • | enter into certain derivative arrangements. |
Our revolving credit facility also contains covenants that, among other things, require us to maintain specified ratios or conditions as follows:
| • | a current ratio, consisting of consolidated current assets, including the unused amount of the total commitments and any letters of credit issued for the benefit of the lenders, to consolidated current liabilities, of not less than 1.0 to 1.0, excluding non-cash derivative assets and liabilities, as of the last day of any fiscal quarter; and |
| • | a debt coverage ratio, consisting of consolidated debt minus all unrestricted cash and cash equivalents to EBITDA, of not more than 3.75 to 1.0 for the four quarters ended on the last day of each fiscal quarter. |
We believe that we are in compliance with the terms of our revolving credit facility. If an event of default exists under the credit agreement, the lenders will be able to accelerate the maturity of the credit agreement and exercise other rights and remedies. Each of the following will be an event of default:
| • | failure to pay any principal or interest due under the revolving credit facility or any amount of principal under any letter of credit when due or any fees or other amount within certain grace periods; |
56
Table of Contents
Index to Financial Statements
| • | a representation or warranty is proven to be incorrect in any material respect on or as of the date made or deemed made; |
| • | failure to perform or otherwise comply with the covenants in the credit agreement or other loan documents, subject, in certain instances, to certain grace periods; |
| • | default by us on the payment of any other indebtedness in excess of 5.0% of borrowing base currently in effect, or any other event occurs that permits or causes the acceleration of such indebtedness; |
| • | bankruptcy or insolvency events involving us or our subsidiaries; |
| • | the entry of one or more judgments, orders, decrees, or arbitration awards involving in the aggregate a liability as to any single or related series of transactions, incidents or conditions in excess of 5.0% of borrowing base currently in effect that remains unsatisfied, unvacated and unstayed pending appeal for a period of thirty days after the entry thereof; and |
| • | a change of control, as defined in the credit agreement. |
Commodity Derivative Contracts
Due to the inherent volatility in oil and gas prices, we use commodity derivative instruments, such as collars, swaps, puts, and basis differential swaps to hedge price risk associated with a significant portion of our anticipated oil and gas production. By removing a majority of the price volatility associated with future production, we expect to reduce, but not eliminate, the potential effects of variability in cash flow from operations due to fluctuations in commodity prices. We have not elected hedge accounting on these derivatives and, therefore, the unrealized gains and losses on open positions are reflected currently in earnings. At each period end, we estimate the fair value of our commodity derivatives and recognize an unrealized gain or loss. For a summary of our commodity derivative contracts as of September 30, 2011, please see “Quantitative and Qualitative Disclosures About Market Risk — Commodity price exposure.”
Obligations and Commitments
We have the following contractual obligations and commitments as of December 31, 2010 (in thousands):
| Payments due by period | ||||||||||||||||||||
| Total | Less than 1 year |
1 – 3 years | 3 – 5 years | More than 5 years |
||||||||||||||||
| Contractual Obligations |
||||||||||||||||||||
| Revolving credit facility (1) |
$ | 130,000 | $ | 0 | $ | 0 | $ | 130,000 | $ | 0 | ||||||||||
| Operating leases (2) |
1,181 | 352 | 829 | 0 | 0 | |||||||||||||||
| Asset retirement obligations (3) |
2,859 | 0 | 0 | 0 | 2,859 | |||||||||||||||
|
|
|
|
|
|
|
|
|
|
|
|||||||||||
| Total contractual cash obligations |
$ | 134,040 | $ | 352 | $ | 829 | $ | 130,000 | $ | 2,859 | ||||||||||
| (1) | Amount excludes interest on our revolving credit facility as both the amount borrowed and applicable interest rate is variable. As of November 14, 2011, we had $221.6 million of indebtedness outstanding under our revolving credit facility. See “Notes to Consolidated Financial Statements — Note 6 — Long-Term Debt.” |
| (2) | See “Notes to Consolidated Financial Statements — Note 10 — Commitments and Contingencies” for a description of lease obligations. |
| (3) | Amounts represent our estimate of future asset retirement obligations on an undiscounted basis. Because these costs typically extend many years into the future, estimating these future costs requires management to make estimates and judgments that are subject to future revisions based |
57
Table of Contents
Index to Financial Statements
| upon numerous factors, including the rate of inflation, changing technology and the political and regulatory environment. See “Notes to Consolidated Financial Statements — Note 5 — Asset Retirement Obligations.” |
Amounts related to our derivative financial instruments are not included in the table above. See Note 4 to our Consolidated Financial Statements.
Critical Accounting Policies and Estimates
We prepare our financial statements and the accompanying notes in conformity with GAAP, which requires our management to make estimates and assumptions about future events that affect the reported amounts in our financial statements and the accompanying notes. We identify certain accounting policies as critical based on, among other things, their impact on the portrayal of our financial condition, results of operations or liquidity and the degree of difficulty, subjectivity and complexity in their deployment. Critical accounting policies cover accounting matters that are inherently uncertain because the future resolution of such matters is unknown. Our management routinely discusses the development, selection and disclosure of each of the critical accounting policies. Following is a discussion of our most critical accounting policies:
Reserves Estimates. Effective December 31, 2009, we adopted revised oil and gas disclosure requirements set forth by the SEC in Release No. 33-8995, “Modernization of Oil and Gas Reporting” and as codified by the Financial Accounting Standards Board (FASB) in Accounting Standards Codification (ASC) Topic 932, “Extractive Industries — Oil and Gas.” The rules include changes to the pricing used to estimate reserves, the option to disclose probable and possible reserves, revised definitions for proved reserves, additional disclosures with respect to undeveloped reserves, and other revised definitions and disclosures.
Proved oil and gas reserves are the estimated quantities of natural gas, crude oil and NGLs that geological and engineering data demonstrate with reasonable certainty to be recoverable in future years from known reservoirs under existing operating conditions and government regulations.
Proved undeveloped reserves include those reserves that are expected to be recovered from new wells on undrilled acreage, or from existing wells where a relatively major expenditure is required for recompletion. Undeveloped reserves may be classified as proved reserves on undrilled acreage directly offsetting development areas that are reasonably certain of production when drilled, or where reliable technology provides reasonable certainty of economic producibility. Undrilled locations may be classified as having undeveloped reserves only if a development plan has been adopted indicating that they are scheduled to be drilled within five years, unless specific circumstances justify a longer time.
Despite the inherent imprecision in these engineering estimates, our reserves are used throughout our financial statements. For example, since we use the units-of-production method to amortize our oil and gas properties, the quantity of reserves could significantly impact our DD&A expense. Our oil and gas properties are also subject to a “ceiling” limitation based in part on the quantity of our proved reserves. Finally, these reserves are the basis for our supplemental oil and gas disclosures.
Reserves as of December 31, 2010 and 2009 were calculated using an unweighted arithmetic average of commodity prices in effect on the first day of each month, held flat for the life of the production, except where prices are defined by contractual arrangements. Reserves as of December 31, 2008 were estimated using prices in effect at the end of that year, in accordance with SEC guidance in effect prior to the issuance of the modernization rules.
We have elected not to disclose probable and possible reserves or reserve estimates in this filing.
58
Table of Contents
Index to Financial Statements
Revenue Recognition. Our revenue recognition policy is significant because revenue is a key component of the results of operations and of the forward-looking statements contained in the analysis of liquidity and capital resources. We record revenue in the month our production is delivered to the purchaser, but payment is generally received 30 to 90 days after the date of production. At the end of each month, we estimate the amount of production that was delivered to the purchaser and the price that will be received. We use our knowledge of our properties, their historical performance, the anticipated effect of weather conditions during the month of production, NYMEX and local spot market prices and other factors as the basis for these estimates. We record the variances between our estimates and the actual amounts received in the month payment is received.
Financial Instruments. Our financial instruments consist of cash and cash equivalents, receivables, payables, debt, and commodity derivatives. Commodity derivatives are recorded at fair value. The carrying amount of our other financial instruments approximate fair value because of the short-term nature of the items or variable pricing.
Derivative financial instruments are recorded in our consolidated balance sheets as either an asset or liability measured at estimated fair value. Changes in the derivative’s fair value are recognized currently in earnings as gains and losses in the period of change. The gains or losses are recorded within revenues in “Gains (losses) on commodity derivative contracts — net.” The related cash flow impact is reflected within cash flows from operating activities.
Asset Retirement Obligations. We have significant obligations to remove tangible equipment and facilities associated with our oil and natural gas wells, and to restore land at the end of oil and natural gas production operations. The removal and restoration obligations are associated with plugging and abandoning wells. Estimating the future restoration and removal costs is difficult and requires us to make estimates and judgments because most of the removal obligations are many years in the future and contracts and regulations often have vague descriptions of what constitutes removal. Asset removal technologies and costs are constantly changing, as are regulatory, political, environmental, safety and public relations considerations. Inherent in the present value calculations are numerous assumptions and judgments including the ultimate settlement amounts, inflation factors, credit adjusted discount rates, timing of settlements and changes in the legal, regulatory, environmental and political environments.
Internal Controls and Procedures
Prior to the completion of this offering, we have been a private company with limited accounting personnel to adequately execute our accounting processes and limited other supervisory resources with which to address our internal control over financial reporting. As such, we have not maintained an effective control environment in that the design and execution of our controls has not consistently resulted in effective review and supervision by individuals with financial reporting oversight roles. The lack of adequate staffing levels resulted in insufficient time spent on review and approval of certain information used to prepare our financial statements. Our independent registered accounting firm and we have concluded that these control deficiencies represented a material weakness in internal control over financial reporting for the nine month period ended September 30, 2011 and for each of the years ended December 31, 2010 and 2009. A material weakness is a control deficiency, or a combination of control deficiencies, in internal control over financial reporting, such that there is a reasonable possibility that a material misstatement of our annual or interim financial statements will not be prevented or detected on a timely basis. The control deficiencies described above, at varying degrees of severity, contributed to the material weaknesses in the control environment.
Management has taken steps to address the causes of these material weaknesses by putting into place new accounting processes and control procedures, including a new methodology to improve
59
Table of Contents
Index to Financial Statements
tracking of unevaluated properties and related costs. In addition, we have added five experienced accounting personnel. However, management is in the process of evaluating the remediation steps needed to address the causes of these control deficiencies and we expect remediation efforts to continue.
While we have begun the process of evaluating our internal control over financial reporting, we are in the early phases of our review and will not complete our review until well after this offering is completed. We cannot predict the outcome of our review at this time. During the course of the review, we may identify additional control deficiencies, which represent significant deficiencies and other material weaknesses, in addition to the material weaknesses previously identified. Management has taken steps to improve our internal control over financial reporting, including the implementation of new accounting processes and control procedures and the identification of gaps in our skills base and expertise of the staff required to meet the financial reporting requirements of a public company.
We are not currently required to comply with the SEC’s rules implementing Section 404 of the Sarbanes Oxley Act of 2002, and are therefore not required to make a formal assessment of the effectiveness of our internal control over financial reporting for that purpose. Upon becoming a public company, we will be required to comply with the SEC’s rules implementing Section 302 of the Sarbanes-Oxley Act of 2002, which will require our management to certify financial and other information in our quarterly and annual reports and provide an annual management report on the effectiveness of our internal control over financial reporting. We will not be required to make our first assessment of our internal control over financial reporting until the year following our first annual report required to be filed with the SEC. To comply with the requirements of being a public company, we will need to upgrade our systems, including information technology, implement additional financial and management controls, reporting systems and procedures and hire additional accounting, finance and legal staff.
Further, our independent registered public accounting firm is not yet required to formally attest to the effectiveness of our internal controls over financial reporting until the year following our first annual report required to be filed with the SEC. Once it is required to do so, our independent registered public accounting firm may issue a report that is adverse in the event it is not satisfied with the level at which our controls are documented, designed, operated or reviewed. Our remediation efforts may not enable us to remedy or avoid material weaknesses or significant deficiencies in the future.
Inflation
Inflation in the United States has been relatively low in recent years and did not have a material impact on our results of operations for the years ended December 31, 2010, 2009 and 2008. Although the impact of inflation has been insignificant in recent years, it is still a factor in the United States economy and we tend to experience inflationary pressure on the cost of oilfield services and equipment as increasing oil and gas prices increase drilling activity in our areas of operations.
Quantitative and Qualitative Disclosures About Market Risk
We are exposed to a variety of market risks including commodity price risk, interest rate risk and counterparty and customer risk. We address these risks through a program of risk management including the use of derivative instruments.
Commodity price exposure. We are exposed to market risk as the prices of oil and natural gas fluctuate due to changes in supply and demand. To partially reduce price risk caused by these market fluctuations, we have hedged in the past and expect to hedge a significant portion of our future production.
60
Table of Contents
Index to Financial Statements
We utilize derivative financial instruments to manage risks related to changes in oil prices. As of September 30, 2011, we utilized fixed price swaps, collars, deferred-premium puts and basis differential swaps to reduce the volatility of oil prices on a portion of our future expected oil production.
For derivative instruments recorded at fair value, the credit standing of our counterparties is analyzed and factored into the fair value amounts recognized on the balance sheet.
The following is a summary of our commodity derivative contracts as of September 30, 2011:
| Hedged Volume |
Weighted- Average Fixed Price |
|||||||
| Oil (Bbls): |
||||||||
| Swaps – 2011 |
248,400 | $ | 82.64 | |||||
| Swaps – 2012 |
893,400 | 84.16 | ||||||
| Swaps – 2013 |
679,125 | 84.73 | ||||||
| Swaps – 2014 |
262,450 | 83.00 | ||||||
| Collars – 2011 |
36,800 | $ | 85.00 – $137.38 | |||||
| Collars – 2012 |
164,700 | $ | 85.00 – $127.28 | |||||
| Deferred Premium Puts – 2011 (1) |
138,000 | $ | 82.54 | |||||
| Deferred Premium Puts – 2012 (1) |
549,000 | 79.01 | ||||||
| Basis Differential Swaps – 2011 (2) |
92,000 | $ | 11.25 | |||||
| Basis Differential Swaps – 2012 (2) |
1,134,600 | 9.78 | ||||||
| Basis Differential Swaps – 2013 (2) |
182,500 | 7.50 | ||||||
| Nine Months Ended September 30, 2011 |
||||
| (in thousands) | ||||
| Derivative fair value at period end — liability (included in the balance sheet) |
$ | 5,415 | ||
|
|
|
|||
| Realized net (loss) gain (included in the statement of operations) |
$ | (12,145 | ) | |
|
|
|
|||
| Unrealized net (loss) gain (included in the statement of operations) |
$ | 34,587 | ||
|
|
|
|||
| (1) | 2011 deferred premium puts represent the net effective floor price of a put with a strike price of $88.33/Bbl and a deferred premium of $5.79/Bbl. 2012 deferred premium puts represent the net effective floor price of a put with a strike price of $85.00/Bbl and a deferred premium of $5.99/Bbl. The premiums for these instruments are paid each month, concurrently with the settlement of the monthly put contracts. |
| (2) | We enter into swap arrangements intended to capture the positive differential between LLS pricing and NYMEX WTI pricing. |
As of December 31, 2010 and 2009, assets and liabilities recorded at fair value in the balance sheets were categorized based upon the level of judgment associated with the inputs used to measure their value. Our only financial assets and liabilities that are measured at fair value as of December 31, 2010 and 2009 are the derivative instruments discussed above. All of these derivatives have a single bank counterparty and are classified as Level 2. Our policy is to net derivative liabilities and assets where there is a legally enforceable master netting agreement with the counterparty. As of December 31, 2010 and 2009, there were no contracts in an asset position; therefore, no contracts were netted with the derivative liabilities.
Interest rate risk. At September 30, 2011, we had indebtedness outstanding under our credit facility of $198.6 million, which bore interest at floating rates. The average interest rate on this
61
Table of Contents
Index to Financial Statements
indebtedness for the nine months ended September 30, 2011 was approximately 2.9%. The average annual interest rate incurred on this indebtedness for the years ended December 31, 2010, 2009 and 2008 was approximately 3.0%, 3.3% and 5.0%, respectively. A 1.0% increase in each of the average LIBOR and federal funds rate for the nine months ended September 30, 2011 and for the year ended December 31, 2010 would have resulted in an estimated $0.9 million and $0.6 million, respectively, increase in interest expense, of which a portion may be capitalized.
We may utilize interest rate derivatives to alter interest rate exposure in an attempt to reduce interest rate expense related to existing debt issues. Interest rate derivatives are used solely to modify interest rate exposure and not to modify the overall leverage of the debt portfolio.
Counterparty and customer credit risk. Joint interest receivables arise from billing entities which own partial interest in the wells we operate. These entities participate in our wells primarily based on their ownership in leases on which we wish to drill. We have limited ability to control participation in our wells. We are also subject to credit risk due to concentration of our oil and natural gas receivables with several significant customers. See “Business — Marketing and Major Customers” for further detail about our significant customers. The inability or failure of our significant customers to meet their obligations to us or their insolvency or liquidation may adversely affect our financial results. In addition, our oil and natural gas derivative arrangements expose us to credit risk in the event of nonperformance by counterparties.
While we do not require our customers to post collateral and we do not have a formal process in place to evaluate and assess the credit standing of our significant customers for oil and gas receivables and the counterparties on our derivative instruments, we do evaluate the credit standing of such counterparties as we deem appropriate under the circumstances. This evaluation may include reviewing a counterparty’s credit rating, latest financial information and, in the case of a customer with which we have receivables, their historical payment record, the financial ability of the customer’s parent company to make payment if the customer cannot and undertaking the due diligence necessary to determine credit terms and credit limits. The counterparties on our derivative instruments currently in place are lenders under our revolving credit facility with investment grade ratings, and we are likely to enter into any future derivative instruments with these or other lenders under our revolving credit facility which also carry investment grade ratings. Several of our significant customers for oil and gas receivables have a credit rating below investment grade or do not have rated debt securities. In these circumstances, we have considered the lack of investment grade credit rating in addition to the other factors described above.
Off-Balance Sheet Arrangements
Currently, we do not have any off-balance sheet arrangements.
62
Table of Contents
Index to Financial Statements
Overview
We are an independent exploration and production company focused on the application of modern drilling and completion techniques to oil-prone resources in previously discovered yet underdeveloped hydrocarbon trends. We were founded in 1993 to focus on oilfields in the Upper Gulf Coast Tertiary trend onshore in central Louisiana. The Upper Gulf Coast Tertiary trend extends from south Texas to Mississippi across our current operating areas in central Louisiana and is characterized by well-defined geology, including tight sands featuring multiple productive zones typically located within large geologic traps. Many of the oilfields in this trend were discovered by major oil companies in the 1940’s and 1950’s, but were not fully developed due to then-prevailing oil prices, the adoption of a state-level severance tax in Louisiana, restrictive production allowables and other regulatory limitations. We have applied modern formation evaluation and drilling and completion techniques to the trend, and, as a result, we have identified a large inventory of development drilling opportunities that we believe will provide strong economic returns. Our early entry and relatively long history in the trend have positioned us as a first-mover. We have accumulated approximately 64,700 net acres in the trend and have options to acquire an aggregate of approximately 31,700 additional targeted net acres.
Our development operations are currently focused in the Wilcox interval of the trend, drilling vertical wells and commingling production from multi-stage hydraulically fractured completions across stacked oil-producing intervals. Our strategy has been validated by the 42 gross wells we have drilled in the trend since the third quarter of 2008, approximately 90% of which produced commercially. Over the past three years, we have increased our average daily production at a compound annual growth rate of 99%, from 1,024 Boe/d in the month ended September 30, 2008 to 8,033 Boe/d in the month ended September 30, 2011. We believe that, based on the results of our drilling program and our understanding of the geology underlying our acreage, we have a total of 601 specifically identified gross vertical drilling locations in the trend. In addition, we believe this trend may further benefit from the application of horizontal drilling and completion techniques. We intend to test this concept by drilling our first horizontal well by the end of 2011.
NSAI, our independent reserve engineers, estimated our net proved reserves to be 24.3 MMBoe as of September 30, 2011, 74% of which were comprised of oil and NGLs. As of September 30, 2011, our properties included approximately 86 gross active producing wells, 94% of which we operate, and in which we held an average working interest of approximately 99% across our 64,700 net acre leasehold. The following table presents summary data regarding our reserves and production for each of our four primary operating areas as well as other acreage we hold that we have identified as having significant hydrocarbon structures, as measured by either production tests or well log analysis, which we refer to as our expansion areas. The information in the table is as of September 30, 2011, unless otherwise indicated:
| Average Daily Production (1) |
Estimated Net Proved Reserves |
Acreage | Identified Vertical Drilling Locations (3) |
Budget | ||||||||||||||||||||||||||||||||
| 2011 Wells (4) |
2012 Wells |
2012 D&C (5) |
||||||||||||||||||||||||||||||||||
| (Boe/d) | (% Oil) (2) | (MMBoe) | (Gross) | (Net) | (Gross) | (Gross) | (Gross) | (In millions) | ||||||||||||||||||||||||||||
| Pine Prairie |
3,728 | 68 | % | 10.0 | 2,957 | 2,940 | 149 | 20 | 13 | $ | 50 | |||||||||||||||||||||||||
| South Bearhead Creek/Oretta |
2,908 | 70 | % | 6.0 | 3,646 | 3,560 | 38 | 8 | 10 | 56 | ||||||||||||||||||||||||||
| West Gordon |
516 | 70 | % | 5.0 | 12,896 | 12,686 | 75 | 9 | 13 | 72 | ||||||||||||||||||||||||||
| North Cowards Gully |
167 | 79 | % | 2.8 | 7,042 | 7,042 | 75 | 1 | 3 | 10 | ||||||||||||||||||||||||||
| Expansion Areas (6): |
||||||||||||||||||||||||||||||||||||
| Acreage under lease |
57 | 100 | % | 0.5 | 39,188 | 38,464 | 264 | 4 | 21 | 105 | ||||||||||||||||||||||||||
| Acreage under option |
— | — | — | 32,067 | 31,669 | — | — | — | — | |||||||||||||||||||||||||||
|
|
|
|
|
|
|
|
|
|
|
|
|
|
|
|
|
|||||||||||||||||||||
| Total |
7,376 | 70 | % | 24.3 | 97,796 | 96,361 | 601 | 42 | 60 | $ | 293 | |||||||||||||||||||||||||
|
|
|
|
|
|
|
|
|
|
|
|
|
|
|
|
|
|||||||||||||||||||||
| (1) | Average daily production for the three months ended September 30, 2011. |
| (2) | Includes volumes attributable to oil and NGLs. |
| (3) | Our drilling locations are specifically identified based on our interpretation of 2D and 3D seismic data, study of previously drilled wells and analogous well performance. We have selected our drilling locations to optimize the initial testing and subsequent delineation of all potential reservoirs in a given field or geologic structure. Drilling locations in our Pine Prairie area are primarily based on 10-acre spacing, while other drilling locations are primarily based on 40-acre spacing or greater. Of our 601 specifically identified gross vertical drilling locations, approximately 83 are classified as proved undeveloped according to NSAI’s September 30, 2011 reserve report. |
| (4) | Includes wells spud or expected to be spud between January 1, 2011 and December 31, 2011. |
| (5) | Represents drilling and completion expenditures. |
| (6) | For a description of our expansion areas, see “— Our Areas of Operation — Expansion Areas Within the Trend.” |
63
Table of Contents
Index to Financial Statements
Our total 2011 capital expenditure budget is $275 million. Through September 30, 2011, approximately $179 million of our 2011 budget has been spent, and we have drilled or spud 27 wells out of 42 wells in our 2011 drilling plan. Our total 2012 capital expenditure budget is $353 million, approximately 30% of which will be spent developing acreage currently under lease in our expansion areas. Our 2012 budget consists of:
| • | $293 million for drilling and completion capital; |
| • | $52 million for acquisition of acreage and seismic data; and |
| • | $8 million in unallocated funds which are available for facilities. |
While we have budgeted $353 million for these purposes, the ultimate amount of capital we will expend may fluctuate materially based on market conditions and the success of our drilling results as the year progresses. Please see “Management’s Discussion and Analysis of Financial Condition and Results of Operations — Liquidity and Capital Resources” beginning on page 52.
Our Business Strategy
Our goal is to increase stockholder value by growing reserves, production and cash flows at an attractive return on invested capital. We seek to achieve this goal through the following strategies:
| • | Accelerate development of our multi-year drilling inventory. We intend to drill and develop our current acreage position to maximize the value of our resource potential. Our assets are characterized by easily identifiable, thick geologic sections of tight sands featuring multiple productive zones typically located within large geologic traps. Our primary operating areas have well-established production histories and relatively low terminal production decline rates. We have identified an inventory of 601 gross vertical drilling locations targeting large, well-defined geologic structures that we believe will increase our reserves, production and cash flow. Since the third quarter of 2008, we have drilled 42 gross wells in the trend, approximately 90% of which produced commercially, making us the most active driller in the trend during that period. Our 2011 drilling plan contemplates using three drilling rigs to drill approximately 42 gross wells, 27 of which we had drilled or spud as of September 30, 2011. We expect to operate up to six drilling rigs by the end of 2012, which would enable us to drill as many as 60 gross operated wells during that year, 21 of which we anticipate drilling in our expansion areas. |
| • | Utilize our technical and operating expertise to enhance returns. Our management team is focused on the application of modern reservoir evaluation and drilling and completion techniques to reduce risk and enhance returns. We utilize relatively inexpensive 2D seismic data and existing sub-surface well control data to identify large, undeveloped or under-developed geologic traps that we believe have significant development potential as targets for our leasing activity. Once we have identified a potential target, we attempt to efficiently verify the economic viability of the target reservoir utilizing existing wellbores and techniques such as sidetracking and slim-hole drilling. Once the development potential of the target reservoir has been established, we seek to economically develop the opportunity by incorporating 3D seismic data and reservoir evaluation methods such as conventional and rotary sidewall coring pressure sampling and other reservoir description techniques. We have accumulated 3D seismic data covering 90% of the acreage in our primary operating areas and 60% of our total acreage. We believe our primary operating areas represent the successful execution of this exploration to development approach. We are applying this same approach to our expansion areas, where we have recently leased approximately 38,000 net acres and have also entered into lease option agreements covering approximately 31,700 additional net targeted acres. We believe future development across our entire acreage position may be further optimized through specialized completion techniques, infill drilling, horizontal drilling and other enhanced recovery methods. |
64
Table of Contents
Index to Financial Statements
| • | Strategically increase our acreage position. While we believe our existing inventory of specifically identified drilling locations provides significant growth opportunities, we continue to use the in-depth knowledge that we have gained as a first mover in the region to increase our leasehold position in the oil-prone portion of the Upper Gulf Coast Tertiary trend. We believe that this portion of the trend extends from east Texas through central Louisiana and into southern Mississippi and offers us significant opportunities to acquire additional acreage. We have screened more than 300 geologic structures in the oil-prone portion of the trend. Our current acreage position, including acreage under option, has captured only 18 of these structures. We have specifically identified approximately 40 additional geologic structures throughout the trend that we believe have characteristics similar to our existing operating areas. In addition to increasing our acreage position through leasing, we may selectively pursue potential acquisitions of strategic assets or operating companies in the trend. Over time, we also expect to selectively target additional onshore basins in North America that would allow us to extend our competencies to large undeveloped acreage positions in hydrocarbon trends similar to our existing core area. |
| • | Apply rigorous investment analysis to capital allocation decisions. We employ rigorous investment analysis to determine the allocation of capital across our many drilling opportunities. We are focused on maximizing the internal rate of return on our investment capital and screen drilling opportunities by measuring risk and financial return, among other factors. We continually evaluate and rank our inventory of potential investments by these measures, incorporating past drilling results and new information we have gathered. This approach has allowed us to maintain attractive operational and efficiency metrics, measured by finding and development costs, even as our capital expenditures and drilling activities have significantly increased over the last three years. |
Our Competitive Strengths
We have a number of competitive strengths that we believe will help us to successfully execute our business strategies:
| • | Extensive technical knowledge, history and first-mover advantage in the Upper Gulf Coast Tertiary trend. We have had operations in the Upper Gulf Coast Tertiary trend since 1993. We believe our extensive operating experience in the trend provides us with an expansive technical understanding of the geology underlying our acreage and of the application of completion technologies and infrastructure design and optimization to our properties. We believe our relatively long history in this area and experience interpreting well control data, core data and 2D and 3D seismic data provides us with an information advantage over our competitors in the trend and has allowed us to identify and acquire quality acreage at a relatively low cost. In addition, we have developed amicable and mutually beneficial relationships with acreage owners in our operating areas, which we believe provides us with a competitive advantage with respect to our leasing and development activity. We also benefit from long-term relationships with local service companies and infrastructure providers that we believe contribute to our efficient low-cost operations. |
| • | Louisiana Light Sweet oil-weighted reserves, production and drilling locations with attractive economics. Our reserves, production and drilling locations are primarily oil with associated liquids rich natural gas. For the three months ended September 30, 2011, our production was comprised of approximately 56% oil and 13% NGLs. We benefit from selling our oil production to the LLS market, which has historically commanded a premium to NYMEX WTI oil prices due to its proximity to U.S. Gulf Coast refiners and the higher quality of the oil production sold in the LLS market. This premium has averaged approximately $6.53 per Bbl in the three years ended September 30, 2011 and has significantly increased in recent months. For the three months ended September 30, 2011, the average realized price before the effect of commodity derivative contracts for our oil |
65
Table of Contents
Index to Financial Statements
| production was $107.56 per Bbl, compared to an average NYMEX WTI price of $89.54 per Bbl for the same period, representing a premium of $18.02 per barrel. Our ability to capture a premium for our oil production in the LLS market provides us with a significant competitive advantage over companies with assets in other well known plays, such as the Bakken and Eagle Ford, where oil price realizations are typically at a discount to NYMEX WTI. In addition, our assets are located in an area with developed legacy infrastructure that reduces our development and transportation costs relative to other onshore basins in North America. |
| • | Multi-year drilling inventory with significant upside potential. We have an inventory of approximately 601 specifically identified gross vertical drilling locations. This inventory includes drilling locations in our expansion areas that have been meaningfully risked given the early stage of development. We believe our expansion areas possess substantially similar characteristics as our primary operating areas, and expect that the execution of our remaining 2011 and 2012 drilling plans will allow us to reduce our risk profile on this acreage and could add materially to our drilling opportunities. We also believe the potential drilling inventory on our existing acreage may increase significantly by targeting additional productive zones and through infill drilling. Based on the results of our development activities in our primary operating areas, we believe that infill drilling within thick geologic sections of tight sands increases the ultimate resource recovery. We have successfully downspaced to 10-acre spacing in portions of our Pine Prairie area. We are currently testing downspacing in our South Bearhead Creek/Oretta and North Cowards Gully areas and intend to apply this concept in our other primary operating areas and our expansion areas. In addition, we may be able to enhance the total recovery in the trend through specialized completion techniques, horizontal drilling and secondary recovery techniques. |
| • | Operating control over 95% of our portfolio. In order to maintain better control over our assets, we have established a leasehold position comprised primarily of properties that we expect to operate. Controlling operations allows us to dictate the pace of development and better manage the cost, type and timing of exploration and development activities. We expect to operate 95% of our 601 specifically identified gross drilling locations. For the three months ended September 30, 2011, approximately 99% of our production was attributable to properties that we operate. |
| • | Experienced management team with extensive operating expertise. Our management team has extensive operating expertise in the oil and gas industry and significant public company executive experience at Apache Corporation, Burlington Resources, ConocoPhillips, Noble Corporation, and SM Energy. Our management team has an average of 30 years of industry experience, including prior experience in the Upper Gulf Coast Tertiary trend and similar trends. We believe our management team is one of our principal competitive strengths relative to our industry peers due to our team’s proven track record of efficiently operating exploration and development programs. |
| • | Conservative financial position. We believe that our capital structure and hedge positions following this offering will allow us to continue our development program and acquire additional acreage even in challenging commodity price environments and periods of capital markets dislocation. Giving effect to the completion of this offering, our liquidity as of September 30, 2011 would have been $ million, consisting of $ million available under our revolving credit facility and $ million in cash and cash equivalents. After the completion of this offering, we believe we will have the liquidity and financial flexibility to more than fund our 2012 drilling program and production growth. In addition, we have an active hedging program in place, with swaps, collars and puts covering approximately 79% and 58% of our remaining budgeted 2011 and 2012 oil production. |
66
Table of Contents
Index to Financial Statements
| • | Alignment among management, founders and public stockholders. Upon the completion of this offering, our management team will have a significant direct ownership interest in us. In addition, our management team will also own an indirect economic interest in us through their ownership of incentive units in MPCI. MPCI is controlled by First Reserve. The incentive units entitle our management to a portion of the proceeds to be received by First Reserve upon sales of our common stock by MPCI. Our management may significantly increase the value allocated to their incentive units by increasing the return on investment for First Reserve. We believe our management team’s direct ownership interest and incentive units provide significant incentives to grow the value of our business for the benefit of all stockholders. |
Our Operations
Overview of the Geologic Structure of the Upper Gulf Coast Tertiary Trend
| The Upper Gulf Coast Tertiary trend is an approximately 65 million year old geologic system. The lower portion of the trend, also known as the Paleogene system, exists as a continuous event along the Upper Gulf Coast region of Texas, Louisiana, and Mississippi. There are three major geologic series in the Paleogene system — the Oligocene, Eocene, and Paleocene. Each of these geologic series contain numerous strata exhibiting viable reservoir rock qualities. Our current acreage position and evaluation efforts are concentrated in the trend within the state of Louisiana. The Yegua/Cockfield, Cook Mountain, Sparta, and Wilcox formations, which are specific to the Eocene geologic series underlying the state of Louisiana, have evidence of numerous hydrocarbon trap systems along the trend. In Louisiana, the trend has cumulatively produced nearly 800 million barrels of oil. The Wilcox interval is prevalent in our primary operating areas and our expansion areas and is the principal target of our identified drilling locations. The Wilcox interval spans a gross thickness of 3,000 to 4,000 feet and lies at depths between 9,000 to 17,000 feet across our focus area in the trend. It consists of silty sandstone with clean sandstone and shales inter-bedded throughout. Porosities are typically between 6% and 18% with permeability ranging from 0.1 to 10 millidarcies.
|
|
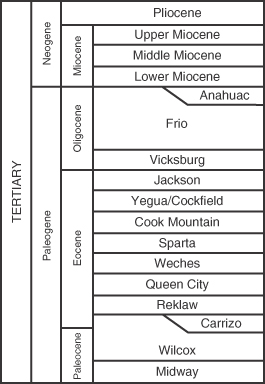
Hydrocarbon discoveries in the Wilcox interval in Louisiana occurred as early as the 1930’s and continued thereafter as numerous new field discoveries were made. Most new field discoveries were made by drilling exploratory wells targeting structures using gravity data, and later by the use of 2D seismic surveys. These structures consist of basic 3- or 4-way rollover anticline closures against large “down-to-the-coast” expansion faults and geologic closures caused by deeper underlying salt deformations along the trend. In some instances, the exploratory wells were tested under natural conditions in select, thin-sand intervals through the use of a drill-stem test. Regulatory requirements in place at the time limited completion intervals to individual sands rather than a collection of stacked sands. Because of the Wilcox interval’s tendency to have lower permeability than traditional Gulf Coast reservoirs, most of the drill-stem tests showed marginally economic production rates, and
67
Table of Contents
Index to Financial Statements
consequently, the exploratory wells were abandoned. In other instances, the exploratory wells were completed in a single pay interval and flowed until production rates became marginally economic. At that time, the existing completed interval was abandoned and a new interval was completed. In almost all cases, minimal reservoir delineation or down spacing efforts were made beyond the exploratory well due to the marginal production tests realized and then prevailing oil prices associated with this area. Some of the early wells continue to produce at very low decline rates.
The hydrocarbon characteristics of the Wilcox interval in Louisiana are consistent with black and/ or volatile oils. A high quality, 45º to 50º API gravity oil is produced along with significant yields of high Btu gas that can be processed for NGLs. The primary drive mechanism for most of the reservoirs is pressure depletion, as opposed to the strong water drive commonly seen in traditional Gulf Coast reservoirs. This typically results in a longer reserve life with minimal or no water production. The hydrocarbon characteristics seen in Louisiana in the Wilcox interval vary considerably to those seen in Texas in the Wilcox interval where historical data indicates a gaseous hydrocarbon production stream. The differences in fluid properties across the entire trend are the result of the hydrocarbon source rocks having different organic compositions and thermal maturities across the play.
We believe advances in drilling and completion techniques have created significant development potential in the trend. Specifically, hydraulic fracture stimulation techniques have been developed by the industry to increase ultimate resource recoveries in tight geologic formations. Infill drilling has also been utilized by the industry to further enhance recoveries from thick, tight geologic intervals. We have successfully implemented infill drilling in our Pine Prairie area and are currently testing the technique in our South Bearhead Creek/Oretta and North Cowards Gully areas. We also intend to apply this concept to our other primary operating areas and expansion areas. There are many plays that contain similar thick, tight geologic sections onshore in the United States that illustrate that the application of these advancements can achieve strong economic results. The Wolfberry trend in the Permian Basin and the Williams Fork trend in the Piceance Basin are two examples.
Our Areas of Operation
Pine Prairie
Our properties in the Pine Prairie area represented 41.3% of our total proved reserves as of September 30, 2011. During the three months ended September 30, 2011, our average production from these properties was 3,728 net Boe/d consisting of 1,917 Bbls of oil, 634 Bbls of NGLs and 7,064 Mcf of natural gas per day. As of September 30, 2011, we held an average working interest and average net revenue interest of 92.1% and 72.2%, respectively, on our acreage in this area. Our current development drilling is targeting the Upper and Lower Wilcox, the Sparta and the shallower Miocene and Frio intervals. We are currently drilling on primarily 10-acre spacing in this area. In 2011, we plan to invest approximately $71 million in the drilling of 20 wells in the Pine Prairie area, and in 2012, we plan to invest approximately $50 million in the drilling of 13 wells. We have an additional 149 identified drilling locations in this area based primarily on 10-acre spacing.
South Bearhead Creek/Oretta
Our properties in the South Bearhead Creek/Oretta area represented 24.6% of our total proved reserves as of September 30, 2011. During the three months ended September 30, 2011, our average production from these properties was 2,908 net Boe/d consisting of 1,734 Bbls of oil, 313 Bbls of NGLs and 5,168 Mcf of natural gas per day. As of September 30, 2011, we held an average working interest and average net revenue interest of 100% and 78.8%, respectively, on our acreage in this area. Our current development drilling is targeting the Upper and Lower Wilcox intervals. The field is being developed on 40-acre spacing by commingling production from the Upper and Lower Wilcox. In 2011, we plan to invest approximately $60 million in the drilling of 8 wells in the South Bearhead Creek/Oretta
68
Table of Contents
Index to Financial Statements
area, and in 2012, we plan to invest approximately $56 million in the drilling of 10 wells. We have an additional 38 identified drilling locations in this area based primarily on 40-acre spacing and are currently testing downspacing to 20-acre spacing.
West Gordon
Our properties in the West Gordon area represented 20.6% of our total proved reserves as of September 30, 2011. During the three months ended September 30, 2011, our average production from these properties was 516 net Boe/d consisting of 337 Bbls of oil, 24 Bbls of NGLs and 932 Mcf of natural gas per day. As of September 30, 2011, we held an average working interest and average net revenue interest of 98.9% and 76.3%, respectively, on our acreage in this area. Our current development drilling is targeting the Upper Wilcox interval, where we are drilling on 40-acre spacing. In 2011, we plan to invest approximately $61 million in the drilling of 9 wells in the West Gordon area, and in 2012, we plan to increase our investment to approximately $72 million in the drilling of 13 wells. We have an additional 75 identified drilling locations in this area based primarily on 40-acre spacing.
North Cowards Gully
Our properties in the North Cowards Gully area represented 11.5% of our total proved reserves as of September 30, 2011. During the three months ended September 30, 2011, our average production from these properties was 167 net Boe/d consisting of 121 Bbls of oil, 11 Bbls of NGLs, and 209 Mcf of natural gas per day. As of September 30, 2011, we held an average working interest and average net revenue interest of 100% and 78.3%, respectively, on our acreage in this area. Our current development drilling is targeting the Upper Wilcox interval, where we are drilling on 40-acre spacing. In 2011, we have invested approximately $9 million in the drilling of one well in North Cowards Gully area, and in 2012, we plan to increase our investment to approximately $10 million in the drilling of 3 wells. We have an additional 75 identified drilling locations in this area based primarily on 40-acre spacing and are currently testing downspacing to 20-acre spacing.
Expansion Areas Within the Trend
In late 2010, we began acquiring seismic data and additional acreage in a focused effort to expand our asset base in the trend. As part of this effort, we screened more than 300 geologic structures in the trend utilizing existing sub-surface well control and 2D seismic. We further narrowed the group of identifiable structures based on our prior experience. Subsequently, we acquired approximately 37,900 net acres in our expansion areas in late 2010 and early 2011. We are currently evaluating prospects on this acreage. We have drilled four wells, three of which are producing and one of which is awaiting surface facilities, and plan to drill another by year-end 2011. We have identified 264 drilling locations on this acreage and are planning to spend approximately $105 million to drill 21 wells in 2012 on this acreage. These drilling locations have been meaningfully risked given the early stage of development. We expect that the execution of our remaining 2011 and 2012 drilling plans will allow us to reduce our risk profile on this acreage and could add materially to our drilling opportunities. During 2011, we also negotiated options to acquire an additional 31,700 net acres in the trend. We have committed to shoot 3D seismic over the optioned acreage which is expected to be completed by October 2012. We may acquire additional acreage within the 3D seismic shoot pending evaluation of the results.
To date, our existing acreage position, including acreage under option, has captured 18 of the previously screened geologic structures. The successful conversion of our primary operating areas from exploration to development and the early results in our expansion areas gives us confidence in our ability to add significant additional value within our expansion areas. Further, we have specifically identified approximately 40 additional geological structures throughout the trend that we may target for future leasehold acquisition.
69
Table of Contents
Index to Financial Statements
Estimated Proved Reserves
Unless otherwise specifically identified in this prospectus, the summary data with respect to our estimated proved reserves presented below has been prepared by our independent reserve engineering firms in accordance with rules and regulations of the SEC applicable to companies involved in oil and natural gas producing activities. For a definition of proved reserves under the SEC rules, see the “Glossary of Oil and Natural Gas Terms” beginning on page A-1 of this prospectus.
The reserve estimates at September 30, 2011 and at December 31, 2010 and 2009 presented in the table below are based on reports prepared by NSAI. NSAI’s reports were prepared consistent with the rules and regulations of the SEC regarding oil and natural gas reserve reporting in effect during such periods. The reserve estimates at December 31, 2008 presented in the table below are based on estimates prepared by our internal engineers, in accordance with the rules and regulations of the SEC regarding oil and natural gas reserve reporting in effect during such period.
| At September 30, | At December 31, | |||||||||||||||
| 2011 | 2010 | 2009 | 2008 | |||||||||||||
| Reserve Data: |
||||||||||||||||
| Estimated proved reserves: |
||||||||||||||||
| Oil (MMBbls) |
14.2 | 11.9 | 7.6 | 4.8 | ||||||||||||
| Natural gas (Bcf) |
38.0 | 27.9 | 13.3 | 5.1 | ||||||||||||
| Natural gas liquids (MMBbls) |
3.8 | 0.3 | 0.1 | 0.0 | ||||||||||||
| Total estimated proved reserves (MMBoe) |
24.3 | 16.9 | 9.9 | 5.6 | ||||||||||||
| Proved developed reserves: |
||||||||||||||||
| Oil (MMBbls) |
6.3 | 5.4 | 2.8 | 2.3 | ||||||||||||
| Natural gas (Bcf) |
18.9 | 14.2 | 4.4 | 1.9 | ||||||||||||
| Natural gas liquids (MMBbls) |
1.9 | 0.1 | 0.0 | — | ||||||||||||
| Total proved developed (MMBoe) |
11.3 | 7.9 | 3.5 | 2.6 | ||||||||||||
| Percent proved developed |
47 | % | 47 | % | 36 | % | 46 | % | ||||||||
| Proved undeveloped reserves: |
||||||||||||||||
| Oil (MMBbls) |
7.9 | 6.5 | 4.8 | 2.5 | ||||||||||||
| Natural gas (Bcf) |
19.1 | 13.7 | 8.9 | 3.2 | ||||||||||||
| Natural gas liquids (MMBbls) |
1.9 | 0.2 | 0.1 | — | ||||||||||||
| Total proved undeveloped (MMBoe) |
13.0 | 9.0 | 6.4 | 3.0 | ||||||||||||
The following table sets forth the benchmark prices used to determine our estimated proved reserves from proved oil and natural gas reserves for the periods indicated.
| At September 30, | At December 31, | |||||||||||||||
| 2011 | 2010 | 2009 | 2008 | |||||||||||||
| Oil and Natural Gas Prices (1): |
||||||||||||||||
| Oil (per Bbl) |
$91.00 | $75.96 | $57.65 | $44.61 | ||||||||||||
| Natural gas (per MMBtu) |
$4.160 | $4.376 | $3.866 | $5.710 | ||||||||||||
| (1) | Benchmark prices for oil and natural gas at September 30, 2011 and at December 31, 2010 and 2009 reflect the unweighted arithmetic average first-day-of-the-month prices for the prior twelve months, using Plains WTI posted prices for oil and NYMEX Henry Hub prices for natural gas. At December 31, 2008, benchmark prices for oil and natural gas reflect NYMEX WTI prices for oil and NYMEX Henry Hub prices for natural gas. |
Our proved reserves have grown from 9.9 to 16.9 MMBoe from year end 2009 to 2010 and 16.9 to 24.3 MMBoe from year end 2010 to September 30, 2011. Our reserve growth in these periods is due directly to the extensions and discoveries associated with our drilling activities in each year. As a result
70
Table of Contents
Index to Financial Statements
of our drilling efforts, we have increased our average daily production at a compound annual growth rate of 99% from 1,024 Boe/d in the month ended September 30, 2008 from 8,033 Boe/d in the month ended September 30, 2011.
Our proved undeveloped reserves have grown from 9.0 MMBoe to 13.0 MMBoe from September 30, 2010 to September 30, 2011. During this time, we spent $29 million of our capital expenditures on drilling proved undeveloped locations and converted 1.6 MMBoe from proved undeveloped reserves to proved developed reserves. In addition, we added 7.9 MMBoe of proved undeveloped reserves through extensions and discoveries. Also, we had a negative revision of 2.4 MMBoe of proved undeveloped reserves.
Independent petroleum engineers
Our estimated reserves at September 30, 2011 and our estimated reserves and related future net revenues at December 31, 2010 and 2009 are based on reports prepared by NSAI, in accordance with generally accepted petroleum engineering and evaluation principles and definitions and guidelines in effect in effect during such period established by the SEC. Copies of these reports have been filed as an exhibit to the registration statement containing this prospectus.
The reserves estimates as of September 30, 2011, December 31, 2010, and December 31, 2009 shown herein have been independently evaluated by NSAI, a worldwide leader of petroleum property analysis for industry and financial organizations and government agencies. NSAI was founded in 1961 and performs consulting petroleum engineering services under Texas Board of Professional Engineers Registration No. F-2699. Within NSAI, the technical persons primarily responsible for preparing the estimates set forth in the NSAI reserves report incorporated herein are Mr. Robert C. Barg, Mr. Philip R. Hodgson, and Mr. Thomas C. Woolley. Bob Barg has been practicing consulting petroleum engineering at NSAI since 1989. Mr. Barg is a Registered Professional Engineer in the State of Texas (License No. 71658) and has over 28 years of practical experience in petroleum engineering, with over 22 years experience in the estimation and evaluation of reserves. He graduated from Purdue University in 1983 with a Bachelor of Science Degree in Mechanical Engineering. Phil Hodgson has been practicing consulting petroleum geology at NSAI since 1998. Mr. Hodgson is a Certified Petroleum Geologist and Geophysicist in the State of Texas (License No. 1314) and has over 27 years of practical experience in petroleum geosciences, with over 13 years experience in the estimation and evaluation of reserves. He graduated from Purdue University in 1982 with a Bachelor of Science Degree in Geology and from Purdue University in 1984 with a Master of Science Degree in Geophysics. Thomas Woolley practiced consulting petroleum engineering at NSAI from 2006 to 2011. Mr. Woolley is a Registered Professional Engineer in the State of Texas (License No. 100562) and has over 8 years of practical experience in petroleum engineering, with over 4 years experience in the estimation and evaluation of reserves. He graduated from Texas A&M University in 2002 with a Bachelor of Science Degree in Petroleum Engineering. All three technical principals meet or exceed the education, training, and experience requirements set forth in the Standards Pertaining to the Estimating and Auditing of Oil and Gas Reserves Information promulgated by the Society of Petroleum Engineers; all three are proficient in judiciously applying industry standard practices to engineering and geoscience evaluations as well as applying SEC and other industry reserves definitions and guidelines.
Technology used to establish proved reserves
Under Rule 4-10(a)(22) of Regulation S-X, as promulgated by the SEC, proved reserves are those quantities of oil and natural gas, which, by analysis of geoscience and engineering data, can be estimated with reasonable certainty to be economically producible from a given date forward, from known reservoirs, and under existing economic conditions, operating methods, and government regulations. The term “reasonable certainty” implies a high degree of confidence that the quantities of oil and/or natural gas actually recovered will equal or exceed the estimate. Reasonable certainty can
71
Table of Contents
Index to Financial Statements
be established using techniques that have been proved effective by actual production from projects in the same reservoir or an analogous reservoir or by other evidence using reliable technology that establishes reasonable certainty. Reliable technology is a grouping of one or more technologies (including computational methods) that has been field tested and has been demonstrated to provide reasonably certain results with consistency and repeatability in the formation being evaluated or in an analogous formation.
In order to establish reasonable certainty with respect to our estimated proved reserves, NSAI employed technologies that have been demonstrated to yield results with consistency and repeatability. The technologies and economic data used in the estimation of our proved reserves include, but are not limited to, electrical logs, radioactivity logs, core analyses, geologic maps and available downhole and production data, seismic data and well test data.
Internal controls over reserves estimation process
We maintain an internal staff of petroleum engineers and geoscience professionals who work closely with our independent reserve engineers to ensure the integrity, accuracy and timeliness of data furnished to NSAI in their reserves estimation process. Curtis Newstrom, PE, our Vice President of New Ventures, is the technical person primarily responsible for overseeing the preparation of our reserve estimates. He has 25 years of industry experience with positions of increasing responsibility in engineering and evaluations and holds a Bachelor of Science in Petroleum Engineering from Marietta College. Our Vice President of New Ventures reports directly to the CEO and is a registered professional engineer in the state of Louisiana (License No. 25260). Throughout each fiscal year, our technical team meets with representatives of our independent reserve engineers to review properties and discuss methods and assumptions used in preparation of the proved reserves estimates. While we have no formal committee specifically designated to review reserves reporting and the reserves estimation process, a preliminary copy of the reserve report is reviewed by our senior management with representatives of our independent reserve engineers and internal technical staff.
Production, revenues and price history
Oil and natural gas are commodities. The price that we receive for the oil and natural gas we produce is largely a function of market supply and demand. Demand for oil and natural gas in the United States has increased dramatically during this decade. However, the current economic slowdown reduced this demand during the second half of 2008 and through 2009. Demand for oil increased during 2010, but demand for natural gas remained sluggish. Demand is impacted by general economic conditions, weather and other seasonal conditions, including hurricanes and tropical storms. Over or under supply of oil or natural gas can result in substantial price volatility. Historically, commodity prices have been volatile and we expect that volatility to continue in the future. A substantial or extended decline in oil or natural gas prices or poor drilling results could have a material adverse effect on our financial position, results of operations, cash flows, quantities of oil and natural gas reserves that may be economically produced and our ability to access capital markets.
72
Table of Contents
Index to Financial Statements
The following table sets forth information regarding oil and natural gas production, revenues and realized prices and production costs for the nine months ended September 30, 2011 and 2010 and the years ended December 31, 2010, 2009 and 2008. For additional information on price calculations, see information set forth in “Management’s Discussion and Analysis of Financial Condition and Results of Operation.”
| Successor | Predecessor | |||||||||||||||||||||||||
| Nine Months Ended September 30, |
Year Ended December 31, |
Period from August 30 to December 31, 2008 |
Period from January 1 to August 29, 2008 |
|||||||||||||||||||||||
| 2011 | 2010 | 2010 | 2009 | |||||||||||||||||||||||
| (in thousands) | ||||||||||||||||||||||||||
| Operating data: |
||||||||||||||||||||||||||
| Net production volumes: |
||||||||||||||||||||||||||
| Oil (MBbls) |
1,136 | 652 | 945 | 497 | 104 | 218 | ||||||||||||||||||||
| Natural gas (Mcf) |
3,154 | 1,446 | 2,253 | 690 | 110 | 131 | ||||||||||||||||||||
| Natural gas liquids (MBbls) |
207 | 4 | 74 | 2 | — | — | ||||||||||||||||||||
| Total oil equivalents (MBoe) |
1,869 | 897 | 1,394 | 614 | 122 | 240 | ||||||||||||||||||||
| Average daily production |
6,847 | 3,285 | 3,820 | 1,682 | 984 | 996 | ||||||||||||||||||||
| Average sales prices: |
||||||||||||||||||||||||||
| Oil, without realized derivatives (per Bbl) |
$ | 108.08 | $ | 77.57 | $ | 80.29 | $ | 55.07 | $ | 75.68 | $ | 118.95 | ||||||||||||||
| Oil, with realized derivatives (per Bbl) |
97.39 | 78.01 | 79.37 | 57.69 | 79.78 | 105.15 | ||||||||||||||||||||
| Natural gas (per Mcf) |
4.70 | 5.23 | 4.66 | 3.89 | 7.72 | 11.48 | ||||||||||||||||||||
| Natural gas liquids (per Bbl) |
48.02 | 40.42 | 36.92 | 47.66 | — | — | ||||||||||||||||||||
| Cost and expenses (per Boe of production): |
||||||||||||||||||||||||||
| Lease operating |
$ | 5.06 | $ | 5.83 | $ | 6.26 | $ | 8.66 | $ | 12.64 | $ | 11.54 | ||||||||||||||
| Workover |
0.70 | 4.30 | 3.36 | 8.51 | 19.48 | 9.19 | ||||||||||||||||||||
| Severance tax |
4.51 | 4.68 | 4.61 | 4.64 | 6.60 | 9.81 | ||||||||||||||||||||
| Asset retirement accretion |
0.11 | 0.12 | 0.13 | 0.20 | 0.30 | 0.33 | ||||||||||||||||||||
| General and administrative |
8.08 | 12.71 | 11.73 | 9.59 | 11.50 | 7.57 | ||||||||||||||||||||
| Depreciation, depletion and amortization |
32.98 | 30.03 | 30.00 | 20.08 | 24.56 | 12.99 | ||||||||||||||||||||
Productive wells
The following table presents the total gross and net productive wells as of September 30, 2011:
| Oil | Natural Gas | Total | ||||||||||||||||||||||
| Gross | Net | Gross | Net | Gross | Net | |||||||||||||||||||
| Total productive wells |
82 | 78.2 | 4 | 3.5 | 86 | 81.7 | ||||||||||||||||||
Gross wells are the number of wells in which a working interest is owned and net wells are the total of our fractional working interests owned in gross wells.
73
Table of Contents
Index to Financial Statements
Acreage
The following table sets forth certain information regarding the developed and undeveloped acreage in which we have a controlling interest as of September 30, 2011 for each of our project areas. Acreage related to royalty, overriding royalty and other similar interests is excluded from this summary.
| Developed Acres |
Undeveloped Acres |
Total Acres | ||||||||||||||||||||||
| Gross | Net | Gross | Net | Gross | Net | |||||||||||||||||||
| Pine Prairie |
2,047 | 2,033 | 910 | 907 | 2,957 | 2,940 | ||||||||||||||||||
| South Bearhead Creek/Oretta |
2,051 | 2,051 | 1,595 | 1,509 | 3,646 | 3,560 | ||||||||||||||||||
| West Gordon |
1,357 | 1,357 | 11,539 | 11,329 | 12,896 | 12,686 | ||||||||||||||||||
| North Cowards Gully |
1,594 | 1,594 | 5,448 | 5,448 | 7,042 | 7,042 | ||||||||||||||||||
| Expansion Areas (1): |
||||||||||||||||||||||||
| Acreage Under Lease |
1,221 | 1,221 | 37,967 | 37,243 | 39,188 | 38,464 | ||||||||||||||||||
| Acreage Under Option |
— | — | 32,067 | 31,669 | 32,067 | 31,669 | ||||||||||||||||||
|
|
|
|
|
|
|
|
|
|
|
|
|
|||||||||||||
| Total acreage |
8,270 | 8,256 | 89,526 | 88,105 | 97,796 | 96,361 | ||||||||||||||||||
|
|
|
|
|
|
|
|
|
|
|
|
|
|||||||||||||
| (1) | For a description of our Expansion Areas, see “— Our Areas of Operation — Expansion Areas Within the Trend.” |
Undeveloped acreage expirations
The following table sets forth the number of gross and net undeveloped acres as of September 30, 2011 that will expire over the next three years by project area unless production is established within the spacing units covering the acreage prior to the expiration dates:
| Expiring 2011 | Expiring 2012 | Expiring 2013 | ||||||||||||||||||||||
| Gross | Net | Gross | Net | Gross | Net | |||||||||||||||||||
| Pine Prairie |
0 | 0 | 35 | 35 | 478 | 459 | ||||||||||||||||||
| South Bearhead Creek/Oretta |
0 | 0 | 0 | 0 | 40 | 40 | ||||||||||||||||||
| West Gordon |
0 | 0 | 52 | 52 | 1,529 | 824 | ||||||||||||||||||
| North Cowards Gully |
165 | 165 | 623 | 593 | 3,541 | 3,520 | ||||||||||||||||||
| Expansion Areas: |
||||||||||||||||||||||||
| Acreage Under Lease |
1,200 | 1,200 | 157 | 131 | 1,501 | 1,196 | ||||||||||||||||||
| Acreage Under Option |
— | — | — | — | — | — | ||||||||||||||||||
|
|
|
|
|
|
|
|
|
|
|
|
|
|||||||||||||
| Undeveloped acreage expirations |
1,365 | 1,365 | 867 | 811 | 7,089 | 6,039 | ||||||||||||||||||
|
|
|
|
|
|
|
|
|
|
|
|
|
|||||||||||||
Approximately 57% of our owned acreage has been acquired in 2011, with the majority of such leases under five year primary term leases. In addition, our typical lease terms along with unit regulatory rules provide us flexibility to continue lease ownership through either establishing production or actively drilling prospects.
74
Table of Contents
Index to Financial Statements
Drilling activity
The following table summarizes our drilling activity for the nine months ended September 30, 2011 and 2010 and the years ended December 31, 2010, 2009 and 2008. Gross wells reflect the sum of all wells in which we own an interest. Net wells reflect the sum of our working interests in gross wells.
| Nine Months Ended September 30, | Years Ended December 31, | |||||||||||||||||||||||||||||||||||||||
| 2011 | 2010 | 2010 | 2009 | 2008 | ||||||||||||||||||||||||||||||||||||
| Gross | Net | Gross | Net | Gross | Net | Gross | Net | Gross | Net | |||||||||||||||||||||||||||||||
| Development wells: |
||||||||||||||||||||||||||||||||||||||||
| Productive |
16 | 15.8 | 10 | 10 | 16 | 16 | 5 | 5 | 1 | 1 | ||||||||||||||||||||||||||||||
| Dry holes |
0 | 0 | 2 | 2 | 2 | 2 | 0 | 0 | 0 | 0 | ||||||||||||||||||||||||||||||
|
|
|
|
|
|
|
|
|
|
|
|
|
|
|
|
|
|
|
|
|
|||||||||||||||||||||
| Total |
16 | 15.8 | 12 | 12 | 18 | 18 | 5 | 5 | 1 | 1 | ||||||||||||||||||||||||||||||
| Exploratory wells: |
||||||||||||||||||||||||||||||||||||||||
| Productive |
0 | 0 | 0 | 0 | 1 | 1 | 0 | 0 | 0 | 0 | ||||||||||||||||||||||||||||||
| Dry holes |
0 | 0 | 0 | 0 | 0 | 0 | 2 | 2 | 0 | 0 | ||||||||||||||||||||||||||||||
|
|
|
|
|
|
|
|
|
|
|
|
|
|
|
|
|
|
|
|
|
|||||||||||||||||||||
| Total |
0 | 0 | 0 | 0 | 1 | 1 | 2 | 2 | 0 | 0 | ||||||||||||||||||||||||||||||
|
|
|
|
|
|
|
|
|
|
|
|
|
|
|
|
|
|
|
|
|
|||||||||||||||||||||
| Total wells |
16 | 15.8 | 12 | 12 | 19 | 19 | 7 | 7 | 1 | 1 | ||||||||||||||||||||||||||||||
As of September 30, 2011, there were 4 gross (3.2 net) development wells being drilled and 10 gross (10 net) development wells and 2 gross (2 net) exploratory wells that have been drilled and that are in the process of completion.
Our drilling activity has increased over the last three years, and we were operating three drilling rigs on our properties as of September 30, 2011. Our drilling activity has primarily focused on delineation and appraisal of our primary operating areas in the Pine Prairie, South Bearhead Creek/Oretta, West Gordon and North Cowards Gully fields, as well as recent expansion into newly acquired acreage. In addition to the drilling activity listed above, a portion of our capital program over the last three years has also been focused on re-entering and recompleting productive zones in existing wellbores. In 2009 and 2010, we had a total of 4 gross (4 net) wells that were deemed dry wells, two of which were geologic dry holes and two of which were caused by mechanical problems encountered while drilling which prevented us from reaching the reservoir targets.
Marketing and Major Customers
We sell our oil and natural gas to third-party purchasers. We are not dependent upon, or contractually limited to, any one purchaser or small group of purchasers. However, for the nine months ended September 30, 2011, Chevron and Gulfmark accounted for 44% and 38% of our revenues, respectively. For the nine months ended September 30, 2010, Chevron accounted for 73% of our revenues. For the year ended December 31, 2010, Chevron, Crosstex, and Gulfmark accounted for 66%, 19%, and 12% of our revenues, respectively. For the year ended December 31, 2009, Chevron and Gulfmark accounted for 66% and 14% of our revenues, respectively. Due to the nature of oil and natural gas markets and because we sell our oil production to purchasers that transport by truck rather than by pipelines, we do not believe the loss of a single purchaser or a few purchasers would materially affect our ability to sell our production.
Title to Properties
As is customary in the oil and natural gas industry, we initially conduct only a cursory review of the title to our properties on which we do not have proved reserves. Prior to the commencement of drilling operations on those properties, we conduct a more thorough title examination and perform curative
75
Table of Contents
Index to Financial Statements
work with respect to significant defects. To the extent title opinions or other investigations reflect defects affecting those properties, we are typically responsible for curing any such defects at our expense. We generally will not commence drilling operations on a property until we have cured known material title defects on such property. We have reviewed the title to substantially all of our producing properties and believe that we have satisfactory title to our producing properties in accordance with standards generally accepted in the oil and natural gas industry. Prior to completing an acquisition of producing oil and natural gas properties, we perform title reviews on the most significant properties and, depending on the materiality of properties, we may obtain a title opinion or review or update previously obtained title opinions. Our oil and natural gas properties are subject to customary royalty and other interests, liens to secure borrowings under our credit facility, liens for current taxes and other burdens which we believe do not materially interfere with the use or affect our carrying value of the properties.
Seasonality
Generally, the demand for and price of natural gas increases during the winter months and decreases during the summer months. However, these seasonal fluctuations are somewhat reduced because during the summer, pipeline companies, utilities, local distribution companies and industrial users purchase and place into storage facilities a portion of their anticipated winter requirements of natural gas.
Competition
The oil and natural gas industry is highly competitive. We compete with numerous entities, including major domestic and foreign oil companies, other independent oil and natural gas concerns and individual producers and operators. Many of these competitors are large, well established companies and have financial and other resources substantially greater than ours. Our ability to acquire additional oil and natural gas properties and to discover reserves in the future will depend upon our ability to evaluate and select suitable properties and consummate transactions in a highly competitive environment. For a more thorough discussion of how competition could impact our ability to successfully complete our business strategy, see “Risk Factors.”
Regulation of the Oil and Natural Gas Industry
Our operations are substantially affected by federal, state and local laws and regulations. In particular, oil and natural gas production and related operations are, or have been, subject to price controls, taxes and numerous other laws and regulations. All of the jurisdictions in which we own or operate properties for oil and natural gas production have statutory provisions regulating the exploration for and production of oil and natural gas, including provisions related to permits for the drilling of wells, bonding requirements to drill or operate wells, the location of wells, the method of drilling and casing wells, the surface use and restoration of properties upon which wells are drilled, sourcing and disposal of water used in the drilling and completion process, and the abandonment of wells. Our operations are also subject to various conservation laws and regulations. These include regulation of the size of drilling and spacing units or proration units, the number of wells which may be drilled in an area, and the unitization or pooling of oil and natural gas wells, as well as regulations that generally prohibit the venting or flaring of natural gas and impose certain requirements regarding the ratability or fair apportionment of production from fields and individual wells.
Failure to comply with applicable laws and regulations can result in substantial penalties. The regulatory burden on the industry increases the cost of doing business and affects profitability. Although we believe we are in substantial compliance with all applicable laws and regulations, and that continued substantial compliance with existing requirements will not have a material adverse effect on
76
Table of Contents
Index to Financial Statements
our financial position, cash flows or results of operations, such laws and regulations are frequently amended or reinterpreted. Additionally, currently unforeseen environmental incidents may occur or past non-compliance with environmental laws or regulations may be discovered. Therefore, we are unable to predict the future costs or impact of compliance. Additional proposals and proceedings that affect the oil and natural gas industry are regularly considered by Congress, the states, the Federal Energy Regulatory Commission, or FERC, and the courts. We cannot predict when or whether any such proposals may become effective.
Regulation of Transportation of Oil
Currently 100% of our oil sales are transported by truck. Sales of oil, condensate and natural gas liquids are not currently regulated and are made at negotiated prices. Nevertheless, Congress could reenact price controls in the future.
Our sales of oil are affected by the availability, terms and cost of transportation. The transportation of oil in common carrier pipelines is also subject to rate and access regulation. The FERC regulates interstate oil pipeline transportation rates under the Interstate Commerce Act. In general, interstate oil pipeline rates must be cost-based, although settlement rates agreed to by all shippers are permitted and market based rates may be permitted in certain circumstances. Effective January 1, 1995, the FERC implemented regulations establishing an annual indexing system (based on inflation) for transportation rates for oil that allowed for an increase or decrease in the cost of transporting oil to the purchaser. A review of these regulations by the FERC in 2000 was successfully challenged on appeal by an association of oil pipelines. On remand, the FERC in February 2003 increased the index ceiling slightly, effective July 2001. FERC reviews the annual indexing factor every five years. For the five-year period commencing July 1, 2011, the annual indexing factor is equal to the Producer Price Index for Finished Goods plus 2.65%. FERC’s order setting this index factor has been appealed. We cannot predict whether or what extent the index factor may change in the future.
Intrastate oil pipeline transportation rates are subject to regulation by state regulatory commissions. The basis for intrastate oil pipeline regulation, and the degree of regulatory oversight and scrutiny given to intrastate oil pipeline rates, varies from state to state. Insofar as effective interstate and intrastate rates are equally applicable to all comparable shippers, we believe that the regulation of oil transportation rates will not affect our operations in any way that is of material difference from those of our competitors who are similarly situated.
Further, interstate and intrastate common carrier oil pipelines must provide service on a non-discriminatory basis. Under this open access standard, common carriers must offer service to all similarly situated shippers requesting service on the same terms and under the same rates. When oil pipelines operate at full capacity, access is governed by prorationing provisions set forth in the pipelines’ published tariffs. Accordingly, we believe that access to oil pipeline transportation services generally will be available to us to the same extent as to our similarly situated competitors.
Regulation of Transportation and Sales of Natural Gas
Historically, the transportation and sale for resale of natural gas in interstate commerce has been regulated by the FERC under the Natural Gas Act of 1938, or NGA, the Natural Gas Policy Act of 1978, or NGPA, and regulations issued under those statutes. In the past, the federal government has regulated the prices at which natural gas could be sold. While sales by producers of natural gas can currently be made at market prices, Congress could reenact price controls in the future. Deregulation of wellhead natural gas sales began with the enactment of the NGPA and culminated in adoption of the Natural Gas Wellhead Decontrol Act which removed all price controls affecting wellhead sales of natural gas effective January 1, 1993.
77
Table of Contents
Index to Financial Statements
FERC regulates interstate natural gas transportation rates, and terms and conditions of service, which affects the marketing of natural gas that we produce, as well as the revenues we receive for sales of our natural gas. Since 1985, the FERC has endeavored to make natural gas transportation more accessible to natural gas buyers and sellers on an open and non-discriminatory basis. The FERC has stated that open access policies are necessary to improve the competitive structure of the interstate natural gas pipeline industry and to create a regulatory framework that will put natural gas sellers into more direct contractual relations with natural gas buyers by, among other things, unbundling the sale of natural gas from the sale of transportation and storage services. Beginning in 1992, the FERC issued a series of orders, beginning with Order No. 636, to implement its open access policies. As a result, the interstate pipelines’ traditional role of providing the sale and transportation of natural gas as a single service has been eliminated and replaced by a structure under which pipelines provide transportation and storage service on an open access basis to others who buy and sell natural gas. Although the FERC’s orders do not directly regulate natural gas producers, they are intended to foster increased competition within all phases of the natural gas industry.
In 2000, the FERC issued Order No. 637 and subsequent orders, which imposed a number of additional reforms designed to enhance competition in natural gas markets. Among other things, Order No. 637 effected changes in FERC regulations relating to scheduling procedures, capacity segmentation, penalties, rights of first refusal and information reporting. On June 19, 2008, the FERC issued Order No. 712, and subsequently issued orders on rehearing and clarification. Among other things, Order No. 712 revised the FERC’s transportation pricing policy by waiving price ceilings for interstate pipeline capacity released from one shipper to another for a period of one year or less, if the release is to take effect on or before one year from the date on which the pipeline is notified of the release.
The natural gas industry historically has been very heavily regulated. Therefore, we cannot provide any assurance that the less stringent regulatory approach recently established by the FERC will continue. However, we do not believe that any action taken will affect us in a way that materially differs from the way it affects other natural gas producers.
The price at which we sell natural gas is not currently subject to federal rate regulation and, for the most part, is not subject to state regulation. However, with regard to our physical sales of these energy commodities, we are required to observe anti-market manipulation laws and related regulations enforced by the FERC and/or the CFTC. See below the discussion of “Other federal laws and regulations affecting our industry — Energy Policy Act of 2005.” Should we violate the anti-market manipulation laws and regulations, we could also be subject to related third party damage claims by, among others, sellers, royalty owners and taxing authorities. In addition, pursuant to Order No. 704, some of our operations may be required to annually report to FERC on May 1 of each year for the previous calendar year. Currently, Order No. 704 requires certain natural gas market participants to report information regarding their reporting of transactions to price index publishers and their blanket sales certificate status, as well as certain information regarding their wholesale, physical natural gas transactions for the previous calendar year depending on the volume of natural gas transacted. See below the discussion of “Other federal laws and regulations affecting our industry — FERC Market Transparency Rules.”
Gathering services, which occur upstream of jurisdictional transmission services, are regulated by the states onshore and in state waters. Although the FERC has set forth a general test for determining whether facilities perform a nonjurisdictional gathering function or a jurisdictional transmission function, the FERC’s determinations as to the classification of facilities is done on a case by case basis. To the extent that the FERC issues an order which reclassifies transmission facilities as gathering facilities, and depending on the scope of that decision, our costs of getting gas to point of sale locations may increase. State regulation of natural gas gathering facilities generally includes various safety,
78
Table of Contents
Index to Financial Statements
environmental and, in some circumstances, nondiscriminatory take requirements. Although such regulation has not generally been affirmatively applied by state agencies, natural gas gathering may receive greater regulatory scrutiny in the future.
Intrastate natural gas transportation and facilities are also subject to regulation by state regulatory agencies, and certain transportation services provided by intrastate pipelines are also regulated by FERC. The basis for intrastate regulation of natural gas transportation and the degree of regulatory oversight and scrutiny given to intrastate natural gas pipeline rates and services varies from state to state. Insofar as such regulation within a particular state will generally affect all intrastate natural gas shippers within the state on a comparable basis, we believe that the regulation of similarly situated intrastate natural gas transportation in any states in which we operate and ship natural gas on an intrastate basis will not affect our operations in any way that is of material difference from those of our competitors. Like the regulation of interstate transportation rates, the regulation of intrastate transportation rates affects the marketing of natural gas that we produce, as well as the revenues we receive for sales of our natural gas.
Regulation of Production
The production of oil and natural gas is subject to regulation under a wide range of local, state and federal statutes, rules, orders and regulations. Federal, state and local statutes and regulations require permits for drilling operations, drilling bonds and reports concerning operations. All of the states in which we own and operate properties have regulations governing conservation matters, including provisions for the unitization or pooling of oil and natural gas properties, the establishment of maximum allowable rates of production from oil and natural gas wells, the regulation of well spacing, and plugging and abandonment of wells. The effect of these regulations is to limit the amount of oil and natural gas that we can produce from our wells and to limit the number of wells or the locations at which we can drill, although we can apply for exceptions to such regulations or to have reductions in well spacing. Moreover, Louisiana imposes a production or severance tax with respect to the production and sale of oil, natural gas and natural gas liquids within its jurisdiction.
The failure to comply with these rules and regulations can result in substantial penalties. Our competitors in the oil and natural gas industry are subject to the same regulatory requirements and restrictions that affect our operations.
Other Federal Laws and Regulations Affecting Our Industry
Energy Policy Act of 2005. On August 8, 2005, President Bush signed into law the Energy Policy Act of 2005, or the EPAct 2005. EPAct 2005 is a comprehensive compilation of tax incentives, authorized appropriations for grants and guaranteed loans, and significant changes to the statutory policy that affects all segments of the energy industry. Among other matters, EPAct 2005 amends the NGA to add an anti-manipulation provision which makes it unlawful for any entity to engage in prohibited behavior to be prescribed by FERC, and furthermore provides FERC with additional civil penalty authority. EPAct 2005 provides the FERC with the power to assess civil penalties of up to $1,000,000 per day for violations of the NGA and increases the FERC’s civil penalty authority under the NGPA from $5,000 per violation per day to $1,000,000 per violation per day. The civil penalty provisions are applicable to entities that engage in the sale of natural gas for resale in interstate commerce. On January 19, 2006, FERC issued Order No. 670, a rule implementing the anti-manipulation provision of EPAct 2005, and subsequently denied rehearing. The rule makes it unlawful for any entity, directly or indirectly, in connection with the purchase or sale of natural gas subject to the jurisdiction of FERC, or the purchase or sale of transportation services subject to the jurisdiction of FERC, (1) to use or employ any device, scheme or artifice to defraud; (2) to make any untrue statement of material fact or omit to make any such statement necessary to make the statements
79
Table of Contents
Index to Financial Statements
made not misleading; or (3) to engage in any act, practice, or course of business that operates as a fraud or deceit upon any person. The new anti-manipulation rules do not apply to activities that relate only to intrastate or other non-jurisdictional sales or gathering, but do apply to activities of intrastate gas pipelines and storage companies that provide interstate services, such as service under Section 311 of the NGPA, as well as otherwise non-jurisdictional entities to the extent the activities are conducted “in connection with” gas sales, purchases or transportation subject to FERC jurisdiction, which now includes the annual reporting requirements under Order 704. The anti-manipulation rules and enhanced civil penalty authority reflect an expansion of FERC’s NGA enforcement authority. Should we fail to comply with all applicable FERC administered statutes, rules, regulations, and orders, we could be subject to substantial penalties and fines.
FERC Market Transparency Rules. On December 26, 2007, FERC issued a final rule on the annual natural gas transaction reporting requirements, as amended by subsequent orders on rehearing, or Order No. 704. Under Order No. 704, wholesale buyers and sellers of more than 2.2 million MMBtu of physical natural gas in the previous calendar year, including interstate and intrastate natural gas pipelines, natural gas gatherers, natural gas processors, natural gas marketers and natural gas producers, are required to report, on May 1 of each year beginning in 2009, aggregate volumes of natural gas purchased or sold at wholesale in the prior calendar year to the extent such transactions utilize, contribute to or may contribute to the formation of price indices. It is the responsibility of the reporting entity to determine which individual transactions should be reported based on the guidance of Order No. 704. Order No. 704 also requires market participants to indicate whether they report prices to any index publishers and, if so, whether their reporting complies with FERC’s policy statement on price reporting.
Additional proposals and proceedings that might affect the natural gas industry are pending before Congress, FERC and the courts. We cannot predict the ultimate impact of these or the above regulatory changes to our natural gas operations. We do not believe that we would be affected by any such action materially differently than similarly situated competitors.
Environmental and Occupational Health and Safety Regulation
Our exploration, development and production operations are subject to stringent federal, regional, state and local laws and regulations governing occupational health and safety, the release or disposal of materials into the environment or otherwise relating to environmental protection. These laws and regulations may, among other things, require the acquisition of permits to conduct exploration, drilling and production operations; govern the amounts and types of substances that may be released into the environment in connection with oil and gas drilling and production; limit or prohibit construction or drilling activities in sensitive areas such as wetlands, wilderness areas or areas inhabited by endangered or threatened species; impose specific health and safety criteria addressing worker protection; require investigatory and remedial actions to mitigate pollution conditions caused by our operations or attributable to former operations; and impose obligations to reclaim and abandon well sites and pits. We may be required to make significant capital and operating expenditures to comply with the requirements of these environmental laws and regulations. Failure to comply with these laws and regulations may result in the assessment of administrative, civil and criminal penalties, loss of leases, the imposition of investigatory or remedial obligations and the issuance of orders enjoining some or all of our operations in affected areas.
These laws and regulations may also restrict the rate of oil and natural gas production below the rate that would otherwise be possible. The regulatory burden on the oil and gas industry increases the cost of doing business in the industry and consequently affects profitability. The clear trend in environmental regulation is to place more restrictions and limitations on activities that may affect the environment, and thus, any changes in environmental laws and regulations or re-interpretation of
80
Table of Contents
Index to Financial Statements
enforcement policies that result in more stringent and costly well drilling, construction, completion or water management activities or waste handling, storage, transport, disposal, or remediation requirements could require us to make significant expenditures to attain and maintain compliance and may otherwise have a material adverse effect on our results of operations and financial position. We may be unable to pass on such increased compliance costs to our customers. Moreover, accidental releases or spills may occur in the course of our operations, and we cannot assure you that we will not incur significant costs and liabilities as a result of such releases or spills, including any third party claims for damage to property, natural resources or persons. While we believe that we are in substantial compliance with existing environmental laws and regulations and that continued compliance with current environmental requirements would not have a material adverse effect on our financial condition or results of operations, there is no assurance that this trend will continue in the future.
The following is a summary of the more significant existing environmental and occupational health and safety laws and regulations to which our business operations are subject and for which compliance may have a material adverse impact on our capital expenditures, results of operations or financial position.
Hazardous Substances and Wastes
The Comprehensive Environmental Response, Compensation, and Liability Act, as amended, or CERCLA, also known as the Superfund law and comparable state laws impose liability without regard to fault or the legality of the original conduct on certain classes of persons who are considered to be responsible for the release of a “hazardous substance” into the environment. These persons include current and prior owners or operators of the site where the release occurred and entities that transported or disposed or arranged for the transport or disposal of the hazardous substances found at the site. Under CERCLA, these “responsible persons” may be subject to joint and several, strict liability for the costs of cleaning up the hazardous substances that have been released into the environment, for damages to natural resources, and for the costs of certain health studies. CERCLA also authorizes the U.S. Environmental Protection Agency, or the EPA, and, in some instances, third parties to act in response to threats to the public health or the environment and to seek to recover from the responsible classes of persons the costs they incur. It is not uncommon for neighboring landowners and other third parties to file claims for personal injury and property damage allegedly caused by the release of hazardous substances or other pollutants into the environment. We generate materials in the course of our operations that may be regulated as CERCLA hazardous substances.
We also generate solid and hazardous wastes that are subject to the requirements of the Resource Conservation and Recovery Act, as amended, or “RCRA,” and comparable state statutes. RCRA imposes strict requirements on the generation, storage, treatment, transport and disposal of hazardous and non-hazardous “solid” wastes. Drilling fluids, produced water and most of the other wastes associated with the exploration, production and development of oil and natural gas are currently exempt from regulation as hazardous wastes under RCRA. However, it is possible that such wastes could in the future be re-classified as hazardous wastes. In September 2010, the Natural Resources Defense Council filed a petition with the EPA requesting the agency to reconsider this RCRA exemption. To date, the EPA has not taken any action on the petition. Any change in the RCRA exemption for such wastes could result in an increase in costs to manage and dispose of wastes, which could have a material adverse effect on our results of operation and financial position. In the course of our operations we generate petroleum hydrocarbon wastes and ordinary industrial wastes that may be regulated as RCRA hazardous wastes.
We currently own or lease, and have in the past owned or leased, properties that have been used for numerous years to explore and produce oil and natural gas. Although we have utilized operating and disposal practices that were standard in the industry at the time, hydrocarbons and wastes may
81
Table of Contents
Index to Financial Statements
have been disposed of or released on or under the properties owned or leased by us or on or under the other locations where these petroleum hydrocarbons and wastes arising from our operations have been taken for treatment or disposal. In addition, certain of these properties have been operated by third parties whose treatment and disposal or release of petroleum hydrocarbons and wastes was not under our control. These properties and wastes disposed thereon may be subject to CERCLA, RCRA and analogous state laws. Under these laws, we could be required to remove or remediate previously disposed wastes (including wastes disposed of or released by prior owners or operators), to clean up contaminated property (including contaminated groundwater) and to perform remedial operations to prevent future contamination.
Water Discharges and Hydraulic Fracturing
The Federal Water Pollution Control Act, as amended, also known as the Clean Water Act, and analogous state laws impose restrictions and strict controls regarding the discharge of pollutants into navigable waters. These laws prohibit the discharge of oil or hazardous substances in U.S. navigable waters or state waters without a permit and impose strict liability in the form of penalties for unauthorized discharge. Spill prevention, control and countermeasure requirements under federal law and some state laws require appropriate containment berms and similar structures to help prevent the contamination of navigable waters in the event of a petroleum hydrocarbon tank spill, rupture or leak. In addition, the Clean Water Act and analogous state laws require individual permits or coverage under general permits for discharges of storm water runoff from certain types of facilities.
The Oil Pollution Act of 1990, as amended, or the OPA, which amends the Clean Water Act, establishes strict liability for owners and operators of facilities that are the site of a release of oil into waters of the U.S. The OPA and its associated regulations impose a variety of requirements on responsible parties related to the prevention of oil spills and liability for damages resulting from such spills. A “responsible party” under the OPA includes owners and operators of certain onshore facilities from which a release may affect waters of the U.S. The OPA assigns joint and several, strict liability, without regard to fault, to each liable party for all containment and oil removal costs and a variety of public and private damages including, but not limited to, the costs of responding to a release of oil, natural resource damages, and economic damages suffered by persons adversely affected by an oil spill.
Oil and natural gas may be recovered in the course of our operations through the use of hydraulic fracturing combined with sophisticated drilling practices. Hydraulic fracturing involves the injection of water, sand and chemicals under pressure into the formation to fracture the surrounding rock and stimulate production. The process is typically regulated by state oil and natural gas commissions. However, the EPA recently asserted federal regulatory authority over certain hydraulic fracturing activities involving diesel under the SDWA Underground Injection Control Program and has began the process of drafting guidance documents on regulatory requirements for companies that plan to conduct hydraulic fracturing activities using diesel. In addition, legislation has been introduced before Congress, called the Fracturing Responsibility and Awareness of Chemicals Act, or “FRAC Act,” to provide for federal regulation of hydraulic fracturing and to require disclosure of the chemicals used in the fracturing process. Also, some states have adopted, and other states are considering adopting, regulations that could impose more stringent permitting, disclosure and/or well construction requirements on hydraulic fracturing operations under certain circumstances. For instance, on October 20, 2011, Louisiana adopted new regulations for hydraulic fracturing operations in the state. These new regulations require hydraulic fracturing operators to publicly disclose the volume of hydraulic fracturing fluid, the type, trade name, supplier and volume of additives, and a list of chemical compounds contained in the additive, along with its maximum concentration, subject to certain trade secret protections. However, even trade secret chemicals will have to be identified by their chemical family. A mandatory disclosure of information regarding the constituents of hydraulic fracturing fluids
82
Table of Contents
Index to Financial Statements
could make it easier for third parties opposing the hydraulic fracturing process to initiate legal proceedings based upon allegations that specific chemicals used in the fracturing process could adversely affect the environment.
In addition, there are also certain governmental reviews either underway or being proposed that focus on environmental aspects of hydraulic fracturing practices. The White House Council on Environmental Quality is coordinating an administration-wide review of hydraulic fracturing practices, and a committee of the United States House of Representatives has conducted an investigation of hydraulic fracturing practices. Furthermore, a number of federal agencies are analyzing, or have been requested to review, a variety of environmental issues associated with hydraulic fracturing. The EPA has commenced a study of the potential environmental effects of hydraulic fracturing on drinking water and groundwater, with initial results expected to be available by late 2012 and final results by 2014. In addition, the U.S. Department of Energy is conducting an investigation into practices the agency could recommend to better protect the environment from drilling using hydraulic fracturing completion methods. Also, the U.S. Department of the Interior is considering disclosure requirements or other mandates for hydraulic fracturing on federal lands. Only recently, certain members of the Congress have called upon the U.S. Government Accountability Office to investigate how hydraulic fracturing might adversely affect water resources, the SEC to investigate the natural gas industry and any possible misleading of investors or the public regarding the economic feasibility of pursuing natural gas deposits in shales by means of hydraulic fracturing, and the U.S. Energy Information Administration to provide a better understanding of that agency’s estimates regarding natural gas reserves, including reserves from shale formations, as well as uncertainties associated with those estimates. These on-going or proposed studies, depending on their degree of pursuit and any meaningful results obtained, could spur initiatives to further regulate hydraulic fracturing under the Safe Drinking Water Act or otherwise. If new laws or regulations that significantly restrict hydraulic fracturing are adopted, such laws could make it more difficult or costly for us to perform fracturing to stimulate production from tight formations. In addition, if hydraulic fracturing becomes regulated at the federal level as a result of federal legislation or regulatory initiatives by the EPA or other federal agencies, our fracturing activities could become subject to additional permitting requirements and attendant permitting delays as well as potential increases in costs. Restrictions on hydraulic fracturing could also reduce the amount of oil and natural gas that we are ultimately able to produce from our reserves.
Air Emissions
The Clean Air Act, as amended, and comparable state laws and regulations restrict the emission of air pollutants from many sources and also impose various monitoring and reporting requirements. These laws and regulations may require us to obtain pre-approval for the construction or modification of certain projects or facilities expected to produce or significantly increase air emissions, obtain and strictly comply with stringent air permit requirements or utilize specific equipment or technologies to control emissions. Obtaining permits has the potential to delay the development of oil and natural gas projects. We may also be required to incur certain capital expenditures in the next few years for air pollution control equipment or other air emissions-related issues; however, we do not believe that such requirements will have a material adverse effect on our operations.
For example, on July 28, 2011, the EPA proposed rules that would establish new air emission controls for oil and natural gas production and natural gas processing operations. Specifically, EPA’s proposed rule package includes New Source Performance Standards to address emissions of sulfur dioxide and volatile organic compounds, and a separate set of emission standards to address hazardous air pollutants frequently associated with oil and natural gas production and processing activities. Among other things, these standards would require the application of reduced emission completion techniques, referred to as “green completions,” for completion of newly drilled and fractured wells in addition to existing wells that are refractured. The proposed rules also would establish specific
83
Table of Contents
Index to Financial Statements
requirements regarding emissions from compressors, dehydrators, storage tanks and other production equipment in addition to leak detection requirements for natural gas processing plants. The EPA will receive public comment and hold hearings regarding the proposed rules and must take final action on them by February 28, 2012. If finalized, these rules could require a number of modifications to our operations including the installation of new equipment, which may result in significant capital expenditures and operating costs.
Climate Change
In December 2009, the EPA determined that emissions of carbon dioxide, methane and other greenhouse gases, or GHGs, present an endangerment to public health and the environment because emissions of such gases are, according to the EPA, contributing to warming of the earth’s atmosphere and other climatic changes. Based on its findings, the EPA has begun adopting and implementing regulations to restrict emissions of GHGs under existing provisions of the federal Clean Air Act including one regulation that requires a reduction in emissions of GHGs from motor vehicles and another that regulates emissions of GHGs from certain large stationary sources, effective January 2, 2011. The EPA has also adopted rules requiring the reporting of GHG emissions from specified large GHG emission sources in the United States, including petroleum refineries, on an annual basis, beginning in 2011 for emissions occurring in 2010, as well as certain onshore and offshore oil and natural gas production facilities on an annual basis, beginning in 2012 for emissions occurring in 2011.
In addition, the U.S. Congress has from time to time considered adopting legislation to reduce emissions of GHGs and almost one-half of the states have already taken legal measures to reduce emissions of GHGs primarily through the planned development of GHG emission inventories and/or regional GHG cap and trade programs. Most of these cap and trade programs work by requiring major sources of emissions to acquire and surrender emission allowances. The number of allowances available for purchase is reduced each year in an effort to achieve the overall GHG emission reduction goal. The adoption of legislation or regulatory programs to reduce emissions of GHGs could require us to incur increased operating costs, such as costs to purchase and operate emissions control systems, to acquire emissions allowances or comply with new regulatory or reporting requirements. Any such legislation or regulatory programs could also increase the cost of consuming, and thereby reduce demand for, the oil and natural gas we produce. Consequently, legislation and regulatory programs to reduce emissions of GHGs could have an adverse effect on our business, financial condition and results of operations. Finally, it should be noted that some scientists have concluded that increasing concentrations of GHG in the Earth’s atmosphere may produce climate changes that have significant physical effects, such as increased frequency and severity of storms, droughts, and floods and other climatic events. If any such effects were to occur, they could have an adverse effect on our financial condition and results of operations.
Endangered Species Act
The federal Endangered Species Act, as amended, or the ESA, restricts activities that may affect endangered and threatened species or their habitats. While some of our facilities may be located in areas that are designated as habitat for endangered or threatened species, we believe that we are in substantial compliance with the ESA. However, the designation of previously unidentified endangered or threatened species could cause us to incur additional costs or become subject to operating restrictions or bans in the affected areas.
Employee Health and Safety
We are subject to a number of federal and state laws and regulations, including the federal Occupational Safety and Health Act, as amended, the OSHA, and comparable state statutes, whose
84
Table of Contents
Index to Financial Statements
purpose is to protect the health and safety of workers. In addition, the OSHA hazard communication standard, the EPA community right-to-know regulations under Title III of the federal Superfund Amendment and Reauthorization Act and comparable state statutes require that information be maintained concerning hazardous materials used or produced in our operations and that this information be provided to employees, state and local government authorities and citizens. We believe that we are in substantial compliance with all applicable laws and regulations relating to worker health and safety.
Legal Proceedings
We are a defendant in an action brought by Clovelly Oil Company, or the plaintiff, in the 13th Judicial District Court in Louisiana in May 2009. The plaintiff alleges that we are subject to an unrecorded Joint Operating Agreement, or JOA, dated July 16, 1972, as a result of our 2007 purchase of a 43.75% working interest in certain acreage, and accordingly, that the plaintiff is entitled to 56.25% of our 242.28-acre lease in the Pine Prairie area. We were not a party to the JOA, and we believe that we are protected by the Louisiana Public Records Doctrine, which holds that instruments involving real property are without effect as to third parties, even if the party knew of the instrument, unless the instrument is filed of record in the appropriate mortgage or conveyance records of the parish in which such property is located.
We made a motion for summary judgment on all of the plaintiff’s claims and the district court granted that motion on August 14, 2009. The plaintiff appealed the district court’s decision to the Louisiana Third Circuit Court of Appeal, and on April 7, 2010, the Third Circuit Court of Appeal reversed and remanded the case back to the district court for trial. On August 9, 2010, the plaintiff amended its original petition to add Wells Fargo Bank, National Association, which holds a mortgage on the acreage, as a defendant.
In December 2010, we filed a Motion for Partial Summary Judgment asking the Court to declare that the JOA does not apply to any new leases acquired after July 16, 1972 that are not extension or renewal leases.
On September 27, 2011, the 13th Judicial District Court in Louisiana granted our motion for partial summary judgment and noted that the JOA does not apply to any new leases acquired after July 16, 1972 which are not extension or renewal leases. The district court also granted a motion for summary judgment filed by Wells Fargo Bank, National Association asserting that, as a mortgage holder of a mortgage covering the applicable lease, Wells Fargo Bank, National Association is protected by the Public Records Doctrine. On October 17, 2011, the plaintiff filed an appeal to the Third Circuit Court of Appeals.
In addition to the litigation and matters noted above, we are from time to time subject to, and are presently involved in, litigation or other legal proceedings arising out of the ordinary course of business. None of these legal proceedings are expected to have a material adverse effect on our financial condition, results of operations or cash flow. With respect to these proceedings and the litigation and claims described in the preceding paragraphs, our management believes that we will either prevail, have adequate insurance coverage or have established appropriate reserves to cover potential liabilities. Any costs that management estimates may be paid related to these proceedings or claims are accrued when the liability is considered probable and the amount can be reasonably estimated. There can be no assurance, however, as to the ultimate outcome of any of these matters, and if all or substantially all of these legal proceedings were to be determined adversely to us, there could be a material adverse effect on our financial condition, results of operations or cash flow.
85
Table of Contents
Index to Financial Statements
Employees
As of September 30, 2011, we employed 51 people, including 19 technical (geosciences, engineering, land), 17 field operations, 11 corporate (finance, planning, business development, legal, office management), and 4 management. Our future success will depend partially on our ability to attract, retain and motivate qualified personnel. We are not a party to any collective bargaining agreements and have not experienced any strikes or work stoppages. We consider our relations with our employees to be satisfactory. From time to time we utilize the services of independent contractors to perform various field and other services.
Offices
We currently lease approximately 20,466 square feet of office space in Houston, Texas at 4400 Post Oak Parkway, Suite 1900, where our principal offices are located. The lease for our Houston office expires in March 2014. We also lease two field offices in Louisiana. We believe that our facilities are adequate for our current operations and that additional leased space can be obtained if needed.
86
Table of Contents
Index to Financial Statements
Directors and Executive Officers
The following table sets forth information regarding our directors and executive officers as of September 30, 2011.
| Name |
Age | Title | ||||
| Stephen J. McDaniel |
50 | Chairman of our Board of Directors | ||||
| John A. Crum |
59 | President, Chief Executive Officer and Director | ||||
| Alex T. Krueger |
37 | Director | ||||
| Anastasia Deulina |
38 | Director | ||||
| John Mogford |
58 | Director | ||||
| Director | ||||||
| Director | ||||||
| Stephen C. Pugh |
52 | Executive Vice President and Chief Operating Officer | ||||
| Thomas L. Mitchell |
51 | Executive Vice President and Chief Financial Officer | ||||
| John P. Foley |
47 | Corporate Counsel and Secretary | ||||
Set forth below is a description of the backgrounds of our directors and executive officers.
Stephen J. McDaniel has served as Chairman of our board of directors since March 2011. He was our President and Chief Executive Officer from August 2008 until March 2011. Prior to that, he served as our President and Treasurer. He is also a member of the board of directors of Ultra Petroleum, a position he has held since 2006, and currently chairs the audit committee of that company. Mr. McDaniel’s previous experience included approximately ten years of oil and gas investment banking, the majority of which was with Merrill Lynch. He held the position of Managing Director at Merrill Lynch when he left the banking industry in 2004 to focus his full time efforts on Midstates Petroleum. He began his career with Conoco in 1983 and held various positions in Conoco’s engineering, operations, and business development organizations. Because of his extensive knowledge of our operations and of the oil and gas industry, and his energy investment banking and engineering experience, including his financial management expertise, we believe Mr. McDaniel is a valuable member of the Board of Directors.
John A. Crum has served as our President and Chief Executive Officer and as a member of our board of directors since March 2011. Mr. Crum was the co-chief operating officer and president — North America of Apache Corp. from February 2009 through March 2011. He previously served in various positions at Apache Corp., including as the executive vice president and president of Apache Canada Ltd. from June 2007 through February 2009, executive vice president and managing director — Apache North Sea from April 2003 through June 2007, executive vice president Apache Corp- Eurasia and new ventures from May 2000 through April 2003, and as regional vice president at Apache Corp. in Australia from June 1995 through May 2000. Mr. Crum has also served in executive and management roles with Aquila Energy Resources Corporation, Pacific Enterprises Oil Company, Southland Royalty Company and Conoco. We believe Mr. Crum’s extensive knowledge of the energy industry and expertise in exploration and production operations provides invaluable expertise and leadership to the board.
Alex T. Krueger has served as a member of our board of directors since October 2009. Mr. Krueger joined First Reserve in June 1999 and is one of three Managing Directors overseeing the firm’s buyout funds. Mr. Krueger’s responsibilities include investment origination, structuring, execution, monitoring and exit strategy. He is involved in investment activities in all areas of the worldwide energy
87
Table of Contents
Index to Financial Statements
industry, with particular expertise in the natural resources sector. Prior to joining First Reserve, Mr. Krueger worked in the Energy group of Donaldson, Lufkin & Jenrette in Houston. Mr. Krueger holds two B.S. degrees from the University of Pennsylvania, one in Chemical Engineering and one in Finance and Statistics from the Wharton School. We believe Mr. Krueger’s extensive energy industry background, particularly his expertise in corporate strategy and business execution, brings important experience and skill to the board.
Anastasia Deulina has served as a member of our board of directors since August 2008. Ms. Deulina is a Director with First Reserve and joined the firm in September 2007. Ms. Deulina’s responsibilities range from deal origination and structuring to due diligence, execution and monitoring, with particular focus on the reserve sectors of the energy industry. Prior to joining First Reserve, Ms. Deulina served as a Vice President at Goldman Sachs from June 2005 through August 2007. From August 2000 to May 2005, she served as a Vice President at Merrill Lynch. Prior to joining Merrill Lynch, Ms. Deulina held positions with the World Bank Moscow Resident Mission and the All-Russian Foreign Trade Academy in Moscow. Ms. Deulina holds a Bachelor of Science in Economics and Management from the Moscow State Geological Prospecting Academy and an MA degree in Energy & Mineral Resources from the University of Texas. We believe Ms. Deulina’s extensive energy industry background, particularly her expertise in mergers and acquisitions, brings important experience and skill to the board.
John Mogford has served as a member of our board of directors since March 2011. Mr. Mogford is an operating partner of First Reserve. As such, he provides direct operational support and guidance to First Reserve portfolio company executives. Mr. Mogford also advices Nomura on the energy sector. Prior to his retirement from BP plc in 2009, Mr. Mogford worked at BP for over 30 years and held numerous positions, in all parts of BP’s business including Executive Vice President and Chief Operating Officer of BP’s Refining division. Mr. Mogford holds a Bachelors of Engineering from Sheffield University in the UK. We believe Mr. Mogford’s extensive energy industry background, particularly his expertise in exploration and production operations, brings important experience and skill to the board.
Stephen C. Pugh has served as our Executive Vice President and Chief Operating Officer since September 2011. Mr. Pugh was previously a senior vice president and regional manager of the ArkLaTex Region at SM Energy Co. from July 2007 through August 2011. Mr. Pugh was a managing director for Scotia Waterous, a global leader in oil and gas merger and acquisition advisory services from July 2006 to July 2007. Mr. Pugh was the general manager, engineering and operations — Gulf Coast for Burlington Resources from May 2004 to June 2006 and vice president — acquisitions and divestitures for Burlington Resources Canada from May 2000 to May 2004.
Thomas L. Mitchell has served as our Executive Vice President and Chief Financial Officer since October 2011. Mr. Mitchell was previously the Senior Vice President, Chief Financial Officer, Treasurer and Controller of Noble Corporation from November 2006 through September 2011. Mr. Mitchell served as Vice President and Controller of Apache Corporation, an oil and gas exploration and production company, from 1997 through October 2006. From 1996 to 1997, he served as Controller of Apache, and from 1989 to 1996 he served Apache in various positions including Assistant to Vice President Production and Director Natural Gas Marketing. Prior to joining Apache, Mr. Mitchell spent seven years with Arthur Andersen & Co. where he practiced as a Certified Public Accountant, managing clients in the oil and gas, banking, manufacturing and government contracting industries.
John P. Foley has served as our Corporate Counsel and Secretary since August 2003. Prior to joining us, Mr. Foley was a financial advisor with Morgan Stanley Dean Witter from April 1995 through March 2001 and Prudential Securities from March 2001 through December 2002. In 1992 Mr. Foley was a co-founder of a law firm headquartered in Arlington, Texas. Mr. Foley began his career in Conoco’s Land Department in 1990.
88
Table of Contents
Index to Financial Statements
Board of Directors
Our board of directors currently consists of five members, including our Chief Executive Officer, and three members designated by First Reserve, which controls a majority of the voting power of our outstanding common stock.
In evaluating director candidates, we will assess whether a candidate possesses the integrity, judgment, knowledge, experience, skills and expertise that are likely to enhance the board’s ability to manage and direct our affairs and business, including, when applicable, to enhance the ability of committees of the board to fulfill their duties.
Director Independence
Our board of directors currently consists of five members, including our Chief Executive Officer. The board of directors reviewed the independence of our directors using the independence standards of the NYSE and, based on this review, determined that , and are independent within the meaning of the NYSE listing standards currently in effect and Rule 10A-3 of the Exchange Act.
Committees of our Board of Directors
Following the completion of this offering, we intend to elect to be treated as a “controlled company” as that term is set forth in Section 303A of the NYSE Listed Company Manual because more than 50% of our voting power is held by First Reserve. Under the NYSE rules, a “controlled company” may elect not to comply with certain NYSE corporate governance requirements, including (1) the requirement that a majority of the board of directors consist of independent directors, (2) the requirement that the nominating and corporate governance committee be composed entirely of independent directors with a written charter addressing the committee’s purpose and responsibilities, (3) the requirement that the compensation committee be composed entirely of independent directors with a written charter addressing the committee’s purpose and responsibilities and (4) the requirement for an annual performance evaluation of the nominating and corporate governance and compensation committees. While these requirements will not apply to us as long as we remain a “controlled company,” our board of directors will nonetheless consist of a majority of independent directors and our nominating and governance committee and compensation committee will consist entirely of independent directors within the meaning of the NYSE listing standards currently in effect. Prior to the consummation of this offering, our nominating and governance committee and compensation committee will each have a written charter addressing such committee’s purpose and responsibilities in accordance with NYSE listing standards.
Our board of directors will have an audit committee, compensation committee and nominating and governance committee, and may have such other committees as the board of directors shall determine from time to time. Each of the standing committees of the board of directors has the composition and responsibilities described below.
Audit committee. The members of our audit committee are , and , each of whom our board of directors has determined is financially literate. is the Chairman of this committee. Our board of directors has determined that is an audit committee financial expert. We will rely on the phase-in rules of the SEC and NYSE with respect to the independence of our audit committee. These rules require us to have an audit committee that has one member that is independent by the date that our common stock is first traded on the NYSE, a majority of members that are independent within 90 days of the effectiveness of the registration statement of which this prospectus forms a part (the “effective date”) and all members that are independent within one year of the effective date. Our audit committee is authorized to:
| • | approve and retain the independent registered public accounting firm to conduct the annual audit of our books and records; |
89
Table of Contents
Index to Financial Statements
| • | review the independence and performance of the independent registered public accounting firm; |
| • | review the proposed scope and results of the audit; |
| • | review and pre-approve the independent registered public accounting firm’s audit and non-audit services rendered; |
| • | approve the audit fees to be paid; |
| • | review accounting and financial controls with the independent registered public accounting firm and our financial and accounting staff; |
| • | review and approve transactions between us and our directors, officers and affiliates; |
| • | recognize and prevent prohibited non-audit services; |
| • | establish procedures for complaints received by us regarding accounting matters; |
| • | oversee internal audit functions; |
| • | oversee our compliance with legal and regulatory requirements; and |
| • | prepare the report of the audit committee that SEC rules require to be included in our annual meeting proxy statement. |
Compensation committee. The members of our compensation committee are , and is the Chairman of this committee. Our compensation committee is authorized to:
| • | review and recommend the compensation arrangements for management, including the compensation for our Chief Executive Officer; |
| • | establish and review general compensation policies with the objective to attract and retain superior talent, to reward individual performance and to achieve our financial goals; |
| • | administer our incentive compensation and benefits plans, including our stock incentive plan; and |
| • | prepare the report of the compensation committee that SEC rules require to be included in our annual meeting proxy statement. |
Nominating and corporate governance committee. The members of our nominating and corporate governance committee are , and is the Chairman of this committee. Our nominating and corporate governance committee is authorized to:
| • | identify, evaluate and recommend qualified nominees for election to the board of directors; |
| • | develop, recommend to the board of directors and oversee a set of corporate governance principles applicable to our company; |
| • | oversee the evaluation of the board of directors and management; and |
| • | develop and maintain a management succession plan. |
Compensation Committee Interlocks and Insider Participation
None of our officers or employees will be members of the compensation committee. None of our executive officers serve on the board of directors or compensation committee of a company that has an executive officer that serves on our board or compensation committee. No member of our board is an executive officer of a company in which one of our executive officers serves as a member of the board of directors or compensation committee of that company.
90
Table of Contents
Index to Financial Statements
To the extent any members of our compensation committee and affiliates of theirs have participated in transactions with us, a description of those transactions is described in “Certain Relationships and Related Person Transactions.”
Code of Business Conduct and Ethics
Our board of directors will adopt a code of business conduct and ethics applicable to our employees, directors and officers, in accordance with applicable U.S. federal securities laws and the corporate governance rules of the NYSE. Any waiver of this code may be made only by our board of directors and will be promptly disclosed as required by applicable U.S. federal securities laws and the corporate governance rules of the NYSE.
Corporate Governance Guidelines
Our board of directors will adopt corporate governance guidelines in accordance with the corporate governance rules of the NYSE.
91
Table of Contents
Index to Financial Statements
COMPENSATION DISCUSSION AND ANALYSIS
The following discussion and analysis of compensation arrangements of our named executive officers for 2011 (as set forth in the Summary Compensation Table below) should be read together with the compensation tables and related disclosures set forth below. This discussion contains forward-looking statements that are based on our current plans, considerations, expectations and determinations regarding future compensation programs. Actual compensation programs that we adopt may differ materially from the currently planned programs summarized in this discussion.
Compensation Discussion and Analysis
Our executive compensation program is overseen by our Chief Executive Officer and our board of directors. The board of directors has ultimate responsibility for making decisions relating to the compensation of our Named Executive Officers. Our Chief Executive Officer reviews compensation for all of our Named Executive Officers other than himself, and makes compensation recommendations to the board of directors. The board of directors then evaluates the Chief Executive Officer’s recommendations and conducts its own independent review and evaluation of the Chief Executive Officer’s compensation and makes final decisions with respect to compensation for all Named Executive Officers based on several factors, including individual performance, business results and general information related to compensation at other private companies.
While our board of directors does not currently have a compensation committee, it plans to implement such a committee prior to the effective date of this offering. Once a compensation committee is in place we expect it to take over primary responsibility for overseeing our executive compensation program.
The purpose of this Compensation Discussion and Analysis is to explain our philosophy used to determine the compensation program for the executives serving as our Chief Executive Officer and Chief Financial Officer during 2011 as well as our three other most highly compensated executive officers, or the “Named Executive Officers,” and to discuss why and how the 2011 compensation package for these executives was implemented. Because we were not formed until October 25, 2011, we did not have executive officers prior to that date. However, because the executive officers of our predecessor are now our executive officers, we believe that disclosure regarding our executive officers’ compensation during fiscal year 2011, as set by our predecessor, is appropriate and relevant to our own compensation philosophy. The Named Executive Officers for the fiscal year ending December 31, 2011 (the “2011 Fiscal Year”), are as follows:
| • | John A. Crum — President and Chief Executive Officer (March 2011 — Present) |
| • | Stephen J. McDaniel — Chairman of the board of directors and former President and Chief Executive Officer (served as President and Chief Executive Officer through March 2011) |
| • | Thomas L. Mitchell — Executive Vice President and Chief Financial Officer (October 2011 — Present) |
| • | Kristen N. McDaniel — former Chief Financial Officer (served as Chief Financial Officer through September 2011) |
| • | Named Executive Officer No. 1 |
| • | Named Executive Officer No. 2 |
| • | Named Executive Officer No. 3 |
Our three other most highly compensated executive officers for the 2011 fiscal year will be added to this disclosure once we are able to determine their identities based on compensation for the full year.
92
Table of Contents
Index to Financial Statements
Objectives of Our Executive Compensation Program
Historically, the objectives of our executive compensation program have been to:
| • | attract and retain talented individuals; |
| • | align the interest of our executives with those of our equity holders; and |
| • | ensure that our executives are motivated to remain with us and improve our profitability and performance during both successful and challenging times. |
These objectives are taken into consideration when creating our compensation programs, when setting each element of compensation under those programs, and when determining the proper mix of the various compensation elements for each of our Named Executive Officers.
We periodically evaluate whether our compensation programs and the levels of pay awarded under each element of compensation achieve these objectives. For example, we concluded that our decision to list our shares on a public stock exchange will change the duties and responsibilities of our executive officers and may change the group of companies with which we compete for executive talent. Accordingly, in order to ensure that the compensation package offered to our executives is competitive with our peers, our board of directors engaged Pearl Meyer & Partners (“PM&P”), an executive compensation consulting firm, in September 2011 to provide general market advice with respect to executive compensation, to review our compensation programs, and to summarize how they compare, as a general matter, to the current compensation practices utilized by companies with which we compete for executive talent. PM&P serves as our board of directors’ independent compensation consultant and has provided no services to us other than those it currently provides to the board of directors regarding executive compensation analysis. We have received the requested report from PM&P. Our Chief Executive Officer and our board of directors are currently taking the PM&P report, along with their own analysis of our compensation programs based on their past experience with us, our executives, and the industry in general, under consideration. We feel that this evaluation of our compensation programs and each of the elements of our compensation scheme is necessary to ensure that our programs continue to meet the objectives we have set in the context of becoming a publicly traded company. This review may result in substantial changes to our compensation programs, which will be disclosed as they are implemented.
Setting Executive Compensation
As a general matter, our Chief Executive Officer makes recommendations to our board of directors as to every element of compensation for each of the Named Executive Officers other than himself. While our board of directors takes the Chief Executive Officer’s recommendations under consideration, it also conducts its own independent analysis and has the final authority over the design and implementation of the compensation programs for our Named Executive Officers.
Historically, our Chief Executive Officer has made recommendations regarding the base salaries for each of the Named Executive Officers at the time they are hired. Our Chief Executive Officer also formulates a suggested annual bonus program each year and presents it to the board of directors. Finally, our Chief Executive Officer has helped to develop our equity compensation program. In each instance, the board of directors considers the Chief Executive Officer’s proposal and then makes an independent analysis and determination with respect to the compensation programs made available to and awards granted to the Named Executive Officers. In the past our Chief Executive Officer has been present during the portions of our board of directors meetings when compensation, including his own compensation, is discussed. We anticipate that our board of directors will change this practice following this offering to exclude the Chief Executive Officer from the portions of the meetings where his compensation is discussed.
93
Table of Contents
Index to Financial Statements
As noted above, at the request of our board of directors, PM&P conducted a study of our current compensation policies and individual levels of compensation for each of our Named Executive Officers. The study is currently being reviewed by our board of directors. The PM&P study compares our Named Executive Officers’ compensation packages as a whole, as well as each element of their compensation packages, to the compensation paid by companies that we believe we compete with for executive talent. The company comparison data contained in the PM&P study has been used by our board of directors to obtain a general sense for the current compensation practices prevalent in the market. Our board of directors has not used this, nor any other data, to benchmark our Named Executive Officers’ compensation against the compensation paid to executives at other companies. Our board of directors is also taking into consideration the additional duties and responsibilities associated with being the executive officer of a publicly traded company (rather than a private company) and the intensely competitive employment market for executives with the experience and expertise that we need to succeed. Prior to the consummation of this offering, the board of directors will determine which compensation programs and policies should be revised, and the extent of such revisions, in order to better achieve the objectives of our executive compensation program in our new role as a publicly traded company.
Key Components of our Compensation Policy
Our compensation and benefits programs have historically consisted of the following components, which are described in greater detail below:
| • | base salary; |
| • | annual cash bonus awards, based on both the achievement of individual performance goals and our company’s performance goals; |
| • | share-based incentive awards; |
| • | severance provisions; and |
| • | participation in broad-based health and welfare benefits. |
Base Salary
Each Named Executive Officer’s base salary is a fixed component of compensation and does not vary depending on the level of performance achieved. Base salaries are determined for each Named Executive Officer based on his or her position and responsibility. The Chief Executive Officer typically negotiates base salary levels with newly hired executive officers and then makes recommendations to our board of directors based on each candidate’s experience, potential to create value, and responsibility associated with the position. Our board of directors then takes this information, as well as information regarding the candidate’s pay at his or her current job, levels of base pay for our other executive officers, and levels of pay at other companies for which we compete for executive talent (based on their experience in the industry and a review of publicly available salary data to get a general sense for the market), and then makes a determination as to the proper base pay to set for that particular executive. Both the Chief Executive Officer and our board of directors consider the other elements of compensation being offered to the candidate when determining the appropriate level of base salary. Once approved by our board of directors, each Named Executive Officer’s base salary has historically been identified in an employment agreement entered into between us and that individual at or around the time they are hired by us.
In prior years, following consideration of all of the factors listed above, the level of each Named Executive Officer’s equity ownership in us, and levels of each of the other compensation elements provided, the Chief Executive Officer and the board of directors had determined that all of our Named
94
Table of Contents
Index to Financial Statements
Executive Officers should be paid a base salary of $200,000. In particular, the Chief Executive Officer and our board of directors historically found that this level of base salary was significant enough to provide our Named Executive Officers with financial stability, yet still left them motivated to earn other elements of compensation tied directly to our performance and their own individual performance. Further, when combined with their annual bonus opportunity and equity awards, this level of base salary was sufficient to make the full compensation package offered to the executive competitive with the compensation offered by the companies with which we compete for executive talent. In 2011, the board of directors determined that in order to remain competitive in our ability to recruit new senior executives with the skill sets necessary to manage our growing company, higher base salaries would need to be offered to such executives. Accordingly, our board of directors decided to award slightly higher base salaries to Mr. Crum and Mr. Mitchell when they joined us in 2011 than had previously been awarded to the other Named Executive Officers. This determination was based on the same factors as the determinations that were made with respect to the other Named Executive Officers; however, our board of directors found that slightly higher salaries were warranted for Mr. Crum and Mr. Mitchell because they had considerable relevant industry experience, and exceptional track records of creating value for the equity holders of the companies for which they worked.
Our Chief Executive Officer and our board of directors review the base salaries for each Named Executive Officer at the time of any promotion or significant change in job responsibilities, and in connection with each review they consider individual and company performance. Note, however, that following the completion of our board of directors’ review of our compensation programs, the base salary for each Named Executive Officer may change. The base salary for each Named Executive Officer for 2011 is reported in the succeeding Summary Compensation Table.
Bonuses
Each Named Executive Officer participates in our annual cash bonus program. The Named Executive Officers’ employment agreements provide that they may each be eligible for a cash bonus each calendar year of up to 50% of their base salaries. Because our board of directors has made annual bonuses more difficult to earn in recent years by awarding pay only for exceptional performance, our board of directors increased the Named Executive Officers’ bonus opportunity to a maximum of 100% of their base salary. The annual cash bonus program is designed to meet each of our compensation objectives. More specifically, the annual bonus program rewards executives for individual and company performance, thereby aligning the executives’ interests with those of our equity holders. Further, the program also provides the executives with the opportunity to earn additional compensation, thereby making our total compensation package more competitive.
Each year, when determining the amount of each Named Executive Officer’s annual cash bonus, our board of directors takes into consideration (i) the individual performance of each Named Executive Officer, (ii) our overall performance, and (iii) our performance in a variety of predetermined areas that our board of directors would like our employees to focus on (“Key Performance Indicators”). While our board of directors takes all of these factors into consideration, it has full discretion to award any level of annual bonus it sees fit, including awarding no bonus, to each of the Named Executive Officers.
The elements of individual performance that are typically taken into account when our board of directors assesses the Named Executive Officers’ individual performance for the year include: initiative, teamwork, leadership, creativity, “can-do” attitude, identification and quantification of high economic return oil and gas reserve targets, value-creating operational efficiency and production improvements, and successfully generating innovative problem-solving solutions and effectively implementing those initiatives.
At the beginning of each year, our Chief Executive Officer develops a proposal for the Key Performance Indicators that will be taken into consideration when our board of directors awards
95
Table of Contents
Index to Financial Statements
bonuses for that year. The Chief Executive Officer then presents his proposed Key Performance Indicators to our board of directors, which independently analyzes the proposed Key Performance Indicators, makes modifications as it sees fit, and then approves a final set of performance indicators for the year. The Key Performance Indicators are then presented to the Named Executive Officers so that they fully understand the program and the elements of company performance that will be taken into consideration by the board of directors when setting annual bonuses for that particular year. The Key Performance Indicators for 2011 are as follows: (i) safety and environmental, (ii) production levels, (iii) finding and developing costs, and (iv) operating costs.
Following the conclusion of our board of directors’ review of our compensation policies, our annual bonus program may significantly change. The annual cash bonuses awarded to each of the Named Executive Officers for 2011 are enumerated in the Summary Compensation Table below.
Equity Investment and Share-Based Awards
Upon joining us, each Named Executive Officer is asked to make a significant investment in us at fair market value. We feel that these investments not only align the Named Executive Officers’ interests with those of our equity holders but also ensure that our executives are motivated to remain with us and improve our profitability and performance during both successful and challenging times. These investments provide a significant upside potential if we succeed, as well as downside risk if we do not. We believe it is this downside risk that differentiates the investment we require of our Named Executive Officers from the purely upside potential associated with the compensatory share-based awards we grant to our executives. We believe any potential risk to us associated with our Named Executive Officers’ exposure to loss with respect to their holdings in us is mitigated by the base salary, annual cash bonus, and additional share-based awards that they receive. In terms of investment, Mr. McDaniel, Mrs. McDaniel, Mr. Crum and Mr. Mitchell have each made a capital investment in our company at fair market value and consequently own common stock in us or one of our affiliates. Mr. and Mrs. McDaniel made their capital investment prior to 2011. Mr. Crum made his capital investment in March 2011. Mr. Mitchell made his capital investment in September 2011.
To further align the interests of the Named Executive Officers with those of our equity holders, to promote retention, and to further motivate our Named Executive Officers to help us reach our profitability goals, we have had a historic practice of granting incentive units and restricted stock to our Named Executive Officers, which we view as compensation for their continued services. The awards of incentive units and restricted stock have typically been made soon after the Named Executive Officer’s capital investment.
Restricted stock is simply common stock that has restrictions on sale and transfer of the shares until it is vested. The grants of restricted stock vest in full on the fifth anniversary of grant. If one of the Named Executive Officers terminates his or her employment prior to vesting of the restricted stock then those restricted stock shall be forfeited; provided that no such forfeiture shall occur and the restricted shock shall become fully vested upon the termination of the Named Executive Officer’s employment by the executive for cause or by us without cause (in each case, as defined in the restricted stock agreement). If a “Change in Control” (as defined below) occurs prior to the end of the restricted period specified in the restricted stock agreement, all restricted stock granted to the Named Executive Officer shall become fully vested upon the “Change in Control.” Upon the vesting of the shares of restricted stock, the restrictions applicable to such shares of restricted stock shall terminate, and as soon as practicable thereafter, a stock certificate for the number of such shares shall be delivered to the executive. As a result of negotiations between us and Mr. Crum prior to his employment with us, Mr. Crum was granted restricted stock of one of our affiliates in March 2011 in connection with his hiring. We believe the restricted stock grant was a necessary and instrumental part of the overall compensation package we offered to Mr. Crum in order to attract him to join our company as Chief Executive Officer. At present, Mr. Crum is the only Named Executive Officer who holds restricted stock.
96
Table of Contents
Index to Financial Statements
Historically, we have offered incentive units to our Named Executive Officers through units in Midstates Incentive Holdings LLC, which owns incentive units in us. These incentive units represent equity interests in us; however, unlike common stock, incentive units have no value for tax purposes on the date of grant. Instead, they are designed to gain value only after our company has realized a certain level of growth and return to those individuals who hold certain other classes of our equity. If a holder of units voluntarily ceases to provide us with services or is terminated by us for cause (as defined in the applicable grant agreement) then he or she shall forfeit those awards for no consideration. If a Named Executive Officer ceases to provide services to us for any other reason then we shall have a right to purchase the units within 90 days of their termination of employment. Mr. McDaniel, Mrs. McDaniel, Mr. Crum and Mr. Mitchell currently hold incentive units through Midstates Incentive Holdings LLC. Mr. McDaniel and Mrs. McDaniel were awarded their units prior to fiscal year 2011. Mr. Crum was awarded his units in March 2011, while Mr. Mitchell was awarded his units in September 2011.
In connection with the offering, (i) all restricted stock previously held by the Named Executive Officers in us or our affiliates will vest according to its terms and will be converted into common stock in us and all common stock previously held by the Named Executive Officers in us or our affiliates will be converted into common stock in us. In addition, the incentive units will remain outstanding. Please see “Corporate Reorganization.”
Severance Benefits
Each of the Named Executive Officers has entered into the same form of employment agreement with us (the “Employment Agreement”). The Employment Agreement has an initial term of one year, with automatic extensions for additional one-year periods unless either party provides at least 30 days advance written notice of its intent to terminate the employment relationship as of the end of the term. If any of the Named Executive Officers are terminated by us for “Employer Cause” (as defined below) or voluntarily by the executive without “Employee Cause” (as defined below) then (i) the executive shall be entitled to receive only any unpaid base salary or benefits (other than bonus) accrued and owed to the executive as of the date of termination (the “Accrued Obligations”), and (ii) we have a right to repurchase all of the equity purchased by the Named Executive Officer from us at the lower of the cost to the executive and the fair market value on the date of termination.
If a Named Executive Officer is terminated by us without Employer Cause, by the executive with Employee Cause, if the executive becomes permanently disabled, or if we choose not to renew the Employment Agreement, then the Named Executive Officer shall receive (a) the Accrued Obligations and any unpaid bonus earned by the executive prior to the termination date (as determined in the board of directors’ discretion), (b) continued payments of the executive’s base salary in effect on the date of termination for a period of six months following the termination, and (c) continued insurance and benefits at the same level that would be provided to the executive had his or her employment with us not terminated, provided at our expense for a period of six months following the termination (the “Severance Payments”). Note, that we have no further obligation to continue the Severance Payments, and the Named Executive Officer will be required to repay any Severance Payments already made if the executive violates his or her two-year non-compete and non-solicitation obligation. If a Named Executive Officer dies, then the executive’s estate will be entitled to the Accrued Obligations as well as the continued base salary payments described in (b) of this paragraph. Additionally, under each termination described in this paragraph, we have a right to repurchase all of the equity purchased by the Named Executive Officer at fair market value on the date of termination. Finally, as a condition to payment of the Severance Payments we may require a Named Executive Officer to execute a valid release of claims agreement; in the event the executive violates the terms of such release, the executive may forfeit all rights to the Severance Payments.
97
Table of Contents
Index to Financial Statements
Notwithstanding anything above, if within approximately 90 days following a termination of employment of a Named Executive Officer we discover that grounds existed as of the termination date for a termination for Employer Cause, then such termination will be deemed to be a termination for Employer Cause and the executive will not be entitled to further payment of the Severance Payments. If, under these circumstances, part or all of the Severance Payments have already been delivered to a Named Executive Officer, then that executive will have to repay any monies or benefits received that he or she would have no right to under a termination for Employer Cause.
As utilized in the Employment Agreement, “Employee Cause” means a termination of employment by the executive because of (i) a substantial and continuing diminution in the nature of the executive’s responsibilities, (ii) the relocation of the executive’s primary office to a location outside of the greater Houston, Texas area, or (iii) a material breach by us of any material provision of the Employment Agreement.
As utilized in the Employment Agreement, “Employer Cause” means (a) the executive’s continued failure to follow reasonable directions of the board of directors or the Chief Executive Officer (provided the executive does not, in good faith, believe that the directions are illegal), (b) repeated intentional breaches by the executive (including breaches due to inaction) of one or more material duties of the executive or intentional failure to follow reasonable directions of the board of directors or the Chief Executive Officer, (c) the executive’s conviction of, or the entering by the executive of a plea of guilty or nolo contendere to, a felony charge or a crime involving moral turpitude, (d) any misconduct by the executive that has caused or is reasonably likely to cause a material financial loss to us, (e) a material violation of any provision of any agreement between the executive, us, or a related entity, or any other agreement or code to which the executive is subject, (f) receipt by the executive of any bribe, (g) the use of illegal drugs, the persistent excessive use of alcohol or engaging in any other activity that materially impairs the executive’s ability to perform his duties hereunder or results in conduct bringing us or any of our affiliates public disgrace or disrepute, (h) excessive absenteeism by the executive, or (i) any act of gross negligence or any intentional misreporting of financial information by the executive to us.
For information regarding the treatment of equity on a termination of employment please see “Executive Compensation — Potential Payments Upon Change of Control”.
As part of their overall review of our compensation policies and programs, the board of directors is also reviewing the employment agreements currently in place between us and the Named Executive Officers, which may significantly change following the offering.
Other Benefits
All of our regular scheduled full-time employees, including our Named Executive Officers, receive the same health and welfare benefits. The benefits include health insurance, dental insurance, life and accidental death and dismemberment insurance, as well as long term disability insurance. We do not currently offer a 401(k) or any other retirement or pension program as we feel that the compensation package offered to our Named Executive Officers provides compensation and incentives sufficient to attract and retain excellent talent without the addition of this benefit. However, during it’s ongoing review of our compensation programs, the board of directors may consider the addition of a retirement program (such as a 401(k) plan) to the compensation package currently offered to our Named Executive Officers to ensure that our overall compensation package continues to meet the objectives we have set in our new role as a publicly traded company.
Other Compensation Items
The board of directors will consider the tax and accounting treatment of our compensatory plans and agreements during its review of our executive compensation program.
98
Table of Contents
Index to Financial Statements
Risk Assessment
Our board of directors believes that our compensation policies do not encourage excessive and unnecessary risk-taking, and that the level of risk that they do encourage is not reasonably likely to have a material adverse effect on us.
Our compensation philosophy and culture support the use of base salary, annual incentive-based compensation, and equity compensation. We believe that the following specific factors, in particular, reduce the likelihood of excessive risk-taking:
| • | Our overall compensation levels are competitive with the market. |
| • | Our compensation mix is balanced among (i) fixed components like salary and benefits, (ii) annual incentives that reward our overall financial performance, operational measures and individual performance, and (iii) share-based awards, primarily consisting of profits interests and restricted stock. |
| • | Our executives’ equity ownership and compensatory equity awards are tied to how our company performs over a period of multiple years, with restricted stock, for example, vesting fully within five years. This minimizes the benefit of a temporary spike in stock price. |
In summary, although a portion of the compensation provided to Named Executive Officers is performance-based, we believe our compensation programs do not encourage excessive and unnecessary risk taking by executive officers (or other employees) because these programs are designed to encourage employees to remain focused on both our short- and long-term operational and financial goals. We set performance goals that we believe are reasonable in light of our past performance and market conditions.
Facets of compensation that incentivize and mitigate risk taking will be one of many factors considered by the board of directors during its review of our current compensation programs and during the design of new programs. The board of directors will ensure that any changes made to our compensation programs do not encourage excessive and unnecessary risk taking and that any level of risk that they do encourage is not reasonably likely to have a material adverse effect on us.
99
Table of Contents
Index to Financial Statements
Summary Compensation Table
The table below sets forth the annual compensation earned during the 2011 Fiscal Year by our “Named Executive Officers,” as of December 31, 2011:
| Name and Principal Position |
Year | Salary ($) |
Bonus ($) |
Stock Awards ($) |
Option ($) |
Non-Equity Plan ($) |
Change in And ($) |
All Other ($) |
Total ($) | |||||||||||
| John A. Crum |
2011 | |||||||||||||||||||
| President and Chief Executive Officer |
||||||||||||||||||||
| Stephen J. McDaniel |
2011 | |||||||||||||||||||
| Chairman of the board of directors and former President and Chief Executive Officer |
||||||||||||||||||||
| Thomas L. Mitchell |
2011 | |||||||||||||||||||
| Executive Vice President and Chief Financial Officer |
||||||||||||||||||||
| Kristen N. McDaniel |
2011 | |||||||||||||||||||
| Former Chief Financial Officer |
||||||||||||||||||||
| Named Executive Officer |
2011 | |||||||||||||||||||
| Named Executive Officer |
2011 | |||||||||||||||||||
| Named Executive Officer |
2011 | |||||||||||||||||||
100
Table of Contents
Index to Financial Statements
Grants of Plan-Based Awards for the 2011 Fiscal Year
| Estimated Future Payouts Plan Awards |
Estimated Future Payouts Plan Awards |
All
Other of Stock |
All Other Securities |
Exercise or Base |
Grant Date Fair Value of Stock and Option | |||||||||||||||||
| Name |
Grant Date |
Threshold ($) |
Target ($) |
Maximum ($) |
Threshold (#) |
Target (#) |
Maximum (#) |
or Units |
Options |
Awards ($/Sh) |
Awards | |||||||||||
| John A. Crum |
||||||||||||||||||||||
| Stephen J. McDaniel |
||||||||||||||||||||||
| Thomas L. Mitchell |
||||||||||||||||||||||
| Kristen N. McDaniel |
||||||||||||||||||||||
| Named Executive Officer No. 1 |
||||||||||||||||||||||
| Named Executive Officer No. 2 |
||||||||||||||||||||||
| Named Executive Officer No. 3 |
||||||||||||||||||||||
101
Table of Contents
Index to Financial Statements
Outstanding Share-Based Awards at 2011 Fiscal Year-End
| Option Awards | Stock Awards | |||||||||||||||||
| Name |
Number of (#) |
Number of (#) |
Share- Plan Awards: (#) |
Option Price ($) |
Option |
Number of Stock |
Market Stock |
Share- Plan Awards: Units or Other Rights That not |
Share- Plan Awards: Value of Units or Other Rights That Not Vested ($) | |||||||||
| John A. Crum |
||||||||||||||||||
| Stephen J. McDaniel |
||||||||||||||||||
| Thomas L. Mitchell |
||||||||||||||||||
| Kristen N. McDaniel |
||||||||||||||||||
| Named Executive Officer No. 1 |
||||||||||||||||||
| Named Executive Officer No. 2 |
||||||||||||||||||
| Named Executive Officer No. 3 |
||||||||||||||||||
102
Table of Contents
Index to Financial Statements
Option Exercises and Stock Vested in the 2011 Fiscal Year
| Option Awards | Stock Awards | |||||||
| Name |
Number of Exercise (#) |
Value Realized on Exercise ($) |
Number of Shares Acquired on Vesting (#) |
Value Vesting ($) | ||||
| John A. Crum |
||||||||
| Stephen J. McDaniel |
||||||||
| Thomas L. Mitchell |
||||||||
| Kristen N. McDaniel |
||||||||
| Named Executive Officer No. 1 |
||||||||
| Named Executive Officer No. 2 |
||||||||
| Named Executive Officer No. 3 |
||||||||
Potential Payments Upon Termination or a Change in Control
The following summaries and table describe and quantify the potential payments and benefits that we would provide to our Named Executive Officers in connection with termination of employment and/or change in control.
Employment Agreement
The employment of each Named Executive Officer may be terminated by us or by the Named Executive Officer at any time, with or without cause. Pursuant to each Named Executive Officer’s Employment Agreement, a Named Executive Officer is entitled to receive severance benefits upon termination by the executive for Employee Cause, by us without Employer Cause, or upon death or permanent disability. Upon an eligible termination, each Named Executive Officer (or the executive’s estate in the event of death) is entitled to the Severance Payments. Additionally, under each termination described in this paragraph, we have a right to repurchase all of the equity purchased by the Named Executive Officer at fair market value on the date of termination. A terminated Named Executive Officer’s entitlement to the Severance Payments is conditioned on the executive’s continued compliance with the covenants under the employment agreement, including obligations not to compete with us and not to solicit our employees or customers for two years following termination of employment, and the terms of any release or separation agreement between the executive and us. Notwithstanding the foregoing, if within approximately 90 days following a termination of employment of a Named Executive Officer we discover that grounds existed as of the termination date for a termination for Employer Cause, then such termination will be deemed to be a termination for Employer Cause and the executive will not be entitled to further payment of the Severance Payments. If, under these circumstances, part or all of the Severance Payments have already been delivered to a Named Executive Officer, then that executive will have to repay any monies or benefits received that he or she would have no right to under a termination for Employer Cause.
No Named Executive Officer has any right to receive a “gross up” for any excise tax imposed by Section 4999 of the Code, or any federal, state and local income tax.
103
Table of Contents
Index to Financial Statements
Restricted Stock Agreement
The Restricted Stock Agreement entered into between us and Mr. Crum contains provisions that provide for accelerated vesting of restricted stock upon the occurrence of certain events. Pursuant to the Restricted Stock Agreement, if a Named Executive Officer’s employment is terminated by either Named Executive Officer for Employee Cause or by us without Employer Cause, all restricted stock granted to the executive shall become fully vested upon the date of termination. If a “Change in Control” (as defined below) occurs prior to the end of the restricted period specified in the Restricted Stock Agreement, all restricted stock granted to the Named Executive Officer shall become fully vested upon the “Change in Control.” Upon the vesting of the shares of restricted stock, the restrictions applicable to such shares of restricted stock shall terminate, and as soon as practicable thereafter, a stock certificate for the number of such shares shall be delivered to Mr. Crum.
As utilized in the Restricted Stock Agreement, “Change in Control” generally means the occurrence of any of the following events: any consolidation or merger of Midstates Petroleum Holdings Inc. with or into any other corporation or other entity or person, or any corporate reorganization in which our stockholders hold less than fifty percent (50%) of the surviving corporation’s voting power immediately after such event; a sale, lease or other disposition of all or substantially all of the assets of Midstates Petroleum Holdings Inc., Midstates Petroleum Holdings LLC or Midstates Petroleum Company LLC to an entity in which the stockholders or members or partners of the applicable Midstates entity hold less than fifty percent (50%) of the acquiring corporation’s voting power after such event; or an initial public offering of the equity of Midstates Petroleum Holdings Inc., Midstates Petroleum Holdings LLC or Midstates Petroleum Company LLC in which more than twenty percent (20%) of the equity of the applicable Midstates entity is sold.
Director Compensation
During the 2011 Fiscal Year, neither we nor our predecessor paid fees to members of our board of directors.
104
Table of Contents
Index to Financial Statements
CERTAIN RELATIONSHIPS AND RELATED PARTY TRANSACTIONS
Corporate Reorganization
In connection with our corporate reorganization, we will engage in certain transactions with certain affiliates and our existing equity holders. Please see “Corporate Reorganization” for a description of these transactions.
Historical Transactions with First Reserve
In August 2008, we entered into an equity purchase agreement pursuant to which certain of our stockholders sold a portion of their equity interests in us to First Reserve, pursuant to which First Reserve acquired an approximate equity interest in us of 72%. Since its initial acquisition in August 2008, First Reserve made an additional capital contribution to us of $50 million, which brought its current aggregate equity interest in us to approximately 77%. Following the completion of this offering, First Reserve will hold an approximate % equity interest in us.
Procedures for Approval of Related Person Transactions
A “Related Party Transaction” is a transaction, arrangement or relationship in which we or any of our subsidiaries was, is or will be a participant, the amount of which involved exceeds $120,000, and in which any related person had, has or will have a direct or indirect material interest. A “Related Person” means:
| • | any person who is, or at any time during the applicable period was, one of our executive officers or one of our directors; |
| • | any person who is known by us to be the beneficial owner of more than 5.0% of our common stock; |
| • | any immediate family member of any of the foregoing persons, which means any child, stepchild, parent, stepparent, spouse, sibling, mother-in-law, father-in-law, son-in-law, daughter-in-law, brother-in-law or sister-in-law of a director, executive officer or a beneficial owner of more than 5.0% of our common stock, and any person (other than a tenant or employee) sharing the household of such director, executive officer or beneficial owner of more than 5.0% of our common stock; and |
| • | any firm, corporation or other entity in which any of the foregoing persons is a partner or principal or in a similar position or in which such person has a 10.0% or greater beneficial ownership interest. |
Our board of directors will adopt a written related party transactions policy prior to the completion of this offering. Pursuant to this policy, our audit committee will review all material facts of all Related Party Transactions and either approve or disapprove entry into the Related Party Transaction, subject to certain limited exceptions. In determining whether to approve or disapprove entry into a Related Party Transaction, our audit committee shall take into account, among other factors, the following: (1) whether the Related Party Transaction is on terms no less favorable than terms generally available to an unaffiliated third-party under the same or similar circumstances and (2) the extent of the Related Person’s interest in the transaction. Further, the policy requires that all Related Party Transactions required to be disclosed in our filings with the SEC be so disclosed in accordance with applicable laws, rules and regulations.
105
Table of Contents
Index to Financial Statements
Midstates Petroleum Company, Inc. is a Delaware corporation that was incorporated for the purpose of this offering. Following the completion of a corporate reorganization that will occur concurrently with the closing of this offering, Midstates Petroleum Company, Inc. will directly own all of the outstanding membership interests in Midstates Petroleum Company LLC. Therefore, investors in this offering will only receive, and this prospectus only describes the offering of, shares of common stock of Midstates Petroleum Company, Inc. Our business will continue to be conducted through Midstates Petroleum Company LLC, as a direct, wholly owned subsidiary of Midstates Petroleum Company, Inc. See “Description of Capital Stock” for additional information regarding the terms of our certificate of incorporation and bylaws as will be in effect upon the closing of this offering.
The reorganization will consist of the following steps:
| • | the contribution by First Reserve of its interests in FR Midstates Holdings LLC (the entity through which First Reserve currently holds its equity interest in Midstates Petroleum Holdings LLC) to MPCI in exchange for limited liability company interests in MPCI; |
| • | the contribution by Midstates Incentive Holdings LLC of its interests in Midstates Petroleum Holdings LLC to MPCI in exchange for limited liability company interests in MPCI; |
| • | the contribution by MPCI of its interests in FR Midstates Holdings LLC and Midstates Petroleum Holdings LLC to Midstates Petroleum Company, Inc. in exchange for shares of Midstates Petroleum Company Inc. common stock; |
| • | the contribution by certain members of management of their interests in Midstates Petroleum Holdings LLC to Midstates Petroleum Company, Inc. in exchange for shares of Midstates Petroleum Company, Inc. common stock; |
| • | the merger of Midstates Petroleum Holdings, Inc. into Midstates Petroleum Company, Inc., as a result of which the shareholders of Midstates Petroleum Holdings, Inc. will receive shares of common stock in Midstates Petroleum Company, Inc.; and |
| • | the merger of FR Midstates Holdings LLC and Midstates Petroleum Holdings LLC into Midstates Petroleum Company, Inc. |
As a result of the transactions discussed above, Midstates Petroleum Company LLC will become a direct, wholly owned subsidiary of Midstates Petroleum Company, Inc.
We refer to transactions described above collectively as our “corporate reorganization.”
106
Table of Contents
Index to Financial Statements
PRINCIPAL AND SELLING STOCKHOLDERS
The following table sets forth information with respect to the beneficial ownership of our common stock as of , 2011 after giving effect to our corporate reorganization by:
| • | each of our named executive officers; |
| • | each of our directors; |
| • | all of our directors and executive officers as a group; and |
| • | the selling stockholders. |
Except as otherwise indicated, the person or entities listed below have sole voting and investment power with respect to all shares of our common stock beneficially owned by them, except to the extent this power may be shared with a spouse. All information with respect to beneficial ownership has been furnished by the respective directors, officers or 5% or more stockholders, as the case may be. Unless otherwise indicated, the address of each person or entity named in the table below is 4400 Post Oak Parkway, Suite 1900, Houston, Texas 77027.
| Shares Beneficially Owned Prior to the Offering |
Shares Being Offered |
Shares Beneficially Owned After Offering |
||||||||||||
| Name and Address of Beneficial Owner |
Number | Percentage | Number | Percentage | ||||||||||
| Selling Stockholders: |
||||||||||||||
| % | % | |||||||||||||
| Directors and Named Executive Officers: |
||||||||||||||
| Stephen J. McDaniel |
% | % | ||||||||||||
| John A. Crum |
% | % | ||||||||||||
| Thomas L. Mitchell |
% | % | ||||||||||||
| Alex T. Krueger |
% | % | ||||||||||||
| Anastasia Deulina |
% | % | ||||||||||||
| John Mogford |
% | % | ||||||||||||
| Director 1 |
% | % | ||||||||||||
| Director 2 |
% | % | ||||||||||||
| Named Executive Officer No. 1 |
% | % | ||||||||||||
| Named Executive Officer No. 2 |
% | % | ||||||||||||
| Named Executive Officer No. 3 |
% | % | ||||||||||||
| All directors and executive officers as a group ( persons) |
% | % | ||||||||||||
107
Table of Contents
Index to Financial Statements
Upon completion of this offering, the authorized capital stock of Midstates Petroleum Company, Inc. will consist of shares of common stock, $0.01 par value per share, of which shares will be issued and outstanding, and shares of preferred stock, $0.01 par value per share, of which no shares will be issued and outstanding.
The following summary of the capital stock and certificate of incorporation and bylaws of Midstates Petroleum Company, Inc. does not purport to be complete and is qualified in its entirety by reference to the provisions of applicable law and to our certificate of incorporation and by-laws, which are filed as exhibits to the registration statement of which this prospectus is a part.
Common Stock
Except as provided by law or in a preferred stock designation, holders of common stock are entitled to one vote for each share held of record on all matters submitted to a vote of the stockholders, will have the exclusive right to vote for the election of directors and do not have cumulative voting rights. Except as otherwise required by law, holders of common stock, as such, are not entitled to vote on any amendment to the certificate of incorporation (including any certificate of designations relating to any series of preferred stock) that relates solely to the terms of any outstanding series of preferred stock if the holders of such affected series are entitled, either separately or together with the holders of one or more other such series, to vote thereon pursuant to the certificate of incorporation (including any certificate of designations relating to any series of preferred stock) or pursuant to the DGCL, Subject to preferences that may be applicable to any outstanding shares or series of preferred stock, holders of common stock are entitled to receive ratably such dividends (payable in cash, stock or otherwise), if any, as may be declared from time to time by our board of directors out of funds legally available for dividend payments. All outstanding shares of common stock are fully paid and non-assessable, and the shares of common stock to be issued upon completion of this offering will be fully paid and non-assessable. The holders of common stock have no preferences or rights of conversion, exchange, pre-emption or other subscription rights. There are no redemption or sinking fund provisions applicable to the common stock. In the event of any liquidation, dissolution or winding-up of our affairs, holders of common stock will be entitled to share ratably in our assets that are remaining after payment or provision for payment of all of our debts and obligations and after liquidation payments to holders of outstanding shares of preferred stock, if any.
Preferred Stock
Our certificate of incorporation authorizes our board of directors, subject to any limitations prescribed by law, without further stockholder approval, to establish and to issue from time to time one or more classes or series of preferred stock, par value $0.01 per share, covering up to an aggregate of shares of preferred stock. Each class or series of preferred stock will cover the number of shares and will have the powers, preferences, rights, qualifications, limitations and restrictions determined by the board of directors, which may include, among others, dividend rights, liquidation preferences, voting rights, conversion rights, preemptive rights and redemption rights. Except as provided by law or in a preferred stock designation, the holders of preferred stock will not be entitled to vote at or receive notice of any meeting of stockholders.
Anti-Takeover Effects of Provisions of Our Certificate of Incorporation, our Bylaws and Delaware Law
Some provisions of Delaware law, and our certificate of incorporation and our bylaws described below, will contain provisions that could make the following transactions more difficult: acquisitions of us by means of a tender offer, a proxy contest or otherwise; or removal of our incumbent officers and
108
Table of Contents
Index to Financial Statements
directors. These provisions may also have the effect of preventing changes in our management. It is possible that these provisions could make it more difficult to accomplish or could deter transactions that stockholders may otherwise consider to be in their best interest or in our best interests, including transactions that might result in a premium over the market price for our shares.
These provisions, summarized below, are expected to discourage coercive takeover practices and inadequate takeover bids. These provisions are also designed to encourage persons seeking to acquire control of us to first negotiate with us. We believe that the benefits of increased protection and our potential ability to negotiate with the proponent of an unfriendly or unsolicited proposal to acquire or restructure us outweigh the disadvantages of discouraging these proposals because, among other things, negotiation of these proposals could result in an improvement of their terms.
Delaware Law
We will not be subject to the provisions of Section 203 of the DGCL, regulating corporate takeovers. In general, those provisions prohibit a Delaware corporation, including those whose securities are listed for trading on the NYSE, from engaging in any business combination with any interested stockholder for a period of three years following the date that the stockholder became an interested stockholder, unless:
| • | the transaction is approved by the board of directors before the date the interested stockholder attained that status; |
| • | upon consummation of the transaction that resulted in the stockholder becoming an interested stockholder, the interested stockholder owned at least 85% of the voting stock of the corporation outstanding at the time the transaction commenced; or |
| • | on or after such time the business combination is approved by the board of directors and authorized at a meeting of stockholders by at least two-thirds of the outstanding voting stock that is not owned by the interested stockholder. |
Certificate of Incorporation and Bylaws
Provisions of our certificate of incorporation and bylaws, which will become effective upon the closing of this offering, may delay or discourage transactions involving an actual or potential change in control or change in our management, including transactions in which stockholders might otherwise receive a premium for their shares, or transactions that our stockholders might otherwise deem to be in their best interests. Therefore, these provisions could adversely affect the price of our common stock.
Among other things, our certificate of incorporation and bylaws will:
| • | permit our board of directors to issue up to shares of preferred stock, with any rights, preferences and privileges as they may designate; |
| • | provide that the authorized number of directors may be changed only by resolution of the board of directors; |
| • | provide that all vacancies, including newly created directorships, may, except as otherwise required by law, be filled by the affirmative vote of a majority of directors then in office, even if less than a quorum; |
| • | provide that we renounce any interest in the business opportunities of First Reserve and of our directors who are affiliated with First Reserve, other than directors employed by us, and that neither our directors affiliated with First Reserve, other than directors employed by us, nor First Reserve, have any obligation to offer us those opportunities; |
109
Table of Contents
Index to Financial Statements
| • | eliminate the personal liability of our directors for monetary damages resulting from breaches of their fiduciary duty to the extent permitted by the DGCL and indemnify our directors and officers to the fullest extent permitted by Section 145 of the DGCL; |
| • | provide that stockholders seeking to present proposals before a meeting of stockholders or to nominate candidates for election as directors at a meeting of stockholders must provide notice in writing in a timely manner, and also specify requirements as to the form and content of a stockholder’s notice; |
| • | not provide for cumulative voting rights, therefore allowing the holders of a majority of the shares of common stock entitled to vote in any election of directors to elect all of the directors standing for election, if they should so choose; and |
| • | provide that our bylaws can be amended or repealed at any regular or special meeting of stockholders or by the board of directors. |
Limitation of Liability and Indemnification Matters
Our certificate of incorporation limits the liability of our directors for monetary damages for breach of their fiduciary duty as directors, except for liability that cannot be eliminated under the DGCL. Delaware law provides that directors of a company will not be personally liable for monetary damages for breach of their fiduciary duty as directors, except for liabilities:
| • | for any breach of their duty of loyalty to us or our stockholders; |
| • | for acts or omissions not in good faith or which involve intentional misconduct or a knowing violation of law; |
| • | for unlawful payment of dividend or unlawful stock repurchase or redemption, as provided under Section 174 of the DGCL; or |
| • | for any transaction from which the director derived an improper personal benefit. |
Any amendment, repeal or modification of these provisions will be prospective only and would not affect any limitation on liability of a director for acts or omissions that occurred prior to any such amendment, repeal or modification.
Our certificate of incorporation and bylaws also provide that we will indemnify our directors and officers to the fullest extent permitted by Delaware law. Our certificate of incorporation and bylaws also permit us to purchase insurance on behalf of any officer, director, employee or other agent for any liability arising out of that person’s actions as our officer, director, employee or agent, regardless of whether Delaware law would permit indemnification. We intend to enter into indemnification agreements with each of our current and future directors and officers. These agreements will require us to indemnify these individuals to the fullest extent permitted under Delaware law against liability that may arise by reason of their service to us, and to advance expenses incurred as a result of any proceeding against them as to which they could be indemnified. We believe that the limitation of liability provision in our certificate of incorporation and the indemnification agreements will facilitate our ability to continue to attract and retain qualified individuals to serve as directors and officers.
Transfer Agent and Registrar
The transfer agent and registrar for our common stock is American Stock Transfer & Trust Company, LLC.
Listing
We expect to list our common stock for quotation on the NYSE under the symbol “MPO.”
110
Table of Contents
Index to Financial Statements
SHARES ELIGIBLE FOR FUTURE SALE
Prior to this offering, there has been no public market for our common stock. Future sales of our common stock in the public market, or the availability of such shares for sale in the public market, could adversely affect the market price of our common stock prevailing from time to time. As described below, only a limited number of shares will be available for sale shortly after this offering due to contractual and legal restrictions on resale. Nevertheless, sales of a substantial number of shares of our common stock in the public market after such restrictions lapse, or the perception that those sales may occur, could adversely affect the prevailing market price of our common stock at such time and our ability to raise equity-related capital at a time and price we deem appropriate.
Sales of Restricted Shares
Upon the closing of this offering, we will have outstanding an aggregate of shares of common stock. Of these shares, all of the shares of common stock to be sold in this offering will be freely tradable without restriction or further registration under the Securities Act, unless the shares are held by any of our “affiliates” as such term is defined in Rule 144 under the Securities Act. All remaining shares of common stock held by existing stockholders will be deemed “restricted securities” as such term is defined under Rule 144. The restricted securities were issued and sold by us in private transactions and are eligible for public sale only if registered under the Securities Act or if they qualify for an exemption from registration under Rule 144 or Rule 701 under the Securities Act, which rules are summarized below.
As a result of the lock-up agreements described below and the provisions of Rule 144 and Rule 701 under the Securities Act, the shares of our common stock (excluding the shares to be sold in this offering) that will be available for sale in the public market are as follows:
| • | no shares will be eligible for sale on the date of this prospectus or prior to 180 days after the date of this prospectus; |
| • | shares will be eligible for sale upon the expiration of the lock-up agreements, beginning 180 days after the date of this prospectus (subject to extension) and when permitted under Rule 144 or Rule 701; and |
| • | shares will be eligible for sale, upon exercise of vested options, upon the expiration of the lock-up agreements, beginning 180 days after the date of this prospectus (subject to extension). |
Lock-up Agreements
We, all of our directors and officers, certain of our principal stockholders and certain of the selling stockholders have agreed not to sell any common stock for a period of 180 days from the date of this prospectus, subject to certain exceptions and extensions. See “Underwriting” for a description of these lock-up provisions.
Rule 144
In general, under Rule 144 under the Securities Act as currently in effect, a person (or persons whose shares are aggregated) who is not deemed to have been an affiliate of ours at any time during the three months preceding a sale, and who has beneficially owned restricted securities within the meaning of Rule 144 for a least sixth months (including any period of consecutive ownership of preceding non-affiliated holders) would be entitled to sell those shares, subject only to the availability of current public information about us. A non-affiliated person who has beneficially owned restricted securities within the meaning of Rule 144 for at least one year would be entitled to sell those shares without regard to the provisions of Rule 144.
111
Table of Contents
Index to Financial Statements
A person (or persons whose shares are aggregated) who is deemed to be an affiliate of ours and who has beneficially owned restricted securities within the meaning of Rule 144 for at least nine months would be entitled to sell within any three-month period a number of shares that does not exceed the greater of one percent of the then outstanding shares of our common stock or the average weekly trading volume of our common stock reported through the NYSE during the four calendar weeks preceding the filing of notice of the sale. Such sales are also subject to certain manner of sale provisions, notice requirements and the availability of current public information about us.
Rule 701
In general, under Rule 701 under the Securities Act, any of our employees, directors, officers, consultants or advisors who purchases shares from us in connection with a compensatory stock or option plan or other written agreement before the effective date of this offering is entitled to sell such shares 90 days after the effective date of this offering in reliance on Rule 144, without having to comply with the holding period requirement of Rule 144 and, in the case of non-affiliates, without having to comply with the public information, volume limitation or notice filing provisions of Rule 144. The SEC has indicated that Rule 701 will apply to typical stock options granted by an issuer before it becomes subject to the reporting requirements of the Exchange Act, along with the shares acquired upon exercise of such options, including exercises after the date of this prospectus.
Stock Issued Under Employee Plans
We intend to file a registration statement on Form S-8 under the Securities Act to register stock issuable under our Long-Term Incentive Plan. This registration statement on Form S-8 is expected to be filed following the effective date of the registration statement of which this prospectus is a part and will be effective upon filing. Accordingly, shares registered under such registration statement will be available for sale in the open market following the effective date, unless such shares are subject to vesting restrictions with us, Rule 144 restrictions applicable to our affiliates or the lock-up restrictions described above.
Registration Rights
We expect to enter into a registration rights agreement with certain of our equity owners which will require us to file and effect the registration of its shares in certain circumstances no earlier than the expiration of the lock-up period contained in the underwriting agreement entered into in connection with this offering.
112
Table of Contents
Index to Financial Statements
MATERIAL U.S. FEDERAL INCOME AND ESTATE TAX CONSIDERATIONS TO NON-U.S. HOLDERS
The following is a general discussion of the material U.S. federal income and estate tax consequences of the acquisition, ownership and disposition of our common stock to a non-U.S. holder. Except as specifically provided below (see “— Estate Tax”), for the purpose of this discussion, a non-U.S. holder is any beneficial owner of our common stock that is not for U.S. federal income tax purposes any of the following:
| • | an individual citizen or resident of the U.S.; |
| • | a corporation (or other entity treated as a corporation for U.S. federal income tax purposes) created or organized in the U.S. or under the laws of the U.S. or any state or the District of Columbia; |
| • | a partnership (or other entity treated as a partnership or other pass-through entity for U.S. federal income tax purposes) created or organized in the U.S. or under the laws of the U.S. or any state or the District of Columbia; |
| • | an estate whose income is subject to U.S. federal income tax regardless of its source; or |
| • | a trust (x) whose administration is subject to the primary supervision of a U.S. court and which has one or more U.S. persons who have the authority to control all substantial decisions of the trust or (y) which has made a valid election to be treated as a U.S. person. |
If a partnership (or an entity treated as a partnership for U.S. federal income tax purposes) holds our common stock, the tax treatment of a partner in the partnership will generally depend on the status of the partner and upon the activities of the partnership. Accordingly, we urge partnerships that hold our common stock and partners in such partnerships to consult their tax advisors.
This discussion assumes that a non-U.S. holder will hold our common stock issued pursuant to the offering as a capital asset (generally, property held for investment). This discussion does not address all aspects of U.S. federal income taxation or any aspects of state, local or non-U.S. taxation, nor does it consider any U.S. federal income tax considerations that may be relevant to non-U.S. holders that may be subject to special treatment under U.S. federal income tax laws, including, without limitation, U.S. expatriates, life insurance companies, tax-exempt or governmental organizations, dealers in securities or currency, banks or other financial institutions, investors whose functional currency is other than the U.S. dollar, and investors that hold our common stock as part of a hedge, straddle or conversion transaction. Furthermore, the following discussion is based on current provisions of the Internal Revenue Code of 1986, as amended, and Treasury Regulations and administrative and judicial interpretations thereof, all as in effect on the date hereof, and all of which are subject to change, possibly with retroactive effect.
We urge each prospective investor to consult a tax advisor regarding the U.S. federal, state, local and non-U.S. income and other tax consequences of acquiring, holding and disposing of shares of our common stock.
Dividends
We have not paid any dividends on our common stock, and we do not plan to pay any dividends for the foreseeable future. However, if we do pay dividends on our common stock, those payments will constitute dividends for U.S. tax purposes to the extent paid from our current or accumulated earnings and profits, as determined under U.S. federal income tax principles. To the extent those dividends exceed our current and accumulated earnings and profits, the dividends will constitute a return of
113
Table of Contents
Index to Financial Statements
capital and will first reduce a holder’s adjusted tax basis in the common stock, but not below zero, and then will be treated as gain from the sale of the common stock (see “— Gain on Disposition of Common Stock”).
Any dividend (out of earnings and profits) paid to a non-U.S. holder of our common stock generally will be subject to U.S. withholding tax either at a rate of 30% of the gross amount of the dividend or such lower rate as may be specified by an applicable tax treaty. To receive the benefit of a reduced treaty rate, a non-U.S. holder must provide us with an IRS Form W-8BEN or other appropriate version of IRS Form W-8 certifying qualification for the reduced rate.
Dividends received by a non-U.S. holder that are effectively connected with a U.S. trade or business conducted by the non-U.S. holder are exempt from such withholding tax. To obtain this exemption, the non-U.S. holder must provide us with an IRS Form W-8ECI properly certifying such exemption. Such effectively connected dividends, although not subject to withholding tax, will be subject to U.S. federal income tax on a net income basis at the same graduated rates generally applicable to U.S. persons, net of certain deductions and credits, subject to any applicable tax treaty providing otherwise. In addition to the income tax described above, dividends received by corporate non-U.S. holders that are effectively connected with a U.S. trade or business of the corporate non-U.S. holder may be subject to a branch profits tax at a rate of 30% or such lower rate as may be specified by an applicable tax treaty.
A non-U.S. holder of our common stock may obtain a refund of any excess amounts withheld if the non-U.S. holder is eligible for a reduced rate of United States withholding tax and an appropriate claim for refund is timely filed with the Internal Revenue Service or the IRS.
Gain on Disposition of Common Stock
A non-U.S. holder generally will not be subject to U.S. federal income tax on any gain realized upon the sale or other disposition of our common stock unless:
| • | the gain is effectively connected with a U.S. trade or business of the non-U.S. holder and, if required by an applicable tax treaty, is attributable to a U.S. permanent establishment maintained by such non-U.S. holder; |
| • | the non-U.S. holder is an individual who is present in the United States for a period or periods aggregating 183 days or more during the calendar year in which the sale or disposition occurs and certain other conditions are met; or |
| • | we are or have been a “U.S. real property holding corporation” for U.S. federal income tax purposes and the non-U.S. holder holds or has held, directly or indirectly, at any time within the shorter of the five-year period preceding the disposition or the non-U.S. holder’s holding period, more than 5% of our common stock. Generally, a corporation is a United States real property holding corporation if the fair market value of its United States real property interests equals or exceeds 50% of the sum of the fair market value of its worldwide real property interests and its other assets used or held for use in a trade or business. We believe that we are, and will remain for the foreseeable future, a “U.S. real property holding corporation” for U.S. federal income tax purposes. |
Unless an applicable tax treaty provides otherwise, gain described in the first and third bullet points above will be subject to U.S. federal income tax on net income basis at the same graduated rates generally applicable to U.S. persons. Corporate non-U.S. holders also may be subject to a branch profits tax equal to 30% (or such lower rate as may be specified by an applicable tax treaty) of its earnings and profits that are effectively connected with a U.S. trade or business.
114
Table of Contents
Index to Financial Statements
Gain described in the second bullet point above (which may be offset by U.S. source capital losses, provided that the non-U.S. holder has timely filed U.S. federal income tax returns with respect to such losses) will be subject to a flat 30% U.S. federal income tax (or such lower rate as may be specified by an applicable tax treaty).
Non-U.S. holders should consult any applicable income tax treaties that may provide for different rules.
Backup Withholding and Information Reporting
Generally, we must report annually to the IRS the amount of dividends paid to each non-U.S. holder, the name and address of the recipient, and the amount, if any, of tax withheld with respect to those dividends. A similar report is sent to each non-U.S. holder. These information reporting requirements apply even if withholding was not required. Pursuant to tax treaties or other agreements, the IRS may make its reports available to tax authorities in the recipient’s country of residence.
Payments of dividends to a non-U.S. holder may be subject to backup withholding (at the applicable rate) unless the non-U.S. holder establishes an exemption, for example, by properly certifying its non-U.S. status on an IRS Form W-8BEN or another appropriate version of IRS Form W-8. Notwithstanding the foregoing, backup withholding may apply if either we or our paying agent has actual knowledge, or reason to know, that the beneficial owner is a U.S. person that is not an exempt recipient.
Payments of the proceeds from sale or other disposition by a non-U.S. holder of our common stock effected outside the U.S. by or through a foreign office of a broker generally will not be subject to information reporting or backup withholding. However, information reporting (but not backup withholding) will apply to those payments if the broker does not have documentary evidence that the holder is a non-U.S. holder, an exemption is not otherwise established, and the broker has certain relationships with the United States.
Payments of the proceeds from a sale or other disposition by a non-U.S. holder of our common stock effected by or through a U.S. office of a broker generally will be subject to information reporting and backup withholding (at the applicable rate) unless the non-U.S. holder establishes an exemption, for example, by properly certifying its non-U.S. status on an IRS Form W-8BEN or another appropriate version of IRS Form W-8. Notwithstanding the foregoing, information reporting and backup withholding may apply if the broker has actual knowledge, or reason to know, that the holder is a U.S. person that is not an exempt recipient.
Backup withholding is not an additional tax. Rather, the U.S. income tax liability of persons subject to backup withholding will be reduced by the amount of tax withheld. If withholding results in an overpayment of taxes, a refund may be obtained, provided that the required information is timely furnished to the IRS.
Estate Tax
Our common stock owned or treated as owned by an individual who is not a citizen or resident of the U.S. (as specifically defined for U.S. federal estate tax purposes) at the time of death will be includible in the individual’s gross estate for U.S. federal estate tax purposes and may be subject to U.S. federal estate tax unless an applicable estate tax treaty provides otherwise.
115
Table of Contents
Index to Financial Statements
Legislation Affecting Common Stock Held Through Foreign Accounts
On March 18, 2010, President Obama signed into law the Hiring Incentives to Restore Employment Act (the “HIRE Act”), which may result in materially different withholding and information reporting requirements than those described above, for payments made after December 31, 2012. The HIRE Act limits the ability of non-U.S. holders who hold our common stock through a foreign financial institution to claim relief from U.S. withholding tax in respect of dividends paid on our common stock unless the foreign financial institution agrees, among other things, to annually report certain information with respect to “United States accounts” maintained by such institution. The HIRE Act also limits the ability of certain non-financial foreign entities to claim relief from U.S. withholding tax in respect of dividends paid by us to such entities unless (1) those entities meet certain certification requirements; (2) the withholding agent does not know or have reason to know that any such information provided is incorrect and (3) the withholding agent reports the information provided to the IRS. The HIRE Act provisions will have a similar effect with respect to dispositions of our common stock after December 31, 2012. A non-U.S. holder generally would be permitted to claim a refund to the extent any tax withheld exceeded the holder’s actual tax liability. Non-U.S. holders are encouraged to consult with their tax advisers regarding the possible implication of the HIRE Act on their investment in respect of the common stock.
116
Table of Contents
Index to Financial Statements
We, the selling stockholders and the underwriters named below have entered into an underwriting agreement with respect to the shares being offered. Subject to certain conditions, each underwriter has severally agreed to purchase the number of shares indicated in the following table. Goldman, Sachs & Co., Morgan Stanley & Co. LLC and Wells Fargo Securities, LLC are the representatives of the underwriters.
| Underwriters |
Number of Shares | |
| Goldman, Sachs & Co. |
||
| Morgan Stanley & Co. LLC |
||
| Wells Fargo Securities, LLC |
||
|
| ||
| Total |
||
|
|
The underwriters are committed to take and pay for all of the shares being offered, if any are taken, other than the shares covered by the option described below unless and until this option is exercised.
The underwriters have an option to buy up to an additional shares from us and the selling stockholders to cover sales by the underwriters of a greater number of shares than the total number set forth in the table above. They may exercise that option for 30 days. If any shares are purchased pursuant to this option, the underwriters will severally purchase shares in approximately the same proportion as set forth in the table above.
The following tables show the per share and total underwriting discounts and commissions to be paid to the underwriters by us and the selling stockholders. Such amounts are shown assuming both no exercise and full exercise of the underwriters’ option to purchase additional shares.
Paid by Midstates Petroleum Company, Inc.
| No Exercise | Full Exercise | |||||||
| Per Share |
$ | $ | ||||||
| Total |
$ | $ | ||||||
Paid by the Selling Stockholders
| No Exercise | Full Exercise | |||||||
| Per Share |
$ | $ | ||||||
| Total |
$ | $ | ||||||
Shares sold by the underwriters to the public will initially be offered at the initial public offering price set forth on the cover of this prospectus. Any shares sold by the underwriters to securities dealers may be sold at a discount of up to $ per share from the initial public offering price. After the initial offering of the shares, the representatives may change the offering price and the other selling terms. The offering of the shares by the underwriters is subject to receipt and acceptance and subject to the underwriters’ right to reject any order in whole or in part.
We, our officers and directors and the selling stockholders have agreed with the underwriters, subject to certain exceptions, not to dispose of or hedge any of our common stock or securities
117
Table of Contents
Index to Financial Statements
convertible into or exchangeable for shares of common stock during the period from the date of this prospectus continuing through the date 180 days after the date of this prospectus, except with the prior written consent of the representatives. This agreement does not apply to any existing employee benefit plans. See “Shares Eligible for Future Sale” for a discussion of certain transfer restrictions.
The 180-day restricted period described in the preceding paragraph will be automatically extended if: (1) during the last 17 days of the 180-day restricted period we issue an earnings release or announce material news or a material event; or (2) prior to the expiration of the 180-day restricted period, we announce that we will release earnings results during the 15-day period following the last day of the 180-day period, in which case the restrictions described in the preceding paragraph will continue to apply until the expiration of the 18-day period beginning on the issuance of the earnings release or the announcement of the material news or material event.
Prior to the offering, there has been no public market for the shares. The initial public offering price has been negotiated among us, the selling stockholders and the representatives. Among the factors to be considered in determining the initial public offering price of the shares, in addition to prevailing market conditions, will be our historical performance, estimates of our business potential and earnings prospects, an assessment of our management and the consideration of the above factors in relation to market valuation of companies in related businesses.
An application has been made to list the common stock on the NYSE under the symbol “MPO.” In order to meet one of the requirements for listing the common stock on the NYSE, the underwriters have undertaken to sell lots of 100 or more shares to a minimum of 400 beneficial holders.
In connection with the offering, the underwriters may purchase and sell shares of common stock in the open market. These transactions may include short sales, stabilizing transactions and purchases to cover positions created by short sales. Short sales involve the sale by the underwriters of a greater number of shares than they are required to purchase in the offering, and a short position represents the amount of such sales that have not been covered by subsequent purchases. A “covered short position” is a short position that is not greater than the amount of additional shares for which the underwriters’ option described above may be exercised. The underwriters may cover any covered short position by either exercising their option to purchase additional shares or purchasing shares in the open market. In determining the source of shares to cover the covered short position, the underwriters will consider, among other things, the price of shares available for purchase in the open market as compared to the price at which they may purchase additional shares pursuant to the option described above. “Naked” short sales are any short sales that create a short position greater than the amount of additional shares for which the option described above may be exercised. The underwriters must cover any such naked short position by purchasing shares in the open market. A naked short position is more likely to be created if the underwriters are concerned that there may be downward pressure on the price of the common stock in the open market after pricing that could adversely affect investors who purchase in the offering. Stabilizing transactions consist of various bids for or purchases of common stock made by the underwriters in the open market prior to the completion of the offering.
The underwriters may also impose a penalty bid. This occurs when a particular underwriter repays to the underwriters a portion of the underwriting discount received by it because the representatives have repurchased shares sold by or for the account of such underwriter in stabilizing or short covering transactions.
Purchases to cover a short position and stabilizing transactions, as well as other purchases by the underwriters for their own accounts, may have the effect of preventing or retarding a decline in the market price of our stock, and together with the imposition of the penalty bid, may stabilize, maintain or otherwise affect the market price of our common stock. As a result, the price of our common stock may
118
Table of Contents
Index to Financial Statements
be higher than the price that otherwise might exist in the open market. The underwriters are not required to engage in these activities and may end any of these activities at any time. These transactions may be effected on the NYSE, in the over-the-counter market or otherwise.
In relation to each Member State of the European Economic Area which has implemented the Prospectus Directive (each, a “Relevant Member State”), each underwriter has represented and agreed that with effect from and including the date on which the Prospectus Directive is implemented in that Relevant Member State (“Relevant Implementation Date”) it has not made and will not make an offer of shares to the public in that Relevant Member State prior to the publication of a prospectus in relation to the shares which has been approved by the competent authority in that Relevant Member State or, where appropriate, approved in another Relevant Member State and notified to the competent authority in that Relevant Member State, all in accordance with the Prospectus Directive, except that it may, with effect from and including the Relevant Implementation Date, make an offer of shares to the public in that Relevant Member State at any time:
(a) to legal entities which are authorised or regulated to operate in the financial markets or, if not so authorised or regulated, whose corporate purpose is solely to invest in securities;
(b) to any legal entity which has two or more of (1) an average of at least 250 employees during the last financial year; (2) a total balance sheet of more than €43,000,000 and (3) an annual net turnover of more than €50,000,000, as shown in its last annual or consolidated accounts;
(c) to fewer than 100 natural or legal persons (other than qualified investors as defined in the Prospectus Directive) subject to obtaining the prior consent of the representatives for any such offer; or
(d) in any other circumstances which do not require the publication by us of a prospectus pursuant to Article 3 of the Prospectus Directive.
For the purposes of this provision, the expression an “offer of shares to the public” in relation to any shares in any Relevant Member State means the communication in any form and by any means of sufficient information on the terms of the offer and the shares to be offered so as to enable an investor to decide to purchase or subscribe the shares, as the same may be varied in that Relevant Member State by any measure implementing the Prospectus Directive in that Relevant Member State and the expression Prospectus Directive means Directive 2003/71/EC and includes any relevant implementing measure in each Relevant Member State.
Each underwriter has represented and agreed that:
| (a) | it has only communicated or caused to be communicated and will only communicate or cause to be communicated an invitation or inducement to engage in investment activity (within the meaning of Section 21 of the Financial Services and Markets Act 2000, or FSMA) received by it in connection with the issue or sale of the shares in circumstances in which Section 21(1) of the FSMA does not apply to us; and |
| (b) | it has complied and will comply with all applicable provisions of the FSMA with respect to anything done by it in relation to the shares in, from or otherwise involving the United Kingdom. |
The shares may not be offered or sold by means of any document other than (i) in circumstances which do not constitute an offer to the public within the meaning of the Companies Ordinance (Cap.32, Laws of Hong Kong), or (ii) to “professional investors” within the meaning of the Securities and Futures Ordinance (Cap.571, Laws of Hong Kong) and any rules made thereunder, or (iii) in other circumstances which do not result in the document being a “prospectus” within the meaning of the Companies Ordinance (Cap.32, Laws of Hong Kong), and no advertisement, invitation or document
119
Table of Contents
Index to Financial Statements
relating to the shares may be issued or may be in the possession of any person for the purpose of issue (in each case whether in Hong Kong or elsewhere), which is directed at, or the contents of which are likely to be accessed or read by, the public in Hong Kong (except if permitted to do so under the laws of Hong Kong) other than with respect to shares which are or are intended to be disposed of only to persons outside Hong Kong or only to “professional investors” within the meaning of the Securities and Futures Ordinance (Cap. 571, Laws of Hong Kong) and any rules made thereunder.
This prospectus has not been registered as a prospectus with the Monetary Authority of Singapore. Accordingly, this prospectus and any other document or material in connection with the offer or sale, or invitation for subscription or purchase, of the shares may not be circulated or distributed, nor may the shares be offered or sold, or be made the subject of an invitation for subscription or purchase, whether directly or indirectly, to persons in Singapore other than (i) to an institutional investor under Section 274 of the Securities and Futures Act, Chapter 289 of Singapore (the “SFA”), (ii) to a relevant person, or any person pursuant to Section 275(1A), and in accordance with the conditions, specified in Section 275 of the SFA or (iii) otherwise pursuant to, and in accordance with the conditions of, any other applicable provision of the SFA.
Where the shares are subscribed or purchased under Section 275 by a relevant person which is: (a) a corporation (which is not an accredited investor) the sole business of which is to hold investments and the entire share capital of which is owned by one or more individuals, each of whom is an accredited investor; or (b) a trust (where the trustee is not an accredited investor) whose sole purpose is to hold investments and each beneficiary is an accredited investor, shares, debentures and units of shares and debentures of that corporation or the beneficiaries’ rights and interest in that trust shall not be transferable for 6 months after that corporation or that trust has acquired the shares under Section 275 except: (1) to an institutional investor under Section 274 of the SFA or to a relevant person, or any person pursuant to Section 275(1A), and in accordance with the conditions, specified in Section 275 of the SFA; (2) where no consideration is given for the transfer; or (3) by operation of law.
The securities have not been and will not be registered under the Financial Instruments and Exchange Law of Japan (the Financial Instruments and Exchange Law) and each underwriter has agreed that it will not offer or sell any securities, directly or indirectly, in Japan or to, or for the benefit of, any resident of Japan (which term as used herein means any person resident in Japan, including any corporation or other entity organized under the laws of Japan), or to others for re-offering or resale, directly or indirectly, in Japan or to a resident of Japan, except pursuant to an exemption from the registration requirements of, and otherwise in compliance with, the Financial Instruments and Exchange Law and any other applicable laws, regulations and ministerial guidelines of Japan.
The shares may not be publicly offered in Switzerland and will not be listed on the SIX Swiss Exchange (“SIX”) or on any other stock exchange or regulated trading facility in Switzerland. This document has been prepared without regard to the disclosure standards for issuance prospectuses under art. 652a or art. 1156 of the Swiss Code of Obligations or the disclosure standards for listing prospectuses under art. 27 ff. of the SIX Listing Rules or the listing rules of any other stock exchange or regulated trading facility in Switzerland. Neither this document nor any other offering or marketing material relating to the shares or the offering may be publicly distributed or otherwise made publicly available in Switzerland.
Neither this document nor any other offering or marketing material relating to the offering, us or the shares have been or will be filed with or approved by any Swiss regulatory authority. In particular, this document will not be filed with, and the offer of shares will not be supervised by, the Swiss Financial Market Supervisory Authority FINMA (FINMA), and the offer of shares has not been and will not be authorized under the Swiss Federal Act on Collective Investment Schemes (“CISA”). The investor protection afforded to acquirers of interests in collective investment schemes under the CISA does not extend to acquirers of shares.
120
Table of Contents
Index to Financial Statements
This prospectus supplement relates to an Exempt Offer in accordance with the Offered Securities Rules of the Dubai Financial Services Authority (“DFSA”). This prospectus supplement is intended for distribution only to persons of a type specified in the Offered Securities Rules of the DFSA. It must not be delivered to, or relied on by, any other person. The DFSA has no responsibility for reviewing or verifying any documents in connection with Exempt Offers. The DFSA has not approved this prospectus supplement nor taken steps to verify the information set forth herein and has no responsibility for the prospectus supplement. The shares to which this prospectus supplement relates may be illiquid and/or subject to restrictions on their resale. Prospective purchasers of the shares offered should conduct their own due diligence on the shares. If you do not understand the contents of this prospectus supplement you should consult an authorized financial advisor.
The underwriters do not expect sales to discretionary accounts to exceed five percent of the total number of shares offered.
We and the selling stockholders estimate that our share of the total expenses of the offering, excluding underwriting discounts and commissions, will be approximately $ .
We and the selling stockholders have agreed to indemnify the several underwriters against certain liabilities, including liabilities under the Securities Act of 1933, as amended.
Conflicts of Interest
The underwriters and their respective affiliates are full service financial institutions engaged in various activities, which may include securities trading, commercial and investment banking, financial advisory, investment management, investment research, principal investment, hedging, financing and brokerage activities. Certain of the underwriters and their respective affiliates have, from time to time, performed, and may in the future perform, various financial advisory and investment banking services for us, for which they received or will receive customary fees and expenses. Affiliates of Goldman, Sachs & Co., Morgan Stanley & Co. LLC and Wells Fargo Securities, LLC are lenders, and in one case, an agent for the lenders, under our reserve-based revolving credit facility. Because a portion of the proceeds of this offering will be used to repay indebtedness under the credit facility, a “conflict of interest” under Rule 5121 of FINRA is therefore deemed to exist. Pursuant to FINRA Rule 5121, a “qualified independent underwriter” meeting certain standards must participate in the preparation of the registration statement of which this prospectus forms a part and exercise the usual standards of due diligence with respect thereto. has assumed the responsibilities of acting as the qualified independent underwriter in this offering.
In the ordinary course of their various business activities, the underwriters and their respective affiliates may make or hold a broad array of investments and actively trade debt and equity securities (or related derivative securities) and financial instruments (including bank loans) for their own account and for the accounts of their customers, and such investment and securities activities may involve our securities and/or instruments. The underwriters and their respective affiliates may also make investment recommendations and/or publish or express independent research views in respect of such securities or instruments and may at any time hold, or recommend to clients that they acquire, long and/or short positions in such securities and instruments.
121
Table of Contents
Index to Financial Statements
The validity of our common stock offered by this prospectus will be passed upon for us by Vinson & Elkins L.L.P., Houston, Texas. Certain legal matters in connection with this offering will be passed upon for the underwriters by Baker Botts L.L.P., Houston, Texas.
The consolidated financial statements of Midstates Petroleum Holdings, LLC and subsidiary (the “Successor”) as of September 30, 2011, December 31, 2010 and 2009 and for the nine month period ended September 30, 2011, years ended December 31, 2010 and 2009, and the period from August 30, 2008 through December 31, 2008, and of Midstates Petroleum Corporation (the “Predecessor”) for the period from January 1, 2008 through August 29, 2008, included in this prospectus, have been audited by Deloitte & Touche LLP, an independent registered public accounting firm, as stated in their report appearing herein (which report expresses an unqualified opinion and includes an explanatory paragraph referring to the adoption of oil and gas reserves guidance on December 31, 2009). Such financial statements have been so included in reliance upon the report of such firm given upon their authority as experts in accounting and auditing.
The balance sheet of Midstates Petroleum Company, Inc. included in this prospectus, has been audited by Deloitte & Touche LLP, an independent registered public accounting firm, as stated in their report appearing herein. Such financial statement has been so included in reliance upon the report of such firm given upon their authority as experts in accounting and auditing.
The information included in this prospectus regarding estimated quantities of proved and probable reserves, the future net revenues from those reserves and their present values as of September 30, 2011 and as of December 31, 2010 and 2009 is based, in part, on estimates of the proved reserves and present values of proved reserves as of September 30, 2011 and December 31, 2010 and 2009, which are based on reports prepared by Netherland, Sewell & Associates, Inc., independent reserve engineers. These estimates are included in this prospectus in reliance upon the authority of such firm as an expert in these matters.
122
Table of Contents
Index to Financial Statements
WHERE YOU CAN FIND MORE INFORMATION
We have filed with the SEC a registration statement on Form S-1 (including the exhibits, schedules and amendments thereto) under the Securities Act, with respect to the shares of our common stock offered hereby. This prospectus does not contain all of the information set forth in the registration statement and the exhibits and schedules thereto. For further information with respect to us and the common stock offered hereby, we refer you to the registration statement and the exhibits and schedules filed therewith. Statements contained in this prospectus as to the contents of any contract, agreement or any other document are summaries of the material terms of this contract, agreement or other document and are not necessarily complete. With respect to each of these contracts, agreements or other documents filed as an exhibit to the registration statement, reference is made to the exhibits for a more complete description of the matter involved. A copy of the registration statement, and the exhibits and schedules thereto, may be inspected without charge at the public reference facilities maintained by the SEC at 100 F Street NE, Washington, D.C. 20549. Copies of these materials may be obtained, upon payment of a duplicating fee, from the Public Reference Section of the SEC at 100 F Street NE, Washington, D.C. 20549. Please call the SEC at 1-800-SEC-0330 for further information on the operation of the public reference facility. The SEC maintains a website that contains reports, proxy and information statements and other information regarding registrants that file electronically with the SEC. The address of the SEC’s website is www.sec.gov.
As a result of the offering, we will become subject to the full informational requirements of the Exchange Act. We will fulfill our obligations with respect to such requirements by filing periodic reports and other information with the SEC. We intend to furnish our shareholders with annual reports containing financial statements certified by an independent public accounting firm.
123
Table of Contents
Index to Financial Statements
| Page | ||||
| F-2 | ||||
| Midstates Petroleum Holdings LLC |
||||
| Consolidated balance sheets as of September 30, 2011 and December 31, 2010 |
F-3 | |||
| F-4 | ||||
| Consolidated statement of members’ equity for the nine months ended September 30, 2011 |
F-5 | |||
| F-6 | ||||
| F-7 | ||||
| Midstates Petroleum Holdings LLC |
||||
| Consolidated balance sheets as of December 31, 2010 and 2009 |
F-27 | |||
| F-28 | ||||
| F-29 | ||||
| F-30 | ||||
| F-31 | ||||
| Midstates Petroleum Company, Inc. |
||||
| F-54 | ||||
| F-55 | ||||
| F-56 | ||||
F-1
Table of Contents
Index to Financial Statements
REPORT OF INDEPENDENT REGISTERED PUBLIC ACCOUNTING FIRM
To the Board of Directors of
Midstates Petroleum Company, Inc.
Houston, Texas
We have audited the accompanying consolidated balance sheets of Midstates Petroleum Holdings, LLC and subsidiary (the “Company”) as of September 30, 2011, December 31, 2010 and 2009, and the related consolidated statements of operations, members’ equity, and cash flows for the nine month period ended September 30, 2011, years ended December 31, 2010 and 2009, the period from August 30, 2008 through December 31, 2008 (successor), and of Midstates Petroleum Corporation for the period from January 1, 2008 to August 29, 2008 (predecessor). These financial statements are the responsibility of the Company’s management. Our responsibility is to express an opinion on the financial statements based on our audits.
We conducted our audits in accordance with the standards of the Public Company Accounting Oversight Board (United States). Those standards require that we plan and perform the audit to obtain reasonable assurance about whether the financial statements are free of material misstatement. The Company is not required to have, nor were we engaged to perform, an audit of its internal control over financial reporting. Our audits included consideration of internal control over financial reporting as a basis for designing audit procedures that are appropriate in the circumstances, but not for the purpose of expressing an opinion on the effectiveness of the Company’s internal control over financial reporting. Accordingly, we express no such opinion. An audit also includes examining, on a test basis, evidence supporting the amounts and disclosures in the financial statements, assessing the accounting principles used and significant estimates made by management, as well as evaluating the overall financial statement presentation. We believe that our audits provide a reasonable basis for our opinion.
In our opinion, such consolidated financial statements present fairly, in all material respects, the financial position of Midstates Petroleum Holdings, LLC and subsidiary as of September 30, 2011, December 31, 2010 and 2009, and the results of their operations and their cash flows for the nine month period ended September 30, 2011, years ended December 31, 2010 and 2009, and the period from August 30, 2008 through December 31, 2008 (successor), and the results of operations and cash flows of Midstates Petroleum Corporation for the period from January 1, 2008 to August 29, 2008 (predecessor) in conformity with accounting principles generally accepted in the United States of America.
As discussed in Note 2 to the consolidated financial statements for the year ended December 31, 2010, the Company adopted new accounting guidance on December 31, 2009 related to the estimation of oil and gas reserves.
/s/ DELOITTE & TOUCHE LLP
Houston, Texas
November 14, 2011
F-2
Table of Contents
Index to Financial Statements
Midstates Petroleum Holdings LLC
Consolidated Balance Sheets
| September 30, 2011 |
December 31, 2010 |
|||||||
| (In thousands) | ||||||||
| ASSETS |
||||||||
| CURRENT ASSETS: |
||||||||
| Cash and cash equivalents |
$ | 10,220 | $ | 11,917 | ||||
| Accounts receivable: |
||||||||
| Oil and gas sales |
17,900 | 14,141 | ||||||
| Member contributions |
2,700 | — | ||||||
| Severance tax refund |
5,396 | — | ||||||
| Other |
253 | 537 | ||||||
| Prepayments and other current assets |
41 | 383 | ||||||
| Inventory |
2,428 | 1,173 | ||||||
| Derivative financial instruments |
4,038 | — | ||||||
|
|
|
|
|
|||||
| Total current assets |
42,976 | 28,151 | ||||||
|
|
|
|
|
|||||
| PROPERTY AND EQUIPMENT: |
||||||||
| Oil and gas properties, on the basis of full-cost accounting: |
||||||||
| Proved properties |
563,791 | 351,544 | ||||||
| Unevaluated properties |
72,186 | 101,366 | ||||||
| Other property and equipment |
1,515 | 1,360 | ||||||
| Less accumulated depreciation, depletion, and amortization |
(118,784 | ) | (57,144 | ) | ||||
|
|
|
|
|
|||||
| Net property and equipment |
518,708 | 397,126 | ||||||
|
|
|
|
|
|||||
| OTHER ASSETS: |
||||||||
| Derivative financial instruments |
2,082 | — | ||||||
| Security deposit and other noncurrent assets |
1,985 | 1,727 | ||||||
|
|
|
|
|
|||||
| Total other assets |
4,067 | 1,727 | ||||||
|
|
|
|
|
|||||
| TOTAL |
$ | 565,751 | $ | 427,004 | ||||
|
|
|
|
|
|||||
| LIABILITIES AND MEMBERS’ EQUITY |
||||||||
| CURRENT LIABILITIES: |
||||||||
| Accounts payable and accrued liabilities |
$ | 69,387 | $ | 42,619 | ||||
| Derivative financial instruments |
705 | 12,657 | ||||||
|
|
|
|
|
|||||
| Total current liabilities |
70,092 | 55,276 | ||||||
|
|
|
|
|
|||||
| LONG-TERM LIABILITIES: |
||||||||
| Asset retirement obligations |
7,094 | 2,859 | ||||||
| Derivative financial instruments |
— | 16,464 | ||||||
| Long-term debt |
198,600 | 89,600 | ||||||
| Other long-term liabilities |
12,043 | 6,926 | ||||||
|
|
|
|
|
|||||
| Total long-term liabilities |
217,737 | 115,849 | ||||||
|
|
|
|
|
|||||
| COMMITMENTS AND CONTINGENCIES (Note 10) |
||||||||
| MEMBERS’ EQUITY (including $0 and $47 million of preferred units, respectively) |
277,922 | 255,879 | ||||||
|
|
|
|
|
|||||
| TOTAL |
$ | 565,751 | $ | 427,004 | ||||
|
|
|
|
|
|||||
The accompanying notes are an integral part of these consolidated financial statements.
F-3
Table of Contents
Index to Financial Statements
Midstates Petroleum Holdings LLC
Consolidated Statements of Operations
| Nine Months Ended September 30, 2011 |
Nine Months Ended September 30, 2010 (Unaudited) |
|||||||
| (In thousands) | ||||||||
| REVENUES: |
||||||||
| Oil sales |
$ | 122,817 | $ | 50,592 | ||||
| Natural gas sales |
14,813 | 7,564 | ||||||
| Natural gas liquid sales |
9,949 | 140 | ||||||
| Gains (losses) on commodity derivative contracts — net |
22,442 | (6,453 | ) | |||||
| Other |
260 | 185 | ||||||
|
|
|
|
|
|||||
| Total revenues |
170,281 | 52,028 | ||||||
|
|
|
|
|
|||||
| EXPENSES: |
||||||||
| Lease operating |
9,451 | 5,225 | ||||||
| Workover |
1,301 | 3,856 | ||||||
| Severance tax |
8,437 | 4,193 | ||||||
| Asset retirement accretion |
205 | 108 | ||||||
| General and administrative |
15,519 | 11,820 | ||||||
| Depreciation, depletion, and amortization |
61,640 | 26,924 | ||||||
|
|
|
|
|
|||||
| Total expenses |
96,553 | 52,126 | ||||||
|
|
|
|
|
|||||
| OPERATING INCOME (LOSS) |
73,728 | (98 | ) | |||||
| OTHER INCOME |
||||||||
| Interest income |
15 | 6 | ||||||
| Interest expense — net of amounts capitalized |
(735 | ) | — | |||||
|
|
|
|
|
|||||
| NET INCOME (LOSS) |
$ | 73,008 | $ | (92 | ) | |||
|
|
|
|
|
|||||
| Unaudited pro forma income tax provision |
$ | 29,203 | ||||||
|
|
|
|||||||
| Unaudited pro forma net income |
$ | 43,805 | ||||||
|
|
|
|||||||
The accompanying notes are an integral part of these consolidated financial statements.
F-4
Table of Contents
Index to Financial Statements
Midstates Petroleum Holdings LLC
Consolidated Statement of Members’ Equity
| BALANCE — December 31, 2009 |
235,334 | |||
| Preferred equity units issued (see Note 7) |
17,503 | |||
| Preferred units converted from common units (see Note 7) |
5,080 | |||
| Common units converted to preferred units (see Note 7) |
(5,080 | ) | ||
| Net loss |
(92 | ) | ||
|
|
|
|||
| BALANCE — September 30, 2010 |
$ | 252,745 | ||
|
|
|
|||
| BALANCE — December 31, 2010 |
$ | 255,879 | ||
|
|
|
|||
| Distribution to members — preferred units |
(47,000 | ) | ||
| Distribution to members — return on preferred units |
(3,572 | ) | ||
| Members’ Contribution |
170 | |||
| Other |
(563 | ) | ||
| Net income |
73,008 | |||
|
|
|
|||
| BALANCE — September 30, 2011 |
$ | 277,922 | ||
|
|
|
|||
The accompanying notes are an integral part of these consolidated financial statements.
F-5
Table of Contents
Index to Financial Statements
Midstates Petroleum Holdings LLC
Consolidated Statements of Cash Flows
| Nine Months Ended September 30, 2011 |
Nine Months Ended September 30, 2010 (unaudited) |
|||||||
| (In thousands) |
||||||||
| CASH FLOWS FROM OPERATING ACTIVITIES: |
||||||||
| Net income (loss) |
$ | 73,008 | $ | (92 | ) | |||
| Adjustments to reconcile net loss to net cash provided by operating activities: |
||||||||
| Unrealized (gains) losses on commodity derivative contracts |
(34,587 | ) | 6,737 | |||||
| Asset retirement accretion expense |
205 | 108 | ||||||
| Depreciation, depletion, and amortization expense |
61,640 | 26,924 | ||||||
| Stock-based compensation |
1,772 | 1,065 | ||||||
| Change in operating assets and liabilities: |
||||||||
| Accounts receivable — oil and gas sales |
(3,759 | ) | (6,184 | ) | ||||
| Accounts receivable — severance tax refund |
(5,396 | ) | — | |||||
| Accounts receivable — other |
284 | (811 | ) | |||||
| Prepayments and other assets |
342 | 2,209 | ||||||
| Inventory |
(1,255 | ) | 105 | |||||
| Accounts payable, accrued liabilities, and other |
11,057 | 5,734 | ||||||
|
|
|
|
|
|||||
| Net cash provided by operating activities |
103,311 | 35,795 | ||||||
|
|
|
|
|
|||||
| CASH FLOWS FROM INVESTING ACTIVITIES: |
||||||||
| Investment in property and equipment |
(162,739 | ) | (94,214 | ) | ||||
| Investment in acquired property |
— | (60 | ) | |||||
|
|
|
|
|
|||||
| Net cash used in investing activities |
(162,739 | ) | (94,274 | ) | ||||
|
|
|
|
|
|||||
| CASH FLOWS FROM FINANCING ACTIVITIES: |
||||||||
| Proceeds from long-term borrowings |
109,000 | 47,000 | ||||||
| Members’ equity contribution |
170 | 18,399 | ||||||
| Distribution to members |
(50,572 | ) | — | |||||
| Other |
(867 | ) | (323 | ) | ||||
|
|
|
|
|
|||||
| Net cash provided by financing activities |
57,731 | 65,076 | ||||||
|
|
|
|
|
|||||
| NET (DECREASE) INCREASE IN CASH AND CASH EQUIVALENTS |
(1,697 | ) | 6,597 | |||||
| Cash and cash equivalents, beginning of period |
11,917 | 4,353 | ||||||
|
|
|
|
|
|||||
| Cash and cash equivalents, end of period |
$ | 10,220 | $ | 10,950 | ||||
|
|
|
|
|
|||||
| SUPPLEMENTAL INFORMATION: |
||||||||
| Non-cash transactions — investments in property and equipment accrued — not paid |
$ | 52,000 | $ | 21,200 | ||||
|
|
|
|
|
|||||
| Non-cash members’ contribution |
$ | 2,700 | — | |||||
|
|
|
|
|
|||||
| Cash paid for interest net of interest capitalized of $2.0 million and $1.0 million, respectively |
$ | 735 | $ | — | ||||
|
|
|
|
|
|||||
The accompanying notes are an integral part of these consolidated financial statements.
F-6
Table of Contents
Index to Financial Statements
Midstates Petroleum Holdings LLC
Notes to Consolidated Financial Statements
| 1. | Organization and Business |
Midstates Petroleum Holdings LLC (the “Company”) and its wholly owned subsidiary, Midstates Petroleum Company LLC (“Subsidiary”), engages in the business of the drilling for and production of oil, natural gas and natural gas liquids. The Company currently has oil and gas operations solely in the state of Louisiana.
At September 30, 2011, the Company is 76.73% owned by FR Midstates Holdings LLC (“FR Midstates”), 22.64% owned by Midstates Petroleum Holdings, Inc. (“Petroleum Inc.”), through which the Company’s founders, management and certain employees hold their equity interests, and 0.63% owned by certain members of management and employees.
| 2. | Summary of Significant Accounting Policies |
Basis of Presentation
The accompanying consolidated financial statements of the Company include the accounts of the Company and Subsidiary. These statements have been prepared in accordance with accounting principles generally accepted in the United States of America (“GAAP”) and reflect, in the opinion of the Company’s management, all adjustments necessary to present fairly the financial position as of, and the results of operations for, the periods presented. All intercompany transactions have been eliminated in consolidation.
The Company operates its oil and natural gas properties as one business segment: the exploration, development and production of oil and natural gas. The Company’s management evaluates performance based on one business segment as there are not different economic environments within the operation of the Company’s oil and natural gas properties.
Interim Periods
Interim periods are not necessarily indicative of results of operations or cash flows for the full year. The Company has evaluated events and transactions through the date of issuance of these consolidated financial statements.
Use of Estimates
The preparation of financial statements in conformity with GAAP requires management to make estimates and assumptions that affect the reported amounts of assets and liabilities and disclosure of contingent assets and liabilities at the date of the financial statements and the reported amounts of revenues and expenses during the reporting period. Actual results could differ from those estimates.
Significant estimates include, but are not limited to, oil and natural gas reserves; depreciation, depletion, and amortization of proved oil and natural gas properties; future cash flows from oil and natural gas properties; fair value of derivatives; fair value of equity compensation; and asset retirement obligations.
Cash and Cash Equivalents
The Company considers all short-term investments with an original maturity of three months or less to be cash equivalents.
F-7
Table of Contents
Index to Financial Statements
Midstates Petroleum Holdings LLC
Notes to Consolidated Financial Statements
Accounts Receivable and Allowance for Doubtful Accounts
Accounts receivable are stated at the historical carrying amount net of write-offs and allowance for uncollectible accounts. The carrying amount of the Company’s accounts receivable approximate fair value because of the short-term nature of the instruments. The Company accrues a reserve on a receivable when, based on the judgment of management, it is probable that a receivable will not be collected and the amount of any reserve may be reasonably estimated. As of September 30, 2011 and December 31, 2010, the Company had no allowance for doubtful accounts.
Oil and Natural Gas Properties
The Company uses the full-cost method of accounting for its exploration and development activities. Under this method of accounting, the cost of both successful and unsuccessful exploration and development activities are capitalized as property and equipment. This includes any internal costs that are directly related to exploration and development activities, but does not include any costs related to production, general corporate overhead or similar activities. Historically, total capitalized internal costs in any given period have not been material to total oil and gas costs capitalized in such period. Proceeds from the sale or disposition of oil and gas properties are accounted for as a reduction to capitalized costs unless a significant portion (greater than 25 percent) of the Company’s reserve quantities are sold, in which case a gain or loss is generally recognized in income.
For the nine months ended September 30, 2011 and September 30, 2010, depletion expense related to oil and gas properties was $61.4 million and $26.8 million, respectively and $32.86 and $29.85 per Boe, respectively.
Unevaluated Property
Oil and gas unevaluated properties and properties under development include costs that are excluded from costs being depleted or amortized. These costs represent investments in unproved properties. The Company excludes these costs until proved reserves are found, until it is determined that the costs are impaired or until major development projects are placed in service. All costs excluded are reviewed at least annually to determine if impairment has occurred.
Oil and Gas Reserves
The estimates of proved oil and natural gas reserves utilized in the preparation of the consolidated financial statements are estimated in accordance with the rules established by the Securities and Exchange Commission (SEC) and the Financial Accounting Standards Board (FASB), which subsequent to December 31, 2008 require that reserve estimates be prepared under existing economic and operating conditions using a 12-month average price with no provision for price and cost escalations in future years except by contractual arrangements. The Company’s reserve estimates at September 30, 2011 and at December 31, 2010 and 2009 were prepared by a third-party petroleum engineer, Netherland, Sewell & Associates, Inc. (“NSAI”). The reserve estimates at December 31, 2008 were prepared by our internal engineers.
Reserve estimates are inherently imprecise. Accordingly, the estimates are expected to change as more current information becomes available. The Company depletes its oil and gas properties using the units-of-production method. Capitalized costs of oil and natural gas properties are depleted over proved reserves. It is possible that, because of changes in market conditions or the inherent imprecision of reserve estimates, the estimates of future cash inflows, future gross
F-8
Table of Contents
Index to Financial Statements
Midstates Petroleum Holdings LLC
Notes to Consolidated Financial Statements
revenues, the amount of oil and natural gas reserves, the remaining estimated lives of oil and natural gas properties, or any combination of the above may be increased or reduced. Increases in recoverable economic volumes generally reduce per unit depletion rates while decreases in recoverable economic volumes generally increase per unit depletion rates.
Other Property and Equipment
Other property and equipment consists of vehicles, furniture and fixtures, and computer hardware and software and are carried at cost. Depreciation is provided principally using the straight-line method over the estimated useful lives of the assets, which range from five to seven years. Maintenance and repairs are charged to expense as incurred, while renewals and betterments are capitalized. For each of the nine months ended September 30, 2011 and September 30, 2010, depreciation expense related to other property and equipment was $0.2 million.
Impairment of Oil and Gas Properties/Ceiling Test
Under the existing full-cost method of accounting, a ceiling test is performed at least annually. The test establishes a limit (ceiling) on the book value of oil and gas properties. The capitalized costs of proved oil and gas properties, net of accumulated depreciation, depletion and amortization (DD&A) and the related deferred income taxes, may not exceed this “ceiling.” The ceiling limitation is the present value of the estimated after-tax future net cash flows from proved oil and gas reserves, excluding future cash outflows associated with settling asset retirement obligations accrued on the balance sheet. If capitalized costs exceed this ceiling, the excess is charged to expense in the accompanying consolidated statements of operations.
Effective December 31, 2009, the Company adopted revised oil and gas disclosure requirements set forth by the SEC in Release No. 33-8995, “Modernization of Oil and Gas Reporting” and as codified by the FASB in Accounting Standards Codification (ASC) Topic 932, “Extractive Industries — Oil and Gas.”
No impairment expense was recorded for the nine months ended September 30, 2011 and the nine months ended September 30, 2010.
Depreciation, Depletion, and Amortization (DD&A)
DD&A of oil and gas properties is calculated quarterly using the Units of Production Method (UOP). The UOP calculation, in its simplest terms, multiplies the percentage of estimated proved reserves produced each quarter times the cost of those reserves. The result is to recognize expense at the same pace that the reservoirs are actually depleting. The amortization base in the UOP calculation includes the sum of proved property costs net of accumulated DD&A, estimated future development costs (future costs to access and develop reserves) and asset retirement costs that are not already included in oil and gas property, less related salvage value.
Revenue Recognition
Oil and gas revenues are recognized when production is sold to a purchaser at a fixed or determinable price, when delivery has occurred and title has transferred and collection of the revenues is reasonably assured. Cash received relating to future revenues is deferred and recognized when all revenue recognition criteria are met. The Company had no significant gas imbalances at September 30, 2011 or December 31, 2010.
F-9
Table of Contents
Index to Financial Statements
Midstates Petroleum Holdings LLC
Notes to Consolidated Financial Statements
Income Taxes
The Company is not a taxpaying entity for federal income tax purposes and, accordingly, it does not recognize any expense for such taxes. The income tax liability resulting from the Company’s activities is the responsibility of the Company’s members. In the event of an examination of the Company’s tax return, the tax liability of the members could be changed if an adjustment of the Company’s income or loss is ultimately sustained by the taxing authorities.
The unaudited pro forma income tax provision (benefit) on the consolidated statements of operations reflects the effect of the Company’s anticipated initial public offering. After consummation, the Company will be subject to U.S. federal and certain state income taxes. The pro forma effective tax rate reflected herein differs from the expected federal statutory rate of 35% due to state income taxes (net of federal benefit) and other typical industry permanent differences. No valuation allowance was deemed necessary due to the presence of future net taxable amounts in excess of deferred tax assets; management placed no reliance on other future taxable income.
The Company, on a pro forma basis, would have recorded a tax provision during the period ended September 30, 2011 of $29.2 million (unaudited). A recalculation of the ceiling test during the period on a pro forma after-tax basis (unaudited) did not result in an impairment.
Financial Instruments
The Company’s financial instruments consist of cash and cash equivalents, receivables, payables, debt, and commodity derivatives. Commodity derivatives are recorded at fair value (see Note 3). The carrying amount of floating-rate debt approximates fair value because the interest rates are variable and reflective of market rates. The carrying amount of the Company’s other financial instruments approximate fair value because of the short-term nature of the items or variable pricing.
Derivative financial instruments are recorded in the consolidated balance sheets as either an asset or liability measured at estimated fair value. Changes in the derivative’s fair value are recognized currently in earnings as gains and losses in the period of change. The gains or losses are recorded in “Gains (losses) on commodity derivative contracts — net.” The related cash flow impact is reflected within cash flows from operating activities.
Asset Retirement Obligations
The legal obligations associated with the retirement of long-lived assets is recognized at estimated fair value at the time that the obligation is incurred. Oil and gas producing companies incur such a liability upon acquiring or drilling a well. The Company estimates the fair value of an asset retirement obligation in the period in which the obligation is incurred and the corresponding asset retirement cost is capitalized by increasing the carrying amount of the related long-lived asset. The liability is accreted to its then present value each period, and the capitalized cost is depreciated over the useful life of the related asset. If the liability is settled for an amount other than the recorded amount, a gain or loss is recorded in the full cost pool. See Note 5.
Capitalized Interest
Interest from external borrowings is capitalized on unevaluated properties using the weighted-average cost of outstanding borrowings until the project is substantially complete and ready for its intended use, which for oil and gas assets is at the first production from the field. Capitalized interest is depleted over the useful lives of the assets in the same manner as the depletion of the underlying assets. Interest capitalized to unevaluated properties was $2.0 million for the nine months ended September 30, 2011 and $1.0 million for the nine months ended September 30, 2010.
F-10
Table of Contents
Index to Financial Statements
Midstates Petroleum Holdings LLC
Notes to Consolidated Financial Statements
Subsequent Events
The Company has evaluated subsequent events through November 14, 2011, the date the consolidated financial statements were issued.
| 3. | Fair Value Measurements of Financial Instruments |
The Company uses a valuation framework based upon inputs that market participants use in pricing an asset or liability, which are classified into two categories: observable inputs and unobservable inputs. Observable inputs represent market data obtained from independent sources; whereas, unobservable inputs reflect a company’s own market assumptions, which are used if observable inputs are not reasonably available without undue cost and effort. These two types of inputs are further divided into the following fair value input hierarchy:
Level 1 — Inputs are unadjusted quoted prices in active markets for identical assets or liabilities at the measurement date.
Level 2 — Inputs, other than quoted prices included in Level 1, are observable for the asset or liability, either directly or indirectly. Level 2 inputs include quoted prices for similar instruments in active markets, and inputs other than quoted prices that are observable for the asset or liability. Fair value assets and liabilities that are generally included in this category are derivatives with fair values based on inputs from actively quoted markets. The Company uses a market approach to estimate the fair values of its derivative instruments, utilizing commodity futures price strips for the underlying commodities provided by a reputable third-party.
Level 3 — Inputs are unobservable for the asset or liability, and include situations where there is little, if any, market activity for the asset or liability.
Financial assets and liabilities are classified based on the lowest level of input that is significant to the fair value measurement. The Company’s assessment of the significance of a particular input to the fair value measurement requires judgment, and may affect the valuation of the fair value of assets and liabilities and their placement within the fair value hierarchy levels.
Assets and Liabilities Measured at Fair Value on a Recurring Basis
Derivative Instruments — Derivative financial instruments reflected in the consolidated balance sheets are recorded at estimated fair value.
At September 30, 2011 and December 31, 2010, all of the Company’s derivative instruments were with two and one bank counterparties, respectively, and are classified as Level 2.
F-11
Table of Contents
Index to Financial Statements
Midstates Petroleum Holdings LLC
Notes to Consolidated Financial Statements
| Fair Value Measurements at September 30, 2011 | ||||||||||||||||
| Quoted Prices in Active Markets (Level 1) |
Significant Other Observable Inputs (Level 2) |
Significant Unobservable Inputs (Level 3) |
Total | |||||||||||||
| (in thousands) | ||||||||||||||||
| Assets: |
||||||||||||||||
| Commodity derivative oil swaps |
$ | — | $ | 4,842 | $ | — | $ | 4,842 | ||||||||
| Commodity derivative deferred premium puts |
— | 7,535 | — | 7,535 | ||||||||||||
| Commodity derivative collars |
— | 2,309 | — | 2,309 | ||||||||||||
| Commodity derivative differential swaps |
— | — | — | — | ||||||||||||
|
|
|
|
|
|
|
|
|
|||||||||
| Total assets |
— | 14,686 | — | 14,686 | ||||||||||||
| Liabilities: |
||||||||||||||||
| Commodity derivative oil swaps |
— | 841 | — | 841 | ||||||||||||
| Commodity derivative deferred premium puts |
— | 323 | — | 323 | ||||||||||||
| Commodity derivative collars |
— | — | — | — | ||||||||||||
| Commodity derivative differential swaps |
— | 8,107 | — | 8,107 | ||||||||||||
|
|
|
|
|
|
|
|
|
|||||||||
| Total liabilities |
$ | — | $ | 9,271 | $ | — | $ | 9,271 | ||||||||
| Fair Value Measurements at December 31, 2010 | ||||||||||||||||
| Quoted Prices in Active Markets (Level 1) |
Significant Other Observable Inputs (Level 2) |
Significant Unobservable Inputs (Level 3) |
Total | |||||||||||||
| (in thousands) | ||||||||||||||||
| Assets: |
||||||||||||||||
| Commodity derivative oil swaps |
$ | — | $ | — | $ | — | $ | — | ||||||||
| Commodity derivative deferred premium puts |
— | — | — | — | ||||||||||||
| Commodity derivative collars |
— | — | — | — | ||||||||||||
|
|
|
|
|
|
|
|
|
|||||||||
| Total assets |
— | — | — | — | ||||||||||||
| Liabilities: |
||||||||||||||||
| Commodity derivative oil swaps |
— | 27,735 | — | 27,735 | ||||||||||||
| Commodity derivative deferred premium puts |
— | 1,386 | — | 1,386 | ||||||||||||
| Commodity derivative collars |
— | — | — | — | ||||||||||||
|
|
|
|
|
|
|
|
|
|||||||||
| Total liabilities |
$ | — | $ | 29,121 | $ | — | $ | 29,121 | ||||||||
Derivative instruments listed above include collars, swaps, and put options that are carried at fair value. The Company records the net change in the fair value of these positions in “Gains (losses) on commodity derivative contracts—net” in the Company’s consolidated statements of operations. The Company is able to value the assets and liabilities based on observable market data for similar instruments, which resulted in the Company reporting its derivatives as Level 2. This observable data includes the forward curve for commodity prices based on quoted markets prices and implied volatility factors related to changes in the forward curves.
For additional information on the Company’s derivative instruments, see Note 4.
F-12
Table of Contents
Index to Financial Statements
Midstates Petroleum Holdings LLC
Notes to Consolidated Financial Statements
Assets and Liabilities Measured at Fair Value on a Nonrecurring Basis
Certain assets and liabilities are reported at fair value on a nonrecurring basis in the Company’s consolidated balance sheets. The following methods and assumptions were used to estimate the fair values:
Asset Retirement Obligations (ARO’s) — The Company estimates the fair value of ARO’s based on discounted cash flow projections using numerous estimates, assumptions and judgments regarding such factors as the existence of a legal obligation for an ARO, amounts and timing of settlements, the credit-adjusted risk-free rate to be used and inflation rates. See Note 5 for a summary of changes in ARO’s.
Debt — The Company’s debt is recorded at the carrying amount on its consolidated balance sheet. For further discussion of the Company’s debt, please see Note 6 — Debt. The carrying amount of floating-rate debt approximates fair value because the interest rates are variable and reflective of market rates.
| 4. | Risk Management and Derivative Instruments |
The Company is exposed to fluctuations in crude oil and natural gas prices on its production. Management believes it is prudent to manage the variability in cash flows by entering into derivative financial instruments to economically hedge a portion of its crude oil and natural gas production. The Company utilizes various types of derivative financial instruments, including swaps and options, to manage fluctuations in cash flows resulting from changes in commodity prices. These derivative contracts are generally placed with major financial institutions that the Company believes are minimal credit risks. The oil and gas reference prices, upon which the commodity derivative contracts are based, reflect various market indices that have a high degree of historical correlation with actual prices received by the Company for its oil and gas production.
Inherent in the Company’s portfolio of commodity derivative contracts are certain business risks, including market risk and credit risk. Market risk is the risk that the price of the commodity will change, either favorably or unfavorably, in response to changing market conditions. Credit risk is the risk of loss from nonperformance by the Company’s counterparty to a contract. The Company does not require collateral from its counterparties but does attempt to minimize its credit risk associated with derivative instruments by entering into derivative instruments only with counterparties that are large financial institutions, which management believes present minimal credit risk. In addition, to mitigate its risk of loss due to default, the Company has entered into agreements with its counterparties on its derivative instruments that allow the Company to offset its asset position with its liability position in the event of default by the counterparty. Had the Company’s counterparties failed to perform under existing derivative contracts, the maximum loss at September 30, 2011 would have been approximately $5.4 million.
F-13
Table of Contents
Index to Financial Statements
Midstates Petroleum Holdings LLC
Notes to Consolidated Financial Statements
Commodity Derivatives
The Company uses commodity derivatives to manage its exposure to commodity price volatility.
As of September 30, 2011, the Company had the following open commodity positions:
| Hedged Volume |
Weighted- Average Fixed Price |
|||||||
| Oil (Bbls): |
||||||||
| Swaps – 2011 |
248,400 | $ | 82.64 | |||||
| Swaps – 2012 |
893,400 | 84.16 | ||||||
| Swaps – 2013 |
679,125 | 84.73 | ||||||
| Swaps – 2014 |
262,450 | 83.00 | ||||||
| Collars – 2011 |
36,800 | $ | 85.00 – $137.38 | |||||
| Collars – 2012 |
164,700 | $ | 85.00 – $127.28 | |||||
| Deferred Premium Puts – 2011 (1) |
138,000 | $ | 82.54 | |||||
| Deferred Premium Puts – 2012 (1) |
549,000 | 79.01 | ||||||
| Basis Differential Swaps – 2011 (2) |
92,000 | $ | 11.25 | |||||
| Basis Differential Swaps – 2012 (2) |
1,134,600 | 9.78 | ||||||
| Basis Differential Swaps – 2013 (2) |
182,500 | 7.50 | ||||||
| (1) | 2011 deferred premium puts represent the net effective floor price of a put with a strike price of $88.33/Bbl and a deferred premium of $5.79/Bbl. 2012 deferred premium puts represent the net effective floor price of a put with a strike price of $85.00/Bbl and a deferred premium of $5.99/Bbl. The premiums for these instruments are paid each month, concurrently with the settlement of the monthly put contracts. |
| (2) | We enter into swap arrangements intended to capture the positive differential between LLS pricing and NYMEX WTI pricing. |
F-14
Table of Contents
Index to Financial Statements
Midstates Petroleum Holdings LLC
Notes to Consolidated Financial Statements
Balance Sheet Presentation
The following table summarizes the gross fair value of derivative instruments by the appropriate balance sheet classification, even when the derivative instruments are subject to netting arrangements and qualify for net presentation in the Company’s consolidated balance sheets at September 30, 2011 and December 31, 2010 (in thousands):
| Type |
Balance Sheet Location (1) |
September 30, 2011 |
December 31, 2010 |
|||||||
| Oil Swaps |
Derivative financial instruments — Current Assets | $ | 3,292 | |||||||
| Oil Swaps |
Derivative financial instruments — Non-Current Assets | 1,550 | ||||||||
| Oil Swaps |
Derivative financial instruments — Current Liabilities | (310 | ) | (11,394 | ) | |||||
| Oil Swaps |
Derivative financial instruments — Non-Current Liabilities | (531 | ) | (16,341 | ) | |||||
| Deferred Premium Puts |
Derivative financial instruments — Current Assets | 5,803 | ||||||||
| Deferred Premium Puts |
Derivative financial instruments — Non-Current Assets | 1,732 | ||||||||
| Deferred Premium Puts |
Derivative financial instruments — Current Liabilities | (323 | ) | (1,263 | ) | |||||
| Deferred Premium Puts |
Derivative financial instruments — Non-Current Liabilities | 0 | (123 | ) | ||||||
| Collars |
Derivative financial instruments — Current Assets | 1,798 | ||||||||
| Collars |
Derivative financial instruments — Non-Current Assets | 511 | ||||||||
| Collars |
Derivative financial instruments — Current Liabilities | 0 | ||||||||
| Collars |
Derivative financial instruments — Non-Current Liabilities | 0 | ||||||||
| Basis Differential Swaps |
Derivative financial instruments — Current Assets | 0 | ||||||||
| Basis Differential Swaps |
Derivative financial instruments — Non-Current Assets | 0 | ||||||||
| Basis Differential Swaps |
Derivative financial instruments — Current Liabilities | (6,927 | ) | |||||||
| Basis Differential Swaps |
Derivative financial instruments — Non-Current Liabilities | (1,180 | ) | |||||||
|
|
|
|
|
|||||||
| Total |
$ | 5,415 | $ | (29,121 | ) | |||||
|
|
|
|
|
|||||||
| (1) | The fair value of derivative instruments reported in the Company’s consolidated balance sheets are subject to netting arrangements and qualify for net presentation. The following table reports the net derivative fair values as reported in the Company’s consolidated balance sheets as of September 30, 2011 and December 30, 2010 (in thousands): |
| September 30, 2011 |
December 31, 2010 |
|||||||
| Consolidated balance sheet classification: |
||||||||
| Current derivative instruments: |
||||||||
| Assets |
$ | 4,038 | $ | — | ||||
| Liabilities |
(705 | ) | (12,657 | ) | ||||
| Non-current derivative instruments : |
||||||||
| Assets |
2,082 | — | ||||||
| Liabilities |
— | (16,464 | ) | |||||
Gains (Losses) on Derivatives
The Company does not designate its derivative instruments as hedging instruments for financial reporting purposes. Accordingly, all gains and losses, including unrealized gains and losses from changes in the derivative instruments’ fair values, have been recorded in “Gains (losses) on commodity derivative contracts — net”, within revenues in the consolidated statements of operations.
For the nine months ended September 30, 2011 and September 30, 2010, the Company realized net gains (losses) of ($12.1) million and $0.3 million, respectively.
F-15
Table of Contents
Index to Financial Statements
Midstates Petroleum Holdings LLC
Notes to Consolidated Financial Statements
For the nine months ended September 30, 2011 and September 30, 2010, the Company recorded net unrealized gains (losses) of $34.6 million and ($6.7) million, respectively, related to the change in fair value of the derivative financial instruments in “Gains (losses) on commodity derivative contracts — net.”
| 5. | Asset Retirement Obligation |
For the Company, asset retirement obligations represent the future abandonment costs of tangible assets, such as wells, service assets, and other facilities. The present value of estimated asset retirement obligations has been capitalized as part of the carrying amount of the related long-lived assets, which approximated $7.1 million and $2.5 million as of September 30, 2011 and 2010, respectively.
The liability has been accreted to its present value as of September 30, 2011 and 2010. The Company evaluated its wells and determined a range of abandonment dates through 2050.
The following table details the change in the asset retirement obligations for the periods ended September 30, 2011 and September 30, 2010 (in thousands):
| Nine Months Ended September 30, 2011 |
Nine Months Ended September 30, 2010 (unaudited) |
|||||||
| Asset retirement obligations at the beginning of the period |
$ | 2,859 | $ | 2,274 | ||||
| Liabilities incurred |
889 | 203 | ||||||
| Revisions |
3,196 | — | ||||||
| Liabilities settled |
(55 | ) | (64 | ) | ||||
| Current period accretion expense |
205 | 108 | ||||||
|
|
|
|
|
|||||
| Asset retirement obligations at the end of the period |
$ | 7,094 | $ | 2,521 | ||||
|
|
|
|
|
|||||
| 6. | Long-Term Debt |
The Company’s long-term debt as of September 30, 2011 and December 31, 2010, is as follows (in thousands):
| September 30, 2011 |
December 31, 2010 |
|||||||
| Credit Facility — senior loan facility |
$ | 198,600 | $ | 89,600 | ||||
As of September 30, 2011, the Company’s credit facility consisted of a $300 million senior revolving credit facility (the “Facility”) with a borrowing base of $225 million. The Facility has a maturity date of December 10, 2014. Borrowings under the Facility are secured by substantially all of the Company’s oil and natural gas properties. Borrowings under the Facility currently bear interest at LIBOR plus an applicable margin between 2.00% and 2.75% per annum. At September 30, 2011 and December 31, 2010, the weighted-average interest rate was 2.9% and 3.0%, respectively.
The credit agreement requires the payment of a commitment fee each quarter. The commitment fee is computed at the rate of 0.5% per annum based on the average daily amount by which the borrowing base exceeds the outstanding borrowings during each quarter.
F-16
Table of Contents
Index to Financial Statements
Midstates Petroleum Holdings LLC
Notes to Consolidated Financial Statements
The borrowing base is subject to semiannual redeterminations in March and September. The terms of the Facility can require monthly repayments to the extent that monthly borrowing base reductions or borrowing base redeterminations cause the outstanding borrowings to exceed the availability under the Facility. At December 31, 2010, the Company had $40.2 million available under the Facility borrowing base of $130 million. At September 30, 2011, the Company’s available borrowing base was $225 million and outstanding amounts under the Facility were $198.6 million.
The Facility contains financial covenants, which, among other things, set a maximum ratio of debt to earnings before income tax, depletion, depreciation, and amortization (EBITDA) of not more than 3.75 to 1, a minimum current ratio (as defined therein) of not less than 1.0 to 1.0 and various other standard affirmative and negative covenants including, but not limited to, restrictions on our ability to make any dividends, distributions or redemptions. The Company is in compliance with the financial debt covenants set forth in the credit agreement.
| 7. | Members’ Equity |
Common and Preferred Units
The Company, FR Midstates, and Petroleum Inc. are parties to a Second Amended and Restated Limited Liability Company Agreement (the “LLC Agreement”) under which certain common and preferred units of the Company are authorized for issuance. Common and preferred units each have the same voting rights.
In June 2010, the Company authorized the issuance of preferred units until the earlier of (i) the issuance of 50,000 preferred units to FR Midstates and (ii) December 31, 2010. Concurrently, 5,080 common units previously issued in 2009 were converted to preferred units. Preferred units may be retired one year after issuance, at the Company’s option, for a price equal to such units’ original value plus 8% interest. Preferred units that are not retired after one year automatically convert to common units at their original value. Any outstanding preferred units are classified as members’ equity on the Company’s consolidated balance sheets as they are not mandatorily redeemable.
During the nine months ended September 30, 2011 and prior to election dates for redemption, all 47,000 preferred units issued and outstanding were retired by payment of a distribution to members, including interest, of approximately $50.6 million.
As of September 30, 2011, there were 256,742 common units issued and outstanding.
Share-Based Compensation
At September 30, 2011, certain restricted and unrestricted shares in Petroleum Inc., certain unrestricted units in the Company, and certain units in Midstates Incentive Holdings, LLC (“Midstates Incentive”) had been issued to employees of the Company. Midstates Incentive holds incentive units in the Company. The incentive units held through Midstates Incentive allow the owners of the units to receive a portion of any proceeds to be received by FR Midstates from the Company in connection with any liquidation of ownership in the Company, assuming minimum return hurdles for FR Midstates are met. The Company has certain rights to call shares that result in the application of liability accounting.
F-17
Table of Contents
Index to Financial Statements
Midstates Petroleum Holdings LLC
Notes to Consolidated Financial Statements
The Company’s share-based payments awarded to employees are accounted for as liability awards pursuant to ASC Topic 718, “Compensation — Stock Compensation.” As such, the Company calculates the fair value of the share-based awards on a quarterly basis using the Company’s estimated market value and total fair value is recorded within “Other long-term liabilities” on the Company’s consolidated balance sheets with changes in such fair value recorded as share-based compensation expense within “General and administrative expense” in the Company’s consolidated statements of operations. The Company’s determination of the fair value of each of the units is affected by: i) the Company’s risk adjusted proved, possible, and probable reserves; ii) internal assessment of long-term commodity prices; iii) current values of the Company’s non-oil and gas assets and liabilities; and iv) a number of complex and subjective variables. Although the fair value of the share-based payments is determined in accordance with GAAP, that value may not be indicative of the fair value observed in a market transaction between a willing buyer and a willing seller.
The following table summarizes share-based compensation expense for the nine months ended September 30, 2011 and 2010:
| Nine Months Ended September 30, 2011 |
Nine Months Ended September 30, 2010 |
|||||||
| (Unaudited) | ||||||||
| (In thousands) | ||||||||
| Restricted shares |
$ | 1,477 | $ | 743 | ||||
| Unrestricted shares and units |
295 | 322 | ||||||
| Incentive units |
— | — | ||||||
|
|
|
|
|
|||||
| Total non-cash compensation expense |
$ | 1,772 | $ | 1,065 | ||||
|
|
|
|
|
|||||
Restricted Shares. Restricted shares are awarded at no cost to the recipient and have a vesting period that commences on the grant date and terminates on the fifth anniversary or upon certain changes in control of the Company, including but not limited to mergers, acquisitions, or a public offering (a “Triggering Event”).
As of September 30, 2011, there was approximately $7 million of total unrecognized compensation cost related to unvested restricted shares, which is expected to be recognized over a weighted average period of approximately 3.5 years.
The table below summarizes activity relating to the restricted shares held in Petroleum, Inc. during the nine months ended September 30, 2011:
| Restricted Shares | ||||
| Outstanding at December 31, 2010 |
101.8 | |||
| Granted |
24.6 | |||
| Vested |
— | |||
| Forfeited |
(9.8 | ) | ||
|
|
|
|||
| Outstanding at September 30, 2011 |
116.6 | |||
Unrestricted Shares and Units. Unrestricted shares are purchased by the recipient on the grant date and are fully vested upon purchase. Any difference between the recipient’s purchase price and the grant date fair value is recognized as compensation expense on the grant date.
F-18
Table of Contents
Index to Financial Statements
Midstates Petroleum Holdings LLC
Notes to Consolidated Financial Statements
The following table summarizes the weighted average grant-date fair value and intrinsic value of the vested unrestricted shares outstanding as of September 30, 2011 and December 31, 2010:
| September 30, 2011 | December 31, 2010 | |||||||
| Unrestricted Shares (held in Petroleum Inc. and the Company) |
||||||||
| Number of vested shares |
97.8 | 71.5 | ||||||
| Weighted average grant date fair value per share |
$ | 76,586 | $ | 74,825 | ||||
| Aggregate intrinsic value of units vested |
$ | 633,251 | $ | 391,463 | ||||
Incentive Units. As of September 30, 2011, 1,666 incentive units were issued and outstanding. Upon the occurrence of certain changes of control of the Company, including a sale by FR Midstates of 100% of its interest in the Company, a sale of all or substantially all of the assets of the Company, or a merger resulting in a change in majority ownership (each, a “Vesting Event”), holders of incentive units shall receive out of proceeds otherwise distributable to FR Midstates a percentage interest in the amounts distributed to FR Midstates in excess of FR Midstates’ aggregate capital contributions and investment expenses (“FR Midstates’ Profits”). No compensation expense related to the incentive units has been recognized by the Company, as the occurrence of a Vesting Event is not considered probable, and thus, the amount of FR Midstates’ Profits, if any, cannot be determined.
| 8. | Related Party Transactions |
A minority owner of Petroleum Inc. is a significant owner of one of the Company’s vendors. For the nine months ended September 30, 2011 and September 30, 2010, the amount paid to this vendor was $1.4 million and $0.5 million, respectively. The amount payable at September 30, 2011 and December 31, 2010 was $0.1 million and $0.1 million, respectively.
| 9. | Concentrations of Credit Risk and Significant Customers |
Financial instruments which potentially subject the Company to credit risk consist primarily of cash balances, accounts receivable and derivative financial instruments.
The Company normally sells production to a relatively small number of purchasers, as is customary in the exploration, development and production business. The Company typically sells a substantial portion of production under short-term (usually one month) contracts tied to a local index. The Company does not have any long-term, fixed-price sales contracts. Two purchasers accounted for 44% and 38%, respectively, of our revenues for the nine months ended September 30, 2011 and one purchaser accounted for 73% of our revenues for the nine months ended September 30, 2010.
Derivative financial instruments are generally executed with major financial institutions that expose the Company to market and credit risks and which may, at times, be concentrated with certain counterparties. The credit worthiness of the counterparties is subject to continual review. The Company also has netting arrangements in place with counterparties to reduce credit exposure. The Company has not experienced any losses from such instruments.
F-19
Table of Contents
Index to Financial Statements
Midstates Petroleum Holdings LLC
Notes to Consolidated Financial Statements
| 10. | Commitments and Contingencies |
Contractual Obligations
At September 30, 2011, contractual obligations for drilling contracts, long term operating leases and seismic contracts are as follows:
| Total | Remaining 2011 |
2012 | 2013 | 2014 and beyond |
||||||||||||||||
| Drilling contracts |
$ | 4,015 | $ | 605 | $ | 3,410 | $ | — | $ | — | ||||||||||
| Noncancellable office lease commitments |
1,150 | 88 | 460 | 481 | 121 | |||||||||||||||
| Seismic contracts |
10,210 | 5,274 | 4,936 | — | — | |||||||||||||||
|
|
|
|
|
|
|
|
|
|
|
|||||||||||
| Net minimum commitments |
$ | 15,375 | $ | 5,967 | $ | 8,806 | $ | 481 | $ | 121 | ||||||||||
|
|
|
|
|
|
|
|
|
|
|
|||||||||||
For the nine months ended September 30, 2011 and September 30, 2010, the Company expensed $0.5 million and $0.3 million, respectively, for office rent.
Litigation
The Company is a defendant in an action brought by Clovelly Oil Company, or the plaintiff, in the 13th Judicial District Court in Louisiana in May 2009. The plaintiff alleges that the Company is subject to an unrecorded Joint Operating Agreement (“JOA”) dated July 16, 1972, as a result of the Company’s 2007 purchase of a 43.75% working interest in certain acreage. The plaintiff alleges that the Company is bound by the 1972 JOA and that the Plaintiff is entitled to 56.25% of the Company’s 242.28-acre Crowell Land & Mineral lease. The Company was not a party to the JOA, and believes that it is protected by the Louisiana Public Records Doctrine, which generally holds that instruments involving real property are without effect as to third parties unless the instrument is filed of record in the appropriate mortgage or conveyance records of the parish in which such property is located.
The Company made a motion for summary judgment on all of the plaintiff’s claims, and the 13th Judicial District Court granted that motion on August 14, 2009. The plaintiff appealed the district court’s decision to the Third Circuit Court of Appeal, and on April 7, 2010, the Third Circuit Court of Appeal reversed and remanded the case back to the district court for trial. On August 9, 2010, the plaintiff amended its original petition to add Wells Fargo Bank, National Association, which holds a mortgage on the acreage as a defendant.
In December 2010, the Company filed a Motion for Partial Summary Judgment asking the district court to declare that the JOA does not apply to any new leases acquired after July 16, 1972 that are not extension or renewal leases. On September 27, 2011, the district court granted the Company’s motion for partial summary judgment. The district court also granted a motion for summary judgment filed by Wells Fargo Bank, National Association asserting that, as a mortgage holder of a mortgage covering the applicable lease, Wells Fargo Bank, National Association is protected by the Public Records Doctrine.
On October 17, 2011, the plaintiff filed an appeal to the Third Circuit Court of Appeal.
Although the outcome of a lawsuit cannot be predicated with certainty, the Company does not believe the ultimate outcome of this case will result in a material impact on its financial position, results of operations, or cash flows.
F-20
Table of Contents
Index to Financial Statements
Midstates Petroleum Holdings LLC
Notes to Consolidated Financial Statements
The Company is involved in other disputes or legal actions arising in the ordinary course of business. The Company does not believe the outcome of such disputes or legal actions will result in a material impact on the Company’s financial position, results of operations, or cash flows.
| 11. | Supplemental Oil and Gas Disclosures — unaudited |
The supplemental data presented herein reflects information for all of the Company’s oil and natural gas producing activities.
Capitalized Costs
The following table sets forth the capitalized costs related to the Company’s oil and natural gas producing activities at September 30, 2011 and December 31, 2010 (in thousands):
| September 30, 2011 |
December 31, 2010 |
|||||||
| Proved properties |
$ | 563,791 | $ | 351,544 | ||||
| Less: Accumulated depreciation, depletion, amortization and impairment |
(118,206 | ) | (56,781 | ) | ||||
|
|
|
|
|
|||||
| Proved properties, net |
445,585 | 294,763 | ||||||
| Unproved properties |
72,186 | 101,366 | ||||||
|
|
|
|
|
|||||
| Total oil and gas properties, net |
$ | 517,771 | $ | 396,129 | ||||
|
|
|
|
|
|||||
Costs Incurred in Oil and Natural Gas Property Acquisition, Exploration and Development Activities
The following table sets forth costs incurred related to the Company’s oil and natural gas activities for the periods ended September 30, 2011 and 2010:
| For the period Ended September 30, 2011 |
For the period Ended September 30, 2010 |
|||||||
| (unaudited) | ||||||||
| Acquisition costs: |
||||||||
| Proved properties |
$ | — | $ | — | ||||
| Unproved properties |
— | — | ||||||
| Exploration costs |
9,902 | 1,904 | ||||||
| Development costs |
170,591 | 109,020 | ||||||
| Asset retirement costs |
205 | 108 | ||||||
|
|
|
|
|
|||||
| Total costs incurred |
$ | 180,698 | $ | 111,032 | ||||
|
|
|
|
|
|||||
Estimated Quantities of Proved Oil and Natural Gas Reserves
The reserve estimates at September 30, 2011 and at December 31, 2010 and 2009 presented in the table below are based on reports prepared by Netherland Sewell and Associates, Inc., independent reserve engineers, in accordance with the FASB’s new authoritative guidance on oil and gas reserve estimation and disclosures. The reserve estimates at December 31, 2008 presented in the table
F-21
Table of Contents
Index to Financial Statements
Midstates Petroleum Holdings LLC
Notes to Consolidated Financial Statements
below are based on a reserve report prepared by Ryder Scott for June 1, 2008, and carried forward to year-end 2008 by the Company. At December 31, 2010, all of the Company’s oil and natural gas producing activities were conducted within the continental United States.
The Company emphasizes that reserve estimates are inherently imprecise and that estimates of new discoveries and undeveloped locations are more imprecise than estimates of established proved producing oil and gas properties. Accordingly, these estimates are expected to change as future information becomes available. Proved oil and natural gas reserves are the estimated quantities of oil and natural gas which geological and engineering data demonstrate, with reasonable certainty, to be recoverable in future years from known reservoirs under economic and operating conditions (i.e., prices and costs) existing at the time the estimate is made. Proved developed oil and natural gas reserves are proved reserves that can be expected to be recovered through existing wells and equipment in place and under operating methods being utilized at the time the estimates were made.
The following table sets forth the Company’s net proved, proved developed and proved undeveloped reserves at September 30, 2011 and December 31, 2010, 2009 and 2008 (1):
| Oil (MBbl) |
Gas (MMcf) |
NGL (MBbl) |
MBoe | |||||||||||||
| 2008 |
||||||||||||||||
| Proved reserves |
||||||||||||||||
| Beginning balance |
2,592 | 3,396 | — | 3,158 | ||||||||||||
| Revisions of previous estimates |
1,145 | 670 | — | 1,257 | ||||||||||||
| Extensions, discoveries and other additions |
1,373 | 1,262 | — | 1,583 | ||||||||||||
| Sales of reserves in place |
— | — | — | — | ||||||||||||
| Purchases of reserves in place |
— | — | — | — | ||||||||||||
| Production |
(322 | ) | (241 | ) | — | (362 | ) | |||||||||
|
|
|
|
|
|
|
|
|
|||||||||
| Net proved reserves at December 31, 2008 |
4,788 | 5,087 | — | 5,636 | ||||||||||||
|
|
|
|
|
|
|
|
|
|||||||||
| Proved developed reserves, December 31, 2008 |
2,319 | 1,892 | — | 2,634 | ||||||||||||
|
|
|
|
|
|
|
|
|
|||||||||
| Proved undeveloped reserves, December 31, 2008 |
2,469 | 3,195 | — | 3,002 | ||||||||||||
|
|
|
|
|
|
|
|
|
|||||||||
| 2009 |
||||||||||||||||
| Proved reserves |
||||||||||||||||
| Beginning balance |
4,788 | 5,087 | — | 5,636 | ||||||||||||
| Revisions of previous estimates |
(804 | ) | 1,110 | 61 | (558 | ) | ||||||||||
| Extensions, discoveries and other additions |
3,513 | 7,089 | 37 | 4,732 | ||||||||||||
| Sales of reserves in place |
— | — | — | — | ||||||||||||
| Purchases of reserves in place |
577 | 662 | 9 | 696 | ||||||||||||
| Production |
(497 | ) | (690 | ) | (2 | ) | (614 | ) | ||||||||
|
|
|
|
|
|
|
|
|
|||||||||
| Net proved reserves at December 31, 2009 |
7,577 | 13,258 | 105 | 9,892 | ||||||||||||
|
|
|
|
|
|
|
|
|
|||||||||
| Proved developed reserves, December 31, 2009 |
2,786 | 4,392 | 19 | 3,536 | ||||||||||||
|
|
|
|
|
|
|
|
|
|||||||||
| Proved undeveloped reserves, December 31, 2009 |
4,791 | 8,866 | 86 | 6,356 | ||||||||||||
|
|
|
|
|
|
|
|
|
|||||||||
F-22
Table of Contents
Index to Financial Statements
Midstates Petroleum Holdings LLC
Notes to Consolidated Financial Statements
| Oil (MBbl) |
Gas (MMcf) |
NGL (MBbl) |
MBoe | |||||||||||||
| 2010 |
||||||||||||||||
| Proved reserves |
||||||||||||||||
| Beginning balance |
7,577 | 13,258 | 105 | 9,892 | ||||||||||||
| Revisions of previous estimates |
(2,220 | ) | (1,043 | ) | 49 | (2,346 | ) | |||||||||
| Extensions, discoveries and other additions |
7,515 | 17,944 | 234 | 10,740 | ||||||||||||
| Sales of reserves in place |
— | — | — | — | ||||||||||||
| Purchases of reserves in place |
— | — | — | — | ||||||||||||
| Production |
(945 | ) | (2,253 | ) | (74 | ) | (1,394 | ) | ||||||||
|
|
|
|
|
|
|
|
|
|||||||||
| Net proved reserves at December 31, 2010 |
11,927 | 27,906 | 314 | 16,892 | ||||||||||||
|
|
|
|
|
|
|
|
|
|||||||||
| Proved developed reserves, December 31, 2010 |
|
5,392 |
|
|
14,203 |
|
|
141 |
|
|
7,900 |
| ||||
|
|
|
|
|
|
|
|
|
|||||||||
| Proved undeveloped reserves, December 31, 2010 |
6,535 | 13,703 | 173 | 8,992 | ||||||||||||
|
|
|
|
|
|
|
|
|
|||||||||
| Nine Months Ended September 30, 2011 |
||||||||||||||||
| Proved reserves |
||||||||||||||||
| Beginning balance |
11,927 | 27,906 | 314 | 16,892 | ||||||||||||
| Revisions of previous estimates |
(2,697 | ) | (4,676 | ) | 1,918 | (1,558 | ) | |||||||||
| Extensions, discoveries and other additions |
6,097 | 17,890 | 1,745 | 10,824 | ||||||||||||
| Sales of reserves in place |
— | — | — | — | ||||||||||||
| Purchases of reserves in place |
— | — | — | — | ||||||||||||
| Production |
(1,136 | ) | (3,154 | ) | (207 | ) | (1,869 | ) | ||||||||
|
|
|
|
|
|
|
|
|
|||||||||
| Net proved reserves at September 30, 2011 |
14,191 | 37,966 | 3,770 | 24,289 | ||||||||||||
|
|
|
|
|
|
|
|
|
|||||||||
| Proved developed reserves, September 30, 2011 |
|
6,332 |
|
|
18,900 |
|
|
1,866 |
|
|
11,348 |
| ||||
|
|
|
|
|
|
|
|
|
|||||||||
| Proved undeveloped reserves, September 30, 2011 |
7,859 | 19,066 | 1,904 | 12,941 | ||||||||||||
|
|
|
|
|
|
|
|
|
|||||||||
| (1) | The following table sets forth the benchmark prices used to determine our estimated proved reserves from proved oil and gas reserves for the periods indicated. |
| At September 30, 2011 |
At December 31, | |||||||||||||||
| 2010 | 2009 | 2008 | ||||||||||||||
| Oil and Natural Gas Prices (1): |
||||||||||||||||
| Oil (per Bbl) |
$ | 91.00 | $ | 75.96 | $ | 57.65 | $ | 44.61 | ||||||||
| Natural gas (per MMBtu) |
$ | 4.160 | $ | 4.376 | $ | 3.866 | $ | 5.710 | ||||||||
| (1) | Benchmark prices for oil and natural gas at September 30, 2011 and at December 31, 2010 and 2009 reflect the unweighted arithmetic average first-day-of-the-month prices for the prior 12 months, using Plains WTI posted prices for oil and NYMEX Henry Hub prices for natural gas. At December 31, 2008, benchmark prices for oil and natural gas reflect NYMEX WTI prices for oil and NYMEX Henry Hub prices for natural gas. |
F-23
Table of Contents
Index to Financial Statements
Midstates Petroleum Holdings LLC
Notes to Consolidated Financial Statements
Purchases of Reserves in Place
An acquisition of an interest in three producing wells and various leases from Sandridge Energy Inc. in the North Cowards Gully field was closed in June 2009. As of year-end 2009, 696 MBoe of proved reserves were attributable to the acquired assets.
Extensions, Discoveries and Other Additions
In the nine months ended September 30, 2011, the Company had a total of 10,824 MBoe of additions. Approximately 4,890 MBoe were from West Gordon, 3,950 MBoe were from Pine Prairie, 1,900 MBoe were from South Bearhead Creek/Oretta and 80 MBoe were from a new expansion area.
In 2010, the Company had a total of 10,740 MBoe of additions. Approximately 4,400 MBoe were from South Bearhead Creek/Oretta, 3,300 Mboe were from Pine Prairie, 2,600 Mboe were from North Cowards Gully and 400 MBoe were from a new expansion area.
In 2009, the Company had a total of 4,732 MBoe of additions. Approximately 1,940 Mboe were from Pine Prairie, 1,700 were from South Bearhead Creek/Oretta, 860 Mboe were from West Gordon and 230 Mboe were from North Cowards Gully.
In 2008, the Company had a total of 1,583 MBoe of additions. Approximately 1,280 MBoe were from Pine Prairie and 300 MBoe were from South Bearhead Creek/Oretta.
Sales of Reserves in Place
There were no sales of reserves in place since January 1, 2008.
Revision of Previous Estimates
In the nine months ended September 30, 2011, the Company had net negative revisions of 1,558 MBoe primarily due to performance revisions in South Bearhead Creek/Oretta and North Cowards Gully, partially offset by positive revisions in Pine Prairie.
In 2010, the Company had net negative revisions of 2,346 MBoe primarily due to performance revisions in West Gordon, North Cowards Gully and Pine Prairie, partially offset by positive revisions in South Bearhead Creek/Oretta.
In 2009, the Company had net negative revisions of 558 MBoe primarily due to performance revisions in Pine Prairie and North Cowards Gully.
In 2008, the Company had net positive revisions of 1,257 MBoe, primarily due to performance revisions in Pine Prairie.
Standardized Measure of Discounted Future Net Cash Flows Relating to Proved Oil and Natural Gas Reserves
The Standardized Measure represents the present value of estimated future cash inflows from proved oil and natural reserves, less future development, production, plugging and abandonment costs and income tax expenses, discounted at 10% per annum to reflect timing of future cash flows. Production costs do not include depreciation, depletion and amortization of capitalized acquisition, exploration and development costs.
Our estimated proved reserves and related future net revenues and Standardized Measure were determined using index prices for oil and natural gas, without giving effect to derivative
F-24
Table of Contents
Index to Financial Statements
Midstates Petroleum Holdings LLC
Notes to Consolidated Financial Statements
transactions, and were held constant throughout the life of the properties. The index prices were $44.61 /Bbl NYMEX WTI for oil and $5.710/MMBtu NYMEX Henry Hub for natural gas at December 31, 2008. The unweighted arithmetic average first-day-of-the-month prices for the prior 12 months were $57.65/Bbl WTI posted price for oil and $3.866/MMBtu NYMEX Henry Hub for natural gas at December 31, 2009, $75.96/Bbl WTI posted price for oil and $4.376/MMBtu NYMEX Henry Hub for natural gas at December 31, 2010. The unweighted arithmetic average first-day-of-the-month prices for the prior 12 months were $91.00/BBL WTI posted price for oil and $4.16/MMBtu NYMEX Henry Hub for natural gas at September 30, 2011. These prices were adjusted by lease for quality, transportation fees, geographical differentials, marketing bonuses or deductions and other factors affecting the price received at the wellhead. The impact of the adoption of the FASB’s authoritative guidance on the SEC oil and gas reserve estimation final rule on our financial statements is not practicable to estimate due to the operational and technical challenges associated with calculating a cumulative effect of adoption by preparing reserve reports under both the old and new rules.
The following table sets forth the Standardized Measure of discounted future net cash flows from projected production of the Company’s oil and natural gas reserves at September 30, 2011 and at December 31, 2010, 2009 and 2008.
| At Period Ended September 30, 2011 |
At Year Ended December 31, | |||||||||||||||
| 2010 | 2009 | 2008 | ||||||||||||||
| (In thousands) | ||||||||||||||||
| Future cash inflows |
$ | 1,740,718 | $ | 1,131,970 | $ | 506,561 | $ | 238,694 | ||||||||
| Future production costs |
596,344 | 526,704 | 148,076 | 63,801 | ||||||||||||
| Future development costs |
356,572 | 215,101 | 83,444 | 29,790 | ||||||||||||
| Future income tax expense (1) |
— | — | — | — | ||||||||||||
|
|
|
|
|
|
|
|
|
|||||||||
| Future net cash flows |
787,802 | 390,165 | 275,041 | 145,103 | ||||||||||||
| 10% annual discount for estimated timing of cash flows |
(277,759 | ) | (92,077 | ) | (116,694 | ) | (62,208 | ) | ||||||||
|
|
|
|
|
|
|
|
|
|||||||||
| Standardized measure of discounted future net cash flows |
$ | 510,043 | $ | 298,088 | $ | 158,347 | $ | 82,895 | ||||||||
|
|
|
|
|
|
|
|
|
|||||||||
| (1) | Does not include the effects of income taxes on future revenues because as of September 30, 2011 and as of December 31, 2010, 2009 and 2008, the Company was a limited liability company not subject to entity-level taxation. Accordingly, no provision for federal or state corporate income taxes has been provided because taxable income was passed through to the company’s equity holders. Following its corporate reorganization, the Company will be a corporation and subject to U.S. federal and state income taxes. |
F-25
Table of Contents
Index to Financial Statements
Midstates Petroleum Holdings LLC
Notes to Consolidated Financial Statements
The following table sets forth the changes in the standardized measure of discounted future net cash flows applicable to proved oil and natural gas reserves for the periods presented.
| Nine Months Ended September 30, 2011 |
Year Ended December 31, | |||||||||||||||
| 2010 | 2009 | 2008 | ||||||||||||||
| (In thousands) |
||||||||||||||||
| January 1, |
$ | 298,088 | $ | 158,347 | $ | 82,895 | $ | 99,289 | ||||||||
|
|
|
|
|
|
|
|
|
|||||||||
| Net changes in prices and production costs |
163,692 | 3,095 | 5,852 | (44,932 | ) | |||||||||||
| Net changes in future development costs |
8,740 | (19,123 | ) | 366 | 2,639 | |||||||||||
| Sales of oil and natural gas, net |
(128,390 | ) | (69,264 | ) | (16,746 | ) | (24,095 | ) | ||||||||
| Extensions |
195,819 | 216,006 | 80,659 | 26,814 | ||||||||||||
| Discoveries |
— | — | — | — | ||||||||||||
| Purchases of reserves in place |
— | — | 8,554 | — | ||||||||||||
| Revisions of previous quantity estimates |
(27,480 | ) | (38,117 | ) | (8,897 | ) | 18,493 | |||||||||
| Previously estimated development costs incurred |
20,524 | 16,955 | — | — | ||||||||||||
| Accretion of discount |
22,357 | 15,835 | 8,289 | 9,929 | ||||||||||||
| Net change in income taxes |
— | — | — | — | ||||||||||||
| Changes in timing, other |
(43,308 | ) | 14,354 | (2,625 | ) | (5,242 | ) | |||||||||
|
|
|
|
|
|
|
|
|
|||||||||
| Period End |
$ | 510,043 | $ | 298,088 | $ | 158,347 | $ | 82,895 | ||||||||
|
|
|
|
|
|
|
|
|
|||||||||
* * * * *
F-26
Table of Contents
Index to Financial Statements
Midstates Petroleum Holdings LLC
Consolidated Balance Sheets
| Successor December 31, |
||||||||
| 2010 | 2009 | |||||||
| (In thousands) | ||||||||
| ASSETS |
||||||||
| CURRENT ASSETS: |
||||||||
| Cash and cash equivalents |
$ | 11,917 | $ | 4,353 | ||||
| Accounts receivable: |
||||||||
| Oil and gas sales |
14,141 | 3,786 | ||||||
| Other |
537 | 84 | ||||||
| Prepayments and other current assets |
383 | 2,672 | ||||||
| Inventory |
1,173 | 1,108 | ||||||
|
|
|
|
|
|||||
| Total current assets |
28,151 | 12,003 | ||||||
|
|
|
|
|
|||||
| PROPERTY AND EQUIPMENT: |
||||||||
| Oil and gas properties, on the basis of full-cost accounting: |
||||||||
| Proved properties |
351,544 | 173,570 | ||||||
| Unevaluated properties |
101,366 | 112,749 | ||||||
| Other property and equipment |
1,360 | 723 | ||||||
| Less accumulated depreciation, depletion, and amortization |
(57,144 | ) | (15,316 | ) | ||||
|
|
|
|
|
|||||
| Net property and equipment |
397,126 | 271,726 | ||||||
|
|
|
|
|
|||||
| OTHER ASSETS: |
||||||||
| Security deposit and other noncurrent assets |
1,727 | 305 | ||||||
|
|
|
|
|
|||||
| Total other assets |
1,727 | 305 | ||||||
|
|
|
|
|
|||||
| TOTAL |
$ | 427,004 | $ | 284,034 | ||||
|
|
|
|
|
|||||
| LIABILITIES AND MEMBERS’ EQUITY |
||||||||
| CURRENT LIABILITIES: |
||||||||
| Accounts payable and accrued liabilities |
$ | 42,619 | $ | 10,320 | ||||
| Derivative financial instruments |
12,657 | 1,827 | ||||||
|
|
|
|
|
|||||
| Total current liabilities |
55,276 | 12,147 | ||||||
|
|
|
|
|
|||||
| LONG-TERM LIABILITIES: |
||||||||
| Asset retirement obligations |
2,859 | 2,274 | ||||||
| Derivative financial instruments |
16,464 | 1,241 | ||||||
| Long-term debt |
89,600 | 29,800 | ||||||
| Other long-term liabilities |
6,926 | 3,238 | ||||||
|
|
|
|
|
|||||
| Total long-term liabilities |
115,849 | 36,553 | ||||||
|
|
|
|
|
|||||
| COMMITMENTS AND CONTINGENCIES (Note 10) |
||||||||
| MEMBERS’ EQUITY (including $47 million and $0 of preferred units, respectively) |
255,879 | 235,334 | ||||||
|
|
|
|
|
|||||
| TOTAL |
$ | 427,004 | $ | 284,034 | ||||
|
|
|
|
|
|||||
The accompanying notes are an integral part of these consolidated financial statements.
F-27
Table of Contents
Index to Financial Statements
Midstates Petroleum Holdings LLC
Consolidated Statements of Operations
| Successor | Predecessor | |||||||||||||||||
| Years ended December 31 |
Period From August 30, 2008 (Date of Inception) to December 31, 2008 |
Period From January 1, 2008 to August 29, 2008 (Date of Acquisition) |
||||||||||||||||
| 2010 | 2009 | |||||||||||||||||
| (In thousands) | ||||||||||||||||||
| REVENUES: |
||||||||||||||||||
| Oil sales |
$ | 75,875 | $ | 27,347 | $ | 7,836 | $ | 25,956 | ||||||||||
| Natural gas sales |
10,505 | 2,683 | 853 | 1,502 | ||||||||||||||
| Natural gas liquid sales |
2,731 | 103 | — | — | ||||||||||||||
| Gains (losses) on commodity derivative contracts — net |
(26,268 | ) | (5,987 | ) | 14,062 | (7,678 | ) | |||||||||||
| Other |
209 | 108 | 43 | 113 | ||||||||||||||
|
|
|
|
|
|
|
|
|
|||||||||||
| Total revenues |
63,052 | 24,254 | 22,794 | 19,893 | ||||||||||||||
|
|
|
|
|
|
|
|
|
|||||||||||
| EXPENSES: |
||||||||||||||||||
| Lease operating |
8,733 | 5,312 | 1,542 | 2,769 | ||||||||||||||
| Workover |
4,683 | 5,226 | 2,376 | 2,206 | ||||||||||||||
| Severance tax |
6,431 | 2,849 | 805 | 2,354 | ||||||||||||||
| Asset retirement accretion |
175 | 120 | 37 | 79 | ||||||||||||||
| General and administrative |
16,847 | 5,886 | 1,402 | 1,816 | ||||||||||||||
| Depreciation, depletion, and amortization |
41,827 | 12,322 | 2,995 | 3,117 | ||||||||||||||
| Impairment in carrying value of oil and natural gas properties |
— | 4,297 | 26,776 | — | ||||||||||||||
|
|
|
|
|
|
|
|
|
|||||||||||
| Total expenses |
78,696 | 36,012 | 35,933 | 12,341 | ||||||||||||||
|
|
|
|
|
|
|
|
|
|||||||||||
| OPERATING INCOME (LOSS) |
(15,644 | ) | (11,758 | ) | (13,139 | ) | 7,552 | |||||||||||
| OTHER INCOME |
||||||||||||||||||
| Interest income |
9 | 6 | 7 | 12 | ||||||||||||||
| Interest expense — net of amounts capitalized |
— | — | — | (854 | ) | |||||||||||||
|
|
|
|
|
|
|
|
|
|||||||||||
| NET INCOME (LOSS) |
$ | (15,635 | ) | $ | (11,752 | ) | $ | (13,132 | ) | $ | 6,710 | |||||||
|
|
|
|
|
|
|
|
|
|||||||||||
| Unaudited pro forma income tax provision (benefit) |
$ | (6,318 | ) | |||||||||||||||
|
|
|
|||||||||||||||||
| Unaudited pro forma net income (loss) |
$ | (9,317 | ) | |||||||||||||||
|
|
|
|||||||||||||||||
The accompanying notes are an integral part of these consolidated financial statements.
F-28
Table of Contents
Index to Financial Statements
Midstates Petroleum Holdings LLC
Consolidated Statements of Members’ Equity
| Successor | Predecessor | |||||||||||||||||||||||||
| Common Stock |
Additional Paid-in Capital |
Retained Earnings |
Treasury Stock (at cost) |
Total | ||||||||||||||||||||||
| (In thousands) | ||||||||||||||||||||||||||
| BALANCE — January 1, 2008 |
2 | 1,297 | 1,229 | (17 | ) | 2,511 | ||||||||||||||||||||
|
|
|
|
|
|
|
|
|
|
|
|||||||||||||||||
| Net income |
— | — | 6,710 | — | 6,710 | |||||||||||||||||||||
|
|
|
|
|
|
|
|
|
|
|
|||||||||||||||||
| BALANCE — AUGUST 30, 2008 |
$ | 2 | $ | 1,297 | $ | 7,939 | $ | (17 | ) | $ | 9,221 | |||||||||||||||
| Conversion from stockholders equity to members’ units (see Note 1) |
$ | 9,221 | (9,221 | ) | ||||||||||||||||||||||
|
|
|
|||||||||||||||||||||||||
| Cash contribution |
$ | 5,138 | ||||||||||||||||||||||||
| Units issued for net assets at estimated fair value |
200,000 | |||||||||||||||||||||||||
| Net loss |
(13,132 | ) | ||||||||||||||||||||||||
|
|
|
|||||||||||||||||||||||||
| BALANCE — December 31, 2008 |
192,006 | |||||||||||||||||||||||||
| Members’ contribution |
55,080 | |||||||||||||||||||||||||
| Net loss |
(11,752 | ) | ||||||||||||||||||||||||
|
|
|
|||||||||||||||||||||||||
| BALANCE — December 31, 2009 |
235,334 | |||||||||||||||||||||||||
| Preferred equity units issued (see Note 7) |
36,180 | |||||||||||||||||||||||||
| Preferred units converted from common units (see Note 7) |
5,080 | |||||||||||||||||||||||||
| Common units converted to preferred units (see Note 7) |
(5,080 | ) | ||||||||||||||||||||||||
| Net loss |
(15,635 | ) | ||||||||||||||||||||||||
|
|
|
|||||||||||||||||||||||||
| BALANCE — December 31, 2010 |
$ | 255,879 | ||||||||||||||||||||||||
|
|
|
|||||||||||||||||||||||||
The accompanying notes are an integral part of these consolidated financial statements.
F-29
Table of Contents
Index to Financial Statements
Midstates Petroleum Holdings LLC
Consolidated Statements of Cash Flows
| Successor | Predecessor | |||||||||||||||||
| Years ended December 31, |
Period From August 30, 2008 (Date of Inception) to December 31, 2008 |
Period From January 1, 2008 to August 29, 2008 (Date of Acquisition) |
||||||||||||||||
| 2010 | 2009 | |||||||||||||||||
| (In thousands) | ||||||||||||||||||
| CASH FLOWS FROM OPERATING ACTIVITIES: |
||||||||||||||||||
| Net income (loss) |
$ | (15,635 | ) | $ | (11,752 | ) | $ | (13,132 | ) | $ | 6,710 | |||||||
| Adjustments to reconcile net loss to net cash provided by operating activities: |
||||||||||||||||||
| Unrealized (gains) losses on commodity derivative contracts |
25,398 | 7,283 | (13,637 | ) | 4,665 | |||||||||||||
| Asset retirement accretion expense |
175 | 120 | 37 | 79 | ||||||||||||||
| Depreciation, depletion, and amortization expense |
41,827 | 12,363 | 2,995 | 3,117 | ||||||||||||||
| Impairment in carrying value of oil and natural gas properties |
— | 4,297 | 26,776 | — | ||||||||||||||
| Stock-based compensation |
1,518 | 234 | — | — | ||||||||||||||
| Change in operating assets and liabilities: |
||||||||||||||||||
| Accounts receivable — oil and gas sales |
(10,355 | ) | (1,459 | ) | 4,754 | (3,814 | ) | |||||||||||
| Accounts receivable — other |
(452 | ) | 515 | (405 | ) | 300 | ||||||||||||
| Prepayments and other assets |
2,290 | (2,645 | ) | 1,086 | (1,108 | ) | ||||||||||||
| Inventory |
(65 | ) | 568 | (1,004 | ) | (672 | ) | |||||||||||
| Accounts payable, accrued liabilities, and other |
5,753 | 1,071 | (3,492 | ) | 718 | |||||||||||||
| Other |
314 | — | (308 | ) | 51 | |||||||||||||
|
|
|
|
|
|
|
|
|
|||||||||||
| Net cash provided by operating activities |
50,768 | 10,595 | 3,670 | 10,046 | ||||||||||||||
|
|
|
|
|
|
|
|
|
|||||||||||
| CASH FLOWS FROM INVESTING ACTIVITIES: |
||||||||||||||||||
| Investment in property and equipment |
(139,618 | ) | (72,237 | ) | (8,810 | ) | (9,480 | ) | ||||||||||
| Investment in acquired property |
— | (3,017 | ) | — | — | |||||||||||||
| Cash acquired in acquisition |
— | — | 3,359 | — | ||||||||||||||
| Other (including escrowed deposit) |
— | 39 | — | — | ||||||||||||||
|
|
|
|
|
|
|
|
|
|||||||||||
| Net cash used in investing activities |
(139,618 | ) | (75,215 | ) | (5,451 | ) | (9,480 | ) | ||||||||||
|
|
|
|
|
|
|
|
|
|||||||||||
| CASH FLOWS FROM FINANCING ACTIVITIES: |
||||||||||||||||||
| Proceeds from long-term borrowings |
60,000 | 13,000 | 5,000 | 2,000 | ||||||||||||||
| Repayment of long-term borrowings |
(200 | ) | (5,000 | ) | (5,100 | ) | (200 | ) | ||||||||||
| Repayment of notes |
(4 | ) | (8 | ) | ||||||||||||||
| Members’ equity contribution |
38,350 | 58,080 | — | — | ||||||||||||||
| Cash contribution related to the transaction |
— | — | 5,138 | — | ||||||||||||||
| Other |
(1,736 | ) | (321 | ) | (39 | ) | — | |||||||||||
|
|
|
|
|
|
|
|
|
|||||||||||
| Net cash provided by financing activities |
96,414 | 65,759 | 4,995 | 1,792 | ||||||||||||||
|
|
|
|
|
|
|
|
|
|||||||||||
| NET INCREASE IN CASH AND CASH EQUIVALENTS |
7,564 | 1,139 | 3,214 | 2,358 | ||||||||||||||
| Cash and cash equivalents, beginning of year |
4,353 | 3,214 | — | 1,000 | ||||||||||||||
|
|
|
|
|
|
|
|
|
|
||||||||||
| Cash and cash equivalents, end of year |
$ | 11,917 | $ | 4,353 | $ | 3,214 | $ | 3,358 | ||||||||||
|
|
|
|
|
|
|
|
|
|||||||||||
| SUPPLEMENTAL INFORMATION: |
||||||||||||||||||
| Non-cash transactions — investments in property and equipment accrued — not paid |
$ | 35,548 | $ | 8,347 | $ | 1,900 | $ | 236 | ||||||||||
|
|
|
|
|
|
|
|
|
|||||||||||
| Cash paid for interest net of interest capitalized of $1.7 million, $0.8 million, $0.3 million, and $0.0 million, respectively |
$ | — | $ | — | $ | — | $ | 1,108 | ||||||||||
|
|
|
|
|
|
|
|
|
|||||||||||
| Units issued for net assets at estimated fair value |
$ | — | $ | — | $ | 200,000 | $ | — | ||||||||||
|
|
|
|
|
|
|
|
|
|||||||||||
The accompanying notes are an integral part of these consolidated financial statements.
F-30
Table of Contents
Index to Financial Statements
Midstates Petroleum Holdings LLC
Notes to Consolidated Financial Statements
| 1. | Organization and Business |
Midstates Petroleum Holdings LLC (the “Company”) and its wholly owned subsidiary, Midstates Petroleum Company LLC (“Subsidiary”), engages in the business of the drilling for and production of oil, natural gas and natural gas liquids. The Company currently has oil and gas operations solely in the state of Louisiana.
At December 31, 2010, the Company was 77.21% owned by FR Midstates Holdings LLC (“FR Midstates”), 19.24% owned by Midstates Petroleum Holdings Inc. (“Petroleum Inc.”), through which the Company’s founders, management and certain employees hold their equity interests, and 3.55% owned by certain members of management and employees.
Reorganization in 2008
Midstates Petroleum Corporation (the “Predecessor”) entered into a Plan of Reorganization in August 2008 (the “Reorganization”). To effect the Reorganization, the Predecessor formed Petroleum Inc., the Company and Subsidiary. The shareholders of the Predecessor contributed the stock and title to the oil and gas properties of the Predecessor to Petroleum Inc., and Petroleum Inc. contributed such stock and properties to the Company. After completion of the above-described contributions, the Predecessor was merged, with Subsidiary continuing as the sole surviving entity. As a result of the above-described transactions, Petroleum Inc. owned 100% of the Company.
The stockholders of Petroleum Inc., the Company and FR Midstates entered into an Equity Purchase Agreement, pursuant to which, on August 29, 2008, Petroleum Inc. sold 71.66% of its membership interests in the Company to FR Midstates for $200 million (the “Transaction”). Due to this change in control, all assets were measured at fair value as of the Transaction date.
For financial reporting purposes, the Transaction was accounted for as a purchase and resulted in a new basis of accounting reflecting estimated fair values for 100% of the assets and liabilities at the closing date of the reorganization based on the purchase price paid. Accordingly, the financial statements for the period subsequent to August 29, 2008 are presented on the Company’s new basis of accounting while giving effect to the Reorganization. The results of operations for the period ended August 29, 2008 reflects the results of the Predecessor prior to the Transaction.
F-31
Table of Contents
Index to Financial Statements
Midstates Petroleum Holdings LLC
Notes to Consolidated Financial Statements
The purchase price allocation of the acquired net assets as a result of the Transaction is as follows (in thousands):
| Purchase Price Allocation |
||||
| CURRENT ASSETS: |
||||
| Cash and cash equivalents |
$ | 3,358 | ||
| Accounts receivable: |
||||
| Oil and gas sales |
7,082 | |||
| Other |
194 | |||
| Prepayments and other current assets |
1,113 | |||
| Inventory |
672 | |||
|
|
|
|||
| Total current assets |
12,419 | |||
| PROPERTY AND EQUIPMENT: |
||||
| Oil and gas properties — full cost method |
112,199 | |||
| Unevaluated properties |
116,552 | |||
| Other property and equipment |
237 | |||
|
|
|
|||
| Net property and equipment |
228,988 | |||
| Escrowed deposit |
39 | |||
| TOTAL ASSETS |
241,446 | |||
|
|
|
|||
| CURRENT LIABILITIES |
||||
| Accounts payable and accrued liabilities |
8,019 | |||
| Derivative financial instruments |
5,293 | |||
| Note payable |
17 | |||
|
|
|
|||
| Total current liabilities |
13,329 | |||
| LONG TERM LIABILITIES |
||||
| Asset retirement obligations |
1,779 | |||
| Derivative financial instruments |
4,130 | |||
| Long-term debt and notes |
21,900 | |||
| Other long-term liabilities |
308 | |||
|
|
|
|||
| Total long-term liabilities |
28,117 | |||
| TOTAL LIABILITIES |
41,446 | |||
|
|
|
|||
| NET ASSETS ACQUIRED |
$ | 200,000 | ||
|
|
|
|||
| 2. | Summary of Significant Accounting Policies |
Basis of Presentation
The accompanying consolidated financial statements of the Company include the accounts of Midstates Petroleum Holdings LLC and Subsidiary. These statements have been prepared in accordance with accounting principles generally accepted in the United States of America (“GAAP”) and reflect, in the opinion of the Company’s management, all adjustments necessary to present fairly the financial position as of, and the results of operations for, the periods presented. All intercompany transactions have been eliminated in consolidation.
F-32
Table of Contents
Index to Financial Statements
Midstates Petroleum Holdings LLC
Notes to Consolidated Financial Statements
The Company operates its oil and natural gas properties as one business segment: the exploration, development and production of oil and natural gas. The Company’s management evaluates performance based on one business segment as there are not different economic environments within the operation of the Company’s oil and natural gas properties.
Use of Estimates
The preparation of financial statements in conformity with GAAP requires management to make estimates and assumptions that affect the reported amounts of assets and liabilities and disclosure of contingent assets and liabilities at the date of the financial statements and the reported amounts of revenues and expenses during the reporting period. Actual results could differ from those estimates.
Significant estimates include, but are not limited to, oil and natural gas reserves; depreciation, depletion and amortization of proved oil and natural gas properties; future cash flows from oil and natural gas properties; fair value of derivatives; fair value of equity compensation; and asset retirement obligations.
Cash and Cash Equivalents
The Company considers all short-term investments with an original maturity of three months or less to be cash equivalents.
Accounts Receivable and Allowance for Doubtful Accounts
Accounts receivable are stated at the historical carrying amount net of write-offs and allowance for uncollectible accounts. The carrying amount of the Company’s accounts receivable approximate fair value because of the short-term nature of the instruments. The Company accrues a reserve on a receivable when, based on the judgment of management, it is probable that a receivable will not be collected and the amount of any reserve may be reasonably estimated. As of December 31, 2010 and 2009, the Company had no allowance for doubtful accounts in either period.
Oil and Natural Gas Properties
The Company uses the full-cost method of accounting for its exploration and development activities. Under this method of accounting, the cost of both successful and unsuccessful exploration and development activities are capitalized as property and equipment. This includes any internal costs that are directly related to exploration and development activities, but does not include any costs related to production, general corporate overhead or similar activities. Historically, total capitalized internal costs in any given year have not been material to total oil and gas costs capitalized in such year. Proceeds from the sale or disposition of oil and gas properties are accounted for as a reduction to capitalized costs unless a significant portion (greater than 25 percent) of the Company’s reserve quantities are sold, in which case a gain or loss is recognized in income.
For the years ended December 31, 2010, 2009, for the period from August 30, 2008 to December 31, 2008 (the “Successor Period”) and the period from January 1, 2008 to August 29, 2008 (the “Predecessor Period”), depletion expense related to oil and gas properties was $41.6 million, $12.1 million, $3.0 million and $3.1 million, respectively and $29.85, $19.79, $24.16 and $12.80 per Boe, respectively.
F-33
Table of Contents
Index to Financial Statements
Midstates Petroleum Holdings LLC
Notes to Consolidated Financial Statements
Unevaluated Property
Oil and gas unevaluated properties and properties under development include costs that are excluded from costs being depleted or amortized. These costs represent investments in unproved properties. The Company excludes these costs until proved reserves are found, until it is determined that the costs are impaired or until major development projects are placed in service. All costs excluded are reviewed at least annually to determine if impairment has occurred.
Oil and Gas Reserves
The estimates of proved oil and natural gas reserves utilized in the preparation of the consolidated financial statements are estimated in accordance with the rules established by the Securities and Exchange Commission (“SEC”) and the Financial Accounting Standards Board (“FASB”), which require that reserve estimates be prepared under existing economic and operating conditions using a 12-month average price with no provision for price and cost escalations in future years except by contractual arrangements. The Company’s reserve estimates at September 30, 2011 and at December 31, 2010 and 2009 were prepared by a third-party petroleum engineer, Netherland, Sewell & Associates, Inc. (“NSAI”). The reserve estimates at December 31, 2008 were prepared by our internal engineers.
Reserve estimates are inherently imprecise. Accordingly, the estimates are expected to change as more current information becomes available. The Company depletes its oil and gas properties using the units-of-production method. Capitalized costs of oil and natural gas properties are depleted over proved reserves. It is possible that, because of changes in market conditions or the inherent imprecision of reserve estimates, the estimates of future cash inflows, future gross revenues, the amount of oil and natural gas reserves, the remaining estimated lives of oil and natural gas properties, or any combination of the above may be increased or reduced. Increases in recoverable economic volumes generally reduce per unit depletion rates while decreases in recoverable economic volumes generally increase per unit depletion rates.
Other Property and Equipment
Other property and equipment consists of vehicles, furniture and fixtures, and computer hardware and software, and are carried at cost. Depreciation is provided principally using the straight-line method over the estimated useful lives of the assets, which range between five and seven years. Maintenance and repairs are charged to expense as incurred, while renewals and betterments are capitalized. For the years ended December 31, 2010 and 2009, for the Successor Period and for the Predecessor Period, depreciation expense related to other property and equipment was $0.2 million, $0.2 million, less than $0.1 million and less than $0.1 million, respectively.
Impairment of Oil and Gas Properties/Ceiling Test
Under the existing full-cost method of accounting, a ceiling test is performed at least annually. The test establishes a limit (ceiling) on the book value of oil and gas properties. The capitalized costs of proved oil and gas properties, net of accumulated depreciation, depletion and amortization (DD&A) and the related deferred income taxes, may not exceed this “ceiling.” The ceiling limitation is the present value of the estimated after-tax future net cash flows from proved oil and gas reserves, discounted at 10%, excluding future cash outflows associated with settling asset retirement obligations accrued on the balance sheet. If capitalized costs exceed this ceiling, the excess is charged to expense in the accompanying consolidated statements of operations.
F-34
Table of Contents
Index to Financial Statements
Midstates Petroleum Holdings LLC
Notes to Consolidated Financial Statements
Effective December 31, 2009, the Company adopted revised oil and gas disclosure requirements set forth by the SEC in Release No. 33-8995, “Modernization of Oil and Gas Reporting” and as codified by the FASB in Accounting Standards Codification (ASC) Topic 932, “Extractive Industries — Oil and Gas.”
In calculating the ceiling test at December 31, 2010, the Company identified that capitalized costs did not exceed the ceiling and no impairment to oil and gas properties was required. In calculating the ceiling test at December 31, 2009, the Company identified that capitalized costs exceeded the ceiling and impaired oil and gas properties by $4.3 million.
As a result of the Transaction, the Company calculated the fair value of proved properties and allocated the purchase price to the proved and unevaluated properties based on relative fair value. The Company allocated $112.2 million to proved properties and $116.6 million to unevaluated properties. In calculating the ceiling test at December 31, 2008, the Company estimated that capitalized costs exceeded the ceiling limitation by $26.8 million, which reduced the carrying value of oil and gas properties and was recognized as impairment expense in the Successor Period. There was no impairment expense recognized in the Predecessor Period.
Depreciation, Depletion and Amortization (DD&A)
DD&A of oil and gas properties is calculated quarterly using the Units of Production Method (UOP). The UOP calculation, in its simplest terms, multiplies the percentage of estimated proved reserves produced each quarter times the cost of those reserves. The result is to recognize expense at the same pace that the reservoirs are actually depleting. The amortization base in the UOP calculation includes the sum of proved property costs net of accumulated DD&A, estimated future development costs (future costs to access and develop reserves) and asset retirement costs that are not already included in oil and gas property, less related salvage value.
Revenue Recognition
Oil and gas revenues are recognized when production is sold to a purchaser at a fixed or determinable price, when delivery has occurred and title has transferred and collection of the revenues is reasonably assured. Cash received relating to future revenues is deferred and recognized when all revenue recognition criteria are met. The Company had no significant gas imbalances at December 31, 2010 or 2009.
Income Taxes
The Company is not a taxpaying entity for federal income tax purposes and, accordingly, it does not recognize any expense for such taxes. The income tax liability resulting from the Company’s activities is the responsibility of the Company’s members. In the event of an examination of the Company’s tax return, the tax liability of the members could be changed if an adjustment of the Company’s income or loss is ultimately sustained by the taxing authorities.
The unaudited pro forma income tax benefit on the consolidated statements of operations reflects the effect of the Company’s anticipated initial public offering. After consummation, the Company will be subject to U.S. federal and certain state income taxes. The pro forma effective tax rate (benefit) reflected herein differs from the expected Federal statutory rate of 35% due to state income taxes (net of federal benefit) and other typical industry permanent differences. No valuation allowance was deemed necessary due to the presence of
F-35
Table of Contents
Index to Financial Statements
Midstates Petroleum Holdings LLC
Notes to Consolidated Financial Statements
future net taxable amounts in excess of deferred tax assets; management placed no reliance on other future taxable income.
The Company, on a proforma basis, would have recorded a tax benefit during the year ended December 31, 2010 of $6.3 million (unaudited).
In addition, on a pro forma basis, a recalculation of the ceiling test during the year on an after-tax basis would have resulted in an impairment of $36.3 million (unaudited).
Financial Instruments
The Company’s financial instruments consist of cash and cash equivalents, receivables, payables, debt, and commodity derivatives. Commodity derivatives are recorded at fair value (see Note 3). The carrying amount of floating-rate debt approximates fair value because the interest rates are variable and reflective of market rates. The carrying amount of the Company’s other financial instruments approximate fair value because of the short-term nature of the items or variable pricing.
Derivative financial instruments are recorded in the consolidated balance sheets as either an asset or liability measured at estimated fair value. Changes in the derivative’s fair value are recognized currently in earnings as gains and losses in the period of change. The gains or losses are recorded within revenues in “Gains (losses) on commodity derivative contracts — net.” The related cash flow impact is reflected within cash flows from operating activities.
Asset Retirement Obligations
The legal obligations associated with the retirement of long-lived assets is recognized at estimated fair value at the time that the obligation is incurred. Oil and gas producing companies incur such a liability upon acquiring or drilling a well. The Company estimates the fair value of an asset retirement obligation in the period in which the obligation is incurred and the corresponding asset retirement cost is capitalized by increasing the carrying amount of the related long-lived asset. The liability is accreted to its then present value each period, and the capitalized cost is depreciated over the useful life of the related asset. If the liability is settled for an amount other than the recorded amount, a gain or loss is recorded in the full cost pool. See Note 5.
Capitalized Interest
Interest from external borrowings is capitalized on unevaluated properties using the weighted-average cost of outstanding borrowings until the project is substantially complete and ready for its intended use, which for oil and gas assets is at the first production from the field. Capitalized interest is depleted over the useful lives of the assets in the same manner as the depletion of the underlying assets. Interest capitalized to unevaluated properties was $1.7 million for the year ended December 31, 2010 and $0.8 million for the year ended December 31, 2009.
Subsequent Events
The Company has evaluated subsequent events through November 14, 2011, the date the consolidated financial statements were issued.
New Accounting Pronouncements
Modernization of Oil and Gas Reporting — In December 2008, the SEC released the Final Rule to revise the existing Regulation S-K and Regulation S-X reporting requirements to align with current
F-36
Table of Contents
Index to Financial Statements
Midstates Petroleum Holdings LLC
Notes to Consolidated Financial Statements
industry practices and technological advances. FASB aligned Accounting Standards Codification (ASC) Topic 932, Extractive Industries — Oil and Gas, with the SEC rules on this topic through the issuance of Accounting Standards Update 2010-3. The Final Rule permits the use of new technologies to determine proved reserves estimates if those technologies have been demonstrated empirically to lead to reliable conclusions about reserve volume estimates. The Final Rule also allows, but not require, companies to disclose their probable and possible reserves to investors. In addition, the new disclosure requirements require companies to: (i) report the independence and qualifications of its reserves preparer or auditor; (ii) file reports when a third party is relied upon to prepare reserves estimates or conduct a reserves audit; and (iii) report oil and natural gas reserves using an average price based upon the prior 12-month period (using the first-day-of-the-month price) rather than a year-end price. The Final Rule became effective for fiscal years ending on or after December 31, 2009. Many of the revisions are updates to definitions in the existing oil and gas rules to make them consistent with the Petroleum Resource Management System, which is a widely accepted standard for the management of petroleum resources that was developed by several industry organizations. The Company adopted these new rules and interpretations as of December 31, 2009.
| 3. | Fair Value Measurements of Financial Instruments |
The Company uses a valuation framework based upon inputs that market participants use in pricing an asset or liability, which are classified into two categories: observable inputs and unobservable inputs. Observable inputs represent market data obtained from independent sources; whereas, unobservable inputs reflect a company’s own market assumptions, which are used if observable inputs are not reasonably available without undue cost and effort. These two types of inputs are further divided into the following fair value input hierarchy:
Level 1 — Inputs are unadjusted quoted prices in active markets for identical assets or liabilities at the measurement date.
Level 2 — Inputs, other than quoted prices included in Level 1, are observable for the asset or liability, either directly or indirectly. Level 2 inputs include quoted prices for similar instruments in active markets, and inputs other than quoted prices that are observable for the asset or liability. Fair value assets and liabilities that are generally included in this category are derivatives with fair values based on inputs from actively quoted markets. The Company uses a market approach to estimate the fair values of its derivative instruments, utilizing commodity futures price strips for the underlying commodities provided by a reputable third-party.
Level 3 — Inputs are unobservable for the asset or liability, and include situations where there is little, if any, market activity for the asset or liability.
Financial assets and liabilities are classified based on the lowest level of input that is significant to the fair value measurement. The Company’s assessment of the significance of a particular input to the fair value measurement requires judgment, and may affect the valuation of the fair value of assets and liabilities and their placement within the fair value hierarchy levels.
Assets and Liabilities Measured at Fair Value on a Recurring Basis
Derivative Instruments — Derivative financial instruments reflected in the consolidated balance sheets are recorded at estimated fair value.
F-37
Table of Contents
Index to Financial Statements
Midstates Petroleum Holdings LLC
Notes to Consolidated Financial Statements
At December 31, 2010 and 2009, all of the Company’s derivative instruments have a single bank counterparty and are classified as Level 2.
| Fair Value Measurements at December 31, 2010 | ||||||||||||||||
| Quoted Prices in Active Markets (Level 1) |
Significant Other Observable Inputs (Level 2) |
Significant Unobservable Inputs (Level 3) |
Total | |||||||||||||
| (in thousands) | ||||||||||||||||
| Assets: |
||||||||||||||||
| Commodity derivative oil swaps |
$ | — | $ | — | $ | — | $ | — | ||||||||
| Commodity derivative deferred premium puts |
— | — | — | — | ||||||||||||
| Commodity derivative collars |
— | — | — | — | ||||||||||||
|
|
|
|
|
|
|
|
|
|||||||||
| Total assets |
— | — | — | — | ||||||||||||
| Liabilities: |
||||||||||||||||
| Commodity derivative oil swaps |
— | 27,735 | — | 27,735 | ||||||||||||
| Commodity derivative deferred premium puts |
— | 1,386 | — | 1,386 | ||||||||||||
| Commodity derivative collars |
— | — | — | — | ||||||||||||
|
|
|
|
|
|
|
|
|
|||||||||
| Total liabilities |
$ | — | $ | 29,121 | $ | — | $ | 29,121 | ||||||||
| Fair Value Measurements at December 31, 2009 | ||||||||||||||||
| Quoted Prices in Active Markets (Level 1) |
Significant Other Observable Inputs (Level 2) |
Significant Unobservable Inputs (Level 3) |
Total | |||||||||||||
| (in thousands) | ||||||||||||||||
| Assets: |
||||||||||||||||
| Commodity derivative oil swaps |
$ | — | $ | — | $ | — | $ | — | ||||||||
| Commodity derivative deferred premium puts |
— | — | — | — | ||||||||||||
| Commodity derivative collars |
— | — | — | — | ||||||||||||
|
|
|
|
|
|
|
|
|
|||||||||
| Total assets |
— | — | — | — | ||||||||||||
| Liabilities: |
||||||||||||||||
| Commodity derivative oil swaps |
— | 2,995 | — | 2,995 | ||||||||||||
| Commodity derivative deferred premium puts |
— | — | — | — | ||||||||||||
| Commodity derivative collars |
— | 73 | — | 73 | ||||||||||||
|
|
|
|
|
|
|
|
|
|||||||||
| Total liabilities |
$ | — | $ | 3,068 | $ | — | $ | 3,068 | ||||||||
Derivative instruments listed above include collars, swaps, and put options that are carried at fair value. The Company records the net change in the fair value of these positions in “Gains (losses) on commodity derivative contracts—net” in the Company’s consolidated statements of operations. The Company is able to value the assets and liabilities based on observable market data for similar instruments, which resulted in the Company reporting its derivatives as Level 2. This observable data includes the forward curve for commodity prices based on quoted markets prices and implied volatility factors related to changes in the forward curves.
For additional information on the Company’s derivative instruments, see Note 4.
F-38
Table of Contents
Index to Financial Statements
Midstates Petroleum Holdings LLC
Notes to Consolidated Financial Statements
Assets and Liabilities Measured at Fair Value on a Nonrecurring Basis
Certain assets and liabilities are reported at fair value on a nonrecurring basis in the Company’s consolidated balance sheets. The following methods and assumptions were used to estimate the fair values:
Asset Retirement Obligations (ARO’s) — The Company estimates the fair value of ARO’s based on discounted cash flow projections using numerous estimates, assumptions, and judgments regarding such factors as the existence of a legal obligation for an ARO; amounts and timing of settlements; the credit-adjusted risk-free rate to be used; and inflation rates. See Note 5 for a summary of changes in ARO’s.
Debt — The Company’s debt is recorded at the carrying amount on its consolidated balance sheet. For further discussion of the Company’s debt, please see Note 6 — Long-Term Debt. The carrying amount of floating-rate debt approximates fair value because the interest rates are variable and reflective of market rates.
| 4. | Risk Management and Derivative Instruments |
The Company is exposed to fluctuations in crude oil and natural gas prices on its production. Management believes it is prudent to manage the variability in cash flows by entering into derivative financial instrument to economically hedge a portion of its crude oil and natural gas production. The Company utilizes various types of derivative financial instruments, including swaps and options, to manage fluctuations in cash flows resulting from changes in commodity prices. These derivative contracts are generally placed with major financial institutions that the Company believes are minimal credit risks. The oil and gas reference prices, upon which the commodity derivative contracts are based, reflect various market indices that have a high degree of historical correlation with actual prices received by the Company for its oil and gas production.
Inherent in the Company’s portfolio of commodity derivative contracts are certain business risks, including market risk and credit risk. Market risk is the risk that the price of the commodity will change, either favorably or unfavorably, in response to changing market conditions. Credit risk is the risk of loss from nonperformance by the Company’s counterparty to a contract. The Company does not require collateral from its counterparties but does attempt to minimize its credit risk associated with derivative instruments entering into derivative instruments only with counterparties that are large financial institutions, which management believes present minimal credit risk. In addition, to mitigate its risk of loss due to default, the Company has entered into agreements with its counterparties on its derivative instruments that allow the Company to offset its asset position with its liability position in the event of default by the counterparty. As of December 31, 2010 and 2009, there were no contracts in an asset position; therefore, no contracts were netted with the derivative liabilities. As the Company’s contracts were all in a liability position, there is no risk of loss relating to counterparties failing to perform under existing derivative contracts at December 31, 2010.
F-39
Table of Contents
Index to Financial Statements
Midstates Petroleum Holdings LLC
Notes to Consolidated Financial Statements
Commodity Derivatives
The Company uses commodity derivatives to manage its exposure to commodity price volatility.
As of December 31, 2010, the Company had the following open commodity positions:
| Hedged Volume |
Weighted- Average Fixed Price |
|||||||
| Oil (Bbls): |
||||||||
| Swaps – 2011 |
1,168,000 | $ | 81.54 | |||||
| Swaps – 2012 |
893,400 | 84.16 | ||||||
| Swaps – 2013 |
679,125 | 84.73 | ||||||
| Swaps – 2014 |
262,450 | 83.00 | ||||||
| Deferred Premium Puts — 2011(1) |
182,500 | $ | 75.55 | |||||
| (1) | 2011 deferred premium puts represent the net effective floor price of a put with a strike price of $88.33/Bbl and a deferred premium of $5.79/Bbl. |
F-40
Table of Contents
Index to Financial Statements
Midstates Petroleum Holdings LLC
Notes to Consolidated Financial Statements
Balance Sheet Presentation
The following table summarizes the gross fair value of derivative instruments by the appropriate balance sheet classification, even when the derivative instruments are subject to netting arrangements and qualify for net presentation in the Company’s consolidated balance sheets at December 31, 2010 and 2009 (in thousands):
| Type |
Balance Sheet Location (1) |
December 31, 2010 |
December 31, 2009 |
|||||||
| Oil Swaps |
Derivative financial instruments — Current Liabilities | $ | (11,394 | ) | $ | (1,754 | ) | |||
| Oil Swaps |
Derivative financial instruments — Non-Current Liabilities | (16,341 | ) | (1,241 | ) | |||||
| Deferred Premium Puts |
Derivative financial instruments — Current Liabilities | (1,263 | ) | |||||||
| Deferred Premium Puts |
Derivative financial instruments — Non-Current Liabilities | (123 | ) | |||||||
| Collars |
Derivative financial instruments — Current Liabilities | (73 | ) | |||||||
|
|
|
|
|
|||||||
| Total |
(29,121 | ) | (3,068 | ) | ||||||
|
|
|
|
|
|||||||
| (1) | The fair value of derivative instruments reported in the Company’s consolidated balance sheets are subject to netting arrangements and qualify for net presentation. The following table reports the net derivative fair values as reported in the Company’s consolidated balance sheets as of December 31, 2010 and 2009 (in thousands): |
| December 31, 2010 |
December 31, 2009 |
|||||||
| Consolidated balance sheet classification: |
||||||||
| Current derivative instruments: |
||||||||
| Assets |
0 | 0 | ||||||
| Liabilities |
(12,657 | ) | (1,827 | ) | ||||
|
|
|
|
|
|||||
| Non-current derivative instruments |
||||||||
| Assets |
0 | 0 | ||||||
| Liabilities |
(16,464 | ) | (1,241 | ) | ||||
|
|
|
|
|
|||||
Gains (Losses) on Derivatives
The Company does not designate its derivative instruments as hedging instruments for financial reporting purposes. Accordingly, all gains and losses, including unrealized gains and losses from changes in the derivative instruments’ fair values, have been recorded in “Gain (losses) on commodity derivative contracts—net”, within revenues in the consolidated statements of operations.
F-41
Table of Contents
Index to Financial Statements
Midstates Petroleum Holdings LLC
Notes to Consolidated Financial Statements
For the years ending December 31, 2010 and December 31, 2009, for the Successor Period, and for the Predecessor Period, the Company realized net gains (losses) of ($0.9 million), $1.3 million, $0.4 million and ($3.0 million), respectively, from its derivative instruments.
For the years ending December 31, 2010 and December 31, 2009, for the Successor Period, and for the Predecessor Period, the Company recorded net unrealized gains/(losses) of ($25.4 million), ($7.3 million), $13.6 million, and ($4.7 million) related to the change in fair value of the derivative financial instruments in “Gain (losses) on commodity derivative contracts — net.”
| 5. | Asset Retirement Obligations |
For the Company, asset retirement obligations represent the future abandonment costs of tangible assets, such as wells, service assets, and other facilities. The present value of estimated asset retirement obligations has been capitalized as part of the carrying amount of the related long-lived assets, which approximated $2.9 million and $2.3 million as of December 31, 2010 and 2009, respectively.
The liability has been accreted to its present value as of December 31, 2010 and 2009. The Company evaluated its wells and determined a range of abandonment dates through 2050.
The following table represents a reconciliation of the asset retirement obligations for the years ended December 31, 2010 and 2009, the Successor Period and the Predecessor Period (in thousands):
| Year Ended December 31, 2010 |
Year Ended December 31, 2009 |
Period From August 30, 2008 (Date of Inception) to December 31, 2008 |
Period From January 1, 2008 to August 29, 2008 (Date of Acquisition) |
|||||||||||||
| Asset retirement obligations at beginning of year |
$ | 2,274 | $ | 1,828 | $ | 1,779 | $ | 1,651 | ||||||||
| Liabilities incurred |
474 | 341 | 75 | 14 | ||||||||||||
| Liabilities settled |
(64 | ) | (15 | ) | (63 | ) | — | |||||||||
| Current period accretion expense |
175 | 120 | 37 | 79 | ||||||||||||
|
|
|
|
|
|
|
|
|
|||||||||
| Asset retirement obligations at end of the period |
$ | 2,859 | $ | 2,274 | $ | 1,828 | $ | 1,744 | ||||||||
|
|
|
|
|
|
|
|
|
|||||||||
| 6. | Long-Term Debt |
The Company’s long-term debt as of December 31, 2010 and 2009, was as follows (in thousands):
| December 31, 2010 |
December 31, 2009 |
|||||||
| Credit Facility — senior loan facility |
$ | 89,600 | $ | 29,800 | ||||
As of December 31, 2009, the Company’s credit facility consisted of a $300 million senior loan revolving credit facility (the “Facility”) that was scheduled to mature in February 2012. On December 10, 2010, the Company amended and restated the credit agreement, which extended the maturity date to December 10, 2014. Borrowings under the Facility are secured by substantially all the Company’s oil and natural gas properties. Borrowings under the Facility
F-42
Table of Contents
Index to Financial Statements
Midstates Petroleum Holdings LLC
Notes to Consolidated Financial Statements
currently bear interest at LIBOR plus an applicable margin between 2.00% and 2.75% per annum. At December 31, 2010, 2009 and 2008, the weighted-average interest rate was 3.01%, 3.25% and 4.95%, respectively.
The credit agreement requires the payment of a commitment fee each quarter. The commitment fee is computed at the rate of 0.5% per annum based on the average daily amount by which the borrowing base exceeds the outstanding borrowings during each quarter.
The borrowing base is subject to semiannual redeterminations in March and September. The terms of the Facility can require monthly repayments to the extent that monthly borrowing base reductions or borrowing base redeterminations cause the outstanding borrowings to exceed the availability under the Facility. At December 31, 2010, the Company had $40.2 million available under the Facility borrowing base of $130 million. In March 2011, the participants in the bank consortium affirmed the Company’s available borrowing base at $130 million. As of November 14, 2011, the Company’s available borrowing base is $225 million and outstanding amounts under the facility are $221.6 million.
The Facility contains financial covenants, which, among other things, set a maximum ratio of debt to earnings before income tax, depletion, depreciation and amortization (EBITDA) of not more than 3.75 to 1, minimum current ratio (as defined therein) of not less than 1.0 to 1.0 and various other standard affirmative and negative covenants including, but not limited to, restrictions on our ability to make dividends, distributions or redemptions. The Company is in compliance with the financial debt covenants set forth in the credit agreement.
| 7. | Members’ Equity |
Common and Preferred Units
The Company, FR Midstates, and Petroleum Inc. are parties to a Second Amended and Restated Limited Liability Company Agreement (the “LLC Agreement”) under which certain common and preferred units of the Company are authorized for issuance. Common and preferred units each require an investment of $1,000 per unit and have the same voting rights.
Member contributions for the years ended December 31, 2010 and 2009 were $36.2 million and $55.1 million, respectively. Contributions related to the Transaction were $5.1 million for the Successor Period. There were no distributions to members during any of these periods.
In June 2010, the Company authorized the issuance of preferred units until the earlier of (i) the issuance of 50,000 preferred units to FR Midstates and (ii) December 31, 2010. Concurrently, 5,080 common units previously issued in 2009 were converted to preferred units. Preferred units may be retired one year after issuance, at the Company’s option, for a price equal to such units’ original value plus 8% interest. Preferred units that are not retired after one year automatically convert to common units at their original value. Any outstanding preferred units are classified as members’ equity on the Company’s consolidated balance sheets as they are not mandatorily redeemable.
At December 31, 2010 a total of 47,000 Preferred Units have been issued to date for $38.4 million and no preferred units have been retired or converted to common units. The first election date to redeem preferred units is June 30, 2011 for 21,000 units.
As of December 31, 2010, there were 255,138 common units issued and outstanding.
F-43
Table of Contents
Index to Financial Statements
Midstates Petroleum Holdings LLC
Notes to Consolidated Financial Statements
Share-Based Compensation
At December 31, 2010, certain restricted and unrestricted shares in Petroleum Inc. and certain incentive units in Midstates Incentive Holdings, LLC (“Midstates Incentive”) had been issued to employees of the Company. The profits units of Midstates Incentive allow the owners of such units a portion of any proceeds to be received from FR Midstates from the Company in connection with any liquidation of ownership in the Company, assuming minimum return hurdles for FR Midstates are met. The Company has a call option to repurchase restricted and unrestricted shares for cash from employees who terminate employment within 30 days of termination. The Company also has a call option to repurchase common units for cash from employees who terminate employment within 90 days.
The Company’s share-based payments awarded to employees are accounted for as liability awards pursuant to ASC Topic 718, “Compensation — Stock Compensation.” As such, the Company calculates the fair value of the share-based awards on a quarterly basis using the Company’s estimated market value. The vested portion of the awards’ total fair value is recorded within “Other long-term liabilities” on the Company’s consolidated balance sheets with changes in such fair value recorded as share-based compensation expense within “General and administrative expense” in the Company’s consolidated statements of operations. The Company’s determination of the fair value of each of the units is affected by: i) the Company’s risk adjusted proved, possible, and probable reserves; ii) internal assessment of long-term commodity prices; iii) current values of the Company’s non-oil and gas assets and liabilities; and iv) a number of complex and subjective variables. Although the fair value of the share-based payments is determined in accordance with GAAP, that value may not be indicative of the fair value observed in a market transaction between a willing buyer and a willing seller.
The following table summarizes share-based compensation expense in the Company’s unaudited consolidated statements of operations for the years ended December 31, 2010 and 2009:
| Year Ended December 31, 2010 |
Year Ended December 31, 2009 |
|||||||
| (In thousands) | ||||||||
| Restricted shares |
$ | 1,126 | $ | 234 | ||||
| Unrestricted shares |
392 | — | ||||||
| Incentive units |
— | — | ||||||
|
|
|
|
|
|||||
| Total noncash compensation expense |
$ | 1,518 | $ | 234 | ||||
Restricted Shares. Restricted shares are awarded at no cost to the recipient and have a vesting period that commences on the grant date and terminates on the fifth anniversary or upon certain changes in control of the Company, including but not limited to mergers, acquisitions, or a public offering (a “Triggering Event”).
As of December 31, 2010 and 2009, there was approximately $9 million and $4 million, respectively, of total unrecognized compensation cost related to unvested restricted shares, which is expected to be recognized over a weighted average period of approximately five years.
F-44
Table of Contents
Index to Financial Statements
Midstates Petroleum Holdings LLC
Notes to Consolidated Financial Statements
The table below summarizes activity relating to the unvested restricted shares held in Petroleum, Inc.:
| Restricted Shares |
||||
| Outstanding at December 31, 2008 |
— | |||
| Granted |
59.1 | |||
| Vested |
— | |||
| Forfeited |
— | |||
|
|
|
|||
| Outstanding at December 31, 2009 |
59.1 | |||
| Granted |
42.7 | |||
| Vested |
— | |||
| Forfeited |
— | |||
|
|
|
|||
| Outstanding at December 31, 2010 |
101.8 | |||
Unrestricted Shares. Unrestricted shares are purchased by the recipient on the grant date and are fully vested upon purchase. Any difference between the recipient’s purchase price and the grant date fair value is recognized as compensation expense on the grant date.
The following table summarizes the weighted average grant-date fair value and intrinsic value of the vested unrestricted shares outstanding as of December 31, 2010 and 2009:
| 2010 | 2009 | |||||||
| Unrestricted Shares (held in Petroleum Inc.) |
||||||||
| Number of vested shares at December 31, |
71.5 | 34.6 | ||||||
| Weighted average grant date fair value per share |
$ | 74,825 | $ | 72,281 | ||||
| Aggregate intrinsic value of units vested |
$ | 391,463 | $ | — | ||||
Incentive Units. As of December 31, 2010, 956 incentive units were issued and outstanding. Upon the occurrence of certain changes of control of the Company, including a sale by FR Midstates of 100% of its interest in the Company, a sale of all or substantially all of the assets of the Company or a merger resulting in a change in majority ownership of the Company (each, a “Vesting Event”), holders of incentive units shall receive from FR Midstates a sharing ratio of their total vested incentive units as a percentage of the total outstanding vested incentive units multiplied by a profits percentage. This profits percentage is a percentage interest in the amounts distributed to FR Midstates in excess of FR Midstates’ aggregate capital contributions and investment expenses (“FR Midstates’ Profits”). No compensation expense related to the incentive units has been recognized by the Company, as the occurrence of a Vesting Event is not considered probable, and thus, the amount of FR Midstates’ Profits, if any, cannot be determined.
| 8. | Related Party Transactions |
A minority owner of Petroleum Inc. is a significant owner of one of the Company’s vendors. For the years ended December 31, 2010, 2009, the Successor Period and for the Predecessor Period, the amount paid to this vendor was $1 million, $0.6 million, $0.3 million, and $0.3 million, respectively. The amount payable at December 31, 2010 and 2009 was $0.1 million and less than $0.1 million, respectively.
F-45
Table of Contents
Index to Financial Statements
Midstates Petroleum Holdings LLC
Notes to Consolidated Financial Statements
| 9. | Concentrations of Credit Risk and Significant Customers |
Financial instruments which potentially subject the Company to credit risk consist primarily of cash balances, accounts receivable and derivative financial instruments.
The Company normally sells production to a relatively small number of purchasers, as is customary in the exploration, development and production business. The Company typically sells a substantial portion of production under short-term (usually one month) contracts tied to a local index. The Company does not have any long-term, fixed-price sales contracts.
For the year ended December 31, 2010, three purchasers accounted for 66%, 19% and 12%, respectively, of the Company’s revenue. For the year ended December 31, 2009, two purchasers accounted for 66% and 14%, respectively, of the Company’s revenue. For the Successor Period, one purchaser accounted for 85% of the Company’s revenue. For the Predecessor Period, one purchaser accounted for 86% of the Company’s revenue.
Derivative financial instruments are generally executed with major financial institutions that expose the Company to market and credit risks and which may, at times, be concentrated with certain counterparties. The credit worthiness of the counterparties is subject to continual review. The Company also has netting arrangements in place with counterparties to reduce credit exposure. The Company has not experienced any losses from such instruments.
| 10. | Commitments and Contingencies |
Contractual Obligations
At December 31, 2010, contractual obligations for long-term operating leases are as follows (in thousands):
| Total | 2011 | 2012 | 2013 | 2014 and beyond |
||||||||||||||||
| Noncancellable office lease commitments |
$ | 1,181 | $ | 352 | $ | 362 | $ | 373 | $ | 94 | ||||||||||
For the years ended December 31, 2010, 2009, the Successor Period and the Predecessor Period, the Company expensed $0.6 million, $0.4 million, less than $0.1 million, and less than $0.1 million, respectively, for office rent.
Litigation
The Company is a defendant in a lawsuit originally filed by Clovelly Oil Company (the “Plaintiff”) in the 13th Judicial District Court on May 7, 2009. The Plaintiff alleges that the Company is subject to an unrecorded Joint Operating Agreement (JOA) dated July 16, 1972, as a result of the Company’s purchase of a 43.75% working interest in 440 acres (“the LeDanois acreage”). The Plaintiff alleges that the Company is bound by the 1972 JOA and that the Plaintiff is entitled to 56.25% of the Company’s 242.28-acre Crowell Land & Mineral lease. The Company’s position is that it was not a party to the agreement and because the agreement was not “filed of record,” it should be protected by the Public Records Doctrine. In Louisiana, the Public Records Doctrine holds that instruments involving real property are without effect as to third parties unless the instrument is filed of record in the appropriate mortgage or conveyance records of the parish in which such property is located.
F-46
Table of Contents
Index to Financial Statements
Midstates Petroleum Holdings LLC
Notes to Consolidated Financial Statements
The Plaintiff originally filed suit in the 13th Judicial District Court (the “District Court”) on May 7, 2009. The Company made a Motion for Summary Judgment and the District Court granted that motion on August 14, 2009. The Plaintiff appealed the District Court’s decision to the Third Circuit Court of Appeal, and on April 7, 2010, the Third Circuit Court of Appeal reversed and remanded the case back to the District Court for trial. On August 9, 2010, the Plaintiff amended its original petition to add Wells Fargo Bank, National Association, which holds a mortgage and security agreement affecting the leasehold interests as a defendant.
Midstates, Wells Fargo Bank, National Association and the Plaintiff all have various motions currently pending before the District Court. Subject to the outcome of these motions, the Company expects that a trial date will be set toward the end of 2011. Although the outcome of a lawsuit cannot be predicted with certainty, the Company does not believe the ultimate outcome of this case will result in a material impact on its financial position, results of operations, or cash flows.
The Company is involved in other disputes or legal actions arising in the ordinary course of business. The Company does not believe the outcome of such disputes or legal actions will result in a material impact on the Company’s financial position, results of operations, or cash flows.
| 11. | Restatement |
The Company recorded adjustments to reflect the correction of impairments in the carrying value of oil and natural gas properties, and the accounting for its stock-based employee compensation plan as well as certain cash flow adjustments as of December 31, 2009 and 2010, as further described below. The net effect of these adjustments reduced the 2009 operating loss and net loss by $1.4 million and increased the 2010 operating loss and net loss by $0.5 million. The effect of these restatements is not material to the Company’s previously issued financial statements.
The Company determined that, in 2009, it had transferred $2.4 million from unevaluated properties to proved properties that should have remained in unevaluated properties, which, together with a calculation error in the ceiling test of $1.0 million, resulted in a net overstatement of the impairment in carrying value of oil and natural gas properties of $1.4 million in 2009. The effect of this adjustment reduced the 2009 operating loss and net loss by $1.4 million.
The Company also determined that its stock-based compensation plan, which grants restricted and unrestricted shares, should have been accounted for as a liability plan rather than an equity plan due to the existence of certain Company call options on employee stock based compensation. As a result, the Company transferred $3.2 million and $6.9 million as of December 31, 2009 and 2010, respectively, from members’ equity to other long-term liabilities. The effect of this adjustment increased the 2009 and 2010 operating loss and net loss by $-0- and $0.5 million, respectively.
The Company determined that, as of December 31, 2009, net cash provided by operating activities and net cash used in investing activities were both overstated by $2.8 million as a result of the inclusion in the statement of cash flows of the change in the balance of certain investments in property and equipment that were accrued, but not paid. The Company recorded a 2009 adjustment to decrease the cash outflow from investment in property and equipment (cash flows from investing activities) by $2.8 million and to decrease the cash inflow from change in accounts payable and accrued liabilities (cash flows from operating activities) by $2.8 million. Related to this
F-47
Table of Contents
Index to Financial Statements
Midstates Petroleum Holdings LLC
Notes to Consolidated Financial Statements
correction, the Company corrected the disclosure of supplemental cash flow information (presented on the statement of cash flows) of investments in property and equipment that were accrued, but not paid, as of December 31, 2009 from $0.5 million to $8.3 million.
The Company determined that, as of December 31, 2010, net cash provided by operating activities was understated by $0.3 million and net cash provided by financing activities was overstated by an equivalent amount as a result of the inclusion of the amortization of debt issuance costs in net cash provided by financing activities rather than net cash provided by operating activities. The Company recorded a 2010 adjustment to decrease the line item other (cash flows from financing activities) by $0.3 million and to increase accounts payable, accrued liabilities, and other (cash flows from operating activities) by an equal amount.
| 12. | Supplemental Oil and Gas Disclosures — unaudited |
The supplemental data presented herein reflects information for all of the Company’s oil and natural gas producing activities.
Capitalized Costs
The following table sets forth the capitalized costs related to the Company’s oil and natural gas producing activities for the years ended December 31, 2010 and 2009 (in thousands):
| December 31, 2010 |
December 31, 2009 |
|||||||
| Proved properties |
$ | 351,544 | $ |
173,570 |
| |||
| Less: Accumulated depreciation, depletion, amortization and impairment |
(56,781 | ) | (15,162 | ) | ||||
| Proved properties, net |
294,763 | |
158,408 |
| ||||
| Unproved properties |
101,366 | |
112,749 |
| ||||
|
|
|
|
|
|||||
| Total oil and gas properties, net |
$ | 396,129 | $ | 271,157 | ||||
|
|
|
|
|
|||||
Costs Incurred in Oil and Natural Gas Property Acquisition, Exploration and Development Activities
The following table sets forth costs incurred related to the Company’s oil and natural gas activities for the years ended December 31, 2010 and 2009, for the Successor Period and for the Predecessor Period:
| For the Year Ended December 31, 2010 |
For the Year Ended December 31, 2009 |
Period From August 30, 2008 (Date of Inception) to December 31, 2008 |
Period From January 1, 2008 to August 20, 2008 (Date of Acquisition) |
|||||||||||||
| (in thousands) |
||||||||||||||||
| Acquisition costs: |
||||||||||||||||
| Proved properties |
$ | — | $ | 3,017 | $ | — | $ | — | ||||||||
| Unproved properties |
— | — | — | — | ||||||||||||
| Exploration costs |
6,754 | 3,144 | — | — | ||||||||||||
| Development costs |
164,748 | 74,090 | 13,086 | 11,923 | ||||||||||||
| Asset retirement costs |
175 | 120 | 37 | 79 | ||||||||||||
|
|
|
|
|
|
|
|
|
|||||||||
| Total costs incurred |
$ | 171,677 | $ | 80,371 | $ | 13,123 | $ | 12,002 | ||||||||
|
|
|
|
|
|
|
|
|
|||||||||
F-48
Table of Contents
Index to Financial Statements
Midstates Petroleum Holdings LLC
Notes to Consolidated Financial Statements
Estimated Quantities of Proved Oil and Natural Gas Reserves
The reserve estimates at December 31, 2010 and 2009 presented in the table below are based on reports prepared by Netherland Sewell and Associates, Inc., independent reserve engineers, in accordance with the FASB’s new authoritative guidance on oil and gas reserve estimation and disclosures. The reserve estimates at December 31, 2008 presented in the table below are based on a reserve report prepared by Ryder Scott for June 1, 2008, and carried forward to year-end 2008 by the Company. At December 31, 2010, all of the Company’s oil and natural gas producing activities were conducted within the continental United States.
The Company emphasizes that reserve estimates are inherently imprecise and that estimates of new discoveries and undeveloped locations are more imprecise than estimates of established proved producing oil and gas properties. Accordingly, these estimates are expected to change as future information becomes available. Proved oil and natural gas reserves are the estimated quantities of oil and natural gas which geological and engineering data demonstrate, with reasonable certainty, to be recoverable in future years from known reservoirs under economic and operating conditions (i.e., prices and costs) existing at the time the estimate is made. Proved developed oil and natural gas reserves are proved reserves that can be expected to be recovered through existing wells and equipment in place and under operating methods being utilized at the time the estimates were made.
F-49
Table of Contents
Index to Financial Statements
Midstates Petroleum Holdings LLC
Notes to Consolidated Financial Statements
The following table sets forth the Company’s net proved, proved developed and proved undeveloped reserves at December 31, 2010, 2009 and 2008(1):
| Oil (MBbl) |
Gas (MMcf) |
NGL (MBbl) |
MBoe | |||||||||||||
| 2008 |
||||||||||||||||
| Proved reserves |
||||||||||||||||
| Beginning balance |
2,592 | 3,396 | — | 3,158 | ||||||||||||
| Revisions of previous estimates |
1,145 | 670 | — | 1,257 | ||||||||||||
| Extensions, discoveries and other additions |
1,373 | 1,262 | — | 1,583 | ||||||||||||
| Sales of reserves in place |
— | — | — | — | ||||||||||||
| Purchases of reserves in place |
— | — | — | — | ||||||||||||
| Production |
(322 | ) | (241 | ) | — | (362 | ) | |||||||||
|
|
|
|
|
|
|
|
|
|||||||||
| Net proved reserves at December 31, 2008 |
4,788 | 5,087 | — | 5,636 | ||||||||||||
|
|
|
|
|
|
|
|
|
|||||||||
| Proved developed reserves, December 31, 2008 |
2,319 | 1,892 | — | 2,634 | ||||||||||||
|
|
|
|
|
|
|
|
|
|||||||||
| Proved undeveloped reserves, December 31, 2008 |
2,469 | 3,195 | — | 3,002 | ||||||||||||
|
|
|
|
|
|
|
|
|
|||||||||
| 2009 |
||||||||||||||||
| Proved reserves |
||||||||||||||||
| Beginning balance |
4,788 | 5,087 | — | 5,636 | ||||||||||||
| Revisions of previous estimates |
(804 | ) | 1,110 | 61 | (558 | ) | ||||||||||
| Extensions, discoveries and other additions |
3,513 | 7,089 | 37 | 4,732 | ||||||||||||
| Sales of reserves in place |
— | — | — | — | ||||||||||||
| Purchases of reserves in place |
577 | 662 | 9 | 696 | ||||||||||||
| Production |
(497 | ) | (690 | ) | (2 | ) | (614 | ) | ||||||||
|
|
|
|
|
|
|
|
|
|||||||||
| Net proved reserves at December 31, 2009 |
7,577 | 13,258 | 105 | 9,892 | ||||||||||||
|
|
|
|
|
|
|
|
|
|||||||||
| Proved developed reserves, December 31, 2009 |
2,786 | 4,392 | 19 | 3,536 | ||||||||||||
|
|
|
|
|
|
|
|
|
|||||||||
| Proved undeveloped reserves, December 31, 2009 |
4,791 | 8,866 | 86 | 6,356 | ||||||||||||
|
|
|
|
|
|
|
|
|
|||||||||
| 2010 |
||||||||||||||||
| Proved reserves |
||||||||||||||||
| Beginning balance |
7,577 | 13,258 | 105 | 9,892 | ||||||||||||
| Revisions of previous estimates |
(2,220 | ) | (1,043 | ) | 49 | (2,346 | ) | |||||||||
| Extensions, discoveries and other additions |
7,515 | 17,944 | 234 | 10,740 | ||||||||||||
| Sales of reserves in place |
— | — | — | — | ||||||||||||
| Purchases of reserves in place |
— | — | — | — | ||||||||||||
| Production |
(945 | ) | (2,253 | ) | (74 | ) | (1,394 | ) | ||||||||
|
|
|
|
|
|
|
|
|
|||||||||
| Net proved reserves at December 31, 2010 |
11,927 | 27,906 | 314 | 16,892 | ||||||||||||
|
|
|
|
|
|
|
|
|
|||||||||
| Proved developed reserves, December 31, 2010 |
|
5,392 |
|
|
14,203 |
|
|
141 |
|
|
7,900 |
| ||||
|
|
|
|
|
|
|
|
|
|||||||||
| Proved undeveloped reserves, December 31, 2010 |
6,535 | 13,703 | 173 | 8,992 | ||||||||||||
|
|
|
|
|
|
|
|
|
|||||||||
| (1) | The following table sets forth the benchmark prices used to determine our estimated proved reserves from proved oil and gas reserves for the periods indicated. |
F-50
Table of Contents
Index to Financial Statements
Midstates Petroleum Holdings LLC
Notes to Consolidated Financial Statements
| At December 31, | ||||||||||||
| 2010 | 2009 | 2008 | ||||||||||
| Oil and Natural Gas Prices (1): |
||||||||||||
| Oil (per Bbl) |
$ | 75.96 | $ | 57.65 | $ | 44.61 | ||||||
| Natural gas (per MMBtu) |
$ | 4.376 | $ | 3.866 | $ | 5.710 | ||||||
| (1) | Benchmark prices for oil and natural gas at September 30, 2011 and at December 31, 2010 and 2009 reflect the unweighted arithmetic average first-day-of-the-month prices for the prior 12 months, using Plains WTI posted prices for oil and NYMEX Henry Hub prices for natural gas. At December 31, 2008, benchmark prices for oil and natural gas reflect NYMEX WTI prices for oil and NYMEX Henry Hub prices for natural gas. |
Purchases of Reserves in Place
In 2009, an acquisition of an interest in three producing wells and various leases from Sandridge Energy Inc. in the North Cowards Gully field was closed in June 2009. As of year-end 2009, 696 MBoe of proved reserves were attributable to the acquired assets.
Extensions, Discoveries and Other Additions
In 2010, the Company had a total of 10,740 MBoe of additions. Approximately 4,400 MBoe were from South Bearhead Creek/Oretta, 3,300 Mboe were from Pine Prairie, 2,600 Mboe were from North Cowards Gully and 400 MBoe were from a new expansion area.
In 2009, the Company had a total of 4,732 MBoe of additions. Approximately 1,940 Mboe were from Pine Prairie, 1,700 were from South Bearhead Creek/Oretta, 860 Mboe were from West Gordon and 230 Mboe were from North Cowards Gully.
In 2008, the Company had a total of 1,583 MBoe of additions. Approximately 1,280 MBoe were from Pine Prairie and 300 MBoe were from South Bearhead Creek/Oretta.
Sales of Reserves in Place
There were no sales of reserves in place during the past three years.
Revision of Previous Estimates
In 2010, the Company had net negative revisions of 2,346 MBoe primarily due to performance revisions in West Gordon, North Cowards Gully and Pine Prairie, partially offset by positive revisions in South Bearhead Creek/Oretta.
In 2009, the Company had net negative revisions of 558 MBoe primarily due to performance revisions in Pine Prairie and North Cowards Gully.
In 2008, the Company had net positive revisions of 1,257 MBoe, primarily due to performance revisions in Pine Prairie.
Standardized Measure of Discounted Future Net Cash Flows Relating to Proved Oil and Natural Gas Reserves
The Standardized Measure represents the present value of estimated future cash inflows from proved oil and natural reserves, less future development, production, plugging and abandonment
F-51
Table of Contents
Index to Financial Statements
Midstates Petroleum Holdings LLC
Notes to Consolidated Financial Statements
costs and income tax expenses, discounted at 10% per annum to reflect timing of future cash flows. Production costs do not include depreciation, depletion and amortization of capitalized acquisition, exploration and development costs.
Our estimated proved reserves and related future net revenues and Standardized Measure were determined using index prices for oil and natural gas, without giving effect to derivative transactions, and were held constant throughout the life of the properties. The index prices were $44.61 /Bbl NYMEX WTI for oil and $5.710/MMBtu NYMEX Henry Hub for natural gas at December 31, 2008. The unweighted arithmetic average first-day-of-the-month prices for the prior 12 months were $57.65/Bbl WTI posted price for oil and $3.866/MMBtu NYMEX Henry Hub for natural gas at December 31, 2009, $75.96/Bbl WTI posted price for oil and $4.376/MMBtu NYMEX Henry Hub for natural gas at December 31, 2010. These prices were adjusted by lease for quality, transportation fees, geographical differentials, marketing bonuses or deductions and other factors affecting the price received at the wellhead. The impact of the adoption of the FASB’s authoritative guidance on the SEC oil and gas reserve estimation final rule on our financial statements is not practicable to estimate due to the operational and technical challenges associated with calculating a cumulative effect of adoption by preparing reserve reports under both the old and new rules.
The following table sets forth the Standardized Measure of discounted future net cash flows from projected production of the Company’s oil and natural gas reserves at December 31, 2010, 2009 and 2008.
| At Year Ended December 31, | ||||||||||||
| 2010 | 2009 | 2008 | ||||||||||
| (In thousands) | ||||||||||||
| Future cash inflows |
$ | 1,131,970 | $ | 506,561 | $ | 238,694 | ||||||
| Future production costs |
526,704 | 148,076 | 63,801 | |||||||||
| Future development costs |
215,101 | 83,444 | 29,790 | |||||||||
| Future income tax expense (1) |
— | — | — | |||||||||
| Future net cash flows |
390,165 | 275,041 | 145,103 | |||||||||
| 10% annual discount for estimated timing of cash flows |
(92,077 | ) | (116,694 | ) | (62,208 | ) | ||||||
|
|
|
|
|
|
|
|||||||
| Standardized measure of discounted future net cash flows |
$ | 298,088 | $ | 158,347 | $ | 82,895 | ||||||
|
|
|
|
|
|
|
|||||||
| (1) | Does not include the effects of income taxes on future revenues because as of December 31, 2010, 2009 and 2008, the Company was a limited liability company not subject to entity-level taxation. Accordingly, no provision for federal or state corporate income taxes has been provided because taxable income was passed through to the company’s equity holders. Following its corporate reorganization, the Company will be a corporation and subject to U.S. federal and state income taxes. |
F-52
Table of Contents
Index to Financial Statements
Midstates Petroleum Holdings LLC
Notes to Consolidated Financial Statements
The following table sets forth the changes in the standardized measure of discounted future net cash flows applicable to proved oil and natural gas reserves for the periods presented.
| 2010 | 2009 | 2008 | ||||||||||
| (In thousands) | ||||||||||||
| January 1, |
$ | 158,347 | $ | 82,895 | $ | 99,289 | ||||||
|
|
|
|
|
|
|
|||||||
| Net changes in prices and production costs |
3,095 | 5,852 | (44,932 | ) | ||||||||
| Net changes in future development costs |
(19,123 | ) | 366 | 2,639 | ||||||||
| Sales of oil and natural gas, net |
(69,264 | ) | (16,746 | ) | (24,095 | ) | ||||||
| Extensions |
216,006 | 80,659 | 26,814 | |||||||||
| Discoveries |
— | — | — | |||||||||
| Purchases of reserves in place |
— | 8,554 | — | |||||||||
| Revisions of previous quantity estimates |
(38,117 | ) | (8,897 | ) | 18,493 | |||||||
| Previously estimated development costs incurred |
16,955 | — | — | |||||||||
| Accretion of discount |
15,835 | 8,289 | 9,929 | |||||||||
| Net change in income taxes |
— | — | — | |||||||||
| Changes in timing, other |
14,354 | (2,625 | ) | (5,242 | ) | |||||||
|
|
|
|
|
|
|
|||||||
| December 31, |
$ | 298,088 | $ | 158,347 | $ | 82,895 | ||||||
|
|
|
|
|
|
|
|||||||
*****
F-53
Table of Contents
Index to Financial Statements
REPORT OF INDEPENDENT REGISTERED PUBLIC ACCOUNTING FIRM
To the Board of Directors of
Midstates Petroleum Company, Inc.
Houston, Texas
We have audited the accompanying balance sheet of Midstates Petroleum Company, Inc. (the “Company”) as of November 9, 2011. This financial statement is the responsibility of the Company’s management. Our responsibility is to express an opinion on this financial statement based on our audit.
We conducted our audit in accordance with the standards of the Public Company Accounting Oversight Board (United States). Those standards require that we plan and perform the audit to obtain reasonable assurance about whether the financial statement is free of material misstatement. The Company is not required to have, nor were we engaged to perform, an audit of its internal control over financial reporting. Our audit included consideration of internal control over financial reporting as a basis for designing audit procedures that are appropriate in the circumstances, but not for the purpose of expressing an opinion on the effectiveness of the Company’s internal control over financial reporting. Accordingly, we express no such opinion. An audit also includes examining, on a test basis, evidence supporting the amounts and disclosures in the financial statement, assessing the accounting principles used and significant estimates made by management, as well as evaluating the overall financial statement presentation. We believe that our audit provides a reasonable basis for our opinion.
In our opinion, such balance sheet presents fairly, in all material respects, the financial position of Midstates Petroleum Company, Inc. as of November 9, 2011, in conformity with accounting principles generally accepted in the United States of America.
/s/ DELOITTE & TOUCHE LLP
Houston, Texas
November 14, 2011
F-54
Table of Contents
Index to Financial Statements
Midstates Petroleum Company, Inc.
Balance Sheet
| November 9, 2011 |
||||
| ASSETS |
||||
| Cash and cash equivalents |
— | |||
|
|
|
|||
| TOTAL |
— | |||
|
|
|
|||
| Commitments and Contingencies (see Note 3) |
||||
| SHAREHOLDER’S EQUITY |
||||
| Common stock, $0.01 par value; authorized 1,000 shares; 1,000 issued and outstanding at November 9, 2011 |
10 | |||
| Less receivable from Midstates Petroleum Holdings LLC |
(10 | ) | ||
|
|
|
|||
| TOTAL |
— | |||
|
|
|
|||
The accompanying notes are an integral part of this financial statement.
F-55
Table of Contents
Index to Financial Statements
Midstates Petroleum Company, Inc.
Notes to the Balance Sheet
| 1. | Organization and Business |
Midstates Petroleum Company, Inc. was formed on October 25, 2011, pursuant to the laws of the State of Delaware to become a holding company for Midstates Petroleum Company LLC.
| 2. | Summary of Significant Accounting Policies |
Basis of Presentation
This balance sheet has been prepared in accordance with accounting principles generally accepted in the United States of America. Separate Statements of Income, Changes in Stockholder’s Equity and of Cash Flows have not been presented because the entity has had no business transactions or activities to date.
Subsequent Events
The Company has evaluated subsequent events through November 14, 2011, the date the financial statements were issued.
| 3. | Commitments and Contingencies |
As of the date of these financial statements, Midstates Petroleum Company, Inc. had no outstanding commitments and contingencies.
F-56
Table of Contents
Index to Financial Statements
GLOSSARY OF OIL AND NATURAL GAS TERMS
The terms defined in this section are used throughout this prospectus:
“Basin.” A large natural depression on the earth’s surface in which sediments generally brought by water accumulate.
“Bbl.” One stock tank barrel, of 42 U.S. gallons liquid volume, used herein in reference to oil, condensate or natural gas liquids.
“Bcf.” One billion cubic feet of natural gas.
“Boe.” Barrels of oil equivalent, with 6,000 cubic feet of natural gas being equivalent to one barrel of oil.
“Boe/d.” Barrels of oil equivalent per day.
“British thermal unit (BTU).” The heat required to raise the temperature of a one-pound mass of water from 58.5 to 59.5 degrees Fahrenheit.
“Completion.” The process of treating a drilled well followed by the installation of permanent equipment for the production of natural gas or oil, or in the case of a dry hole, the reporting of abandonment to the appropriate agency.
“Developed acreage.” The number of acres that are allocated or assignable to productive wells or wells capable of production.
“Developed reserves.” Reserves of any category that can be expected to be recovered (i) through existing wells with existing equipment and operating methods or in which the cost of the required equipment is relatively minor when compared to the cost of a new well; and (ii) through installed extraction equipment and infrastructure operational at the time of the reserves estimate if the extraction is by means not involving a well.
“Development well.” A well drilled within the proved area of a natural gas or oil reservoir to the depth of a stratigraphic horizon known to be productive.
“Dry hole.” A well found to be incapable of producing hydrocarbons in sufficient quantities such that proceeds from the sale of such production do not exceed production expenses and taxes.
“Economically producible.” A resource which generates revenue that exceeds, or is reasonably expected to exceed, the costs of the operation.
“Exploratory well.” A well drilled to find a new field or to find a new reservoir in a field previously found to be productive of natural gas or oil in another reservoir.
“Field.” An area consisting of a single reservoir or multiple reservoirs all grouped on, or related to, the same individual geological structural feature or stratigraphic condition. The field name refers to the surface area, although it may refer to both the surface and the underground productive formations.
“Formation.” A layer of rock which has distinct characteristics that differ from nearby rock.
A-1
Table of Contents
Index to Financial Statements
“Horizontal drilling.” A drilling technique used in certain formations where a well is drilled vertically to a certain depth and then drilled at a right angle within a specified interval.
“Infill drilling.” A drilling technique used in certain formations where a well is drilled into the same pool as known producing wells so that oil or natural gas does not have to travel as far through the formation.
“MBbl.” One thousand barrels of oil, condensate or natural gas liquids.
“MBoe.” One thousand barrels of oil equivalent.
“Mcf.” One thousand cubic feet of natural gas.
“MMBbl.” One million barrels of oil, condensate or natural gas liquids.
“MMBoe.” One million barrels of oil equivalent.
“MMBtu.” One million British thermal units.
“MMcf.” One million cubic feet of natural gas.
“Net acres.” The percentage of total acres an owner has out of a particular number of acres, or a specified tract. An owner who has 50% interest in 100 acres owns 50 net acres.
“NYMEX.” The New York Mercantile Exchange.
“Productive well.” A well that is found to be capable of producing hydrocarbons in sufficient quantities such that proceeds from the sale of the production exceed production expenses and taxes.
“Proved developed reserves.” Proved reserves that can be expected to be recovered through existing wells with existing equipment and operating methods.
“Proved reserves.”
Under SEC rules for fiscal years ending on or after December 31, 2009, proved reserves are defined as:
Those quantities of oil and gas, which, by analysis of geoscience and engineering data, can be estimated with reasonable certainty to be economically producible — from a given date forward, from known reservoirs, and under existing economic conditions, operating methods, and government regulations — prior to the time at which contracts providing the right to operate expire, unless evidence indicates that renewal is reasonably certain, regardless of whether deterministic or probabilistic methods are used for the estimation. The project to extract the hydrocarbons must have commenced or the operator must be reasonably certain that it will commence the project within a reasonable time. The area of the reservoir considered as proved includes (i) the area identified by drilling and limited by fluid contacts, if any, and (ii) adjacent undrilled portions of the reservoir that can, with reasonable certainty, be judged to be continuous with it and to contain economically producible oil or gas on the basis of available geoscience and engineering data. In the absence of data on fluid contacts, proved quantities in a reservoir are limited by the lowest known hydrocarbons, LKH, as seen in a well penetration unless geoscience, engineering, or performance data and reliable technology establishes a lower contact with reasonable certainty. Where direct observation from well penetrations has defined a highest known oil, HKO, elevation and the potential exists for an associated gas cap, proved oil reserves may be assigned in the structurally higher portions of the reservoir only if geoscience, engineering, or performance data and reliable technology establish the higher contact with reasonable
A-2
Table of Contents
Index to Financial Statements
certainty. Reserves which can be produced economically through application of improved recovery techniques (including, but not limited to, fluid injection) are included in the proved classification when (i) successful testing by a pilot project in an area of the reservoir with properties no more favorable than in the reservoir as a whole, the operation of an installed program in the reservoir or an analogous reservoir, or other evidence using reliable technology establishes the reasonable certainty of the engineering analysis on which the project or program was based; and (ii) the project has been approved for development by all necessary parties and entities, including governmental entities. Existing economic conditions include prices and costs at which economic producibility from a reservoir is to be determined. The price shall be the average price during the 12-month period prior to the ending date of the period covered by the report, determined as an unweighted arithmetic average of the first-day-of-the-month price for each month within such period, unless prices are defined by contractual arrangements, excluding escalations based upon future conditions.
Under SEC rules for fiscal years ending prior to December 31, 2009, proved reserves are defined as:
The estimated quantities of oil, natural gas, and natural gas liquids which geological and engineering data demonstrate with reasonable certainty to be recoverable in future years from known reservoirs under existing economic and operating conditions, i.e., prices and costs as of the date the estimate is made. Prices include consideration of changes in existing prices provided only by contractual arrangements, but not on escalations based upon future conditions. Reservoirs are considered proved if economic producibility is supported by either actual production or conclusive formation test. The area of a reservoir considered proved includes (A) that portion delineated by drilling and defined by gas-oil and/or oil-water contacts, if any, and (B) the immediately adjoining portions not yet drilled, but which can be reasonably judged as economically productive on the basis of available geological and engineering data. In the absence of information on fluid contacts, the lowest known structural occurrence of hydrocarbons controls the lower proved limit of the reservoir. Reserves which can be produced economically through application of improved recovery techniques (such as fluid injection) are included in the proved classification when successful testing by a pilot project, or the operation of an installed program in the reservoir, provides support for the engineering analysis on which the project or program was based. Estimates of proved reserves do not include the following: (A) Oil that may become available from known reservoirs but is classified separately as indicated additional reserves; (B) oil, natural gas, and natural gas liquids, the recovery of which is subject to reasonable doubt because of uncertainty as to geology, reservoir characteristics, or economic factors; (C) oil, natural gas, and natural gas liquids, that may occur in undrilled prospects; and (D) oil, natural gas, and natural gas liquids, that may be recovered from oil shales, coal, gilsonite and other such sources.
“Proved undeveloped reserves (PUD).” Proved reserves that are expected to be recovered from new wells on undrilled acreage or from existing wells where a relatively major expenditure is required for recompletion.
“Reasonable certainty.” A high degree of confidence.
“Recompletion.” The process of re-entering an existing wellbore that is either producing or not producing and completing new reservoirs in an attempt to establish or increase existing production.
“Reserves.” Estimated remaining quantities of oil and natural gas and related substances anticipated to be economically producible as of a given date by application of development projects to known accumulations.
“Reservoir.” A porous and permeable underground formation containing a natural accumulation of producible natural gas and/or oil that is confined by impermeable rock or water barriers and is individual and separate from other reservoirs.
A-3
Table of Contents
Index to Financial Statements
“Rotary sidewall coring.” A technique for collecting core samples where a miniaturized automated rotary drilling tool is applied to the side of the borehole to cut a sample from the subject material.
“Sidetracking.” The workover term for drilling a directional hole to bypass an obstruction in the well that cannot be removed or damage to the well, such as collapsed casing that cannot be repaired. Sidetracking is also done to deepen a well or to relocate the bottom of the well in a more productive zone, which is horizontally removed from the original well.
“Slim-hole drilling.” A drilling technique in which the size of the hole is smaller than the conventional hole diameter for a given depth.
“Spacing.” The distance between wells producing from the same reservoir. Spacing is often expressed in terms of acres, e.g., 40-acre spacing, and is often established by regulatory agencies.
“Unit.” The joining of all or substantially all interests in a reservoir or field, rather than a single tract, to provide for development and operation without regard to separate property interests. Also, the area covered by a unitization agreement.
“Wellbore.” The hole drilled by the bit that is equipped for oil or gas production on a completed well. Also called well or borehole.
“Working interest.” The right granted to the lessee of a property to explore for and to produce and own oil, gas, or other minerals. The working interest owners bear the exploration, development, and operating costs on either a cash, penalty, or carried basis.
A-4
Table of Contents
Index to Financial Statements
Shares
Midstates Petroleum Company, Inc.
Goldman, Sachs & Co.
Morgan Stanley
Wells Fargo Securities
Through and including , 2012 (the 25th day after the date of this prospectus) all dealers effecting transactions in these securities, whether or not participating in this offering, may be required to deliver a prospectus. This is in addition to a dealer’s obligation to deliver a prospectus when acting as an underwriter and with respect to an unsold allotment or subscription.
Table of Contents
Index to Financial Statements
Part II
INFORMATION NOT REQUIRED IN PROSPECTUS
| ITEM 13. | Other Expenses of Issuance and Distribution |
The following table sets forth an itemized statement of the amounts of all expenses (excluding underwriting discounts and commissions) payable by us in connection with the registration of the common stock offered hereby. With the exception of the SEC Registration Fee, FINRA Filing Fee and NYSE listing fee), the amounts set forth below are estimates. The selling stockholders will not bear any portion of such expenses.
| SEC Registration Fee |
$ | 45,840 | ||
| FINRA Filing Fee |
40,500 | |||
| NYSE listing fee |
* | |||
| Accountants’ fees and expenses |
* | |||
| Legal fees and expenses |
* | |||
| Printing and engraving expenses |
* | |||
| Transfer agent and registrar fees |
3,500 | |||
| Miscellaneous |
* | |||
|
|
|
|||
| Total |
$ | * | ||
|
|
|
| * | To be filed by amendment. |
| ITEM 14. | Indemnification of Directors and Officers |
Section 145(a) of the DGCL provides, in general, that a corporation may indemnify any person who was or is a party or is threatened to be made a party to any threatened, pending, or completed action, suit, or proceeding, whether civil, criminal, administrative, or investigative (other than an action by or in the right of the corporation), because he or she is or was a director, officer, employee, or agent of the corporation, or is or was serving at the request of the corporation as a director, officer, employee, or agent of another corporation, partnership, joint venture, trust, or other enterprise, against expenses (including attorneys’ fees), judgments, fines, and amounts paid in settlement actually and reasonably incurred by the person in connection with such action, suit, or proceeding, if he or she acted in good faith and in a manner he or she reasonably believed to be in or not opposed to the best interests of the corporation and, with respect to any criminal action or proceeding, had no reasonable cause to believe his or her conduct was unlawful.
Section 145(b) of the DGCL provides, in general, that a corporation may indemnify any person who was or is a party or is threatened to be made a party to any threatened, pending, or completed action or suit by or in the right of the corporation to procure a judgment in its favor because the person is or was a director, officer, employee, or agent of the corporation, or is or was serving at the request of the corporation as a director, officer, employee, or agent of another corporation, partnership, joint venture, trust, or other enterprise, against expenses (including attorneys’ fees) actually and reasonably incurred by the person in connection with the defense or settlement of such action or suit if he or she acted in good faith and in a manner he or she reasonably believed to be in or not opposed to the best interests of the corporation, except that no indemnification shall be made with respect to any claim, issue, or matter as to which he or she shall have been adjudged to be liable to the corporation unless and only to the extent that the Court of Chancery or other adjudicating court determines that, despite the adjudication of liability but in view of all of the circumstances of the case, he or she is fairly and reasonably entitled to indemnity for such expenses which the Court of Chancery or other adjudicating court shall deem proper.
II-1
Table of Contents
Index to Financial Statements
Section 145(e) of the DGCL provides that expenses (including attorneys’ fees) incurred by an officer or director in defending any civil, criminal, administrative or investigative action, suit or proceeding may be paid by the corporation in advance of the final disposition of such action, suit or proceeding upon receipt of an undertaking by or on behalf of such director or officer to repay such amount if it shall ultimately be determined that such person is not entitled to be indemnified by the corporation as authorized by Section 145 of the DGCL Law. Section 145(e) of the DGCL further provides that such expenses (including attorneys’ fees) incurred by former directors and officers or other employees or agents of the corporation may be so paid upon such terms and conditions as the corporation deems appropriate.
Section 145(g) of the DGCL provides, in general, that a corporation may purchase and maintain insurance on behalf of any person who is or was a director, officer, employee, or agent of the corporation, or is or was serving at the request of the corporation as a director, officer, employee, or agent of another corporation, partnership, joint venture, trust or other enterprise against any liability asserted against such person and incurred by such person in any such capacity, or arising out of his or her status as such, whether or not the corporation would have the power to indemnify the person against such liability under Section 145 of the DGCL.
Our certificate of incorporation that will be in effect upon the closing of this offering will provide that we will indemnify and hold harmless, to the fullest extent permitted by the DGCL, any person who was or is made or is threatened to be made a party or is otherwise involved in any threatened, pending or completed action, suit, or proceeding, whether civil, criminal, administrative, or investigative, by reason of the fact that he or she is or was one of our directors or officers or is or was serving at our request as a director or officer of another corporation, partnership, joint venture, trust or other enterprise. Our amended and restated bylaws that will be in effect upon the closing of this offering will further provide for the advancement of expenses to each of our officers and directors.
Our certificate of incorporation that will be in effect upon the closing of this offering will provide that, to the fullest extent permitted by the DGCL, our directors shall not be personally liable to us or our stockholders for monetary damages for breach of fiduciary duty as a director. Under Section 102(b)(7) of the DGCL, the personal liability of a director to the corporation or its stockholders for monetary damages for breach of fiduciary duty can be limited or eliminated except (1) for any breach of the director’s duty of loyalty to the corporation or its stockholders; (2) for acts or omissions not in good faith or which involve intentional misconduct or a knowing violation of law; (3) under Section 174 of the DGCL (relating to unlawful payment of dividend or unlawful stock purchase or redemption); or (4) for any transaction from which the director derived an improper personal benefit.
We also intend to maintain a general liability insurance policy which covers certain liabilities of directors and officers of our company arising out of claims based on acts or omissions in their capacities as directors or officers, whether or not we would have the power to indemnify such person against such liability under the DGCL or the provisions of our certificate of incorporation.
In connection with the sale of common stock being registered hereby, we intend to enter into indemnification agreements with each of our directors and our executive officers. These agreements will provide that we will indemnify each of our directors and such officers to the fullest extent permitted by law and by our certificate of incorporation or bylaws.
In any underwriting agreement we enter into in connection with the sale of common stock being registered hereby, the underwriters will agree to indemnify, under certain conditions, us, our directors, our officers and persons who control us, within the meaning of the Securities Act, against certain liabilities.
II-2
Table of Contents
Index to Financial Statements
| ITEM 15. | Recent Sales of Unregistered Securities |
On November 9, 2011, Midstates Petroleum Company, Inc. issued 1,000 shares of common stock, par value $0.01 per share, to Midstates Petroleum Holdings LLC for $10.00. The issuance of such shares of common stock was not registered under the Securities Act, because the shares were offered and sold in a transaction exempt from registration under Section 4(2) of the Securities Act.
| ITEM 16. | Exhibits and Financial Statement Schedules |
| (a) | Exhibits |
| Exhibit Number |
Description | |
| *1.1 | Form of Underwriting Agreement. | |
| *2.1 | Form of Reorganization Agreement. | |
| *3.1 | Amended and Restated Certificate of Incorporation of Midstates Petroleum Company, Inc. | |
| *3.2 | Amended and Restated Bylaws of Midstates Petroleum Company, Inc. | |
| *4.1 | Form of Common Stock Certificate. | |
| *5.1 | Opinion of Vinson & Elkins, L.L.P. as to the legality of the securities being registered. | |
| *10.1 | Amended and Restated Credit Agreement, dated as of December 10, 2010, among Midstates Petroleum LLC, Wells Fargo Bank, National Association and the other financial institutions party thereto. | |
| *10.2 | First Amendment, dated March 28, 2011, to Amended and Restated Credit Agreement, dated as of December 10, 2010, among Midstates Petroleum LLC, Wells Fargo Bank, National Association and the other financial institutions party thereto. | |
| *10.3 | Second Amendment, dated September 30, 2011, Amended and Restated Credit Agreement, dated as of December 10, 2010, among Midstates Petroleum LLC, Wells Fargo Bank, National Association and the other financial institutions party thereto. | |
| *10.4 | Employment Agreement between John A. Crum and Midstates Petroleum Company LLC. | |
| *10.5 | Employment Agreement between Thomas L. Mitchell and Midstates Petroleum Company LLC. | |
| *10.6 | Employment Agreement between Stephen C. Pugh and Midstates Petroleum Company LLC. | |
| *10.7 | Employment Agreement between John Foley and Midstates Petroleum Company LLC. | |
| *10.8 | Form of Registration Rights Agreement among Midstates Petroleum Company, Inc. and certain equity owners. | |
| *10.9 | Form of Long-Term Incentive Plan of Midstates Petroleum Company, Inc. | |
| *10.10 | Form of Indemnification Agreement between Midstates Petroleum Company, Inc. and each of the directors and executive officers thereof. | |
| *21.1 | List of subsidiaries of Midstates Petroleum Company, Inc. | |
| 23.1 | Consent of Deloitte & Touche LLP. | |
| 23.2 | Consent of Deloitte & Touche LLP. | |
II-3
Table of Contents
Index to Financial Statements
| 23.3 | Consent of Netherland, Sewell & Associates, Inc. | |
| *23.4 | Consent of Vinson & Elkins L.L.P. (included in Exhibit 5.1). | |
| 24.1 | Power of Attorney (included on the signature page of this registration statement). | |
| 99.1 | Report of Netherland, Sewell & Associates, Inc. for reserves as of September 30, 2011. | |
| 99.2 | Report of Netherland, Sewell & Associates, Inc. for reserves as of December 31, 2010. | |
| 99.3 | Report of Netherland, Sewell & Associates, Inc. for reserves as of December 31, 2009. | |
| * | To be filed by amendment. |
| ITEM 17. | Undertakings |
The undersigned registrant hereby undertakes to provide to the underwriters at the closing specified in the underwriting agreement certificates in such denominations and registered in such names as required by the underwriters to permit prompt delivery to each purchaser.
Insofar as indemnification for liabilities arising under the Securities Act may be permitted to directors, officers and controlling persons of the registrant pursuant to the foregoing provisions, or otherwise, the registrant has been advised that in the opinion of the SEC such indemnification is against public policy as expressed in the Securities Act and is, therefore, unenforceable. In the event that a claim for indemnification against such liabilities (other than the payment by the registrant of expenses incurred or paid by a director, officer or controlling person of the registrant in the successful defense of any action, suit or proceeding) is asserted by such director, officer or controlling person in connection with the securities being registered, the registrant will, unless in the opinion of its counsel the matter has been settled by controlling precedent, submit to a court of appropriate jurisdiction the question whether such indemnification by it is against public policy as expressed in the Securities Act and will be governed by the final adjudication of such issue.
The undersigned registrant hereby undertakes that:
(1) For purposes of determining any liability under the Securities Act, the information omitted from the form of prospectus filed as part of this registration statement in reliance upon Rule 430A and contained in a form of prospectus filed by the registrant pursuant to Rule 424(b)(1) or (4) or 497(h) under the Securities Act shall be deemed to be part of this registration statement as of the time it was declared effective.
(2) For the purpose of determining any liability under the Securities Act, each post-effective amendment that contains a form of prospectus shall be deemed to be a new registration statement relating to the securities offered therein, and the offering of such securities at that time shall be deemed to be the initial bona fide offering thereof.
II-4
Table of Contents
Index to Financial Statements
SIGNATURES
Pursuant to the requirements of the Securities Act of 1933, the registrant has duly caused this Registration Statement to be signed on its behalf by the undersigned, thereunto duly authorized, in the City of Houston, State of Texas, on November 14, 2011.
| MIDSTATES PETROLEUM COMPANY, INC. | ||
| By: | /S/ THOMAS L. MITCHELL | |
| Thomas L. Mitchell | ||
| Chief Financial Officer | ||
POWER OF ATTORNEY
Each person whose signature appears below appoints John A. Crum, John Foley and Thomas L. Mitchell, and each of them, any of whom may act without the joinder of the other, as his true and lawful attorneys-in-fact and agents, with full power of substitution and resubstitution, for him and in his name, place and stead, in any and all capacities, to sign any and all amendments (including post-effective amendments) to this Registration Statement and any Registration Statement (including any amendment thereto) for this offering that is to be effective upon filing pursuant to Rule 462(b) under the Securities Act of 1933, as amended, and to file the same, with all exhibits thereto, and all other documents in connection therewith, with the Securities and Exchange Commission, granting unto said attorneys-in-fact and agents full power and authority to do and perform each and every act and thing requisite and necessary to be done, as fully to all intents and purposes as he might or would do in person, hereby ratifying and confirming all that said attorneys-in-fact and agents or any of them or their or his substitute or substitutes, may lawfully do or cause to be done by virtue hereof.
Pursuant to the requirements of the Securities Act of 1933, as amended, this Registration Statement has been signed below by the following persons in the capacities and the dates indicated.
| Signature |
Title |
Date | ||
| /S/ JOHN A. CRUM John A. Crum |
President, Chief Executive Officer and Director (Principal Executive Officer) | November 14, 2011 | ||
| /S/ THOMAS L. MITCHELL Thomas L. Mitchell |
Executive Vice President and Chief Financial Officer (Principal Financial Officer and Principal Accounting Officer) |
November 14, 2011 | ||
| /S/ STEPHEN J. MCDANIEL Stephen J. McDaniel |
Chairman of the Board of Directors | November 14, 2011 | ||
| /S/ ALEX T. KRUEGER Alex T. Krueger |
Director | November 14, 2011 | ||
| /S/ ANASTASIA DEULINA Anastasia Deulina |
Director | November 14, 2011 | ||
| /S/ JOHN MOGFORD John Mogford |
Director | November 14, 2011 | ||
II-5
Table of Contents
Index to Financial Statements
INDEX TO EXHIBITS
| Exhibit Number |
Description | |
| *1.1 | Form of Underwriting Agreement. | |
| *2.1 | Form of Reorganization Agreement. | |
| *3.1 | Amended and Restated Certificate of Incorporation of Midstates Petroleum Company, Inc. | |
| *3.2 | Amended and Restated Bylaws of Midstates Petroleum Company, Inc. | |
| *4.1 | Form of Common Stock Certificate. | |
| *5.1 | Opinion of Vinson & Elkins, L.L.P. as to the legality of the securities being registered. | |
| *10.1 | Amended and Restated Credit Agreement, dated as of December 10, 2010, among Midstates Petroleum LLC, Wells Fargo Bank, National Association and the other financial institutions party thereto. | |
| *10.2 | First Amendment, dated March 28, 2011, to Amended and Restated Credit Agreement, dated as of December 10, 2010, among Midstates Petroleum LLC, Wells Fargo Bank, National Association and the other financial institutions party thereto. | |
| *10.3 | Second Amendment, dated September 30, 2011, Amended and Restated Credit Agreement, dated as of December 10, 2010, among Midstates Petroleum LLC, Wells Fargo Bank, National Association and the other financial institutions party thereto. | |
| *10.4 | Employment Agreement between John A. Crum and Midstates Petroleum Company LLC. | |
| *10.5 | Employment Agreement between Thomas L. Mitchell and Midstates Petroleum Company LLC. | |
| *10.6 | Employment Agreement between Stephen C. Pugh and Midstates Petroleum Company LLC. | |
| *10.7 | Employment Agreement between John Foley and Midstates Petroleum Company LLC. | |
| *10.8 | Form of Registration Rights Agreement among Midstates Petroleum Company, Inc. and certain equity owners. | |
| *10.9 | Form of Long-Term Incentive Plan of Midstates Petroleum Company, Inc. | |
| *10.10 | Form of Indemnification Agreement between Midstates Petroleum Company, Inc. and each of the directors and executive officers thereof. | |
| *21.1 | List of subsidiaries of Midstates Petroleum Company, Inc. | |
| 23.1 | Consent of Deloitte & Touche LLP. | |
| 23.2 | Consent of Deloitte & Touche LLP. | |
| 23.3 | Consent of Netherland, Sewell & Associates, Inc. | |
| *23.4 | Consent of Vinson & Elkins L.L.P. (included in Exhibit 5.1). | |
| 24.1 | Power of Attorney (included on the signature page of this registration statement). | |
| 99.1 | Report of Netherland, Sewell & Associates, Inc. for reserves as of September 30, 2011. | |
| 99.2 | Report of Netherland, Sewell & Associates, Inc. for reserves as of December 31, 2010. | |
| 99.3 | Report of Netherland, Sewell & Associates, Inc. for reserves as of December 31, 2009. | |
| * | To be filed by amendment. |
II-6