Attached files
| file | filename |
|---|---|
| 8-K - ROCK-TENN COMPANY 8-K - Rock-Tenn CO | a50065071.htm |
Exhibit 99.1
Fiscal 2011 4th Quarter Earnings Conference Call Presentation November 10, 2011 Jim Rubright – Chairman and Chief Executive Officer Steve Voorhees – Chief Financial Officer and Chief Administrative Officer
Statements in this presentation that do not relate strictly to historical facts are forward-looking statements within the meaning of the Private Securities Litigation Reform Act of 1995. Forward-looking statements are based on our current expectations, beliefs, plans or forecasts and use words in this presentation such as will, estimate, trending, or refer to future time periods. You should not place undue reliance on any forward-looking statements as such statements involve risks, uncertainties, assumptions and other factors that could cause actual results to differ materially, including the following: our ability to integrate Smurfit-Stone or to achieve benefits from the Smurfit Acquisition, including, without limitation, synergies and performance improvements; expected levels of depreciation, corporate expenses, interest expense, income tax rates, federal NOL utilization, Black Liquor and AMT tax credit utilization, pension contributions, capital expenditures, commodity costs, maintenance outages, containerboard inventory builds; the level of demand for our products; our ability to successfully identity and make performance improvements; anticipated returns on our capital investments; possible increases in energy, raw materials, shipping and capital equipment costs; any reduction in the supply of raw materials; fluctuations in selling prices and volumes; intense competition; the potential loss of certain customers; adverse changes in general market and industry conditions and other risks, uncertainties and factors discussed in Item 1A "Risk Factors" and under the caption "Business — Forward-Looking Information" in our 2010 Annual Report on Form 10-K and by similar disclosures in any of our subsequent SEC filings. The information contained herein speaks as of the date hereof and we do not have or undertake any obligation to update such information as future events unfold.Cautionary Statement Regarding Forward-Looking Information
Use of Non-GAAP Financial Measures and Reconciliations We have included financial measures that are not prepared in accordance with accounting principles generally accepted in the United States ("GAAP"). The non-GAAP financial measures presented are not intended to be a substitute for GAAP financial measures, and any analysis of non-GAAP financial measures should be used only in conjunction with results presented in accordance with GAAP reconciliations of non-GAAP financial measures to GAAP financial measures included in the Appendix to this presentation.
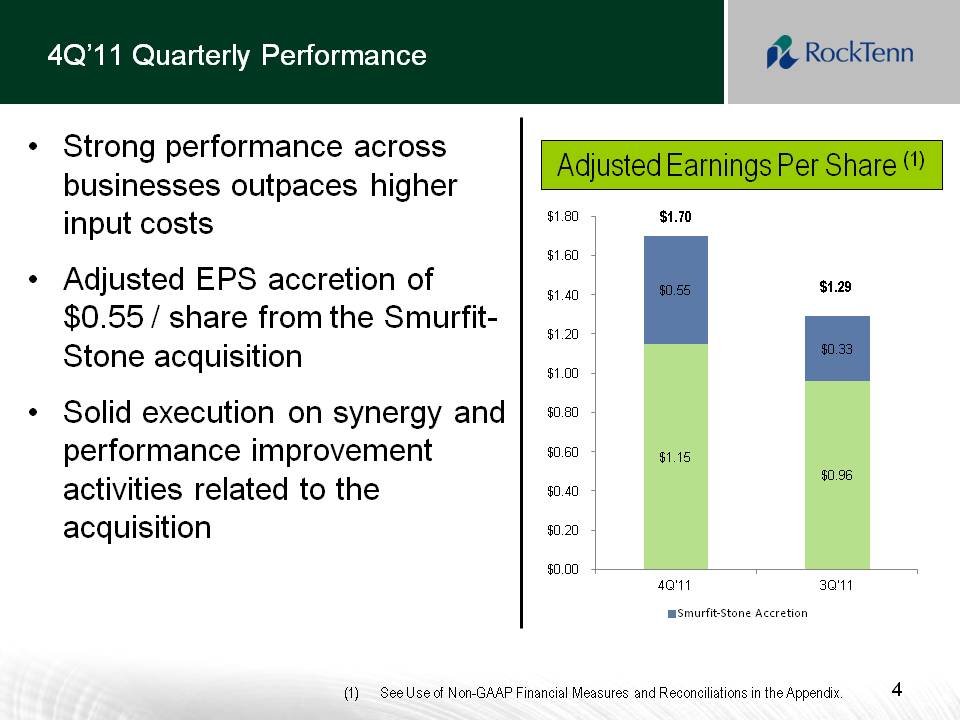
4Q’11 Quarterly Performance 4 Strong performance across businesses outpaces higher input costs Adjusted EPS accretion of $0.55 / share from the Smurfit-Stone acquisition Solid execution on synergy and performance improvement activities related to the acquisition AdjustedEarningsPerShare(1)SeeUseofNon-GAAPFinancialMeasuresandReconciliationsintheAppendix.$1.70$1.29
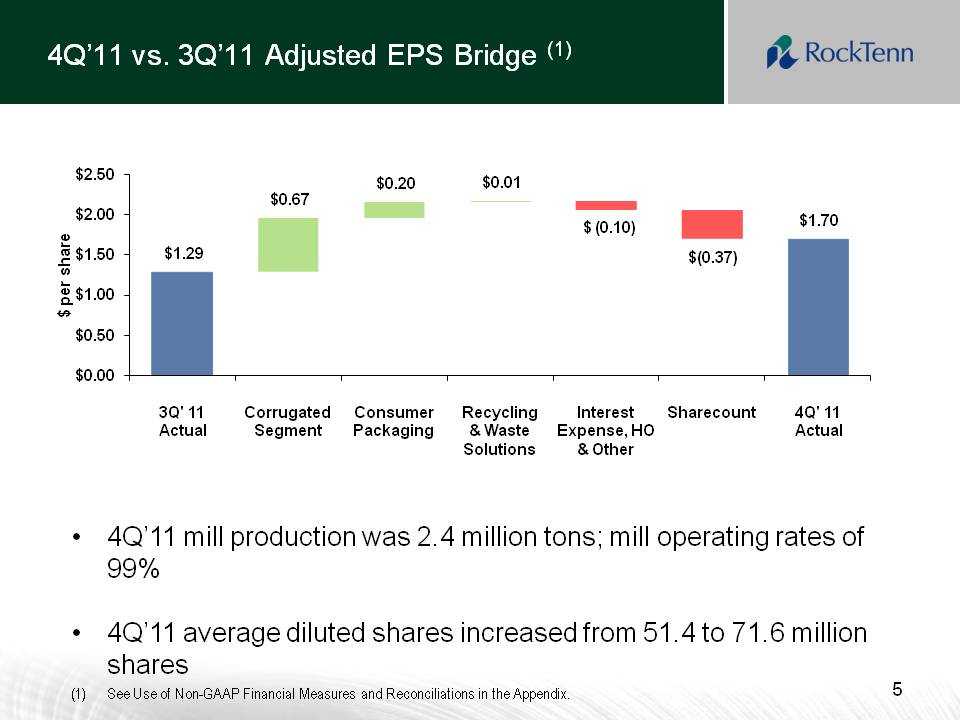
Title: 4Q’11 vs. 3Q’11 Adjusted EPS Bridge (1) Other Placeholder: 5 4Q’11 mill production was 2.4 million tons; mill operating rates of 99%4Q’11 average diluted shares increased from 51.4 to 71.6 million shares See Use of Non-GAAP Financial Measures and Reconciliations in the Appendix.
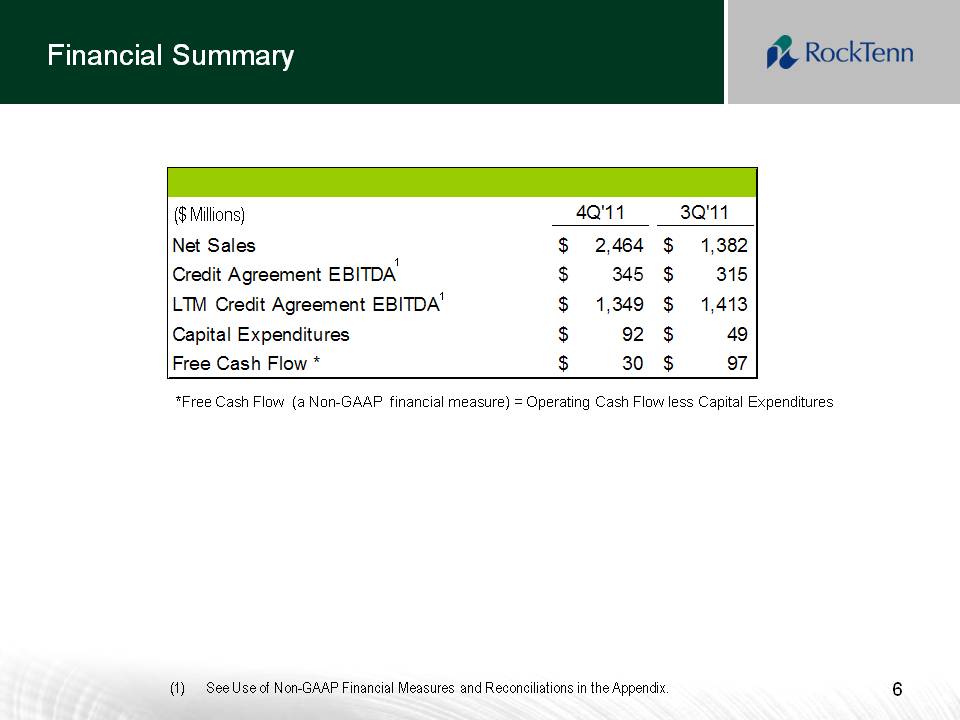
Financial Summary Other Placeholder: 6 1 *Free Cash Flow (a Non-GAAP financial measure) = Operating Cash Flow less Capital Expenditures See Use of Non-GAAP Financial Measures and Reconciliations in the Appendix. ($ Millions) 1
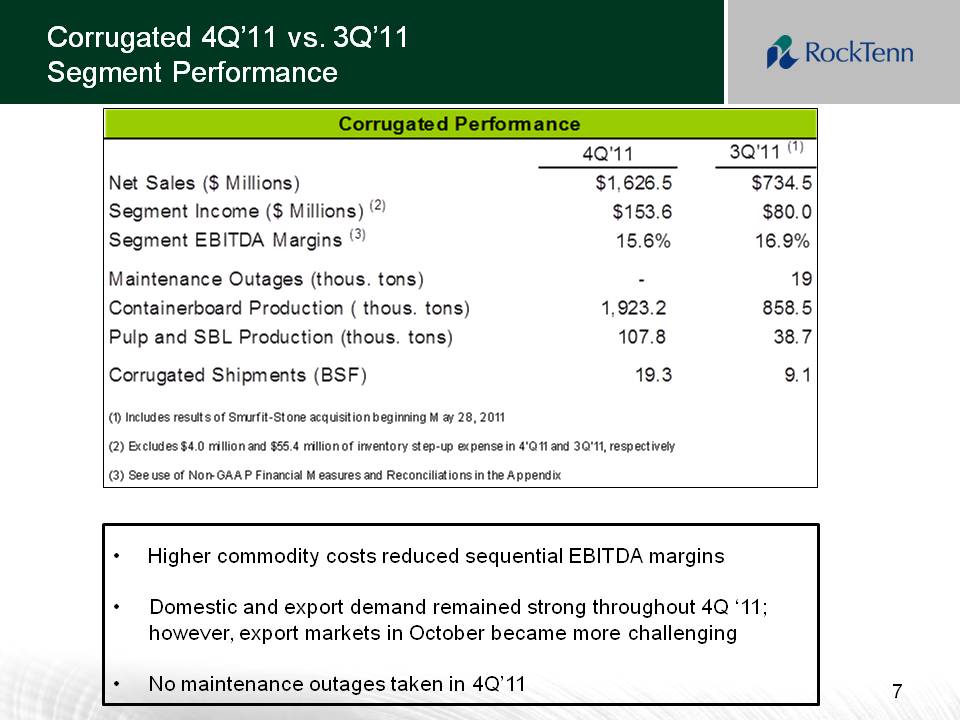
Corrugated 4Q’11 vs. 3Q’11 Segment Performance Other Placeholder: 7 Higher commodity costs reduced sequential EBITDA margins Domestic and export demand remained strong throughout 4Q ‘11; however, export markets in October became more challengingNo maintenance outages taken in 4Q’11
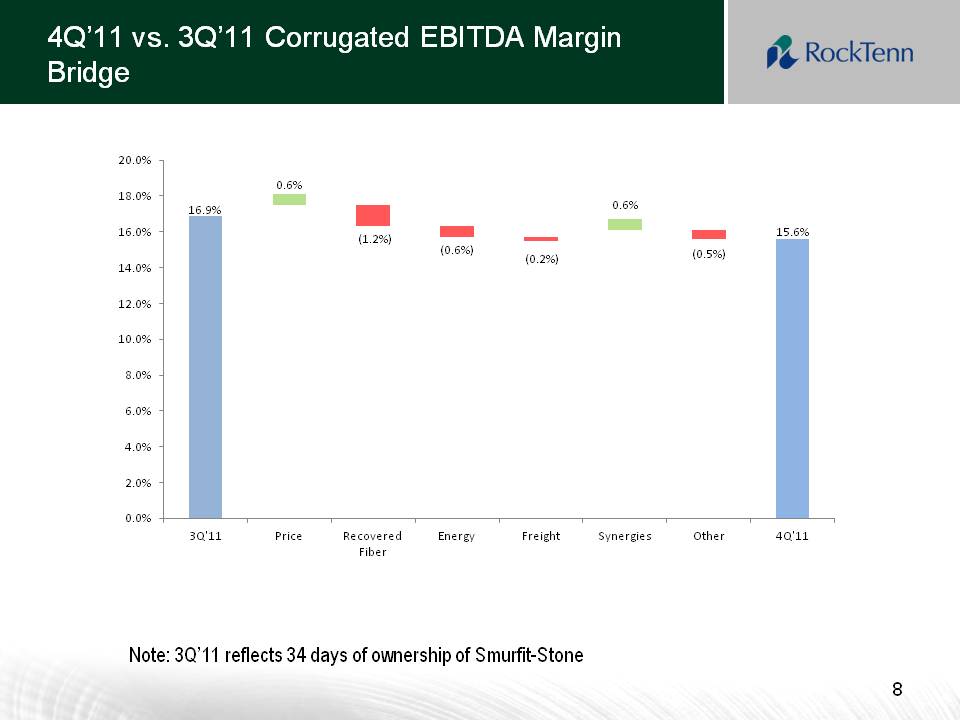
4Q’11 vs. 3Q’11 Corrugated EBITDA Margin Bridge Other Placeholder: 8 Note: 3Q’11 reflects 34 days of ownership of Smurfit-Stone
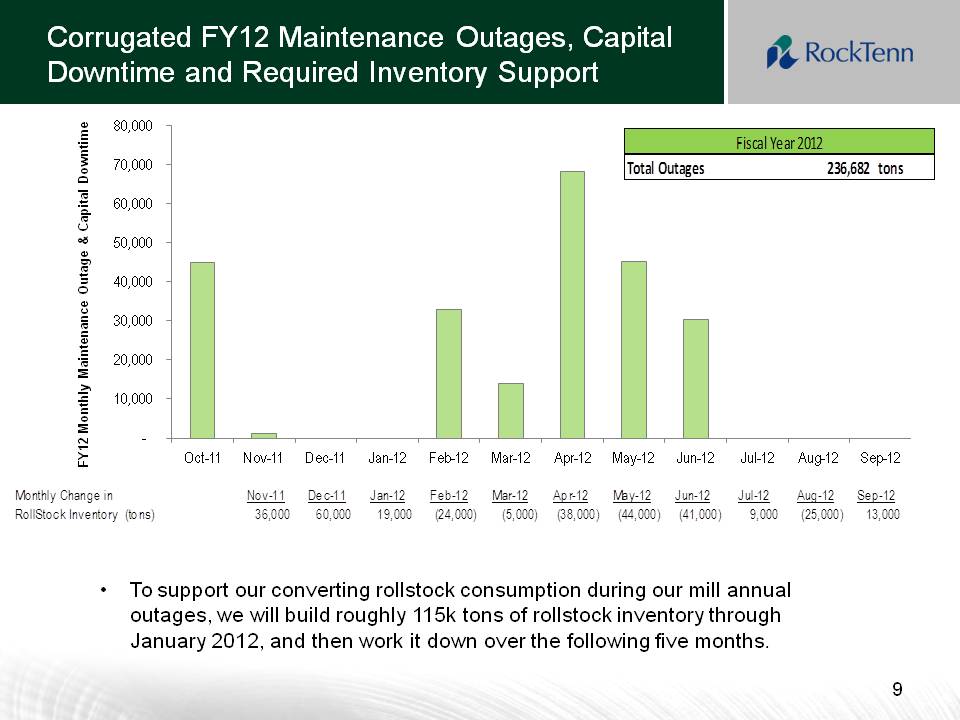
Corrugated FY12 Maintenance Outages, Capital Downtime and Required Inventory Support Other Placeholder: 9 To support our converting rollstock consumption during our mill annual outages, we will build roughly 115k tons of rollstock inventory through January 2012, and then work it down over the following five months.
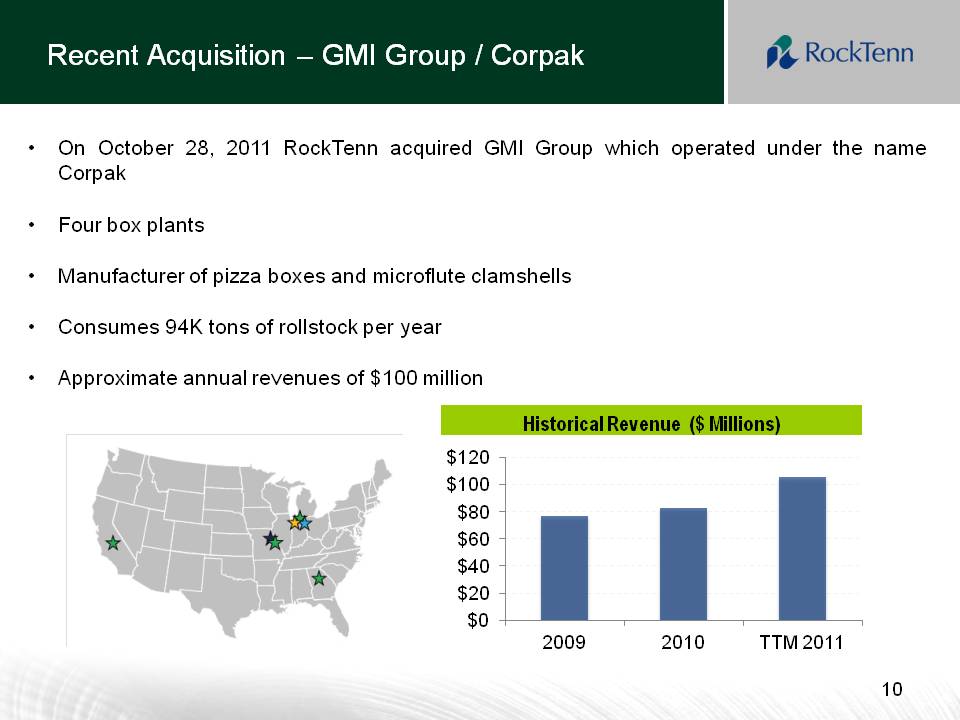
Recent Acquisition – GMI Group / Corpak Other Placeholder: 10 On October 28, 2011 RockTenn acquired GMI Group which operated under the name CorpakFour box plantsManufacturer of pizza boxes and microflute clamshellsConsumes 94K tons of rollstock per yearApproximate annual revenues of $100 million Historical Revenue ($ Millions)
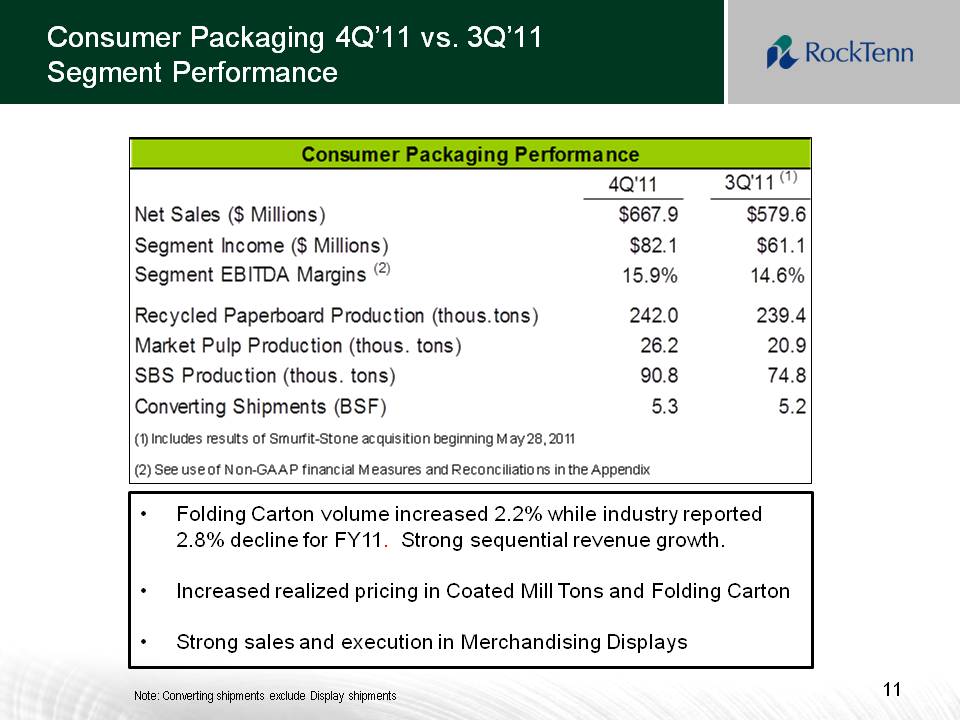
Consumer Packaging 4Q’11 vs. 3Q’11 Segment Performance Other Placeholder: 11 Folding Carton volume increased 2.2% while industry reported 2.8% decline for FY11. Strong sequential revenue growth.Increased realized pricing in Coated Mill Tons and Folding CartonStrong sales and execution in Merchandising Displays Note: Converting shipments exclude Display shipments
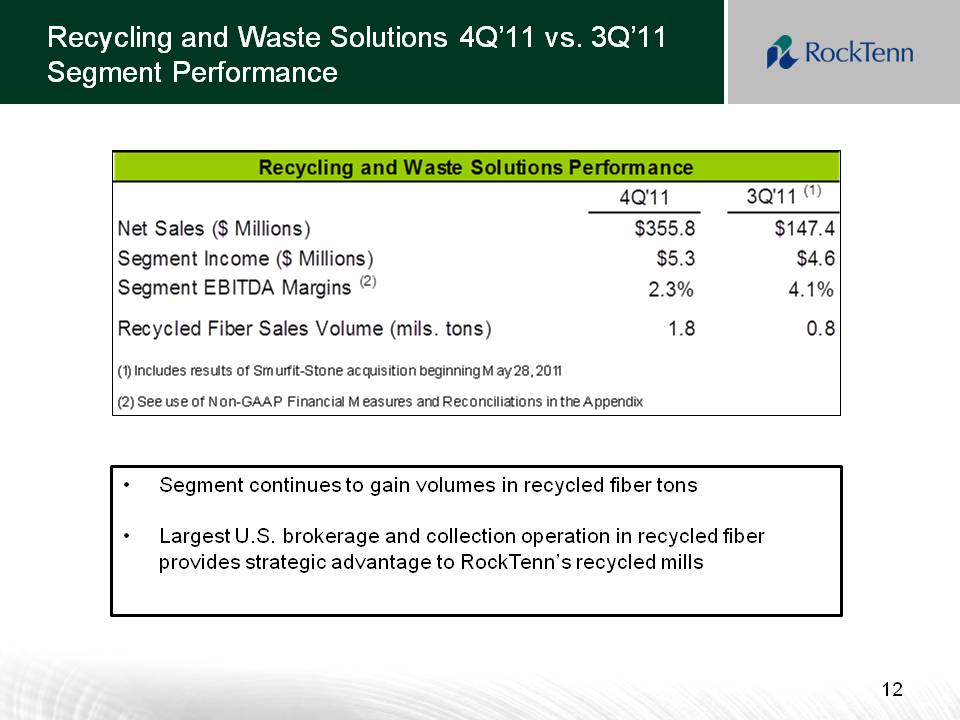
Recycling and Waste Solutions 4Q’11 vs. 3Q’11 Segment Performance Other Placeholder: 12 Segment continues to gain volumes in recycled fiber tonsLargest U.S. brokerage and collection operation in recycled fiber provides strategic advantage to RockTenn’s recycled mills
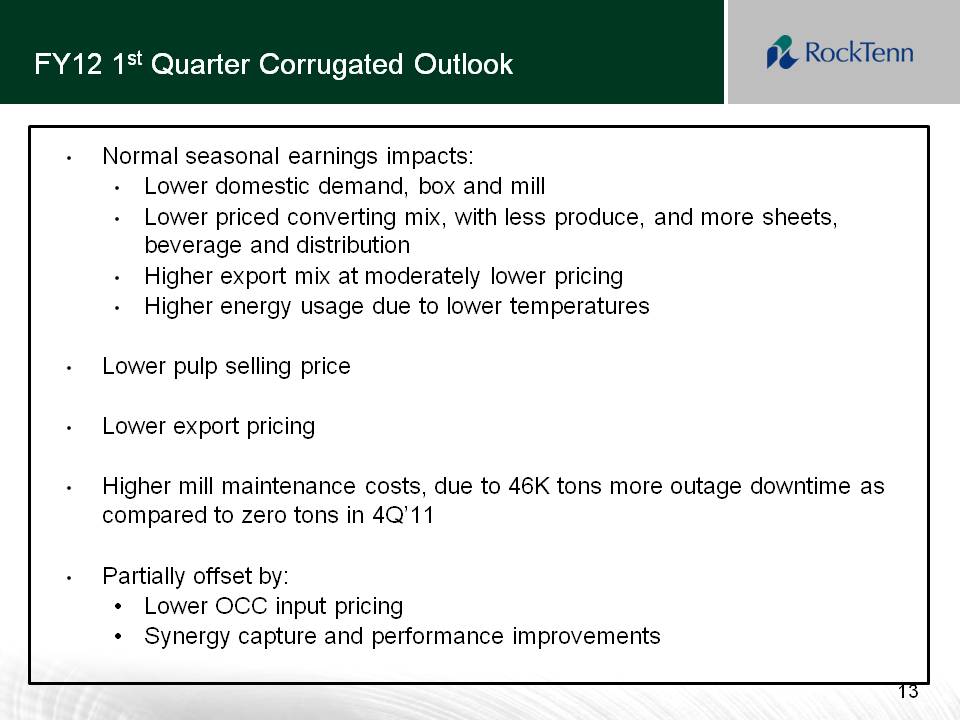
FY12 1st Quarter Corrugated Outlook Other Placeholder: Normal seasonal earnings impacts:Lower domestic demand, box and millLower priced converting mix, with less produce, and more sheets, beverage and distributionHigher export mix at moderately lower pricingHigher energy usage due to lower temperaturesLower pulp selling price Lower export pricingHigher mill maintenance costs, due to 46K tons more outage downtime as compared to zero tons in 4Q’11Partially offset by:Lower OCC input pricingSynergy capture and performance improvements
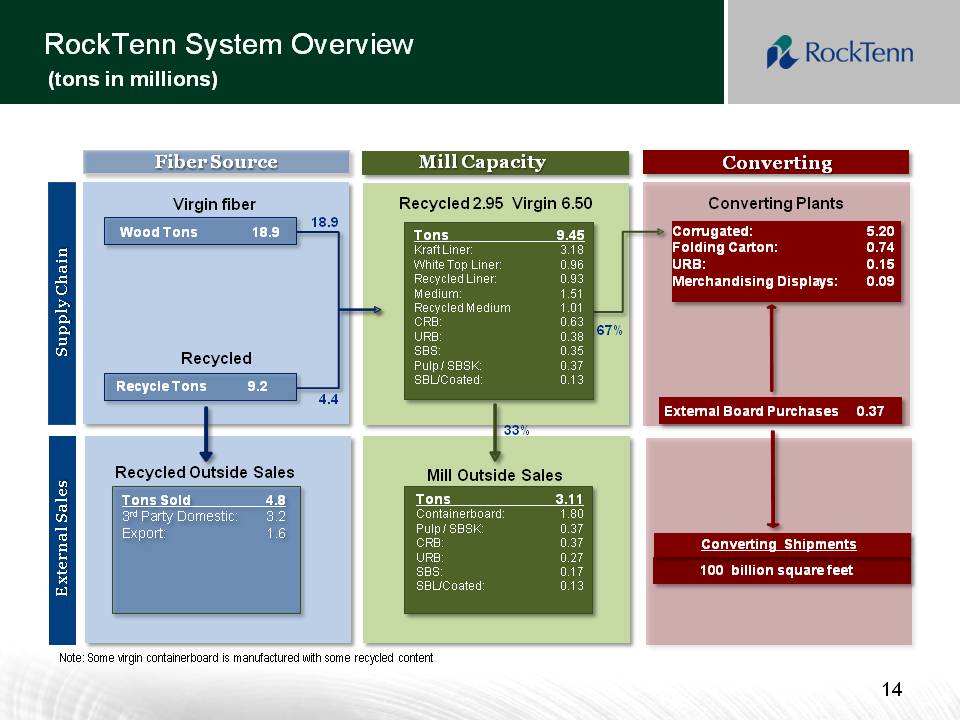
RockTenn System Overview (tons in millions) Mill Capacity Converting Supply Chain External Sales Virgin fiber Recycled Mill Outside Sales Recycled 2.95 Virgin 6.50 Converting Plants Corrugated: 5.20Folding Carton:0.74URB:0.15Merchandising Displays: 0.09 External Board Purchases 0.37 18.9 4.4 Fiber Source Recycle Tons 9.2 Wood Tons 18.9 Tons9.45Kraft Liner: 3.18White Top Liner: 0.96Recycled Liner: 0.93Medium: 1.51Recycled Medium 1.01CRB: 0.63URB: 0.38SBS: 0.35Pulp / SBSK: 0.37SBL/Coated: 0.13 Tons3.11Containerboard:1.80Pulp / SBSK: 0.37CRB: 0.37URB: 0.27 SBS: 0.17SBL/Coated:0.13Tons Sold 4.83rd Party Domestic: 3.2Export: 1.6 Recycled Outside Sales Converting Shipments 100 billion square feet Note: Some virgin containerboard is manufactured with some recycled content 67% 33% Other Placeholder: 14
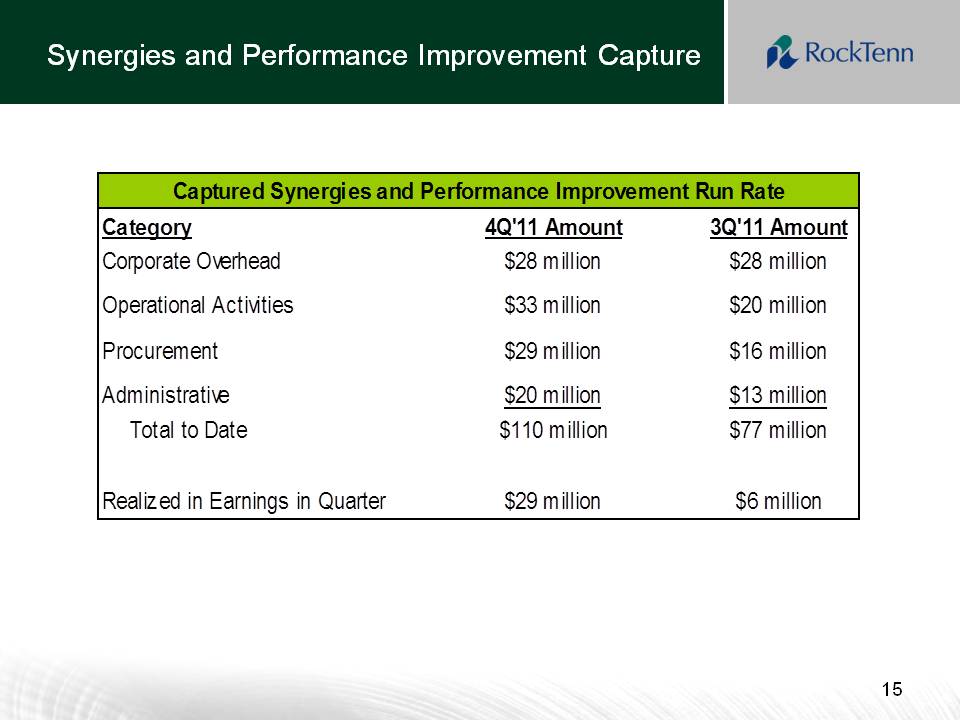
Synergies and Performance Improvement Capture Other Placeholder: 15
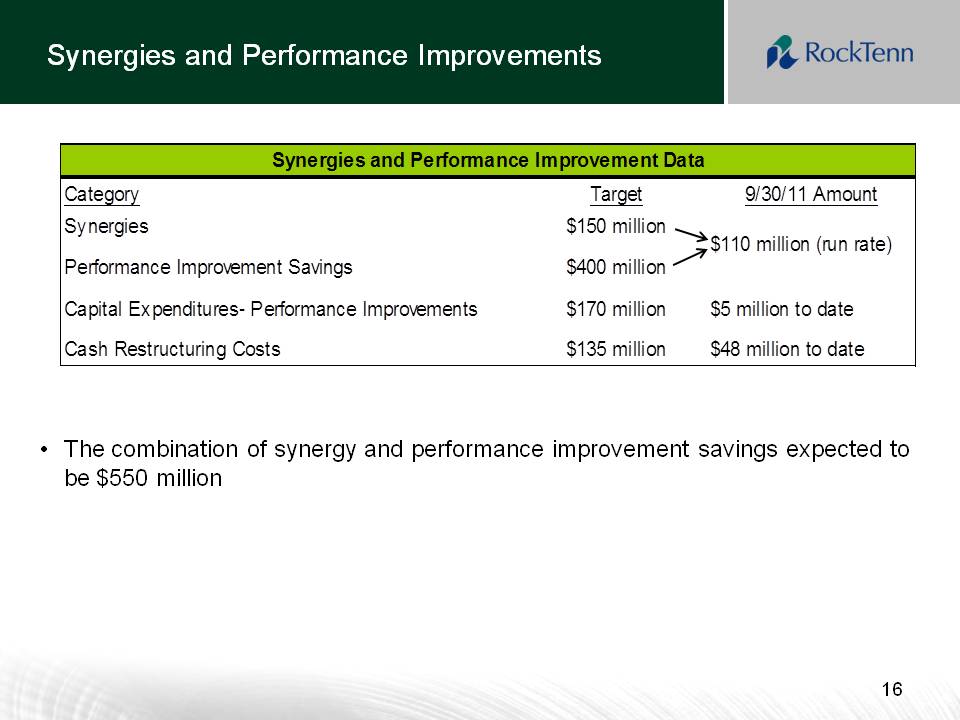
Synergies and Performance Improvements Other Placeholder: 16 The combination of synergy and performance improvement savings expected to be $550 million
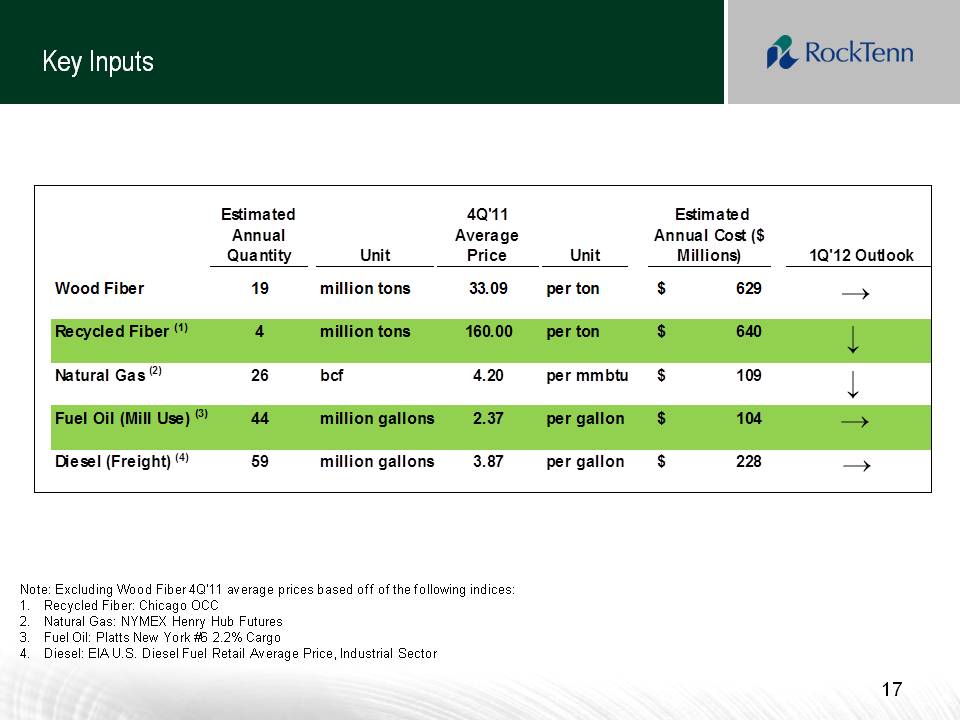
Key Inputs Other Placeholder: 17 Note: Excluding Wood Fiber 4Q’11 average prices based off of the following indices:Recycled Fiber: Chicago OCCNatural Gas: NYMEX Henry Hub FuturesFuel Oil: Platts New York #6 2.2% CargoDiesel: EIA U.S. Diesel Fuel Retail Average Price, Industrial Sector
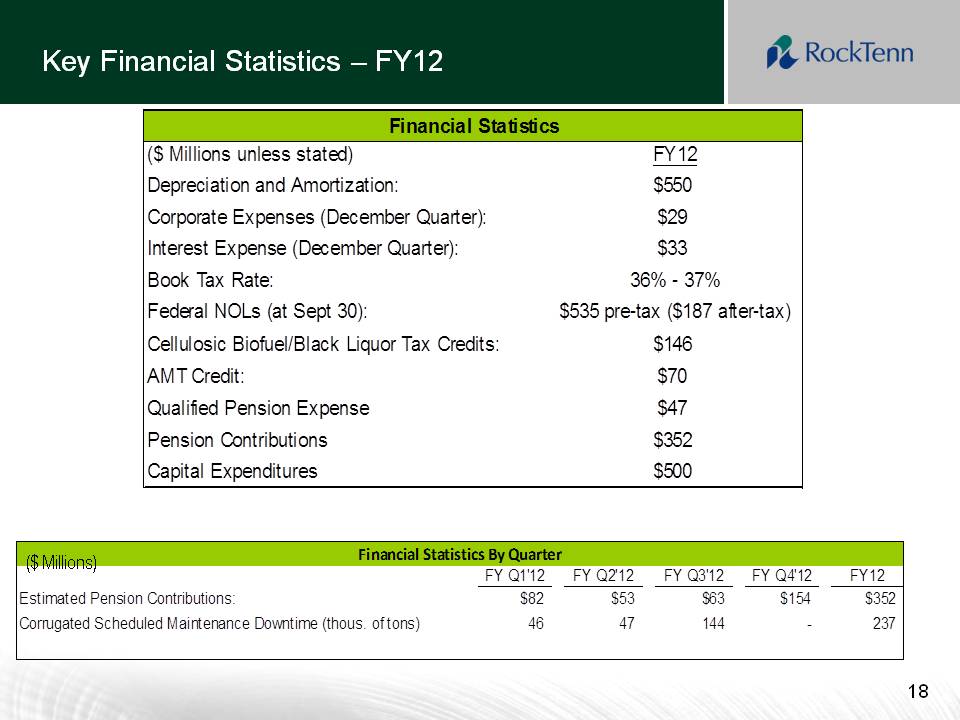
Key Financial Statistics – FY12 Other Placeholder: 18 ($ Millions)
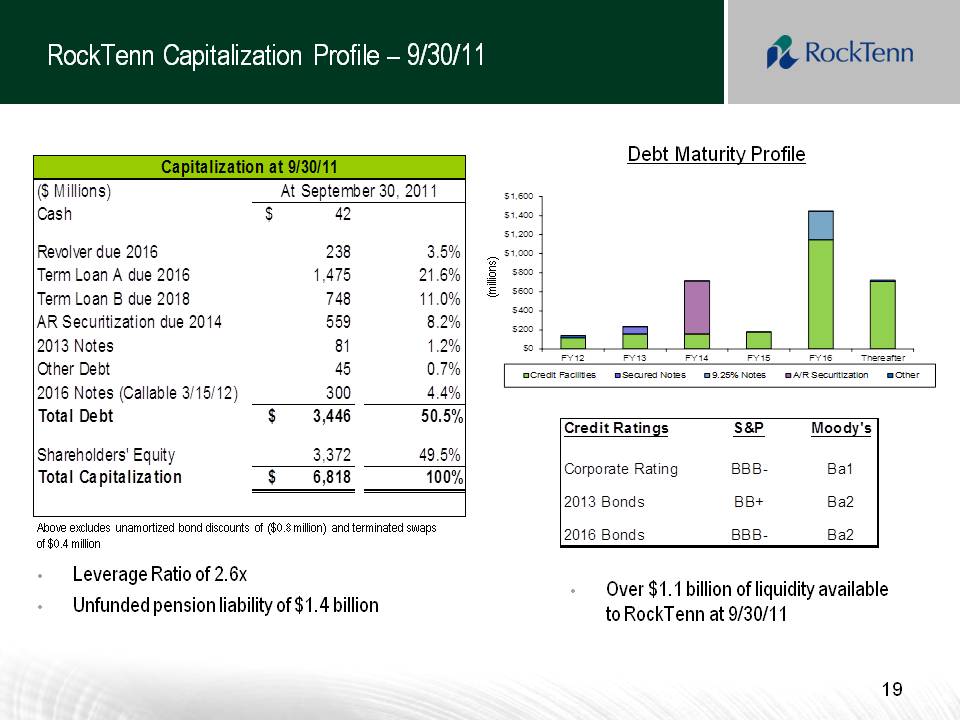
Other Placeholder: 19 RockTenn Capitalization Profile – 9/30/11 Debt Maturity Profile (millions) Over $1.1 billion of liquidity available to RockTenn at 9/30/11 Leverage Ratio of 2.6xUnfunded pension liability of $1.4 billion Above excludes unamortized bond discounts of ($0.8 million) and terminated swaps of $0.4 million

Appendix
Other Placeholder: 22 Use of Non-GAAP Financial Measures and Reconciliations Body: Below, we define the non-GAAP financial measures, provide a reconciliation of each non-GAAP financial measure to the most directly comparable financial measure calculated in accordance with GAAP, and discuss the reasons that we believe this information is useful to management and may be useful to investors. These measures may differ from similarly captioned measures of other companies in our industry.Non-GAAP MeasuresOur definitions of Credit Agreement EBITDA and Segment EBITDA may differ from other similarly titled measures at other companies. Credit Agreement EBITDA (as defined) and Adjusted EBITDA (as defined) are not defined in accordance with GAAP and should not be viewed as alternatives to GAAP measures of operating results or liquidity. RockTenn management believes that net income is the most directly comparable GAAP measure to Credit Agreement EBITDA (as defined) and Segment Income is the most directly comparable GAAP measure to Segment EBITDA.
Non-GAAP Measures: Credit Agreement EBITDA and Total Funded Debt (as defined) Body: “Credit Agreement EBITDA” is calculated in accordance with the definition of “EBITDA” contained in the Company’s Credit Agreement. Credit Agreement EBITDA is generally defined as Consolidated Net Income plus: consolidated interest expense; consolidated tax expenses; depreciation and amortization expenses; various charges and expenses related to, or incurred in connection with, the Smurfit-Stone acquisition; costs and expenses relating to the integration of Smurfit-Stone and the achievement of synergies relating to the Smurfit-Stone acquisition; certain run-rate synergies expected to be achieved due to the Smurfit-Stone acquisition; all non-cash charges; all cash charges and expenses for plant and other facility closures and other cash restructuring charges; labor disruption charges; officer payments associated with any permitted acquisitions; “black liquor” expenses; and cash charges and expenses incurred in respect of the Chapter 11 bankruptcy proceeding and plan of reorganization of Smurfit-Stone; and all non-recurring cash expenses taken in respect of any multi-employer and defined benefit pension plan obligations that are related to plant and other facilities closures. For additional information on the calculation see our Credit Agreement, dated as of May 27, 2011, filed as Exhibit 10.1 to our Form 8-K. “Total Funded Debt” is calculated in accordance with the definition contained in the Company’s Credit Agreement. Total Funded Debt is generally defined as aggregate debt obligations reflected in our balance sheet, less the hedge adjustments resulting from terminated and existing fair value interest rate derivatives or swaps, plus additional outstanding letters of credit not already reflected in debt, plus debt guarantees.
Other Placeholder: 24 Non-GAAP Measures: Credit Agreement EBITDA and Total Funded Debt Body: Our management uses Credit Agreement EBITDA and Total Funded Debt to evaluate compliance with RockTenn’s debt covenants and borrowing capacity available under its Credit Agreement. Management also uses Credit Agreement EBITDA as a measure of our Company’s core operating performance. Management believes that investors also use these measures to evaluate the Company’s compliance with its debt covenants and available borrowing capacity. Management also believes that investors use Credit Agreement EBITDA as a measure of our Company’s core operating performance. Borrowing capacity is dependent upon, in addition to other measures, the “Total Funded Debt/EBITDA ratio” or the “Leverage Ratio,” which is defined as Total Funded Debt divided by Credit Agreement EBITDA.
Other Placeholder: 25 Non-GAAP Measures: Net Debt Body: We have defined the non-GAAP measure Net Debt to include the aggregate debt obligations reflected in our balance sheet, less the hedge adjustments resulting from terminated and existing fair value interest rate derivatives or swaps, the balance of our cash and cash equivalents, restricted cash (which includes the balance sheet line items restricted cash and restricted cash and marketable debt securities) and certain other investments that we consider to be readily available to satisfy such debt obligations. Our management uses Net Debt, along with other factors, to evaluate our financial condition. We believe that Net Debt is an appropriate supplemental measure of financial condition and may be useful to investors because it provides a more complete understanding of our financial condition before the impact of our decisions regarding the appropriate use of cash and liquid investments.
Other Placeholder: 26 Non-GAAP Measures: Adjusted Net Income and Adjusted Earnings Per Diluted Share Body: We also use the non-GAAP measures “adjusted net income” and “adjusted earnings per diluted share”. Management believes these non-GAAP financial measures provide our board of directors, investors, potential investors, securities analysts and others with useful information to evaluate the performance of the Company because it excludes restructuring and other costs, net, the alternative fuel mixture credit and cellulosic biofuel producer credit and other specific items that management believes are not indicative of the ongoing operating results of the business. The Company and the board of directors use this information to evaluate the Company’s performance relative to other periods.
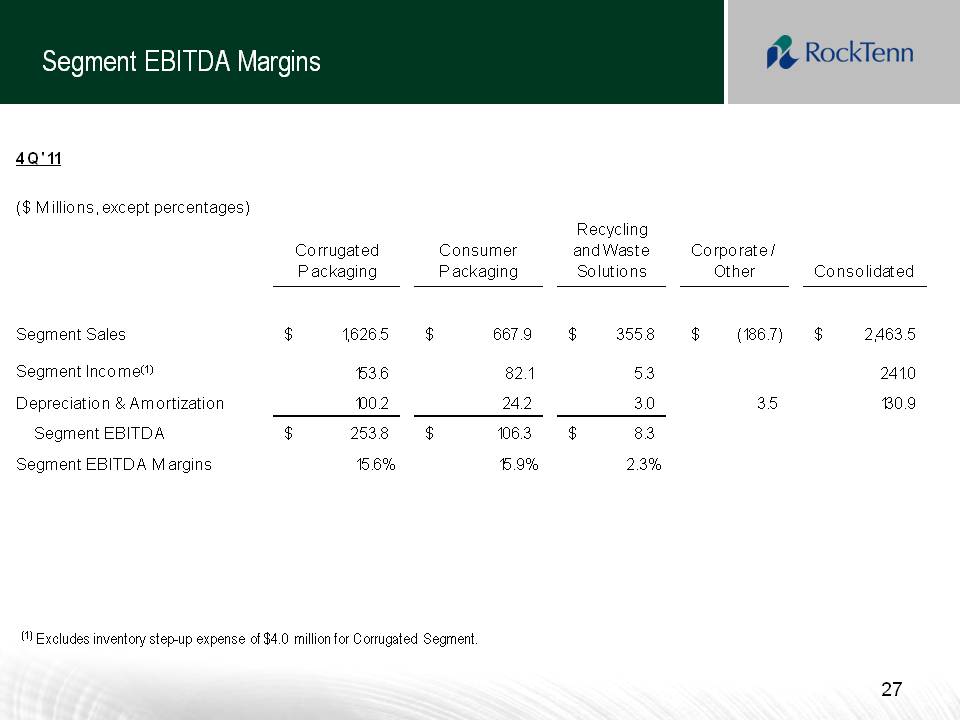
Segment EBITDA Margins Other Placeholder: 27 (1) Excludes inventory step-up expense of $4.0 million for Corrugated Segment.
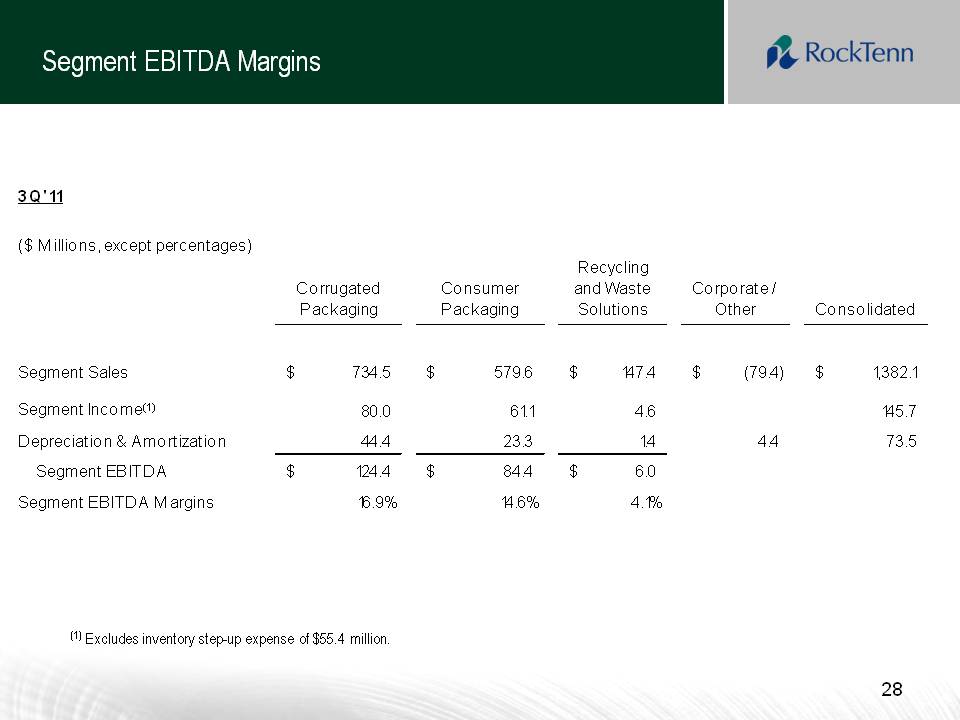
Segment EBITDA Margins Other Placeholder: 28 (1) Excludes inventory step-up expense of $55.4 million.
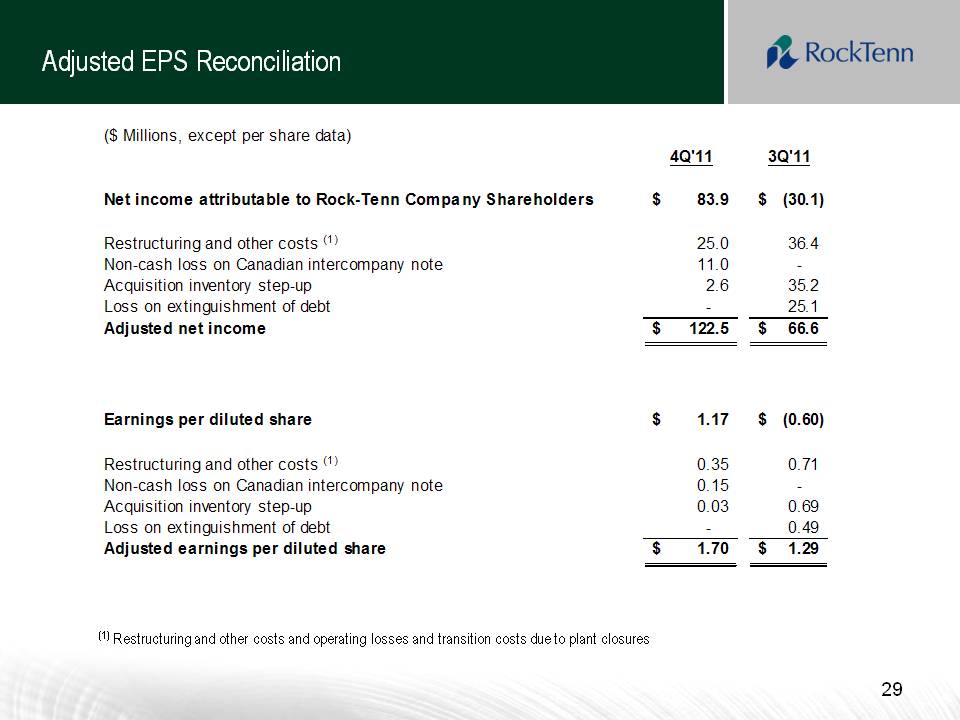
Adjusted EPS Reconciliation Other Placeholder: 29 (1) Restructuring and other costs and operating losses and transition costs due to plant closures
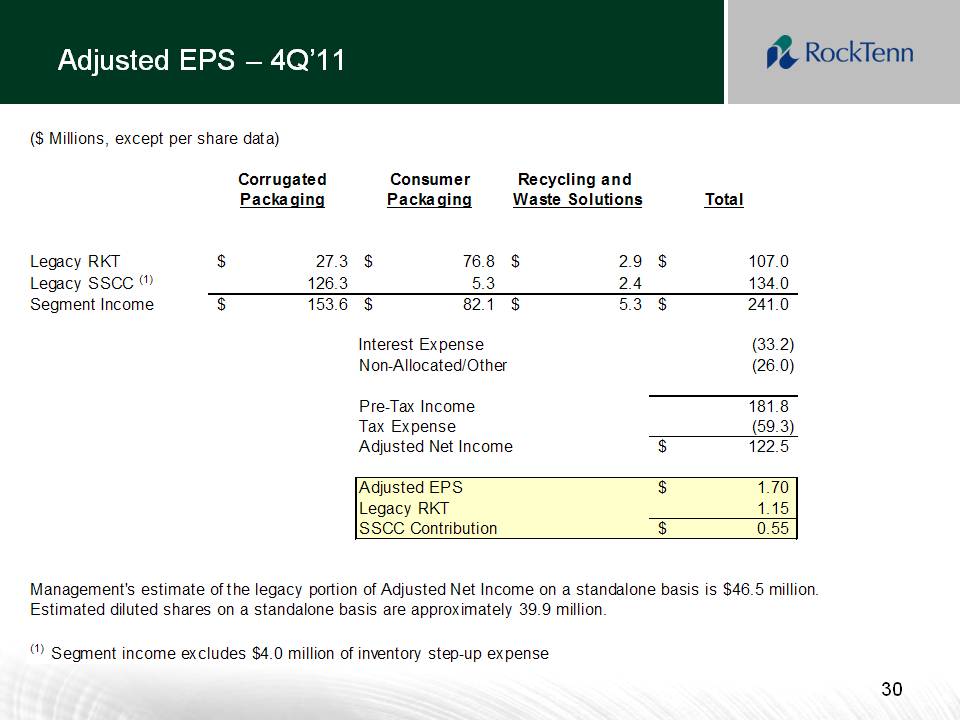
Slide: 30 Adjusted EPS – 4Q’11 Other Placeholder: 30
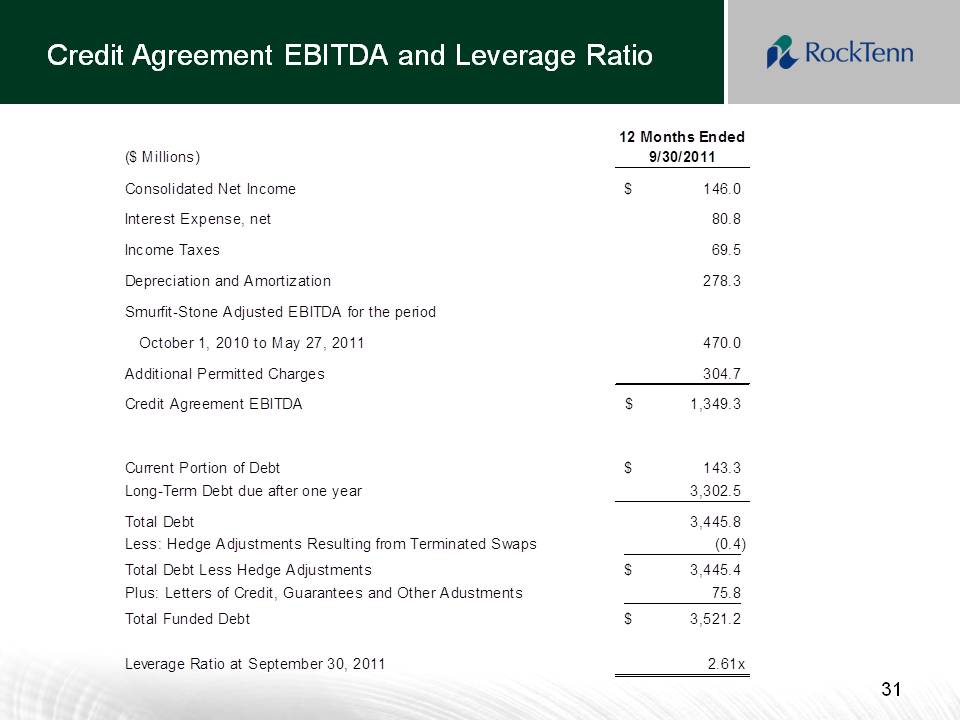
Slide: 31 Credit Agreement EBITDA and Leverage Ratio Other Placeholder: 31
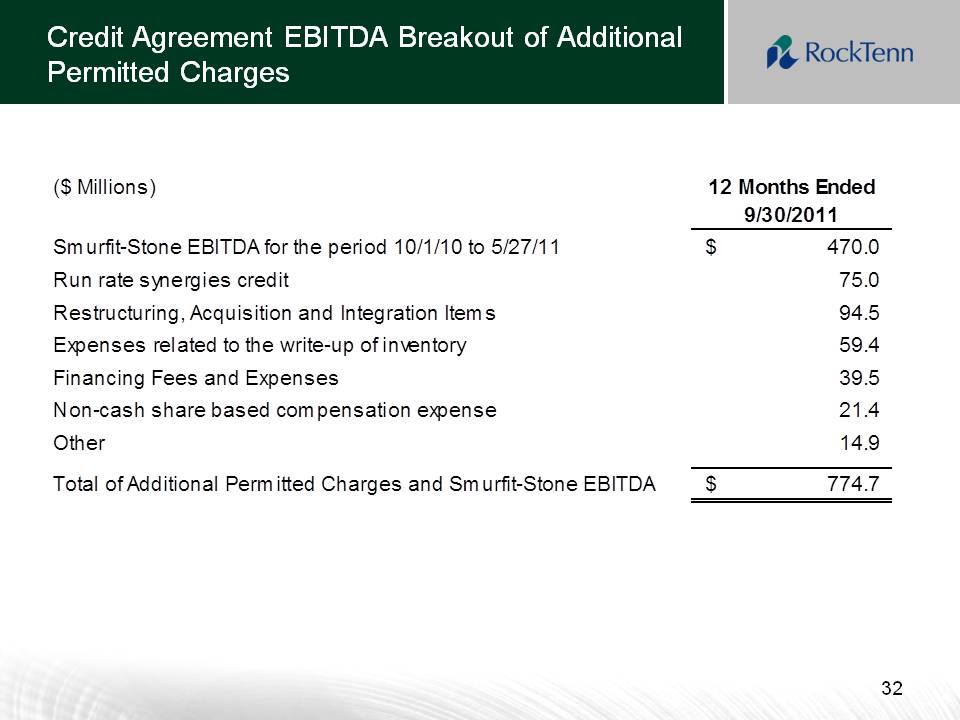
Slide: 32 Credit Agreement EBITDA Breakout of Additional Permitted Charges Other Placeholder: 32
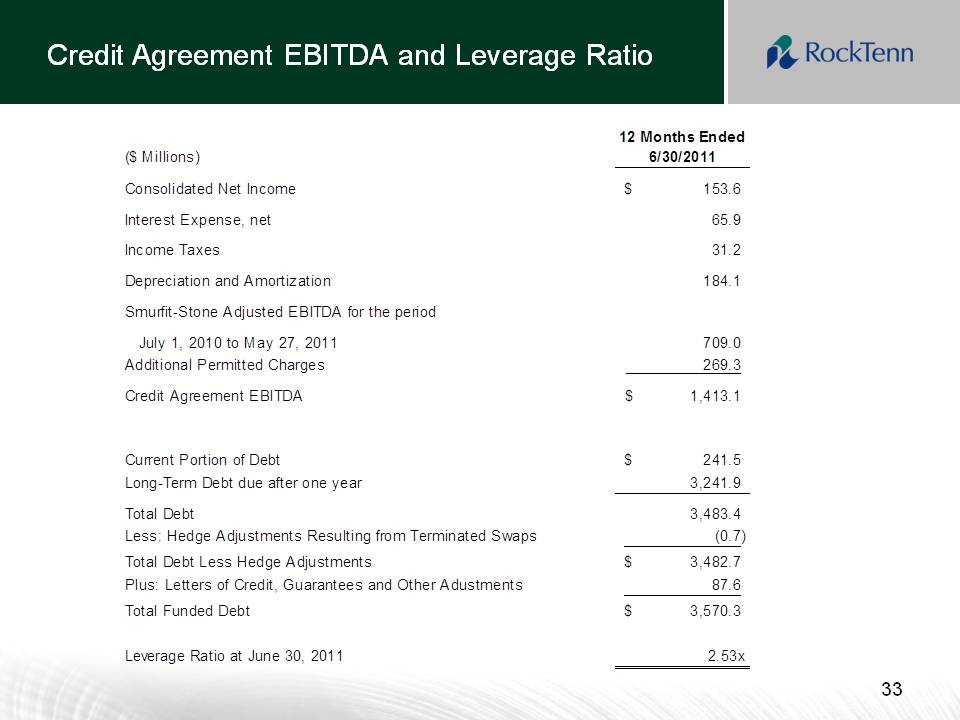
Slide: 33 Credit Agreement EBITDA and Leverage Ratio Other Placeholder: 33
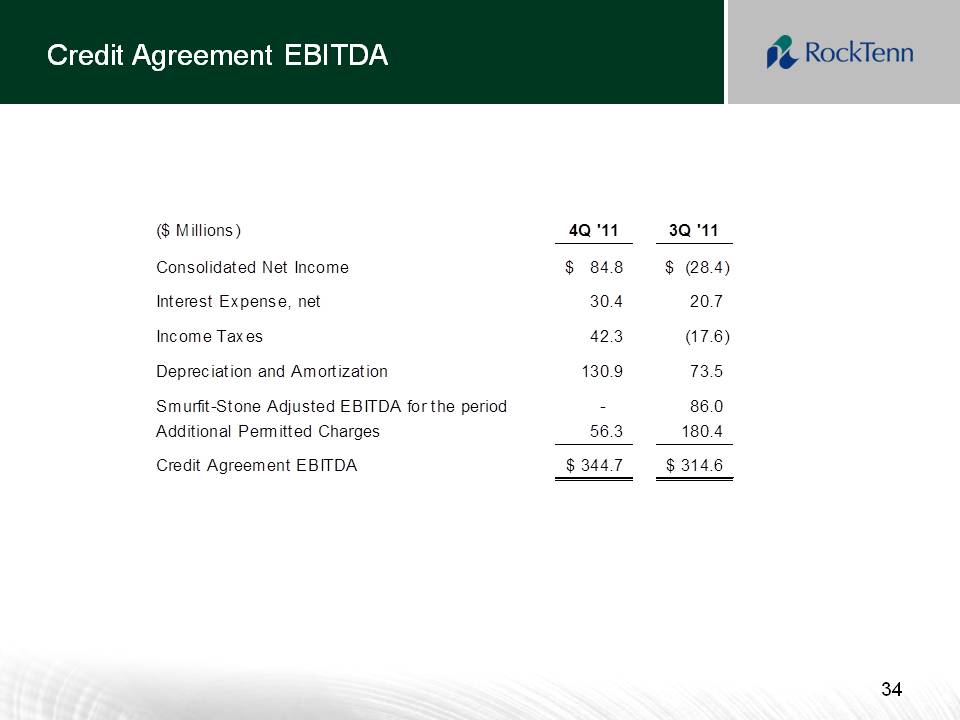
Slide: 34 Credit Agreement EBITDA Other Placeholder: 34
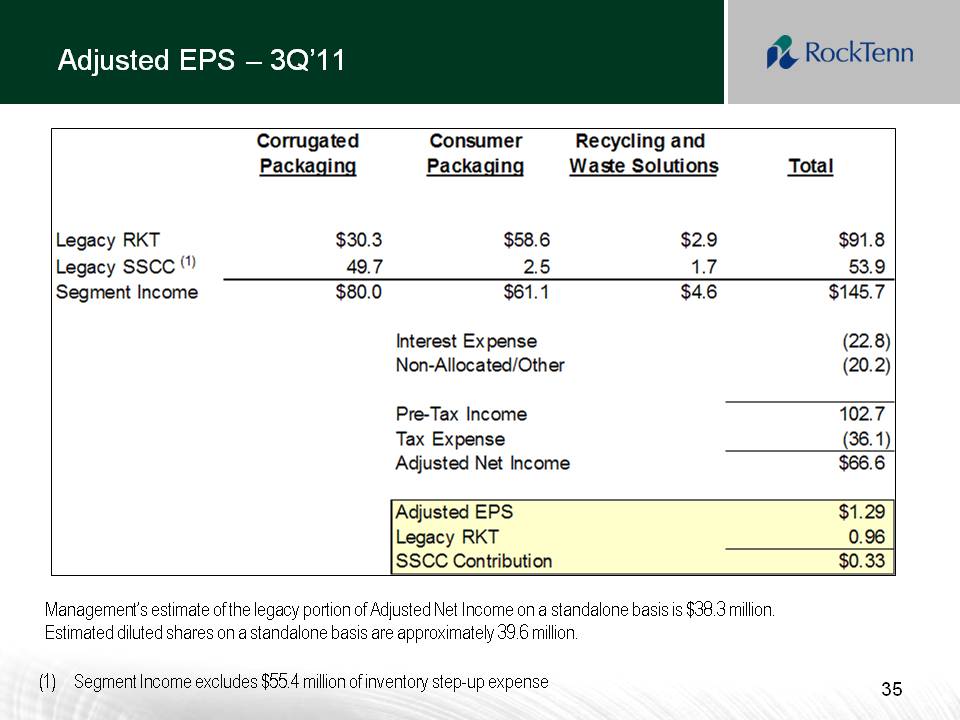
Slide: 35 Adjusted EPS – 3Q’11 Other Placeholder: 35 Segment Income excludes $55.4 million of inventory step-up expense Management’s estimate of the legacy portion of Adjusted Net Income on a standalone basis is $38.3 million. Estimated diluted shares on a standalone basis are approximately 39.6 million.
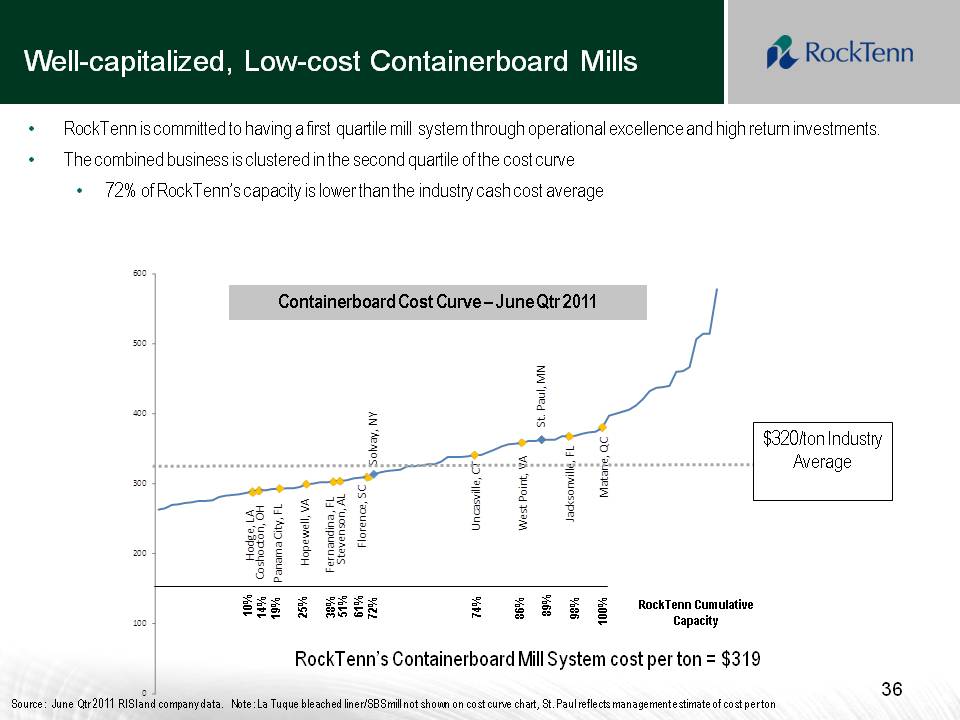
Slide: 36 Other Placeholder: RockTenn is committed to having a first quartile mill system through operational excellence and high return investments.The combined business is clustered in the second quartile of the cost curve72% of RockTenn’s capacity is lower than the industry cash cost average Well-capitalized, Low-cost Containerboard Mills $320/ton Industry Average Source: June Qtr 2011 RISI and company data. Note: La Tuque bleached liner/SBS mill not shown on cost curve chart, St. Paul reflects management estimate of cost per ton Containerboard Cost Curve – June Qtr 2011 RockTenn’s Containerboard Mill System cost per ton = $319 RockTenn Cumulative Capacity 19% 14% 25% 100% 10% 72% 61% 51% 38% 98% 89% 86% 74% Other Placeholder: 36
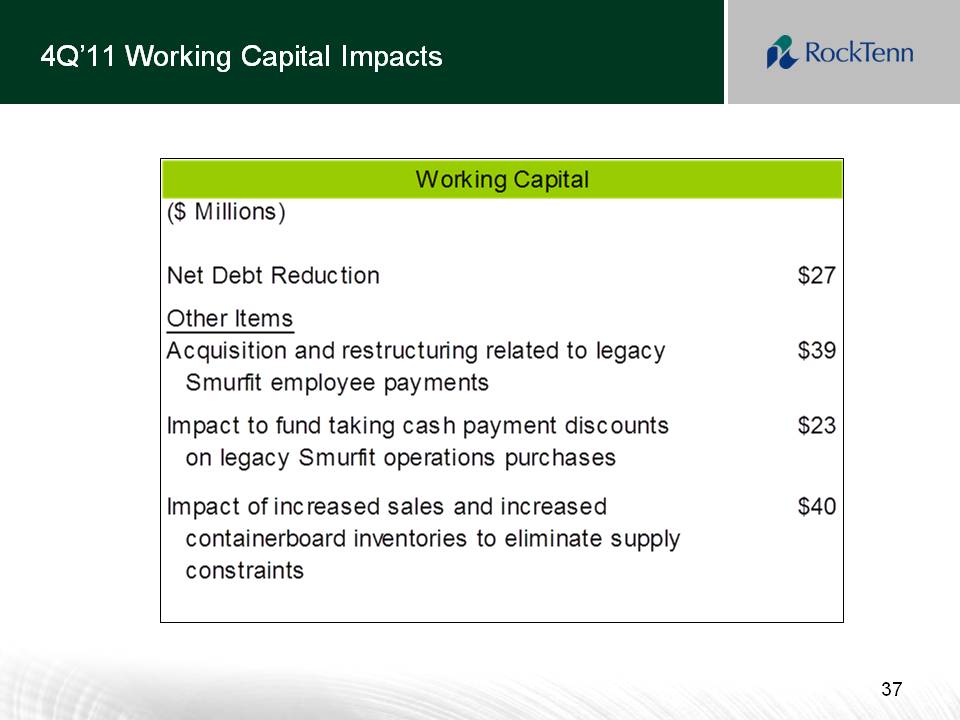
Other Placeholder: 37 4Q’11 Working Capital Impacts
