Attached files
| file | filename |
|---|---|
| 8-K - FORM 8-K - Ameris Bancorp | d254398d8k.htm |
Exhibit 99.1
Sandler O’Neill
East Coast Financial Services Conference November 2011
Cautionary Statements
This presentation contains certain performance measures determined by methods other than in accordance with accounting principles generally accepted in the United States of America (“GAAP”). Management of Ameris Bancorp (the “Company”) uses these non? GAAP measures in its analysis of the Company’s performance. These measures are useful when evaluating the underlying performance and efficiency of the Company’s operations and balance sheet. The Company’s management believes that these non? GAAP measures provide a greater understanding of ongoing operations, enhance comparability of results with prior periods and demonstrate the effects of significant gains and charges in the current period. The Company’s management believes that investors may use these non? GAAP financial measures to evaluate the Company’s financial performance without the impact of unusual items that may obscure trends in the Company’s underlying performance. These disclosures should not be viewed as a substitute for financial measures determined in accordance with GAAP, nor are they necessarily comparable to non? GAAP performance measures that may be presented by other companies. Tangible common equity and Tier 1 capital ratios are non? GAAP measures. The Company calculates the Tier 1 capital using current call report instructions. The Company’s management uses these measures to assess the quality of capital and believes that investors may find them useful in their evaluation of the Company. These capital measures may, or may not be necessarily comparable to similar capital measures that may be presented by other companies.
This presentation may contain statements that constitute “forward? looking statements” within the meaning of Section 27A of the Securities Act of 1933, as amended, and Section 21E of the Securities Exchange Act of 1934, as amended. The words “believe”, “estimate”, “expect”, “intend”, “anticipate” and similar expressions and variations thereof identify certain of such forward? looking statements, which speak only as of the dates which they were made. The Company undertakes no obligation to publicly update or revise any forward? looking statements, whether as a result of new information, future events or otherwise. Readers are cautioned that any such forward? looking statements are not guarantees of future performance and involve risks and uncertainties and that actual results may differ materially from those indicated in the forward? looking statements as a result of various factors. Readers are cautioned not to place undue reliance on these forward? looking statements and are referred to the Company’s periodic filings with the Securities and Exchange Commission for a summary of certain factors that may impact the Company’s results of operations and financial condition. 2
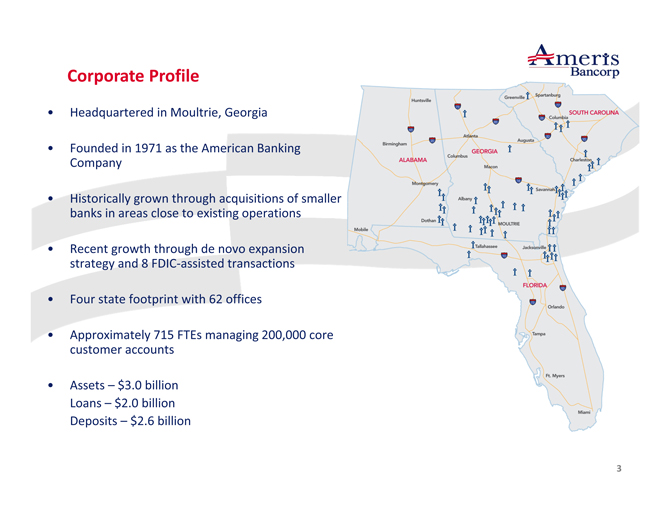
Corporate Profile
• Headquartered in Moultrie, Georgia
• Founded in 1971 as the American Banking Company
• Historically grown through acquisitions of smaller banks in areas close to existing operations
• Recent growth through de novo expansion strategy and 8 FDIC? assisted transactions
• Four state footprint with 62 offices
• Approximately 715 FTEs managing 200,000 core customer accounts
• Assets – $3.0 billion Loans – $2.0 billion Deposits – $2.6 billion 3
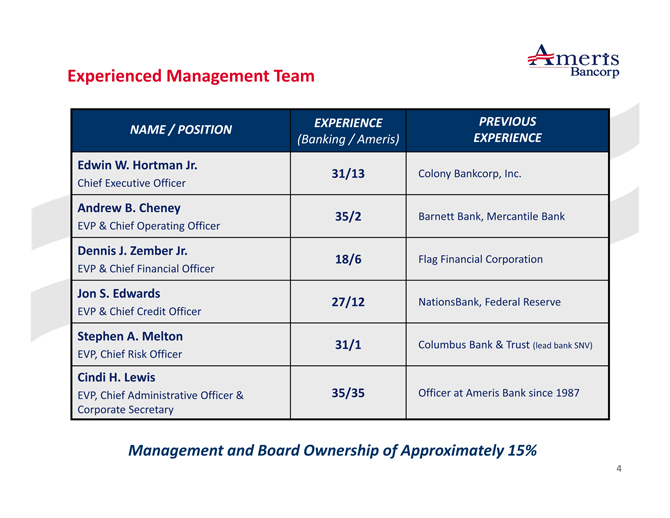
Experienced Management Team
EXPERIENCE PREVIOUS NAME / POSITION
(Banking / Ameris) EXPERIENCE
Edwin W. Hortman Jr.
31/13 Colony Bankcorp, Inc. Chief Executive Officer
Andrew B. Cheney
35/2 Barnett Bank, Mercantile Bank EVP & Chief Operating Officer
Dennis J. Zember Jr.
18/6 Flag Financial Corporation EVP & Chief Financial Officer
Jon S. Edwards
27/12 NationsBank, Federal Reserve EVP & Chief Credit Officer
Stephen A. Melton
31/1 Columbus Bank & Trust (lead bank SNV) EVP, Chief Risk Officer
Cindi H. Lewis
EVP, Chief Administrative Officer & 35/35 Officer at Ameris Bank since 1987 Corporate Secretary
Management and Board Ownership of Approximately 15% 4
Current Focus
Position Ameris Bank as a Consolidator in our 4 Southeastern States
? FDIC Assisted acquisitions – Slowing pipeline of opportunities but our markets still have majority of potential deals. Interest in both Strategic (builds market share) and Financial (builds excess TCE and T1 capital)
? Traditional M&A – Rapidly growing pipeline of opportunities in our footprint on larger, thinly capitalized institutions
Accelerate transition out of this cycle to above average ROA and ROE
? Build momentum on growing earning assets and additional revenue opportunities
? Build unique non? interest lines of businesses to drive non? interest income over 1.00% of total assets by 2013
? Gain operating leverage from continued consolidation. Significantly reduce non? provision credit related costs such that PTPP earnings drive higher EPS
Continue Improving Credit Quality
? Continue 4 quarter trend on declining levels of NPAs
• 2011 pace of “in? migration” only 1/3rd of 2010 pace •NPLs down 40% from their peak
? Aggressively value and dispose of OREO to drive decreases in NPAs 5
Loan Portfolio Detail
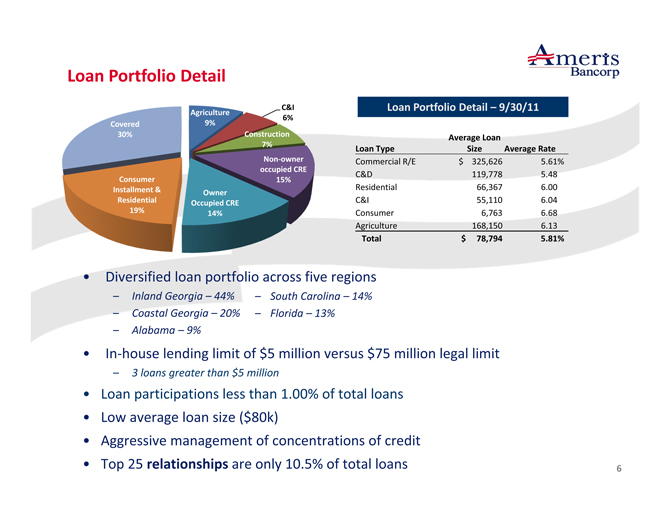
Loan Portfolio Detail – 9/30/11
Average Loan
Loan Type Size Average Rate
Commercial R/E $ 325,626 5.61% C&D 119,778 5.48 Residential 66,367 6.00 C&I 55,110 6.04 Consumer 6,763 6.68 Agriculture 168,150 6.13
Total $ 78,794 5.81%
• Diversified loan portfolio across five regions
– Inland Georgia – 44% – South Carolina – 14%
– Coastal Georgia – 20% – Florida – 13%
– Alabama – 9%
• In? house lending limit of $5 million versus $75 million legal limit
– 3 loans greater than $5 million
• Loan participations less than 1.00% of total loans
• Low average loan size ($80k)
• Aggressive management of concentrations of credit
• Top 25 relationships are only 10.5% of total loans 6
C&D and CRE Detail (in millions)
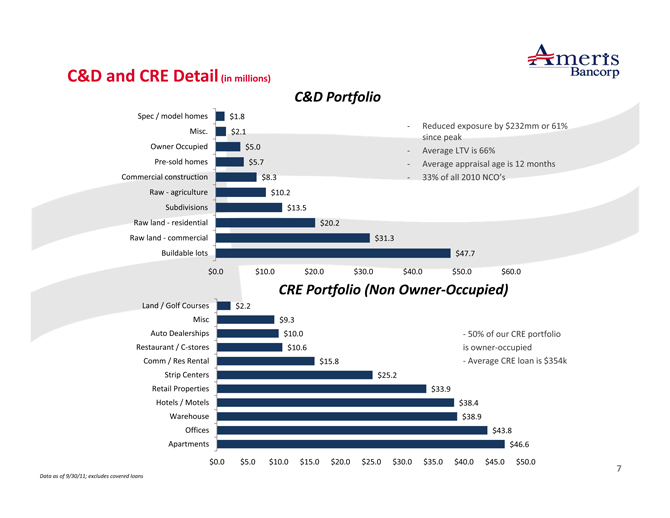
C&D Portfolio
Spec / model homes $1.8
? Reduced exposure by $232mm or 61% Misc. $2.1 since peak Owner Occupied $5.0
? Average LTV is 66%
Pre? sold homes $5.7 ? Average appraisal age is 12 months Commercial construction $8.3 ? 33% of all 2010 NCO’s Raw agriculture ? $10.2 Subdivisions $13.5 Raw land residential ? $20.2 Raw land commercial ? $31.3 Buildable lots $47.7
$0.0 $10.0 $20.0 $30.0 $40.0 $50.0 $60.0
CRE Portfolio (Non Owner? Occupied)
Land / Golf Courses $2.2
Misc $9.3
Auto Dealerships $10.0 ?50% of our CRE portfolio
Restaurant / C? stores $10.6 is owner? occupied
Comm / Res Rental $15.8 ?Average CRE loan is $354k
Strip Centers $25.2
Retail Properties $33.9
Hotels / Motels $38.4
Warehouse $38.9
Offices $43.8
Apartments $46.6
$0.0 $5.0 $10.0 $15.0 $20.0 $25.0 $30.0 $35.0 $40.0 $45.0 $50.0
Data as of 9/30/11; excludes covered loans 7
Credit Quality
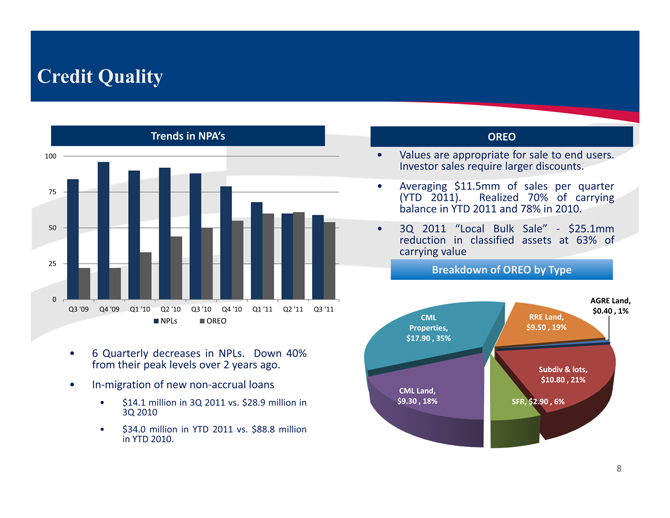
Trends in NPA’s
100 75 50 25
0
Q3 ‘09 Q4 ‘09 Q1 ‘10 Q2 ‘10 Q3 ‘10 Q4 ‘10 Q1 ‘11 Q2 ‘11 Q3 ‘11 NPLs OREO
OREO
• Values are appropriate for sale to end users. Investor sales require larger discounts.
• Averaging $11.5mm of sales per quarter (YTD 2011). Realized 70% of carrying balance in YTD 2011 and 78% in 2010.
• 3Q 2011 “Local Bulk Sale” ?$25.1mm reduction in classified assets at 63% of carrying value
Breakdown of OREO by Type
| • |
|
6 Quarterly decreases in NPLs. Down 40% from their peak levels over 2 years ago. |
• In? migration of new non? accrual loans
• $14.1 million in 3Q 2011 vs. $28.9 million in
3Q 2010
• $34.0 million in YTD 2011 vs. $88.8 million in YTD 2010.
AGRE Land, $0.40 , 1%
CML RRE Land, Properties, $9.50 , 19%
$17.90 , 35%
Subdiv & lots,
$10.80 , 21% CML Land,
$9.30 , 18% SFR, $2.90 , 6% 8
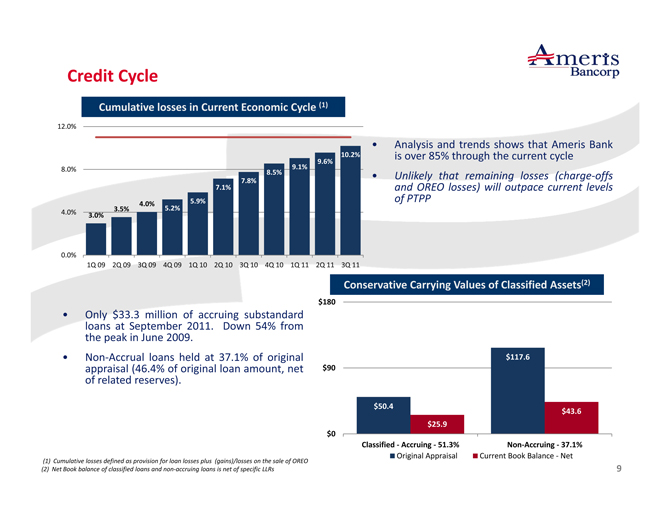
Credit Cycle
Cumulative losses in Current Economic Cycle (1)
12.0%
10.2%
9.1% 9.6%
8.0%
8.5%
7.8%
7.1%
4.0% 5.9%
3.5% 5.2%
4.0%
3.0%
0.0%
1Q 09 2Q 09 3Q 09 4Q 09 1Q 10 2Q 10 3Q 10 4Q 10 1Q 11 2Q 11 3Q 11
• Analysis and trends shows that Ameris Bank is over 85% through the current cycle
• Unlikely that remaining losses (charge? offs and OREO losses) will outpace current levels of PTPP
Conservative Carrying Values of Classified Assets(2)
$180
$117.6 $90
$50.4
$43.6
$25.9 $0
Classified Accruing ? 51 ?.3% Non? Accruing 37 ?.1%
Original Appraisal Current Book Balance Net ?
• Only $33.3 million of accruing substandard loans at September 2011. Down 54% from the peak in June 2009.
• Non? Accrual loans held at 37.1% of original appraisal (46.4% of original loan amount, net of related reserves).
(1) Cumulative losses defined as provision for loan losses plus (gains)/losses on the sale of OREO (2) Net Book balance of classified loans and non? accruing loans is net of specific LLRs 9
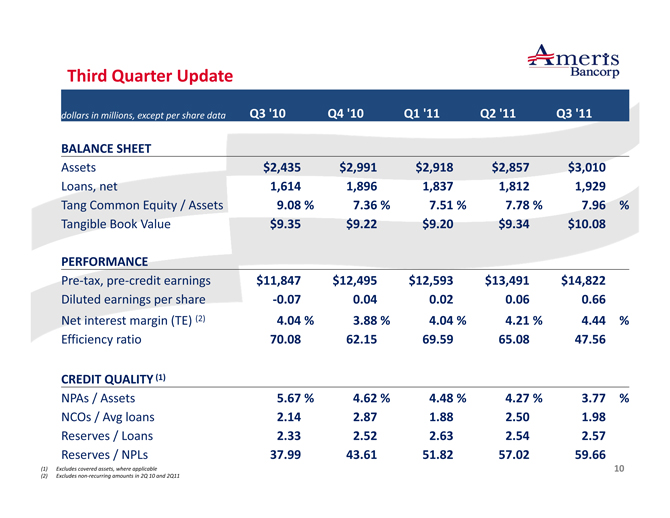
Third Quarter Update
dollars in millions, except per share data Q3 ‘10 Q4 ‘10 Q1 ‘11 Q2 ‘11 Q3 ‘11
BALANCE SHEET
Assets $2,435 $2,991 $2,918 $2,857 $3,010 Loans, net 1,614 1,896 1,837 1,812 1,929 Tang Common Equity / Assets 9.08 % 7.36 % 7.51 % 7.78 % 7.96 % Tangible Book Value $9.35 $9.22 $9.20 $9.34 $10.08
PERFORMANCE
Pre? tax, pre? credit earnings $11,847 $12,495 $12,593 $13,491 $14,822
Diluted earnings per share ? 0.07 0.04 0.02 0.06 0.66
Net interest margin (TE) (2) 4.04 % 3.88 % 4.04 % 4.21 % 4.44 % Efficiency ratio 70.08 62.15 69.59 65.08 47.56
CREDIT QUALITY (1)
NPAs / Assets 5.67 % 4.62 % 4.48 % 4.27 % 3.77 % NCOs / Avg loans 2.14 2.87 1.88 2.50 1.98 Reserves / Loans 2.33 2.52 2.63 2.54 2.57 Reserves / NPLs 37.99 43.61 51.82 57.02 59.66
| (1) |
|
Excludes covered assets, where applicable |
| (2) |
|
Excludes non? recurring amounts in 2Q 10 and 2Q11 10 |
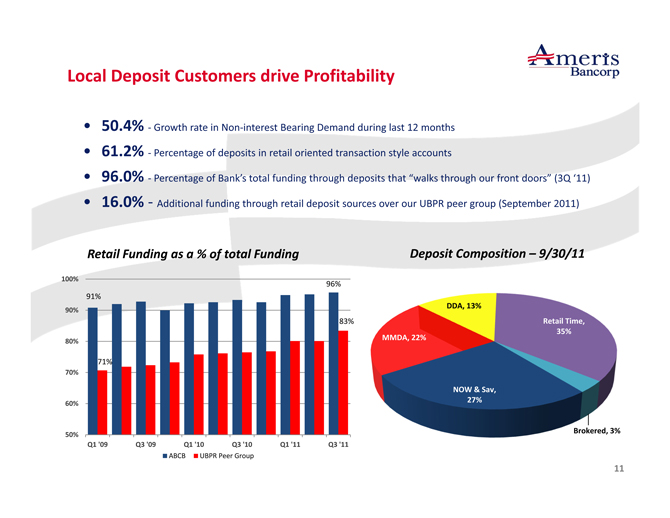
Local Deposit Customers drive Profitability
• 50.4% ?Growth rate in Non? interest Bearing Demand during last 12 months
• 61.2% ?Percentage of deposits in retail oriented transaction style accounts
• 96.0% ?Percentage of Bank’s total funding through deposits that “walks through our front doors” (3Q ‘11)
• 16.0% ?Additional funding through retail deposit sources over our UBPR peer group (September 2011)
Retail Funding as a % of total Funding
100%
96% 91%
90%
83%
80%
71%
70%
60%
50%
Q1 ‘09 Q3 ‘09 Q1 ‘10 Q3 ‘10 Q1 ‘11 Q3 ‘11
ABCB UBPR Peer Group
Deposit Composition – 9/30/11
DDA, 13%
Retail Time, MMDA, 22% 35%
NOW & Sav, 27%
Brokered, 3% 11
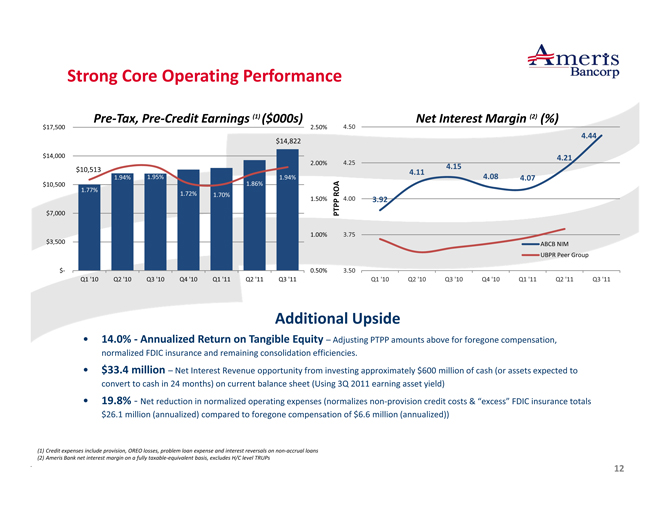
Strong Core Operating Performance
Pre? Tax, Pre? Credit Earnings (1) ($000s)
$17,500 2.50%
$14,822
$14,000
2.00% $10,513
1.94% 1.95% 1.94% $10,500 1.86%
1.77%
1.72% 1.70% 1.50% $7,000
1.00% $3,500
$? 0.50% Q1 ‘10 Q2 ‘10 Q3 ‘10 Q4 ‘10 Q1 ‘11 Q2 ‘11 Q3 ‘11
Net Interest Margin (2) (%)
4.50
4.44
4.21
4.25
4.15
4.11
4.08 4.07 ROA
4.00 3.92
PTPP
3.75
ABCB NIM UBPR Peer Group
3.50
Q1 ‘10 Q2 ‘10 Q3 ‘10 Q4 ‘10 Q1 ‘11 Q2 ‘11 Q3 ‘11
Additional Upside
• 14.0% Annualized ? Return on Tangible Equity – Adjusting PTPP amounts above for foregone compensation, normalized FDIC insurance and remaining consolidation efficiencies.
• $33.4 million – Net Interest Revenue opportunity from investing approximately $600 million of cash (or assets expected to convert to cash in 24 months) on current balance sheet (Using 3Q 2011 earning asset yield)
• 19.8% ?Net reduction in normalized operating expenses (normalizes non? provision credit costs & “excess” FDIC insurance totals $26.1 million (annualized) compared to foregone compensation of $6.6 million (annualized))
(1) Credit expenses include provision, OREO losses, problem loan expense and interest reversals on non? accrual loans (2) Ameris Bank net interest margin on a fully taxable? equivalent basis, excludes H/C level TRUPs . 12
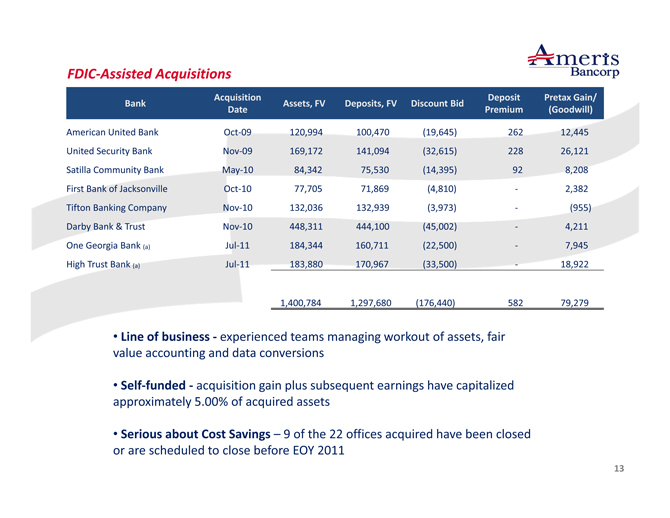
FDIC? Assisted Acquisitions
Acquisition Deposit Pretax Gain/ Bank Assets, FV Deposits, FV Discount Bid Date Premium (Goodwill)
American United Bank Oct? 09 120,994 100,470 (19,645) 262 12,445 United Security Bank Nov? 09 169,172 141,094 (32,615) 228 26,121 Satilla Community Bank May? 10 84,342 75,530 (14,395) 92 8,208 First Bank of Jacksonville Oct? 10 77,705 71,869 (4,810) ? 2,382 Tifton Banking Company Nov? 10 132,036 132,939 (3,973) ? (955) Darby Bank & Trust Nov? 10 448,311 444,100 (45,002) ? 4,211 One Georgia Bank (a) Jul? 11 184,344 160,711 (22,500) ? 7,945 High Trust Bank (a) Jul? 11 183,880 170,967 (33,500) ? 18,922
1,400,784 1,297,680 (176,440) 582 79,279
• Line of business experienced ? teams managing workout of assets, fair value accounting and data conversions
• Self? funded acquisition ? gain plus subsequent earnings have capitalized approximately 5.00% of acquired assets
• Serious about Cost Savings – 9 of the 22 offices acquired have been closed or are scheduled to close before EOY 2011 13
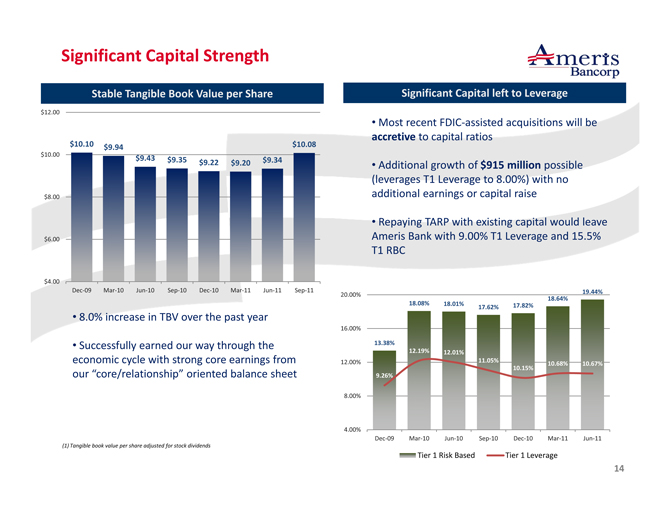
Significant Capital Strength
Stable Tangible Book Value per Share
$12.00
$10.10 $10.08
$9.94
$10.00
$9.43 $9.35 $9.34
$9.22 $9.20
$8.00
$6.00
$4.00
Dec? 09 Mar? 10 Jun? 10 Sep? 10 Dec? 10 Mar? 11 Jun? 11 Sep? 11
Significant Capital left to Leverage
• Most recent FDIC? assisted acquisitions will be accretive to capital ratios
• Additional growth of $915 million possible (leverages T1 Leverage to 8.00%) with no additional earnings or capital raise
• Repaying TARP with existing capital would leave Ameris Bank with 9.00% T1 Leverage and 15.5% T1 RBC
• 8.0% increase in TBV over the past year
• Successfully earned our way through the economic cycle with strong core earnings from our “core/relationship” oriented balance sheet
19.44%
20.00%
18.08% 18.01% 18.64%
17.62% 17.82%
16.00%
13.38%
12.19% 12.01%
12.00% 11.05%
10.68% 10.67%
10.15% 9.26%
8.00%
4.00%
Dec? 09 Mar? 10 Jun? 10 Sep? 10 Dec? 10 Mar? 11 Jun? 11
Tier 1 Risk Based Tier 1 Leverage
| (1) |
|
Tangible book value per share adjusted for stock dividends 14 |
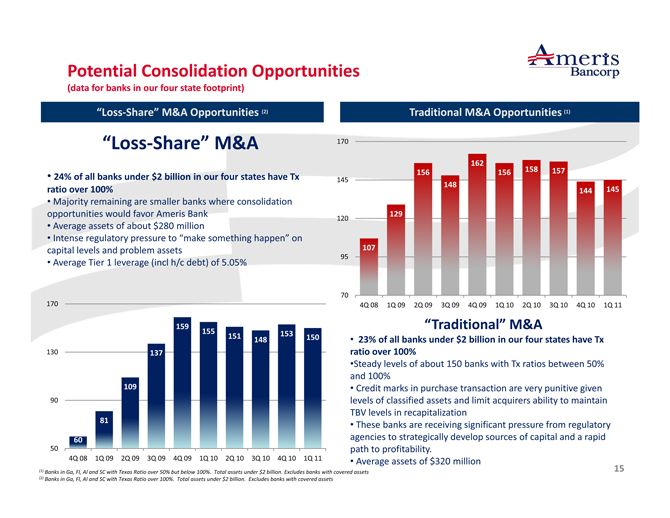
Potential Consolidation Opportunities
(data for banks in our four state footprint)
“Loss? Share” M&A Opportunities (2)
“Loss? Share” M&A
• 24% of all banks under $2 billion in our four states have Tx ratio over 100%
• Majority remaining are smaller banks where consolidation opportunities would favor Ameris Bank
• Average assets of about $280 million
• Intense regulatory pressure to “make something happen” on capital levels and problem assets
• Average Tier 1 leverage (incl h/c debt) of 5.05%
170
159
155 153 151 150 148
130 137
109
90
81
60
50
4Q 08 1Q 09 2Q 09 3Q 09 4Q 09 1Q 10 2Q 10 3Q 10 4Q 10 1Q 11
Traditional M&A Opportunities (1)
170
162 158 156 156 157
145
148
144 145
129
120
107
95
70
4Q 08 1Q 09 2Q 09 3Q 09 4Q 09 1Q 10 2Q 10 3Q 10 4Q 10 1Q 11
“Traditional” M&A
• 23% of all banks under $2 billion in our four states have Tx ratio over 100%
•Steady levels of about 150 banks with Tx ratios between 50% and 100%
• Credit marks in purchase transaction are very punitive given levels of classified assets and limit acquirers ability to maintain TBV levels in recapitalization
• These banks are receiving significant pressure from regulatory agencies to strategically develop sources of capital and a rapid path to profitability.
• Average assets of $320 million
(1) Banks in Ga, Fl, Al and SC with Texas Ratio over 50% but below 100%. Total assets under $2 billion. Excludes banks with covered assets (2) Banks in Ga, Fl, Al and SC with Texas Ratio over 100%. Total assets under $2 billion. Excludes banks with covered assets 15
Sandler O’Neill
East Coast Financial Services Conference November 2011