Attached files
| file | filename |
|---|---|
| 8-K - FORM 8-K - General Motors Co | d253679d8k.htm |
| EX-99.1 - NEWS RELEASE - General Motors Co | d253679dex991.htm |
 General Motors Company
Q3 2011 Results
November 9, 2011
Exhibit 99.2
*******
*******
*******
*******
*******
*******
*******
*******
*******
*******
*******
*******
*******
*******
*******
*******
*******
*******
*******
*******
******* |
 Forward Looking Statements
In this presentation and in related comments by our management, our use of
the words “expect,”
“anticipate,”
“possible,”
“potential,”
“target,”
“believe,”
“commit,”
“intend,”
“continue,”
“may,”
“would,”
“could,”
“should,”
“project,”
“projected,”
“positioned”
or similar expressions is intended to identify forward
looking statements that represent our current judgment about possible future
events. We believe these judgments are reasonable, but these statements
are not guarantees of any events or financial results, and our actual
results may differ materially due to a variety of important factors. Among
other items, such factors might include:
our ability to realize production efficiencies and
to achieve reductions in costs as a result of our restructuring initiatives and
labor modifications; our ability to maintain quality control over our
vehicles and
avoid
material
vehicle
recalls;
our
suppliers’
ability
to
deliver
parts,
systems and components at such times to allow us to meet production
schedules; our ability to maintain adequate liquidity and financing sources
and an appropriate level of debt, including as required to fund our planned
significant
investment
in
new
technology;
our
ability
to
realize
successful
vehicle applications of new technology; and our ability to continue to attract
new customers, particularly for our new products.
GM's most recent annual report on Form 10-K and quarterly reports on Form
10-Q provide information about these and other factors, which we may
revise or supplement in future reports to the SEC.
1 |
 Third
Quarter 2011 Highlights 2
Q3 ‘11
F/(U) vs.
Q3 ‘10
Global Deliveries
2.2M
Net Revenue
$36.7B
EBIT -
Adj.
$2.2B
-
GMNA
$2.2B
-
GME
$(0.3)B
-
GMIO
$0.4B
-
GMSA
$0.0B
Auto Free Cash Flow
$0.3B |
 Third
Quarter Highlights •
Reached labor agreement with UAW
–
Maintains GM’s low break-even level
–
Gives employees a direct stake in company’s performance
–
Protects GM’s balance sheet
•
Corporate credit rating upgrades
•
GM and SAIC agreement for the co-development of new
electric vehicle architecture
•
Agreement with LG to jointly design & engineer future
electric vehicles
•
Important product announcements –
Cadillac ELR,
Chevy Colorado midsize pickup, Chevy Spark minicar,
Spark EV (all electric), Chevy Trailblazer midsize SUV
3 |
 Q3
2010
Q3
2011
GAAP
Net Revenue ($B)
34.1
36.7
Operating Income ($B)
1.7
1.8
Net Income to Common Stockholders ($B)
2.0
1.7
EPS –
Diluted ($/Share)
1.20
1.03
Non-
GAAP
EBIT-
Adj. ($B)
2.3
2.2
Automotive Free Cash Flow ($B)
1.4
0.3
Summary of Q3 2011 Results
4
Note: Starting Q4 2010, EBIT-Adj. includes GM Financial on an Earnings Before
Tax (EBT) basis |
 Net
Income Impact of Special Items 5
Q3
2010
Q3
2011
Net Income to Common Stockholders ($B)
2.0
1.7
EPS –
Diluted ($/Share)
1.20
1.03
Special Items Included ($B):
None
-
-
Total Impact of Special Items:
Net Income to Common Stockholders ($B)
-
-
EPS –
Diluted ($/Share)
-
- |
 Q3
Operating Income Walk to EBIT- Adj.
6
($B)
Q3
2010
Q3
2011
Operating Income
1.7
1.8
Equity Income
0.4
0.4
Non-Controlling Interests
(0.1)
0.0
Non-Operating Income
0.3
0.0
Earnings Before Interest & Taxes (EBIT)
2.3
2.2
Less Special Items
0.0
0.0
EBIT-
Adj.
2.3
2.2
Note: Starting Q4 2010 EBIT & EBIT-Adj. include GM Financial on an Earnings
Before Tax (EBT) basis Note: Results may not foot due to rounding
|
 Q3
EBIT & EBIT- Adj.
2.1
(0.6)
0.5
0.2
n/a
0.0
2.3
0.0
2.3
2.2
(0.3)
0.4
0.0
0.2
(0.2)
2.2
0.0
2.2
GMNA
GME
GMIO
GMSA
GM
Financial*
Corp. /
Elims
EBIT-
Adj.
Plus
Special Items
EBIT
($B)
* GM Financial at an Earnings Before Tax basis (EBT)
GMNA
GME
GMIO
GMSA
GM
Financial*
Corp./
Elims
EBIT-
Adj.
Plus
Special Items
EBIT
Q3 2010
Q3 2011
Note: Results may not foot due to rounding
7 |
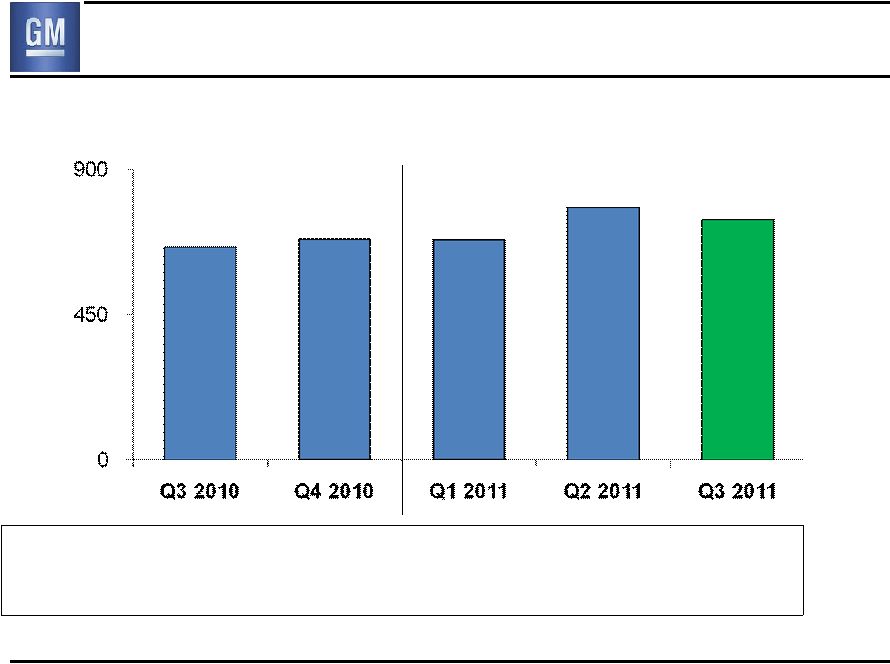
 Global Deliveries
(000’s)
Global Share
11.4%
11.5%
11.4%
12.2%
12.0%
GM deliveries & market share include vehicles sold around the world under GM
and JV brands, and through GM-branded distribution network
8 |
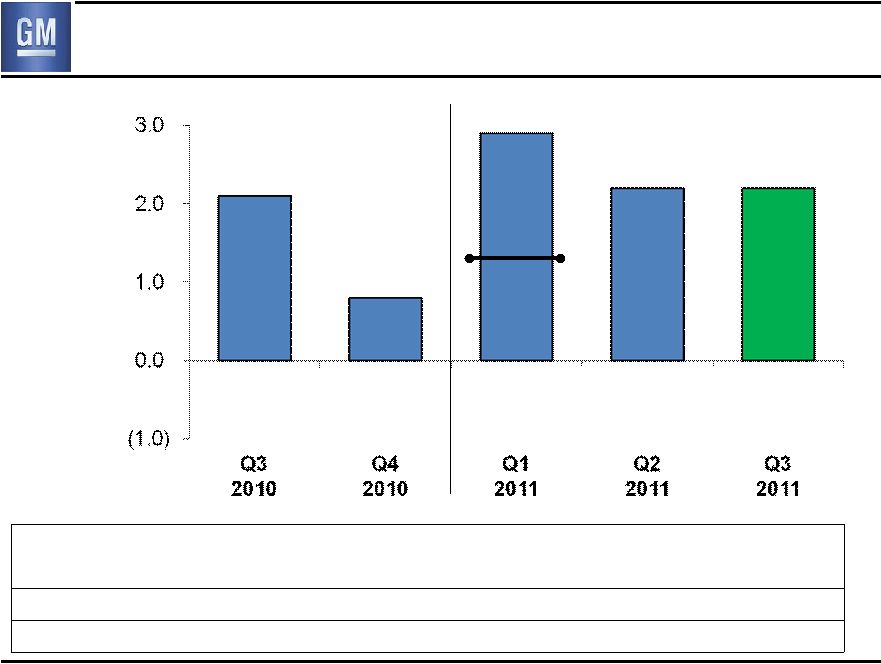
 Earnings Before Interest & Taxes
($B)
Revenue ($B)
34.1
36.9
36.2
39.4
36.7
Oper Inc % Rev
5.1%
0.8%
2.6%
6.2%
4.9%
EBIT-
Adj % Rev.
6.7%
2.8%
5.6%
7.5%
6.0%
Production (000’s)
2,104
2,269
2,327
2,400
2,221
2.3
1.3
3.5
1.0
EBIT-Adj.
2.0
EBIT-Adj.
Note: Starting Q4 2010 EBIT & EBIT-Adj. include GM Financial on an Earnings
Before Tax (EBT) basis 9
3.0
2.2 |
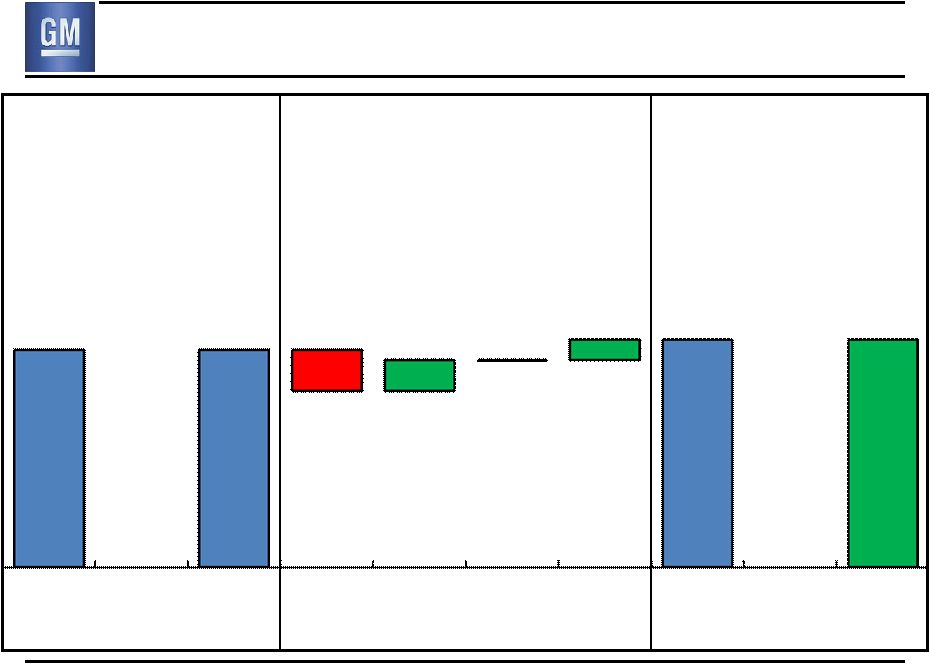
 Consolidated EBIT –
Q3 2010 vs. Q3 2011
Q3 2010
EBIT ($B)
Q3 2011
EBIT ($B)
$0.1B Decrease
EBIT
EBIT-Adj.
Less Special
Items
EBIT-Adj.
EBIT
Plus Special
Items
0.0
0.4
(0.4)
(0.1)
Volume /
Mix
Price
Cost
Other
0.0
2.3
2.3
2.2
0.0
2.2
10 |
 GMNA
Deliveries (000’s) GMNA Share
17.7%
18.5%
18.3%
19.1%
18.8%
U.S. Share
18.3%
19.1%
19.0%
20.0%
19.7%
660
685
684
11
784
745 |
 2,500
3,000
3,500
4,000
4,500
5,000
5,500
6%
8%
10%
12%
14%
16%
18%
20%
22%
Q3 2010
Q4 2010
Q1 2011
Q2 2011
Q3 2011
Key GMNA Performance Indicators
Avg. U.S. Retail Incentive as % of ATP
GM %
12.6
10.7
9.6
9.6
9.4
10.4
12.5
13.1
9.7
8.7
8.9
8.7
9.7
10.1
9.8
8.9
GM vs. Ind.
(GM % / Ind. %)
1.12
1.01
0.95
1.02
0.97
1.00
1.25
1.22
0.95
0.99
1.08
0.99
0.98
1.03
1.03
1.03
Share
$/Unit
U.S. Retail Share
U.S. Total Share
Avg. GM U.S. Retail
Incentive
Note: Incentive & ATP Information Based on J.D. Power and Associates
Power Information Network data Oct
2011
12 |
 GMNA
Earnings Before Interest & Taxes ($B)
Revenue ($B)
21.5
22.0
22.1
23.1
21.9
EBIT-
Adj % Rev
9.9%
3.4%
5.7%
9.7%
10.0%
Production
(000’s)
707
703
786
824
740
U.S. Dealer Inv (000’s) 478
511
574
605
558
2.1
0.8
2.9
1.3
EBIT-Adj.
13
2.2
2.2 |
 GMNA
EBIT – Q3 2010 vs. Q3 2011
Q3 2010
EBIT ($B)
Q3 2011
EBIT ($B)
$0.1B Improvement
EBIT
EBIT-Adj.
Less Special
Items
EBIT-Adj.
EBIT
Plus Special
Items
(0.4)
0.3
0.0
0.2
Volume /
Mix
Price
Cost
Other
0.0
2.1
2.1
2.2
0.0
2.2
14 |
 GME
Deliveries (000’s)
GME Share
8.9%
9.0%
8.5%
9.1%
8.8%
Germany Share
8.5%
9.0%
8.2%
8.9%
8.6%
U.K. Share
12.6%
12.4%
12.6%
13.3%
11.9%
Chevrolet
GME Excl.
Chevrolet
GME deliveries and market share include unit sales of Chevrolets
produced by GMIO and delivered to customers in GME.
Revenue and associated costs of these unit sales are reported by
GMIO
15 |
 GME
Earnings Before Interest & Taxes ($B)
Revenue ($B)
5.7
6.9
6.9
7.5
6.2
EBIT-
Adj % Rev
(9.9)%
(9.2)%
0.1%
1.4%
(4.7)%
Production (000’s)
286
313
344
326
270
(0.6)
(0.6)
(0.4)
0.0
EBIT-Adj.
16
0.1
(0.3) |
 GME
EBIT – Q3 2010 vs. Q3 2011
Q3 2010
EBIT ($B)
Q3 2011
EBIT ($B)
$0.3B Improvement
EBIT
EBIT-Adj.
Less Special
Items
EBIT-Adj.
EBIT
Plus Special
Items
Volume /
Mix
Price
Cost
Other
0.0
0.1
0.0
0.2
0.0
0.0
(0.6)
(0.6)
(0.3)
(0.3)
17 |
 GMIO
Deliveries (000’s)
GMIO Share
8.7%
8.6%
9.1%
9.6%
9.4%
China Share
13.6%
11.6%
13.6%
13.4%
14.1%
India Share
3.0%
3.4%
3.1%
3.4%
3.7%
China
GMIO Excl.
China
18 |
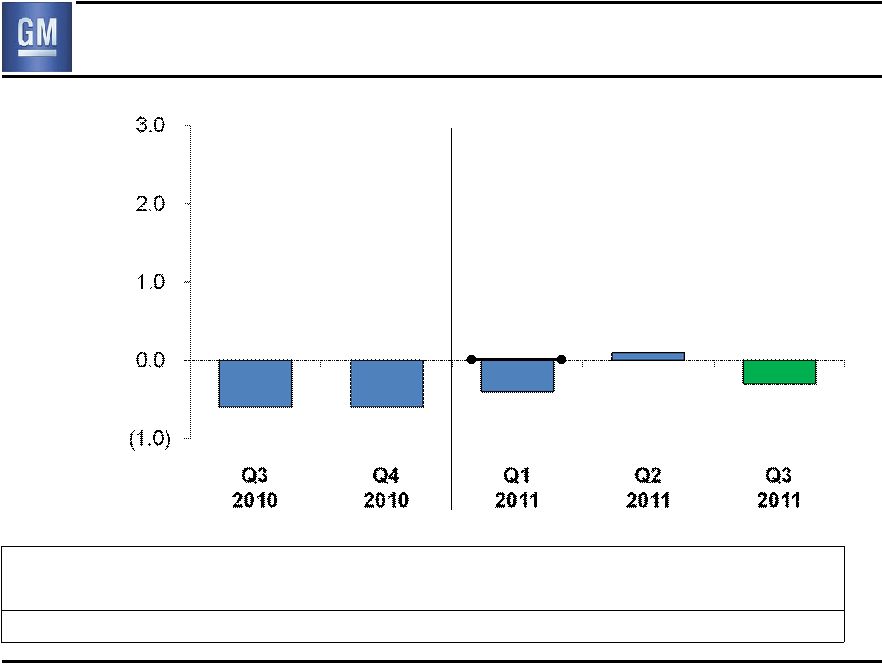
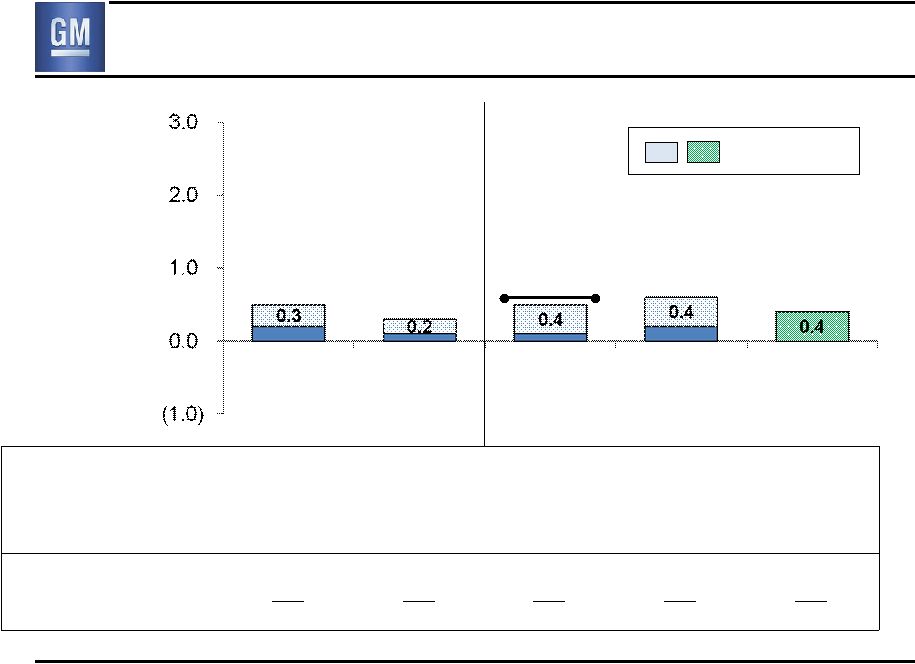 GMIO
Earnings Before Interest & Taxes ($B)
Revenue ($B)
EBIT margin from
consolidated operations*
Total China JV NI/Rev**
5.1
4.5%
11.8%
6.1
2.0%
7.7%
5.4
3.0%
12.0%
6.6
3.4%
11.1%
6.3
(0.6)%
10.5%
Consolidated Prod. (000’s)
Joint Venture Prod. (000’s)
Total Production (000’s)
235
631
866
265
747
1,012
257
709
966
310
693
1,003
253
715
968
0.5
0.3
0.5
0.6
EBIT-Adj.
19
0.6
Q3
2010
Q4
2010
Q1
2011
Q2
2011
Q3
2011
* Excludes equity income and non-controlling interest adjustment. See
supplementary schedule S8 for additional details. ** Revenue not consolidated
in GM results, pro-rata share of earnings reported as equity inc. ***
Joint Venture production includes China & other JV’s 0.4
***
Equity Income |
 EBIT
EBIT-Adj.
Less Special
Items
EBIT-Adj.
EBIT
Plus Special
Items
Volume /
Mix
Price
Cost
Other
Q3 2010
EBIT ($B)
Q3 2011
EBIT ($B)
$0.1B Decrease
0.2
(0.2)
(0.1)
0.0
0.0
0.0
0.5
0.5
0.4
0.4
GMIO EBIT –
Q3 2010 vs. Q3 2011
20 |
 GMSA
Deliveries (000’s)
GMSA Share
19.8%
19.6%
18.7%
19.3%
18.7%
Brazil Share
18.3%
18.4%
17.3%
17.6%
17.1%
Brazil
GMSA Other
21 |
 GMSA
Earnings Before Interest & Taxes ($B)
Revenue ($B)
4.0
4.5
3.9
4.4
4.4
EBIT-
Adj % Rev
4.1%
4.4%
2.3%
1.3%
(1.0)%
Production (000’s)
245
241
231
247
243
0.2
0.2
0.1
0.1
22
0.0 |
 GMSA
EBIT – Q3 2010 vs. Q3 2011
Q3 2010
EBIT ($B)
Q3 2011
EBIT ($B)
$0.2B Decrease
EBIT
0.0
(0.2)
(0.1)
0.1
EBIT
EBIT-Adj.
Less Special
Items
EBIT-Adj.
Plus Special
Items
Volume /
Mix
Price
Cost
Other
0.2
0.2
0.0
0.0
0.0
0.0
23 |
 Automotive Free Cash Flow
($B)
Q3 2010
Q3 2011
Net Income to Common Stockholders
2.0
1.7
Add-back Non-Controlling Interests, Preferred Dividends &
undistributed earnings allocated to Series B
0.2
0.4
Deduct Non-Auto (GM Financial)
n/a
(0.1)
Automotive Net Income
2.2
2.0
Depreciation / Amortization
1.7
1.4
Working Capital
(0.5)
(0.3)
Pension / OPEB –
Cash in Excess of Expense
(0.3)
(0.3)
Other
(0.5)
(1.0)
Automotive Net Cash Provided/(Used)
Operating Activities
2.6
1.8
Capital Expenditures
(1.2)
(1.5)
Automotive Free Cash Flow
1.4
0.3
24 |
 Key
Automotive Balance Sheet Items ($B)
Sep. 30
2010
Jun. 30
2011
Sep. 30
2011
Cash & marketable securities*
34.5
33.8
33.0
Available Credit Facilities
1.3
5.9
5.9
Available Liquidity*
35.8
39.7
38.8
Key Obligations:
Debt
8.6
4.7
4.2
Series A Preferred Stock
7.0
5.5
5.5
U.S. Pension Underfunded Status**
18.0
10.8
8.7
Unfunded OPEB
9.4
10.0
9.5
* Includes Canadian HC Trust restricted cash
** Excludes U.S. non-qualified plan PBO of ~$0.9 billion
*** Excludes ~$2B stock contribution completed 1/13/11 that is counted as a
plan asset starting in July 2011 25
***
Note: Results may not foot due to rounding |
 GM
Financial Q3
2010
Q3
2011
Industry Avg. (Excl. GM)
Q3
2010
Q3
2011
GM Sales Penetrations
U.S. Subprime (<=620)
4.8%
6.6%
4.5%
5.1%
U.S. Lease
8.6%
11.4%
20.5%
20.6%
Canada Lease
2.1%
9.4%
13.8%
15.0%
GM / GM Financial Linkage
GM as % of GM Financial Originations
(GM New / GMF Loan & Lease)
15.7%
39.3%
GM Fin. as % of GM U.S. S/P & Lease
9.8%
16.9%
GM Financial Performance
GM Financial Credit Losses
(annualized net charge-offs as % avg. receivables)
5.4%
3.0%
EBT ($M)
91
178
26
GM Sales Penetrations based on JD Power PIN
* GM acquired GM Financial in Oct. 2010, prior to this GM Financial was an
independent entity and not consolidated into GM results. Q3 2010 does not
reflect purchase accounting and is not directly comparable to Q3 2011 |
 Q4 2011 Outlook
27
•
Based on current industry outlook, expect Q4 EBIT-
Adj. to
be at levels similar to Q4 2010
Seasonal trends in GMNA
Continued weakness in Europe
•
GME will not reach target of breakeven EBIT-
Adj. before
restructuring charges due to declining economic conditions
•
Expect a special items gain in Q4 of ~$800M related to
Canadian Health Care Trust (HCT) |
 Third Quarter
Summary 28
•
Calendar-year-to-date results encouraging
Revenue $112B
Global share +0.5 pts to 11.9%
EBIT-Adj. $7.2B
•
Good progress, but more to do to deliver long-term
sustainable results
Improve results in GME & GMSA
Reduce complexity
Focus on cost containment
Leverage expected global growth
Deliver improved margins |
 New
GM 29 |
 General Motors Company
Select Supplemental Financial Information
*****
*****
*****
*****
*****
*****
*****
*****
*****
*****
*****
*****
*****
*****
*****
*****
*****
*****
*****
*****
***** |
 EBIT
Walk to Net Income to Common Stockholders S1
($B)
Q3
2010
Q3
2011
GMNA
2.1
2.2
GME
(0.6)
(0.3)
GMIO
0.5
0.4
GMSA
0.2
0.0
Corp & Elims
0.0
(0.2)
GM Financial
n/a
0.2
Total EBIT
2.3
2.2
Interest Expense / (Income)
0.1
0.0
Income Tax Expense / (Benefit)
0.0
0.1
Net Income to Stockholders
2.2
2.1
Undistributed earnings allocated to Series B (Basic)
n/a
(0.2)
Dividends on Preferred Stock
(0.2)
(0.2)
Net Income to Common Stockholders
2.0
1.7
Note: Starting Q4 2010 EBIT includes GM Financial on an Earnings
Before Tax (EBT) basis
Note: Results may not foot due to rounding |
 Reconciliation of Q3 2011 EBIT-
Adj.
($B)
Q3
2010
Q3
2011
Net Income to Common Stockholders
2.0
1.7
Add Back:
Undistributed earnings allocated to Series B (Basic)
n/a
0.2
Dividends on Preferred Stock
0.2
0.2
Interest Expense / (Income)
0.1
0.0
Income Tax Expense / (Benefit)
0.0
0.1
Earnings Before Interest & Taxes (EBIT)
2.3
2.2
Less Special Items:
None
-
-
Total Special Items
0.0
0.0
EBIT-
Adj.
2.3
2.2
Note: Results may not foot due to rounding
S2
Note: Starting Q4 2010, EBIT includes GM Financial on an Earnings Before Tax (EBT)
basis |
 Restructuring (not included in special items)
($B)
Q3
2010
Q4
2010
Q1
2011
Q2
2011
Q3
2011
GMNA –
Dealer Related
0.0
0.0
0.0
0.0
0.0
GMNA –
Non-Dealer
Related
0.1
0.2
0.0
0.0
(0.1)
Total GMNA
0.1
0.2
0.0
0.0
(0.1)
Total GME
(0.1)
(0.1)
0.0
(0.1)
(0.1)
Total GMIO
0.0
0.0
0.0
0.0
0.0
Total GMSA
0.0
0.0
0.0
0.0
0.0
Total
(0.1)
0.1
(0.1)
(0.1)
(0.2)
S3
Note: Results may not foot due to rounding |
 Operating Income Walk to EBIT-
Adj.
($B)
Q3
2010
Q4
2010
Q1
2011
Q2
2011
Q3
2011
Operating Income
1.7
0.3
0.9
2.5
1.8
Equity Income
0.4
0.3
2.1
0.4
0.4
Non-Controlling Interests
(0.1)
(0.1)
0.0
0.0
0.0
Non-Operating Income
0.3
0.9
0.5
0.2
0.0
Earnings Before Interest & Taxes
(EBIT)
2.3
1.3
3.5
3.0
2.2
Less Special Items
0.0
0.3
1.5
0.0
0.0
EBIT-
Adj.
2.3
1.0
2.0
3.0
2.2
Note: Starting Q4 2010 EBIT & EBIT-Adj. include GM Financial on an
Earnings Before Tax (EBT) basis S4
Note: Results may not foot due to rounding |
 Reconciliation of Automotive Free Cash Flow
($B)
Q3
2010
Q3
2011
Net cash provided by operating activities
2.6
2.0
Less net cash provided by operating activities-GM Financial
n/a
(0.2)
Automotive Net Cash Provided/(Used)
Operating Activities
2.6
1.8
Capital expenditures
(1.2)
(1.5)
Automotive Free Cash Flow
1.4
0.3
S5 |
 GM
Financial – Key Metrics
($M)
Q3 2011
Memo:
Q3 2010**
Earnings Before Tax
178
91
Total Originations
1,547
959
GM new vehicles as % of total
39.3%
16.5%
Finance Receivables
9,438
8,676
Delinquencies (>30 days)*
6.4%
8.7%
Annualized net charge-offs as % of
avg. receivables
3.0%
5.4%
S6
* Excludes finance receivables in repossession
** GM acquired GM Financial in Oct. 2010, prior to this GM Financial was an
independent entity and not consolidated into GM results. Q3 2010 does not
reflect purchase accounting and is not directly comparable to Q3 2011 |
 Info
Item: GMNA – C$ Net Monetary Liability
GMNA C$ NML Translational Impact
Q3
2010
Q4
2010
CY
2010
Q1
2011
Q2
2011
Q3
2011
Non-Cash EBIT Impact ($B)
$(0.2)
$(0.2)
$(0.4)
$(0.2)
$0.0
$0.3
Period End FX (CAD per USD)
Inc/(Dec) vs. Prior Period
1.0269
(0.0222)
0.9980
(0.0289)
0.9980
(0.0507)
0.9713
(0.0267)
0.9730
0.0017
1.0317
0.0587
•
GM Canada balance sheet includes C$ Net Monetary Liability (NML)
position, primarily pension, OPEB and accrued liabilities
•
USD value of NML will vary due to difference in period end to period end FX
•
Since GM Canada is USD functional, translation exchange realized
as non-
cash charge recorded to GMNA P&L
S7 |
 Calculation
of
EBIT-
Adj.
as
a
Percent
of
Revenue
($B)
Q3
2010
%
Q4
2010
%
Q1
2011
%
Q2
2011
%
Q3
2011
%
Consolidated
Revenue
34.1
36.9
36.2
39.4
36.7
Operating Income
1.7
5.1%
0.3
0.8%
0.9
2.6%
2.5
6.2%
1.8
4.9%
EBIT-
Adj.
2.3
6.7%
1.0
2.8%
2.0
5.6%
3.0
7.5%
2.2
6.0%
GMIO
Revenue
5.1
6.1
5.4
6.6
6.3
Operating Income
0.1
2.5%
0.1
1.1%
0.1
1.8%
0.2
2.3%
0.0
0.2%
Non-Operating Income (Expense)
0.1
0.1
0.0
0.1
(0.1)
Plus Special Items *
0.0
0.0
0.1
0.0
0.0
EBIT from consolidated
operations
0.2
4.5%
0.1
2.0%
0.2
3.0%
0.2
3.4%
0.0
(0.6)%
Note: EBIT-
Adj. includes GM Financial on an Earnings Before Tax (EBT) basis; Results may not
foot due to rounding * Q1 2011 includes $67 million charge recorded as
a special item S8 |
 EBIT
to EBIT– Adj.
($B)
Q3
2010
Q4
2010
Q1
2011
Q2
2011
Q3
2011
EBIT
GMNA
2.1
0.8
2.9
2.2
2.2
GME
(0.6)
(0.6)
(0.4)
0.1
(0.3)
GMIO
0.5
0.3
0.5
0.6
0.4
GMSA
0.2
0.2
0.1
0.1
0.0
Corp & Elim.
0.0
0.4
0.3
(0.2)
(0.2)
GM Financial*
n/a
0.1
0.1
0.1
0.2
Total EBIT
2.3
1.3
3.5
3.0
2.2
Special Items
GMNA
0.0
(0.1)
(1.6)
0.0
0.0
GME
0.0
(0.1)
0.4
0.0
0.0
GMIO
0.0
0.0
0.1
0.0
0.0
GMSA
0.0
0.0
0.0
0.0
0.0
Corp & Elim.
0.0
(0.2)
(0.3)
0.0
0.0
GM Financial
0.0
0.0
0.0
0.0
0.0
Total Special Items
0.0
(0.3)
(1.5)
0.0
0.0
EBIT–
Adj.
GMNA
2.1
0.8
1.3
2.2
2.2
GME
(0.6)
(0.6)
0.0
0.1
(0.3)
GMIO
0.5
0.3
0.6
0.6
0.4
GMSA
0.2
0.2
0.1
0.1
0.0
Corp & Elim.
0.0
0.2
0.0
(0.2)
(0.2)
GM Financial*
n/a
0.1
0.1
0.1
0.2
Total EBIT–
Adj.
2.3
1.0
2.0
3.0
2.2
S9
Note: Results may not foot due to rounding
* GM Financial at an Earnings Before Tax basis (EBT)
|