Attached files
| file | filename |
|---|---|
| EX-32 - SECTION 1350 CERTIFICATION - WisdomTree Investments, Inc. | d234483dex32.htm |
| EX-31.2 - CERTIFICATION OF CHIEF FINANCIAL OFFICER PURSUANT TO RULES 13A-14 - WisdomTree Investments, Inc. | d234483dex312.htm |
| EXCEL - IDEA: XBRL DOCUMENT - WisdomTree Investments, Inc. | Financial_Report.xls |
| EX-31.1 - CERTIFICATION OF CHIEF EXECUTIVE OFFICER PURSUANT TO RULES 13A-14 - WisdomTree Investments, Inc. | d234483dex311.htm |
Table of Contents
UNITED STATES
SECURITIES AND EXCHANGE COMMISSION
Washington, D.C. 20549
Form 10-Q
(Mark One)
| x | QUARTERLY REPORT PURSUANT TO SECTION 13 OR 15(d) OF THE SECURITIES EXCHANGE ACT OF 1934 |
For the quarterly period ended September 30, 2011
or
| ¨ | TRANSITION REPORT PURSUANT TO SECTION 13 OR 15(d) OF THE SECURITIES EXCHANGE ACT OF 1934 |
For the transition period from to .
Commission File Number 001-10932
WisdomTree Investments, Inc.
(Exact name of registrant as specified in its charter)
| Delaware | 13-3487784 | |
| (State or other jurisdiction of incorporation or organization) |
(IRS Employer Identification No.) | |
| 380 Madison Avenue, 21st Floor New York, New York |
10017 | |
| (Address of principal executive officers) | (Zip Code) | |
212-801-2080
(Registrant’s Telephone Number, Including Area Code)
Indicate by check mark whether the registrant (1) has filed all reports required to be filed by Section 13 or 15(d) of the Securities Exchange Act of 1934, as amended (the “Exchange Act’) during the preceding 12 months (or for such shorter period that the registrant was required to file such reports), and (2) has been subject to such filing requirements for the past 90 days. Yes x No ¨
Indicate by check mark whether the registrant has submitted electronically and posted on its corporate Web site, if any, every Interactive Data File required to be submitted and posted pursuant to Rule 405 of Regulation S-T (§232.405 of this chapter) during the preceding 12 months (or for such shorter period that the registrant was required to submit and post such files). x Yes ¨ No
Indicate by check mark whether the registrant is a large accelerated filer, an accelerated filer, a non-accelerated filer or a smaller reporting company. See definitions of “large accelerated filer,” “accelerated filer” and “smaller reporting company” in 12b-2 of the Exchange Act.
| Large accelerated filer | ¨ | Accelerated filer | ¨ | |||
| Non-accelerated filer | x | Smaller reporting company | ¨ | |||
Indicate by check mark whether the registrant is a shell company (as defined in Rule 12b-2 of the Exchange Act). Yes ¨ No x
As of November 4, 2011 there were 115,961,628 shares of the registrant’s Common Stock, $.01 par value per share, outstanding (voting shares).
Table of Contents
WISDOMTREE INVESTMENTS, INC.
Form 10-Q
For the Quarterly Period Ended September 30, 2011
2
Table of Contents
CAUTIONARY NOTE REGARDING FORWARD-LOOKING STATEMENTS
This Quarterly Report on Form 10-Q, or this Report, contains forward-looking statements that are based on our management’s belief and assumptions and on information currently available to our management. Although we believe that the expectations reflected in these forward-looking statements are reasonable, these statements relate to future events or our future financial performance, and involve known and unknown risks, uncertainties and other factors that may cause our actual results, levels of activity, performance or achievements to be materially different from any future results, levels of activity, performance or achievements expressed or implied by these forward-looking statements.
In some cases, you can identify forward-looking statements by terminology such as “may,” “will,” “should,” “expects,” “intends,” “plans,” “anticipates,” “believes,” “estimates,” “predicts,” “potential,” “continue” or the negative of these terms or other comparable terminology. These statements are only predictions. You should not place undue reliance on forward-looking statements because they involve known and unknown risks, uncertainties and other factors, which are, in some cases, beyond our control and which could materially affect results. Factors that may cause actual results to differ materially from current expectations include, among otherthings, those listed in the section entitled “Risk Factors” and elsewhere in this Report. If one or more of these risks or uncertainties occur, or if our underlying assumptions prove to be incorrect, actual events or results may vary significantly from those implied or projected by the forward-looking statements. No forward-looking statement is a guarantee of future performance. You should read this Report and the documents that we reference in this Report and have filed with the Securities and Exchange Commission as exhibits to the registration statement, of which this Report is a part, completely and with the understanding that our actual future results may be materially different from any future results expressed or implied by these forward-looking statements, please see Item 1A. “Risk Factors” in this Report.
In particular, forward-looking statements in this Report include statements about:
| • | anticipated trends, conditions and investor sentiment in the global markets; |
| • | anticipated levels of inflows into and outflows out of our exchange traded funds; |
| • | our ability to deliver favorable rates of return to investors; |
| • | our ability to develop new products and services; |
| • | our ability to maintain current vendors or find new vendors to provide services to us at favorable costs; |
| • | competition in our business; and |
| • | the effect of laws and regulations that apply to our business. |
The forward-looking statements in this Report represent our views as of the date of this Report. We anticipate that subsequent events and developments may cause our views to change. However, while we may elect to update these forward-looking statements at some point in the future, we have no current intention of doing so except to the extent required by applicable law. Therefore, these forward-looking statements do not represent our views as of any date other than the date of this Report.
3
Table of Contents
ITEM 1. CONSOLIDATED FINANCIAL STATEMENTS
WisdomTree Investments, Inc. and Subsidiaries
Consolidated Balance Sheets
(In Thousands, Except Per Share Amounts)
| September 30, 2011 |
December 31, 2010 |
|||||||
| (Unaudited) | ||||||||
| Assets |
||||||||
| Current assets: |
||||||||
| Cash and cash equivalents |
$ | 21,052 | $ | 14,233 | ||||
| Investments |
— | 1,295 | ||||||
| Accounts receivable |
5,737 | 4,825 | ||||||
| Other current assets |
1,184 | 642 | ||||||
|
|
|
|
|
|||||
| Total current assets |
27,973 | 20,995 | ||||||
| Fixed assets, net |
640 | 756 | ||||||
| Investments |
9,233 | 7,300 | ||||||
| Other noncurrent assets |
59 | 91 | ||||||
|
|
|
|
|
|||||
| Total assets |
$ | 37,905 | $ | 29,142 | ||||
|
|
|
|
|
|||||
| Liabilities and stockholders’ equity |
||||||||
| Liabilities |
||||||||
| Current liabilities: |
||||||||
| Fund management and administration payable |
$ | 8,866 | $ | 5,714 | ||||
| Compensation and benefits payable |
2,987 | 3,638 | ||||||
| Accounts payable and other liabilities |
2,810 | 2,263 | ||||||
|
|
|
|
|
|||||
| Total current liabilities |
14,663 | 11,615 | ||||||
| Other noncurrent liabilities |
186 | 292 | ||||||
|
|
|
|
|
|||||
| Total liabilities |
14,849 | 11,907 | ||||||
|
|
|
|
|
|||||
| Stockholders’ equity |
||||||||
| Preferred stock, par value $0.01; 2,000 shares authorized: |
— | — | ||||||
| Common stock, par value $0.01; 250,000 shares authorized: issued: 115,963 and 115,291 outstanding: 114,520 and 113,132 |
1,159 | 1,152 | ||||||
| Additional paid-in capital |
161,847 | 158,236 | ||||||
| Accumulated deficit |
(139,950 | ) | (142,153 | ) | ||||
|
|
|
|
|
|||||
| Total stockholders’ equity |
23,056 | 17,235 | ||||||
|
|
|
|
|
|||||
| Total liabilities and stockholders’ equity |
$ | 37,905 | $ | 29,142 | ||||
|
|
|
|
|
|||||
The accompanying notes are an integral part of these consolidated financial statements
4
Table of Contents
WisdomTree Investments, Inc. and Subsidiaries
Consolidated Statements of Operations
(In Thousands, Except Per Share Amounts)
(Unaudited)
| Three Months Ended September 30, |
Nine Months Ended September 30, |
|||||||||||||||
| 2011 | 2010 | 2011 | 2010 | |||||||||||||
| Revenues |
||||||||||||||||
| ETF advisory fees |
$ | 17,554 | $ | 9,860 | $ | 48,341 | $ | 27,456 | ||||||||
| Other income |
182 | 270 | 644 | 743 | ||||||||||||
|
|
|
|
|
|
|
|
|
|||||||||
| Total revenues |
17,736 | 10,130 | 48,985 | 28,199 | ||||||||||||
| Expenses |
||||||||||||||||
| Compensation and benefits |
5,085 | 4,405 | 14,912 | 14,260 | ||||||||||||
| Fund management and administration |
5,093 | 3,569 | 14,991 | 10,272 | ||||||||||||
| Marketing and advertising |
911 | 745 | 3,240 | 2,331 | ||||||||||||
| Sales and business development |
954 | 766 | 2,612 | 1,972 | ||||||||||||
| Professional and consulting fees |
1,473 | 795 | 3,922 | 2,526 | ||||||||||||
| Occupancy, communication and equipment |
288 | 273 | 846 | 829 | ||||||||||||
| Depreciation and amortization |
68 | 80 | 200 | 235 | ||||||||||||
| Third party sharing arrangements |
1,794 | 609 | 4,434 | 1,485 | ||||||||||||
| Other |
711 | 405 | 1,625 | 1,258 | ||||||||||||
|
|
|
|
|
|
|
|
|
|||||||||
| Total expenses |
16,377 | 11,647 | 46,782 | 35,168 | ||||||||||||
|
|
|
|
|
|
|
|
|
|||||||||
| Income/(loss) before provision for income taxes |
1,359 | (1,517 | ) | 2,203 | (6,969 | ) | ||||||||||
| Provision for income taxes |
625 | — | 1,013 | — | ||||||||||||
| Tax benefit |
(625 | ) | — | (1,013 | ) | — | ||||||||||
|
|
|
|
|
|
|
|
|
|||||||||
| Net income/(loss) |
$ | 1,359 | $ | (1,517 | ) | $ | 2,203 | $ | (6,969 | ) | ||||||
|
|
|
|
|
|
|
|
|
|||||||||
| Net income/(loss) per share—basic |
$ | 0.01 | $ | (0.01 | ) | $ | 0.02 | $ | (0.06 | ) | ||||||
| Net income/(loss) per share—diluted |
$ | 0.01 | $ | (0.01 | ) | $ | 0.02 | $ | (0.06 | ) | ||||||
| Weighted average common shares—basic |
114,238 | 112,424 | 113,886 | 111,675 | ||||||||||||
| Weighted average common shares—diluted |
136,075 | 112,424 | 135,615 | 111,675 | ||||||||||||
The accompanying notes are an integral part of these consolidated financial statements
5
Table of Contents
WisdomTree Investments, Inc. and Subsidiaries
Consolidated Statements of Cash Flows
(In Thousands)
(Unaudited)
| Nine Months Ended September 30, |
||||||||
| 2011 | 2010 | |||||||
| Cash flows from operating activities |
||||||||
| Net income/(loss) |
$ | 2,203 | $ | (6,969 | ) | |||
| Adjustments to reconcile net income/(loss) to net cash provided by/(used in) operating activities: |
||||||||
| Depreciation, amortization and other |
200 | 235 | ||||||
| Stock-based compensation |
5,427 | 6,529 | ||||||
| Deferred rent |
(115 | ) | (70 | ) | ||||
| Accretion to interest income |
79 | (6 | ) | |||||
| (Increase)/decrease in operating assets and liabilities: |
||||||||
| Accounts receivable |
(912 | ) | (842 | ) | ||||
| Other assets |
(510 | ) | 88 | |||||
| Fund management and administration payable |
3,152 | 760 | ||||||
| Compensation and benefits payable |
(651 | ) | (406 | ) | ||||
| Accounts payable and other liabilities |
556 | 12 | ||||||
|
|
|
|
|
|||||
| Net cash provided by/(used in) operating activities |
9,429 | (669 | ) | |||||
|
|
|
|
|
|||||
| Cash flows from investing activities |
||||||||
| Purchase of fixed assets |
(84 | ) | (87 | ) | ||||
| Purchase of investments |
(5,833 | ) | (6,114 | ) | ||||
| Proceeds from the redemption of investments |
5,116 | 7,183 | ||||||
|
|
|
|
|
|||||
| Net cash (used in)/provided by investing activities |
(801 | ) | 982 | |||||
|
|
|
|
|
|||||
| Cash flows from financing activities |
||||||||
| Shares repurchased |
(2,130 | ) | — | |||||
| Proceeds from exercise of stock options |
321 | 1 | ||||||
|
|
|
|
|
|||||
| Net cash (used in)/provided by financing activities |
(1,809 | ) | 1 | |||||
|
|
|
|
|
|||||
| Net increase in cash and cash equivalents |
6,819 | 314 | ||||||
| Cash and cash equivalents—beginning of period |
14,233 | 11,476 | ||||||
|
|
|
|
|
|||||
| Cash and cash equivalents—end of period |
$ | 21,052 | $ | 11,790 | ||||
|
|
|
|
|
|||||
| Supplemental disclosure of cash flow information |
||||||||
| Cash paid for income taxes |
$ | 12 | $ | 11 | ||||
|
|
|
|
|
|||||
| Non-cash investing and financing activities: |
||||||||
| Cashless exercise of stock options |
$ | 391 | $ | 60 | ||||
|
|
|
|
|
|||||
The accompanying notes are an integral part of these consolidated financial statements
6
Table of Contents
WisdomTree Investments, Inc. and Subsidiaries
NOTES TO CONSOLIDATED FINANCIAL STATEMENTS
(In Thousands, Except Share and Per Share Amounts)
(unaudited)
1. Organization and Description of Business
WisdomTree Investments, Inc. (“WisdomTree” or the “Company”) is a New York-based exchange-traded fund sponsor and asset manager. The Company is the eighth largest sponsor of ETFs in the United States based on assets under management (“AUM”). In June 2006, the Company launched 20 ETFs and, as of September 30, 2011, had 47 ETFs with AUM of $11.2 billion. Through its operating subsidiary, the Company provides investment advisory and other management services to the WisdomTree Trust (“WTT”) and WisdomTree ETFs. The Company also licenses its indexes to third parties and promotes the use of WisdomTree ETFs in 401(k) plans. The Company has the following subsidiaries:
| • | WisdomTree Asset Management, Inc. (“WTAM”)—a wholly owned subsidiary formed in February 2005, is an investment advisor registered with the Securities and Exchange Commission (“SEC”). WTAM provides investment advisory and other management services to WTT and the WisdomTree ETFs. In exchange for providing these services, the Company receives advisory fee revenues based on a percentage of the ETFs average daily net assets under management. |
| • | WisdomTree Retirement Services, Inc. (“WTRS”)—a wholly owned subsidiary formed in August 2007, markets with selected third parties the use of WisdomTree ETFs in 401(k) plans as well as offering a platform that offers ETFs to the 401(k) marketplace. |
The WisdomTree ETFs are issued by WTT. WTT, a non-consolidated third-party, is a Delaware statutory trust registered with the SEC as an open-end management investment company. WTT offers ETFs across international and domestic equities, currency, fixed income and alternatives asset classes. The Company has licensed the use of its own fundamentally-weighted indexes on an exclusive basis to WTT for the WisdomTree ETFs. The Board of WTT, or the Trustees, is separate from the Board of the Company. The Trustees are primarily responsible for overseeing the management and affairs of the WisdomTree ETFs and the Trust for the benefit of the WisdomTree ETF shareholders and has contracted with the Company to provide for general management and administration services of WTT and the WisdomTree ETFs. The Company, in turn, has contracted with third parties to provide the majority of these administration services. In addition, certain officers of the Company provide general management services for WTT.
2. Significant Accounting Policies
Basis of Presentation
These consolidated financial statements have been prepared in conformity with U.S. generally accepted accounting principles (“GAAP”), and in the opinion of management reflect all adjustments, consisting of only normal recurring adjustments, necessary for a fair statement of financial condition, results of operations and cash flows for the periods presented. The consolidated financial statements include the accounts of the Company’s wholly owned subsidiaries WTAM and WTRS. All intercompany accounts and transactions have been eliminated in consolidation. Certain accounts in the prior periods’ consolidated financial statements have been reclassified to conform to the current period’s consolidated financial statements presentation. These reclassifications had no effect on the previously reported net losses. These consolidated financial statements should be read in conjunction with the audited consolidated financial statements and footnotes for the year ended December 31, 2010.
Use of Estimates
The preparation of the Company’s consolidated financial statements in conformity with GAAP requires management to make estimates and assumptions that affect the reported amounts of assets and liabilities as of the balance sheet dates and the reported amounts of revenues and expenses for the periods presented. Actual results could differ from those estimates.
Revenue Recognition
The Company earns investment advisory fees for ETFs and separately managed accounts as well as licensing fees from third parties. ETF advisory fees are based on a percentage of the ETFs average daily net assets and recognized over the period the related service is provided. Fees for separately managed accounts and licensing are based on a percentage of the average monthly net assets and recognized over the period the related service is provided.
7
Table of Contents
Depreciation and Amortization
Depreciation is provided for using the straight-line method over the estimated useful lives of the related assets as follows:
| Equipment |
3 years | |||
| Furniture and fixtures |
7 years |
Leasehold improvements are amortized over the term of their respective leases or service lives of the improvements, whichever is shorter. Fixed assets are stated at cost less accumulated depreciation and amortization.
Marketing and Advertising
Advertising costs, including media advertising are expensed when incurred.
Cash and Cash Equivalents
The Company considers all highly liquid investments with an original maturity of 90 days or less at the time of purchase to be classified as cash equivalents. Cash and cash equivalents are held with one large financial institution.
Accounts Receivable and Allowance for Doubtful Accounts
Accounts receivable are customers’ obligations due under normal trade terms. An allowance for doubtful accounts is not provided because, in the opinion of management, all accounts receivable recorded are deemed collectible.
Impairment of Long-Lived Assets
On a periodic basis, the Company performs a review for the impairment of long-lived assets when events or changes in circumstances indicate that the estimated undiscounted future cash flows expected to be generated by the assets are less than their carrying amounts or when other events occur which may indicate that the carrying amount of an asset may not be recoverable.
Earnings/(Loss) per Share
Basic earnings or loss per share is computed by dividing net income or loss available to common stockholders by the weighted-average number of common shares outstanding for the period. Diluted earnings per share reflects the potential reduction in earnings per share that could occur if options or other contracts to issue common stock were exercised or converted into common stock. Options and restricted shares to purchase shares of common stock were included in the three and nine months ended September 30, 2011 but not included in the computation of diluted loss per share for the three and nine months ended September 30, 2010 as the Company incurred losses during those periods.
Investments
The Company accounts for all of its investments as held-to-maturity, which are recorded at amortized cost, which approximates fair value. For held-to-maturity investments, the Company has the intent and ability to hold investments to maturity and it is not more likely than not that the Company will be required to sell the investments before recovery of their amortized cost bases, which may be maturity.
On a periodic basis, the Company reviews its portfolio of investments for impairment. If a decline in fair value is deemed to be other-than-temporary, the security is written down to its fair value through earnings.
Subsequent Events
The Company has evaluated subsequent events after the date of the consolidated financial statements to consider whether or not the impact of such events needed to be reflected or disclosed in the consolidated financial statements. Such evaluation was performed through the issuance of these interim consolidated financial statements.
Stock-Based Awards
Accounting for share-based compensation requires the measurement and recognition of compensation expense for all equity awards based on estimated fair values. The Company accounts for stock-based compensation for its employees based on the cost of employee services received in exchange for a stock-based award. Stock-based compensation is measured based on the grant-date fair value of the award and are amortized over the relevant service period.
8
Table of Contents
Stock-based awards granted to non-employees for goods or services are valued at the fair value of the equity instruments issued or the fair value of consideration received, whichever is a more reliable measure of the fair value of the transaction, and recognized when performance obligations are complete.
Income Taxes
The Company accounts for income taxes using the liability method, which requires the determination of deferred tax assets and liabilities based on the differences between the financial and tax basis of assets and liabilities using the enacted tax rates in effect for the year in which differences are expected to reverse. Deferred tax assets are adjusted by a valuation allowance if, based on the weight of available evidence, it is more-likely-than-not that some portion or all of the deferred tax assets will not be realized.
In order to recognize and measure any unrecognized tax benefits, management evaluates and determines whether any of its tax positions are more-likely-than-not to be sustained upon examination, including resolution of any related appeals or litigation processes, based on the technical merits of the position. Once it is determined that a position meets this recognition threshold, the position is measured to determine the amount of benefit to be recognized in the consolidated financial statements. Management does not believe that the Company has any material uncertain tax positions. The Company records interest and penalties, if any, related to income taxes within the provision for income taxes in the consolidated statements of operations.
The Company had tax years December 31, 1996 through December 31, 2010 open for examination by federal and state agencies as of September 30, 2011.
Related-Party Transactions
The Company’s revenues are derived primarily from investment advisory agreements with WTT and WisdomTree ETFs. Under these agreements, the Company has granted WTT an exclusive license to its own indexes for operation of the WisdomTree ETFs. The Trustees are primarily responsible for overseeing the management and affairs of the WisdomTree ETFs and the Trust for the benefit of the WisdomTree ETF stockholders and has contracted with the Company to provide for general management and administration of WTT and the WisdomTree ETFs. The Company is also responsible for expenses of WTT, including the cost of transfer agency, custody, fund administration and accounting, legal, audit, and other non-distribution services. In exchange, the Company receives fees based on a percentage of the ETF average daily net assets. The advisory agreements may be terminated by WTT upon notice. Certain officers of the Company also provide general management oversight of WTT; however, these officers have no material decision making responsibilities and primarily implement the decisions of the Trustees. At September 30, 2011 and December 31, 2010, the balance of accounts receivable from WTT was approximately $5,574 and $4,612, respectively. Revenue from ETF advisory services provided to WTT for the three months ended September 30, 2011 and 2010 was approximately $17,554 and $9,860, respectively and for the nine months ended September 30, 2011 and 2010 was approximately $48,341 and $27,456, respectively.
Third Party Sharing Arrangements
Included in third party sharing arrangements expense are payments (reimbursements) from/(to) the Company with respect to (i) a collaborative arrangement and (ii) marketing agreements with third parties:
Collaborative Arrangement—In 2008, the Company entered into a mutual participation agreement with Mellon Capital Management Corporation (“Mellon Capital”) and The Dreyfus Corporation (“Dreyfus”) in which the parties agreed to collaborate in developing currency and fixed income ETFs under WTT. Under the agreement, the Company is responsible for operating the ETFs and providing sales, marketing and research support at its own cost. Mellon Capital and Dreyfus are responsible for providing sub-advisory, fund administration and accounting services for these collaborative ETFs at its own cost. Any revenues less third party costs, such as marketing, legal, accounting or fund management, related to these collaborative products are shared equally, including any losses (“net profit/(loss)”). The Company is responsible for arranging any third party costs related to this collaborative arrangement. This agreement expires in March 2013. The Company has determined it is the principal participant for transactions under this collaborative arrangement and as such, records these transactions on a gross basis reflecting all of the revenues and third party expenses on its consolidated financial statements in accordance with the nature of the revenue or expense. Any net profit/(loss) payments are reflected in Third Party Sharing Arrangements expense on the consolidated financial statements.
9
Table of Contents
Revenues and expenses under this collaborative arrangement included in the Company’s consolidated financial statement are as follows:
| Three Months Ended September 30, |
Nine Months Ended September 30, |
|||||||||||||||
| 2011 | 2010 | 2011 | 2010 | |||||||||||||
| ETF advisory fees revenue |
$ | 3,882 | $ | 1,658 | $ | 9,653 | $ | 4,608 | ||||||||
| Expenses: |
||||||||||||||||
| Fund management and administration |
381 | 331 | 1,073 | 775 | ||||||||||||
| Marketing and advertising |
41 | 18 | 389 | 679 | ||||||||||||
| Sales and business development |
69 | 95 | 115 | 186 | ||||||||||||
| Other |
— | 1 | — | 3 | ||||||||||||
|
|
|
|
|
|
|
|
|
|||||||||
| Total third party expenses |
491 | 445 | 1,577 | 1,643 | ||||||||||||
|
|
|
|
|
|
|
|
|
|||||||||
| Net profit |
3,391 | 1,213 | 8,076 | 2,965 | ||||||||||||
|
|
|
|
|
|
|
|
|
|||||||||
| 50% sharing |
$ | 1,696 | $ | 606 | $ | 4,038 | $ | 1,482 | ||||||||
Marketing agreements—In 2010, the Company entered into agreements with two external marketing firms to serve as the external marketing agents for the WisdomTree ETFs in the U.S. independent broker-dealer channel and in Latin America. Under these agreements, the Company will pay a percentage of their advisory fee revenue, subject to caps, to the marketing agents based on incremental growth in assets under management in the respective sales channel. The Company incurred marketing fees for the three and nine months ended September 30, 2011 of $98 and $396, respectively and $3 for the three and nine months ended September 30, 2010.
Segment, Geographic and Customer Information
The Company operates as one business segment, as an ETF sponsor and asset manager providing investment advisory services. Revenues are derived in the U.S. and all of the Company’s assets are located in the U.S.
Recently Issued Accounting Pronouncements
In January 2010, ASU No. 2010-6, Improving Disclosures About Fair Value Measurement, adds required disclosures about items transferring into and out of Levels 1 and 2 in the fair value hierarchy; adding separate disclosures about purchase, sales, issuances, and settlements relative to Level 3 measurements; and clarifying, among other things, the existing fair value disclosures about the level of disaggregation. ASU No. 2010-6 is effective for interim and annual reporting periods beginning after December 15, 2009, except for the requirement to provide Level 3 purchases, sales, issuances, and settlements on a gross basis, which is effective for fiscal years beginning after December 15, 2010. This standard impacts disclosure requirements only and did not have a material impact on our consolidated financial statements.
In May 2011, FASB issued ASU No. 2011-04 “Amendments to Achieve Common Fair Value Measurement and Disclosure Requirements in U.S. GAAP and International Financial Reporting Standards (“IFRS”).” ASU No. 2011-04 includes common requirements for measurement of and disclosure about fair value between U.S. GAAP and IFRS. ASU No. 2011-04 will require reporting entities to disclose the following information for fair value measurements categorized within Level 3 of the fair value hierarchy: quantitative information about the unobservable inputs used in the fair value measurement, the valuation processes used by the reporting entity and a narrative description of the sensitivity of the fair value measurement to changes in unobservable inputs and the interrelationships between those unobservable inputs. In addition, ASU No. 2011-04 will require reporting entities to make disclosures about amounts and reasons for all transfers in and out of Level 1 and Level 2 fair value measurements. The new and revised disclosures are effective for interim and annual reporting periods beginning after December 15, 2011. At this time, management is evaluating the implications of ASU No. 2011-04 and its impact on the Company’s consolidated financial statements.
3. Investments and Fair Value Measurements
The following table is a summary of the Company’s investments:
| September 30, 2011 | December 31, 2010 | |||||||
| Held-to-Maturity | Held-to-Maturity | |||||||
| Federal agency debt instruments |
$ | 9,233 | $ | 8,595 | ||||
|
|
|
|
|
|||||
| Total |
$ | 9,233 | $ | 8,595 | ||||
|
|
|
|
|
|||||
10
Table of Contents
The following table summarizes unrealized gains, losses, and fair value on investments:
| September 30, 2011 | December 31, 2010 | |||||||
| Held-to-Maturity | Held-to-Maturity | |||||||
| Cost/amortized cost |
$ | 9,233 | $ | 8,595 | ||||
| Gross unrealized gains |
50 | 47 | ||||||
| Gross unrealized losses |
(41 | ) | (151 | ) | ||||
|
|
|
|
|
|||||
| Fair value |
$ | 9,242 | $ | 8,491 | ||||
|
|
|
|
|
|||||
The Company’s table sets forth the maturity profile of investments:
| September 30, 2011 | December 31, 2010 | |||||||
| Held-to-Maturity | Held-to-Maturity | |||||||
| Due within one year |
$ | — | $ | 1,295 | ||||
| Due one year through five years |
— | 249 | ||||||
| Due five years through ten years |
1,150 | 796 | ||||||
| Due over ten years |
8,083 | 6,255 | ||||||
|
|
|
|
|
|||||
| Total |
$ | 9,233 | $ | 8,595 | ||||
|
|
|
|
|
|||||
Fair Value Measurement
Under the accounting for fair value measurements and disclosures, fair value is defined as the price that would be received to sell an asset or paid to transfer a liability, or the exit price, in an orderly transaction between market participants at the measurement date. The accounting guidance establishes a hierarchy of valuation techniques based on whether the inputs to those valuation techniques are observable or unobservable. Observable inputs reflect market data obtained from independent sources, while unobservable inputs reflect the Company’s market assumptions.
These three types of inputs create the following fair value hierarchy:
Level 1—Quoted prices for identical instruments in active markets.
Level 2—Quoted prices for similar instruments in active markets; quoted prices for identical or similar instruments in markets that are not active; and model-derived valuations whose inputs are observable or whose significant value drivers are observable.
Level 3—Instruments whose significant value drivers are unobservable.
This hierarchy requires the use of observable market data when available. The Company’s held-to-maturity securities are categorized as Level 1. The amortized cost of the held-to-maturity securities approximates fair value. The Company does not intend to sell its investments held-to maturity before the recovery of their amortized cost bases which may be at maturity.
Some of our financial instruments are not measured at fair value on a recurring basis but are recorded at amounts that approximate fair value due to their liquid or short-term nature. Such financial assets and financial liabilities include: cash and cash equivalents, accounts receivable, certain other current assets, accounts payable and other liabilities, fund management and administration payable, and compensation and benefits payable.
4. Commitments and Contingencies
Contractual Obligations
The Company has entered into obligations under operating leases with initial non-cancelable terms in excess of one year for office space, telephone, and data services. Expenses recorded under these agreements for the three months ended September 30, 2011 and 2010 were approximately $267 and $248 respectively. Expenses for the nine months ended September 30, 2011 and 2010 were approximately $781 and $761 respectively.
11
Table of Contents
Future minimum lease payments with respect to non-cancelable operating leases at September 30, 2011 are approximately as follows:
| Remainder of 2011 |
$ | 352 | ||
| 2012 |
1,372 | |||
| 2013 |
1,298 | |||
| 2014 |
74 | |||
| 2015 and thereafter |
— | |||
|
|
|
|||
| Total |
$ | 3,096 | ||
|
|
|
Letter of Credit
The Company collateralizes its leased office space through a standby letter credit in the amount of $700 held as an investment in debt securities, which is included in investments on the consolidated balance sheets at September 30, 2011 and December 31, 2010.
Contingencies
The Company is subject to various routine regulatory reviews and inspections by the SEC as well as legal proceedings arising in the ordinary course of business. The Company is not currently party to any litigation or other legal proceedings that management believes are reasonably likely to have a material adverse effect on the Company’s operating results, financial condition or cash flows.
5. Stock-Based Awards
Stock Options and Restricted Stock
The Company grants stock options to employees, certain directors and non-employee consultants and special advisors for services. Options are issued generally for terms of ten years and vest between two to four years. Options are issued with an exercise price equal to the fair value of the Company on the date of grant. The Company estimated the fair value for options using the Black-Scholes Option Pricing Model.
The Company grants restricted stock to employees and certain directors. All restricted stock awards require future service as a condition of delivery of the underlying shares of common stock along with certain other requirements outlined in the award agreements. Restricted stock awards generally vest over one to four years.
From time-to-time, the Company also grants restricted and common stock to nonemployee consultants, special advisors and vendors for services. In general, theses awards vest over the contractual period of the consulting arrangement. The fair value of these awards is measured at the grant dated fair value and re-measured at each reporting period. Fair value is determined as the closing price of the Company’s common stock on the date of grant.
A summary of options and restricted stock activity is as follows:
| Options | Weighted Average Exercise Price of Options |
Restricted Stock Awards |
||||||||||
| Balance at January 1, 2011 |
21,443,617 | $ | 0.60 | 2,158,509 | ||||||||
| Granted |
755,000 | $ | 5.68 | 561,526 | ||||||||
| Exercised/vested |
(535,842 | ) | $ | 1.12 | (1,251,896 | ) | ||||||
| Forfeitures or expirations |
(109,066 | ) | $ | 2.32 | (25,405 | ) | ||||||
|
|
|
|
|
|||||||||
| Balance at September 30, 2011 |
21,553,709 | $ | 0.76 | 1,442,734 | ||||||||
|
|
|
|
|
|
|
|||||||
A summary of stock-based compensation expense is as follows:
| Three Months Ended September 30, |
Nine Months Ended September 30, |
|||||||||||||||
| 2011 | 2010 | 2011 | 2010 | |||||||||||||
| Employees and directors |
$ | 995 | $ | 1,492 | $ | 3,374 | $ | 5,319 | ||||||||
| Non-employees |
808 | 476 | 2,053 | 1,210 | ||||||||||||
|
|
|
|
|
|
|
|
|
|||||||||
| Total |
$ | 1,803 | $ | 1,968 | $ | 5,427 | $ | 6,529 | ||||||||
|
|
|
|
|
|
|
|
|
|||||||||
12
Table of Contents
6. Earnings and Dividend Per Share
The following is a reconciliation of the basic and diluted earnings per share computation:
| Three Months Ended September 30, |
Nine Months Ended September 30, |
|||||||||||||||
| 2011 | 2010 | 2011 | 2010 | |||||||||||||
| Net income/(loss) |
$ | 1,359 | $ | (1,517 | ) | $ | 2,203 | $ | (6,969 | ) | ||||||
|
|
|
|
|
|
|
|
|
|||||||||
| Shares of common stock and common stock equivalents: |
||||||||||||||||
| Weighted averages shares used in basic computation (in thousands) |
114,238 | 112,424 | 113,886 | 111,675 | ||||||||||||
| Dilutive effect of stock options and unvested restricted stock (in thousands) |
21,837 | — | 21,729 | — | ||||||||||||
|
|
|
|
|
|
|
|
|
|||||||||
| Weighted averages shares used in dilutive computation (in thousands) |
136,075 | 112,424 | 135,615 | 111,675 | ||||||||||||
|
|
|
|
|
|
|
|
|
|||||||||
| Basic earnings per share |
$ | 0.01 | $ | (0.01 | ) | $ | 0.02 | $ | (0.06 | ) | ||||||
| Dilutive earnings per share |
$ | 0.01 | $ | (0.01 | ) | $ | 0.02 | $ | (0.06 | ) | ||||||
Diluted earnings per share reflects the potential reduction in earnings per share that could occur if options or other contracts to issue common stock were exercised or converted into common stock. Options and restricted shares to purchase shares of common stock were included in the three and nine months ended September 30, 2011 but not included in the computation of diluted loss per share for the three and nine months ended September 30, 2010 as the Company incurred losses during those periods. The number of outstanding options and unvested restricted stock excluded for the three and nine months ended September 30, 2010 were 21,765 and 2,582, respectively.
7. Income Taxes
At September 30, 2011 and December 31, 2010, the Company had net operating losses carry forward of $97,022 and $101,856, respectively, which it carries as a deferred tax asset which had been completely offset by a valuation allowance. For the three and nine months ended September 30, 2011, the Company has utilized $625 and $1,013, respectively, of its net operating loss by applying a 45.96% rate.
8. Shares Repurchased
During the nine months ended September 30, 2011, the Company repurchased 383,201 shares of its Company stock for an aggregate price of $2,130. The shares repurchased related to the vesting of restricted common stock granted to employees.
9. Subsequent Event
On October 17, 2011 the Company filed a registration statement on Form S-1 with the Securities and Exchange Commission for a proposed public offering of shares of its common stock by the Company and certain of its stockholders. The number of shares to be offered by the stockholders has not yet been determined but the Company intends to issue up to one million new shares. BofA Merrill Lynch and Morgan Stanley & Co. LLC are acting as joint book-running managers for the offering.
13
Table of Contents
ITEM 2. MANAGEMENT’S DISCUSSION AND ANALYSIS OF FINANCIAL CONDITION AND RESULTS OF OPERATIONS
MANAGEMENT’S DISCUSSION AND ANALYSIS OF FINANCIAL CONDITION AND RESULTS OF OPERATIONS
The following discussion and analysis of our financial condition and results of operations should be read together with our consolidated financial statements and the related notes and the other financial information included elsewhere in this Report. In addition to historical consolidated financial information, the following discussion contains forward-looking statements that reflect our plans, estimates and beliefs. Our actual results could differ materially from those discussed in the forward-looking statements. Factors that could cause or contribute to these differences include those discussed below. For a more complete description of the risks noted above and other risks that could cause our actual results to materially differ from our current expectations, please see Item 1A. “Risk Factors” of this Report. We assume no obligation to update or revise publicly any forward-looking statements, whether as a result of new information, future events or otherwise, unless required by law.
Executive Summary
We are the eighth largest sponsor of ETFs in the United States based on assets under management, or AUM, with an AUM of approximately $11.2 billion as of September 30, 2011. An ETF is an investment fund that holds securities such as stocks or bonds and trades at approximately the same price as the net asset value of its underlying assets. ETFs offer exposure to a wide variety of investment themes, including domestic, international and global equities, fixed income securities, currencies or commodities, as well as securities in specific industries and countries. We launched 20 ETFs in June 2006 and as of September 30, 2011, we offer a comprehensive family of 47 ETFs, which includes 34 international and domestic equity ETFs, nine currency ETFs, two recently launched international fixed income ETFs and two recently launched alternative strategy ETFs.
Through our operating subsidiary, we provide investment advisory and other management services to the WisdomTree ETFs. In exchange for providing these services, we receive advisory fee revenues based on a percentage of the ETFs average daily net assets under management.
Our expenses are predominantly related to selling, operating and marketing our ETFs. We have contracted with third parties to provide certain operational services for the ETFs. We have contracted with BNY Mellon to act as sub-advisor and provide portfolio management services, fund administration, custody, accounting and other related services for the WisdomTree ETFs.
Through our dedicated salesforce, we distribute our ETFs through all major channels within the asset management industry, including brokerage firms, registered investment advisors, institutional investors, private wealth managers and discount brokers. We do not target our ETFs for sale directly to the retail segment but rather to the financial advisor who acts as the intermediary between the end-client and us.
Our revenues are highly correlated to the level and relative mix of our AUM, as well as the fee rate associated with our ETFs. A significant portion of our AUM is invested in securities issued outside of the United States. Therefore, our AUM and our revenues are affected by movements in global capital market levels and the strengthening or weakening of the U.S. dollar against other currencies. Another factor impacting our revenues is the fees associated with our ETFs. Our overall average fee rate is affected by the mix of flows into our ETFs. With a significant portion of our AUM invested in securities issued outside of the U.S., favorable market sentiment to emerging markets, currencies and international fixed income is likely to have a positive effect on our overall revenue. Likewise, unfavorable market sentiments in these areas may cause a decrease in our revenues. In addition, we currently compete within the ETF market against several large ETF sponsors, many smaller sponsors, as well as new entrants to the marketplace, and will compete against large asset management companies who have recently launched or announced intentions to launch ETF products. However, it is our belief that our ability to gather inflows into our ETFs, coupled with general stock market trends, will have the greatest impact on our business.
14
Table of Contents
Market Environment
We have been and continue to operate in an extremely challenging and highly competitive business environment. The following chart reflects our ETF assets under management and major market equity indexes since the third quarter of last year:
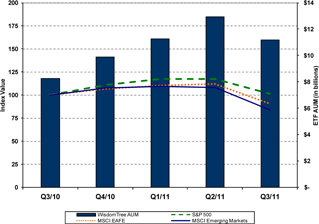
Equity markets worldwide were in a general upward trend since the bottom of the financial crises of 2008 and 2009 and this positive momentum continued into the first half of 2011. We, in turn, also experienced robust growth and expansion of our AUM, net inflows and market share of industry inflows. However, despite the recovery, concerns remained regarding high unemployment and the rate of economic recovery in the United States, the stability of European economies and their banks, and rising inflation in the emerging market countries. These concerns came to the forefront recently as the U.S. equity markets together with other equity markets worldwide experienced significant volatility. This recent volatility was led by the U.S. debt ceiling debates in Congress and the subsequent downgrade of U.S. government debt by Standard and Poor’s coupled with significant concerns over stability of European banks and the possibility of Greece defaulting on its debt. Our AUM reached a high of $13.5 billion on July 26, 2011; however, has declined to $11.2 billion as of September 30, 2011, primarily as a result of negative market movement.
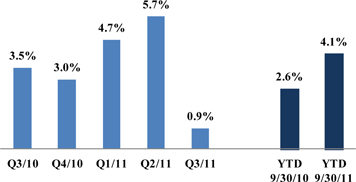
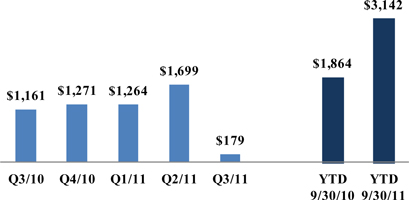
Our Results
The following charts reflect our net ETF inflows, market share of ETF industry inflows and ETF AUM on a quarterly basis since the third quarter of last year and as of and for the nine months ended September 30, 2010 and 2011:
Market Share of Industry Inflows
15
Table of Contents
Net Inflows
(in millions)
AUM
(in billions)
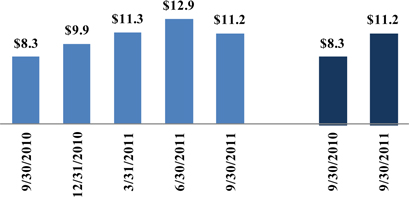
For the nine months ended September 30, 2011, our revenues were $49.0 million, compared to $28.2 million for the first nine months of 2010, and our expenses increased to $46.8 million from $35.2 million for the nine months ended September 30, 2010. We recorded net income of $2.2 million in the nine months ended September 30, 2011, compared to a net loss of $7.0 million in the comparable period in 2010.
Key Operating Statistics
The following table presents key operating statistics that serve as indicators for the performance of our business:
| As of and for the Three Months Ended | As of and for the Nine Months Ended |
|||||||||||||||||||
| September 30, 2011 |
June 30, 2011 |
September 30, 2010 |
September 30, 2011 |
September 30, 2010 |
||||||||||||||||
| Total ETFs (in millions) |
||||||||||||||||||||
| Beginning of period assets |
$ | 12,934 | $ | 11,284 | $ | 6,240 | $ | 9,891 | $ | 5,979 | ||||||||||
| Inflows/(outflows) |
179 | 1,699 | 1,161 | 3,142 | 1,864 | |||||||||||||||
| Market appreciation/(depreciation) |
(1,929 | ) | (49 | ) | 859 | (1,849 | ) | 417 | ||||||||||||
|
|
|
|
|
|
|
|
|
|
|
|||||||||||
| End of period assets |
$ | 11,184 | $ | 12,934 | $ | 8,260 | $ | 11,184 | $ | 8,260 | ||||||||||
|
|
|
|
|
|
|
|
|
|
|
|||||||||||
| Average assets during the period |
$ | 12,762 | $ | 12,062 | $ | 7,055 | $ | 11,706 | $ | 6,709 | ||||||||||
16
Table of Contents
| ETF Industry and Market Share (in billions) |
||||||||||||||||||||
| ETF industry net inflows |
$ | 21 | $ | 30 | $ | 33 | $ | 77 | $ | 73 | ||||||||||
| WisdomTree market share of industry inflows |
0.8 | % | 5.7 | % | 3.5 | % | 4.1 | % | 2.6 | % | ||||||||||
| International Developed Equity ETFs (in millions) |
||||||||||||||||||||
| Beginning of period assets |
$ | 2,619 | $ | 2,613 | $ | 1,674 | $ | 2,062 | $ | 1,953 | ||||||||||
| Inflows/(outflows) |
50 | 33 | (20 | ) | 564 | (32 | ) | |||||||||||||
| Market appreciation/(depreciation) |
(370 | ) | (27 | ) | 246 | (327 | ) | (21 | ) | |||||||||||
|
|
|
|
|
|
|
|
|
|
|
|||||||||||
| End of period assets |
$ | 2,299 | $ | 2,619 | $ | 1,900 | $ | 2,299 | $ | 1,900 | ||||||||||
|
|
|
|
|
|
|
|
|
|
|
|||||||||||
| Average assets during the period |
$ | 2,488 | $ | 2,596 | $ | 1,794 | $ | 2,434 | $ | 1,957 | ||||||||||
| Emerging Markets Equity ETFs (in millions) |
||||||||||||||||||||
| Beginning of period assets |
$ | 3,988 | $ | 3,759 | $ | 1,728 | $ | 3,780 | $ | 1,431 | ||||||||||
| Inflows/(outflows) |
102 | 344 | 707 | 506 | 1,043 | |||||||||||||||
| Market appreciation/(depreciation) |
(860 | ) | (115 | ) | 361 | (1,056 | ) | 322 | ||||||||||||
|
|
|
|
|
|
|
|
|
|
|
|||||||||||
| End of period assets |
$ | 3,230 | $ | 3,988 | $ | 2,796 | $ | 3,230 | $ | 2,796 | ||||||||||
|
|
|
|
|
|
|
|
|
|
|
|||||||||||
| Average assets during the period |
$ | 3,719 | $ | 3,863 | $ | 2,153 | $ | 3,733 | $ | 1,741 | ||||||||||
| International Sector Equity ETFs (in millions) |
||||||||||||||||||||
| Beginning of period assets |
$ | 248 | $ | 252 | $ | 190 | $ | 249 | $ | 358 | ||||||||||
| Inflows/(outflows) |
7 | 1 | 20 | 1 | (105 | ) | ||||||||||||||
| Market appreciation/(depreciation) |
(53 | ) | (5 | ) | 37 | (48 | ) | (6 | ) | |||||||||||
|
|
|
|
|
|
|
|
|
|
|
|||||||||||
| End of period assets |
$ | 202 | $ | 248 | $ | 247 | $ | 202 | $ | 247 | ||||||||||
|
|
|
|
|
|
|
|
|
|
|
|||||||||||
| Average assets during the period |
$ | 234 | $ | 258 | $ | 218 | $ | 246 | $ | 259 | ||||||||||
| US Equity ETFs (in millions) |
||||||||||||||||||||
| Beginning of period assets |
$ | 2,612 | $ | 2,218 | $ | 1,406 | $ | 2,057 | $ | 1,330 | ||||||||||
| Inflows/(outflows) |
241 | 374 | 211 | 668 | 368 | |||||||||||||||
| Market appreciation/(depreciation) |
(330 | ) | 20 | 162 | (202 | ) | 81 | |||||||||||||
|
|
|
|
|
|
|
|
|
|
|
|||||||||||
| End of period assets |
$ | 2,523 | $ | 2,612 | $ | 1,779 | $ | 2,523 | $ | 1,779 | ||||||||||
|
|
|
|
|
|
|
|
|
|
|
|||||||||||
| Average assets during the period |
$ | 2,528 | $ | 2,364 | $ | 1,540 | $ | 2,352 | $ | 1,484 | ||||||||||
| Currency ETFs (in millions) |
||||||||||||||||||||
| Beginning of period assets |
$ | 1,896 | $ | 1,467 | $ | 1,242 | $ | 1,179 | $ | 907 | ||||||||||
| Inflows/(outflows) |
(566 | ) | 382 | (19 | ) | 87 | 328 | |||||||||||||
| Market appreciation/(depreciation) |
(136 | ) | 47 | 43 | (72 | ) | 31 | |||||||||||||
|
|
|
|
|
|
|
|
|
|
|
|||||||||||
| End of period assets |
$ | 1,194 | $ | 1,896 | $ | 1,266 | $ | 1,194 | $ | 1,266 | ||||||||||
|
|
|
|
|
|
|
|
|
|
|
|||||||||||
| Average assets during the period |
$ | 1,786 | $ | 1,677 | $ | 1,224 | $ | 1,599 | $ | 1,226 |
17
Table of Contents
| International Fixed Income ETFs (in millions) |
||||||||||||||||||||
| Beginning of period assets |
$ | 1,379 | $ | 902 | — | $ | 564 | — | ||||||||||||
| Inflows/(outflows) |
280 | 442 | 262 | 1,057 | 262 | |||||||||||||||
| Market appreciation/(depreciation) |
(166 | ) | 35 | 10 | (128 | ) | 10 | |||||||||||||
|
|
|
|
|
|
|
|
|
|
|
|||||||||||
| End of period assets |
$ | 1,493 | $ | 1,379 | $ | 272 | $ | 1,493 | $ | 272 | ||||||||||
|
|
|
|
|
|
|
|
|
|
|
|||||||||||
| Average assets during the period |
$ | 1,780 | $ | 1,195 | $ | 126 | $ | 1,218 | $ | 42 | ||||||||||
| Alternative Strategy ETFs (in millions) |
||||||||||||||||||||
| Beginning of period assets |
$ | 192 | $ | 73 | — | — | — | |||||||||||||
| Inflows/(outflows) |
65 | 123 | — | $ | 259 | — | ||||||||||||||
| Market appreciation/(depreciation) |
(14 | ) | (4 | ) | — | (16 | ) | — | ||||||||||||
|
|
|
|
|
|
|
|
|
|
|
|||||||||||
| End of period assets |
$ | 243 | $ | 192 | — | $ | 243 | — | ||||||||||||
|
|
|
|
|
|
|
|
|
|
|
|||||||||||
| Average assets during the period |
$ | 227 | $ | 109 | — | $ | 124 | — | ||||||||||||
| Average ETF assets during the period |
||||||||||||||||||||
| Emerging markets equity ETFs |
29 | % | 32 | % | 31 | % | 32 | % | 26 | % | ||||||||||
| International developed equity ETFs |
20 | % | 21 | % | 25 | % | 21 | % | 29 | % | ||||||||||
| US equity ETFs |
20 | % | 20 | % | 22 | % | 20 | % | 22 | % | ||||||||||
| Currency ETFs |
14 | % | 14 | % | 17 | % | 14 | % | 18 | % | ||||||||||
| International fixed income ETFs |
14 | % | 10 | % | 2 | % | 10 | % | 1 | % | ||||||||||
| International sector equity ETFs |
2 | % | 2 | % | 3 | % | 2 | % | 4 | % | ||||||||||
| Alternative strategy ETFs |
1 | % | 1 | % | 0 | % | 1 | % | 0 | % | ||||||||||
|
|
|
|
|
|
|
|
|
|
|
|||||||||||
| Total |
100 | % | 100 | % | 100 | % | 100 | % | 100 | % | ||||||||||
|
|
|
|
|
|
|
|
|
|
|
|||||||||||
| Average ETF advisory fee during the period |
0.55 | % | 0.55 | % | 0.56 | % | 0.55 | % | 0.55 | % | ||||||||||
|
|
|
|
|
|
|
|
|
|
|
|||||||||||
| Number of ETFs - end of the period |
||||||||||||||||||||
| International developed equity ETFs |
14 | 14 | 14 | 14 | 14 | |||||||||||||||
| US equity ETFs |
12 | 12 | 12 | 12 | 12 | |||||||||||||||
| Currency ETFs |
9 | 9 | 9 | 9 | 9 | |||||||||||||||
| Emerging markets equity ETFs |
4 | 4 | 4 | 4 | 4 | |||||||||||||||
| International sector equity ETFs |
4 | 4 | 4 | 4 | 4 | |||||||||||||||
| International fixed income ETFs |
2 | 2 | 1 | 2 | 1 | |||||||||||||||
| Alternative strategy ETFs |
2 | 1 | — | 2 | — | |||||||||||||||
|
|
|
|
|
|
|
|
|
|
|
|||||||||||
| Total |
47 | 46 | 44 | 47 | 44 | |||||||||||||||
|
|
|
|
|
|
|
|
|
|
|
|||||||||||
| Headcount |
64 | 61 | 56 | 64 | 56 |
18
Table of Contents
Three Months Ended September 30, 2011 compared to September 30, 2010
Overview
| As of and
For the Three Months Ended September 30, |
Percent | |||||||||||||||
| 2011 | 2010 | Change | Change | |||||||||||||
| Assets Under Management (in millions) |
||||||||||||||||
| Beginning of period assets |
$ | 12,934 | $ | 6,240 | ||||||||||||
| Net inflows |
179 | 1,161 | ($982 | ) | (84.6 | %) | ||||||||||
| Market appreciation/(depreciation) |
(1,929 | ) | 859 | |||||||||||||
|
|
|
|
|
|||||||||||||
| End of period assets |
$ | 11,184 | $ | 8,260 | $ | 2,924 | 35.4 | % | ||||||||
|
|
|
|
|
|||||||||||||
| Financial Results (in thousands) |
||||||||||||||||
| Total revenues |
$ | 17,736 | $ | 10,130 | $ | 7,606 | 75.1 | % | ||||||||
| Total expenses |
16,377 | 11,647 | 4,730 | 40.6 | % | |||||||||||
|
|
|
|
|
|
|
|||||||||||
| Net income/(loss) |
$ | 1,359 | ($1,517 | ) | $ | 2,876 | nm | |||||||||
|
|
|
|
|
|
|
|||||||||||
Our AUM was $11.2 billion at September 30, 2011, a decrease of $1.8 billion or 13.5% from $12.9 billion at June 30, 2011, primarily due to a $1.9 billion decline in the market value of securities held by our ETFs. Our AUM at September 30, 2010 reflected an increase of $2.0 billion or 32.4% from $6.2 billion at June 30, 2010, primarily due to $1.2 billion of net inflows into our ETFs. We reported net income of $1.4 million in the three months ended September 30, 2011 compared to a loss of $1.5 million in the comparable period in 2010.
Revenues
| Three Months Ended Sept. 30, |
Change | Percent Change |
||||||||||||||
| 2011 | 2010 | |||||||||||||||
| Average assets under management (in millions) |
$ | 12,762 | $ | 7,055 | $ | 5,707 | 80.9 | % | ||||||||
| Average ETF advisory fee |
0.55 | % | 0.56 | % | (0.01 | ) | (1.8 | %) | ||||||||
| ETF advisory fees (in thousands) |
$ | 17,554 | $ | 9,860 | $ | 7,694 | 78.0 | % | ||||||||
| Other income (in thousands) |
182 | 270 | (88 | ) | (32.6 | %) | ||||||||||
|
|
|
|
|
|
|
|||||||||||
| Total revenues (in thousands) |
$ | 17,736 | $ | 10,130 | $ | 7,606 | 75.1 | % | ||||||||
|
|
|
|
|
|
|
|||||||||||
Our total revenues for the three months ended September 30, 2011 increased 75.1% to a record $17.7 million as compared to $10.1 million in the third quarter of 2010, primarily due to higher average assets under management from strong net ETF inflows.
ETF advisory fees
ETF advisory fees revenue increased 78.0% from $9.9 million in the three months ended September 30, 2010 to a record $17.6 million in the comparable period in 2011. This increase was primarily due to higher average asset balances. Average ETF assets under management were $12.8 billion in the third quarter of 2011, as compared to $7.1 billion in the third quarter of 2010. Our average assets under management during the three months ended September 30, 2011 did not decline in absolute terms as our end of period assets under management. We experienced strong net inflows through most of the third quarter; however, due to the volatility in the market place, we experienced a large outflow from certain of our emerging market currency and international fixed income ETFs during the last week of the quarter. As a result, our net inflows and AUM declined. As this outflow happened at the end of the
19
Table of Contents
period, it did not have a material effect on our average assets or our revenues for the three months ended September 30, 2011; however, this decline will likely have a negative effect on our average assets and revenues for the fourth quarter. Also affecting our average assets was a decline of $1.9 billion in the market value of securities held by our ETFs due to the market volaility. Our average ETF advisory fees decreased from 0.56% in the three months ended September 30, 2010 to 0.55% in the comparable period in 2011 due to a change in the mix of average assets of our ETFs.
Other income
Other income decreased 32.6% from $0.3 million in the three months ended September 30, 2010 to $0.2 million in the comparable period in 2011. This decline was primarily due to lower separate account revenues. Following the first quarter of 2011, we no longer managed separate accounts.
Expenses
| (in thousands) |
Three Months Ended Sept. 30, |
Percent Change |
||||||||||||||
| 2011 | 2010 | Change | ||||||||||||||
| Compensation and benefits |
$ | 5,085 | $ | 4,405 | $ | 680 | 15.4 | % | ||||||||
| Fund management and administration |
5,093 | 3,569 | 1,524 | 42.7 | % | |||||||||||
| Marketing and advertising |
911 | 745 | 166 | 22.3 | % | |||||||||||
| Sales and business development |
954 | 766 | 188 | 24.5 | % | |||||||||||
| Professional and consulting fees |
1,473 | 795 | 678 | 85.3 | % | |||||||||||
| Occupancy, communications and equipment |
288 | 273 | 15 | 5.5 | % | |||||||||||
| Depreciation and amortization |
68 | 80 | (12 | ) | (15.0 | %) | ||||||||||
| Third-party sharing arrangements |
1,794 | 609 | 1,185 | nm | ||||||||||||
| Other |
711 | 405 | 306 | 75.6 | % | |||||||||||
|
|
|
|
|
|
|
|
|
|||||||||
| Total expenses |
$ | 16,377 | $ | 11,647 | $ | 4,730 | 40.6 | % | ||||||||
|
|
|
|
|
|
|
|||||||||||
| As a Percent of Revenues: |
Three Months Ended Sept. 30, |
|||||||
| 2011 | 2010 | |||||||
| Compensation and benefits |
28.7 | % | 43.5 | % | ||||
| Fund management and administration |
28.7 | % | 35.2 | % | ||||
| Marketing and advertising |
5.1 | % | 7.4 | % | ||||
| Sales and business development |
5.4 | % | 7.6 | % | ||||
| Professional and consulting fees |
8.3 | % | 7.8 | % | ||||
| Occupancy, communications and equipment |
1.6 | % | 2.7 | % | ||||
| Depreciation and amortization |
0.4 | % | 0.8 | % | ||||
| Third-party sharing arrangements |
10.1 | % | 6.0 | % | ||||
| Other |
4.0 | % | 4.0 | % | ||||
|
|
|
|
|
|||||
| Total expenses |
92.3 | % | 115.0 | % | ||||
|
|
|
|
|
|||||
In the three months ended September 30, 2011, our total expenses increased 40.6% to $16.4 million from $11.6 million in the third quarter of 2010, primarily due to an increase in fund management and administration expense resulting from higher average assets under management, higher compensation and benefits expense, higher third-party sharing arrangements due to higher asset balances in our currency and fixed income ETFs, and higher marketing and advertising and sales and business development expenses to support our growth.
Compensation and benefits
Compensation and benefits expense increased 15.4% from $4.4 million in the three months ended September 30, 2010 to $5.1 million in the comparable period in 2011 primarily due to higher accrued incentive compensation due to our strong year to date results, as well as costs associated with higher headcount. Our headcount increased from 56 at the end of September 2010 to 64 at the end of September 2011. Stock-based compensation expense decreased $0.5 million as equity awards granted to employees in prior years with higher fair values become fully vested and replaced with a lower number of awards at lower fair values.
20
Table of Contents
Fund management and administration
Fund management and administration expense increased 42.7% from $3.6 million in the three months ended September 30, 2010 to $5.1 million in the comparable period in 2011. Higher average assets under management led to an increase of $1.2 million in portfolio management, fund administration and accounting, index licensing, and distribution fees. Printing fees for our regulatory reports increased $0.2 million due to an increase in the number of shareholders of our ETFs. We had 47 ETFs at September 30, 2011 compared to 44 at the September 30, 2010.
Marketing and advertising
Marketing and advertising expense increased 22.3% from $0.7 million in the three months ended September 30, 2010 to $0.9 million in the comparable period in 2011 primarily due to higher levels of television, print and online advertising to support our growth. We expect to continue our marketing efforts into the fourth quarter.
Sales and business development
Sales and business development expense increased 24.5% from $0.8 million in the three months ended September 30, 2010 to $1.0 million in the comparable period in 2011 primarily due to increased new product development related activities.
Professional and consulting fees
Professional and consulting fees increased 85.3% from $0.8 million in the three months ended September 30, 2010 to $1.5 million in the comparable period in 2011 primarily due to a $0.3 million increase in variable stock based compensation expense from $0.5 million to $0.8 million as a result of the higher price of our common stock. Legal and accounting fees associated with the preparation of our SEC registration statement on Form 10 in connection with the listing of our common stock onto the NASDAQ Global Market were $0.2 million in the three months ended September 30, 2011.
Occupancy, communications and equipment
Occupancy, communications and equipment expense remained relatively unchanged at $0.3 million in the three months ended September 30, 2010 and the comparable period in 2011.
Depreciation and amortization
Depreciation and amortization expense remained relatively unchanged in the three months ended September 30, 2010 from the comparable period in 2011.
Third-party sharing arrangements
Third-party sharing arrangements increased $1.2 million from $0.6 million in the three months ended September 30, 2010 to $1.8 million in the comparable period in 2011. This increase was primarily due to a $1.1 million increase in net profits in our currency and fixed income ETFs, which are subject to a profit sharing agreement with Mellon Capital and Dreyfus. Under the agreement, we share revenues and third party costs equally. This expense increased due to the higher average asset balances in these ETFs. In addition, fees paid to third parties for marketing our ETFs in the independent broker-dealer channel and Latin America increased by $0.1 million.
Other
Other expenses increased 75.6% to $0.7 million in the three months ended September 30, 2011 primarily due to higher administration related expenses.
21
Table of Contents
Nine Months Ended September 30, 2011 compared to September 30, 2010
Overview
| As of and for the Nine Months Ended Sept. 30, |
Change | Percent Change |
||||||||||||||
| 2011 | 2010 | |||||||||||||||
| Assets Under Management (in millions) |
||||||||||||||||
| Beginning of period assets |
$ | 9,891 | $ | 5,979 | ||||||||||||
| Net inflows |
3,142 | 1,864 | $ | 1,278 | 68.6 | % | ||||||||||
| Market appreciation/(depreciation) |
(1,849 | ) | 417 | |||||||||||||
|
|
|
|
|
|||||||||||||
| End of period assets |
$ | 11,184 | $ | 8,260 | $ | 2,924 | 35.4 | % | ||||||||
|
|
|
|
|
|||||||||||||
| Financial Results (in thousands) |
||||||||||||||||
| Total revenues |
$ | 48,985 | $ | 28,199 | $ | 20,786 | 73.7 | % | ||||||||
| Total expenses |
46,782 | 35,168 | 11,614 | 33.0 | % | |||||||||||
|
|
|
|
|
|
|
|||||||||||
| Net income/(loss) |
$ | 2,203 | ($6,969 | ) | $ | 9,172 | ||||||||||
|
|
|
|
|
|
|
|||||||||||
Our AUM in the nine months of 2011 increased 13.1% primarily due to strong net inflows into our ETFs partly offset by negative market movement. We reported net income of $2.2 million in the nine months ended September 30, 2011 compared to a loss of $7.0 million in the comparable period in 2010.
Revenues
| Nine Months Ended June 30, |
Change | Percent Change |
||||||||||||||
| 2011 | 2010 | |||||||||||||||
| Average assets under management (in millions) |
$ | 11,706 | $ | 6,709 | $ | 4,997 | 74.5 | % | ||||||||
| Average ETF advisory fee |
0.55 | % | 0.55 | % | — | — | ||||||||||
| ETF advisory fees (in thousands) |
$ | 48,341 | $ | 27,456 | $ | 20,885 | 76.1 | % | ||||||||
| Other income (in thousands) |
644 | 743 | (99 | ) | (13.3 | %) | ||||||||||
|
|
|
|
|
|
|
|||||||||||
| Total revenues (in thousands) |
$ | 48,985 | $ | 28,199 | $ | 20,786 | 73.7 | % | ||||||||
|
|
|
|
|
|
|
|||||||||||
Our total revenues for the nine months ended September 30, 2011 increased 73.7% to a $49.0 million as compared to $28.2 million in the comparable period in 2010, primarily due to higher average assets under management from strong net ETF inflows.
ETF advisory fees
ETF advisory fees revenue increased 76.1% from $27.5 million in the nine months ended September 30, 2010 to a record $48.3 million in the comparable period in 2011. This increase was primarily due to higher average asset balances due to strong net inflows. The average fee earned remained unchanged at 0.55% during the nine months ended September 30, 2011 and September 30, 2010.
Other income
Other income decreased 13.3% from $0.7 million in the nine months ended September 30, 2010 to $0.6 million in the comparable period in 2011. This decline was primarily due to lower separate account revenues. Following the first quarter of 2011, we no longer managed separate accounts.
22
Table of Contents
Expenses
| (in thousands) |
Nine Months Ended Sept. 30, |
Change | Percent Change |
|||||||||||||
| 2011 | 2010 | |||||||||||||||
| Compensation and benefits |
$ | 14,912 | $ | 14,260 | $ | 652 | 4.6 | % | ||||||||
| Fund management and administration |
14,991 | 10,272 | 4,719 | 45.9 | % | |||||||||||
| Marketing and advertising |
3,240 | 2,331 | 909 | 39.0 | % | |||||||||||
| Sales and business development |
2,612 | 1,972 | 640 | 32.5 | % | |||||||||||
| Professional and consulting fees |
3,922 | 2,526 | 1,396 | 55.3 | % | |||||||||||
| Occupancy, communications and equipment |
846 | 829 | 17 | 2.1 | % | |||||||||||
| Depreciation and amortization |
200 | 235 | (35 | ) | (14.9 | %) | ||||||||||
| Third-party sharing arrangements |
4,434 | 1,485 | 2,949 | 198.6 | % | |||||||||||
| Other |
1,625 | 1,258 | 367 | 29.2 | % | |||||||||||
|
|
|
|
|
|
|
|
|
|||||||||
| Total expenses |
$ | 46,782 | $ | 35,168 | $ | 11,614 | 33.0 | % | ||||||||
|
|
|
|
|
|
|
|||||||||||
| As a Percent of Revenues: |
Nine Months Ended Sept. 30, |
|||||||
| 2011 | 2010 | |||||||
| Compensation and benefits |
30.4 | % | 50.6 | % | ||||
| Fund management and administration |
30.6 | % | 36.4 | % | ||||
| Marketing and advertising |
6.6 | % | 8.3 | % | ||||
| Sales and business development |
5.3 | % | 7.0 | % | ||||
| Professional and consulting fees |
8.0 | % | 9.0 | % | ||||
| Occupancy, communications and equipment |
1.7 | % | 2.9 | % | ||||
| Depreciation and amortization |
0.4 | % | 0.8 | % | ||||
| Third-party sharing arrangements |
9.1 | % | 5.3 | % | ||||
| Other |
3.3 | % | 4.5 | % | ||||
|
|
|
|
|
|||||
| Total expenses |
95.5 | % | 124.7 | % | ||||
|
|
|
|
|
|||||
For the nine months ended September 30, 2011, our total expenses increased $11.6 million or 33.0% to $46.8 million as compared to $35.2 million in the comparable period in 2010. This increase was primarily due to higher fund management and administration expenses due to higher average asset balances, higher third-party sharing arrangements due to higher asset balances in our currency and fixed income ETFs, and higher marketing and advertising and sales and business development expenses to support our growth.
Compensation and benefits
Compensation and benefits expense increased 4.6% from $14.3 million in the nine months ended September 30, 2010 to $14.9 million in the comparable period in 2011 primarily due to higher accrued incentive compensation due to our strong year to date results, as well as costs associated with higher headcount. Our headcount increased from 56 at the end of September 2010 to 64 at the end of September 2011. Partly offsetting this increase was a decrease of $2.0 million in stock-based compensation as equity awards granted to employees in prior years with higher fair values become fully vested and replaced with a lower number of awards at lower fair values.
Fund management and administration
Fund management and administration expense increased 45.9% from $10.3 million in the nine months ended September 30, 2010 to $15.0 million in the comparable period in 2011. Higher average assets under management led to an increase of $3.3 million in portfolio management, fund administration and accounting, index licensing, and distribution fees. Included in the nine months ended September 30, 2011 is a one-time charge of $0.7 million related to reimbursing the WisdomTree India ETF for excess fees we collected as a result of overestimating the operating expense recapture fees for the India ETF’s fiscal year ended March 31, 2011. Lastly, printing related fees increased $0.3 million due to an increase in the number of shareholders owning our ETFs. We had 47 ETFs at the end of September 2011 compared to 44 at the end of September 2010.
23
Table of Contents
Marketing and advertising
Marketing and advertising expense increased 39.0% from $2.3 million in the nine months ended September 30, 2010 to $3.2 million in the comparable period in 2011 primarily due to higher levels of television, print and online advertising to support our growth. We expect to have higher annual spending on marketing and advertising for the full year of 2011 as compared to the full year 2010.
Sales and business development
Sales and business development expense increased 32.5% from $2.0 million in the nine months ended September 30, 2010 to $2.6 million in the comparable period in 2011 primarily due to higher new product related spending and sales activity to support our growth.
Professional and consulting fees
Professional and consulting fees increased 55.3% from $2.5 million in the nine months ended September 30, 2010 to $3.9 million in the comparable period in 2011 primarily due to a $0.8 million increase in variable stock based compensation expense from $1.2 million to $2.1 million, due to the higher price of our common stock. Legal and accounting fees associated with the preparation of our SEC registration statement on Form 10 in connection with the listing of our common stock onto the NASDAQ Global Market were $0.7 million in the nine months ended September 30, 2011.
Occupancy, communications and equipment
Occupancy, communications and equipment expense remained relatively unchanged at $0.8 million in the nine months ended September 30, 2010 and the comparable period in 2011.
Depreciation and amortization
Depreciation and amortization expense remained relatively unchanged at $0.2 million in the nine months ended September 30, 2010 and the comparable period in 2011.
Third-party sharing arrangements
Third-party sharing arrangements increased $2.9 million from $1.5 million in the nine months ended September 30, 2010 to $4.4 million in the comparable period in 2011. This increase was primarily due to a $2.5 million increase in net profits in our currency and fixed income ETFs, which are subject to a profit sharing agreement with Mellon Capital and Dreyfus. Under the agreement, we share revenues and third party costs equally. This expense increased due to the higher average asset balances in these ETFs. In addition, fees paid to third parties for marketing our ETFs in the independent broker-dealer channel and Latin America increased by $0.4 million.
Other
Other expenses increased 29.2% to $1.6 million in the nine months ended September 30, 2011 primarily due to higher corporate insurance and administrative related expenses.
Liquidity and Capital Resources
The following table summarizes key data regarding our liquidity, capital resources and use of capital to fund our operations:
| Sept. 30, 2011 |
Dec. 31, 2010 |
|||||||
| Balance Sheet Data (in thousands): |
||||||||
| Cash and cash equivalents |
$ | 21,052 | $ | 14,233 | ||||
| Investments |
9,233 | 8,595 | ||||||
| Accounts receivable |
5,737 | 4,825 | ||||||
| Total liabilities |
(14,849 | ) | (11,907 | ) | ||||
|
|
|
|
|
|||||
| $ | 21,173 | $ | 15,746 | |||||
24
Table of Contents
| Nine Months Ended Sept. 30, 2011 |
Nine Months Ended Sept. 30, 2010 |
|||||||
| Cash Flow Data (in thousands): |
||||||||
| Operating cash flows |
$ | 9,429 | ($669 | ) | ||||
| Investing cash flows |
(801 | ) | 982 | |||||
| Financing cash flows |
(1,809 | ) | 1 | |||||
|
|
|
|
|
|||||
| Increase in cash and cash equivalents |
$ | 6,819 | $ | 314 | ||||
|
|
|
|
|
|||||
Future Outlook on Expenses
We believe the ETF industry is still in its infancy and we have significant growth opportunities; therefore, it is important for us to strategically invest in our business. Our investment in strategic growth initiatives includes anticipated higher spending on marketing, advertising and sales efforts, as well as conservative increases to our headcount, in both sales and operational support. We also intend to launch additional ETFs and may close some ETFs in the future, which will have an effect on our fund related costs. We also intend to establish an international fund company to capitalize on growth opportunities outside of the U.S. The investment in strategic growth initiatives is an estimate of planned expenses and some of these costs may or may not be incurred depending on the nature of the growth initiatives or market conditions.
Along with expenses for our strategic growth initiatives, we expect to incur approximately $1.5 million to $2.0 million in costs in 2012 for obtaining approval from the shareholders of the WisdomTree ETFs for us to continue as investment advisor for the WisdomTree ETFs if our largest stockholder, Michael Steinhardt, who currently beneficially owns 30.1% of our common stock, were to sell or otherwise transfer shares of common stock in the future such that his beneficial ownership would fall below 25%. We intend to commence this approval process on a proactive basis as the Investment Company Act of 1940 presumes a change in control of our Company if Mr. Steinhardt’s ownership falls below the 25% threshold. A change in control of our Company would trigger an automatic termination of our investment advisory agreements with the WisdomTree Trust. We also intend to seek approval from the WisdomTree ETF shareholders to give us the option to change sub-advisors in the future from BNY-Mellon.
Our current gross margin, which we define as our total revenues less our fund management and administration expenses and less third-party sharing arrangements, is approximately 61%. Based on our current AUM levels and mix, we currently do not expect any significant deviation from this metric in the near term.
We also expect to grant additional equity awards in 2012 as most of our employees will have vested in a significant portion of their previously granted equity awards. The amount of such award has not yet been determined. Lastly, we have sub-leased a portion of our office space to an unrelated third party until March 2012. We expect our office space costs to increase as we assume the subleased space. With the exception of marketing expenses which are subject to seasonal fluctuations, we expect our expenses to decline as a percent of our revenues as we mature.
Liquidity
We consider our available liquidity to be our assets we can convert to cash less our liabilities. Assets consist of cash and cash equivalents, current receivables, and investments. Cash and cash equivalents include cash on hand and non-interest-bearing and interest-bearing deposits with financial institutions. Accounts receivable primarily represents advisory fees we earn from the WisdomTree ETFs which are collected by the fifth business day of the month following the month earned. Investments represent debt instruments of U.S. government and agency securities. Our liabilities consist primarily of payments owed to vendors and third parties in the normal course of business as well as accrued year end incentive compensation for employees.
Cash and cash equivalents increased $6.8 million in the nine months ended September 30, 2011 primarily due to $9.4 million of cash flows generated by our operating activities as a result of higher revenues from higher assets under management partly offset by $1.8 million of cash flows used to repurchase our common stock and $0.8 million to purchase investments with our excess cash.
Cash and cash equivalents increased $0.3 million in the nine months ended September 30, 2010 primarily due to $1.0 million of proceeds from net redemptions of our investments partly offset by $0.7 million of cash used to operate our business as we incurred a loss during the period.
25
Table of Contents
Capital Resources
Currently, our principal source of financing is our operating cash flow, though historically, our principal source of financing was through the private placement of our common stock. We believe that current cash flows generated by our operating activities and the net proceeds raised through our proposed public offering of shares of our common stock should be sufficient for us to fund our operations for at least the next 12 months.
Use of Capital
Our business does not require us to maintain a significant cash position. We expect that our main uses of cash will be to fund the ongoing operations of our business, invest in strategic growth initiatives, re-acquire shares of our common stock issued to our employees as incentive compensation as discussed below or expand our business through strategic acquisitions.
During the nine months ended September 30, 2011, we repurchased approximately 383,000 shares from our employees at then current market prices at a cost of $2.1 million in connection with vesting of restricted stock. The amount repurchased represented the estimated tax liability the employees owed to the various taxing authorities related to the income they earned from vested shares. We expect to continue purchasing shares for similar reasons for the remainder of 2011.
Contractual Obligations
The following table summarizes our future cash payments associated with contractual obligations as of September 30, 2011.
| Payments Due by Period | ||||||||||||||||||||||||
| (in thousands) | ||||||||||||||||||||||||
| Total | Less than 1 year |
1 to 3 years | 3 to 5 years | More than 5 years |
||||||||||||||||||||
| Operating lease |
$ | 3,096 | $ | 352 | $ | 2,744 | — | — | ||||||||||||||||
Off-Balance Sheet Arrangements
Other than operating leases, which are included in the table above, we do not have any off-balance sheet financing or other arrangements. We have neither created nor are party to any special-purpose or off-balance sheet entities for the purpose of raising capital, incurring debt or operating our business.
Critical Accounting Policies
Stock-Based Compensation
Stock-based compensation expense reflects the fair value of stock-based awards measured at grant date and is recognized over the relevant service period. The fair value of each option award is estimated on the date of grant using the Black-Scholes option valuation model. The Black-Scholes option valuation model we use includes the input of certain variables that are dependent on future expectations, including the expected lives of our options from grant date to exercise date, the volatility of our underlying common shares in the market over that time period, the rate of dividends that we may pay during that time and an appropriate risk-free interest rate. Many of these assumptions require management’s judgment. If actual experience differs significantly from these estimates, stock-based compensation expense and our results of operations could be materially affected.
Income and Deferred Taxes
We recognize an asset or liability for the deferred tax consequences of temporary differences between the tax basis of assets and liabilities and their reported amounts in the consolidated financial statements. These temporary differences will result in taxable or deductible amounts in future years when the reported amounts of assets are recovered or liabilities are settled. A valuation allowance is recorded to reduce the carrying values of deferred tax assets and liabilities to the amount that is more likely than not to be realized. As of September 30, 2011, we have net operating loss carry forwards and we have recognized a deferred tax asset for such carry forwards. Given the significant losses we have incurred since we began our operations, a valuation allowance has been recorded for the full amount of the deferred tax asset.
Recently Issued Accounting Pronouncements
In January 2010, ASU No. 2010-6, Improving Disclosures About Fair Value Measurement, adds required disclosures about items transferring into and out of Levels 1 and 2 in the fair value hierarchy; adding separate disclosures about purchase, sales, issuances, and settlements relative to Level 3 measurements; and clarifying, among other things, the existing fair value disclosures
26
Table of Contents
about the level of disaggregation. ASU No. 2010-6 is effective for interim and annual reporting periods beginning after December 15, 2009, except for the requirement to provide Level 3 purchases, sales, issuances, and settlements on a gross basis, which is effective for fiscal years beginning after December 15, 2010. This standard impacts disclosure requirements only and did not have a material impact on our consolidated financial statements.
In May 2011, the Financial Accounting Standards Board, or FASB, issued ASU No. 2011-04 “Amendments to Achieve Common Fair Value Measurement and Disclosure Requirements in U.S. GAAP and International Financial Reporting Standards (“IFRS”)”. ASU No. 2011-04 includes common requirements for measurement of and disclosure about fair value between U.S. GAAP and IFRS. ASU No. 2011-04 will require reporting entities to disclose the following information for fair value measurements categorized within Level 3 of the fair value hierarchy: quantitative information about the unobservable inputs used in the fair value measurement, the valuation processes used by the reporting entity and a narrative description of the sensitivity of the fair value measurement to changes in unobservable inputs and the interrelationships between those unobservable inputs. In addition, ASU No. 2011-04 will require reporting entities to make disclosures about amounts and reasons for all transfers in and out of Level 1 and Level 2 fair value measurements. The new and revised disclosures are effective for interim and annual reporting periods beginning after December 15, 2011. At this time, management is evaluating the implications of ASU No. 2011-04 and its impact on the Company’s consolidated financial statements.
ITEM 3: Quantitative and Qualitative Disclosures about Market Risk
In the normal course of business, our financial results are subject to market risk. Market risk to us generally represents the risk of changes in the value of financial instruments held in the portfolios of the WisdomTree ETFs that generally results from fluctuations in equity prices, foreign currency exchange rates against the U.S. dollar, and interest rates. Nearly all (in excess of 90%) of our revenue is derived from advisory agreements for the WisdomTree ETFs. Under these agreements, the advisory fee we receive is based on the market value of the assets in the WisdomTree ETF portfolios we manage.
Fluctuations in the value of these securities are common and are generated by numerous factors such as market volatility, the overall economy, inflation, changes in investor strategies, availability of alternative investment vehicles, government regulations and others. Accordingly changes in any one or a combination of these factors may reduce the value of investment securities and, in turn, the underlying assets under management on which our revenues are earned. These declines may cause investors to withdraw funds from our ETFs in favor of investments that they perceive as offering greater opportunity or lower risk, thereby compounding the impact on our revenues. Beginning in the second half of 2008 and into 2009, global equity markets experienced unprecedented volatility which caused significant declines in our assets under management and revenues during the quarters in that time period. Challenging and volatile market conditions might continue to be present in the foreseeable future.
In order to maximize yields, we invest our corporate cash in short-term interest earning assets, primarily money market instruments at a commercial bank and U.S. government and agency debt instruments which totaled $21.1 million and $14.2 million as of September 30, 2011 and December 31, 2010, respectively. We do not anticipate that changes in interest rates will have a material impact on our financial condition, operating results or cash flows.
ITEM 4. CONTROLS AND PROCEDURES
Evaluation of Disclosure Controls and Procedures
As of September 30, 2011, our management, with the participation of our Chief Executive Officer and our Executive Vice President—Finance and Chief Financial Officer, evaluated the effectiveness of our disclosure controls and procedures pursuant to Rule 13a-15(b) promulgated under the Securities Exchange Act of 1934, as amended, or the “Exchange Act”. Based upon that evaluation, our Chief Executive Officer and our Executive Vice President—Finance and Chief Financial Officer concluded that, as of September 30, 2011, our disclosure controls and procedures were effective at a reasonable assurance level in ensuring that material information required to be disclosed by us in the reports that we file or submit under the Exchange Act is recorded, processed, summarized and reported within the time periods specified in the rules, regulations and forms of the Securities and Exchange Commission, or the SEC, including ensuring that such material information is accumulated by and communicated to our management, including our Chief Executive Officer and our Executive Vice President—Finance and Chief Financial Officer, as appropriate to allow timely decisions regarding required disclosure.
Changes in Internal Control Over Financial Reporting
During the quarter ended September 30, 2011, there were no changes in our internal control over financial reporting that have materially affected, or are reasonably likely to materially affect, our internal control over financial reporting.
27
Table of Contents
| ITEM 1. | LEGAL PROCEEDINGS |
As an investment advisor, we may be subject to routine reviews and inspections by the SEC as well as legal proceedings arising in the ordinary course of business. We are not currently party to any litigation or other legal proceedings that are expected to have a material impact on our business, financial position or results of operations.
| ITEM 1A. | RISK FACTORS |
Any investment in our common stock involves a high degree of risk. You should consider carefully the specific risk factors described below in addition to the other information contained in this Report before making a decision to invest in our common stock. If any of these risks actually occur, our business, operating results, financial condition and prospects could be harmed. This could cause the trading price of our common stock to decline and a loss of all or part of your investment. Certain statements below are forward-looking statements. See the section entitled “Cautionary Note Regarding Forward-Looking Statements.”
Risks Related to Our Business and Our Industry
We have only a limited operating history and, as a result, recent historical growth may not provide an accurate representation of the growth we may experience in the future, which may make it difficult to evaluate our future prospects.
We launched our first 20 ETFs in June 2006 and have only a limited operating history in the asset management business upon which an evaluation of our performance can be made. We have incurred significant losses since we launched our first ETFs. We first reported net income in the first quarter of 2011 and we only began to generate positive cash flow on a full quarterly basis in the second fiscal quarter of the year ended December 31, 2010 and, as a result, recent historical growth may not provide an accurate representation of the growth we may experience in the future, which may make it difficult to evaluate our future prospects. We have a history of net losses and have not achieved sustained profitability, and we may not be able to maintain or increase our level of profitability. Prior to generating net income for the three and nine months ended September 30, 2011, we incurred net losses of $27.0 million, $21.2 million and $7.5 million in the years ended December 31, 2008, 2009 and 2010, respectively. Even though we may achieve profitability in one quarter or period, because of the various risks outlined in this Report, we cannot assure you that we will continue to be profitable.
Challenging global market conditions associated with declining prices of securities can adversely affect our business by reducing the market value of the assets we manage or causing customers to sell their fund shares and trigger redemptions.
We are subject to risks arising from adverse changes in global market conditions and the declining prices of securities, which may result in a decrease in demand for investment products, a higher redemption rate and/or a decline in AUM. The securities markets are highly volatile and securities prices may increase or decrease for many reasons, including general economic conditions, political events, acts of terrorism and other matters beyond our control. Substantially all of our revenue is determined by the amount of our AUM and a substantial part of our AUM is represented by equity securities, in both the international and U.S. markets. As a result, our business can be expected to generate lower revenue in declining equity market environments or general economic downturns, such as after the recent U.S. government debt rating downgrade and in response to concern over potential sovereign debt defaults by other countries. A decline in the prices of securities held by the WisdomTree ETFs may cause our revenue to decline by either causing the value of our AUM to decrease, which would result in lower advisory fees, or causing investors in the WisdomTree ETFs to sell their shares in favor of investments they perceive to offer greater opportunity or lower risk, thus triggering redemptions that would also result in decreased AUM and lower fees.
Fluctuations in the amount and mix of our AUM may negatively impact revenue and operating margin.
The level of our revenue depends on the level and mix of our AUM. Our revenue is derived primarily from advisory fees based on a percentage of the value of our AUM and varies with the nature of the ETFs, which have different fee levels. Fluctuations in the amount and mix of our AUM may be attributable in part to market conditions outside of our control that have had, and in the future could have, a negative impact on our revenue and operating margin.
We are subject to an increased risk of asset volatility from changes in the foreign markets as discussed below. Individual markets may be adversely affected by economic, political, financial, or other instabilities that are particular to the country or regions in which a market is located, including without limitation local acts of terrorism, economic crises or other business, social or political
28
Table of Contents
crises. Declines in these markets and currency fluctuations have caused in the past, and may cause in the future, a decline in our revenue. Changing market conditions and currency fluctuations may cause a shift in our asset mix between foreign and U.S. assets, potentially resulting in a decline in our revenue since we generally derive higher fee revenue from our ETFs investing in foreign markets, particularly in emerging markets.
We have had in the past, and in the future may have, investors who maintain significant positions in one or more of our ETFs. If such an investor were to broadly change or withdraw its investments in our ETFs because of a change to its investment strategy, market conditions or any other reason, it may significantly change the level and mix of our AUM, which may negatively affect our revenue and operating margin.
Most of our assets under management are held in ETFs that invest in foreign securities and we therefore have substantial exposure to foreign market conditions and are subject to currency exchange rate risks.
Many of our ETFs invest in securities of companies, governments and other organizations located outside the United States and at September 30, 2011, approximately 65% of our AUM was held by these ETFs. Therefore, the success of our business is closely tied to market conditions in foreign markets. Investments in non-U.S. issuers are affected by political, social and economic uncertainty effecting a country or region in which we are invested. In addition, fluctuations in foreign currency exchange rates could reduce the revenue we earn from these foreign invested ETFs. This occurs because an increase in the value of the U.S. dollar relative to non-U.S. currencies may result in a decrease in the dollar value of the AUM in these ETFs, which, in turn, would result in lower revenue. Furthermore, investors are likely to believe these ETFs, as well as our suite of currency and fixed income ETFs, are a less attractive investment opportunity when the value of the U.S. dollar rises relative to non-U.S. currencies, which could have the effect of reducing investments in these ETFs, thus reducing revenue.
We derive a substantial portion of our revenue from products invested in emerging markets and are exposed to the market-specific political and economic risks as well as general investor sentiment regarding future growth of those markets.
At September 30, 2011, approximately 42% of our ETF AUM was concentrated in six of our WisdomTree ETFs that primarily invest in equity or fixed income securities issued by companies and governments in emerging markets. In the nine months ended September 30, 2011, approximately 51% of our revenue was derived from those six ETFs. As a result, our operating results are particularly exposed to the performance of those funds, economic and market conditions in those emerging markets, general investor sentiment regarding future growth in those emerging markets and our ability to maintain the assets under management of those funds. In addition, because these funds have a higher expense ratio than our other funds in general, they generate a disproportionate percentage of our total revenue. If the AUM in these funds were to decline, either because of declining market values or because of net outflows from these funds, our revenue would be adversely affected.
We derive a substantial portion of our revenue from a limited number of products and, as a result, our operating results are particularly exposed to the performance of those funds, investor sentiment toward the strategies pursued by those funds and our ability to maintain the assets under management of those funds.
At September 30, 2011, approximately 66% of our ETF AUM was concentrated in 10 of our WisdomTree ETFs. As a result, our operating results are particularly exposed to the performance of those funds, investor sentiment toward investing in the strategies pursued by those funds and our ability to maintain the assets under management of those funds.
The WisdomTree ETFs have a limited track record and poor investment performance could cause our revenue to decline.
The WisdomTree ETFs have a limited track record upon which an evaluation of their investment performance can be made. At September 30, 2011, of our total 47 ETFs, only 19 ETFs had a five year track record and 39 had a three year track record. The investment performance of our funds is important to our success. While strong investment performance could stimulate sales of our ETFs, poor investment performance, on an absolute basis or as compared to third-party benchmarks or competitive products, could lead to a decrease in sales or stimulate redemptions, thereby lowering the assets under management and reducing our revenue. Our fundamentally-weighted equity ETFs are designed to provide the potential for better risk-adjusted investment returns over full market cycles and are best suited for investors with a longer-term investment horizon. However, the investment approach of our equity ETFs may not perform well during certain shorter periods of time during different points in the economic cycle.
29
Table of Contents
We currently depend on BNY Mellon to provide us with critical services to operate our business and the WisdomTree ETFs. The failure of BNY Mellon to adequately provide such services could materially affect our operating business and harm our customers.
We currently depend upon BNY Mellon to provide the WisdomTree Trust with portfolio management services. BNY Mellon also provides us with custody services, fund accounting, administration, transfer agency and securities lending services. The failure of BNY Mellon to provide us and the WisdomTree ETFs with these services could result in financial loss to us and our customers. In addition, because BNY Mellon provides a multitude of important services to us, and portfolio management for the WisdomTree ETFs covers several different asset classes, changing this vendor relationship would be challenging. It might require us to devote a significant portion of management’s time to negotiate a similar relationship with a new vendor or have these services provided by multiple vendors, which would require us to coordinate the transfer of these functions to this new vendor or vendors.
We currently depend on BNY Mellon to provide us with portfolio management services to the WisdomTree ETFs and changing this vendor relationship is not completely within our control and effecting a change would be challenging to us.
BNY Mellon currently serves as our sub-advisor and provides the WisdomTree Trust with portfolio management services. We cannot replace BNY Mellon as our sub-advisor without the approval of independent trustees of the WisdomTree Trust and the approval of the stockholders of the WisdomTree ETFs. Therefore our ability to replace BNY Mellon as sub-advisor is not completely within our control. In addition, because BNY Mellon provides portfolio management for several different asset classes, changing this vendor relationship would be challenging. It might require us to devote a significant portion of management’s time to negotiate a similar relationship with a new vendor or have these services provided by multiple vendors, which would require us to coordinate the transfer of this function to this new vendor or vendors.
We depend on other third parties to provide many critical services to operate our business and the WisdomTree ETFs. The failure of key vendors to adequately provide such services could materially affect our operating business and harm our customers.
In addition to BNY Mellon, we depend on other third-party vendors to provide us with many services that are critical to operating our business, including a third-party provider of index calculation services for our indexes, a distributor of the WisdomTree ETFs and a third-party provider of indicative values of the portfolios of the WisdomTree ETFs. The failure of these key vendors to provide us and the WisdomTree ETFs with these services could lead to operational issues and result in financial loss to us and our customers.
The asset management business is intensely competitive. Many of our competitors have greater market share, offer a broader range of products and have greater financial resources than we do. As a result, we may experience pressures on our pricing and market share.
Our business operates in intensely competitive industry segments. We compete directly with other ETF sponsors and mutual fund companies and indirectly against other investment management firms, insurance companies, banks, brokerage firms and other financial institutions that offer products that have similar features and investment objectives to those offered by us. We compete based on a number of factors, including name recognition, service, investment performance, product features and breadth of product choices, and fees. Many of our competitors have greater market share, offer a broader range of products and have greater financial resources than we do. Some financial institutions operate in a more favorable regulatory environment and have proprietary products and distribution channels which may provide certain competitive advantages to them and their investment products. Our competitors may also adopt products, services or strategies similar to ours, including the use of fundamentally-weighted indexes. In addition, over time certain sectors of the financial services industry have become considerably more concentrated, as financial institutions involved in a broad range of financial services have been acquired by or merged into other firms. This convergence could result in our competitors gaining greater resources and we may experience pressures on our pricing and market share as a result of these factors and as some of our competitors seek to increase market share by reducing prices. We believe that competition within the ETF industry will continue to increase as more traditional asset management companies become ETF sponsors.
Competitive fee pressures could reduce revenue and profit margins.
The investment management business is highly competitive and has relatively low barriers to entry. Although the ETF industry currently has a higher barrier to entry as a result of the need for ETF sponsors to obtain exemptive relief from the SEC in order to operate ETFs, we expect that additional companies, both new companies and traditional asset managers, many of whom are much larger than us, will enter the ETF space. In addition, in 2008, the SEC proposed a rule that, if adopted, would eliminate the need to obtain this exemptive relief. To the extent that we are forced to compete on the basis of price, we may not be able to maintain our current fee structure. Fee reductions on existing or future new products could cause our revenue and profit margins to decline.
30
Table of Contents
Our revenue could be adversely affected if the WisdomTree Trust determines that the advisory fees we received from the WisdomTree ETFs should be reduced.
Our advisory agreements with the WisdomTree Trust and the fees we collect from the WisdomTree ETFs are subject to review and approval by the independent trustees of the WisdomTree Trust. The advisory agreements are subject to initial review and approval. After the initial two-year term of the agreement for each ETF, the continuation of such agreement must be reviewed and approved at least annually by a majority of the independent trustees. In determining whether to approve the agreements, the independent trustees consider factors such as (i) the nature and quality of the services provided by us, (ii) the fees charged by us and the costs and profits realized by us in connection with such services, as well as any ancillary or “fall-out” benefits from such services, (iii) the extent to which economies of scale are shared with the WisdomTree ETFs, and (iv) the level of fees paid by other similar funds. If the independent trustees determine that the advisory fees we charge to any particular fund are too high, we will need to reduce our fees, which could adversely affect our revenue.
Our risk management policies and procedures, and those of our third-party vendors upon which we rely, may not be fully effective in identifying or mitigating risk exposure, including employee misconduct. If our policies and procedures do not adequately protect us from exposure to these risks, we may incur losses that would adversely affect our financial condition, reputation and market share.
We have developed risk management policies and procedures and we continue to refine them as we conduct our business. Many of our procedures involve oversight of third-party vendors that provide us with critical services such as portfolio management, custody and fund accounting and administration, and index calculation services. Our policies and procedures to identify, monitor and manage risks may not be fully effective in mitigating our risk exposure. Moreover, we are subject to the risks of errors and misconduct by our employees, including fraud and non-compliance with policies. These risks are difficult to detect in advance and deter, and could harm our business, results of operations or financial condition. Although we maintain insurance and use other traditional risk-shifting tools, such as third-party indemnification, in order to manage certain exposures, they are subject to terms such as deductibles, coinsurance, limits and policy exclusions, as well as risk of counterparty denial of coverage, default or insolvency. If our policies and procedures do not adequately protect us from exposure and our exposure is not adequately covered by insurance or other risk-shifting tools, we may incur losses that would adversely affect our financial condition and could cause a reduction in our revenue as our customers shift their investments to the products of our competitors.
Compliance with extensive, complex and changing regulation imposes significant financial and strategic costs on our business, and non-compliance could result in fines and penalties.
Our business is subject to extensive regulation of our business and operations. Our subsidiary, WisdomTree Asset Management, Inc., or WTAM, is a registered investment adviser and is subject to oversight by the SEC pursuant to its regulatory authority under the Investment Advisers Act of 1940, as amended. We also must comply with certain requirements under the Investment Company Act of 1940, as amended, with respect to the WisdomTree ETFs for which WTAM acts as investment adviser. In addition, the content and use of our marketing and sales materials and of our sales force is subject to the regulatory authority of FINRA. To a lesser extent, we are also subject to foreign laws and regulatory authorities with respect to operational aspects of our funds that invest in securities of issuers in foreign countries and in the sales of our funds in foreign jurisdictions. Each of the regulatory bodies with jurisdiction over us has regulatory powers dealing with many aspects of our business, including the authority to grant, and, in specific circumstances to cancel, permissions to carry on particular businesses. Our failure to comply with applicable laws or regulations could result in fines, censure, suspensions of personnel or other sanctions, including revocation of our registration as an investment adviser. Even if a sanction imposed against us or our personnel is small in monetary amount, the adverse publicity arising from the imposition of sanctions against us by regulators could harm our reputation and thus result in redemptions from our ETFs and impede our ability to retain customers and develop new customers, all of which may reduce our revenue.
We face the risk of significant intervention by regulatory authorities, including extended investigation activity, adoption of costly or restrictive new regulations and judicial or administrative proceedings that may result in substantial penalties. Among other things, we could be fined or be prohibited from engaging in some of our business activities. The requirements imposed by our regulators are designed to ensure the integrity of the financial markets and to protect customers and other third parties who deal with us, and are not designed to protect our stockholders. Consequently, these regulations often serve to limit our activities, including through customer protection and market conduct requirements.
In addition, the regulatory environment in which we operate is subject to modifications and further regulation. Recently, concerns have been raised about ETF’s alleged contribution to market volatility as well as the disclosure requirements applicable to certain types of more complex EFTs. New laws or regulations, or changes in the enforcement of existing laws or regulations, applicable to us and our clients also may adversely affect our business, and our ability to function in this environment will depend on our ability to constantly monitor and react to these changes. For example, in January 2011, the Commodity Futures Trading Commission proposed regulations that, if adopted, would impose upon us additional registration and licensing requirements for a select number of our ETFs and subject us to an additional and extensive regulatory structure. If adopted, these regulations would likely cause us to incur additional costs to achieve and maintain compliance.
31
Table of Contents
Specific regulatory changes also may have a direct impact on our revenue. In addition to regulatory scrutiny and potential fines and sanctions, regulators continue to examine different aspects of the asset management industry. New regulation or judicial interpretations regarding the annual approval process for investment advisory agreements may result in the reduction of fees under these agreements. These regulatory changes and other proposed or potential changes may result in a reduction of revenue.
Damage to our reputation could adversely affect our business.
We believe we have developed a strong brand and a reputation for innovative, thoughtful products, favorable long-term investment performance and excellent client services. The WisdomTree name and brand is a valuable asset and any damage to it could hamper our ability to maintain and grow our AUM and attract and retain employees, thereby having a material adverse affect on our revenue. Risks to our reputation may range from regulatory issues to unsubstantiated accusations. Managing such matters may be expensive, time-consuming and difficult.
Abnormally wide bid/ask spreads and market disruptions that halt or disrupt trading or create extreme volatility could undermine investor confidence in the ETF investment structure and limit investor acceptance of ETFs.
The shares of the WisdomTree ETFs, like the shares of all ETFs, trade on exchanges in market transactions that generally approximate the value of the underlying portfolio of securities held by the particular ETF. Trading involves risks including the potential lack of an active market for fund shares, abnormally wide bid/ask spreads (the difference between the prices at which shares of an ETF can be bought and sold) that can exist for a variety of reasons and losses from trading. These risks can be exacerbated during periods when there is low demand for an ETF, when the markets in the underlying basket of securities are closed, when markets conditions are extremely volatile or when trading is disrupted. For example, during the so-called “flash crash” that occurred in May 2010, the shares of some ETFs traded with extreme volatility that did not correspond with the underlying value of their portfolio investments. Similar market conditions could undermine investor confidence in the ETF structure as an investment vehicle and limit further investor acceptance of ETFs. This could result in limited growth or a reduction in the overall ETF market and result in our revenue not growing as rapidly as it has in the recent past or even in a reduction of revenue.
We have experienced significant growth in recent years, and if we were unable to manage this growth it could have a material adverse effect on our business.
We have experienced significant growth in recent years, which has placed increased demands on our management and other resources and will continue to do so in the future. We may not be able to maintain or accelerate our current growth rate, manage our expanding operations effectively or achieve planned growth on a timely or profitable basis. Managing our growth effectively will involve, among other things:
| • | continuing to retain, motivate and manage our existing employees and attract and integrate new employees; |
| • | developing, implementing and improving our operational, financial, accounting, reporting and other internal systems and controls on a timely basis; and |
| • | maintaining and developing our various support functions including human resources, information technology, legal and corporate communications. |
If we are unable to manage our growth effectively, there could be a material adverse effect on our ability to maintain or increase revenue and profitability.
Continued growth will require continued investment in personnel, information technology infrastructure and marketing activities, as well as further development and implementation of financial, operational and compliance systems and controls. We may not be successful in implementing all of the processes that are necessary to support our growth. Unless our growth results in an increase in our revenue that is at least proportionate to the increase in our costs associated with this growth, our gross margins and our future profitability will be adversely affected.
Our growth strategy also involves, among other things, diversifying our product line to include more ETFs in non-equity asset classes, including fixed income and alternative investment strategies. This will require us to develop products in areas in which we do not have significant prior experience. We may not be successful in developing new products and if developed and launched, we may not be successful in marketing these new products.
32
Table of Contents
Our ability to operate our company effectively could be impaired if we fail to retain or recruit key personnel.
The success of our business and the implementation of our growth strategy are highly dependent on our ability to attract, retain and motivate highly skilled, and sometimes highly specialized, employees, including in particular, operations, product development, research and sales personnel. The market for these individuals is extremely competitive and is likely to become more so as additional investment management firms enter the ETF industry. Our compensation methods may not enable us to recruit and retain required personnel. In particular, our use of equity grants as a component of total employee compensation may be ineffective if the market price of our common stock declines. Also, we may need to increase compensation levels, which would decrease our net income or increase our losses. If we are unable to retain and attract key personnel, it could have an adverse effect on our business, results of operations and financial condition.
Changes in U.S. federal income tax law could make some of our products less attractive to customers.
Many of the WisdomTree ETFs seek to obtain the investment return achieved by our proprietary indexes that weigh index components based upon dividends. Corporate dividends currently enjoy favorable tax treatment under current U.S. federal income tax law. If the tax rates imposed on dividends were to be increased, it may make these WisdomTree ETFs less attractive to our customers.
Our expenses are subject to fluctuations that could materially affect our operating results.
Our results of operations are also dependent on the level of expenses, which can vary from quarter to quarter. Our expenses may fluctuate primarily as a result of discretionary spending, including marketing, advertising and sales expenses we incur to support our growth initiatives. Accordingly, our results of operation may vary from quarter to quarter.
Any significant limitation or failure of our technology systems that are critical to our operations could interrupt or damage our operations and result in material financial loss, regulatory violations, reputational harm or legal liability.
We are dependent upon the effectiveness of our information security policies, procedures and capabilities to protect the technology systems that we use to operate our business and to protect the data that reside on or are transmitted through them. Although we take protective measures to secure information, our technology systems may still be vulnerable to unauthorized access, computer viruses or other events that could result in inaccuracies in our information or system disruptions or failures, which could materially interrupt or damage our operations. Any inaccuracies, delays or system failures could subject us to client dissatisfaction and losses or result in material financial loss, regulatory violations, reputational harm or legal liability, which, in turn, could cause a decline in the company’s earnings or stock price.
We may in the future be involved in legal proceedings that could require significant management time and attention, possibly resulting in significant expense or in an unfavorable outcome, which could have a material adverse effect on our business, financial condition, results of operations and cash flows.
From time to time, we may be subject to litigation. In connection with any litigation in which we are involved, we may be forced to incur costs and expenses in connection with defending ourselves or in connection with the payment of any settlement or judgment in connection therewith if there is an unfavorable outcome. The expense of defending litigation may be significant. The amount of time to resolve lawsuits is unpredictable and defending ourselves may divert management’s attention from the day-to-day operations of our business, which could adversely affect our business, results of operations and cash flows. In addition, an unfavorable outcome in any such litigation could have a material adverse effect on our business, results of operations and cash flows.
Catastrophic and unpredictable events could have a material adverse effect on our business.
A terrorist attack, war, power failure, cyber-attack, natural disaster or other catastrophic or unpredictable event could adversely affect our future revenue, expenses and operating results by: interrupting our normal business operations; sustaining employee casualties, including loss of our key employees; requiring substantial expenditures and expenses to repair, replace and restore normal business operations; and reducing investor confidence. We have a disaster recovery plan to address certain contingencies, but this plan may not be sufficient in responding or ameliorating the effects of all disaster scenarios. Similarly, these types of events could also affect the ability of the third-party vendors that we rely upon to conduct our business–e.g., BNY Mellon, which provides us with sub-advisory portfolio management services as well as custodial, fund accounting and administration services, or Standard & Poor’s, which provide us with index calculation services–to continue to provide these necessary services to us, even though they may also have disaster recovery plans to address these contingencies. If we or our third-party vendors are unable to respond adequately or in a timely manner, this failure may result in a loss of revenue and/or increased expenses, either of which would have a material adverse effect on our operating results.
33
Table of Contents
A change of control of our company would automatically terminate our investment management agreements relating to the WisdomTree ETFs unless the Board of Trustees of the WisdomTree Trust and stockholders of the WisdomTree ETFs voted to continue the agreements. A change in control could occur if a third party were to acquire controlling interest in our company, if Michael Steinhardt were to sell or otherwise transfer a certain portion of his shares or if we were to issue additional shares such that Steinhardt’s beneficial ownership were diluted.
Under the Investment Company Act, an investment management agreement with a fund must provide for its automatic termination in the event of its assignment. The fund’s board and stockholders must vote to continue the agreement following its assignment, the cost of which can be significant and which ordinarily would be borne by us in order to avoid dissatisfaction by the stockholders of the WisdomTree ETFs. Under the Investment Advisers Act, a client’s investment management agreement may not be “assigned” by the investment advisor without the client’s consent.
An investment management agreement is considered under both acts to be assigned to another party when a controlling block of the advisor’s securities is transferred. Under both acts, there is a presumption that a stockholder beneficially owning 25% or more of an advisor’s voting stock controls the advisor and conversely a stockholder beneficially owning less than 25% is presumed not to control the advisor. We cannot be certain that the Trustees and the stockholders of the WisdomTree ETFs would consent to assignments of our investment management agreements or approve new agreements with us if a change of control occurs. This restriction may discourage potential purchasers from acquiring a controlling interest in our company.
In addition, an assignment of our investment management agreements may occur if the beneficial ownership of our common stock by Michael Steinhardt, who currently beneficially owns 30.1% of our common stock, were to be reduced below 25%. This reduction could occur if Mr. Steinhardt were to sell or otherwise transfer shares of common stock, or if we sell or issue additional shares of common stock in the future that dilutes his beneficial ownership. Although we intend to commence the process to proactively obtain approval of the stockholders of the WisdomTree ETFs to continue our investment advisory agreements if Mr. Steinhardt’s ownership falls below the 25% threshold, we cannot be assured that such approval will be obtained.
We may be subject to claims of infringement of third-party intellectual property rights, which could harm our business.
Third parties may assert against us alleged patent, copyright, trademark or other intellectual property rights to intellectual property that is important to our business. Any claims that our products or processes infringe the intellectual property rights of others, regardless of the merit or resolution of such claims, could cause us to incur significant costs in responding to, defending and resolving such claims, and may divert the efforts and attention of our management from our business. As a result of such intellectual property infringement claims, we could be required or otherwise decide that it is appropriate to:
| • | pay third-party infringement claims; |
| • | discontinue selling the particular funds subject to infringement claims; |
| • | discontinue using the processes subject to infringement claims; |
| • | develop other intellectual property or products not subject to infringement claims, which could be time-consuming and costly or may not be possible; or |
| • | license the intellectual property from the third party claiming infringement, which license may not be available on commercially reasonable terms. |
The occurrence of any of the foregoing could result in unexpected expenses, reduce our revenue and adversely affect our business and financial results.
We have applied for patents, but they may not be issued and we may not be able to enforce or protect our patents and other intellectual property rights, which may harm our ability to compete and harm our business.
Although we have applied for patents relating to our index methodology and the operation of our equity ETFs, these patents may not be issued to us. In addition, even if issued, our ability to enforce our patents and other intellectual property rights is subject to general litigation risks. While we have been competing without the benefit of these patents being issued, if they are not issued or we cannot successfully enforce them, we may lose the benefit of a future competitive advantage that they would otherwise provide to us. If we seek to enforce our rights, we could be subject to claims that the intellectual property right is invalid or is otherwise not enforceable. Furthermore, our assertion of intellectual property rights could result in the other party seeking to assert alleged intellectual property rights of its own or assert other claims against us, which could harm our business. If we are not ultimately successful in defending ourselves against these claims in litigation, we may be subject to the risks described in the immediately preceding risk factor entitled “We may be subject to claims of infringement of third-party intellectual property rights, which could harm our business.”
34
Table of Contents
Fulfilling our public company financial reporting and other regulatory obligations will be expensive and time consuming.
As a company whose common stock was recently registered under the Exchange Act and listed on a national securities exchange, we are required to maintain specific corporate governance practices and adhere to a variety of reporting requirements and complex accounting rules under the Sarbanes-Oxley Act of 2002, or SOX, and the related rules and regulations of the SEC, as well as the rules of the securities exchange. We anticipate that compliance with these requirements will cause us to continue to incur significant legal and accounting compliance costs, and place significant demands on our accounting and legal staff, and on our accounting and information systems. We expect to hire additional staff with appropriate public company experience and technical knowledge, which will increase our compensation expense.
Beginning with the fiscal year ended December 31, 2012, our management will be required to conduct an annual assessment of the effectiveness of our internal controls over financial reporting and include a report on our internal controls in our annual reports on Form 10-K pursuant to Section 404 of SOX. In addition, we are required to have our independent registered public accounting firm attest to and report on the effectiveness of our internal controls over financial reporting. We will incur significant costs in order to implement and maintain our internal controls over financial reporting and comply with Section 404 of SOX, including necessary auditing and legal fees, and costs associated with accounting, internal audit, information technology, compliance and administrative staff.
We may face risks arising from future acquisitions and our efforts to acquire companies may subject us to significant costs without the realization of the anticipated benefits of those acquisitions.
We may acquire other companies in the future. Any such acquisition may be effected quickly, may occur at any time and may be significant in size relative to our existing operations. These acquisitions may involve numerous risks, including, among others:
| • | failure to achieve financial or operating objectives; |
| • | failure to integrate successfully and in a timely manner any operations, products, services or technology; |
| • | diversion of the attention of management and other personnel; |
| • | failure to obtain necessary regulatory or other approvals; |
| • | failure to retain personnel; |
| • | failure to obtain any necessary financing on acceptable terms or at all; |
| • | unforeseen liabilities of the acquired entity; |
| • | failure of counterparties to indemnify us against liabilities arising from the acquired entities; and |
| • | unfavorable market conditions that could negatively impact our growth expectations of the acquired entities. |
These risks, and the overall failure to successfully manage any potential acquisition, could adversely affect our future profitability and may prevent us from realizing expected benefits from the acquisitions, which could result in the impairment of goodwill and/or intangible assets recognized at the time of acquisition.
Risks Relating to our Common Stock
The market price of our shares may fluctuate significantly.
The market price of our common stock may fluctuate widely, depending upon many factors, some of which may be beyond our control, including:
| • | decreases in our assets under management; |
| • | variations in our quarterly operating results; |
| • | differences between our actual financial operating results and those expected by investors and analysts; |
| • | publication of research reports about us or the investment management industry; |
| • | changes in expectations concerning our future financial performance and the future performance of the ETF industry and the asset management industry in general, including financial estimates and recommendations by securities analysts; |
| • | our strategic moves and those of our competitors, such as acquisitions or consolidations; |
| • | changes in the regulatory framework of the ETF industry and the asset management industry in general and regulatory action, including action by the SEC to lessen the regulatory requirements or shortening the process to obtain regulatory relief under the Investment Company Act of 1940, as amended that is necessary to become an ETF sponsor; |
| • | changes in general economic or market conditions; and |
| • | realization of any other of the risks described elsewhere in this section. |
35
Table of Contents
In addition, stock markets in general have experienced volatility that has often been unrelated to the operating performance of a particular company. These broad market fluctuations may adversely affect the trading price of our common stock. Furthermore, in the past, market fluctuations and price declines in a company’s stock have led to securities class action litigations or other derivative shareholder lawsuits. If such a suit were to arise, it could cause substantial costs to us and divert our resources regardless of the outcome.
Future sales of our common stock in the public market by management or our large stockholders could lower our stock price.
Our two largest stockholders (each of whom has a representative on our Board of Directors), together with the other members of our Board of Directors and our executive officers, beneficially own approximately 58.2% of our outstanding common stock. If these stockholders sell, or indicate an intent to sell, substantial amounts of our common stock in the public market, the trading price of our common stock may decline significantly. On October 17, 2011, we filed a Registration Statement on Form S-1 to provide for the underwritten public offering of a portion of these shares. We cannot predict the effect, if any, that future public sales of these shares of the availability of these shares for sale will have on the market price of our common stock.
If equity research analysts do not publish research or reports about our business or if they issue unfavorable commentary or downgrade our common stock, the price of our common stock could decline.
The trading market for our common stock relies in part on the research and reports that equity research analysts publish about us and our business. We do not control these analysts. The price and trading volume of our common stock could decline if one or more equity analysts downgrade our common stock or if analysts issue other unfavorable commentary or cease publishing reports about us or our business.
Future issuance of our common stock could lower our stock price and dilute the interests of existing stockholders.
We may issue additional shares of our common stock in the future, either in connection with an acquisition or for other business reasons. The issuance of a substantial amount of common stock could have the effect of substantially diluting the interests of our current stockholders. In addition, the sale of a substantial amount of common stock in the public market, either in the initial issuance or in a subsequent resale by the target company in an acquisition which received such common stock as consideration or by investors who acquired such common stock in a private placement could have an adverse affect on the market price of our common stock.
The members of our Board of Directors, their affiliates and our executive officers, as stockholders, control our company.
Our two largest stockholders (each of whom has a representative on our Board of Directors) together with the other members of our Board of Directors and our executive officers, as stockholders, collectively beneficially own 58.2 % of our outstanding common stock. As a result of this ownership, they have the ability to control all matters requiring approval by stockholders of our company, including the election of directors. In particular, Michael Steinhardt, chairman of our Board of Directors, beneficially owns 30.1% of our outstanding common stock and James D. Robinson, IV, a director of our company, serves as a general partner of three venture capital funds that together beneficially owns 17.4% of our outstanding common stock. As a result, Messrs. Steinhardt and Robinson beneficially own an aggregate of 47.5% of our outstanding stock and have the ability to significantly influence all matters requiring approval by stockholders of our company. This concentration of ownership also may have the effect of delaying or preventing a change in control of our company that may be favored by other stockholders. This could prevent transactions in which stockholders might otherwise receive a premium for their shares over current market prices. Although our directors and officers have a duty of loyalty to us under Delaware law and our amended and restated certificate of incorporation, transactions that we enter into in which a director or officer has a conflict of interest are generally permissible so long as (1) the material facts relating to the director’s or officer’s relationship or interest as to the transaction are disclosed to our Board of Directors and a majority of our disinterested directors, or a committee consisting solely of disinterested directors, approves the transaction, (2) the material facts relating to the director’s or officer’s relationship or interest as to the transaction are disclosed to our stockholders and a majority of our disinterested stockholders approves the transaction, or (3) the transaction is otherwise fair to us. Under our certificate of incorporation, representatives of our stockholders are not required to offer to us any transaction opportunity of which they become aware and could take any such opportunity for themselves or offer it to other companies in which they have an investment, unless such opportunity is expressly offered to them solely in their capacity as a director of ours.
A provision in our certificate of incorporation and by-laws may prevent or delay an acquisition of our company, which could decrease the market value of our common stock.
Provisions of Delaware law, our amended and restated certificate of incorporation and our amended and restated by-laws may discourage, delay or prevent a merger, acquisition or other change in control that stockholders may consider favorable. These provisions may also prevent or delay attempts by stockholders to replace or remove our current management or members of our Board of Directors. These provisions include:
| • | a classified Board of Directors; |
36
Table of Contents
| • | limitations on the removal of directors; |
| • | advance notice requirements for stockholder proposals and nominations; |
| • | the inability of stockholders to act by written consent or to call special meetings; |
| • | the ability of our Board of Directors to make, alter or repeal our amended and restated by-laws; and |
| • | the authority of our Board of Directors to issue preferred stock with such terms as our Board of Directors may determine. |
In addition, with the listing of our common stock on the NASDAQ Global Market on July 26, 2011, we are subject to the provisions of Section 203 of the Delaware General Corporation Law, which limits business combination transactions with stockholders of 15% or more of our outstanding voting stock that our Board of Directors has not approved. These provisions and other similar provisions make it more difficult for stockholders or potential acquirers to acquire us without negotiation. These provisions may apply even if some stockholders may consider the transaction beneficial to them.
As a result, these provisions could limit the price that investors are willing to pay in the future for shares of our common stock. These provisions might also discourage a potential acquisition proposal or tender offer, even if the acquisition proposal or tender offer is at a premium over the then current market price for our common stock.
We do not intend to pay dividends in the foreseeable future.
We have never paid dividends on our common stock and we intend to invest our available cash flow into our growth strategy for the foreseeable future. Thus, the shares of common stock may not realize a return in the form of dividends in the foreseeable future. Investors who anticipate the need for immediate dividends from shares of common stock should refrain from purchasing our common stock. In addition, our Board of Directors is authorized, without stockholder approval, to issue preferred stock with such terms as our Board of Directors may, in its discretion, determine. Our Board of Directors could, therefore, issue preferred stock with dividend rights superior to that of the common stock, which could also limit the payment of dividends on the common stock.
| ITEM 2. | UNREGISTERED SALES OF EQUITY SECURITIES AND USE OF PROCEEDS |
Set forth below is information regarding shares of capital stock issued and options granted by us during the third quarter of 2011. Also included is the consideration, if any, received by us for such shares and options and information relating to the section of the Securities Act, or rules of the SEC under which exemption from registration was claimed. No underwriters were involved in any of the following sales of securities.
Recent Sales of Unregistered Securities
Issuances to Employees, Consultants and Non-Employee Directors
On September 2, 2011 the Company registered 26,193,531 shares of common stock underlying its various equity compensation plans and amendments.
During the third quarter of 2011, from July 1, 2011 through September 1, 2011, the issuance of stock options as described below were issued pursuant to written compensatory benefit plans or arrangements with our employees, directors and senior board advisors not involving public offerings in reliance on the exemption provided by Rule 701 promulgated under the Securities Act or Section 4(2) of the Securities Act.
During the third quarter of 2011, from July 1, 2011 through September 1, 2011, we issued an aggregate of 130,000 options to purchase shares of our common stock to our employees at exercise prices ranging from $6.43 to $7.77. These options were issued without cash consideration and become exercisable over four years based upon continued employment.
Use of Proceeds
Not applicable.
37
Table of Contents
Purchase of Equity Securities by the Issuer and Affiliated Purchasers
The following table provides information with respect to purchases made by or on behalf of the Company or any “affiliated purchaser” of shares of the Company’s common stock.
| (In thousands, except per share data) | ||||||||||||||||
| Period |
Total Number of Shares Purchased (1) |
Average Price Paid Per Share (1) |
Total Number of Shares Purchased as Part of Publicly Announced Plans or Programs |
Approximate Dollar Value of Shares that May Yet Be Purchased Under the Plans or Programs |
||||||||||||
| July 1, 2011 to July 31 2011 |
— | $ | — | — | $ | — | ||||||||||
| August 1, 2011 to August 31, 2011 |
37 | $ | 8.09 | — | $ | — | ||||||||||
| September 1, 2011 to September 30, 2011 |
1 | $ | 8.62 | — | $ | — | ||||||||||
|
|
|
|
|
|||||||||||||
| Total |
38 | $ | 8.10 | |||||||||||||
|
|
|
|
|
|||||||||||||
| (1) | The identified shares reflect restricted shares withheld pursuant to the terms of awards granted to employees to offset tax withholding obligations that occur upon vesting and release of the restricted share. The value of the shares withheld is based upon the volume weighted average price of the common stock on the date of vesting. During the three months ended September 30, 2011, the Company repurchased 37,858 restricted shares of Company stock withheld pursuant to the terms of awards granted to employees to offset tax withholding obligations for an aggregate price of $306,649 with an average price per share of $8.10. |
38
Table of Contents
| ITEM 6. | EXHIBITS |
| Exhibit No. |
Description |
Reference | ||||||
| 3.1 | (1 | ) | Form of Amended and Restated Certificate of Incorporation. | 3.1 | ||||
| 3.2 | (1 | ) | Amended and Restated Bylaws. | 3.2 | ||||
| 4.1 | (1 | ) | Specimen Common Stock Certificate. | 4.1 | ||||
| 4.2 | (1 | ) | Amended and Restated Stockholders Agreement among Registrant and certain investors dated December 21, 2006. | 4.2 | ||||
| 4.3 | (1 | ) | Securities Purchase Agreement among Registrant and certain investors dated December 21, 2006. | 4.3 | ||||
| 4.4 | (1 | ) | Securities Purchase Agreement among Registrant and certain investors dated October 15, 2009. | 4.4 | ||||
| 4.5 | (1 | ) | Third Amended and Restated Registration Rights Agreement dated October 15, 2009. | 4.5 | ||||
| 10.1 | (1 | ) † | Amended and Restated Employment Agreement between WisdomTree Asset Management, Inc. and Bruce Lavine dated as of May 24, 2011. | 10.31 | ||||
| 10.2 | (1 | ) † | Amended and Restated Employment Agreement between WisdomTree Asset Management, Inc. and Peter M. Ziemba dated as of May 24, 2011. | 10.32 | ||||
| 10.3 | (1 | ) † | Amended and Restated Employment Agreement between WisdomTree Asset Management, Inc. and Amit Muni dated as of May 24, 2011. | 10.33 | ||||
| 10.34 | (1 | ) | Form of Indemnification Agreement for Officers and Directors. | 10.35 | ||||
| 31.1 | (2 | ) | Certification of Chief Executive Officer and Principal Executive Officer pursuant to Rules 13a-14 of the Exchange Act. | |||||
| 31.2 | (2 | ) | Certification of Chief Financial Officer and Principal Accounting Officer pursuant to Rules 13a-14 of the Exchange Act. | |||||
| 32 | (2 | ) | Section 1350 Certification. | |||||
| 101.INS | (2 | )* | XBRL Instance Document | |||||
| 101.SCH | (2 | )* | XBRL Taxonomy Extension Schema Document | |||||
| 101.CAL | (2 | )* | XBRL Taxonomy Extension Calculation Linkbase Document | |||||
| 101.DEF | (2 | )* | XBRL Taxonomy Extension Definition Linkbase Document | |||||
| 101.LAB | (2 | )* | XBRL Taxonomy Extension Labels Linkbase Document | |||||
| 101.PRE | (2 | )* | XBRL Taxonomy Extension Presentation Linkbase Document | |||||
| (1) | Incorporated by reference from the Registrant’s Registration Statement on Form 10, filed with the SEC on March 31, 2011. |
| (2) | Filed herewith |
| † | Indicates management contract or compensatory plan or arrangement |
| * | Pursuant to Rule 406T, the interactive data files in Exhibit 101 hereto are deemed not filed or a part of a registration statement or prospectus for purposes of Section 11 or 12 of the Securities Act of 1933, as amended, are deemed not filed for purposes of Section 18 of the Securities Exchange Act of 1934, as amended ,and otherwise is not subject to liability under these sections and shall not be incorporated by reference into any registration statement or other document filed under the Securities Act of 1933, as amended, except as expressly set forth by specific reference in such filing. |
39
Table of Contents
SIGNATURE
Pursuant to the requirements of the Securities Exchange Act of 1934, the registrant has duly caused this Report to be signed on its behalf by the undersigned thereunto duly authorized on this 8th day of November, 2011.
| WISDOMTREE INVESTMENTS, INC. | ||
| By: | /s/ AMIT MUNI | |
| Amit Muni | ||
|
Executive Vice President—Finance and Chief Financial Officer (Authorized Officer and Principal Financial Officer) | ||
40