Attached files
| file | filename |
|---|---|
| EX-99.1 - FORM 8K EXHIBIT 99.1 - PPL Corp | form8k-exhibit99_1.htm |
| 8-K - FORM 8K - PPL Corp | form8k.htm |

©PPL Corporation 2011
EEI Financial Conference
Orlando, FL
November 6 - 9, 2011
©PPL Corporation 2011

©PPL Corporation 2011
2
Cautionary Statements and Factors
That May Affect Future Results
That May Affect Future Results
Any statements made in this presentation about future
operating results or other future events are forward-looking
statements under the Safe Harbor Provisions of the Private
Securities Litigation Reform Act of 1995. Actual results may
differ materially from such forward-looking statements. A
discussion of factors that could cause actual results or events
to vary is contained in the Appendix to this presentation and
in the Company’s SEC filings.
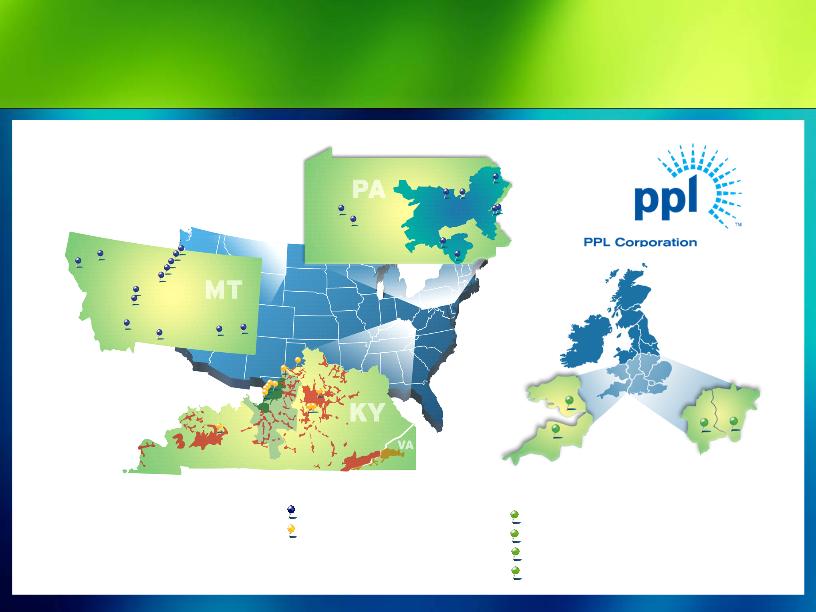
Exhibit 99.2
3
PPL Delivery and Generation Assets
United Kingdom delivery territories:
WPD (South Wales)
WPD (South West)
WPD (West Midlands)
WPD (East Midlands)
United Kingdom delivery territories:
Delivery territories:
•
PPL Electric Utilities
•
Kentucky Utilities
•
Louisville Gas and Electric
Delivery territories:
•
PPL Electric Utilities
•
Kentucky Utilities
•
Louisville Gas and Electric
Delivery territories:
•
PPL Electric Utilities
•
Kentucky Utilities
•
Louisville Gas and Electric
United Kingdom delivery territories:
Generation assets:
Competitive power plants
Regulated power plants
Generation assets:
Regulated power plants
Generation assets:
Regulated power plants

©PPL Corporation 2011
4
Investment Highlights
Predominantly rate-regulated business mix with significant growth prospects
Operations in constructive jurisdictions
Approximately two-thirds of regulated capital expenditures earn real-time or near real-time
returns
returns
~ 9% compound annual growth in rate base from 2011 to 2015
Expect 75% of 2013 EBITDA from regulated businesses
Highly attractive competitive generation fleet
Competitively positioned nuclear, hydro and efficient coal
Complemented by flexible dispatch gas fired units
No significant exposure to currently proposed environmental regulations
Multiple drivers of significant upside
Increasing natural gas prices
Increasing heat rates
Environmental regulation
Business Risk Profile rated “Excellent” by S&P
Stable ratings outlooks
Secure dividend with strong platform for future growth
©PPL Corporation 2011
5
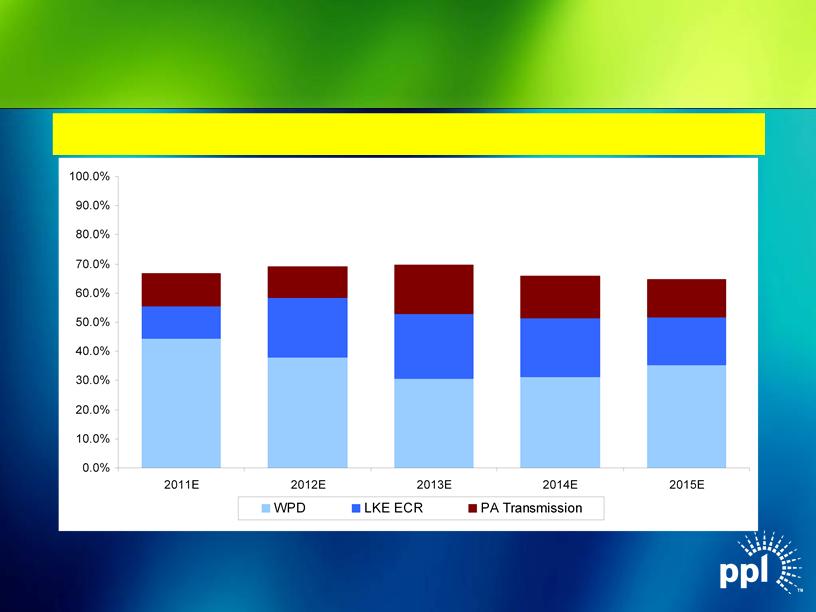
(1)
(2)
67%
$0.8
$0.2
$0.2
69%
$1.1
$0.6
$0.3
69%
$0.6
$0.8
$1.1
66%
$1.1
$0.7
$0.5
65%
$1.1
$0.5
$0.4
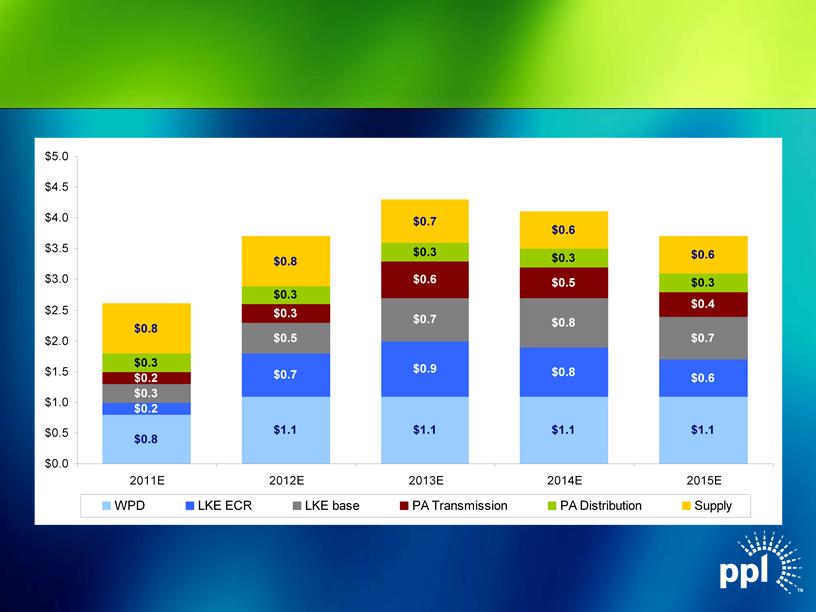
Note: $ in billions.
(1) Includes capex for WPD Midlands. Figures based on assumed exchange rate of $1.60 / GBP.
(1)
Real-Time Recovery of Regulated
Capex Spending
Capex Spending
Approximately two-thirds of regulated capital expenditures earn returns
subject to minimal or no regulatory lag
subject to minimal or no regulatory lag

©PPL Corporation 2011
6
Midlands Integration
Goal: Improved Performance…
Safety
Network performance
Contact center
Complaint handling
…resulting in cost efficiencies and potential
long-term revenue bonuses
long-term revenue bonuses

©PPL Corporation 2011
7
Midlands Integration - Actions to Date
Road shows completed for 3,900 Midlands staff setting out WPD
background values and approach to integration - 36 presentations over 9
days
background values and approach to integration - 36 presentations over 9
days
Organizational design completed
85% of union staff voted to move to single set of WPD labor contract
terms
terms
Staff allocated new roles
Redundancy notices sent
Systems integration on track

©PPL Corporation 2011
8
Midlands Integration - Improved Safety
|
|
2010/11
(April to Sep 2010)
|
2011/12
(April to Sep 2011)
|
|
Lost Time
Accidents |
9
|
1
|
|
Non Lost Time
Accidents |
52
|
50
|
©PPL Corporation 2011
9
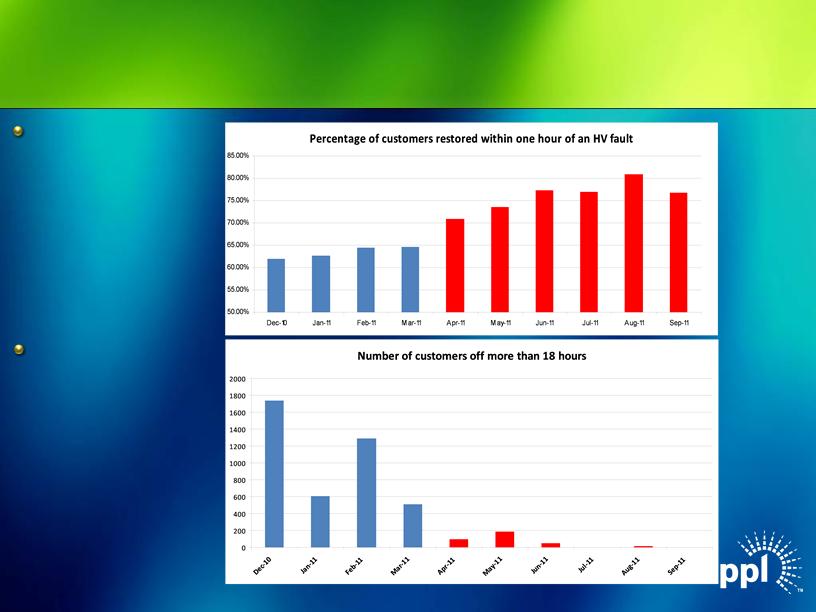
Midlands Integration - Improved
Network Performance
Network Performance
Target 60:
18 Hour Standard:
©PPL Corporation 2011
10
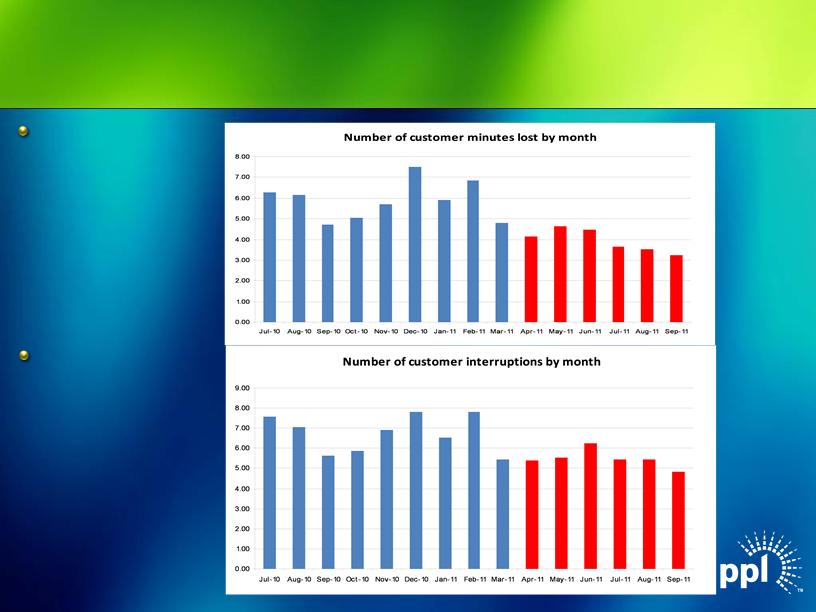
Midlands Integration - Improved
Network Performance (cont’d)
Network Performance (cont’d)
Customer
Minutes Lost:
Minutes Lost:
Customer
Interruptions:
Interruptions:
©PPL Corporation 2011
11
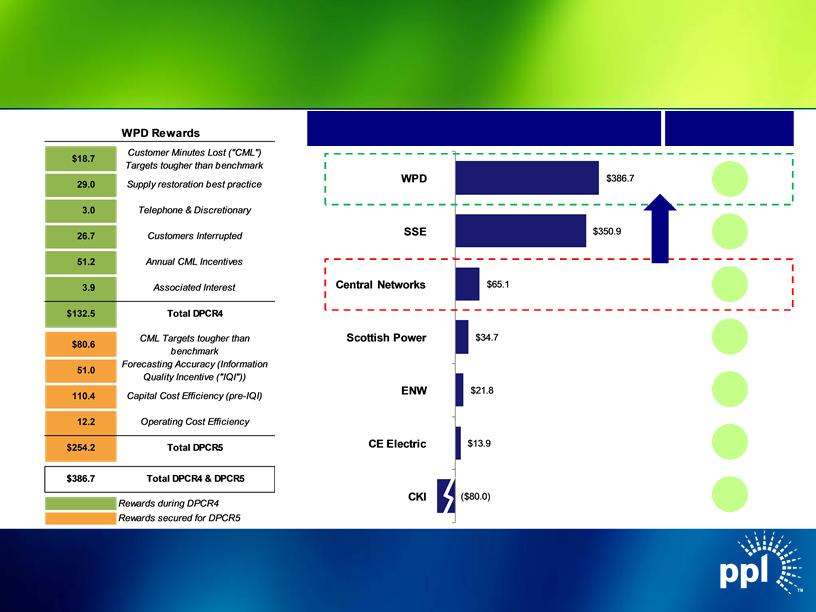
WPD Performance Rewards Top in Industry
Aggregate Total Award / Penalty ($ in millions)
Aggregate as % of
DPCR4 Revenue
DPCR4 Revenue
Source: Ofgem data.
Note: Figures based on assumed exchange rate of $1.60 / GBP.
12.3%
7.1%
1.4%
0.8%
1.0%
0.4%
(3.9%)
Improvement
Opportunity
Opportunity
11 WPD Performance Rewards Top in Industry WPD Performance Rewards Top in Industry $13.9 $ 21.8 $34.7 $65.1 $350.9 $386.7 CKI CE Electric ENW Scottish Power Central Networks SSE WPD ($ 80.0) Aggregate Total Award / Penalty ($ in millions) Aggregate as % of DPCR4 Revenue Source: Ofgem data. Note: Figures based on assumed exchange rate of $1.60 / GBP. $18.7 Customer Minutes Lost ( " CML" ) Targets tougher than benchmark 29.0 Supply restoration best practice 3.0 Telephone & Discretionary 26.7 Customers Interrupted 51.2 Annual CML Incentives 3.9 Associated Interest $132.5 Total DPCR4 $80.6 CML Targets tougher than benchmark 51.0 Forecasting Accuracy (Information Quality Incentive ( " IQI" ) ) 110.4 Capital Cost Efficiency ( pre- IQI) 12.2 Operating Cost Efficiency $254.2 Total DPCR5 $386.7 Total DPCR4 & DPCR5 Rewards during DPCR4 Rewards secured for DPCR5 WPD Rewards 12.3% 7.1% 1.4% 0.8% 1.0% 0.4% (3.9% ) Improvement Opportunity ©PPL Corporation 2011 1 WPD Performance Rewards Top in Industry WPD Performance Rewards Top in Industry $13.9 $ 21.8 $34.7 $65.1 $350.9 $386.7 CKI CE Electric ENW Scottish Power Central Networks SSE WPD ($ 80.0) Aggregate Total Award / Penalty ($ in millions) Aggregate as % of DPCR4 Revenue Source: Ofgem data. Note: Figures based on assumed exchange rate of $1.60 / GBP. $18.7 Customer Minutes Lost ( " CML" ) Targets tougher than benchmark 29.0 Supply restoration best practice 3.0 Telephone & Discretionary 26.7 Customers Interrupted 51.2 Annual CML Incentives 3.9 Associated Interest $132.5 Total DPCR4 $80.6 CML Targets tougher than benchmark 51.0 Forecasting Accuracy (Information Quality Incentive ( " IQI" ) ) 110.4 Capital Cost Efficiency ( pre- IQI) 12.2 Operating Cost Efficiency $254.2 Total DPCR5 $386.7 Total DPCR4 & DPCR5 Rewards during DPCR4 Rewards secured for DPCR5 WPD Rewards 12.3% 7.1% 1.4% 0.8% 1.0% 0.4% (3.9% ) Improvement Opportunity
©PPL Corporation 2011
12
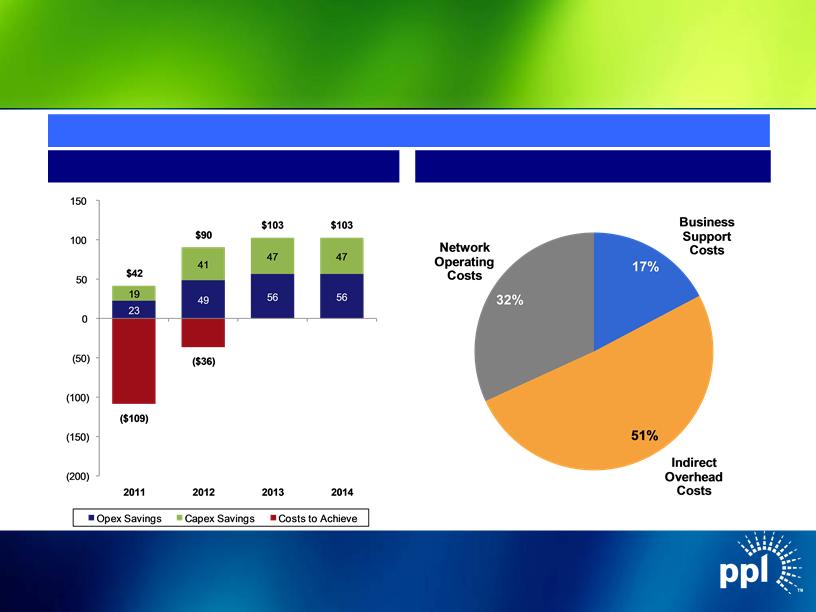
Significant Synergy Opportunity
100% Synergies retained through end of current rate period(1); 47% in following rate period(2)
Estimated Annual Pre-Tax Synergies
Opex Synergies by Category
Note: Figures based on assumed exchange rate of $1.60 / GBP.
(1) Ends in March 2015.
(2) Expected to end in March 2023.
$ in millions

©PPL Corporation 2011
13
Kentucky Regulated
Environmental Cost Recovery (ECR) Mechanism
ECR allows real-time return of and on environmental investment
(including CWIP) and recovery of environmental expenses
associated with coal-fired generation
(including CWIP) and recovery of environmental expenses
associated with coal-fired generation
Total Capital Expenditure Plan - $2.5 Billion
LG&E - $1.4 Billion
KU - $1.1 Billion
No impact from EPA’s recent modifications to CSAPR allocations
KPSC ruling expected in mid-December

©PPL Corporation 2011
14
Pennsylvania Regulated - Transmission
PPL Electric to build Pennsylvania
portion of the 150-mile
Susquehanna to Roseland, NJ
500 kV transmission line. New
Jersey portion of the line to be
built by PSEG
portion of the 150-mile
Susquehanna to Roseland, NJ
500 kV transmission line. New
Jersey portion of the line to be
built by PSEG
Already approved by both PA and
NJ state utility commissions
NJ state utility commissions
ROE of 12.93%
Currently under review by
National Park Service
National Park Service
Expected in-service date in the
spring of 2015
spring of 2015
Named to initial list of projects for federal Rapid Response Team for Transmission
Susquehanna-Roseland Transmission Line

©PPL Corporation 2011
15
Pennsylvania Regulated - Distribution
House Bill 1294 - Alternative Ratemaking
Bill provides for timely recovery of costs for a broad
range of capital projects geared toward improving and
maintaining safety and reliability
range of capital projects geared toward improving and
maintaining safety and reliability
Passed House on Oct. 4
Currently being reviewed by the Consumer Protection
and Professional Licensure Committee (Senate)
and Professional Licensure Committee (Senate)

©PPL Corporation 2011
16
Supply Market Fundamentals
Coal Retirements in PJM
7 - 17 GWs of PJM coal-fired capacity at-risk for retirement by 2019.
Most at an average age of 50 years, are under 500 MWs, and have capacity
factors around 30%
factors around 30%
~ 50% located in western PJM
Price Impact
Anticipate an increase in PJM West Hub prices
Actual increase difficult to predict currently as:
The allowance market is not yet functioning
Retrofit costs and operational adjustments are not fully incorporated
Heat rates will likely expand as coal-fired generation either retires or backs down
PPL Impact
PJM Fleet - Well-positioned to capture anticipated increases in PJM
pricing while having minimal impacts on operations.
pricing while having minimal impacts on operations.
©PPL Corporation 2011
17
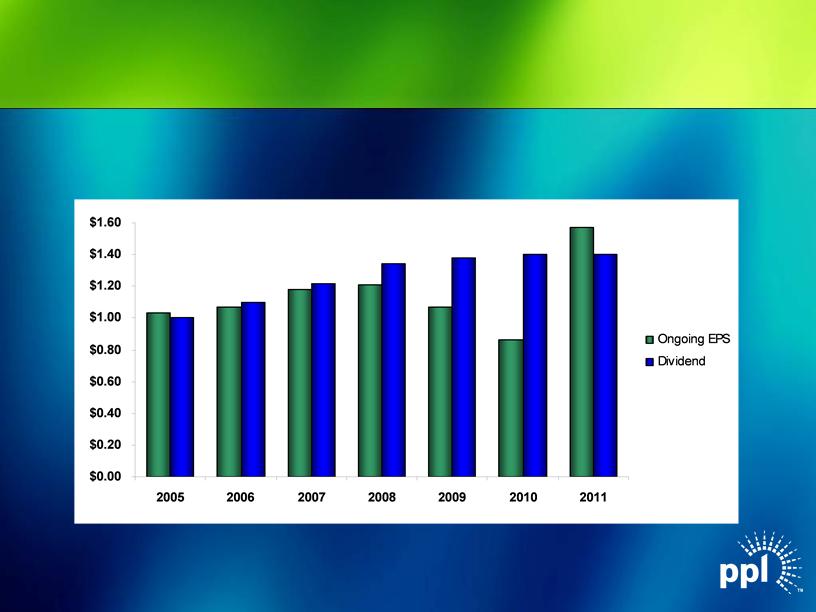
Dividend Profile
A significantly more rate-regulated business mix provides strong
support for current dividend and a platform for future growth
support for current dividend and a platform for future growth
(1) Ongoing EPS based on mid-point of forecast. Annualized dividend based on 3rd quarter declaration. Actual dividends to
be determined by Board of Directors.
be determined by Board of Directors.
(2) From only regulated segments.
$/Share
Annualized
(2)
(1)

©PPL Corporation 2011
18
Appendix
©PPL Corporation 2011
19
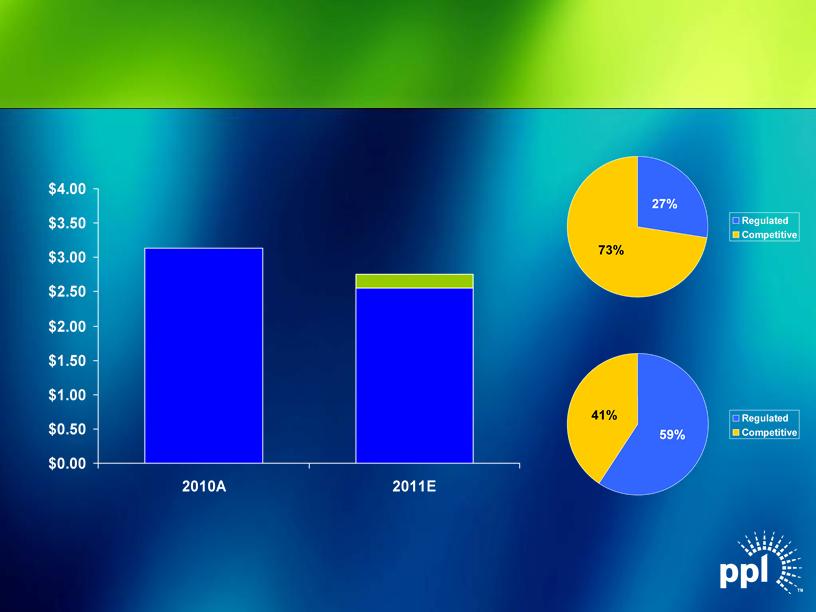
$3.13
$2.75
$/Share
(1) Based on mid-point of forecasted earnings range.
Note: See appendix for reconciliation of earnings from ongoing operations to reported earnings.
(1)
$2.55
2010A
2011E
Increased 2011 Earnings from Ongoing
Operations Forecast
Operations Forecast
©PPL Corporation 2011
20
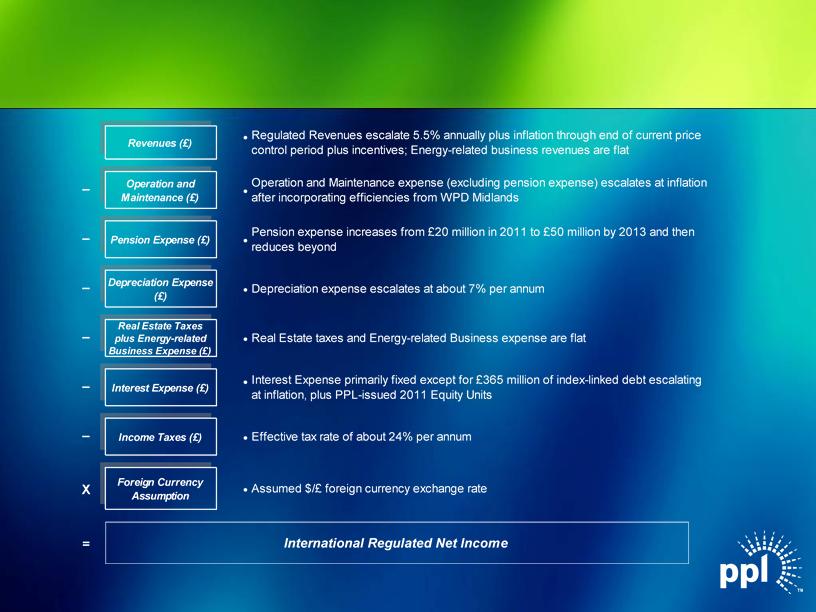
International - Modeling Parameters
20 International International –– Modeling Parameters Modeling Parameters – – – – – – X = Revenues ( £ ) . Regulated Revenues escalate 5.5% annually plus inflation through end of current price control period plus incentives; Energy related business revenues are flat . Operation and Maintenance expense ( excluding pension expense) escalates at inflation after incorporating efficiencies from WPD Midlands Pension expense increases from £20 million in 2011 to £50 million by 2013 and then reduces beyond Operation and Maintenance ( £ ) Pension Expense ( £ ) .. Interest Expense ( £ ) Income Taxes ( £ ) Depreciation expense escalates at about 7% per annum Interest Expense primarily fixed except for £ 365 million of index linked debt escalating at inflation, plus PPL issued 2011 Equity Units .. Effective tax rate of about 24% per annum Real Estate taxes and Energy related Business expense are flat Depreciation Expense (£ ) Real Estate Taxes plus Energy related Business Expense (£ ) . International Regulated Net Income Foreign Currency Assumption. Assumed $/ £ foreign currency exchange rate ©PPL Corporation 2011 2 International International –– Modeling Parameters Modeling Parameters – – – – – – X = Revenues ( £ ) . Regulated Revenues escalate 5.5% annually plus inflation through end of current price control period plus incentives; Energy related business revenues are flat . Operation and Maintenance expense ( excluding pension expense) escalates at inflation after incorporating efficiencies from WPD Midlands Pension expense increases from £20 million in 2011 to £50 million by 2013 and then reduces beyond Operation and Maintenance ( £ ) Pension Expense ( £ ) .. Interest Expense ( £ ) Income Taxes ( £ ) Depreciation expense escalates at about 7% per annum Interest Expense primarily fixed except for £ 365 million of index linked debt escalating at inflation, plus PPL issued 2011 Equity Units .. Effective tax rate of about 24% per annum Real Estate taxes and Energy related Business expense are flat Depreciation Expense (£ ) Real Estate Taxes plus Energy related Business Expense (£ ) . International Regulated Net Income Foreign Currency Assumption. Assumed $/ £ foreign currency exchange rate
©PPL Corporation 2011
21
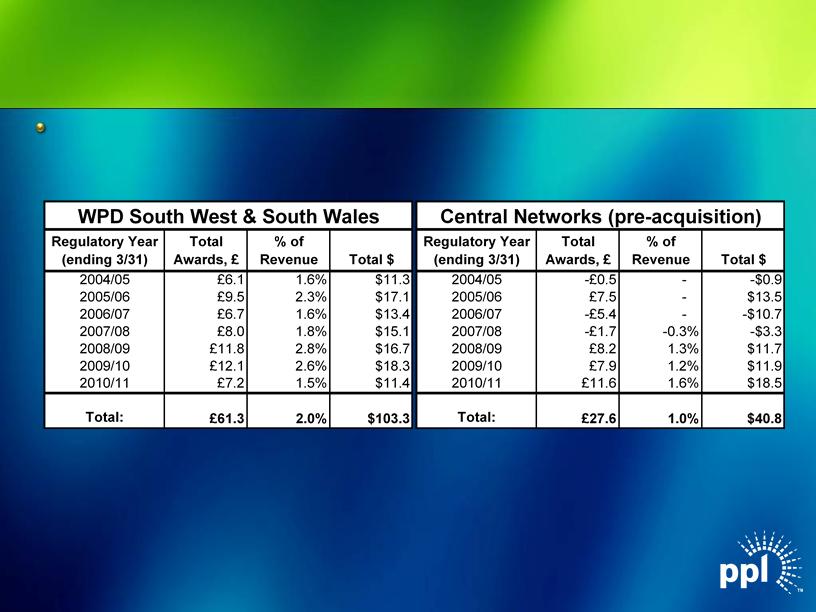
WPD - Annual Revenue Performance Bonuses
WPD has earned over $100 million in annual performance awards over the past
7-year regulatory period, excluding Central Networks historical performance
7-year regulatory period, excluding Central Networks historical performance
Annual Revenue Performance Bonuses Annual Revenue Performance Bonuses Annual Revenue Performance Bonuses WPD has earned over $100 million in annual performance awards over the past 7-year regulatory period, excluding Central Networks historical performance WPD South West & South Wales Central Networks (pre-acquisition) Regulatory Year ( ending 3/31) Total Awards, £ % of Revenue Total $ Regulatory Year ( ending 3/31) Total Awards, £ % of Revenue Total $ 2004/05 2005/06 2006/07 2007/08 2008/09 2009/10 2010/11 £6.1 £9.5 £6.7 £8.0 £11.8 £12.1 £7.2 1.6% 2.3% 1.6% 1.8% 2.8% 2.6% 1.5% $ 11.3 $ 17.1 $ 13.4 $ 15.1 $ 16.7 $ 18.3 $ 11.4 2004/05 2005/06 2006/07 2007/08 2008/09 2009/10 2010/11 - £0.5 £7.5 - £5.4 - £1.7 £8.2 £7.9 £11.6 --- - 0.3% 1.3% 1.2% 1.6% -$0.9 $13.5 -$10.7 - $3.3 $ 11.7 $ 11.9 $ 18.5 Total: £61.3 2.0% $ 103.3 Total: £27.6 1.0% $ 40.8 ©PPL Corporation 2011 21

©PPL Corporation 2011
22
Capacity revenues are expected to be $430 million, $385 million and $590 million for 2011, 2012 and 2013, respectively.
As of September 30, 2011
(1) Represents expected sales of Supply segment based on current business plan assumptions.
(2) The 2011 average hedge energy prices are based on the fixed price swaps as of September 30, 2011; the prior collars have all been converted to fixed swaps.
(3) The 2012 and 2013 ranges of average energy prices for existing hedges were estimated by determining the impact on the existing collars resulting from 2012 and 2013 power prices at the
5th and 95th percentile confidence levels.
5th and 95th percentile confidence levels.
(4) Includes nine months of actual results.
(5) Transportation contract in negotiation.
|
|
|
|
2011(4)
|
|
2012
|
|
2013
|
|
Baseload
|
|
|
|
|
|
|
|
|
Expected Generation(1) (Million MWhs)
|
|
|
47.0
|
|
54.7
|
|
54.4
|
|
East
|
|
|
39.5
|
|
46.2
|
|
46.0
|
|
West
|
|
|
7.5
|
|
8.5
|
|
8.4
|
|
Current Hedges (%)
|
|
|
100%
|
|
91%
|
|
72%
|
|
East
|
|
|
100%
|
|
90%
|
|
72%
|
|
West
|
|
|
100%
|
|
96%
|
|
75%
|
|
Average Hedged Price (Energy Only) ($/MWh)(2) (3)
|
|
|
|
|
|
|
|
|
East
|
|
|
$57
|
|
$54-55
|
|
$53-56
|
|
West
|
|
|
$55
|
|
$53-54
|
|
$50-51
|
|
Current Coal Hedges (%)
|
|
|
100%
|
|
96%
|
|
89%
|
|
East
|
|
|
100%
|
|
95%
|
|
93%
|
|
West
|
|
|
100%
|
|
100%
|
|
79%
|
|
Average Hedged Consumed Coal Price (Delivered $/Ton)
|
|
|
|
|
|
|
|
|
East
|
|
|
$73-74
|
|
$76-80
|
|
(5)
|
|
West
|
|
|
$24-26
|
|
$23-29
|
|
$23-30
|
|
Intermediate/Peaking
|
|
|
|
|
|
|
|
|
Expected Generation(1) (Million MWhs)
|
|
|
8.0
|
|
6.2
|
|
6.3
|
|
Current Hedges (%)
|
|
|
100%
|
|
32%
|
|
19%
|
Enhancing Value Through Active Hedging
©PPL Corporation 2011
23
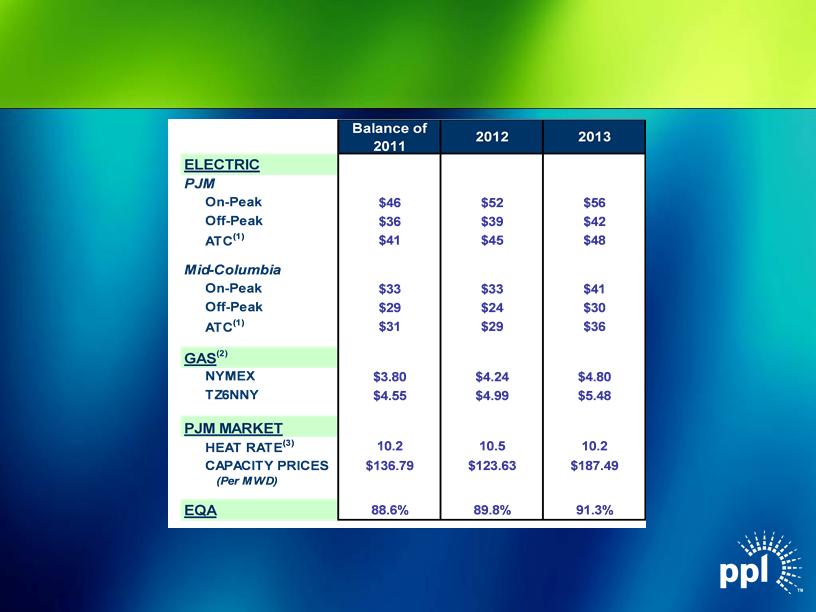
Market Prices
|
(1)
|
24-hour average.
|
|
(2)
|
NYMEX and TZ6NNY forward gas prices on 9/30/2011.
|
|
(3)
|
Market Heat Rate = PJM on-peak power price divided by TZ6NNY gas price.
|
23 Market Prices Market Prices Balance of 2011 2012 2013 $46 $52 $56 $36 $39 $42 $41 $45 $48 $33 $33 $41 $29 $24 $30 $31 $29 $36 $3.80 $4.24 $4.80 $4.55 $4.99 $5.48 10.2 10.5 10.2 $136.79 $123.63 $187.49 88.6% 89.8% 91.3% (Per MWD) EQA HEAT RATE(3) TZ6NNY PJM MARKET ATC(1) NYMEX GAS(2) CAPACITY PRICES Mid- Columbia On-Peak Off-Peak ATC(1) ELECTRIC PJM On-Peak Off-Peak (1) 24- hour average. (2) NYMEX and TZ6NNY forward gas prices on 9/30/ 2011. (3) Market Heat Rate = PJM on-peak power price divided by TZ6NNY gas price. ©PPL Corporation 2011 4 Market Prices Market Prices Balance of 2011 2012 2013 $46 $52 $56 $36 $39 $42 $41 $45 $48 $33 $33 $41 $29 $24 $30 $31 $29 $36 $3.80 $4.24 $4.80 $4.55 $4.99 $5.48 10.2 10.5 10.2 $136.79 $123.63 $187.49 88.6% 89.8% 91.3% (Per MWD) EQA HEAT RATE(3) TZ6NNY PJM MARKET ATC(1) NYMEX GAS(2) CAPACITY PRICES Mid- Columbia On-Peak Off-Peak ATC(1) ELECTRIC PJM On-Peak Off-Peak (1) 24- hour average. (2) NYMEX and TZ6NNY forward gas prices on 9/30/ 2011. (3) Market Heat Rate = PJM on-peak power price divided by TZ6NNY gas price.

©PPL Corporation 2011
24
Supply Hydro Expansion
Construction Progress
Holtwood Hydro Expansion Project (PA)
©PPL Corporation 2011
25
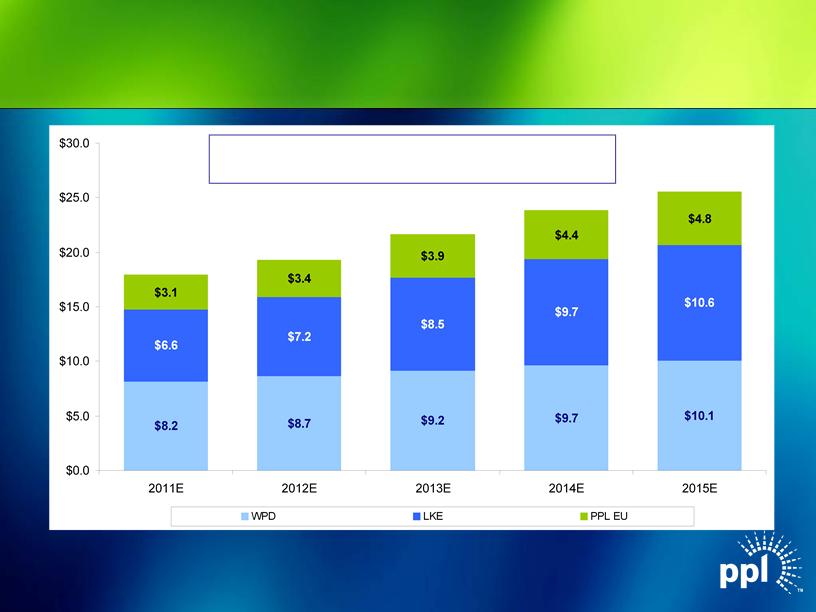
Regulated Rate Base Growth
($ in billions)
(1) Represents capitalization for LKE, as LG&E and KU rate constructs are based on capitalization. Represents Regulatory Asset Value (RAV) for WPD.
(2) Includes RAV for WPD Midlands. Figures based on assumed exchange rate of $1.60 / GBP and are as of year-end December 31.
$17.9
$19.3
$21.6
$23.8
$25.5
(2)
2011E - 2015E Regulatory Asset Base CAGR: 9.3%
(1)
©PPL Corporation 2011
26
Capital Expenditures
($ in billions)
(1) Includes capex for WPD Midlands. Figures based on assumed exchange rate of $1.60 / GBP.
(2) Expect approximately 85% to receive timely returns via ECR mechanism based on historical experience.
(1)
(2)
$2.6
$3.7
$4.3
$4.1
$3.7
©PPL Corporation 2011
27
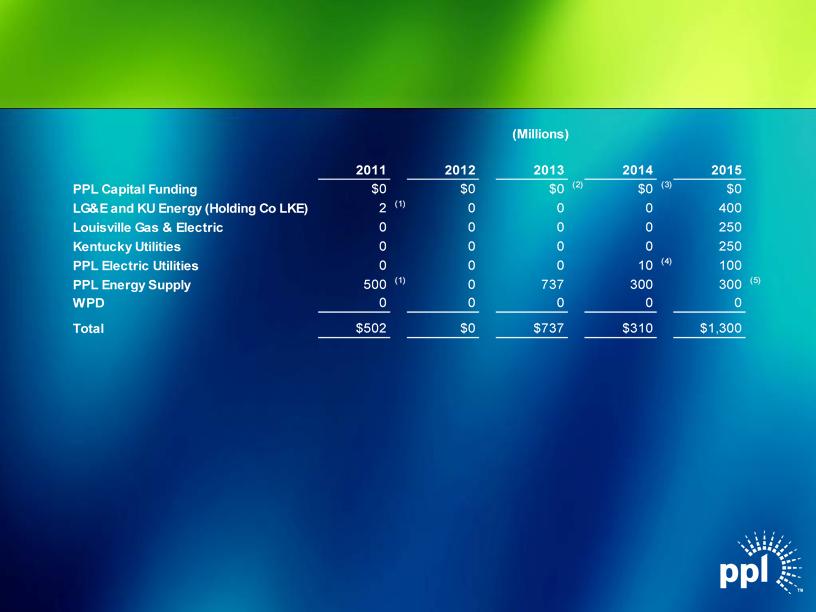
Note: As of September 30, 2011
(1) Notes were repaid at maturity in November 2011.
(2) Excludes $1.15 billion of junior subordinated notes due 2018 that are a component of PPL’s 2010 Equity Units and
may be put back to PPL Capital Funding if the remarketing in 2013 is not successful.
may be put back to PPL Capital Funding if the remarketing in 2013 is not successful.
(3) Excludes $978 million of junior subordinated notes due 2019 that are a component of PPL’s 2011 Equity Units and
may be put back to PPL Capital Funding if the remarketing in 2014 is not successful.
may be put back to PPL Capital Funding if the remarketing in 2014 is not successful.
(4) Bonds defeased in substance in 2008 by depositing sufficient funds with the trustee.
(5) Represents REset Put Securities due 2035 that are required to be put by the holders in October 2015 either for (a)
purchase and remarketing by a remarketing dealer or (b) repurchase by PPL Energy Supply.
purchase and remarketing by a remarketing dealer or (b) repurchase by PPL Energy Supply.
Debt Maturities
©PPL Corporation 2011
28
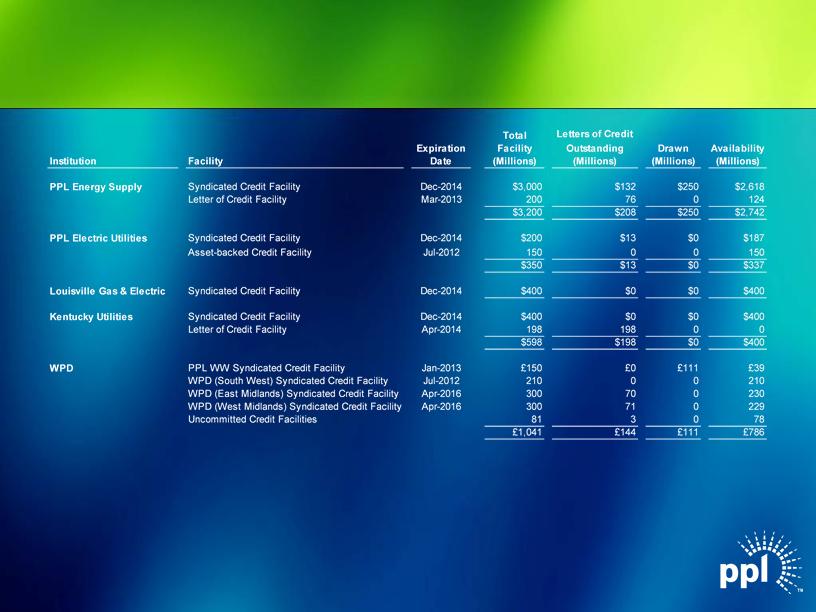
Note: As of September 30, 2011
● Credit facilities consist of a diverse bank group, with no bank and its affiliates providing an aggregate commitment of more than
9% of the total committed capacity for the domestic facilities and 17% of the total committed capacity for WPD’s facilities.
9% of the total committed capacity for the domestic facilities and 17% of the total committed capacity for WPD’s facilities.
(1) In October 2011, PPL Energy Supply, PPL Electric Utilities, Louisville Gas & Electric and Kentucky Utilities each amended its
respective syndicated credit facility, which included extending the expiration dates to October 2016.
respective syndicated credit facility, which included extending the expiration dates to October 2016.
(1)
(1)
(1)
(1)
Liquidity Profile
©PPL Corporation 2011
29
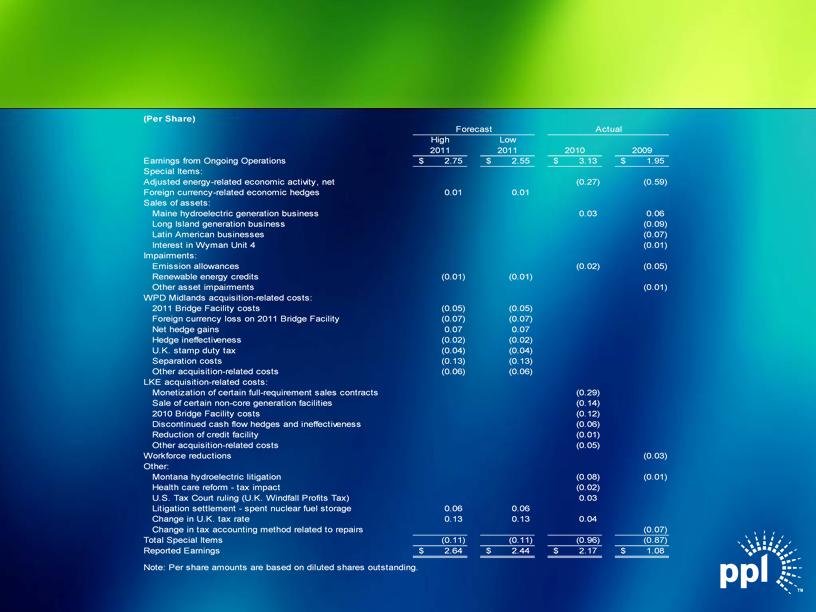
Reconciliation of PPL’s Earnings from Ongoing
Operations to Reported Earnings
Operations to Reported Earnings

©PPL Corporation 2011
30
Statements contained in this presentation, including statements with respect to future earnings, cash flows, financing, regulation and
corporate strategy are "forward-looking statements" within the meaning of the federal securities laws. Although PPL Corporation
believes that the expectations and assumptions reflected in these forward-looking statements are reasonable, these statements are
subject to a number of risks and uncertainties, and actual results may differ materially from the results discussed in the statements.
The following are among the important factors that could cause actual results to differ materially from the forward-looking statements:
market demand and prices for energy, capacity and fuel; weather conditions affecting customer energy usage and operating costs;
competition in power markets; the effect of any business or industry restructuring; the profitability and liquidity of PPL Corporation and
its subsidiaries; new accounting requirements or new interpretations or applications of existing requirements; operating performance of
plants and other facilities; the length of scheduled and unscheduled outages at our generating plants; environmental conditions and
requirements and the related costs of compliance, including environmental capital expenditures and emission allowance and other
expenses; system conditions and operating costs; development of new projects, markets and technologies; performance of new
ventures; asset or business acquisitions and dispositions, and PPL Corporation’s ability to realize the expected benefits from acquired
businesses, including the 2010 acquisition of Louisville Gas and Electric Company and Kentucky Utilities Company and the 2011
acquisition of the Central Networks electricity distribution businesses in the U.K.; any impact of hurricanes or other severe weather on
our business, including any impact on fuel prices; receipt of necessary government permits, approvals, rate relief and regulatory cost
recovery; capital market conditions and decisions regarding capital structure; the impact of state, federal or foreign investigations
applicable to PPL Corporation and its subsidiaries; the outcome of litigation against PPL Corporation and its subsidiaries; stock price
performance; the market prices of equity securities and the impact on pension income and resultant cash funding requirements for
defined benefit pension plans; the securities and credit ratings of PPL Corporation and its subsidiaries; political, regulatory or
economic conditions in states, regions or countries where PPL Corporation or its subsidiaries conduct business, including any potential
effects of threatened or actual terrorism or war or other hostilities; foreign exchange rates; new state, federal or foreign legislation,
including new tax legislation; and the commitments and liabilities of PPL Corporation and its subsidiaries. Any such forward-looking
statements should be considered in light of such important factors and in conjunction with PPL Corporation's Form 10-K and other
reports on file with the Securities and Exchange Commission.
Forward-Looking Information Statement

©PPL Corporation 2011
31
“Earnings from ongoing operations” should not be considered as an alternative to reported earnings, or net income attributable to PPL, which is an
indicator of operating performance determined in accordance with generally accepted accounting principles (GAAP). PPL believes that “earnings from
ongoing operations,” although a non-GAAP financial measure, is also useful and meaningful to investors because it provides management’s view of
PPL’s fundamental earnings performance as another criterion in making investment decisions. PPL’s management also uses “earnings from ongoing
operations” in measuring certain corporate performance goals. Other companies may use different measures to present financial performance.
“Earnings from ongoing operations” is adjusted for the impact of special items. Special items include:
• Energy-related economic activity (as discussed below).
• Foreign currency-related economic hedges.
• Gains and losses on sales of assets not in the ordinary course of business.
• Impairment charges (including impairments of securities in the company’s nuclear decommissioning trust funds).
• Workforce reduction and other restructuring impacts.
• Acquisition-related costs and charges.
• Other charges or credits that are, in management’s view, not reflective of the company’s ongoing operations.
Energy-related economic activity includes the changes in fair value of positions used economically to hedge a portion of the economic value of PPL’s
generation assets, full-requirement sales contracts and retail activities. This economic value is subject to changes in fair value due to market price
volatility of the input and output commodities (e.g., fuel and power) prior to the delivery period that was hedged. Also included in energy-related
economic activity is the ineffective portion of qualifying cash flow hedges, the monetization of certain full-requirement sales contracts and premium
amortization associated with options. This economic activity is deferred, with the exception of the full-requirement sales contracts that were
monetized, and included in earnings from ongoing operations over the delivery period of the item that was hedged or upon realization. Management
believes that adjusting for such amounts provides a better matching of earnings from ongoing operations to the actual amounts settled for PPL’s
underlying hedged assets. Please refer to the Notes to the Financial Statements and MD&A in PPL Corporation’s periodic filings with the Securities
and Exchange Commission for additional information on energy-related economic activity.
Free cash flow before dividends is derived by deducting capital expenditures and other investing activities-net, from cash flow from operations. Free
cash flow before dividends should not be considered as an alternative to cash flow from operations, which is determined in accordance with GAAP.
PPL believes that free cash flow before dividends, although a non-GAAP measure, is an important measure to both management and investors, as it
is an indicator of the company's ability to sustain operations and growth without additional outside financing beyond the requirement to fund maturing
debt obligations. Other companies may calculate free cash flow before dividends in a different manner.
Definitions of Non-GAAP Financial Measures