Attached files
| file | filename |
|---|---|
| 8-K - FORM 8-K - Energy Future Holdings Corp /TX/ | d253195d8k.htm |
 EFH
Corp. 2011 EEI Financial Conference
Discussion Deck
November
6
th
-
9
th
Exhibit 99.1 |
 1
Safe Harbor Statement
This presentation contains forward-looking statements, which are subject
to various risks and uncertainties. A discussion of the risks and
uncertainties that could cause actual results to differ materially from
management's current projections, forecasts, estimates and expectations
is contained in EFH Corp.'s filings with the Securities and Exchange
Commission (SEC).
Regulation G
This presentation includes certain non-GAAP financial measures. A
reconciliation
of
these
measures
to
the
most
directly
comparable
GAAP
measures is included in the appendix to this presentation.
|
 2
Table of Contents
I.
Energy Future Holdings (EFH)
Overview…………………… II.
Luminant
Overview…………………………...……………....
III.
TXU Energy
Overview.…………………………………….….
IV.
Oncor
Overview.………………………………………..…..…
V.
EFH Supplemental
Information………………………..…...
VI.
Appendix –
Reg
G…………………………………..………....
3
-
4
5
-
22
23
-
27
28
-
31
32
-
35
36
-
40 |
 3
Largest competitive electric
generator in Texas
Largest lignite/coal and
nuclear generation fleet in
Texas
Low-cost lignite reserves
Largest T&D utility in
Texas
Leader in smart-grid
development
Constructive regulatory
regime
Largest retail
electricity provider in
Texas
Strong customer value
proposition
The largest power generator, retail electricity provider and transmission &
distribution utility in Texas.
Energy Future Holdings Overview |
 2011 Key
Highlights 4
Operational
achievements
Solid safety performance
Coal fueled plant generation
OG/S5 Q3 capacity factor (~95%)
Gas plant summer operations
New
ERCOT summer and winter demand
records
TXU Energy bad debt reduction
Top decile nuclear cost & reliability
ERCOT nodal execution
Land reclamation program
CREZ construction program
AMS deployment and plan
Financial
achievements
Liability Management Program
–
Extended ~$15B of TCEH TLB
–
Issued
~$1.8B
of
TCEH
1
Lien
notes
Defended creditor allegations
Effective cost / capex management
Effective asset management
IRS tax settlement progression
Strategic
initiatives
EPA regulations
Support ERCOT/PUCT engagement and
advocacy on resource adequacy
TXUE marketing partnerships
(Southwest/SolarCity)
Nuclear licensing progression
All 14 CCNs for CREZ approved
Monetized non-core assets
st |
 5 |
 6
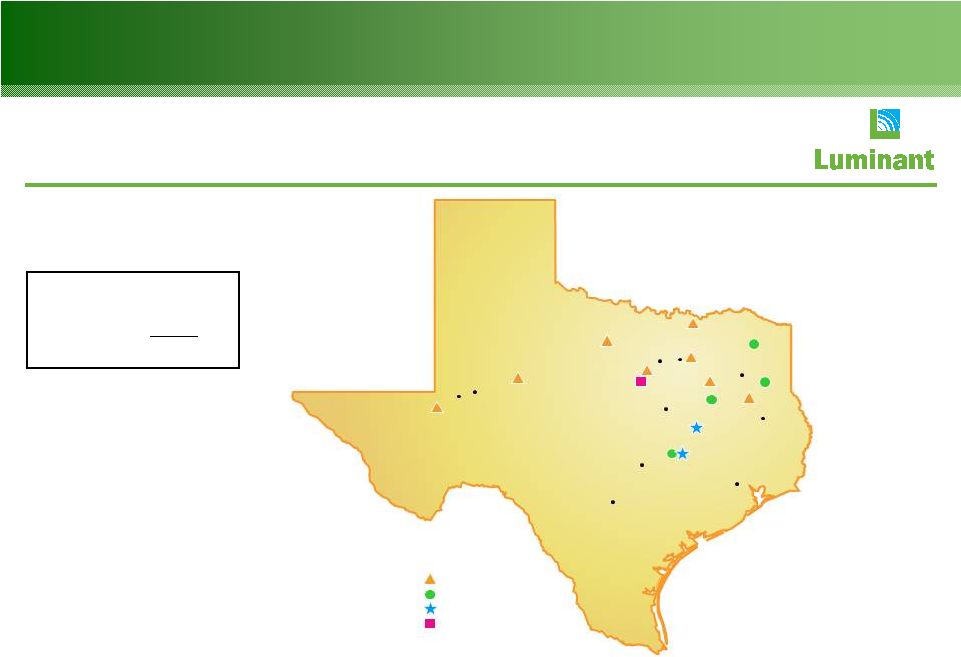
Luminant Generation Facilities
Generation capacity in ERCOT
At 12/31/10; MW
Nuclear
2,300 MW
Coal
8,017
Natural gas¹
5,110
Total
15,427 MW
1
Includes four mothballed units (1,655 MW) not currently available for dispatch and eight units (1,268
MW) currently operated for unaffiliated parties.
HOUSTON
SAN ANTONIO
AUSTIN
WACO
MIDLAND
LUFKIN
ODESSA
DALLAS
TYLER
FORT
WORTH
Power Plants
Natural gas
Coal
Coal, new build
Nuclear |
 40
55
42
47
41
2007
2008
2009
2010
2011E
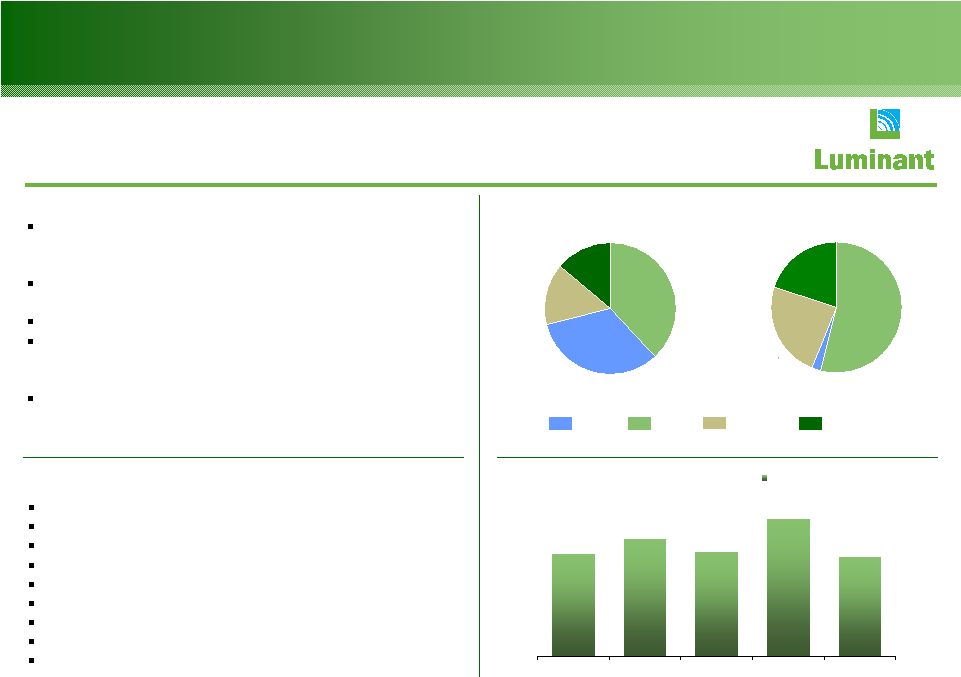
Luminant Recordables
(# of Incidents)
1
Includes four mothballed units (1,655 MW) not currently available for dispatch and
eight units (1,268 MW) currently operated for unaffiliated parties. 2
Nine months ended September 30, 2011 (excludes purchased power).
24%
54%
20%
Business Profile
Generation
Largest coal & nuclear generation fleet in ERCOT with
around-the-clock assets that dispatch at low heat rate
levels
Top decile nuclear plant production and cost
performance
Top quartile coal fleet production and cost performance
Liquidity-light natural gas hedging program designed to
provide cash flow security (~47% hedged for Jan 1, 2011
–
Dec 31, 2015)
Comanche Peak expansion through Mitsubishi
partnership may provide a long term nuclear growth
option
14%
33%
38%
15%
Coal
Gas
Nuclear
Generating
Capacity¹
as
of
12/31/10
Total
Net
Generation²
Sept.
2011
15,427 MW
60,775 GWh
New Build-Coal
Safety
Wholesale power prices
Natural gas hedge program
Coal/ Nuclear plant reliability
Mining operations
Fuel/ O&M costs
Peaking gas assets
Operational excellence/continuous improvement
Competitive market
Value Drivers
Safety Performance
07-11E
Luminant is the largest power generator in Texas.
Luminant
Business Summary
7
2% |
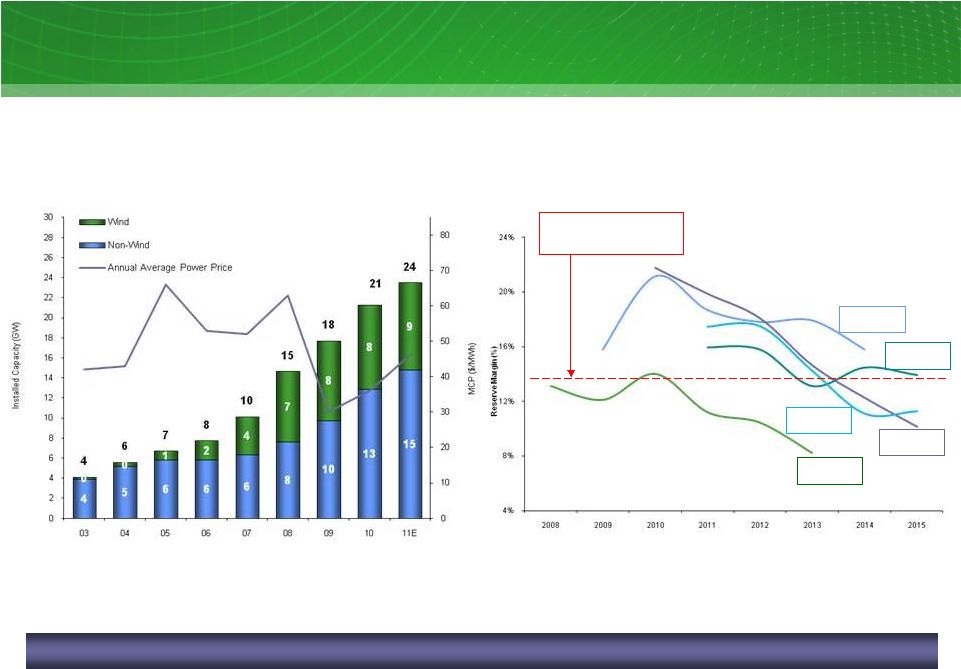 ERCOT
Fundamental Supply and Demand Dynamics ERCOT Supply Additions
03-11; GW
ERCOT Reserve Margin Projections Over Time
08-15; Percent
Dec 07
Target Min Reserve
Margin of 13.75%
Dec 08
Dec 09
Dec 10
ERCOT projects target reserve margin will be below 13.75% beginning in 2014
8
May 11
Source: ERCOT’s Capacity, Demand and Reserves Reports
|
 Summer
2011
ERCOT
supply
stack
-
indicative
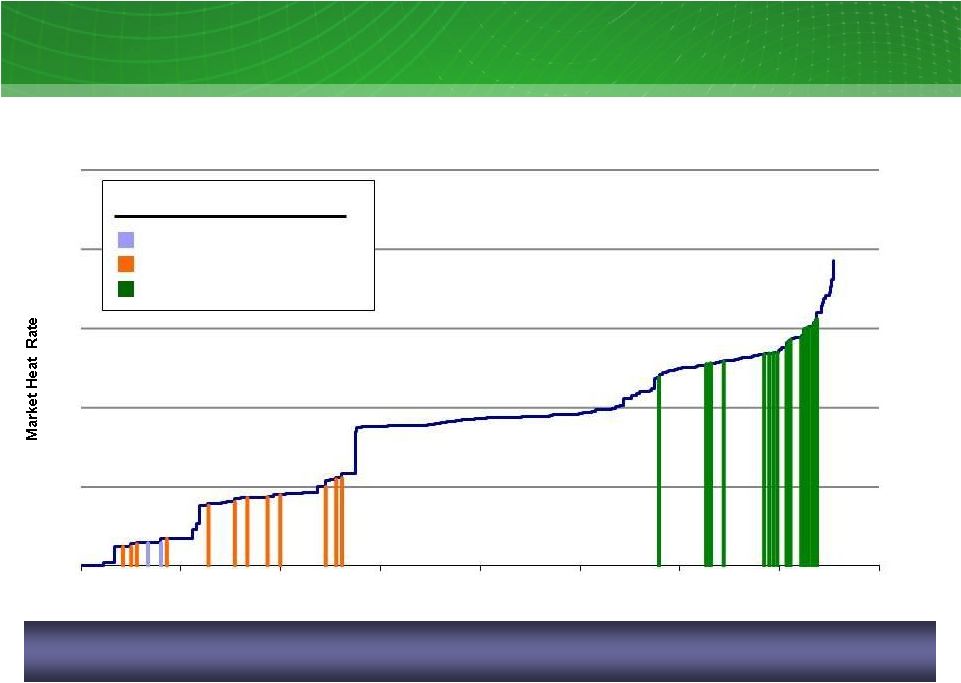
ERCOT Supply Stack
Sources: ERCOT and Energy Velocity
®, Ventyx Luminant
plants
are
typically
on
the
“book-ends”
of
the
supply
stack.
ERCOT’s
marginal price is set by natural gas in most hours of the year.
9
Luminant nuclear plant
Luminant lignite/coal plants
Luminant gas plants
Legend
0
4
8
12
16
20
0
10
20
30
40
50
60
70
80
Cumulative MWs |
 Nuclear
Reliability vs. Cost Benchmarks 75
80
85
90
95
10.00
15.00
20.00
25.00
30.00
35.00
40.00
O&M costs ($/MWh)
08-10 Capability Factor / O&M
$/MWh
Benchmarking peer set defined as 18 month fuel cycle U.S. nuclear plants. 2011 for
CPNPP is an estimate of full year performance. Source: EUCG May 2011 release
for Cost and WANO for Capability Factors. Braidwood
Byron
STP
CPNPP
Decile
Quartile
Median
Decile
Quartile
Median
Vogtle
08-10
09-11
10 |
 11
0
10
20
30
40
50
60
70
2003
2004
2005
2006
2007
2008
2009
2010
2011
EFH
Industry
Impact of Refueling Outages
Avg. nuclear
fleet
refueling
outage
duration¹
-
18
month
cycle units
03-11; days
Nuclear fleet output
03-11; thousand GWh
Nuclear Refueling Cycle
18 months
Duration: ~19-26 days
2011 Refueling Outage Impact
2011 outages: Unit 1 -
20 days
Unit 2 -
23 days
Shortest Fall outage to date & 2nd
shortest Spring outage in the industry
2012 Refueling Outage Impact
2012 outage planned for 22 days (Unit 2)
1
2005
and
2008
were
dual
refueling
outage
years;
this
graph
shows
the
average
outage
duration
for
each
of
those
years.
2
Industry based on early release data from Electric Utility Cost Group (EUCG)
2
World record steam
generator outage
World record steam
generator outage
16
17
18
19
20
2003
2004
2005
2006
2007
2008
2009
2010
2011E
0
1
2
3
EFH
# of Refueling Outages |
 1
Benchmarking net capacity factors based on GADS. Luminant is legacy
lignite/coal fleet only and based on net capacity of 5,837 MW. Luminant
08–10 fleet avg. = 81.5 % Luminant 10 fleet = 79.9%
Source: GKS
Luminant
vs. US coal fleet net capacity factors
Percent
Luminant vs. US coal fleet O&M
$/MWh
Luminant has industry leading performance relative to other coal-fueled
generators. High-Performance Coal Operator
12
1
Top decile
80.4%
Top quartile
76.9%
Top decile
$3.68
Top quartile
$4.90
Luminant 08–10 fleet avg. = $3.72
Luminant 10 fleet = $4.15 |
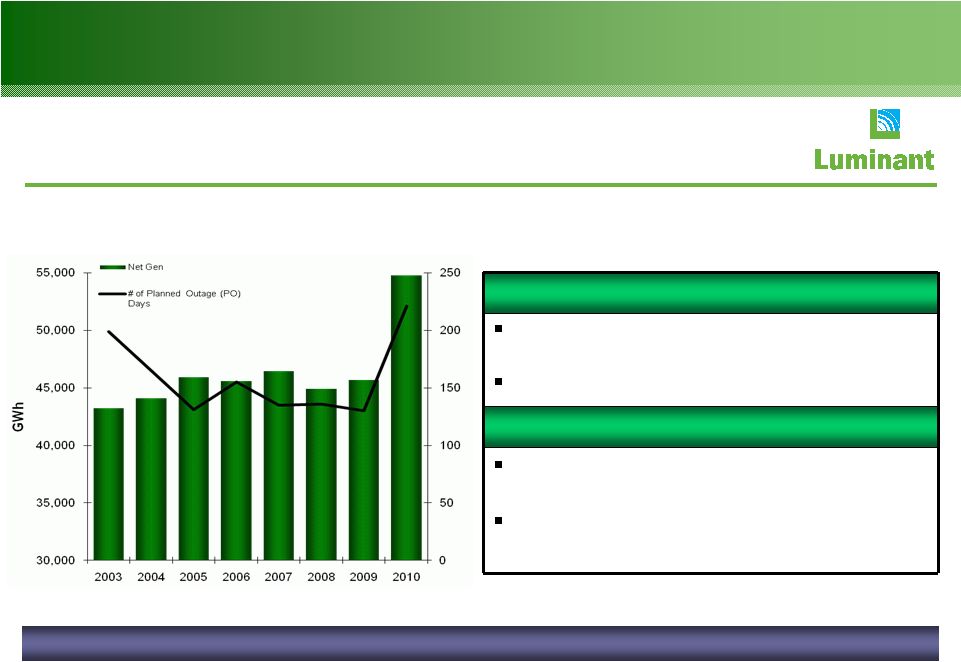 13
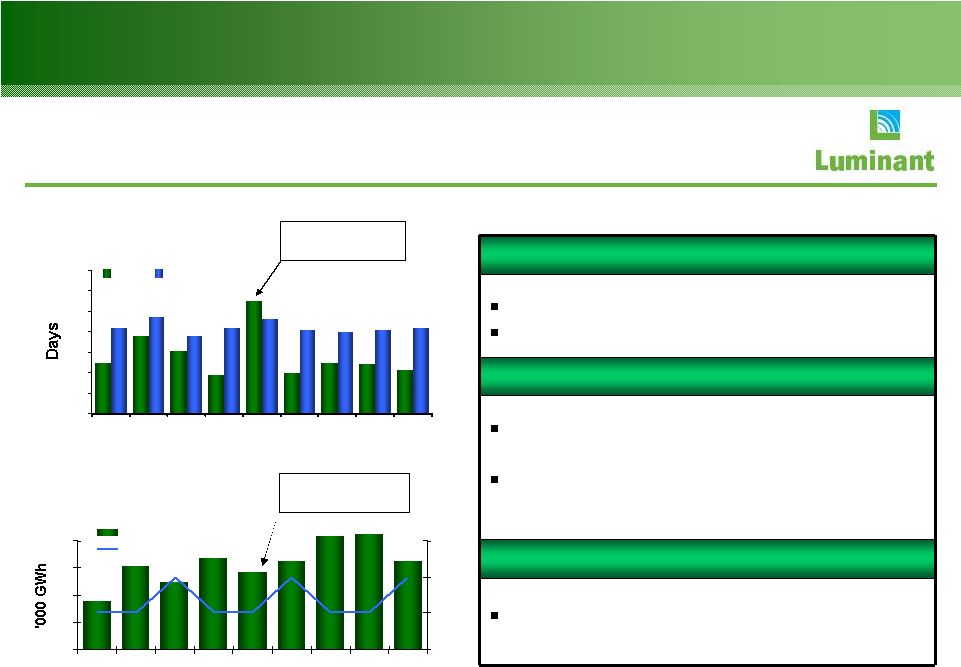
Coal Fleet Output
Coal fleet output
1,2
03-10; GWh
Coal Fleet Planned Outage Cycle
3 or 4 year overhaul cycle depending on
unit
Duration is scope dependent
2010 Planned Outage Impact
2010 reflects 221 planned outage days
(41 at new units)
2010 average major outage duration was
48 days
Increased generation from new units and improved reliability from legacy fleet.
1
2009 includes 1,443 GWh of new build generation (Sandow 5 and Oak Grove 1 units). 2
2010 includes 11,384 GWh of new build generation and 41 planned outage days (Sandow 5,
Oak Grove 1 & 2 units). |
 14
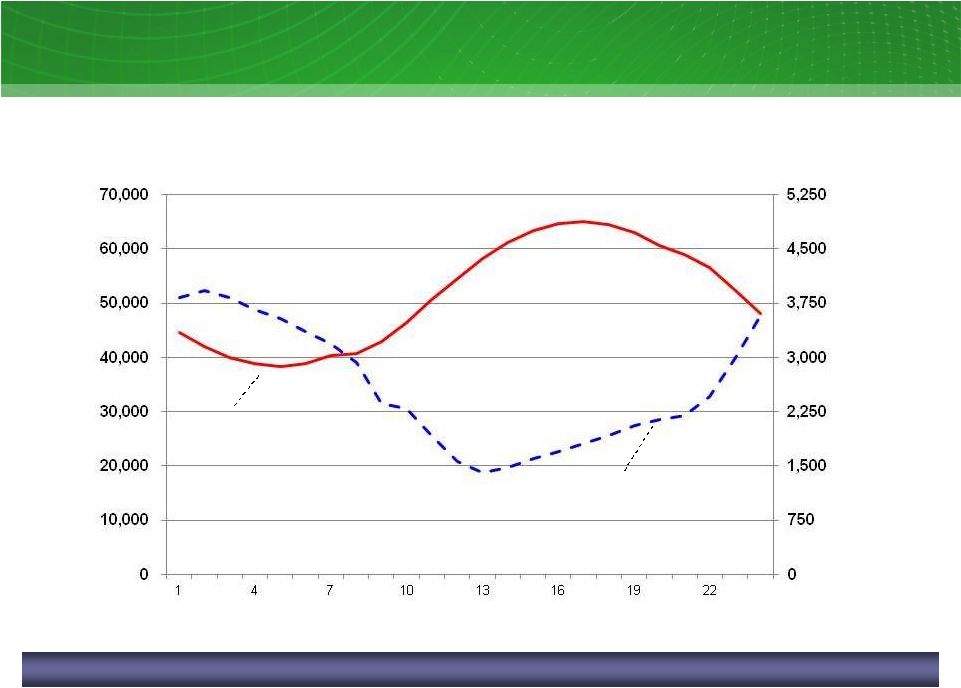
ERCOT Average Daily Profile of Load and Wind
Source: ERCOT
ERCOT average daily profile of load and wind output
August 11; mixed measures
Average
Load
Average
Wind Output
Hour
Load
(aMW)
Wind Output
(MW)
Wind operating characteristics necessitate additional resources for
reliability. |
 15
Texas Wind Additions
ERCOT SGIA
2
Cumulative wind capacity additions in Texas
Pre-01 -
10;11E -
12E; MW
1
Renewable
Portfolio
Standard
2
Signed
Generation
Interconnect
Agreement
Source:
ERCOT
–
January
2011
System
Planning
Report
to
the
Reliability
and
Operations
Subcommittee
RPS
1
Target
of 2,880 MW
by 2009
RPS
1
Target
of 5,880 MW
by 2015
CREZs
Designated
0
2,000
4,000
6,000
8,000
10,000
12,000
Pre 01
02
03
04
05
06
07
08
09
10
11E
12E |
 16
Summer 2011 Heat Wave Impacts –
August was the story
Averages
°F
#
of
Days
>
100
°F
Cooling Degree Days
(CDDs)
On-Peak Heat Rate
# of hours with prices
> $2,000/MWh
Entering Summer ‘11 we generally had a long position bias given
market point-of-view and desire to maintain peaking reserves for unit
outages
Load
was
hedged
against
95
percentile
weather
with
call
options
Actual
summer
outcome
–
exceptional
coal
unit
performance
provided
incremental
long
position,
>
99 percentile
weather
created
load
short
at high prices partially offset by hedges (call options)
Select August Data
Asset
Management
was
able
to
realize
a
net
benefit
when
compared
to
last
year
due
to
strong unit performance and sound asset management strategies
th
th |
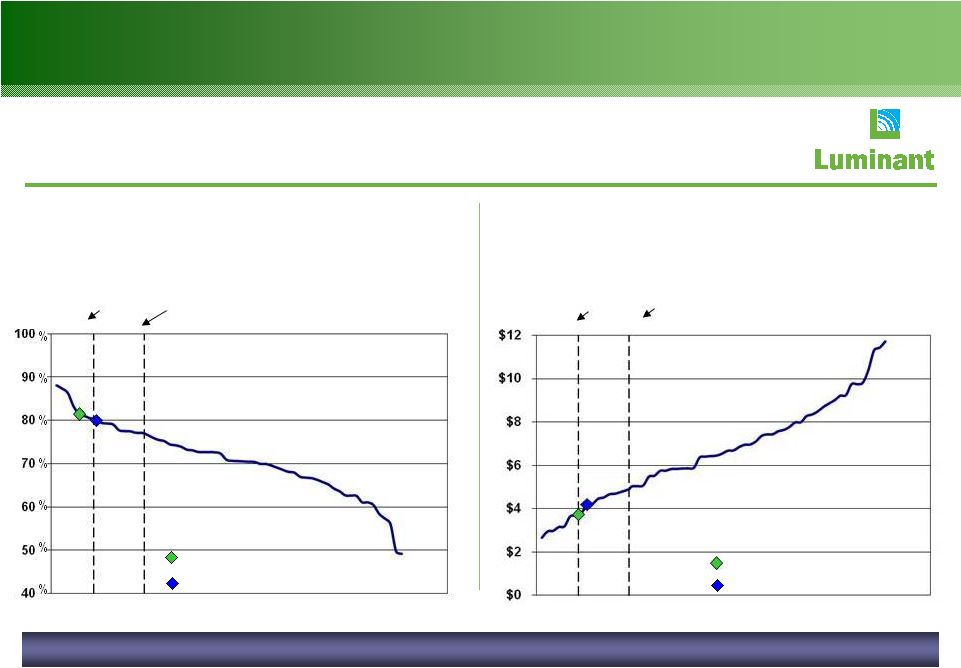
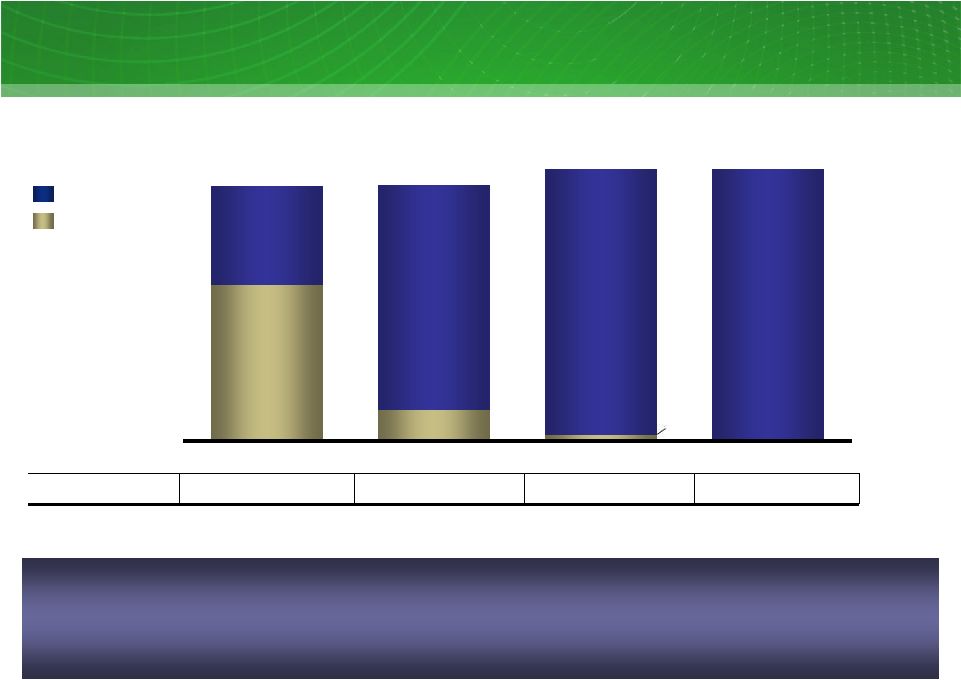 TCEH
Heat Rate Position 12-15
1,2
; TWh
46
9
2
29
66
78
80
~75
~75
~80
~80
2012
2013
2014
2015
% Hedged
~60%
~12%
~2%
~0%
Open Position
TXUE & LUME
Net Position²
1
As of the end of Q3 2011 and includes the impact of Cross-State Air Pollution
Rule 2
Excludes speculative trading positions
TCEH Heat Rate Position
In general, heat rate position is un-hedged past 36 months. Before entering
a year, the heat rate position is hedged to ~70-80% through retail and
wholesale channels. Within the year, various months and products are
either hedged or left as open positions depending on
point-of-view 17
2 |
 HSC
Natural Gas Futures $/MMBtu
ERCOT NHub ATC (7x24) Heat Rate
MMBtu/MWh
*limited broker
quotes
18
Forward Natural Gas Prices and Heat Rates
Forward position has benefited from recent rise in heat rates, while forward gas has
continued to hold at ~$5/mmbtu |
 Historical 2014 Forward Natural Gas Prices
Historical 2014 Forward Houston Ship Channel (HSC) Gas Prices
Q1’07-
Q3’11; $/MMBtu
19 |
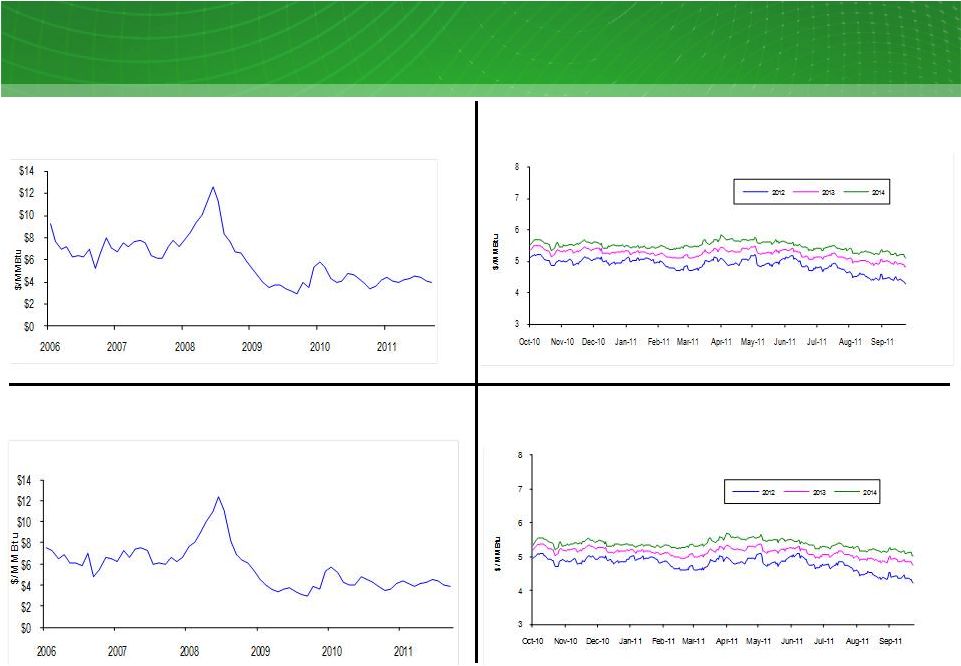 20
20
Houston
Ship
Channel
settled
natural
gas
prices¹
Jan 06-Sep 11; $/MMBtu
Market Price Snapshot
NYMEX
forward
natural
gas
prices
2012-2014; $/MMBtu
NYMEX
settled
natural
gas
prices
Jan 06-Sep 11; $/MMBtu
1
Settled prices are monthly averages
2
Forward prices reflect market observable quotes during the 12 months ended Sep 30, 2011 for the
following delivery periods: 2012, 2013 and 2014
2
1
Houston Ship Channel forward natural gas prices
2012-2014; $/MMBtu
2 |
 21
21
Market Price Snapshot
ERCOT North HUB 7x24 settled heat rate
Jan 06-Sep11; MMBtu/MWh
ERCOT
North HUB 7x24 forward heat rate
2012-2014; MMBtu/MWh
ERCOT
North HUB 5x16 forward heat rate
2012-2014; MMBtu/MWh
ERCOT
North HUB 5x16 settled heat rate
Jan 06-Sep 11; MMBtu/MWh
1
Market heat rate calculated by dividing 7x24 and 5x16 power prices, as appropriate,
by Houston Ship Channel natural gas prices 2
Settled prices are monthly averages
3
Forward prices reflect market observable quotes during the 12 months ended Sep 30,
2011 for the following delivery periods: 2012, 2013 and 2014 5
10
15
20
25
30
35
2006
2007
2008
2009
2010
2011
6
7
8
9
10
11
12
Oct-10
Nov-10
Dec-10
Jan-11
Feb-11
Mar-11
Apr-11
May
-11
Jun-11
Jul-11
Aug-11
Sep-11
2012
2013
2014
5
10
15
20
25
30
35
40
45
50
55
2006
2007
2008
2009
2010
2011
6
7
8
9
10
11
12
Oct-10
Nov-10
Dec-10
Jan-11
Feb-11
Mar-11
Apr-11
May-11
Jun-11
Jul-11
Aug-11
Sep-11
2012
2013
2014
1,2
1,2
1,3
1,3 |
 Currently Installed¹
Environmental Control Equipment At
Luminant Coal Units
Coal Unit
Capacity
(MW)
FGD
(Scrubber)²
Activated
Carbon
Injection³
ESP
4
SNCR
5
SCR
5
Bag-
house
4
Fuel Source
Oak Grove 1
800
Lignite
Oak Grove 2
800
Lignite
Sandow 4
557
Lignite
Sandow 5
580
Lignite
Martin Lake 1
750
Lignite/PRB
6
Martin Lake 2
750
Lignite/PRB
Martin Lake 3
750
Lignite/PRB
Monticello 1
565
Lignite/PRB
Monticello 2
565
Lignite/PRB
Monticello 3
750
Lignite/PRB
Big Brown 1
575
Lignite/PRB
Big Brown 2
575
Lignite/PRB
Currently installed
1
There is no assurance that the currently installed control equipment will satisfy
the requirements under any change to applicable law or any future Environmental Protection Agency or
Texas Commission on Environmental Quality regulations.
2
FGD refers to flue gas desulfurization systems that reduce SO2 emissions with
co-benefits of other emissions reductions. 3
Activated carbon injection systems reduce mercury emissions.
4
ESP refers to electro-static precipitation systems. ESP and bag-house
systems reduce particulate emissions with co-benefits of other emissions reductions.
5
SNCR refers to selective non-catalytic reduction systems. SCR refers to
selective catalytic reduction systems. Both systems reduce NOx emissions.
6
PRB refers to Powder River Basin coal transported to plants via
railcar. 22 |
 23 |
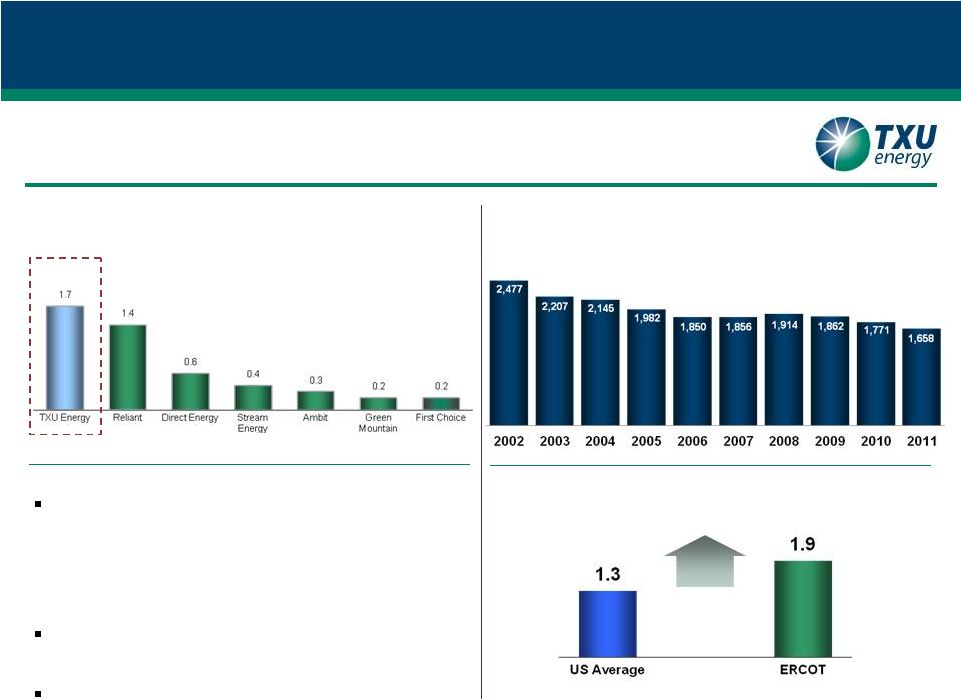  TXU Energy
Business Summary Strong customer value proposition
•
High brand recognition in Texas competitive areas
•
Competitive retail prices
•
Innovative products and services
•
Committed to low-income customer assistance
•
Improved customer care delivery capabilities
Balance Sheet
•
Combined TCEH risk management and liquidity efficient
capital structure
Expected margins (5–10% net)
Source: Latest available company filings, TXU Energy estimates.
Sources: NERC, ERCOT
Residential
Customers
/
Meters
(in
millions)
TXU Energy is the leading electricity retailer in the ERCOT market
Residential
Customers
(in
thousands)
TXU Energy has maintained market position since 2006
Projected Annual Demand Growth
CAGR (2010A-2019E)
Value Drivers
TXU Energy is the largest electricity retailer in Texas.
24
43% |
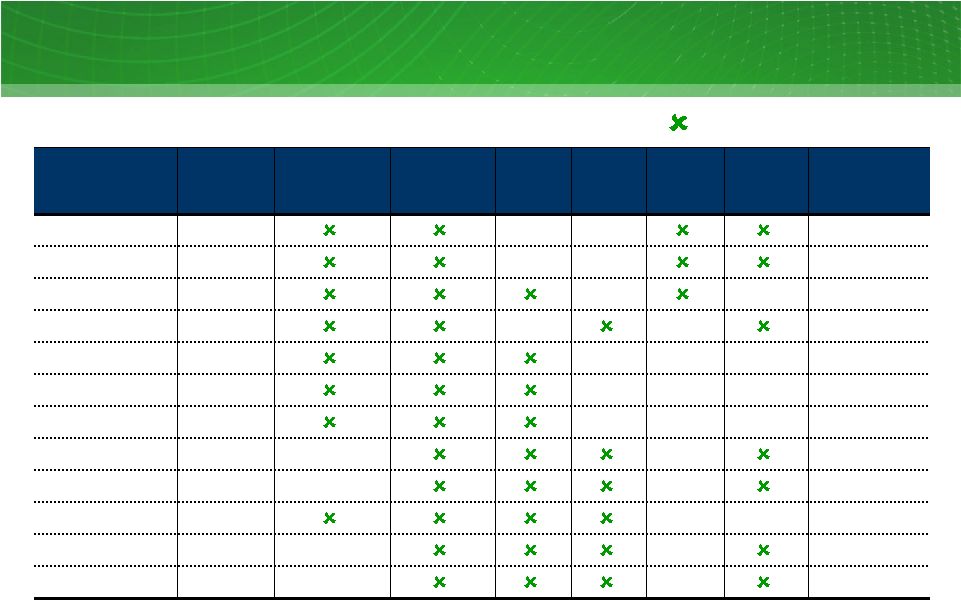
  TXU Energy
Marketing Campaign GM Billboards
GM Television & Radio
Online & Email
Direct Mail
Print
Mass Media in Market -
Southwest Airlines Exclusive Partnership
25 |
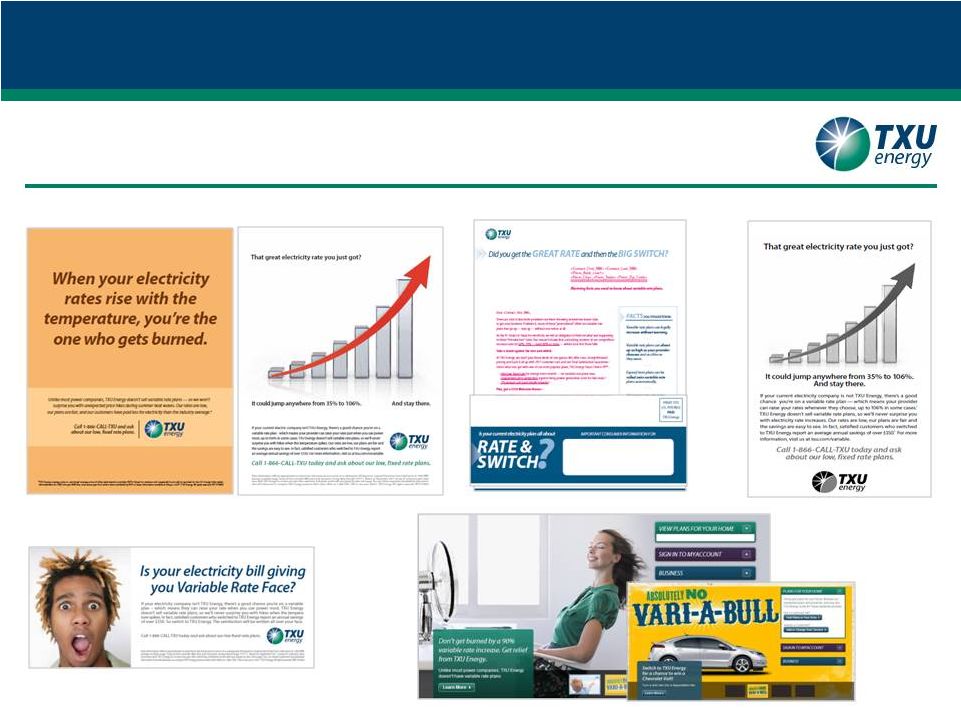  TXU Energy
Marketing Campaign Direct Mail
Sunday Insert
Val Pac
Newspaper
Mass Media in Market -
No Variable
Online
26 |
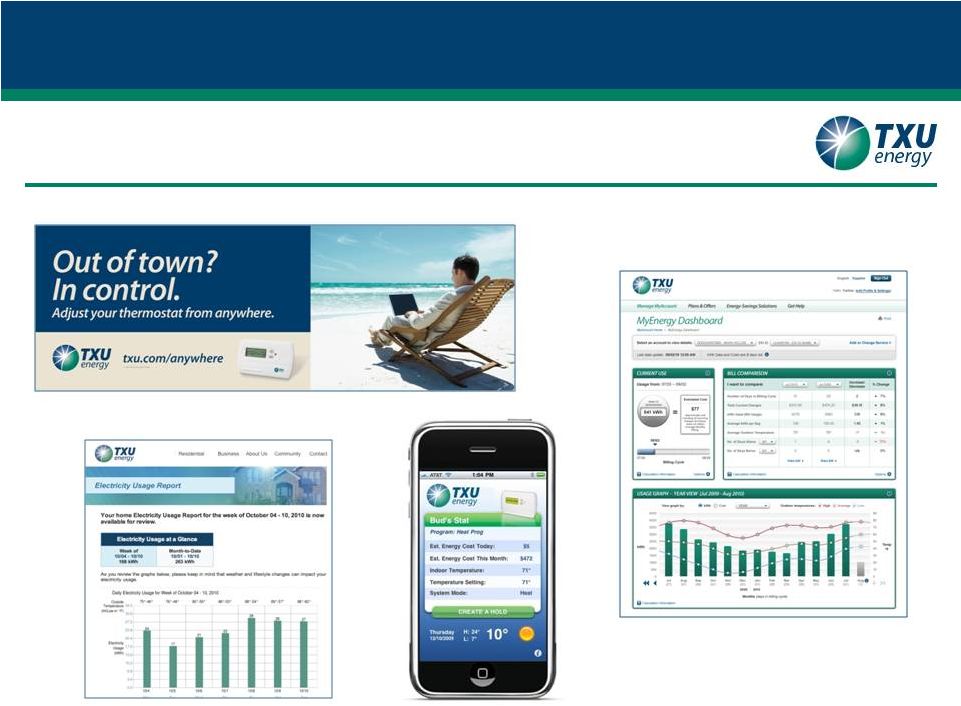 TXU
Energy Marketing Campaign Innovations
TXU Energy MyEnergy Dashboard
TXU Energy Electricity Usage Report
TXU Energy iPhone App
27
Brighten
iThermostat
SM |
 28 |
 1
Oncor currently estimates that the total cost of the CREZ / Voltage Support
projects will be approximately $2.0 billion. Supportive regulatory
environment 10.25% authorized ROE
Improved capital expenditure recovery
Low operating costs per customer
Low rates compared to peers
Strong reliability and safety performance
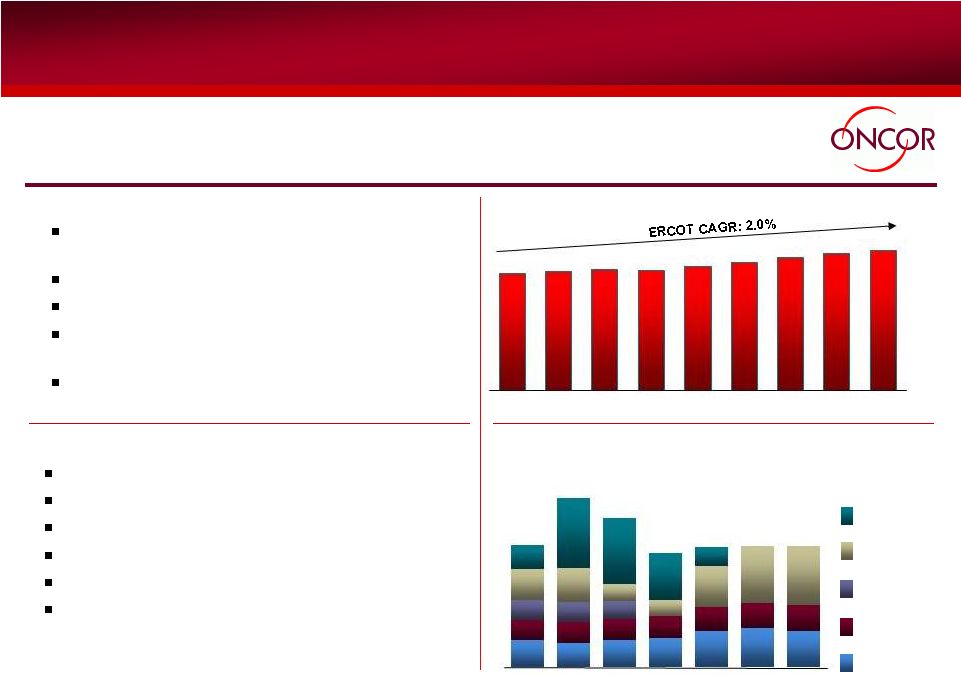
Oncor Overview
Value Drivers
Business Profile
Oncor, which is approximately 80% owned by EFH Corp., is the largest transmission
& distribution utility in Texas.
6
th
largest US transmission & distribution
company
Low costs and high reliability
No commodity position
Accelerated recovery of investments in
advanced meters and transmission
$2.0
billion¹
CREZ
investment
Sources: ERCOT, CDR Report, May 2011
Projected peak demand growth
08-18E; GW
Actual and Estimated Capital Expenditures
’10 -
’16E; $ millions
New Service
Advanced
Metering
CREZ
/
Voltage
Support
IT /
Maintenance /
General Plant
Transmission
Grid
Expansion
29
62
64
64
66
68
71
73
74
63
2008A
2009A
2010A
2011E
2012E
2013E
2014E
2015E
2016E
226
200
230
240
305
325
305
171
180
170
185
200
205
215
164
160
150
257
290
140
135
475
490
202
580
555
390
1,020
1,410
1,250
950
1,000
1,005
1,010
340
155
10
11E
12E
13E
14E
15E
16E
1 |
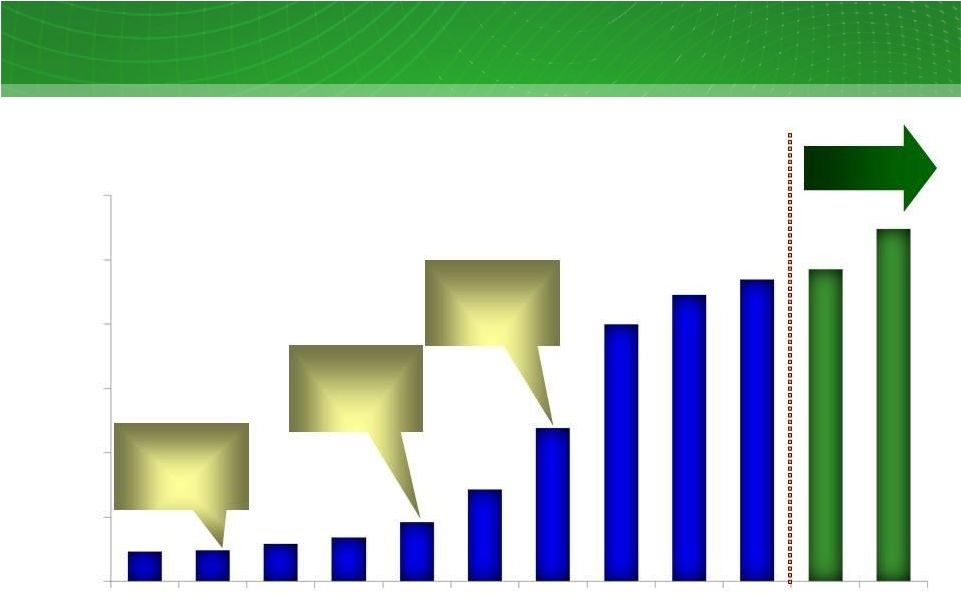
 30
New Oncor
Infrastructure
1
Oncor
currently estimates that the cost of these projects will be approximately $2.0
billion. Oncor’s
investment in CREZ will receive accelerated recovery,
consistent with other transmission investment, mitigating regulatory delay.
…to
…to
to
support
support
the
the
continued
continued
buildout
buildout
of
of
wind
wind
capacity
capacity
in
in
Texas
Texas
Oncor
expects to invest ~$2.0 billion¹
on new
CREZ-related transmission lines… |
 31
Oncor Demand-Side Management
Oncor is leading the largest advanced metering initiatives deployment in the US with
a commitment to have 3.2 million meters installed by the end of 2012 (over 2.1
million meters have been installed through September 2011)
Oncor recovers its investment through a
PUC -approved
surcharge
Customer monitoring of consumption
“Smart”
appliances
Dynamic pricing
Oncor’s
energy
efficiency
filing
has
been
approved
and
is
reflected
in
rates.
1
Public Utility Commission of Texas.
Oncor to deploy ~$690 million of capital
for advanced metering
initiatives… …that will enable key DSM initiatives
1 |
 Energy
Future Holdings Corp. Energy Future Holdings Corp.
32 |
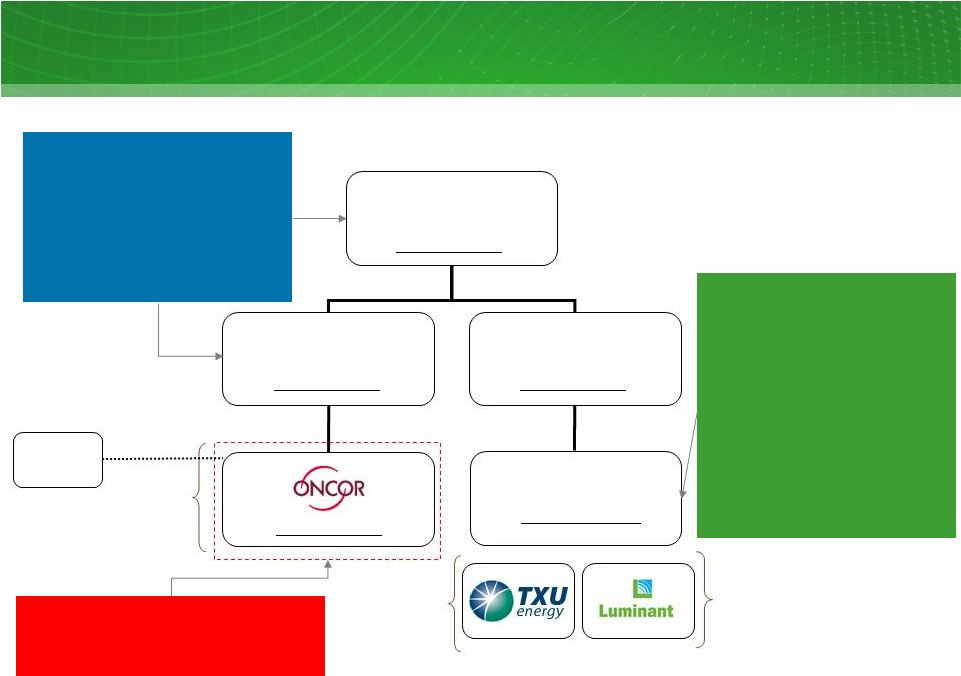 Approx. 80% Ownership
$41.7B total gross
debt
$39.7B total net
debt
Ring-fenced entity
Approx. 20%
Ownership
As of 9/30/11
$15.4B 1 Lien TLB due 2017
$3.8B 1
Lien TLB due 2014
$1.02B Deposit LC due 2017
$0.04B Deposit LC due 2014
$1.75B 1
Lien Notes @ 11.5% due
2020
$1.6B 2
Lien Notes @ 15% due
2021
$4.6B Unsecured LBO Notes @
10.25/10.5% due 2015/2016
$1.5B Unsecured PCRBs/Other
$3.5B 1st Lien Notes @ 9.75/10%
due 2019/2020
$0.4B 2
Lien Notes @ 11% due
2021
$0.6B Unsecured LBO Notes @
10.875/11.25% due 2017
$1.4B Unsecured Legacy Notes @
5.55
–
6.55%
$0.1B Unsecured Other
$0.5B Revolver @ L+27.5 due 2013
$4.8B @ avg. 6.5%
$0.6B @ avg. 5.2%
1
Gross debt includes amount currently due and unamortized debt and fair value
discounts and premiums. 2
Total net debt equals total gross debt less total cash & equivalents and
restricted cash of ~$2.0 billion. 3
Excludes $211 million from A/R Securitization.
EFH Capital Structure Overview
33
TCEH
~ $29.7B gross
debt³ Energy
Future Competitive Holdings
~ $0.1B gross debt
~ $5.9B gross debt
Energy Future
Intermediate Holding
~ $2.7B gross debt
Texas
Transmission
Investment
LLC
EFH
~ $3.3B gross debt
2
1
nd
st
st
st
nd |
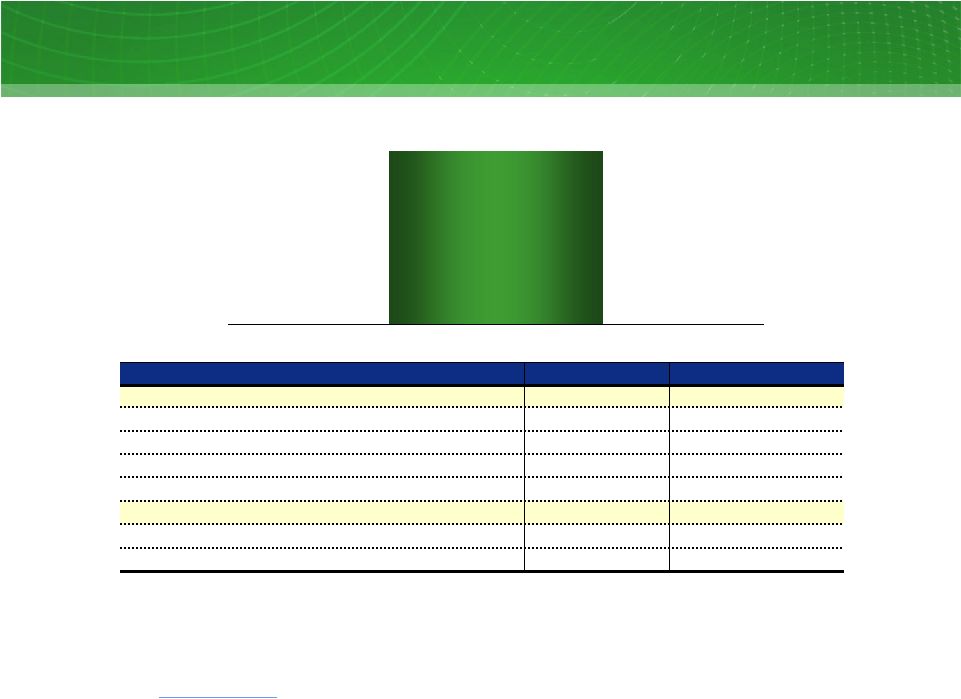
 Key
Drivers 2012 Est. Impact vs
2011 (millions)
Assumptions
Nuclear outage
$75 –
$85
2 refueling outages in 2011 vs. 1 in 2012
Safe and reliable operational performance
Lower outage related expenses
Higher coal
generation and
operational
improvements
$20 -
$30
1 incremental TWh from new lignite units
~$20/MWh average incremental margin¹ Lower operating
and maintenance costs Impact of CSAPR
$250 -
$270
Impact
of
CSAPR²
on
legacy
coal/lignite
units
~9 TWh lower generation from idling MO1&2
Shifting to 100% PRB on BB & MO3
Commodity
$25 -
$125
Lower
weighted
average
NG
hedge
price³
of
~$0.20 /mmbtu for ~500 mm mmbtu
Higher
heat
rate
of
~0.30
–
0.35
on
~68
-
70
TWh
4
Impact of normal weather and load related costs
on 2012 asset management margins relative to
2011
Retail
$25 -
$125
Potential decline driven by lower count, price
environment and normal weather in 2012
2011E TCEH
Adjusted EBITDA
$2,739
YTD
9/30/11
2012 TCEH Adjusted EBITDA (non-GAAP) Key Drivers
$?
Q4
1
Based on ERCOT North Hub 7X24 HSC power prices for 2012 of ~$38/MWh as of
7/29/2011 2
CSAPR as issued in July 2011
3
Weighted average prices are based on NYMEX Henry Hub prices of forward natural gas
sales positions in the long-term hedging program (excluding the impact of offsetting purchases for
rebalancing and pricing point basis transactions)
4
Excludes volume committed under a long term purchase contract
5
See Appendix for Regulation G reconciliation.
Illustrative for discussion purposes
34
5 |
 TCEH
Open EBITDA (non-GAAP) Estimate 1
Open EBITDA is intended to provide a view of our projected earnings for the fiscal
year ended December 31, 2012, assuming that (1) our expected coal and nuclear generation for 2012
is sold at market observed forward power prices as of 9/30/11 less our expected
costs to produce the power, including expected fuel expense, O&M and SG&A expenses, assuming
CSAPR as issued July 2011. (2) our retail revenues are derived from market observed
retail rates, and (3) we do not engage in any natural gas and power hedging activities. This is not
intended to serve as an indication of what we expect our earnings to be for the
fiscal year ended December 31, 2012, or how we intend to operate the business. EFH Corp. does not
provide projected EBITDA for future periods and, as a result, there is no
comparable GAAP financial measure to which we can reconcile Open EBITDA.
2
Estimated wholesale power prices for 2012 is based on average ERCOT North Hub
prices as of 9/30/11. 3
Includes fuel (excluding nuclear fuel amortization), O&M and SG&A
expenses 4
5
Calculation assumes a 35% overall tax rate
Assumptions
Units
2012E
Wholesale
Total coal and nuclear generation
TWh
70 -
72
Estimated
power
price²
$/MWh
$36 -
$38
Average
coal
and
nuclear
cost³
$/MWh
$30 -
$32
Retail
Revenues
4
$
$4.2 -
$5.0
Profitability
percentage
(after
tax)
5
%
5 -
10%
TCEH
Open
EBITDA
(non-GAAP)¹
Estimate
12E: $ millions
$700 - $1,300
2012E
35
Based
on
a
10.5¢
/
kWh
average
residential
pricing
and
~$2.0
billion
of
small
and
large
business
revenue
based
on
trailing
12
months
(Q4
2010
and
Q1-Q3
2011).
For
residential
new
offer
pricing
please
go
to
www.powertochoose.org. |
 Appendix –
Regulation G Reconciliations
36 |
 37
Table 1: EFH Corp. Net Debt Reconciliation
As of September 30, 2011
$ millions
Description
9/30/11
Short-term borrowings²
0
Long-term debt due currently
462
Long-term debt, less amounts due currently
35,298
Total debt
35,760
Less:
Cash and cash equivalents
(838)
Restricted cash
(1,031)
Net debt
33,891
1
GAAP basis which reflects deconsolidation of Oncor. Oncor’s total debt
is ~$5.9 billion, added to EFH Corp.’s debt equals ~$41.7 billion.
2
Excludes $211 million at TXU Receivables Company related to the accounts receivable
securitization program. 1 |
 38
Table 2: TCEH Total Debt Reconciliation
As of September 30, 2011
$ millions
1
Excludes $211 million at TXU Receivables Company related to the accounts receivable
securitization program. Description
9/30/11
Short-term borrowings¹
0
Long-term debt due currently
444
Long-term debt, less amounts due currently
29,251
Total debt
29,695 |
 39
Table 3: Oncor Net Debt Reconciliation
As of September 30, 2011
$ millions
Description
9/30/11
Short-term borrowings
553
Long-term debt due currently
493
Long-term debt, less amounts due currently
4,882
Total debt
5,928
Less:
Cash and cash equivalents
(2)
Restricted cash
(84)
Net debt
5,842 |
 Table 4:
TCEH Adjusted EBITDA Reconciliation Three and Nine Months Ended September 30,
2010 and 2011 $ millions
Factor
Q3 10
Q3 11
YTD 10
YTD 11
Net loss
(3,690)
(709)
(3,646)
(1,660)
Income tax expense (benefit)
214
(375)
260
(874)
Interest expense and related charges
852
1,372
2,516
3,020
Depreciation and amortization
345
371
1,027
1,097
EBITDA
(2,279)
659
157
1,583
Adjustments to EBITDA (pre-tax):
Interest income
(23)
(20)
(65)
(66)
Amortization of nuclear fuel
38
35
102
104
Purchase accounting adjustments
33
32
124
147
Impairment of assets and inventory write down
-
427
1
427
Impairment of goodwill
4,100
-
4,100
-
Unrealized net (gain) loss resulting from hedging transactions
(767)
(138)
(1,615)
247
EBITDA amount attributable to consolidated unrestricted subsidiaries
-
(2)
-
(5)
Amortization of ”day one”
net loss on Sandow 5 power purchase agreement
(9)
-
(19)
-
Corp. depreciation, interest and income tax expense included in SG&A
4
4
9
11
Noncash compensation expense
-
5
11
8
Severance expense
-
50
3
52
Transition and business optimization costs
4
1
18
2
33
Transaction and merger expenses
5
9
9
29
28
Restructuring and other
6
2
(3)
1
70
Expenses incurred to upgrade or expand a generation station
7
-
-
100
100
TCEH Adjusted EBITDA per Incurrence Covenant
1,109
1,076
2,940
2,739
Expenses related to unplanned generation station outages
31
71
122
162
Pro forma adjustment for Oak Grove 2 reaching 70% capacity in Q2
2011
8
-
7
-
32
Other adjustments allowed to determine Adjusted EBITDA per Maintenance Covenant
9
10
-
19
8
TCEH Adjusted EBITDA per Maintenance Covenant
1,150
1,154
3,081
2,941
1
Includes amortization of the intangible net asset value of retail and wholesale
power sales agreements, environmental credits, coal purchase contracts, nuclear fuel contracts and power
purchase agreements and the stepped up value of nuclear fuel. Also includes
certain credits and gains on asset sales not recognized in net income due to purchase accounting.
2
Impairment of assets includes impairment of emissions allowances
and certain assets relating to mining operations due to EPA rule and impairment of
land. 3
Includes
expenses
recorded
under
stock-based
compensation
accounting
standards
and
excludes
capitalized
amounts.
4
Includes certain incentive compensation expenses, systems development professional
fees related to major generation operations and retail billing / customer care computer applications
and costs relating to certain growth initiatives.
5
Includes costs related to the 2007 merger and the Sponsor Group management
fee. 6
Includes net third-party fees paid in connection with the amendment and
extension of the TCEH Senior Secured Facilities, gains on termination of a long-term power sales contract and
settlement of amounts due from a hedging/trading counterparty, and reversal of
certain liabilities accrued in purchase accounting. 7
Reflects noncapital outage costs.
8
Represents the annualization of the actual six months ended September 30, 2011
EBITDA results for Oak Grove 2, which achieved the requisite 70% average capacity factor in the second
quarter 2011.
9
Primarily pre-operating expenses related to Oak Grove and Sandow 5 generation
facilities. 40
3
2
1 |
 41
EFH Corp. Investor Relations Contacts
Rima Hyder
Director, Investor Relations
214-812-5090
rima.hyder@energyfutureholdings.com
Charles Norvell
Senior Analyst, Investor Relations
214-812-8062
charles.norvell@energyfutureholdings.com
|