Attached files
| file | filename |
|---|---|
| 8-K - FORM 8-K - US BANCORP \DE\ | c24209e8vk.htm |
Exhibit 99.1

| Andy CecereVice Chairman and CFONovember 4, 2011 BancAnalysts Association of Boston Conference |
| Forward-looking Statements and Additional Information The following information appears in accordance with the Private Securities Litigation Reform Act of 1995: This presentation contains forward-looking statements about U.S. Bancorp. Statements that are not historical or current facts, including statements about beliefs and expectations, are forward-looking statements and are based on the information available to, and assumptions and estimates made by, management as of the date made. These forward-looking statements cover, among other things, anticipated future revenue and expenses and the future plans and prospects of U.S. Bancorp. Forward-looking statements involve inherent risks and uncertainties, and important factors could cause actual results to differ materially from those anticipated. Global and domestic economies could fail to recover from the recent economic downturn or could experience another severe contraction, which could adversely affect U.S. Bancorp's revenues and the values of its assets and liabilities. Global financial markets could experience a recurrence of significant turbulence, which could reduce the availability of funding to certain financial institutions and lead to a tightening of credit, a reduction of business activity, and increased market volatility. Continued stress in the commercial real estate markets, as well as a delay or failure of recovery in the residential real estate markets, could cause additional credit losses and deterioration in asset values. In addition, U.S. Bancorp's business and financial performance is likely to be negatively impacted by effects of recently enacted and future legislation and regulation. U.S. Bancorp's results could also be adversely affected by continued deterioration in general business and economic conditions; changes in interest rates; deterioration in the credit quality of its loan portfolios or in the value of the collateral securing those loans; deterioration in the value of securities held in its investment securities portfolio; legal and regulatory developments; increased competition from both banks and non-banks; changes in customer behavior and preferences; effects of mergers and acquisitions and related integration; effects of critical accounting policies and judgments; and management's ability to effectively manage credit risk, residual value risk, market risk, operational risk, interest rate risk and liquidity risk. For discussion of these and other risks that may cause actual results to differ from expectations, refer to U.S. Bancorp's Annual Report on Form 10-K for the year ended December 31, 2010, on file with the Securities and Exchange Commission, including the sections entitled "Risk Factors" and "Corporate Risk Profile" contained in Exhibit 13, and all subsequent filings with the Securities and Exchange Commission under Sections 13(a), 13(c), 14 or 15(d) of the Securities Exchange Act of 1934. Forward-looking statements speak only as of the date they are made, and U.S. Bancorp undertakes no obligation to update them in light of new information or future events.This presentation includes non-GAAP financial measures to describe U.S. Bancorp's performance. The reconciliations of those measures to GAAP measures are provided within or in the appendix of the presentation. These disclosures should not be viewed as a substitute for operating results determined in accordance with GAAP, nor are they necessarily comparable to non-GAAP performance measures that may be presented by other companies. |

| U.S. Bancorp OverviewPerformanceCapital ManagementPositioned to Win |
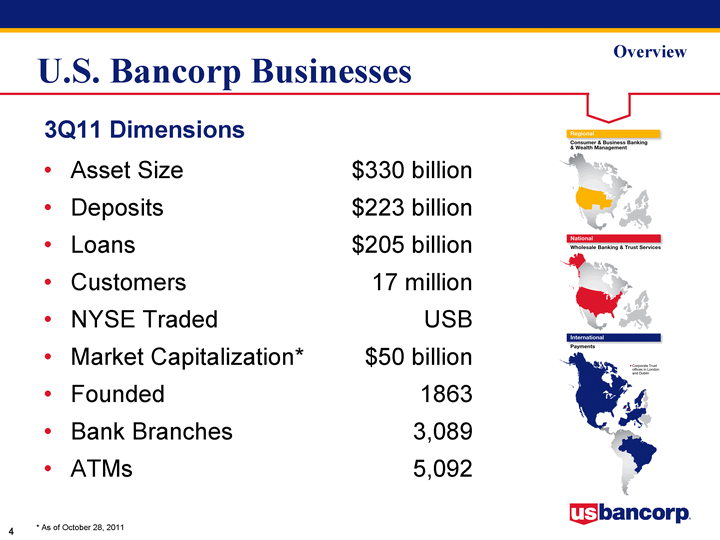
| U.S. Bancorp Businesses 3Q11 Dimensions Asset Size $330 billionDeposits $223 billionLoans $205 billionCustomers 17 millionNYSE Traded USBMarket Capitalization* $50 billionFounded 1863Bank Branches 3,089ATMs 5,092 * As of October 28, 2011 Overview |
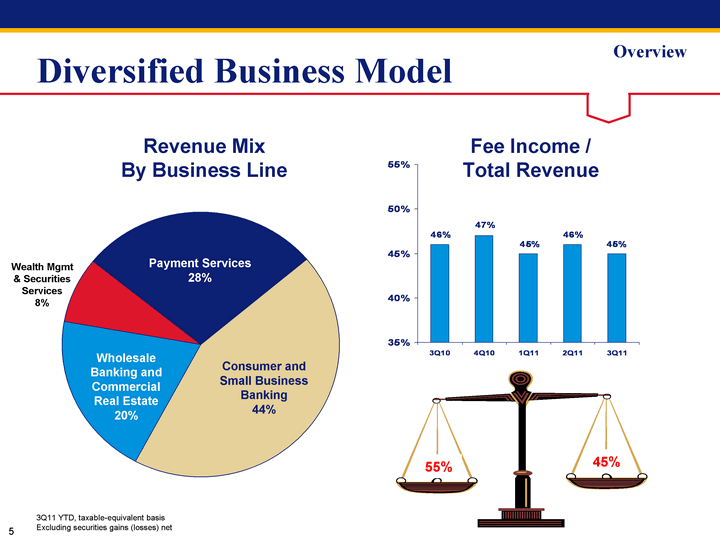
| Consumer Wholesale PCTAM Payments Treas & Corp Support Revenue 44 20 8 28 0 Diversified Business Model 3Q11 YTD, taxable-equivalent basisExcluding securities gains (losses) net Revenue MixBy Business Line Fee Income /Total Revenue Consumer andSmall Business Banking44% Payment Services28% Wealth Mgmt& Securities Services8% Wholesale Banking and Commercial Real Estate20% 3Q10 4Q10 1Q11 2Q11 3Q11 Fee Income 0.46 0.47 0.45 0.46 0.45 Core 0 0 0 0 55% 45% Overview |

| U.S. Bancorp OverviewPerformanceCapital ManagementPositioned to Win |

| 3Q10 4Q10 1Q11 2Q11 3Q11 Loans 192.5 195.5 197.6 198.8 202.2 Deposits 182.7 190.3 204.3 209.4 215.4 Loan and Deposit Growth Average BalancesYear-Over-Year Growth 3Q11 Acquisition AdjustedLoan Growth = 4.5%Deposit Growth = 13.2% 2.4%$197.6 4.0%$198.8 5.0%$202.2 5.8%$192.5 2.0%$195.5 11.9%$204.3 14.2%$209.4 17.9%$215.4 9.8%$182.7 5.2%$190.3 $ in billions Performance |

| Loan Growth vs. Peers Average balances; USB loan growth above adjusted for FCB acquisitionUSB reported loan growth 3Q11 vs. 2Q11 = 1.7%, 3Q11 vs. 3Q10 = 5.0%Source: company reports; Peer banks: BAC, BBT, FITB, JPM, KEY, PNC, RF, STI and WFC USB Peer 1 Peer 2 Peer 3 Peer 4 Peer 5 Peer 6 Peer 7 Peer 8 Peer 9 Loan Growth 0.017 0.013 0.013 0.011 0.009 0.006 0.004 0.004 -0.007 -0.009 USB Peer 1 Peer 2 Peer 3 Peer 4 Peer 5 Peer 6 Peer 7 Peer 8 Peer 9 Deposit Growth 0.045 0.026 0.02 0.015 0.008 0.001 -0.002 -0.007 -0.06 -0.087 Loan Growth3Q11 vs. 2Q11 Loan Growth3Q11 vs. 3Q10 Performance |

| 2007 Noninterest Bearing 33334 Savings 58298 Time 39813 Loan and Deposit Growth vs. Peers 3Q11 Noninterest Bearning 64228 Savings 115163 Time 43241 3Q11 Commercial 53832 Commercial Real Estate 35603 Residential Mortgage and Home Equity 53534 Credit Card 16332 Other Retail 30069 Covered 15398 2007 Commercial 51074 Commercial Real Estate 29207 Residential Mortgage and Home Equity 39223 Credit Card 10956 Other Retail 23367 Covered 0 Commercial Commercial Real Estate Residential Mtg and Home Equity Credit Card Other Retail Covered Noninterest-bearing Savings Time 33% 19% 26% 7% 15% 26% 17% 26% 8% 8% 15% 25% 45% 30% 29% 52% 19% USB +33% USB +70% Peer Median +29% Source: SNLPeer banks: BAC, BBT, FITB, JPM, KEY, PNC, RF, STI and WFC Peer Median +6% Performance Ending Deposits4Q07$131 billion Ending Deposits3Q11$223 billion Ending Loans4Q07$154 billion Ending Loans3Q11$205 billion |

| Revenue Growth Total RevenueYear-Over-Year Growth 7.9% 7.9% 4.6% 3.8% 4.5% 3Q10 4Q10 1Q11 2Q11 3Q11 Reported 4587 4721 4519 4690 4795 Performance NII Pay DSC Trust Mtg Comml Other East 55 17 9 5 5 4.5 4.5 Fee Income45% Net InterestIncome55% Service Charges Trust & Inv Mgmt Mortgage Comm'l Products All Other Payments 20% 11% 11% 10% 10% 38% Revenue Diversification3Q11 Taxable-equivalent basisPayments = credit and debit card revenue, corporate payment products revenue and merchant processing servicesService charges = deposit service charges, treasury management fees and ATM processing services USB RecordRevenue 3Q11 |
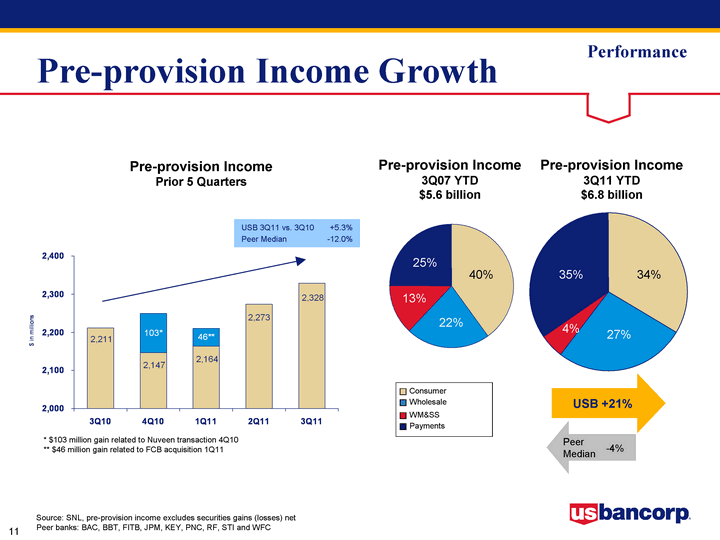
| 3Q10 4Q10 1Q11 2Q11 3Q11 Reported 2211 2147 2164 2273 2328 Adjusted 0 103 46 0 0 Pre-provision Income Growth 2011 Consumer 34 Wholesale 27 Wealth Management 5 Payments 35 2007 Consumer 40 Wholesale 22 Wealth Management 13 Payments 25 Pre-provision Income3Q07 YTD$5.6 billion Pre-provision Income3Q11 YTD$6.8 billion 22% 40% 13% 25% 27% 34% 4% 35% Consumer Wholesale WM&SS Payments USB +21% Source: SNL, pre-provision income excludes securities gains (losses) netPeer banks: BAC, BBT, FITB, JPM, KEY, PNC, RF, STI and WFC PeerMedian -4% Performance Pre-provision IncomePrior 5 Quarters * $103 million gain related to Nuveen transaction 4Q10** $46 million gain related to FCB acquisition 1Q11 USB 3Q11 vs. 3Q10 +5.3%Peer Median -12.0% |
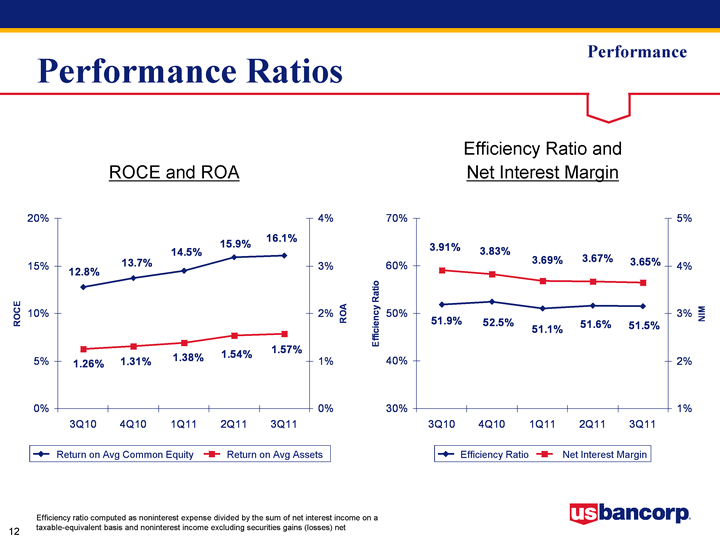
| Performance Ratios 3Q10 4Q10 1Q11 2Q11 3Q11 Return on Avg Common Equity 0.128 0.137 0.145 0.159 0.161 Return on Avg Common Equity 0.128 0.137 0.145 0.159 0.161 Return on Avg Assets 0.0126 0.0131 0.0138 0.0154 0.0157 3Q10 4Q10 1Q11 2Q11 3Q11 Efficiency Ratio 0.519 0.525 0.511 0.516 0.515 Net Interest Margin 0.0391 0.0383 0.0369 0.0367 0.0365 ROCE and ROA Efficiency Ratio andNet Interest Margin Return on Avg Common Equity Return on Avg Assets Efficiency Ratio Net Interest Margin Efficiency ratio computed as noninterest expense divided by the sum of net interest income on a taxable-equivalent basis and noninterest income excluding securities gains (losses) net Performance |

| Performance Metrics vs. Peers Performance Source: SNL and company reports; Peer banks: BAC, BBT, FITB, JPM, KEY, PNC, RF, STI and WFC USB Peer 1 Peer 2 Peer 3 Peer 4 Peer 5 Peer 6 Peer 7 Peer 8 Peer 9 ROA 0.0116 0.0106 0.0097 0.0073 0.0066 0.0009 0.0008 0 USB Peer 1 Peer 2 Peer 3 Peer 4 Peer 5 Peer 6 Peer 7 Peer 8 Peer 9 ROCE 0.126 0.099 0.098 0.077 0.069 USB Peer 1 Peer 2 Peer 3 Peer 4 Peer 5 Peer 6 Peer 7 Peer 8 Peer 9 ER 0.496 0.557 0.571 0.581 0.596 0.6 0.663 0.692 0.703 0.716 Return onAverage Assets Return on AverageCommon Equity Efficiency Ratio USB Peer 1 Peer 2 Peer 3 Peer 4 Peer 5 Peer 6 Peer 7 Peer 8 Peer 9 ROA 0.0157 0.0133 0.0126 0.0123 0.0107 0.0098 0.0088 0.0076 0.005 0.0047 USB Peer 1 Peer 2 Peer 3 Peer 4 Peer 5 Peer 6 Peer 7 Peer 8 Peer 9 ROCE 0.161 0.119 0.119 0.114 0.101 0.09 0.088 0.083 0.042 0.029 USB Peer 1 Peer 2 Peer 3 Peer 4 Peer 5 Peer 6 Peer 7 Peer 8 Peer 9 ER 0.515 0.599 0.605 0.616 0.628 0.649 0.661 0.667 0.667 0.711 Since 1Q08 3Q11 |

| Credit Quality 3Q07 4Q07 1Q08 2Q08 3Q08 4Q08 1Q09 2Q09 3Q09 4Q09 1Q10 2Q10 3Q10 4Q10 1Q11 2Q11 3Q11 NPA $ Change 76 49 155 290 357 489 727 626 386 184 91 -261 -171 -212 -159 -217 -226 NPA % Change 0.13 0.08 0.22 0.34 0.31 0.33 0.37 0.23 0.12 0.05 0.02 -0.07 -0.05 -0.06 -0.05 -0.06 -0.07 3Q07 4Q07 1Q08 2Q08 3Q08 4Q08 1Q09 2Q09 3Q09 4Q09 1Q10 2Q10 3Q10 4Q10 1Q11 2Q11 3Q11 NCO $ Change 8 26 68 103 102 134 156 141 112 69 25 -21 -119 -58 -132 -58 -78 NCO % Change 0.041884817 0.130653266 0.302222222 0.351535836 0.257575758 0.269076305 0.246835443 0.17893401 0.12056 0.07 0.02 -0.02 -0.11 -0.06 -0.14 -0.07 -0.1 $ in millions, linked quarter change* Excluding Covered Assets (assets subject to loss sharing agreements with FDIC), 1Q11 change in NPAs excludes FCB acquisition ($287 million) Change in Net Charge-offs Change in Nonperforming Assets* NCO $ Change (Left Scale) NCO % Change (Right Scale) NPA $ Change (Left Scale) NPA % Change (Right Scale) 103 68 (21) 25 69 112 141 156 134 102 155 290 91 184 386 626 727 489 357 (261) (119) (171) (58) (212) (132) (159) (78) (217) (58) (226) Performance |
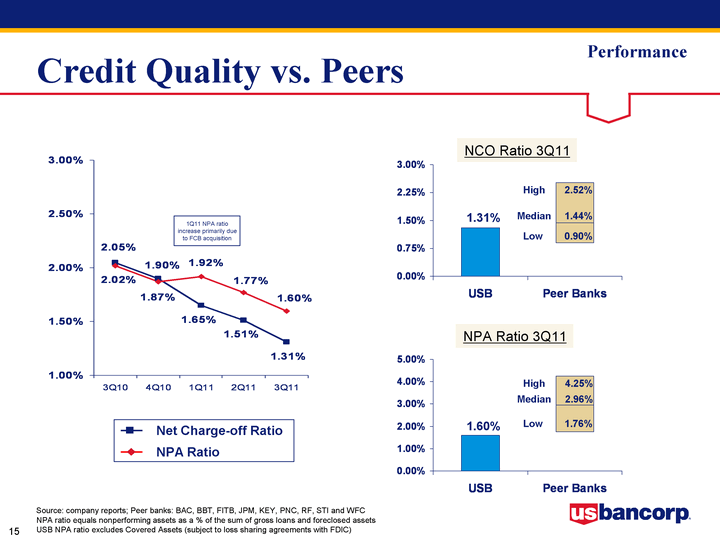
| Credit Quality vs. Peers Source: company reports; Peer banks: BAC, BBT, FITB, JPM, KEY, PNC, RF, STI and WFCNPA ratio equals nonperforming assets as a % of the sum of gross loans and foreclosed assetsUSB NPA ratio excludes Covered Assets (subject to loss sharing agreements with FDIC) 3Q09 4Q09 3Q10 4Q10 1Q11 2Q11 3Q11 Charge-off Ratio 0.0227 0.023 0.0205 0.019 0.0165 0.0151 0.0131 NPA Ratio 0.0214 0.0225 0.0202 0.0187 0.0192 0.0177 0.016 USB Peer Banks USB 0.0131 0 Low 0 0.009 Median 0 0.0054 High 0 0.0108 USB Peer Banks USB 0.016 0 Low 0 0.0176 Median 0 0.012 High 0 0.0129 NCO Ratio 3Q11 NPA Ratio 3Q11 1.31% 0.90% 1.44% 2.52% High Median Low 4.25% 2.96% 1.76% 1.60% High Median Low Net Charge-off Ratio NPA Ratio 1Q11 NPA ratio increase primarily due to FCB acquisition Performance |

| Capital Position 4Q07 1Q08 2Q08 3Q08 4Q08 1Q09 2Q09 3Q09 4Q09 1Q10 2Q10 3Q10 4Q10 1Q11 2Q11 3Q11 TARP 0 0 0 0 24.4 25.3 0 0 0 0 0 0 0 0 0 0 Tier 1 Capital Ratio 0.083 0.086 0.085 0.085 0.106 0.109 0.094 0.095 0.096 0.099 0.101 0.103 0.105 0.108 0.11 0.108 Tier 1 Common Ratio 0.056 0.057 0.056 0.057 0.051 0.054 0.067 0.068 0.068 0.071 0.074 0.076 0.078 0.082 0.084 0.085 Tier 1 Capital 17.5 18.5 18.6 18.9 18 18.9 21.7 22 22.6 23.3 24 24.9 25.9 26.8 27.8 28.1 TARP Equity Tier 1 Capital Tier 1 Capital Ratio Tier 1 Common Ratio Performance 9/30/11 Tier 1Common RatioBasel III:8.2% Anticipated Basel III definitions reflect adjustments to the related elements as proposed in December 2010 by regulatory agencies |
| U.S. Bancorp OverviewPerformanceCapital ManagementPositioned to Win |

| Capital Management CapitalManagement Strong capital generation and historically high payout ratioGoal to resume normal capital management Reinvest Acquisitions Dividends ShareRepurchases 20 - 40% Targets: Investment criteria:Strategic fitReturn > cost of capital (10-11%) |

| Investing in Organic Growth Technology InvestmentsTier 4 Data CenterBranch Hardware and SoftwareInternet ChannelHome Mtg Origination PlatformMobile Banking ChannelCall Center TelephonyDistribution Channel Integration 2005 2006 2007 2008 2009 2010 2011 Fcst CapX 301 540 484 519 772 856 650 Capital Expenditures Capital expenditures approved by Capital Expenditures Committee We continue to invest:Wholesale Banking and Commercial Real EstateFootprint expansionNew products and servicesConsumer and Small Business BankingBranch technologyAcquisitionsOptimal denovo branch expansionWealth Management and Securities ServicesCorporate Trust acquisitionsAscent Private Capital ManagementPayment ServicesInternational expansionMobile paymentsAcquisitionsEnterprise Revenue Office CapitalManagement |

| Investing in Acquisitions PaymentsMerchant processing portfolio of Santander-MexicoMerchant processing portfolio of Citizens National Bank Credit card portfolios from CitiMerchant processing portfolio of MB Financial BankCredit card portfolio of Town North BankSouthern DataCommAIMS LogisticsNumerous small portfoliosJoint ventures:Brazil merchant services companySyncada Consumer and WholesaleBanking operations of First Community Bank (NM)Banking subsidiaries of FBOP CorporationBB&T's Nevada banking operationsFirst Bank of IdahoDowney Savings & Loan AssociationPFF Bank & TrustMellon 1st Business Bank Trust BusinessesBank of America's securitization trust administration businessCorporate trust administration business of F.N.B. Corporation Corporate trust business of AmeriServ FinancialBond trustee business of First Citizens bankMutual fund servicing division of Fiduciary Management, Inc DivestituresDivestiture of FAF Advisors long- term asset management business Consumer Wholesale PCTAM Payments Revenue 43 20 9 28 Consumer and Small BusinessBanking PaymentServices WealthManagementand SecuritiesServices Wholesale Bankingand CommercialReal Estate Acquisitions CapitalManagement |

| Capital Management Strong capital generation and historically high payout ratioGoal to resume normal capital management Reinvest Acquisitions Dividends ShareRepurchases 20 - 40% Targets: 30 - 40% 30 - 40% Investment criteria:Strategic fitReturn > cost of capital (10-11%) 2003 2004 2005 2006 2007 2008 2009 2010 3Q11 YTD Dividends 0.44 0.46 0.5 0.53 0.66 1.06 0.21 0.12 0.21 Share Repurchase 0.11 0.63 0.4 0.59 0.45 0.02 0 0 0.12 Earnings Distributed to Shareholders 90% 55% 109% 112% 111% 108% 21% 12% Dividends ShareRepurchase 33% CapitalManagement |

| U.S. Bancorp OverviewPerformanceCapital ManagementPositioned to Win |
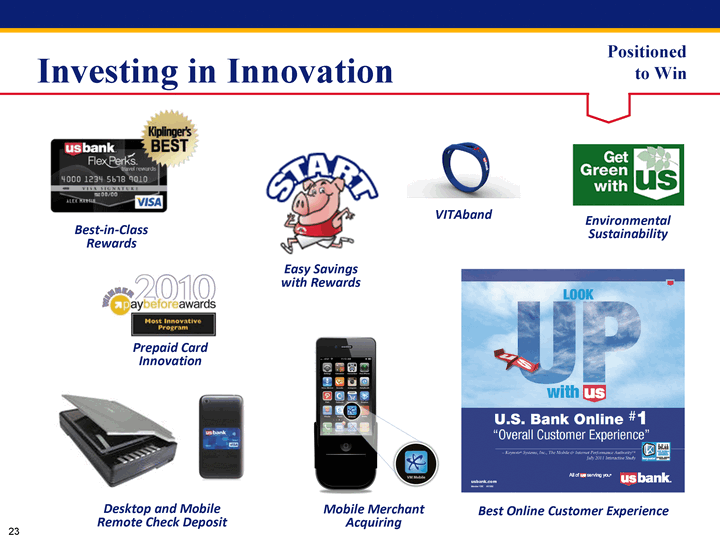
| Investing in Innovation Best-in-Class Rewards Best Online Customer Experience Environmental Sustainability Prepaid Card Innovation Mobile Merchant Acquiring VITAband Desktop and Mobile Remote Check Deposit Positionedto Win |

| Positionedto Win Growing Market Share Middle Market Loan 19th 6th Book RunnerInvestment Grade Loan 11th 5th Book RunnerInvestment Grade Bond NA 13th Lead / Co-leadSource: Thomson Reuters, middle market comprised of North Central and West regions 2010 2007 USB Market Rank MarketShareChange Core Deposits 2.0% 2.6% Consumer Loans 1.8% 2.8%Mortgage Origination 0.7% 3.1%C&I Loans 3.2% 3.4%CRE Loans 1.6% 2.3%Source: SNL and National Mortgage News 2Q11 1Q07 USB Market Share MarketShareChange 2010 2007 USB Market Share MarketShareChange Retail Credit Card 3% 4% Commercial Credit Card 10% 11%Fund Services (# of funds) 18% 18%Wealth Management (AUM) 1% 2%Source: Nilson (card), Investment Co Institute (fund services) and Barron's (wealth mgmt) Municipal Trust (# of issues) 27% 26%Corporate Trust ($ proceeds) 6% 14%Structured Trust ($ proceeds) 13% 15%Source: Securities Data Corp 3Q11 2007 USB Market Share MarketShareChange |

| Long-term Growth Drivers Return on recent and on-going investments in technology, corporate banking, wealth management, corporate trust, payments and M&APositive leverage to economic recovery, particularly payments and trustMarket share gains, including growth in loans and deposits as "flight to quality" continuesEfficiency ratio in the low 50sCredit costs normalize at 100 bps of average loans over the cycleNormalized ROE 16-19%; normalized ROA 1.60-1.90%Unknown regulatory impact = negative biasNormalized capital management = positive biasSuperior execution Positionedto Win |

| Long-term Growth Expectations Long-term Growth ExpectationsNet Interest Income 5-7%Noninterest Income 8-10% Total Revenue 7-8%Noninterest Expense 4-5%Provision for Credit Losses 6-8% Net Income 8-9%EPS 8-10% Positionedto Win |
| Positioned to Win |

| Andy CecereVice Chairman and CFONovember 4, 2011 BancAnalysts Association of Boston Conference |
| Appendix |
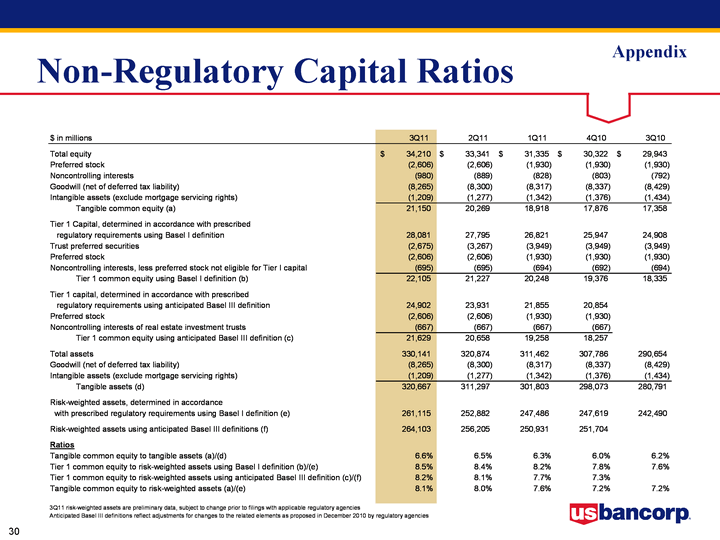
| Non-Regulatory Capital Ratios Appendix |

| Andy CecereVice Chairman and CFONovember 4, 2011 BancAnalysts Association of Boston Conference |
