Attached files
| file | filename |
|---|---|
| 8-K - FORM 8-K - ELECTRONICS FOR IMAGING INC | d251441d8k.htm |
 Long-Term Financial Model
Vincent Pilette
CFO
Exhibit 99.1 |
 What
Do You Need to Know? What Do You Need to Know?
We Have Been Delivering on the Growth Opportunities…
We Have Been Delivering on the Growth Opportunities…
•
Great momentum going into Q4’11
•
Seven consecutive quarters of double-digit revenue growth
•
Four consecutive quarters of double-digit operating margin
•
Reiterating Q4 outlook of $155-160M revenue and $0.31-0.34 EPS
•
Solid revenue growth drivers
•
Plethora of new product introductions in 2
nd
half of 2011
•
Three tuck-in acquisitions closed in 2011
•
Record recurring revenue, ink and software maintenance
•
Multiple drivers of profit growth
•
Inkjet gross margin back to 40% driven by high quality products
•
APPS gross margin expansion as a result of higher sales volume
•
OPEX efficiencies driving towards business target of 40-44% of revenue
•
Active capital management
•
Working capital improvements, growing cash from operations
•
Increased funnel of acquisitions and stock buy-back strategy
2
This information speaks as of the date hereof and is not subject
to update. |
 EFI
Total Addressable Market EFI Total Addressable Market
Addressable Market is Growing at High-Single Digit
Addressable Market is Growing at High-Single Digit
Segments
Estimated
Market
CAGR
(’11-14)
Digital Controllers
•
Medium/high-end Controllers
$1.8B
$0.5B
3-5%
Print Production Software
•
Creative Software
•
Offset workflow
•
Print MIS –
Production
•
Print MIS –
Packaging
•
Web-to-Print
•
Other
$5.0B
$0.3B
$0.3B
$0.3B
4-5%
4-5%
~8%
S/WF Digital Printers
•
SWF Printer Ink
•
WF Printer Ink
$1.3B
10-12%
Labeling Digital Printers
•
Digital Printer ink
•
Conversion-ready Analog
$0.7B
13-15%
(1) SOURCE: I.T. Strategies,
Info-Trends, EFI business intelligence
•
Today, EFI’s direct
addressable market
amounts to $3.5B growing
at ~8% CAGR
•
#1 market share in high-
end controllers
•
#1 market share in
business automation
software for commercial
printers
•
Plethora of new product
introductions in Inkjet
3
(2) The 2011E information speaks as of the date hereof and is not subject to
update. |
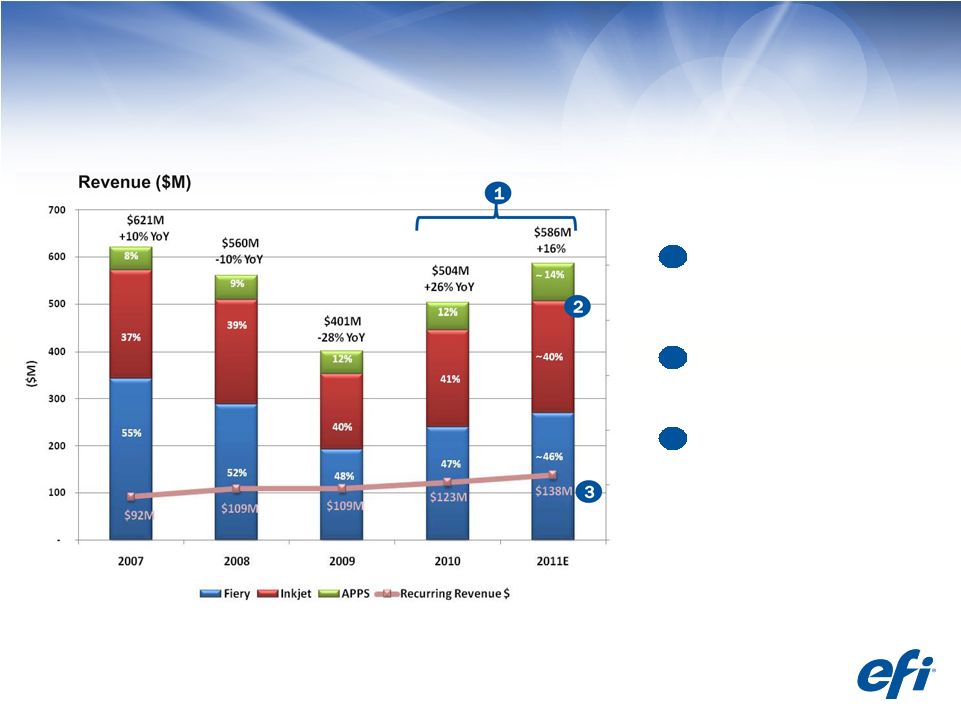 Historical Revenue Trend & FY 2011 Estimate
Revenue Mix is Changing and Recurring Revenue is Growing
Revenue Mix is Changing and Recurring Revenue is Growing
4
Two years of double-digit
revenue growth, on track to
pass record year (2007)
Driving revenue mix and
diversification of portfolio
Recurring revenue growing
at 11% CAGR (‘07 –
’11),
43% of non-Fiery revenue,
23% of total revenue
(1) 2011E based on Q4’11 midpoint of company’s outlook (Revenue of
$155-160M and non-GAAP EPS of $0.31-0.34). (2) The 2011E
information speaks as of the date hereof and is not subject to update.
~
~
~
3
2
1 |
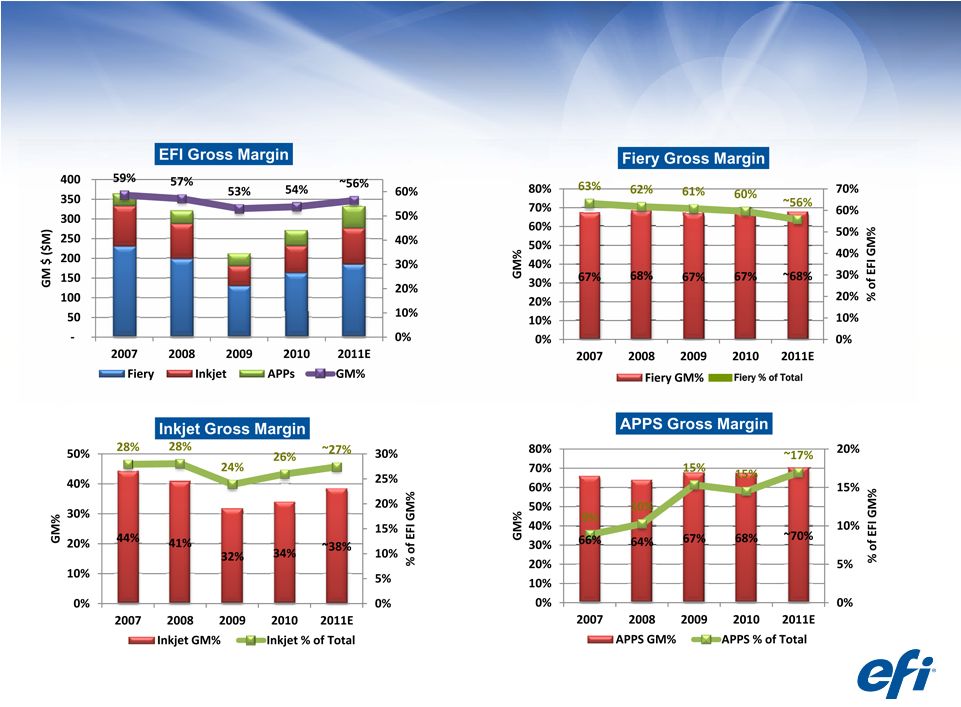 Non-GAAP Gross Margin % Trend
Expanding Gross Margin While Diversifying Gross Profit Sources
Expanding Gross Margin While Diversifying Gross Profit Sources
5
(1) 2011E based on Q4’11 midpoint of company’s outlook (Revenue of
$155-160M and non-GAAP EPS of $0.31-0.34). (2) Non-GAAP
numbers have been adjusted to exclude certain items. See GAAP to non-GAAP reconciliation and our use of non-GAAP information.
(3) The 2011E information speaks as of the date hereof and is not subject to
update. |
 Cost
Structure Trend Cost Structure Trend
Lowering Spend as % of Revenue
Lowering Spend as % of Revenue
•
OPEX efficiencies driving towards lower % of revenue
•
OPEX balance between technology investment and direct sales capacity
•
Infrastructure savings leading to higher % of innovation and variable spend
6
(2) Non-GAAP numbers have been adjusted to exclude certain items. See
GAAP to non-GAAP reconciliation and our use of non-GAAP information.
(1) 2011E based on Q4’11 midpoint of company’s outlook (Revenue of
$155-160M and non-GAAP EPS of $0.31-0.34). (3) The 2011E
information speaks as of the date hereof and is not subject to update. |
 Non-GAAP P&L
Returning to Historical Operating Profit Margin Performance
Returning to Historical Operating Profit Margin Performance
2007
2007
2008
2008
2009
2009
2010
2010
2011E
2011E
Revenue
YoY %
$621M
+10%
$560M
-10%
$401M
-28%
$504M
+26%
$586M
+16%
GM %
58.5%
57.1%
53.0%
53.8%
~56%
OPEX
% of Rev
$285M
46%
$278M
50%
$230M
57%
$235M
47%
~$263M
~45%
OP
% of Rev
$78M
12.6%
$42M
7.5%
($18M)
(4.5%)
$36M
7.1%
~$66M
~11%
EPS
$1.19
$0.74
($0.22)
$0.59
$1.08
•
2011 return to double
digit operating profit
margin
•
Moving towards
sustainable profit drop
rate of ~25%+ on
annual basis
•
2011E OP and EPS
growth > 80% YoY
driven by gross margin
improvement and
increased spend
productivity
7
(1) 2011E based on Q4’11 midpoint of company’s outlook (Revenue of
$155-160M and non-GAAP EPS of $0.31-0.34). (3) The 2011E
information speaks as of the date hereof and is not subject to update. (2)
Non-GAAP numbers have been adjusted to exclude certain items. See GAAP to non-GAAP reconciliation and our use of non-GAAP information. |
 Balance Sheet Optimization
Growing Cash from Operations
Growing Cash from Operations
Key
Balance
Sheet
Figures
Q3’07
Q3’08
Q3’09
Q3’10
Q3’11
Total
Cash
&
Investments*
$550M
$202M
$270M
$207M
$203M
YTD Cash Flow from
Operations
% of Revenue
$54M
12%
$25M
6%
($26M)
--
$19M
5%
$43M
10%
Working Capital (Days)
52.5
63.7
80.7
61.0
59.2
Accounts Receivable
(net)
$97M
$97M
$80M
$86M
$91M
DSO
56.5
61.4
72.5
61.0
57.2
Net Inventory
$37M
$48M
$44M
$45M
$47M
Inventory Turns
7.0
5.3
4.5
5.5
5.4
Total Assets
$1,199M
$865M
$731M
$685M
$720M
* Excludes $56.9 million long term restricted investments
8 |
 Capital Allocation Strategy
•
Continued focus on cash generation
(~1 x OP on annual basis)
•
Use
of
cash:
the
Board
and
Management will continue to evaluate
options, including:
-
M&A-
strengthening our existing segments,
with accretive deals
-
Continue to
reduce the shares of common
stock outstanding
-
Accumulate cash
•
Currently
we
are
not
focused
on:
-
Transformative acquisition
-
Dividend
9
The 2011E information speaks as of the date hereof and is not subject to
update. |
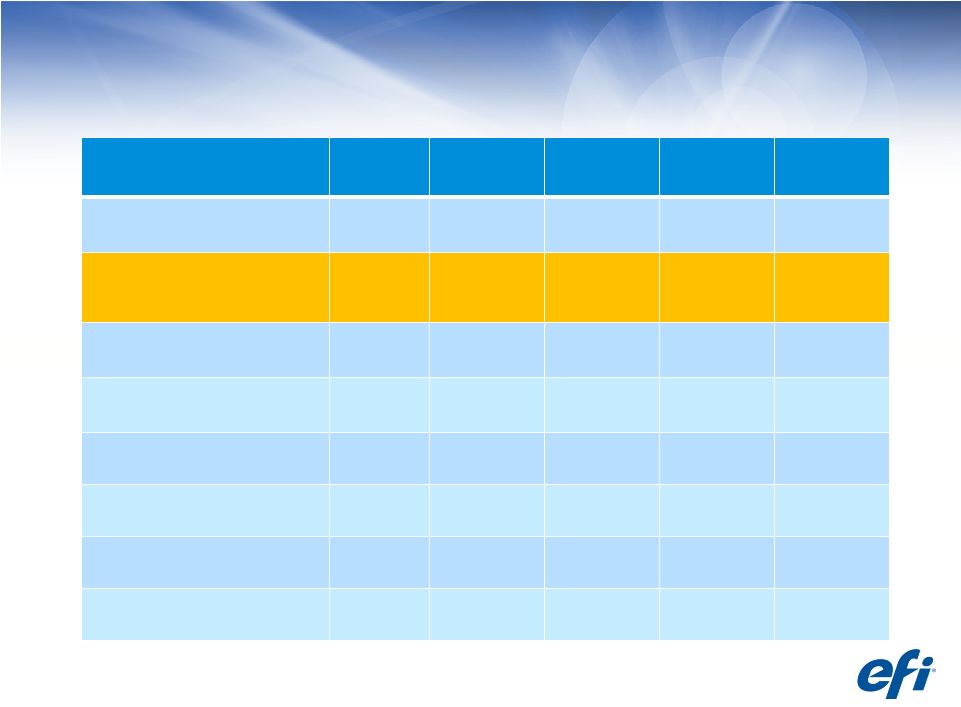
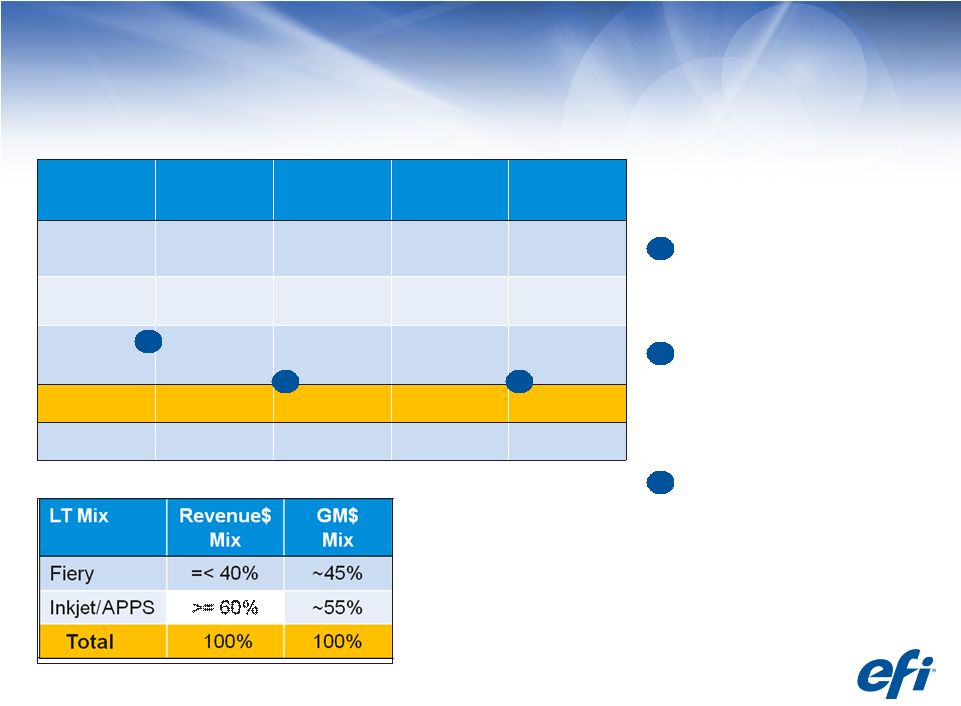 Non-GAAP Long-Term Financial Model
Targeting 12-15% Operating Profit Margin
Targeting 12-15% Operating Profit Margin
2011
LT Model
L-T Growth
Gross
Margin
OPEX
Op Margin
Fiery
GDP+
66% -
68%
Inkjet
10% -15%
~ 40%
APPS
10% -
20%
> 70%
Total
~ 10%
55%-
57%
40%-
44%
12%-
15%
53-55%
40-44%
10-14%
~10%
2010 LT model
10
Raising long term APPS
revenue growth target to
10-20% YoY
Raising EFI long-term GM
rate to 55-57% driven by
APPS GM expansion and
revenue mix
Raising EFI long-term
operating profit margin
range to 12-15% of revenue
1
1
2
2
3
3
The 2011E information speaks as of the date hereof and is not subject to
update. 6-10%
6-10%
GDP+
66-68%
~40%
67-69%
2010 LT model
2010 LT model
2010 LT model |
 Appendix
 |
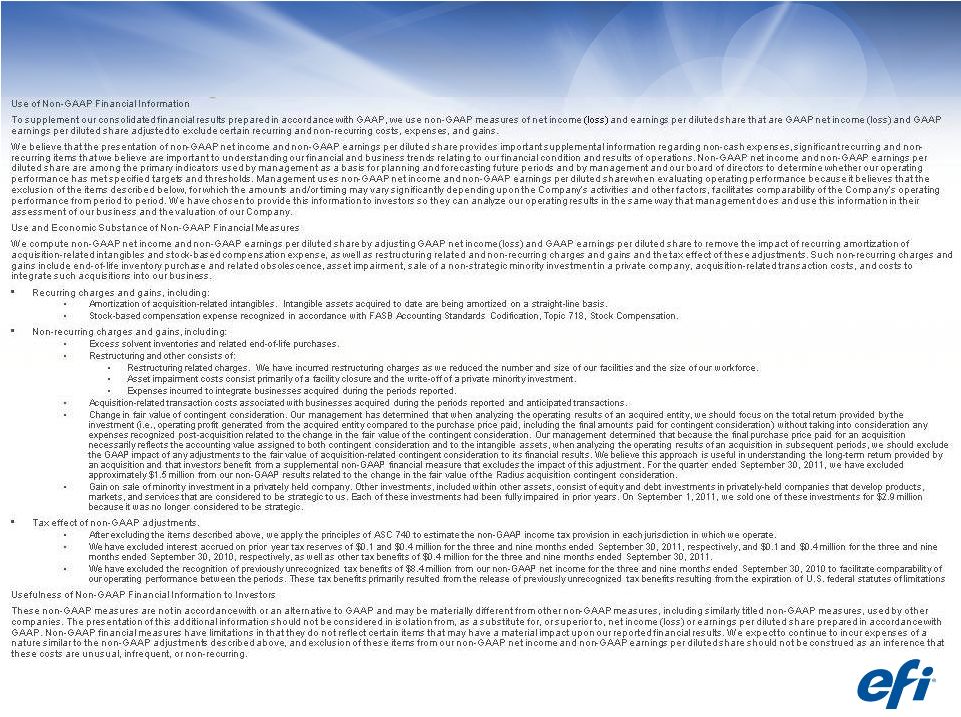 About our Non-GAAP Net Income
and Adjustments
and Adjustments
This information speaks as of the date hereof and is not subject
to update.
12 |
           Q3
2011 Results Summary Q3 2011 Results Summary
.
This information speaks of the date hereof and is not subject to
update.
$M
Q3 2011
Q2 2011
% Change
Q3 2010
% Change
NON-GAAP
Revenue
147.3
$
141.2
$
4%
129.0
$
14%
Operating Profit
16.5
14.1
17%
11.1
49%
Operating Profit %
11.2%
10.0%
1.2 pts
8.6%
2.6 pts
Net Income
11.6
11.3
3%
10.7
8%
EPS
0.25
$
0.23
$
9%
0.23
$
9%
GAAP
GAAP Net Income
6.1
3.6
69%
13.4
(54%)
GAAP EPS
0.13
$
0.07
$
86%
0.29
$
(55%)
Non-GAAP numbers have been adjusted to exclude certain items. See GAAP to
non-GAAP reconciliation and our use of non-GAAP information.
13 |
 Reconciliation of GAAP to Non-GAAP
•
This information speaks of the date hereof and is not subject to update.
•
Non-GAAP numbers have been adjusted to exclude certain items. See our description of
our use of non-GAAP information. 14
GAAP to Non-GAAP Reconciliation ($M)
Q110
Q210
Q310
Q410
FY10
Q111
Q211
Q311
FY11 YTD
GAAP
Net Income (Loss)
(11.4)
(2.5)
13.4
8.0
7.5
6.2
3.6
6.1
16.0
EPS
(0.25)
$
(0.06)
$
0.29
$
0.17
$
0.16
$
0.13
$
0.07
$
$0.13
0.33
$
ADJUSTMENTS
COGS: Excess Solvent Inventories &
End of Life Purchases
-
2.3
-
-
2.3
-
-
-
$
-
COGS: Stock Based Compensation Expense
0.3
0.3
0.3
0.2
1.0
0.2
0.4
0.7
$
1.3
OPEX: Stock Based Compensation Expense
3.7
3.0
4.6
3.6
14.9
5.0
6.7
4.6
$
16.2
OPEX: Amortization of Identified Intangibles
2.9
2.9
3.4
3.2
12.4
3.4
3.0
2.3
$
8.7
OPEX: Acquisition-Related Transaction Costs
0.6
0.5
0.1
-
1.2
0.6
0.2
0.7
$
1.6
OPEX: Change in Fair Value of
Contingent Consideration
-
-
-
-
-
-
-
1.5
$
1.5
OPEX: Restructuring and Other
2.0
1.0
1.0
0.3
4.3
1.4
0.4
0.6
$
2.3
OI&E: Gain on Sale of Minority Investment
in a Privately-Held Company
-
-
-
-
-
-
-
(2.9)
$
(2.9)
Tax Effect of Non-GAAP Adjustments
1.7
(3.4)
(12.0)
(2.0)
(15.7)
(3.3)
(3.0)
(2.0)
$
(8.3)
NON-GAAP
Non-GAAP Net Income (Loss)
(0.1)
$
4.0
$
10.7
$
13.3
$
27.9
$
13.5
$
11.3
$
11.6
$
36.4
$
Non-GAAP EPS
-
$
0.09
$
0.23
$
0.28
$
0.59
$
0.28
$
0.23
$
$0.25
0.75
$ |
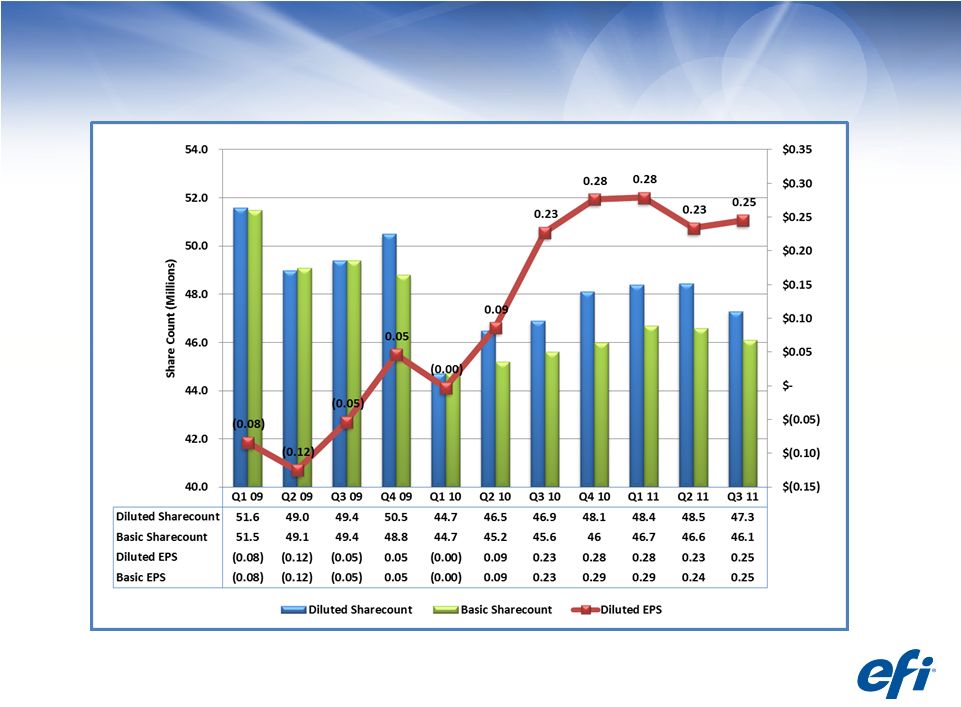 Share Count & Non-GAAP EPS
Non-GAAP numbers have been adjusted to exclude certain items. See GAAP to
non-GAAP reconciliation and our use of non-GAAP information.
15 |