Attached files
| file | filename |
|---|---|
| EX-3.3 - EX-3.3 - CYOPTICS INC | a2206034zex-3_3.htm |
| EX-3.2 - EX-3.2 - CYOPTICS INC | a2206034zex-3_2.htm |
| EX-10.4 - EX-10.4 - CYOPTICS INC | a2206034zex-10_4.htm |
| EX-23.1 - EX-23.1 - CYOPTICS INC | a2205179zex-23_1.htm |
| EX-21.1 - EX-21.1 - CYOPTICS INC | a2206034zex-21_1.htm |
| EX-10.1 - EX-10.1 - CYOPTICS INC | a2206034zex-10_1.htm |
| EX-10.23 - EX-10.23 - CYOPTICS INC | a2206034zex-10_23.htm |
| EX-10.20 - EX-10.20 - CYOPTICS INC | a2206034zex-10_20.htm |
As filed with the Securities and Exchange Commission on November 4, 2011
Registration No. 333-176262
UNITED STATES
SECURITIES AND EXCHANGE COMMISSION
Washington, D.C. 20549
AMENDMENT NO. 2 TO
FORM S-1
REGISTRATION STATEMENT
Under
The Securities Act of 1933
CyOptics, Inc.
(Exact name of Registrant as specified in its charter)
| Delaware (State or other jurisdiction of incorporation or organization) |
3674 (Primary Standard Industrial Classification Code Number) |
95-4745030 (I.R.S. Employer Identification Number) |
9999 Hamilton Blvd.
Breinigsville, PA 18031
Tel: (484) 391-2061
Fax: (484) 397-2014
(Address, including zip code, and telephone number, including area code, of Registrant's principal executive offices)
Ettore J. Coringrato, Jr.
President and Chief Executive Officer
9999 Hamilton Blvd.
Breinigsville, PA 18031
Tel: (484) 391-2061
Fax: (484) 397-2014
(Name, address, including zip code, and telephone number, including area code, of agent for service)
| Copies to: | ||
Caine Moss Richard A. Kline Goodwin Procter LLP 135 Commonwealth Drive Menlo Park, CA 94025 Tel: (650) 752-3100 Fax: (650) 853-1038 |
Jeffrey D. Saper Robert D. Sanchez Daniel S. Peale Wilson Sonsini Goodrich & Rosati Professional Corporation 1700 K Street, NW, Fifth Floor Washington, D.C. 20006 Tel: (202) 973-8800 Fax: (202) 973-8899 |
|
Approximate date of commencement of proposed sale to the public:
As soon as practicable after this registration statement becomes effective.
If any of the securities being registered on this Form are to be offered on a delayed or continuous basis pursuant to Rule 415 under the Securities Act of 1933 check the following box: o
If this Form is filed to register additional securities for an offering pursuant to Rule 462(b) under the Securities Act, please check the following box and list the Securities Act registration statement number of the earlier effective registration statement for the same offering. o
If this Form is a post effective amendment filed pursuant to Rule 462(c) under the Securities Act, check the following box and list the Securities Act registration statement number of the earlier effective registration statement for the same offering. o
If this Form is a post effective amendment filed pursuant to Rule 462(d) under the Securities Act, check the following box and list the Securities Act registration statement number of the earlier effective registration statement for the same offering. o
Indicate by check mark whether the registrant is a large accelerated filer, an accelerated filer, a non-accelerated filer, or a smaller reporting company. See the definitions of "large accelerated filer," "accelerated filer" and "smaller reporting company" in Rule 12b-2 of the Exchange Act. (Check one):
| Large accelerated filer o | Accelerated filer o | Non-accelerated filer ý (Do not check if a smaller reporting company) |
Smaller reporting company o |
The registrant hereby amends this registration statement on such date or dates as may be necessary to delay its effective date until the registrant shall file a further amendment which specifically states that this registration statement shall thereafter become effective in accordance with Section 8(a) of the Securities Act of 1933 or until the registration statement shall become effective on such date as the Securities and Exchange Commission, acting pursuant to said Section 8(a), may determine.
The information in this prospectus is not complete and may be changed. We may not sell these securities until the registration statement filed with the Securities and Exchange Commission is effective. This prospectus is not an offer to sell these securities and we are not soliciting offers to buy these securities in any jurisdiction where the offer or sale is not permitted.
Prospectus
SUBJECT TO COMPLETION, DATED NOVEMBER 4, 2011
Shares

Common Stock
This is the initial public offering of common stock of CyOptics, Inc. We are offering shares of common stock. The estimated initial public offering price is between $ and $ per share.
We intend to apply to have our common stock listed on The NASDAQ Global Select Market under the symbol "CYOP."
Investing in our common stock involves risks. See "Risk factors" beginning on page 12 of this prospectus.
| |
Per share | Total | |||||
|---|---|---|---|---|---|---|---|
Initial public offering price |
|||||||
Underwriting discounts and commissions |
|||||||
Proceeds to CyOptics (before expenses) |
|||||||
We have granted the underwriters a 30-day option to purchase up to additional shares of common stock from us on the same terms and conditions set forth above to cover over-allotments, if any.
Neither the Securities and Exchange Commission nor any state securities commission has approved or disapproved of these securities or determined if this prospectus is truthful or complete. Any representation to the contrary is a criminal offense.
The underwriters expect to deliver the shares on or about , 2011.
J.P. Morgan |
Barclays Capital |
Needham & Company, LLC |
Raymond James |
Roth Capital Partners |
Prospectus dated , 2011
You should rely only on the information contained in this prospectus and in any free writing prospectus prepared by or on behalf of us. We have not, and the underwriters have not, authorized anyone to provide you with information different from, or in addition to, that contained in this prospectus or any related free writing prospectus. This prospectus is an offer to sell only the shares offered hereby but only under circumstances and in jurisdictions where it is lawful to do so. The information contained in this prospectus is current only as of its date.
Through and including, , 2012 (the 25th day after the date of this prospectus), all dealers effecting transactions in these securities, whether or not participating in this offering, may be required to deliver a prospectus. This is in addition to a dealer's obligation to deliver a prospectus when acting as an underwriter and with respect to an unsold allotment or subscription.
For investors outside the United States: neither we nor any of the underwriters have done anything that would permit this offering or possession or distribution of this prospectus in any jurisdiction where action for that purpose is required, other than the United States. You are required to inform yourselves about and to observe any restrictions relating to this offering and the distribution of this prospectus.
i
This summary highlights information contained elsewhere in this prospectus and does not contain all of the information that you should consider in making your investment decision. Before investing in our common stock, you should carefully read this entire prospectus, including our consolidated financial statements and the related notes thereto and the information set forth under the sections "Risk factors" and "Management's discussion and analysis of financial condition and results of operations," in each case appearing elsewhere in this prospectus.
Company overview
We are a leading platform-based provider of core optical technologies enabling bandwidth for high-speed networks. Our solutions provide the fundamental building blocks—the creation, modulation, routing and detection of light—for optical networking, which is a high-performance, cost-effective alternative to traditional networking technologies. We produce active components that create and detect light, passive components that guide and combine light, and packaging solutions that integrate active and passive components into compact, high-performance, power- and cost-efficient products. Through our vertically integrated technology and manufacturing platforms, we design, fabricate and package a broad portfolio of optical components—lasers, detectors, transmitters, receivers and modulators—for module manufacturers and systems providers, including network equipment manufacturers, who sell to communication service providers and enterprises in the Access, Enterprise/Data Center and Long Haul/Metro segments of the communications network, and for other emerging end market applications, such as defense and avionics, high performance computing, medical and security.
Network traffic continues to increase rapidly in volume, volatility and complexity, driven by unprecedented demand for bandwidth-intensive, rich content such as streaming and real-time video, the growth of online social networking and cloud-based computing services, and the proliferation of mobile devices. Optical networking is becoming the de facto transport technology with its attractive bandwidth capacity, reach, reliability, low power consumption and network intelligence capabilities. Within the optical networking value chain, innovation at the optical component level is driving increased functionality, performance and cost savings, and gradually capturing an increasing percentage of optical networking spending.
We believe we are one of the few companies in our industry with vertically integrated technology and manufacturing platforms that span from Indium Phosphide and Silica-on-Silicon fabrication to proprietary, highly automated assembly and test facilities. Our in-house capabilities allow us to offer a dependable supply of quality optical components and modules. Our photonic integrated circuit and components on board solutions incorporate greater functionality and intelligence at the component level, which enables us to serve next-generation, higher speed networks. We continue to leverage and expand upon more than 25 years of research, development and investments, including by the former optoelectronics divisions of Lucent Technologies and Bell Labs, which we obtained through our acquisition of a division of TriQuint Semiconductor, Inc. in 2005, and our broad portfolio of proprietary technologies, which form the foundation of our technical expertise and extensive know-how.
1
We sell our products to a global, diversified customer base that includes module manufacturers and network equipment manufacturers, who in turn sell to communication service providers and enterprises, and to defense and avionics contractors. Our largest customers by revenue during 2010 include Cambridge Industries Group, Ltd., Ciena Corporation, Finisar Corporation, Huawei Technologies Co., Ltd., Source Photonics, Inc. and Superxon Technology, Ltd, and our largest customer by revenue during 2010 in the defense and avionics markets is Lockheed Martin Corporation. We believe that greater than 70% of our revenue was sole-sourced in 2010, which we believe demonstrates the differentiation of our products and gives us significant insight into our customers' product and technology roadmaps.
We believe we have an attractive financial profile, with strong top-line performance. Furthermore, our strong, collaborative design relationships with our customers, which provide us with an understanding of forward-looking customer demand profiles and percent share awards, in combination with our backlog levels provides us with a degree of revenue visibility for the following quarter and also helps us manage our short-term cost structure. We have grown our revenue at a 31.3% compound annual growth rate, or CAGR, from 2005 to 2010 and 55.4% period over period from the six months ended June 30, 2010 to the six months ended June 30, 2011. We have also experienced significant margin expansion, as our income (loss) from operations margin increased from 9.2% in the six months ended June 30, 2010 to 12.9% in the six months ended June 30, 2011. In addition, our non-GAAP adjusted income (loss) from operations margin increased from 11.6% in the six months ended June 30, 2010 to 13.9% in the six months ended June 30, 2011. Adjusted income (loss) from operations margin is not calculated in accordance with generally accepted accounting principles in the United States, or GAAP, and should not be considered as an alternative to income (loss) from operations margin calculated and presented in accordance with GAAP. A reconciliation of this non-GAAP measure to income (loss) from operations margin calculated and presented in accordance with GAAP is included in this prospectus in "Management's discussion and analysis of financial condition and results of operations—Key business metrics—Use of non-GAAP financial measures." We incurred aggregate net losses of $96.1 million from 2005 to 2010.
Industry
Network traffic continues to increase rapidly in volume, volatility and complexity. To address this trend, communication service providers and enterprises are expanding and upgrading their existing network infrastructures.
Optical networking is becoming the de facto transport technology due to its attractive bandwidth capacity, reach, reliability, low power consumption and network intelligence capabilities. Optical components and modules provide the fundamental building blocks—the creation, modulation, routing and detection of light—for the optical network ecosystem, from Long Haul/Metro, Access to the Digital Home, through fiber-to-the-home, to Enterprise/Data Center. Ovum, a third-party industry analyst, estimates the market for optical components and modules was $5.6 billion in 2010 and is forecasted to grow to $10.5 billion in 2015, representing a 13.4% CAGR. However, we believe there are specific market segments and
2
geographies we address that are expected to meaningfully exceed that growth rate. These include:
- •
- Access network segment. Access networks increasingly use
high-speed optical fiber in new deployments and as a replacement for copper lines in legacy networks. Passive optical networks (PON) are currently the fastest-growing broadband Access
technology. Gigabit passive optical networks (GPON) are expected to continue to gain market share over prior passive optical network technologies. According to Ovum, gigabit passive optical
network transceiver sales are projected to grow from $288.5 million in 2010 to $576.7 million in 2015, representing a 14.9% CAGR. However, with China's aggressive fiber-to-the-home
rollout, Dell'Oro, a third-party industry analyst, expects gigabit passive optical network revenue in China to grow by as much as 40% year-over-year in 2011.
- •
- Enterprise/Data Center network segments. Fueled primarily by
server virtualization and cloud computing, server-to-switch connection rates are moving rapidly from 1 gigabit Ethernet to 10 gigabit Ethernet. The adoption of
10 gigabit Ethernet is accelerating the migration of copper to optical fiber and the need for 40 gigabit Ethernet and 100 gigabit Ethernet on data center core uplinks. Traditional
architectures are no longer adequate for 40 gigabit Ethernet and 100 gigabit Ethernet, which require multi-channel architectures to meet the requirements of next-generation
switches. According to Ovum, 100 gigabit Ethernet transceiver sales will increase from $51.6 million in 2010 to $712.6 million in 2015, representing a 69.1% CAGR.
- •
- Long Haul/Metro network segments. Communication service
providers are accelerating deployments of next-generation 40 gigabits per second, or Gbps, and 100Gbps networks. A key emerging technology for next-generation 40Gbps and
100Gbps networks is coherent detection. According to Ovum, revenue from 100Gbps coherent modules will increase from $35.3 million in 2010 to $786.5 million in 2015, representing an 86.0%
CAGR, while revenue from 40Gbps and 100Gbps Long Haul/Metro receivers is forecasted to grow from $66.0 million in 2010 to $494.8 million in 2015, representing a 49.6%
CAGR.
- •
- Other emerging end market applications. Optical components and modules are increasingly being used in emerging end market applications, such as defense and avionics, high performance computing, medical and security, which require high-speed, high-bandwidth data transmission, higher levels of integration and/or high performance laser/receiver solutions.
Demand for increased bandwidth capacity and lower costs is driving higher levels of integration at the module and system level to achieve increased faceplate density, lower power dissipation and greater system functionality. This trend is creating an opportunity for optical component manufacturers to deliver next-generation optical modules and optical components on board solutions, with the technical capabilities mentioned above, directly to network equipment manufacturers. Our existing products and manufacturing solutions provide these key technical capabilities, which we believe enable us to meet the requirements necessary to address current optical networking trends. We believe that innovation at the optical component level is driving increased functionality, higher performance and cost savings in optical networking solutions. Innovative optical component solutions, many of which are based on photonic integrated circuits, such as multi-channel coherent components and tunable lasers, are expected to comprise an increasing percentage of total optical system capital expenditures.
3
For example, according to Cisco Systems, while optical components represent approximately 19% of capital expenditures for 10Gbps systems, they represent approximately 68% for 100Gbps systems.
We believe optical module manufacturers and network equipment manufacturers face many challenges, such as meeting demand for high-performance, high-speed optical solutions, increasing system complexity, decreasing time to market, and reducing capital investment and operating expenses for service providers. We believe these challenges present opportunities that our solutions can address.
Our solutions
We design, fabricate and package a broad portfolio of optical components, including lasers, detectors, transmitters, receivers and modulators. The key benefits of our solutions include:
- •
- High levels of photonic integration. Our in-house
Indium Phosphide and Silica-on-Silicon technology platforms and diverse toolbox of device elements enable the efficient design and scalable, high volume fabrication of a broad
variety of highly integrated photonic integrated circuits that allow us to produce small, reliable and power-efficient solutions.
- •
- High bit rate products. Our high bit rate, bidirectional
optical subassembly products are used in next-generation Access networks (10Gbps or higher), while our photonic integrated circuit-based components and
next-generation modules are used for communication switches in high capacity Enterprise/Data Center (40Gbps or higher) and coherent Long Haul/Metro (40Gbps or higher) networks.
- •
- Cost-efficient solutions. Our highly automated
chip fabrication operations and packaging operations enable us to manufacture our products at high yields and low labor cost, while the re-usability, re-configurability and
scalability of our assembly and test equipment reduces our on-going capital needs. We believe these operational efficiencies enable us to deliver products that are at a lower or competitive cost
relative to our competitors while maintaining a differentiated product portfolio.
- •
- Tailored solutions. We leverage our in-house
hybrid and monolithic photonic integration techniques, highly automated assembly and test manufacturing, cooled and uncooled Indium Phosphide laser fabrication capabilities, and our array of device
and packaging technologies, to tailor our products to each communications network segment.
- •
- Consistent quality and reliability. Our automated manufacturing and control systems that we have built into our device fabrication, packaging and testing processes enable us to deliver products with stable performance, high quality and a high level of reliability.
Competitive strengths
We believe our key competitive strengths include the following:
- •
- Strong institutional knowledge base and track record of technology innovation. We develop industry-leading optical components, including photonic integrated circuit-based components and next-generation modules, by leveraging and expanding upon more than 25 years of investments including those made by the former optoelectronics divisions of
4
Lucent Technologies and Bell Labs, which we obtained through our acquisition of a division of TriQuint Semiconductor, Inc. in 2005, and our broad portfolio of proprietary technologies, which form the foundation of our extensive technical expertise and know-how.
- •
- Greater intelligence at the component level. As the industry
migrates to higher speed networks, increased system-level consolidation and integration is expected to increase optical components' share of capital expenditures and enhance opportunities for
differentiation. Our photonic integrated circuit and components on board solutions, which provide significant performance and cost advantages over traditional, non-integrated components, are well
positioned to capture a larger share of the optical value chain bill of materials at higher network speeds.
- •
- Vertical integration. We believe we are one of the few
companies in our industry with vertically integrated technology and manufacturing platforms that span from Indium Phosphide and Silica-on-Silicon fabrication to proprietary,
highly automated assembly and test facilities. Our comprehensive in-house capabilities allow us to offer our customers a dependable supply of quality optical components and modules, giving
us significant time-to-market, time-to-volume and cost advantages and the ability to respond more quickly to changing market and customer requirements.
- •
- Industry-leading market position. We are a leader in several
of our served market segments and are positioned to be a leader in next-generation components on board and photonic integrated circuit solutions. For example, we believe that our
fiber-to-the-home, bidirectional optical subassembly products were deployed in 49.5% of all gigabit passive optical network and Ethernet passive optical network optical line terminals and 47.3%
of all gigabit passive optical network optical network units sold worldwide in 2010.
- •
- Diversity across network segments, products and
customers. Our revenues are diversified across network segments, allowing us to capitalize on growth in investment cycles in the communications network, and across
products, with more than 2,500 products across various product types. We also have a large, global and diversified customer base.
- •
- Experienced management team with strong execution track-record. Most of our executive officers have more than 15 years of relevant industry experience, with the substantial majority having more than 25 years of relevant experience. Members of our management team and board of directors also played integral roles in leading Lucent Technologies' optoelectronic components business in 2000. We have acquired and successfully integrated five businesses since 2003, and have grown sales from $27.8 million in 2005 to $108.3 million in 2010, representing a 31.3% CAGR.
5
Our strategy
Our goal is to become the leading provider of high-performance optical technologies that enable the rapid growth in high-speed optical networking communications. Key elements of our strategy are as follows:
- •
- Extend leadership in fiber-to-the-home. We intend to maintain
our strong position in our core fiber-to-the-home markets and extend our market share in gigabit passive optical networks by winning new customers and introducing next generation products. We plan to
take advantage of market disruption and product cycle transitions by providing an alternative to traditional transceiver vendors through our bidirectional optical subassembly product offerings and by
developing new products to address emerging fiber-to-the-home applications and technologies.
- •
- Capture an increasing share of the Enterprise/Data Center and Long-Haul/Metro market
segments. We intend to leverage our technology leadership, Indium Phosphide and Silica-on-Silicon integration and
high-performance packaging to establish leadership in 40Gbps and 100Gbps Ethernet multi-channel photonic integrated circuits, receivers and miniaturized tunable lasers for coherent
applications and tunable 10Gbps transmit optical subassembly products for both module manufacturers and network equipment manufacturers. Our goal is to become the market leader in these segments
through a combination of high performance, on-time delivery and low manufacturing cost.
- •
- Continue to grow our defense and avionics business and other emerging end market
applications. We intend to continue to leverage our differentiated technologies and U.S.-based design and manufacturing to address the growing demand
for optical components and modules in defense and avionics and other emerging end market applications.
- •
- Continue our gross margin expansion. We intend to continue
our gross margin improvement through increased scale, manufacturing efficiencies and continued introduction of higher performance products with greater component-level intelligence and integrated
functionality to module manufactures and network equipment manufacturers.
- •
- Selectively pursue complementary acquisitions. We intend to continue to selectively pursue acquisitions that accelerate our revenue growth, complement our strengths, help us execute our strategies and grow our addressable markets.
6
Risk factors
Our business is subject to numerous risks and uncertainties, such as those highlighted in "Risk factors" immediately following this prospectus summary, including:
- •
- We are subject to the cyclical nature of the markets in which we compete and any future downturn may reduce demand for our
products and revenue;
- •
- If spending for optical communications networks does not continue to grow as expected, our business may suffer;
- •
- Given the high fixed cost associated with our vertically integrated business, a reduction in demand for our products may
adversely impact our gross profits and our results of operations;
- •
- We are dependent on our key customers for a significant portion of our revenue and the loss of, or a significant reduction
in orders from, any of our key customers may reduce our revenue and adversely impact our results of operations;
- •
- We face intense competition and continuous pricing pressure in our industry, which could negatively impact our results of
operations and market share; and
- •
- We must continually achieve new design wins and enhance existing products or our business may be harmed.
Corporate information
We were incorporated in the State of Delaware in 1999. Our principal executive offices are located at 9999 Hamilton Boulevard, Breinigsville, Pennsylvania 18031, and our telephone number is (484) 391-2061. Our website address is www.cyoptics.com. Information contained on our website is not incorporated by reference into this prospectus, and you should not consider information contained on our website as part of this prospectus or in deciding whether to purchase shares of our common stock.
Our name is a trademark of CyOptics, Inc. for which we are seeking registration in the United States and selected international jurisdictions. This prospectus contains additional trade names and trademarks of ours and of other companies.
This summary highlights selected information appearing elsewhere in this prospectus and does not contain all the information you should consider before investing in our common stock. You should carefully read this prospectus in its entirety before investing in our common stock, including "Risk factors," and our consolidated financial statements and related notes included elsewhere in this prospectus.
7
Common stock offered by us: Shares
Common stock to be outstanding after this offering: Shares
Use of proceeds
We intend to use the net proceeds from this offering for working capital and general corporate purposes, including capital expenditures. We also may use a portion of the net proceeds to selectively pursue acquisitions that complement our strengths and help us execute our strategies or to repay some or all of the outstanding amounts under our credit facilities. However, we have no understandings or agreements with respect to any such acquisition or investment or debt repayment. See "Use of proceeds."
Proposed NASDAQ Global Select Market symbol: "CYOP"
The number of shares of our common stock to be outstanding following this offering is based on 14,359,377 shares of our common stock outstanding as of June 30, 2011 on a pro forma basis and excludes:
- •
- 1,665,343 shares of common stock issuable upon the exercise of options outstanding as of June 30, 2011, with
a weighted average exercise price of $2.92 per share;
- •
- 26,038 shares of common issuable upon the exercise of outstanding warrants, with a weighted average exercise price of
$10.03 per share; and
- •
- shares of our common stock reserved for future issuance under our stock-based compensation plans, including sh ares of common stock reserved for issuance under our 2011 Stock Option and Incentive Plan, which will become effective in connection with this offering, and any future increase in shares reserved for issuance under such plan.
Unless otherwise noted, the information in this prospectus reflects and assumes the following:
- •
- the conversion of all outstanding shares of our convertible preferred stock into an aggregate of 13,064,838 shares of
common stock upon the closing of this offering;
- •
- a 1-for-52 reverse stock split effected on January 13, 2011;
- •
- the filing of our amended and restated certificate of incorporation immediately prior to the effectiveness of this
offering; and
- •
- no exercise by the underwriters of their over-allotment option.
8
Summary consolidated financial data
The tables below summarize our consolidated financial data. The following summary financial data should be read together with our consolidated financial statements and related notes and "Management's discussion and analysis of financial condition and results of operations" included elsewhere in this prospectus. The data for each of the three years ended December 31, 2010, 2009 and 2008 have been derived from our audited consolidated financial statements appearing elsewhere in this prospectus. The data for the six months ended June 30, 2011 and 2010 have been derived from our unaudited condensed consolidated financial statements appearing elsewhere in this prospectus. The historical results presented below are not necessarily indicative of financial results to be achieved in future periods.
| |
Year ended December 31, | Six months ended June 30, | ||||||||||||||||||
|---|---|---|---|---|---|---|---|---|---|---|---|---|---|---|---|---|---|---|---|---|
| (in thousands, except for share and per share amounts) |
||||||||||||||||||||
| 2010 |
2009 |
2008 |
2011 |
2010 |
||||||||||||||||
| |
|
|
|
(unaudited) |
||||||||||||||||
Consolidated Statement of Operations Data: |
||||||||||||||||||||
Total revenues |
$ | 108,336 | $ | 65,730 | $ | 72,564 | $ | 76,611 | $ | 49,290 | ||||||||||
Cost of revenues |
79,375 | 60,646 | 63,157 | 55,894 | 36,272 | |||||||||||||||
Gross profit |
28,961 | 5,084 | 9,407 | 20,717 | 13,018 | |||||||||||||||
Gross margin |
26.7% | 7.7% | 13.0% | 27.0% | 26.4% | |||||||||||||||
Operating expenses: |
||||||||||||||||||||
Research and development |
12,010 | 19,540 | 19,031 | 7,324 | 5,754 | |||||||||||||||
Sales and marketing |
2,671 | 3,181 | 3,888 | 1,736 | 1,253 | |||||||||||||||
General and administrative |
3,270 | 7,972 | 5,904 | 1,811 | 1,469 | |||||||||||||||
Severance and liquidation expenses |
— | 6,465 | — | — | — | |||||||||||||||
Asset impairment |
— | 3,221 | 9,841 | — | — | |||||||||||||||
Total operating expenses |
17,951 | 40,379 | 38,664 | 10,871 | 8,476 | |||||||||||||||
Income (loss) from operations |
11,010 | (35,295 | ) | (29,257 | ) | 9,846 | 4,542 | |||||||||||||
Interest expense, net |
(1,328 | ) | (1,617 | ) | (2,148 | ) | (554 | ) | (684 | ) | ||||||||||
Other (expense) income, net |
(292 | ) | 1,574 | (642 | ) | (192 | ) | 49 | ||||||||||||
Income (loss) before income taxes |
9,390 | (35,338 | ) | (32,047 | ) | 9,100 | 3,907 | |||||||||||||
Provision for income taxes |
501 | 128 | 177 | 2,226 | 202 | |||||||||||||||
Net income (loss) |
$ | 8,889 | $ | (35,466 | ) | $ | (32,224 | ) | $ | 6,874 | $ | 3,705 | ||||||||
Net income (loss) attributable to common stockholders |
$ | 1,115 | $ | (35,466 | ) | $ | (32,224 | ) | $ | 48,092 | $ | 464 | ||||||||
Net income (loss) per common share(1): |
||||||||||||||||||||
Basic |
$ | 0.73 | $ | (23.74 | ) | $ | (22.68 | ) | $ | 36.90 | $ | 0.30 | ||||||||
Diluted |
$ | 0.73 | $ | (23.74 | ) | $ | (22.68 | ) | $ | 0.45 | $ | 0.30 | ||||||||
Weighted average number of shares outstanding: |
||||||||||||||||||||
Basic |
1,519,124 | 1,494,124 | 1,420,786 | 1,303,131 | 1,521,391 | |||||||||||||||
Diluted |
1,523,183 | 1,494,124 | 1,420,786 | 15,110,781 | 1,521,391 | |||||||||||||||
Pro forma net income per common share (unaudited)(2): |
||||||||||||||||||||
Basic |
||||||||||||||||||||
Diluted |
||||||||||||||||||||
Weighted average number of shares used in pro forma computation (unaudited)(2) : |
||||||||||||||||||||
Basic |
||||||||||||||||||||
Diluted |
||||||||||||||||||||
Pro forma as adjusted net income per common share (unaudited)(3): |
||||||||||||||||||||
Basic |
||||||||||||||||||||
Diluted |
||||||||||||||||||||
Weighted average number of shares used in pro forma as adjusted computation (unaudited)(3): |
||||||||||||||||||||
Basic |
||||||||||||||||||||
Diluted |
||||||||||||||||||||
(1) We applied the two-class method to compute net income (loss) per common share which requires that earnings for the period be allocated between common and participating securities based upon their respective contractual rights to receive distributed and undistributed earnings. See Note 2 of the notes to each of our consolidated financial statements and our unaudited condensed consolidated financial statements included elsewhere in this prospectus.
9
(2) The pro forma basic and diluted net income per share have been calculated assuming (i) the conversion of all outstanding shares of convertible preferred stock into an aggregate of 13,064,838 shares of our common stock as of the beginning of the applicable period and (ii) the reclassification of outstanding preferred stock warrants from long-term liabilities to additional paid-in capital as of the beginning of the applicable period. The numerator of the pro forma net income per share calculation is derived by adding $ for the year ended December 31, 2010 related to the preferred stock warrant liability and by excluding the impact of $ for the six months ended June 30, 2011 related to the redemption of preferred stock below carrying value to arrive at net income attributable to common shares of approximately $ and $ for the year ended December 31, 2010 and the six months ended June 30, 2011, respectively.
(3) The pro forma as adjusted basic and diluted net income per share have been calculated assuming (i) the conversion of all outstanding shares of convertible preferred stock into an aggregate of 13,064,838 shares of our common stock as of the beginning of the applicable period and (ii) the reclassification of outstanding preferred stock warrants from long-term liabilities to additional paid-in capital as of the beginning of the applicable period, (iii) the sale by us of the shares of common stock in our initial public offering as of the beginning of the applicable period, and (iv) the filing of our amended and restated certificate of incorporation which will occur immediately prior to the closing of the offering. The numerator of the pro forma net income per share calculation is derived by adding for the year ended December 31, 2010 related to the preferred stock warrant liability, and subtracting for the six months ended June 30, 2011 related to the redemption of preferred stock below carrying value to net income as reported to arrive at net income attributable to common shares of approximately $ and $ for the year ended December 31, 2010 and the six months ended June 30, 2011, respectively.
The following table presents our summary consolidated balance sheet data as of June 30, 2011:
- •
- on an actual basis;
- •
- on a pro forma basis to give effect to (i) the conversion of all outstanding shares of preferred stock into shares
of our common stock and all outstanding warrants to purchase preferred stock into warrants to purchase common stock; and (ii) the reclassification of our outstanding preferred stock warrants
from long-term liabilities to additional paid-in capital; and
- •
- on a pro forma as adjusted basis to give effect to the conversion and reclassification described in the prior bullet and (i) the sale by us of the shares of common stock offered by this prospectus at an initial public offering price of $ per share, the midpoint of the price range on the cover of this prospectus, and after deducting the underwriting discounts and commissions and estimated offering expenses payable by us; and (ii) the filing of our amended and restated certificate of incorporation, which will occur immediately prior to the closing of this offering.
| |
June 30, 2011 | |||||||||
|---|---|---|---|---|---|---|---|---|---|---|
| (in thousands) |
Actual |
Pro forma |
Pro forma as adjusted |
|||||||
Consolidated Balance Sheet Data: |
||||||||||
Working capital(1) |
$ | 58,761 | $ | 58,761 | $ | |||||
Total assets |
107,372 | 107,372 | ||||||||
Long-term obligations, including current portion |
12,065 | 11,826 | ||||||||
Convertible preferred stock |
95,404 | — | ||||||||
Total stockholders' equity (deficit) |
(30,104 | ) | 65,539 | |||||||
(1) Working capital is defined as total current assets less total current liabilities.
10
Key business metrics
| |
Years ended December 31, | Six months ended June 30, |
||||||||||||||
|---|---|---|---|---|---|---|---|---|---|---|---|---|---|---|---|---|
| (in thousands, except percentages) |
2010 |
2009 |
2008 |
2011 |
2010 |
|||||||||||
GAAP metrics: |
||||||||||||||||
Total revenues |
$ | 108,336 | $ | 65,730 | $ | 72,564 | $ | 76,611 | $ | 49,290 | ||||||
Gross profit |
$ | 28,961 | $ | 5,084 | $ | 9,407 | $ | 20,717 | $ | 13,018 | ||||||
Gross margin |
26.7% | 7.7% | 13.0% | 27.0% | 26.4% | |||||||||||
Income (loss) from operations |
$ | 11,010 | $ | (35,295 | ) | $ | (29,257 | ) | $ | 9,846 | $ | 4,542 | ||||
Income (loss) from operations margin |
10.2% | (53.7)% | (40.3)% | 12.9% | 9.2% | |||||||||||
Net income (loss) |
$ | 8,889 | $ | (35,466 | ) | $ | (32,224 | ) | $ | 6,874 | $ | 3,705 | ||||
Net cash provided by (used in) operating activities |
$ | 8,233 | $ | (14,766 | ) | $ | (23,176 | ) | $ | 4,523 | $ | 4,040 | ||||
Non-GAAP metrics: |
||||||||||||||||
Adjusted gross profit* |
$ | 30,483 | $ | 9,198 | $ | 10,381 | $ | 21,126 | $ | 13,528 | ||||||
Adjusted gross margin* |
28.1% | 14.0% | 14.3% | 27.6% | 27.4% | |||||||||||
Adjusted income (loss) from operations* |
$ | 13,175 | $ | (19,664 | ) | $ | (16,861 | ) | $ | 10,623 | $ | 5,726 | ||||
Adjusted income (loss) from operations margin* |
12.2% | (29.9)% | (23.2)% | 13.9% | 11.6% | |||||||||||
Adjusted net income (loss)* |
$ | 11,216 | $ | (19,835 | ) | $ | (19,828 | ) | $ | 7,517 | $ | 4,860 | ||||
EBITDA* |
15,694 | (25,167 | ) | (22,928 | ) | 11,618 | 7,380 | |||||||||
EBITDA margin* |
14.5% | (38.3)% | (31.6)% | 15.2% | 15.0% | |||||||||||
Adjusted EBITDA* |
$ | 15,953 | $ | (12,056 | ) | $ | (12,523 | ) | $ | 11,701 | $ | 7,390 | ||||
Adjusted EBITDA margin* |
14.7% | (18.3)% | (17.3)% | 15.3% | 15.0% | |||||||||||
Free cash flow* |
$ | 5,306 | $ | (18,217 | ) | $ | (25,015 | ) | $ | 117 | $ | 3,295 | ||||
* These performance measures are not calculated in accordance with GAAP. A reconciliation of these non-GAAP measures to the most directly comparable measure calculated and presented in accordance with GAAP is included in this prospectus in "Management's discussion and analysis of financial condition and results of operations—Key business metrics—Use of non-GAAP financial measures." These non-GAAP measures should not be considered as an alternative to any measure of financial performance calculated and presented in accordance with GAAP. In addition, our non-GAAP measures may not be comparable to similarly titled measures of other companies because other companies may not calculate such similarly titled measures in the same manner as we do. We prepare our non-GAAP measures to eliminate the impact of items that we do not consider indicative of our core operating performance. We encourage you to evaluate these adjustments, the reasons we consider them appropriate and the material limitations of these non-GAAP measures as described in "Management's discussion and analysis of financial condition and results of operations—Key business metrics—Use of non-GAAP financial measures."
11
Investing in our common stock involves a high degree of risk. You should consider carefully the risks and uncertainties described below, together with all of the other information in this prospectus, including our consolidated financial statements and related notes, before deciding whether to purchase shares of our common stock. If any of the following risks is realized, our business, financial condition, results of operations and prospects could be materially and adversely affected. In that event, the price of our common stock could decline and you could lose part or all of your investment.
Risks related to our business and industry
We are subject to the cyclical nature of the markets in which we compete and any future downturn may reduce demand for our products and revenue.
In the past, the markets in which we compete have experienced significant downturns, often connected with, or in anticipation of, the maturation of product cycles—for both manufacturers' and their customers' products—and with declining general economic conditions. These downturns have been characterized by diminished product demand, production overcapacity, high inventory levels and accelerated erosion of average selling prices. These markets are impacted by the aggregate capital expenditures of service providers and enterprises as they build out and upgrade their network infrastructure. These markets are highly cyclical and characterized by constant and rapid technological change, pricing pressures, evolving standards and wide fluctuations in product supply and demand.
We may experience substantial period-to-period fluctuations in future results of operations. Any future downturn in the markets in which we compete, or changes in demand for our products from our customers, could result in a significant reduction in our revenue. It may also increase the volatility of the price of our common stock.
In addition, the communications networks industry from time to time has experienced and may again experience a pronounced downturn. To respond to a downturn, many service providers and enterprises may slow their capital expenditures, cancel or delay new developments, reduce their workforces and inventories and take a cautious approach to acquiring new equipment and technologies from network equipment manufacturers, any of which could cause our results of operations to fluctuate from period to period and harm our business.
If spending for optical communications networks does not continue to grow as expected, our business may suffer.
Our future success depends on continued capital investment in global communications network infrastructure and on continued demand for high-bandwidth, high-speed communications networks and the ability of network equipment manufacturers to meet this demand. Spending on communications networks is limited by several factors, including limited investment resources, uncertainty regarding the long-term evolution and sustainability of service provider business models and a changing regulatory environment. We cannot be certain that demand for bandwidth-intensive content will continue to grow at the same pace in the future or that communications service providers will continue to increase spending to meet such demand. If expectations for growth of communications networks and bandwidth consumption are not realized and investment in communications networks does not grow as anticipated, our business, results of operations and gross margins could be harmed.
12
Given the high fixed costs associated with our vertically integrated business, a reduction in demand for our products may adversely impact our gross profits and our results of operations.
We have a high fixed cost base due to our vertically integrated business model, including the fact that 536 of our employees as of June 30, 2011 were employed in manufacturing engineering and operations and business operations. We may not be able to adjust these fixed costs quickly to adapt to rapidly changing market conditions. Our gross profit and gross margin is greatly affected by our sales volume and volatility on a quarterly basis and the corresponding absorption of fixed manufacturing overhead expenses. In addition, because we are a vertically integrated manufacturer, insufficient demand for our products may subject us to the risk of high inventory carrying costs and increased inventory obsolescence. Given our vertical integration, the rate at which we turn inventory has historically been low when compared to our cost of sales. We do not expect this to change significantly in the future and believe that we will have to maintain a relatively high level of inventory compared to our cost of sales. As a result, we continue to expect to have a significant amount of working capital invested in inventory. We may be required to write down inventory costs in the future and our high inventory costs may have an adverse effect on our gross profits and our results of operations.
We are dependent on our key customers for a significant portion of our revenue and the loss of, or a significant reduction in orders from, any of our key customers may reduce our revenue and adversely impact our results of operations.
Historically, we have generated most of our revenue from a limited number of customers. In 2010, our top ten customers represented 61.9% of our total revenue, with only Finisar Corporation (15.3% of revenues) representing more than 10.0% of our revenues. Furthermore, sales of certain of our current products are dependent upon and concentrated among a limited number of customers and the successful introduction of future component and module products could similarly be dependent upon a limited number of customers. As a result, the loss of, or a significant reduction in orders from any our key customers would materially and adversely affect our revenue and results of operations. Adverse events affecting our key customers could also negatively affect our revenue and results of operations. In addition, network equipment manufacturers may continue to consolidate, and we may not be able to offset any potential decline in revenue arising from the consolidation of our existing customers with revenue from new customers or additional revenue from the combined company.
We face intense competition which could negatively impact our results of operations and market share.
The communications networking industry is highly competitive. Our competitors range from large, international companies offering a wide range of products beyond the optical networking component or module markets to smaller companies specializing in niche markets within the optical networking component and module markets. Some of our competitors, particularly larger, more diversified companies, have substantially greater technical, financial and marketing resources, name recognition, manufacturing capacity, and/or better-established relationships with customers than we have. Some of our competitors have more resources to develop or acquire, and more experience in developing or acquiring, new products and technologies and in creating market awareness for and selling these products and technologies. Some of our competitors may be able to develop new products more quickly than we can and may be able to develop products that are more reliable or which provide more functionality than our products. All of these advantages may cause us to lose sales or market share or reduce the prices of our products.
13
We also face competition from some of our customers who evaluate our capabilities against the merits of manufacturing products internally. Such customers may be able to internally manufacture competitive products at a lower cost than we would charge these customers. As a result, customers may purchase fewer of our products or we may be forced to lower our selling prices, both of which would negatively impact our financial results.
We must continually achieve new design wins and enhance existing products or our business may be harmed.
The markets for our products are characterized by frequent new product introductions, changes in customer and market requirements and evolving industry standards, all with an underlying pressure to reduce cost and meet stringent reliability and qualification requirements. Our future performance will depend on our successful and timely development, introduction and market acceptance of new and enhanced products that address these challenges. The anticipated or actual introduction of new and enhanced products by us and by our competitors may lead our customers to defer or cancel orders for our existing products and rapid obsolescence and value diminution of existing inventory.
The development of new, technologically-advanced products is a complex and uncertain process requiring frequent innovation, highly-skilled engineering and development personnel and significant capital expenditures, as well as the accurate anticipation of technological and market trends. Product development delays may result from numerous factors, including:
- •
- changing product specifications and customer requirements;
- •
- unanticipated engineering and manufacturing complexities and problems discovered during development and manufacturing;
- •
- difficulties in reallocating engineering resources and overcoming resource limitations; and
- •
- changing market or competitive product requirements.
We have in the past experienced slowdowns in demand for existing products and delays in new product development, and such delays may occur again in the future. We cannot assure you that we will be able to identify, develop, manufacture, market or support new or enhanced products successfully, if at all, or on a timely basis. To the extent customers defer or cancel orders for our products for any reason or we fail to achieve new design wins, our competitive and financial position would be adversely affected and our ability to grow our revenue would be impaired.
Further, we cannot assure you that our new products will gain market acceptance or that we will be able to respond effectively to product introductions by competitors, technological changes or emerging industry standards. We also may not be able to develop and evolve the underlying core technologies necessary to create new products and enhancements, license these technologies from third parties, or remain competitive in our markets.
We are under continuous pressure to reduce the prices of our products.
The communications networking industry has historically been characterized by declining product prices for components over time as a result of new product and technology introductions, increased competition, aggressive pricing from our competitors and pricing pressure from customers. We have reduced the prices of some of our products in the past, and we expect to continue to experience pricing pressure for our products in the future. When
14
seeking to maintain or increase their market share, our competitors may also reduce the prices of their products. In addition, our customers may have the ability to internally develop and manufacture competing products at a lower cost than we would otherwise charge, which would add additional downward pressure on our selling prices. If we are unable to offset future reductions in our average selling prices by increasing our sales volume, by reducing our costs and expenses or by introducing new products at higher price points, our profitability could suffer.
Our manufacturing processes are extremely complex and specialized and disruptions could have a material adverse effect on our business, financial condition and results of operations.
The fabrication of our products involves extremely complex and precise processes. We may experience delays, disruptions or quality control problems in our manufacturing operations. For instance, minor impurities, contamination of the clean room environment, errors in any step of the fabrication process, defects in equipment or materials, human error, or a number of other factors can cause a substantial percentage of our products to be rejected or malfunction. We could also experience a disruption in our fabrication facility for our products due to equipment maintenance, repairs and/or upgrades.
Additionally, manufacturing yields depend on a number of factors, including the stability and manufacturability of the product design, manufacturing improvements gained over cumulative production volumes, the quality and consistency of component parts and the nature and extent of customization requirements by customers. Capacity constraints, raw materials shortages, logistical issues, labor shortages, the introduction of new product lines and changes in customer requirements, manufacturing facilities or processes, or those of some third party contract manufacturers and suppliers of raw materials and components have historically caused, and may in the future cause, reduced manufacturing yields. Moreover, an increase in the rejection and rework rate of products during the quality control process before, during or after manufacture would result in our experiencing lower yields. As a result of all of these potential difficulties, we could incur additional costs to fulfill customer orders and/or product shipments to our customers could be delayed, each of which would negatively affect our revenue, costs, competitive position and reputation.
We rely on a limited number of suppliers for certain raw materials, and if they stopped, decreased or delayed shipments to us, it could have an adverse effect on our business.
We depend on a limited number of suppliers for certain raw materials we have qualified to use in the manufacture of certain of our products. Some of these suppliers could disrupt our business if they stop, decrease or delay shipments or if the materials they ship have quality or consistency issues. Some of these materials are available only from a limited number of suppliers or have been qualified only from a single supplier. For example, we currently rely on two suppliers, Finisar Corporation and Alps Electric (USA), Inc., for certain piece parts used in our products that comprised approximately 23% and 21% of our total revenue for the year ended December 31, 2010, respectively. Collectively, such piece parts were used in products that comprised approximately 23% of our revenues for the year ended December 31, 2010 as there was significant overlap between the products that incorporated such piece parts. Although we rely on these two suppliers as the single source of our supply for such piece parts, these piece parts are available from a limited number of other sources. We may also face material shortages if we experience increased demand for materials beyond what our qualified suppliers can deliver on a timely basis or at all. Although we strive to mitigate shortages, any
15
inability on our part to timely obtain sufficient quantities of critical piece parts at reasonable costs could adversely affect our ability to meet demand for our products, which could cause our revenue, results of operations, or both to suffer.
We typically have not entered into long-term agreements with our suppliers and, therefore, our suppliers could stop supplying materials at any time or fail to supply adequate quantities of piece parts on a timely basis. It is difficult, costly, time consuming and, on short notice, sometimes impossible for us to identify and qualify new suppliers. The reliance on a sole supplier, single qualified vendor or limited number of suppliers could result in delivery and quality problems and reduced control over product pricing, reliability and performance. We have in the past had to change suppliers, which has, in some instances, resulted in delays in product development and manufacturing and loss of revenue.
If we fail to retain our key personnel or if we fail to attract additional qualified personnel, we may not be able to achieve our anticipated level of growth and our business could suffer.
Our future success depends, in part, on our ability to attract and retain key personnel, including our senior management team and others, and on the continued contributions of members of our senior management team and key technical personnel, each of whom would be difficult to replace. The loss of any of the members of our senior management team or key personnel or the inability to continue to attract and retain qualified personnel could have a material adverse effect on our business. Competition for highly skilled technical personnel is extremely intense, and we continue to face challenges identifying, hiring and retaining qualified personnel in certain areas of our business. If we fail to retain our senior management and other key personnel or if we fail to attract additional qualified personnel, our business could suffer.
Our success will depend on our ability to anticipate and quickly respond to rapidly changing technologies and customer requirements.
The communications networking industry is characterized by substantial investment in new technologies and the development of diverse and changing technologies. For example, new technologies are required to satisfy the emerging standards for 40Gbps and 100Gbps data transmission in communications networks. Furthermore, fast introduction of new products can be critical to success. It is difficult to displace an existing supplier for a particular type of product once a network equipment manufacturer has chosen a supplier, even if a later-to-market product provides superior performance or cost efficiency. If we are unable to make our new or enhanced products commercially available on a timely basis, we may lose existing and potential customers for extended time periods, which would cause our financial results to suffer.
The communications networking industry has long product development cycles requiring us to incur product development costs without assurances of an acceptable investment return.
The communications networking industry is highly capital-intensive. Large volumes of equipment and support structures are installed with considerable expenditures of funds and other resources, and long investment return period expectations. At the component supplier level, this creates considerable, typically multi-year, gaps between the commencement of new product development and volume purchases. Accordingly, we often incur significant research and development costs for products that, at the earliest, will be purchased by our customers
16
long after much of the cost is incurred and, in some cases, may never be purchased due to changes in industry or customer requirements in the interim.
Due to changing industry and customer requirements, we are constantly developing new products and developing and using new technologies in our products. These development activities can and are expected to necessitate a significant investment of capital. Our new products often require a long time to develop because of their complexity and rigorous testing and qualification requirements. Additionally, developing a manufacturing approach with an acceptable cost structure and yield for new products can be expensive and time-consuming. Due to the costs and length of research and development and manufacturing process cycles, we may not recognize revenue from new products until long after such expenditures are incurred, if at all, and our gross margin may decrease if our costs are higher than expected.
If our customers do not qualify our products for use, then our results of operations may suffer.
Prior to placing volume purchase orders with us, most of our customers require us to obtain their approval of our new and existing products, and our customers often audit our manufacturing facilities and perform other vendor evaluations during this process. The approval process, generally known as qualification, involves product sampling and reliability testing and collaboration with our product management and engineering teams in the design and manufacturing stages. For example, we have developed new technologies and products that are key components in our customers' systems for 40Gbps and 100Gbps data transmission. While we are shipping certain products for 40Gbps and 100Gbps system designs today, many of our products for these systems are currently being qualified for use by our customers. If we are unable to qualify these and other of our products with customers, then our future revenues would be lower than expected, and we may not be able to recover the costs of our investments in new and existing products, each of which would have an adverse effect on our results of operations.
In addition, due to rapid technological changes in our markets, a customer may cancel or modify a design project before we have qualified our product or begun volume manufacturing of a qualified product. It is unlikely that we would be able to recover the expenses for cancelled or unutilized custom design projects. It is difficult to predict with any certainty whether our customers will delay or terminate product qualification or the frequency with which customers will cancel or modify their projects, but any such delay, cancellation or modification would have a negative effect on our results of operations.
Rapidly changing standards and regulations could make our products obsolete, which would cause our revenue and results of operations to suffer.
We design our products to conform to regulations established by governments and to standards set by industry standards bodies worldwide, such as the American National Standards Institute, the European Telecommunications Standards Institute, the International Telecommunications Union and the Institute of Electrical and Electronics Engineers, Inc. Various industry organizations are currently considering whether and to what extent to create standards for elements used in 100Gbps systems. Because certain of our products are designed to conform to current specific industry standards, if competing or new standards emerge that are preferred by our customers, we would have to make significant expenditures to develop new products. If our customers adopt new or competing industry standards with which our products are not compatible, or the industry groups adopt standards or governments issue
17
regulations with which our products are not compatible, our existing products would become less desirable to our customers and our revenue and results of operations would suffer.
Customer demand is difficult to forecast and, as a result, we may be unable to optimally match production with customer demand.
We make planning and spending decisions, including determining the levels of business that we will seek and accept, production schedules, component procurement commitments, personnel needs and other resource requirements, based on our estimates of customer demand. The majority of our products are purchased pursuant to individual purchase orders. While our customers generally provide us with their demand forecasts, they are typically not contractually committed to buy any quantity of products beyond firm purchase orders. The short-term nature of our customer commitments and the possibility of unexpected changes in demand for their products limit our ability to accurately predict future customer demand. On occasion, customers have required rapid increases in production, which has strained our resources. We may not have sufficient capacity at any given time to meet the volume demands of our customers, or one or more of our suppliers may not have sufficient capacity at any given time to meet our volume demands. Conversely, a downturn in the markets in which our customers compete can cause, and in the past has caused, our customers to significantly reduce the amount of products ordered from us or to cancel existing orders, leading to lower utilization of our facilities. Because many of our costs and operating expenses are relatively fixed, reduction in customer demand would have an adverse effect on our gross margin, income (loss) from operations and cash flow. During an industry downturn, there is also a higher risk that our trade receivables would be uncollectible.
It could be discovered that our products contain defects that may cause us to incur significant costs, divert our management's attention, result in a loss of customers and result in product liability claims.
Our products are complex and undergo quality testing and formal qualification by our customers and us. However, defects may occur from time to time. Our customers' testing procedures involve evaluating our products under likely and foreseeable failure scenarios and over varying amounts of time. For various reasons, such as the occurrence of performance problems that are unforeseeable in testing or that are detected only when products age or are operated under peak stress conditions, our products may fail to perform as expected long after customer acceptance. Failures could result from faulty components or design, problems in manufacturing or other unforeseen reasons. For the majority of our products, we provide a product warranty of one year or less from date of shipment. For select customers, we provide extended warranties beyond our normal product warranty period for specified failures on a case-by-case basis. As a result, we could incur significant costs to repair or replace defective products under warranty, particularly when such failures occur in installed systems. We have experienced failures in the past and will continue to face this risk going forward, as our products are widely deployed throughout the world in multiple demanding environments and applications. In addition, we may in certain circumstances honor warranty claims after the warranty has expired or for problems not covered by warranty in order to maintain customer relationships. Any significant product failure could result in lost future sales of the affected product and other products, as well as customer relations problems, litigation and damage to our reputation.
18
In addition, our products are typically embedded in, or deployed in conjunction with, our customers' products, which incorporate a variety of components, modules and subsystems and may be expected to interoperate with modules and subsystems produced by third parties. As a result, not all defects are immediately detectable and when problems occur, it may be difficult to identify the source of the problem. These problems may cause us to incur significant damages or warranty and repair costs, divert the attention of our engineering personnel from our product development efforts and cause significant customer relations problems or loss of customers, all of which would harm our business. The occurrence of any defects in our products could also give rise to liability for damages caused by such defects. Although we carry product liability insurance to mitigate this risk, insurance may not adequately cover costs that may arise from defects in our products or otherwise, nor will it protect us from reputational harm that may result from such defects.
If we fail to adequately manage our long-term growth and expansion requirements, our business will suffer.
In recent years, we have experienced significant growth through, among other things, internal expansion programs, new product developments and acquisitions of other companies. We expect to continue to grow, which could require us to expand our manufacturing operations, including hiring new personnel, purchasing additional equipment, leasing or purchasing additional facilities, expanding our management infrastructure and working with our suppliers to manage any such expansion. If we fail to secure these expansion requirements or manage our future growth effectively, our business could suffer.
Natural disasters, terrorist attacks or other catastrophic events could harm our operations.
Our worldwide operations could be subject to natural disasters and other business disruptions, which could harm our future revenue and financial condition and increase our costs and expenses. Further, a terrorist attack, including one aimed at energy or communications infrastructure suppliers, could hinder or delay the development and sale of our products. Although we maintain casualty and business interruption insurance, if an earthquake, typhoon, hurricane, terrorist attack or other natural or manmade catastrophe were to destroy any part of our facilities, destroy or disrupt vital infrastructure systems or interrupt our operations for any extended period of time, our business would be materially adversely affected.
Our manufacturing facilities are leased from third parties.
We conduct all of our manufacturing operations at facilities located in Pennsylvania, New Jersey and Mexico. The leases for our facilities located in Pennsylvania expire in July 2014 and October 2017, if not renewed at our option; the lease for our facility located in New Jersey expires in July 2014, if not renewed at our option; and the lease for our facility located in Mexico expires in December 2011, if not renewed at our option. We are substantially dependent on our facilities in Pennsylvania and New Jersey and a loss of use of one or more of our manufacturing facilities may result in an interruption or delay in our ability to manufacture our products. If we are unable to renew our leases with the owners of the facilities on commercially reasonable terms, or if we migrate to new facilities, we may experience delays in delivering our products until leases for other facilities can be arranged and the migration to a new facility is completed.
Our operations also rely heavily on the availability of electrical power and cooling capacity, which are also supplied by third-party providers. If our facilities experience a major power
19
outage or if the cost of electrical power increases significantly, our operations and profitability could be harmed. If our facilities experience a major power outage, we would have to rely on back-up generators, which may not function properly, and their supply may be inadequate. Such a power outage could result in the disruption of our business. Additionally, if our current facilities fail to have sufficient cooling capacity or availability of electrical power, we would need to find alternative facilities.
If we fail to protect, or incur significant costs in defending, our intellectual property and other proprietary rights, our business and results of operations could be materially harmed.
Our success depends to a significant degree on our ability to protect our intellectual property and other proprietary rights. We rely on a combination of patent, trademark, trade secret and unfair competition laws, as well as license agreements and other contractual provisions, to establish and protect our intellectual property and other proprietary rights. We have applied for patent registrations in the United States, most of which have been issued. In addition, we are applying to register the trademark "CyOptics" in the United States. We cannot guarantee that our pending applications will be approved by the applicable governmental authorities. Moreover, our existing and future patents and trademarks may not be sufficiently broad to protect our proprietary rights or may be held invalid or unenforceable in court. Failure to obtain patents or trademark registrations or a successful challenge to our registrations in the United States would limit our ability to protect the intellectual property rights that these applications and registrations are intended to cover.
We also attempt to protect our intellectual property, including our trade secrets and know-how, through the use of trade secret and other intellectual property laws, and contractual provisions. We enter into confidentiality and invention assignment agreements with our employees and independent consultants. We also use non-disclosure agreements with other third parties who may have access to our proprietary technologies and information. Such measures, however, provide only limited protection, and there can be no assurance that our confidentiality and non-disclosure agreements will not be breached, especially after our employees or those of our third-party contract manufacturers end their employment or engagement, and that our trade secrets will not otherwise become known by competitors or that we will have adequate remedies in the event of unauthorized use or disclosure of proprietary information. Unauthorized third parties may try to copy or reverse engineer our products or portions of our products, otherwise obtain and use our intellectual property, or may independently develop similar or equivalent trade secrets or know-how. If we fail to protect our intellectual property and other proprietary rights, or if such intellectual property and proprietary rights are infringed or misappropriated, our business, results of operations or financial condition could be materially harmed.
Policing unauthorized use of our technology is difficult, and we cannot be certain that the steps we have taken will prevent the misappropriation, unauthorized use or other infringement of our intellectual property rights. Further, if we are unable to effectively protect our intellectual property rights from misappropriation or other infringement in foreign countries where we have not applied for patent protections, and where patent, trademark, trade secret and other intellectual property laws are ineffective or unavailable, or do not protect our proprietary rights as fully as U.S. law, our business could be materially harmed.
If we are compelled to take legal actions to protect and enforce our intellectual property rights and determine their validity and scope, these actions would result in litigation costs and could require significant time and attention from our technical and management personnel. In addition, an adverse outcome of such proceedings could reduce our competitive advantage or otherwise harm our financial condition and our business.
20
We have entered into an agreement with one of our customers that requires us to place manufacturing or technical information, including patents, trade secrets, know-how, source code and other intellectual property, into an escrow. Such agreement provides that the customer will have a right to access the escrowed materials if we experience insolvency, commit a material breach and/or are unable or unwilling to deliver the ordered products in the allotted timeframe. Depending on the licenses granted upon release of the escrow, we may not be able to control the customer's use of the released materials and may not be able to receive the same revenue that we would receive when selling the products in the ordinary course of business.
Our participation in standards setting organizations or industry initiatives may require us to license our patents to other companies that adopt certain standards or specifications. As a result of such licensing, our patents may not be enforceable against others who might otherwise be infringing those patents and the value of our intellectual property may be impaired. Likewise, in order to provide products that are compliant with standards that have been adopted or will be adopted in the future, we could license patents owned by others. Such licensing requirements may materially adversely affect the value of our products, and, consequently, our business, financial condition, liquidity and results of operations.
We may be involved in intellectual property disputes in the future, which could divert management's attention, cause us to incur significant costs and prevent us from selling or using the challenged technology.
Participants in the markets in which we sell our products have experienced litigation regarding patent and other intellectual property rights. Regardless of their merit, responding to claims against us alleging infringement of certain patents or other intellectual property rights of others can be time consuming, divert management's attention and resources and may cause us to incur significant expenses. While we do not believe that our products infringe upon the intellectual property rights of other parties and meritorious defenses would exist with respect to any assertions to the contrary, we cannot be certain that our products would not be found infringing the intellectual property rights of others. If certain of our proprietary rights are found to be invalid, among other potential actions, we may be required to:
- •
- obtain from a third party claiming infringement a license to sell or use the relevant technology, which may not be
available on reasonable terms, or at all;
- •
- stop manufacturing, selling, incorporating or using our products that use the challenged intellectual property;
- •
- pay substantial monetary damages; or
- •
- expend significant resources to redesign the products that use the technology and to develop non-infringing technology.
Any of these actions could adversely affect our financial results.
We may be obligated to indemnify our customers for claims that our intellectual property infringes the rights of others, which may result in substantial expenses to us.
We often indemnify our customers for intellectual property claims made against them for products incorporating our technology. As such, claims against our customers may require us to
21
incur substantial expenses, such as legal expenses, damages for past infringement or royalties for future use. While we have not incurred any indemnification expenses to date, any future indemnity claim could adversely affect our relationships with our customers and result in substantial costs to us.
We face a variety of risks associated with international sales and operations.
We currently derive, and expect to continue to derive, a significant portion of our revenue from international sales in various markets. Our international revenue and operations are subject to a number of material risks, including, but not limited to:
- •
- difficulties in staffing, managing and supporting operations in more than one country;
- •
- difficulties in enforcing agreements and collecting receivables through foreign legal systems;
- •
- fewer legal protections for intellectual property in foreign jurisdictions;
- •
- foreign and U.S. taxation issues and international trade barriers;
- •
- general economic and political conditions in the markets in which we operate;
- •
- difficulties in obtaining any necessary governmental authorizations for the export of our products to certain foreign
jurisdictions;
- •
- fluctuations in foreign economies;
- •
- fluctuations in the value of foreign currencies and interest rates;
- •
- availability and continuity of labor supply;
- •
- trade and travel restrictions;
- •
- outbreaks of contagious diseases;
- •
- domestic and international economic or political changes, hostilities and other disruptions in regions where we currently
operate or may operate in the future;
- •
- difficulties and increased expenses in complying with a variety of U.S. and foreign laws, regulations and trade standards;
and
- •
- different and changing legal and regulatory requirements in the jurisdictions in which we currently operate or may operate in the future.
Negative developments in any of these areas could result in a reduction in demand for our products, the cancellation or delay of orders already placed, difficulties in producing and delivering our products, threats to our intellectual property, difficulty in collecting receivables, and a higher cost of doing business. In addition, although we intend to implement an anti-corruption compliance program throughout the company prior to this offering, violations of our compliance program may result in criminal or civil sanctions, including material monetary fines, penalties and other costs against us or our employees, and may have a material adverse effect on our business.
22
We have a limited history of operations, making it difficult to predict our future results of operations.
We have a limited history of operations, which makes it difficult to evaluate our business and financial prospects. While our operations began in 1999, we did not generate revenue from the commercial shipments of our initial products until 2001. Since then, our revenue, gross margin and results of operations have varied significantly and are likely to continue to vary from quarter to quarter due to a number of factors, many of which are not within our control. For instance, changes in gross margin may result from various factors, such as changes in pricing, changes in our fixed costs, changes in the mix of our products sold and changes in the amount of product manufactured versus the amount of product sold over time. In making an investment decision, you should evaluate our business in light of the risks, expenses and difficulties frequently encountered by companies in the rapidly changing communications networking industry. It is difficult for us to accurately forecast our future revenue and gross margin and plan expenses accordingly and, therefore, it is difficult for us to predict our future results of operations.
We have outstanding indebtedness that exposes us to risks that could adversely affect our business, results of operations and financial condition.
We had approximately $11.8 million of debt outstanding as of June 30, 2011. We have a $20.0 million revolving credit facility with Silicon Valley Bank that is subject to certain borrowing base restrictions and is secured by liens on substantially all of our assets. As of June 30, 2011, we had $10.2 million outstanding under this revolving line and $6.1 million currently available for borrowing. We also had a term loan balance of $0.6 with Silicon Valley Bank at June 30, 2011 that was repaid in full in August 2011. In addition, we had approximately $1.1 million of debt outstanding at June 30, 2011 from TriQuint Semiconductor that is also subject to liens on substantially all of our assets. Even after giving effect to the use of proceeds of this offering as described under "Use of Proceeds", we expect to continue to have outstanding indebtedness following this offering. The level and nature of our indebtedness could, among other things:
- •
- make it difficult for us to obtain any necessary financing in the future;
- •
- limit our flexibility in planning for or reacting to changes in our business;
- •
- reduce funds available for use in our operations;
- •
- hinder our ability to raise equity capital, because in the event of a liquidation of our business, debt holders receive a
priority before equity holders; and
- •
- make us more vulnerable in the event of a downturn in our business.
If we increase our indebtedness by borrowing under our credit facilities or incur other new indebtedness, each of the risks described above would increase.
23
We may not be able to obtain capital when desired on favorable terms, if at all, or without dilution to our stockholders.
It is possible that we may not generate sufficient cash flow from operations or otherwise have the capital resources to meet our future capital needs. If this occurs, we may need additional financing to execute on our current or future business strategies, including:
- •
- investment in our research and development efforts by hiring additional technical and other personnel;
- •
- expansion of our operating or manufacturing infrastructure;
- •
- acquisitions of complementary businesses, products or technologies; or
- •
- pursuit of our strategic plans and response to competitive pressures.
If we raise additional funds through the issuance of equity or convertible debt securities, the percentage ownership of our stockholders could be significantly diluted, and these newly-issued securities may have rights, preferences or privileges senior to those of existing stockholders, including those acquiring shares in this offering. We cannot assure you that additional financing will be available on terms favorable to us, or at all. If adequate funds are not available or are not available on acceptable terms, if and when needed, our ability to fund our operations, take advantage of unanticipated opportunities, develop or enhance our products, or otherwise respond to competitive pressures could be significantly limited.
Potential future acquisitions could be difficult to integrate, divert the attention of key personnel, disrupt our business, dilute stockholder value and impair our financial results.
As part of our business strategy, we have pursued and intend to continue to pursue acquisitions of complementary businesses, products or technologies that we believe could accelerate our ability to compete in our existing markets or allow us to enter new markets.
Acquisitions involve numerous risks, any of which could harm our business, including:
- •
- difficulties in integrating the operations, technologies, products, existing contracts, accounting and personnel of the
target company and realizing the anticipated synergies of the combined businesses;
- •
- difficulties in supporting and transitioning customers, if any, of the target company;
- •
- diversion of financial and management resources from existing operations;
- •
- the price we pay or other resources that we devote may exceed the value we realize, or the value we could have realized if
we had allocated the purchase price or other resources to another opportunity;
- •
- risks of entering new markets in which we have limited or no experience;
- •
- potential loss of key employees, customers and strategic alliances from either our current business or the target
company's business;
- •
- assumption of unanticipated problems or liabilities, such as problems with the quality of the target company's products;
24
- •
- inability to generate sufficient revenue to offset acquisition costs;
- •
- dilutive effect on our stock as a result of any equity-based acquisitions;
- •
- failure to realize anticipated tax benefits;
- •
- inability to successfully complete transactions with a suitable acquisition candidate; and
- •
- in the event of international acquisitions, risks associated with accounting and business practices that are different from applicable U.S. practices and requirements.
Acquisitions also frequently result in the recording of goodwill and other intangible assets which are subject to potential impairments which have occurred in the past and which, were they to occur in the future, could harm our financial results.
Acquisitions may also result in the incurrence of liabilities. For example, in July 2008, we acquired PGT Photonics, S.p.A., or PGT, which enabled us to gain access to PGT's unique tunable laser products and technologies, complementary photonic integrated circuit capabilities and manufacturing infrastructure. In September 2009, as a result of the macroeconomic downturn, we commenced dissolution of PGT and synergized the acquired PGT technologies into our ongoing operations, and a liquidator was assigned to dissolve PGT pursuant to Italian law. Dissolution of entities under Italian law is a lengthy process and we have not finalized the PGT dissolution. While we believe we have satisfied all outstanding PGT-related liabilities and have no material continuing obligations or commitments related to PGT, it is possible that we may be subject to liabilities which, if substantial, could harm our results of operations.
As a result, if we fail to properly evaluate acquisitions or investments, we may not achieve the anticipated benefits of any such acquisitions, and we may incur costs in excess of what we anticipate. The failure to successfully evaluate and execute acquisitions or investments or otherwise adequately address these risks could materially harm our business and financial results.
If we fail to maintain effective internal control over financial reporting in the future, the accuracy and timing of our financial reporting may be adversely affected.
The preparation of our consolidated financial statements involves a number of complex manual and automated processes, which are dependent upon individual data input or review and require significant management judgment. One or more of these elements may result in errors that may not be detected and could result in a material misstatement of our consolidated financial statements.
The Sarbanes-Oxley Act of 2002, or Sarbanes-Oxley Act, requires, among other things, that as a publicly traded company we maintain effective internal control over financial reporting and disclosure controls and procedures.
If a material misstatement occurs in the future, we may fail to meet our future reporting obligations, we may need to restate our financial results and the price of our common stock may decline. Any failure of our internal controls could also adversely affect the results of the periodic management evaluations and annual independent registered public accounting firm attestation reports regarding the effectiveness of our internal control over financial reporting that will be required when the rules of the Securities and Exchange Commission, or the SEC,
25
under Section 404 of the Sarbanes-Oxley Act, which would most likely become applicable to us beginning with the filing of our Annual Report on Form 10-K for the year ending December 31, 2012. Effective internal controls are necessary for us to produce reliable financial reports and are important to helping prevent financial fraud. As a public company, we will need to augment our internal finance functions and, if we are unable to do so, it may make it more difficult for us to meet our obligations under the Sarbanes-Oxley Act, including the requirement to find that our internal controls are effective. If we cannot provide reliable financial reports or prevent fraud, our business and results of operations could be harmed, investors could lose confidence in our reported financial information, and the trading price of our stock could drop significantly.
Potential changes in our effective tax rate could harm our future results.
We are subject to income taxes in the United States and various foreign jurisdictions, and our domestic and international tax liabilities are subject to the allocation of expenses in differing jurisdictions. Our tax rate is affected by changes in the mix of earnings and losses in countries with differing statutory tax rates, certain non-deductible expenses arising from the requirement to expense stock options and the valuation of deferred tax assets and liabilities, including our ability to utilize any net operating losses. Increases in our effective tax rate could harm our results of operations.
We may be unable to utilize our net operating loss carryforwards to reduce our income taxes.
As of December 31, 2010, we had net operating loss, or NOL, carryforwards for U.S. federal and state tax purposes of $186.9 million and $64.8 million, respectively, with a corresponding valuation allowance. If not utilized, these NOL carryforwards expire, beginning in 2022. Subsequent to December 31, 2010, as a consequence of equity transactions in January 2011, we anticipate further limitation on the use of our NOL carryforwards. The utilization of the NOL carryforwards are subject to a substantial limitation imposed by Section 382 of the Internal Revenue Code of 1986, as amended, and similar state provisions. As of December 31, 2010, we recorded deferred tax assets with a corresponding valuation allowance for the NOL carryforwards currently available after considering the existing Section 382 limitation. Based on the preliminary results of a study that we are in the process of completing to assess the ownership changes that have occurred since our formation and their impact on the value of the NOLs, we have updated our deferred tax assets and corresponding valuation allowance to reflect the most recent analysis for our existing NOL carryforwards that are not subject to limitation. As of June 30, 2011, the estimated total available net operating loss carryforwards are approximately $49.0 million for federal purposes and approximately $47.0 million for state purposes. Upon finalization of the Section 382 study, we may further adjust the amount of the NOLs that we can utilize.
We will incur increased costs as a result of operating as a public company, and our management will be required to devote substantial time to new compliance initiatives.
As a public company, we will incur legal, accounting and other expenses that we did not incur as a private company. In addition, the Sarbanes-Oxley Act and the Dodd-Frank Wall Street Reform and Consumer Protection Act, as well as rules subsequently implemented by the SEC and the NASDAQ Stock Market, impose additional requirements on public companies, including specific corporate governance practices. For example, the listing requirements of the NASDAQ Stock Market require that we satisfy certain corporate governance requirements relating to
26
independent directors, audit and compensation committees, distribution of annual and interim reports, stockholder meetings, stockholder approvals, solicitation of proxies, conflicts of interest, stockholder voting rights and codes of conduct. Our management and other personnel will need to devote a substantial amount of time to these compliance initiatives. Moreover, these rules and regulations will increase our legal and financial compliance costs and will make some activities more time-consuming and costly. For example, we expect these rules and regulations to make it more difficult and more expensive for us to obtain director and officer liability insurance, and we may be required to accept reduced policy limits and coverage or incur substantial additional costs to maintain the same or similar coverage. These rules and regulations could also make it more difficult for us to attract and retain qualified persons to serve on our board of directors, our board committees or as executive officers.
We are subject to governmental export and import controls that could subject us to liability or impair our ability to compete in international markets.
We are subject to export control laws, regulations and requirements that limit which products we sell and where and to whom we sell our products. While we do not believe we are currently required to obtain any export licenses, and we have not obtained any export licenses to date, it is possible that export licenses would be required in the future from U.S. government agencies for some of our products in accordance with various laws, including but not limited to, the International Traffic in Arms Regulations. In addition, various countries regulate the import of certain technologies and have enacted laws that could limit our ability to distribute our products. We may not be successful in obtaining the necessary export and import licenses. Failure to comply with these and similar laws on a timely basis, or at all, or any limitation on our ability to export or sell our products would adversely affect our business, financial condition and results of operations.
Changes in our products or changes in export and import laws and implementing regulations may create delays in the introduction of new products in international markets, prevent our customers from deploying our products internationally or, in some cases, prevent the export or import of our products to certain countries altogether. Any change in export or import regulations or related legislation, shift in approach to the enforcement or scope of existing regulations, or change in the countries, persons or technologies targeted by such regulations, could result in decreased use of our products by, or in our decreased ability to export or sell our products to, existing or potential customers with international operations. In such event, our business and results of operations could be adversely affected.
We are subject to government regulations that could adversely impact our business.
The Federal Communications Commission, or FCC, has jurisdiction over the entire U.S. telecommunications industry and, as a result, our products and our U.S. customers are subject to FCC rules and regulations. Our business is also subject to other U.S. governmental and regulatory authorities, including the Department of Homeland Security, International Trafficking in Arms Regulations and the Department of Defense. Current and future regulations affecting communications services, our products or our customers' businesses could impose new requirements or result in more stringent enforcement of existing laws, which could result in additional costs and increased penalties, which could negatively affect our business. In addition, international regulatory standards could impair our ability to develop products for international customers in the future. Delays caused by our compliance with regulatory
27
requirements could result in postponements or cancellations of product orders. Further, we may not be successful in obtaining or maintaining any regulatory approvals that may, in the future, be required to operate our business. Any failure to obtain such approvals could harm our business and results of operations.
We sell our products to federal government entities under subcontracts. A loss or reduction of such contracts, a failure to obtain new contracts or a modification or termination under such contracts could have an adverse effect on our business.
We derived less than 2.0% of our revenues for the fiscal year 2010 from subcontracts with prime defense contractors or subcontractors of the federal government. The loss or significant curtailment of any of these government subcontracts, or failure to exercise renewal options or enter into new contracts or subcontracts, could have an adverse effect on our future business, results of operations and financial condition. Continuation and the exercise of renewal options on existing government subcontracts and new government contracts and subcontracts are, among other things, contingent upon the availability of adequate funding for the various federal government agencies with which we and prime government contractors do business. Changes in federal government spending could directly affect our financial performance. Among the factors that could impact federal government spending and which would reduce our federal government contracting and subcontracting business are:
- •
- a significant decline in, or reapportioning of, spending by the federal government;
- •
- changes, delays or cancellations of federal government programs or requirements;
- •
- the adoption of new laws or regulations that affect companies that provide products or services to the federal government;
- •
- federal government shutdowns or other delays in the government appropriations process;
- •
- curtailment of the federal government's use of third-party firms;
- •
- changes in the political climate, including with regard to the funding for the products we provide; and
- •
- general economic conditions.
Furthermore, if the current presidential administration were to reorder its budgetary priorities resulting in a general decline in U.S. defense spending, it could cause federal government agencies to reduce their purchases under contracts, exercise their rights to terminate contracts in whole or in part, to issue temporary stop work orders or decline to exercise options to renew contracts, all of which could harm our operations and significantly reduce our future revenues.
In addition, the federal government can terminate or modify any of its contracts with us or its prime contractors either for its convenience, or if we or its prime contractors default, by failing to perform under the terms of the applicable contract. A termination arising out of our default could expose us to liability and have a material adverse effect on our ability to compete for future contracts and subcontracts. If the federal government or its prime contractors terminate and/or materially modify any of our contracts or if any applicable options are not exercised,
28
our failure to replace sales generated from such contracts would result in lower sales and could adversely affect our earnings, which could have a material adverse effect on our business.
We are subject to environmental, health and safety laws and regulations, which could subject us to liabilities, increase our costs, or restrict our business or operations in the future.
Our manufacturing operations and our products are subject to a variety of federal, state, local and international environmental, health and safety laws and regulations. These laws and regulations govern, among other things, air emissions, wastewater discharges, the handling and disposal of hazardous substances and wastes, soil and groundwater contamination, employee health and safety, and the use of hazardous materials in our products. Liability under environmental, health and safety laws can be joint and several and without regard to fault or negligence. There can be no assurance that violations of these laws will not occur in the future, as a result of human error, accident, equipment failure or other causes. Our failure to comply with present and future environmental, health or safety requirements, or the identification of contamination, could cause us to incur substantial costs, including cleanup costs, monetary fines, and civil or criminal penalties, and subject us to property damage or personal injury claims, suspension of production, alteration of our manufacturing facilities or processes, or curtailment of operations sales and adverse publicity. In addition, these laws and regulations have increasingly become more stringent over time and we expect that our operations and products will be affected by new environmental requirements on an ongoing basis, which will likely result in additional costs, which could have a material adverse effect on our business. The identification of presently unidentified environmental conditions, more vigorous enforcement of current environmental, health and safety requirements by regulatory agencies, or other unanticipated events could restrict our ability to expand our facilities, require us to install costly pollution control equipment or incur other additional expenses, or require us to modify our manufacturing processes or the contents of our products, which could have a material adverse effect on our business, financial condition and results of operations.
Our manufacturing facilities use, store and dispose of hazardous substances in connection with their processes. In addition, our operations have grown through acquisitions, and it is possible that businesses that we have acquired may expose us to environmental liabilities that have not yet been discovered associated with historical site conditions or offsite locations. Some environmental laws impose liability for contamination on current and former owners and operators of affected sites, or on parties that generated wastes disposed of at off-site locations, regardless of fault. In the event we are found liable for any such contamination in the future, there can be no assurance that remediation costs, or potential claims for personal injury or property or natural resource damages resulting from contamination, will not be material.
Some jurisdictions in which our products are sold have enacted requirements regarding the hazardous material content of certain products. For example, member states of the European Union, are among a growing number of jurisdictions, which have placed restrictions on the use of lead, among other chemicals, in electronic products, which affects the composition and packaging of our products. The passage of such requirements in additional jurisdictions, or the tightening of standards or elimination of certain exemptions in jurisdictions where our products are already subject to such requirements, could cause us to incur significant expenditures to make our products compliant with new requirements, or could limit the markets into which we may sell our products. Additionally, given our manufacturing
29
operations, increasing efforts to control emissions of greenhouse gases could significantly increase our operating costs.
Risks related to this offering and our common stock
There is no existing market for our common stock and we do not know if one will develop to provide our stockholders adequate liquidity.
There has not been a public trading market for shares of our common stock prior to this offering. An active trading market may not develop or be sustained after this offering. The initial public offering price for the shares of common stock sold in this offering will be determined by negotiations between us and representatives of the underwriters. This price may not be indicative of the price at which our common stock will trade after this offering.
Our financial results may vary significantly from quarter to quarter due to a number of factors, which may lead to volatility in our stock price.
Our quarterly revenue and results of operations have varied in the past and may continue to vary significantly from quarter to quarter. This variability may lead to volatility in our stock price as research analysts and investors respond to these quarterly fluctuations. These fluctuations are due to numerous factors, including:
- •
- fluctuations in demand for our products;
- •
- the timing, size and product mix of sales of our products;
- •
- changes in our pricing and sales policies or the pricing and sales policies of our competitors;
- •
- our ability to design, manufacture and deliver products to our customers in a timely and cost-efficient manner
and that meet customer requirements;
- •
- quality control or yield problems in our manufacturing operations;
- •
- our ability to timely obtain adequate quantities of the components used in our products;
- •
- length and variability of the sales cycles of our products;
- •
- new product introductions and enhancements by our competitors and ourselves;
- •
- unanticipated increases in costs or expenses; and
- •
- fluctuations in foreign currency exchange rates.
The foregoing factors are difficult to forecast, and these, as well as other factors, could materially adversely affect our quarterly and annual results of operations. In addition, a significant amount of our operating expenses is relatively fixed in nature due to our internal manufacturing, research and development, sales and general administrative efforts. Any failure to adjust spending quickly enough to compensate for a revenue shortfall could magnify the adverse impact of such revenue shortfall on our results of operations. Moreover, our results of operations may not meet our announced guidance or the expectations of research analysts or investors, in which case the price of our common stock could decrease significantly. There can be no assurance that we will be able to successfully address these risks.
30
Our stock price may be volatile and you may be unable to sell your shares at or above the offering price.
The market price of our common stock could be subject to wide fluctuations in response to, among other things, the risk factors described in this section of this prospectus, and other factors beyond our control, such as fluctuations in the valuation of companies perceived by investors to be comparable to us.
Furthermore, the stock markets have experienced price and volume fluctuations that have affected and continue to affect the market prices of equity securities of many companies. These fluctuations often have been unrelated or disproportionate to the operating performance of those companies. These broad market and industry fluctuations, as well as general economic, political and market conditions, such as recessions, interest rate changes or international currency fluctuations, may negatively affect the market price of our common stock.
In the past, many companies that have experienced volatility in the market price of their stock have been subject to securities class action litigation. We may become the target of this type of litigation in the future. Securities litigation against us could result in substantial costs and divert our management's attention from other business concerns, which could seriously harm our business.
As a result of the foregoing, fluctuations in the market price of our common stock could prevent our investors from selling their shares at or above the offering price.
If research analysts do not publish research about our business or if they issue unfavorable commentary or downgrade our common stock, our stock price and trading volume could decline.
The trading market for our common stock will depend in part on the research and reports that research analysts publish about us and our business. The price of our common stock could decline if one or more research analysts downgrade our stock or if those analysts issue other unfavorable commentary or cease publishing reports about us or our business. If one or more of the research analysts ceases coverage of our company or fails to publish reports on us regularly, demand for our common stock could decrease, which could cause our stock price or trading volume to decline.
Our principal stockholders, executive officers and directors own a significant percentage of our stock and will continue to have significant control of our management and affairs after the offering, and they can take actions that may be against your best interests.
Following the completion of this offering, our executive officers and directors, and entities that are affiliated with them, will beneficially own an aggregate of approximately % of our outstanding common stock. Our largest stockholder, Jerusalem Venture Partners, will beneficially own an aggregate of approximately % of our outstanding common stock following completion of this offering. This significant concentration of share ownership may adversely affect the trading price for our common stock because investors often perceive disadvantages in owning stock in companies with controlling stockholders. Also, as a result, these stockholders, acting together, may be able to control our management and affairs and matters requiring stockholder approval, including the election of directors and approval of significant corporate transactions, such as mergers, consolidations, the sale of substantially all of our assets or amendments to our certificate of incorporation or by-laws. Consequently, this
31
concentration of ownership may have the effect of delaying or preventing a change in control, including a merger, consolidation or other business combination involving us, or discouraging a potential acquirer from making a tender offer or otherwise attempting to obtain control, even if such a change in control would benefit our other stockholders.
Our stock price could decline due to the large number of outstanding shares of our common stock eligible for future sale.
Sales of substantial amounts of our common stock in the public market following this offering, or the perception that these sales could occur, could cause the market price of our common stock to decline. These sales could also make it more difficult for us to sell equity or equity-related securities in the future at a time and price that we deem appropriate.
Assuming completion of this offering as of , 2011, we would have had an aggregate of shares of common stock outstanding, assuming no exercise of the underwriters' over-allotment option and no exercise of outstanding options or warrants. The shares sold pursuant to this offering will be immediately tradable without restriction. Of the remaining shares:
- •
- no shares will be eligible for sale immediately upon completion of this offering;
- •
- shares will be eligible for sale upon the expiration of lock-up agreements, subject in some
cases to volume and other restrictions of Rule 144 and Rule 701 under the Securities Act of 1933, as amended, or the Securities Act; and
- •
- The number of shares eligible for sale upon expiration of lock-up agreements assumes the conversion of all outstanding shares of our Series A Preferred Stock, Series B Preferred Stock, Series B-2 Preferred Stock, Series C Preferred Stock, Series C-1 Preferred Stock into an aggregate of 12,399,825 shares of common stock on a 1-for-1 basis and the conversion of all outstanding shares of our Series B-1 Preferred Stock into an aggregate of 665,013 shares of Common Stock on a one for 1.161144499 basis.
The lock-up agreements expire 180 days after the date of this prospectus, subject to potential extension in the event we release earning results or material news or a material event relating to us occurs near the end of the lock-up period. J.P. Morgan Securities LLC and Barclays Capital Inc., as representatives of the underwriters, may, in their discretion and at any time without notice, release all or any portion of the securities subject to lock-up agreements. After the completion of this offering, we intend to register approximately shares of our common stock that have been issued or reserved for future issuance under our stock incentive plans.
Because our initial public offering price is substantially higher than the pro forma as adjusted net tangible book value per share of our outstanding common stock, new investors will incur immediate and substantial dilution.
The initial public offering price is substantially higher than the pro forma as adjusted net tangible book value per share of our common stock based on the expected total value of our total assets, less our goodwill and other intangible assets, less our total liabilities immediately following this offering. Therefore, if you purchase shares of our common stock in this offering, you will experience immediate and substantial dilution of $ per share in the price you pay for our common stock as compared to the pro forma as adjusted net tangible book value as of June 30, 2011. To the extent outstanding options or warrants to purchase common stock
32
are exercised, there will be further dilution. For a further description of the dilution that you will experience immediately after this offering, see "Dilution."
Our management has broad discretion in the use of the net proceeds from this offering and may not use the net proceeds effectively.
Our management will have broad discretion in the application of the net proceeds of this offering. We cannot specify with certainty the uses to which we will apply the net proceeds we will receive from this offering. The failure by our management to apply these funds effectively could adversely affect our ability to continue to maintain and expand our business.
We currently do not intend to pay dividends on our common stock and, consequently, your only opportunity to achieve a return on your investment is if the price of our common stock appreciates.
We currently do not plan to declare dividends on shares of our common stock in the foreseeable future. See "Dividend policy" for more information. Consequently, your only opportunity to achieve a return on your investment in our company will be if the market price of our common stock appreciates and you sell your shares at a profit. There is no guarantee that the price of our common stock that will prevail in the market after this offering will ever exceed the price that you pay.
Our charter and organizational documents and Delaware law could prevent a takeover that stockholders consider favorable and could also reduce the market price of our stock.
Our amended and restated certificate of incorporation and our amended and restated bylaws, which will be effective upon completion of this offering, contain provisions that could delay or prevent a merger, acquisition or other change in control that stockholders may consider favorable, including transactions in which stockholders might otherwise receive a premium for their shares. These provisions may also prevent or delay attempts by stockholders to replace or remove our current management or members of our board of directors. These provisions include:
- •
- providing for a classified board of directors with staggered, three-year terms;
- •
- not providing for cumulative voting in the election of directors;
- •
- authorizing our board of directors to issue, without stockholder approval, preferred stock rights senior to those of
common stock;
- •
- prohibiting stockholder action by written consent;
- •
- limiting the persons who may call special meetings of stockholders; and
- •
- requiring advance notification of stockholder nominations and proposals.
The affirmative vote of the holders of at least 662/3% of our shares of capital stock entitled to vote, and not less than 662/3% of the outstanding shares of each class entitled to vote thereon as a class, is generally necessary to amend or repeal the above provisions that are contained in our amended and restated certificate of incorporation. Also, absent approval of our board of directors, our amended and restated by-laws may only be amended or repealed by the affirmative vote of the holders of at least 662/3% of our shares of capital stock entitled to vote.
33
Upon completion of this offering, we will be subject to the provisions of Section 203 of the Delaware General Corporation Law. In general, Section 203 prohibits a publicly held Delaware corporation from engaging in a "business combination" with an "interested stockholder" for a three-year period following the time that this stockholder becomes an interested stockholder, unless the business combination is approved in a prescribed manner.
These and other provisions in our amended and restated certificate of incorporation, our amended and restated bylaws, our 2011 amended and restated investor rights agreement and under Delaware law could discourage potential takeover attempts, reduce the price that investors might be willing to pay for shares of our common stock in the future and result in the market price being lower than it would be without these provisions. See "Description of capital stock—Preferred stock", "Description of capital stock—Anti-takeover effects of Delaware law and our certificate of incorporation and bylaws", and "Certain relationships and related party transactions—Private placement financings—Investor rights agreement."
The right of first negotiation in our 2011 amended and restated investor rights agreement could delay a sale of the company.
We are party to an investor rights agreement that affords Finisar Corporation, one of our stockholders and our largest customer in 2010, a right of first negotiation in the event we seek to solicit, encourage, pursue or negotiate an offer from a non-affiliated third-party purchaser to effect a sale of the company. In the event our board of directors has resolved to pursue such a transaction, we must deliver to Finisar a notice describing the material terms and conditions of the solicited transaction. Finisar then has five days to deliver a negotiation notice if it desires to initiate a process to make an offer to acquire the company. If Finisar fails to deliver the notice, we may proceed towards consummating a transaction with a non-affiliated third party purchaser to effect the sale of the company. If Finisar delivers the notice, we may not enter into an exclusive negotiating or standstill agreement with any third party for 25 days, during which we are required to negotiate with Finisar in good faith towards effecting a sale transaction. If we are unable to come to an agreement with Finisar during this period, we may enter into a sale transaction in respect of the Targeted Solicitation within the next 12 months, subject to extension if we have entered into an agreement and are working in good faith to consummate the sale transaction. In the event we enter into a letter of intent with Finisar regarding a sale transaction, the agreement must include a reasonable break-up fee in favor of Finisar and a reasonable exclusive negotiating or standstill period. The right of first negotiation does not have a specified termination date. Though Finisar's right of first negotiation does not compel us to enter into a sale transaction with Finisar, the right of first negotiation could delay a potential sale of the company.
34
Special note regarding forward-looking statements
and industry data
This prospectus contains forward-looking statements that are based on our management's beliefs and assumptions and on information currently available to our management. The forward-looking statements are contained principally in "Prospectus summary," "Risk factors," "Management's discussion and analysis of financial condition and results of operations," "Business" and "Compensation discussion and analysis." Forward-looking statements include information concerning our possible or assumed future results of operations, business strategies, financing plans, competitive position, industry environment, potential growth opportunities and the effects of competition. Forward-looking statements include all statements that are not historical facts and can be identified by terms such as "anticipates," "believes," "could," "seeks," "estimates," "expects," "intends," "may," "plans," "potential," "predicts," "projects," "should," "will," "would" or similar expressions and the negatives of those terms.
Forward-looking statements involve known and unknown risks, uncertainties and other factors that may cause our actual results, performance or achievements to be materially different from any future results, performance or achievements expressed or implied by the forward-looking statements. We discuss these risks in greater detail in "Risk factors" and elsewhere in this prospectus. Given these uncertainties, you should not place undue reliance on these forward-looking statements. Also, forward-looking statements represent our management's beliefs and assumptions only as of the date of this prospectus. You should read this prospectus and the documents that we have filed as exhibits to the registration statement, of which this prospectus is a part, completely and with the understanding that our actual future results may be materially different from what we expect.
Except as required by law, we assume no obligation to update these forward-looking statements publicly, or to update the reasons actual results could differ materially from those anticipated in these forward-looking statements, even if new information becomes available in the future.
This prospectus also contains estimates and other information concerning our industry, including market size and growth rates, that are based on industry publications, surveys and forecasts, including those generated by Cisco Systems, Dell'Oro and Ovum. This information involves a number of assumptions and limitations, and you are cautioned not to give undue weight to these estimates. These industry publications, surveys and forecasts generally indicate that their information has been obtained from sources believed to be reliable. The industry in which we operate is subject to a high degree of uncertainty and risk due to variety of factors, including those described in "Risk factors."
35
We estimate that the net proceeds from our sale of shares of common stock in this offering at an assumed initial public offering price of $ per share, the midpoint of the price range set forth on the front cover of this prospectus after deducting estimated underwriting discounts and commissions and estimated offering expenses, will be approximately $ million, assuming no exercise by the underwriters of their over-allotment option, or $ million if the underwriters' option to purchase additional shares is exercised in full. A $1.00 increase (decrease) in the assumed initial public offering price would increase (decrease) the net proceeds to us from this offering by $ million, assuming the number of shares offered by us, as set forth on the front cover of this prospectus, remains the same and after deducting the estimated underwriting discounts and commissions.
The principal purposes of this offering are to create a public market for our common stock and to facilitate our future access to public equity markets, as well as to obtain additional capital. We have no specific plans as to the use of a specific portion of the proceeds of this offering. However, we anticipate that we will use the net proceeds of this offering primarily for working capital and general corporate purposes and, subject to long-term demand from our customers following completion of this offering, capital expenditures to expand our manufacturing facilities and capabilities. The amount and timing of these expenditures will vary depending on a number of factors, including competitive and technological developments and the rate of growth, if any, of our business.
In addition, we may use a portion of the net proceeds to selectively pursue acquisitions that complement our strengths and help us execute our strategies or use up to $ million to repay some or all of the outstanding amounts under our debt facilities. However, we have no understandings or agreements with respect to any such acquisition or investment or debt repayment.
Pending their use, we plan to invest our net proceeds from this offering in short-term, interest-bearing obligations, investment-grade instruments, certificates of deposit, or direct or guaranteed obligations of the U.S. government.
We have never declared or paid cash dividends on our common stock. We currently intend to retain all available funds and any future earnings for use in the operation of our business and do not anticipate paying any dividends on our common stock in the foreseeable future. Any future determination to declare dividends will be made at the discretion of our board of directors and will depend on our financial condition, results of operations, capital requirements, general business conditions and other factors that our board of directors may deem relevant. In addition, our debt facility restricts our ability to declare or pay cash dividends on our capital stock.
36
The following table sets forth our capitalization as of June 30, 2011 on:
- •
- an actual basis;
- •
- on a pro forma basis to give effect to (i) the automatic conversion of all outstanding shares of our
Series A Preferred Stock, Series B Preferred Stock, Series B-2 Preferred Stock, Series C Preferred Stock and Series C-1 Preferred Stock into shares of our common
stock on a 1-for-1 basis, (ii) the automatic conversion of all outstanding shares of our Series B-1 Preferred Stock into shares of our common stock on a 1-for-1.161144499 basis,
(iii) the automatic conversion of all outstanding warrants to purchase preferred stock into warrants to purchase common stock; and (iv) the reclassification of our outstanding preferred
stock warrants from long-term liabilities to additional paid-in capital; and
- •
- on a pro forma as adjusted basis to give effect to the conversion and reclassification described in the prior bullet and (i) the sale by us of the shares of common stock offered by this prospectus at an initial public offering price of $ per share, the midpoint of the price range on the cover of this prospectus, and after deducting the underwriting discounts and commissions and estimated offering expenses payable by us; and (ii) the filing of our amended and restated certificate of incorporation, which will occur immediately prior to the closing of this offering.
The following information is illustrative only of our capitalization following the completion of this offering and will be adjusted based on the actual initial public offering price and other terms of this offering determined at pricing. You should read this table together with "Management's discussion and analysis of financial condition and results of operations" and our financial statements and the related notes appearing elsewhere in this prospectus.
37
| As of June 30, 2011 (in thousands except share and per share data) |
Actual |
Pro-forma |
Pro-forma as adjusted(1) |
|||||||
|---|---|---|---|---|---|---|---|---|---|---|
Long-term obligations, including current portion |
$ | 12,065 | $ | 11,826 | ||||||
Convertible preferred stock, $0.001 par value per share; 18,337,337 shares authorized, 12,972,547 shares issued and outstanding, actual; no shares authorized, none issued or outstanding, pro forma; no shares authorized, issued or outstanding, pro forma as adjusted |
95,404 | — | ||||||||
Stockholders' equity (deficit): |
||||||||||
Preferred stock, $0.001 par value per share, no shares authorized or outstanding actual and pro forma; 25,000,000 shares authorized, no shares issued and outstanding, pro forma as adjusted |
— | — | ||||||||
Common stock, $0.001 par value per share; 22,084,428 shares authorized, 1,294,539 shares issued and outstanding, actual; 500,000,000 shares authorized, shares issued and outstanding, pro forma; and shares authorized, shares issued and outstanding, pro forma as adjusted |
1 | 14 | ||||||||
Additional paid-in capital(1) |
45,219 | 140,849 | ||||||||
Accumulated deficit |
(75,324 | ) | (75,324 | ) | ||||||
Total stockholders' equity (deficit)(1) |
(30,104 | ) | 65,539 | |||||||
Total capitalization(1) |
$ | 77,365 | $ | 77,365 | ||||||
(1) A $1.00 increase (decrease) in the assumed initial public offering price of $ per share, the midpoint of the range set forth on the cover page of this prospectus, would increase (decrease) each of additional paid-in capital, total stockholders' equity and total capitalization by $ million, assuming that the number of shares offered by us, as set forth on the cover page of this prospectus, remains the same, and after deducting estimated underwriting discounts and commissions and estimated offering expenses payable by us. Each increase of million shares in the number of shares offered by us, together with a $ increase in the assumed offering price of $ per share, would increase additional paid-in capital, total stockholders' equity and total capitalization by approximately $ million.
The number of shares of our common stock to be outstanding following this offering as of June 30, 2011 excludes:
- •
- 1,665,343 shares of common stock issuable upon the exercise of options outstanding as of June 30, 2011, with
a weighted average exercise price of $2.92 per share;
- •
- 26,038 shares of common issuable upon the exercise of outstanding warrants, with a weighted average exercise price
of $10.03 per share; and
- •
- shares of our common stock reserved for future issuance under our stock-based compensation plans, including sh ares of common stock reserved for issuance under our 2011 Stock Option and Incentive Plan, which will become effective in connection with this offering, and any future increase in shares reserved for issuance under such plan.
38
If you invest in our common stock, your interest will be diluted to the extent of the difference between the amount per share paid by purchasers of shares of common stock in this initial public offering and the pro forma as adjusted net tangible book value per share of common stock immediately after completion of this offering.
At June 30, 2011, our pro forma net tangible book value was approximately $ million, or $ per share of common stock. Pro forma net tangible book value per share represents total tangible assets less total liabilities, divided by the number of shares of common stock outstanding after giving effect to (i) the conversion of all outstanding shares of our convertible preferred stock into an aggregate of 13,064,838 shares of our common stock effective immediately prior to the completion of this offering, for a total of 14,359,377 shares of common stock outstanding on June 30, 2011 and (ii) the reclassification of our preferred stock warrant liabilities from long-term liabilities to additional paid-in capital. After giving effect to our sale of shares of common stock in this offering at an assumed initial public offering price of $ , the midpoint of the price range set forth on the front cover of this prospectus, and after deducting estimated underwriting discounts and commissions and estimated offering expenses, our pro forma as adjusted net tangible book value at June 30, 2011 would have been $ , or $ per share of common stock. This represents an immediate increase in pro forma net tangible book value of $ per share to existing stockholders and an immediate dilution of $ per share to new investors.
The following table illustrates this dilution:
Assumed initial public offering price per share |
$ | ||||||
Pro forma net tangible book value per share as of June 30, 2011 |
$ | ||||||
Increase per share attributable to this offering |
|||||||
Pro forma as adjusted net tangible book value per share after this offering |
|||||||
Dilution per share to new investors in this offering |
$ | ||||||
If all our outstanding options had been exercised, the pro forma net tangible book value as of June 30, 2011 would have been $ million, or $ per share, and the pro forma as adjusted net tangible book value after this offering would have been $ million, or $ per share, causing dilution to new investors of $ per share.
The following table summarizes, on a pro forma as adjusted basis as of June 30, 2011, the total number of shares of common stock purchased from us, the total consideration paid to us, and the average price per share paid to us by existing stockholders and by new investors purchasing shares in this offering at the initial public offering price of $ , the midpoint of the price
39
range set forth on the front cover of this prospectus, before deducting estimated underwriting discounts and commissions and estimated offering expenses:
| |
Shares purchased | Total consideration | Average price per share |
||||||||||||||
|---|---|---|---|---|---|---|---|---|---|---|---|---|---|---|---|---|---|
| |
Number |
Percent |
Amount |
Percent |
|||||||||||||
Existing stockholders |
% | $ | % | $ | |||||||||||||
New investors |
|||||||||||||||||
Total |
% | $ | % | ||||||||||||||
The foregoing calculations exclude as of June 30, 2011:
- •
- 1,665,343 shares of common stock issuable upon the exercise of options outstanding as of June 30, 2011, with a
weighted average exercise price of $2.92 per share;
- •
- 26,038 shares of common issuable upon the exercise of outstanding warrants, with a weighted average exercise price
of $10.03 per share; and
- •
- shares of our common stock reserved for future issuance under our stock-based compensation plans, including sh ares of common stock reserved for issuance under our 2011 Stock Option and Incentive Plan, which will become effective in connection with this offering, and any future increase in shares reserved for issuance under such plan.
40
Selected consolidated financial data
The following selected consolidated financial data should be read together with our financial statements and accompanying notes and "Management's discussion and analysis of financial condition and results of operations" appearing elsewhere in this prospectus. The selected financial data in this section is not intended to replace our financial statements and the related notes. Our historical results are not necessarily indicative of our future results.
We derived the consolidated statements of operations data for each of the three years ended December 31, 2010, 2009 and 2008 and the consolidated balance sheet data as of December 31, 2010 and 2009 from our audited consolidated financial statements appearing elsewhere in this prospectus. The consolidated statements of operations data for the years ended December 31, 2007 and 2006, and the consolidated balance sheet data as of December 31, 2008, 2007 and 2006 are derived from our audited consolidated financial statements that are not included in this prospectus. The consolidated statements of operations data for the six months ended June 30, 2011 and 2010 and the consolidated balance sheet data as of June 30, 2011 are derived from our unaudited condensed consolidated financial statements appearing elsewhere in this prospectus.
| |
|
|
|
|
|
Six months ended June 30, | ||||||||||||||||||
|---|---|---|---|---|---|---|---|---|---|---|---|---|---|---|---|---|---|---|---|---|---|---|---|---|
| |
Year ended December 31, | |||||||||||||||||||||||
| (in thousands, except share and per share data) |
||||||||||||||||||||||||
| 2010 |
2009 |
2008 |
2007 |
2006 |
2011 |
2010 |
||||||||||||||||||
| |
|
|
|
|
|
(unaudited) |
||||||||||||||||||
Consolidated Statement of Operations Data: |
||||||||||||||||||||||||
Total revenues |
$ | 108,336 | $ | 65,730 | $ | 72,564 | $ | 52,029 | $ | 46,719 | $ | 76,611 | $ | 49,290 | ||||||||||
Cost of revenues |
79,375 | 60,646 | 63,157 | 47,673 | 38,583 | 55,894 | 36,272 | |||||||||||||||||
Gross profit |
28,961 | 5,084 | 9,407 | 4,356 | 8,136 | 20,717 | 13,018 | |||||||||||||||||
Operating expenses: |
||||||||||||||||||||||||
Research and development |
12,010 | 19,540 | 19,031 | 10,569 | 8,876 | 7,324 | 5,754 | |||||||||||||||||
Sales and marketing |
2,671 | 3,181 | 3,888 | 2,459 | 2,115 | 1,736 | 1,253 | |||||||||||||||||
General and administrative |
3,270 | 7,972 | 5,904 | 3,136 | 2,332 | 1,811 | 1,469 | |||||||||||||||||
Severance and liquidation expenses |
— | 6,465 | — | — | — | — | — | |||||||||||||||||
Asset impairment |
— | 3,221 | 9,841 | — | — | — | — | |||||||||||||||||
Restructuring charge |
— | — | — | — | 1,502 | — | — | |||||||||||||||||
Total operating expenses |
17,951 | 40,379 | 38,664 | 16,164 | 14,825 | 10,871 | 8,476 | |||||||||||||||||
Income (loss) from operations |
11,010 | (35,295 | ) | (29,257 | ) | (11,808 | ) | (6,689 | ) | 9,846 | 4,542 | |||||||||||||
Other (expense) income: |
||||||||||||||||||||||||
Interest expense, net |
(1,328 | ) | (1,617 | ) | (2,148 | ) | (1,088 | ) | (972 | ) | (554 | ) | (684 | ) | ||||||||||
Other (expense) income, net |
(292 | ) | 1,574 | (642 | ) | (387 | ) | 433 | (192 | ) | 49 | |||||||||||||
Total other income (expense) |
(1,620 | ) | (43 | ) | (2,790 | ) | (1,475 | ) | (539 | ) | (746 | ) | (635 | ) | ||||||||||
Income (loss) before provision for income taxes |
9,390 | (35,338 | ) | (32,047 | ) | (13,283 | ) | (7,228 | ) | 9,100 | 3,907 | |||||||||||||
Provision for income taxes |
501 | 128 | 177 | — | — | 2,226 | 202 | |||||||||||||||||
Net income (loss) |
$ | 8,889 | $ | (35,466 | ) | $ | (32,224 | ) | $ | (13,283 | ) | $ | (7,228 | ) | $ | 6,874 | $ | 3,705 | ||||||
Net income (loss) attributable to common shareholders |
$ | 1,115 | $ | (35,466 | ) | $ | (32,224 | ) | $ | (13,283 | ) | $ | (7,228 | ) | $ | 48,092 | $ | 464 | ||||||
Net income (loss) per common share(1): |
||||||||||||||||||||||||
Basic |
$ | 0.73 | $ | (23.74 | ) | $ | (22.68 | ) | $ | (15.22 | ) | $ | (8.62 | ) | $ | 36.90 | $ | 0.30 | ||||||
Diluted |
$ | 0.73 | $ | (23.74 | ) | $ | (22.68 | ) | $ | (15.22 | ) | $ | (8.62 | ) | $ | 0.45 | $ | 0.30 | ||||||
41
| |
Year ended December 31, | Six months ended June 30, | |||||||||||||||||||||
|---|---|---|---|---|---|---|---|---|---|---|---|---|---|---|---|---|---|---|---|---|---|---|---|
| (in thousands, except share and per share data) |
|||||||||||||||||||||||
| 2010 |
2009 |
2008 |
2007 |
2006 |
2011 |
2010 |
|||||||||||||||||
| |
|
|
|
|
|
(unaudited) |
|||||||||||||||||
Weighted average number of common shares outstanding |
|||||||||||||||||||||||
Basic |
1,519,124 | 1,494,124 | 1,420,786 | 872,714 | 838,059 | 1,303,131 | 1,521,391 | ||||||||||||||||
Diluted |
1,523,183 | 1,494,124 | 1,420,786 | 872,714 | 838,059 | 15,110,781 | 1,521,391 | ||||||||||||||||
Pro forma net income per common share (unaudited)(2): |
|||||||||||||||||||||||
Basic |
$ | $ | $ | $ | $ | $ | $ | ||||||||||||||||
Diluted |
$ | $ | $ | $ | $ | $ | $ | ||||||||||||||||
Weighted average number of shares used in pro forma computation (unaudited)(2): |
|||||||||||||||||||||||
Basic |
|||||||||||||||||||||||
Diluted |
|||||||||||||||||||||||
Pro forma as adjusted net income per common share (unaudited)(3): |
|||||||||||||||||||||||
Basic |
$ | $ | $ | $ | $ | $ | $ | ||||||||||||||||
Diluted |
$ | $ | $ | $ | $ | $ | $ | ||||||||||||||||
Weighted average number of shares used in pro forma as adjusted computation (unaudited)(3): |
|||||||||||||||||||||||
Basic |
|||||||||||||||||||||||
Diluted |
|||||||||||||||||||||||
(1) We applied the two-class method to compute net income (loss) per common share which requires that earnings for the period be allocated between common and participating securities based upon their respective contractual rights to receive distributed and undistributed earnings. See Note 2 of the notes to each of our consolidated financial statements included elsewhere in this prospectus.
(2) The pro forma basic and diluted net income per share have been calculated assuming (i) the conversion of all outstanding shares of convertible preferred stock into an aggregate of 13,064,838 shares of our common stock as of the beginning of the applicable period and (ii) the reclassification of outstanding preferred stock warrants from long-term liabilities to additional paid-in capital as of the beginning of the applicable period. The numerator of the pro forma net income per share calculation is derived by adding $ for the year ended December 31, 2010 related to the preferred stock warrant liability and by excluding the impact of $ for the six months ended June 30, 2011 related to the redemption of preferred stock below carrying value to net income as reported to arrive at net income attributable to common shares of approximately $ and $ for the year ended December 31, 2010 and the six months ended June 30, 2011, respectively.
(3) The pro forma as adjusted basic and diluted net income per share have been calculated assuming (i) the conversion of all outstanding shares of convertible preferred stock into an aggregate of 13,064,838 shares of our common stock as of the beginning of the applicable period and (ii) the reclassification of outstanding preferred stock warrants from long-term liabilities to additional paid-in capital as of the beginning of the applicable period, (iii) the sale by us of the shares of common stock in our initial public offering as of the beginning of the applicable period, and (iv) the filing of our amended and restated certificate of incorporation immediately prior to the closing of this offering. The numerator of the pro forma net income per share calculation is derived by adding $ for the year ended December 31, 2010 related to the preferred stock warrant liability and subtracting $ for the six months ended June 30, 2011 related to the redemption of preferred stock below carrying value to net income as reported to arrive at net income attributable to common shares of approximately $ and $ for the year ended December 31, 2010 and the six months ended June 30, 2011, respectively.
| |
As of December 31, | As of June 30, | |||||||||||||||||
|---|---|---|---|---|---|---|---|---|---|---|---|---|---|---|---|---|---|---|---|
| (in thousands) |
2010 |
2009 |
2008 |
2007 |
2006 |
2011 |
|||||||||||||
| |
|
|
|
|
|
(unaudited) |
|||||||||||||
Consolidated balance sheet data: |
|||||||||||||||||||
Cash and cash equivalents |
$ | 12,397 | $ | 9,122 | $ | 35,929 | $ | 6,033 | $ | 7,323 | $ | 31,437 | |||||||
Working capital |
34,978 | 25,632 | 44,561 | 7,992 | 15,261 | 58,761 | |||||||||||||
Total assets |
74,311 | 55,433 | 107,331 | 48,295 | 38,908 | 107,372 | |||||||||||||
Long-term obligations, including current portion |
13,033 | 14,750 | 16,287 | 19,102 | 14,930 | 12,065 | |||||||||||||
Convertible preferred stock |
122,958 | 122,958 | 122,958 | 49,582 | 34,037 | 95,404 | |||||||||||||
Total stockholders' equity (deficit) |
(84,561 | ) | (93,471 | ) | (61,039 | ) | (30,100 | ) | (18,024 | ) | (30,104 | ) | |||||||
42
Management's discussion and analysis of financial condition and results of operations
The following discussion and analysis of our financial condition and results of operations should be read in conjunction with "Selected consolidated financial data" and our consolidated financial statements and related notes appearing elsewhere in this prospectus. In addition to historical information, this discussion and analysis contains forward-looking statements that involve risks, uncertainties and assumptions. Our actual results may differ materially from those anticipated in these forward-looking statements as a result of certain factors. Factors that we believe could cause or contribute to these differences include, but are not limited to, those identified below and elsewhere in this prospectus, including those set forth under "Risk factors" and "Special note regarding forward-looking statements and industry data."
Overview
We are a leading platform-based provider of core optical technologies enabling bandwidth for high-speed networks. Our solutions provide the fundamental building blocks—the creation, modulation, routing and detection of light—for optical networking, which is a high-performance, cost-effective alternative to traditional networking technologies. We produce active components that create and detect light, passive components that guide and combine light, and packaging solutions that integrate active and passive components into compact, high-performance, power- and cost-efficient products. Through our vertically integrated technology and manufacturing platforms, we design, fabricate and package a broad portfolio of optical components—lasers, detectors, transmitters, receivers and modulators—for module manufacturers and network equipment manufacturers, who sell to communication service providers and enterprises in the Access, Enterprise/Data Center and Long Haul/Metro segments of the communications network, and for other emerging end market applications, such as defense and avionics, high performance computing, medical and security.
We believe we are one of the few companies in our industry with vertically integrated technology and manufacturing platforms that span from Indium Phosphide and Silica-on-Silicon fabrication to proprietary, highly automated assembly and test facilities. Our in-house capabilities allow us to offer a dependable supply of quality optical components and modules. Our photonic integrated circuit and components on board solutions incorporate greater functionality and intelligence at the component level, which enables us to serve next-generation, higher speed networks.
We sell our products to a global, diversified customer base that includes module manufacturers and network equipment manufacturers, who in turn sell to communication service providers and enterprises, and to defense and avionics contractors. Our largest customers by revenue during 2010 include Cambridge Industries Group Ltd., Ciena Corporation, Finisar Corporation, Huawei Technologies Co., Ltd., Source Photonics, Inc. and Superxon Technology, Ltd., and our largest customer by revenue during 2010 in the defense and avionics markets is Lockheed Martin Corporation. We believe that greater than 70% of our revenue was sole-sourced in 2010, which we believe demonstrates the differentiation of our products and gives us significant insight into our customers' product and technology roadmaps.
We believe we have an attractive financial profile, with strong top-line performance. Furthermore, our strong, collaborative design relationships with our customers, which provide
43
us with an understanding of forward-looking customer demand profiles and percent share awards, in combination with our backlog levels provides us with a degree of revenue visibility for the following quarter and also helps us manage our short-term cost structure. We have grown our revenue at a 31.3% CAGR between 2005 and 2010 and 55.4% period over period from the six months ended June 30, 2010 to the six months ended June 30, 2011. We have also experienced significant margin expansion, as our income (loss) from operations margin increased from 9.2% in the six months ended June 30, 2010 to 12.9% in the six months ended June 30, 2011, and our adjusted income (loss) from operations margin increased from 11.6% in the six months ended June 30, 2010 to 13.9% in the six months ended June 30, 2011. Adjusted income (loss) from operations margin is not calculated in accordance with GAAP. A reconciliation of this non-GAAP measure to income (loss) from operations margin calculated and presented in accordance with GAAP is included below in "—Key business metrics." Adjusted income (loss) from operations margin should not be considered as an alternative to income (loss) from operations margin calculated and presented in accordance with GAAP. We incurred aggregate net losses of $96.1 million from 2005 to 2010.
Our history and key milestones
In 1999, the company was founded with a vision of providing core optical technologies to enable bandwidth for high-speed networks. Key milestones in our development include:
- •
- In February 2003, we acquired the optical component packaging capabilities of CENIX, Inc., an optical start-up that
developed high-speed optical modules using an automated manufacturing platform;
- •
- In April 2003, we introduced what we believe to be one of the first commercially available 10Gbps transmit optical
subassembly products, or TOSAs, to enable pluggable transceivers;
- •
- In April 2005, we acquired the optoelectronics division of TriQuint Semiconductor, Inc., formerly the
optoelectronics divisions of Lucent Technologies and Bell Labs;
- •
- In September 2005, we introduced what we believe to be one of the lowest power consumption cooled 2.5Gbps small form
factor laser transmitters for integration into pluggable transceivers;
- •
- In April 2007, we acquired Apogee Photonics, Inc., a supplier of laser sources for 10Gbps and 40Gbps markets;
- •
- In November 2007, we acquired Inplane Photonics, Inc., a manufacturer of planar lightguide circuits,
or PLCs, for optical networks in defense and telecommunications applications using Silica-on-Silicon PLC technology;
- •
- In July 2008, we acquired PGT Photonics S.p.A., or PGT, a silicon-based photonics business with tunable laser
technology, photonic integrated circuit capabilities and manufacturing infrastructure;
- •
- In March 2011, we introduced what we believe to be one of the first 40Gbps/100Gbps coherent receivers with full
integration of 90 degree hybrids, detectors, trans-impedance amplifiers and polarization splitters; and
- •
- In May 2011, we introduced what we believe to be one of the first commercially available 10Gbps TOSAs for dense wavelength division multiplexing in small form-factor pluggable plus transceivers.
44
Key business metrics
Presented in the following table is a number of key metrics that we believe are helpful to evaluate our business.
Our management monitors a number of the key financial metrics shown below to help us evaluate trends, measure the effectiveness and efficiency of our operations and gauge our cash generation. These include revenue, gross profit and gross margin, income (loss) from operations, income (loss) from operations margin, net income (loss) and net cash provided by (used in) operating activities. We discuss a number of the elements of these metrics in "—Financial operations overview" and "—Critical accounting policies and estimates."
In addition, we present a number of key non-GAAP financial metrics in the table below that we believe are useful for investors and that we expect our management to use to evaluate our business in future periods. These include adjusted gross profit, adjusted gross margin, earnings before interest, taxes, depreciation and amortization or EBITDA, EBITDA margin, adjusted EBITDA, adjusted EBITDA margin, adjusted income (loss) from operations, adjusted income (loss) from operations margin, adjusted net income (loss) and free cash flow. These measures are not a recognized presentation under GAAP. An explanation of the elements of each non-GAAP measure and a full reconciliation of each non-GAAP measure to the most directly comparable GAAP measure, as well as a discussion of the material limitations of adjusted EBITDA, is presented in "—Use of non-GAAP financial measures—Reconciliation of non-GAAP measures to most comparable GAAP measure."
| |
Years ended December 31, | Six months ended June 30, |
||||||||||||||
|---|---|---|---|---|---|---|---|---|---|---|---|---|---|---|---|---|
| (in thousands, except percentages) |
2010 |
2009 |
2008 |
2011 |
2010 |
|||||||||||
GAAP metrics: |
||||||||||||||||
Total revenues |
$ | 108,336 | $ | 65,730 | $ | 72,564 | $ | 76,611 | $ | 49,290 | ||||||
Gross profit |
$ | 28,961 | $ | 5,084 | $ | 9,407 | $ | 20,717 | $ | 13,018 | ||||||
Gross margin |
26.7% | 7.7% | 13.0% | 27.0% | 26.4% | |||||||||||
Income (loss) from operations |
$ | 11,010 | $ | (35,295 | ) | $ | (29,257 | ) | $ | 9,846 | $ | 4,542 | ||||
Income (loss) from operations margin |
10.2% | (53.7)% | (40.3)% | 12.9% | 9.2% | |||||||||||
Net income (loss) |
$ | 8,889 | $ | (35,466 | ) | $ | (32,224 | ) | $ | 6,874 | $ | 3,705 | ||||
Net cash provided by (used in) operating activities |
$ | 8,233 | $ | (14,766 | ) | $ | (23,176 | ) | $ | 4,523 | $ | 4,040 | ||||
Non-GAAP metrics: |
||||||||||||||||
Adjusted gross profit |
$ | 30,483 | $ | 9,198 | $ | 10,381 | $ | 21,126 | $ | 13,528 | ||||||
Adjusted gross margin |
28.1% | 14.0% | 14.3% | 27.6% | 27.4% | |||||||||||
Adjusted income (loss) from operations |
$ | 13,175 | $ | (19,664 | ) | $ | (16,861 | ) | $ | 10,623 | $ | 5,726 | ||||
Adjusted income (loss) from operations margin |
12.2% | (29.9)% | (23.2)% | 13.9% | 11.6% | |||||||||||
Adjusted net income (loss) |
$ | 11,216 | $ | (19,835 | ) | $ | (19,828 | ) | $ | 7,517 | $ | 4,860 | ||||
EBITDA |
15,694 | (25,167 | ) | (22,928 | ) | $ | 11,618 | $ | 7,380 | |||||||
EBITDA margin |
14.5% | (38.3)% | (31.6)% | 15.2% | 15.0% | |||||||||||
Adjusted EBITDA |
$ | 15,953 | $ | (12,056 | ) | $ | (12,523 | ) | $ | 11,701 | $ | 7,390 | ||||
Adjusted EBITDA margin |
14.7% | (18.3)% | (17.3)% | 15.3% | 15.0% | |||||||||||
Free cash flow |
$ | 5,306 | $ | (18,217 | ) | $ | (25,015 | ) | $ | 117 | $ | 3,295 | ||||
45
Use of non-GAAP financial measures
Adjusted gross profit, adjusted gross margin, adjusted income (loss) from operations, adjusted income (loss) from operations margin, adjusted net income (loss), EBITDA, EBITDA margin, adjusted EBITDA, adjusted EBITDA margin and free cash flow are performance measures that are not calculated in accordance with GAAP. The foregoing non-GAAP measures should not be considered as a substitute for, or superior to, the information provided to measures of financial performance calculated and presented in accordance with GAAP. The table at the end of this section in "—Reconciliation of non-GAAP measures to most comparable GAAP measure" provides a reconciliation of these non-GAAP measures to the most directly comparable measures calculated and presented in accordance with GAAP.
Our non-GAAP measures may not be comparable to similarly titled measures of other companies because other companies may not calculate such similarly titled measures in the same manner as we do. We prepare our non-GAAP measures in each case to eliminate the impact of items that we do not consider indicative of our core operating performance. We encourage you to evaluate these adjustments and the reasons we consider them appropriate.
Definitions of Non-GAAP Financial Measures
Our non-GAAP financial measures are calculated as follows:
- •
- Adjusted gross profit is based on gross profit and excludes the
amortization of certain purchased intangible assets, inventory write-offs in 2009 in connection with the dissolution of PGT, and stock-based compensation expense.
- •
- Adjusted gross margin is equal to adjusted gross profit divided by total
revenues.
- •
- Adjusted income (loss) from operations is based on our income (loss) from
operations and excludes the amortization of purchased intangible assets, inventory and accounts receivable write-offs in 2009 in connection with the dissolution of PGT, acquired in-process
research and development costs, stock-based compensation expense, severance and liquidation expenses related to PGT and asset impairment charges.
- •
- Adjusted income (loss) from operations margin is equal to adjusted income
(loss) from operations divided by total revenues.
- •
- Adjusted net income (loss) is based on our net income (loss) and excludes
the amortization of purchased intangible assets, inventory and accounts receivable write-offs in 2009 in connection with the dissolution of PGT, acquired in-process research and
development costs, preferred stock warrant charges, stock-based compensation expense, severance and liquidation expenses related to PGT, asset impairment charges and the related tax effects of such
non-GAAP adjustments.
- •
- EBITDA is based on our net income (loss) and excludes amortization of
purchased intangible assets, depreciation expense, net interest expense and provision for income taxes.
- •
- EBITDA margin is equal to EBITDA divided by total revenues.
- •
- Adjusted EBITDA is based on our net income (loss) and excludes the amortization of purchased intangible assets, inventory and accounts receivable write-offs in 2009 in connection with the dissolution of PGT, depreciation expense, acquired in-process research
46
and development costs, preferred stock warrant charges, stock-based compensation expense, severance and liquidation expenses related to PGT, asset impairment charges, net interest expense and provision for income taxes.
- •
- Adjusted EBITDA margin is equal to adjusted EBITDA divided by total
revenues.
- •
- Free cash flow is based on our cash provided by (used in) operating activities and includes our purchases of property and equipment.
Use of Non-GAAP Financial Measures by Investors
We believe that the use of the foregoing non-GAAP measures is helpful for an investor in determining whether to invest in our common stock.
We believe these non-GAAP measures are useful to investors because they are frequently used by securities analysts, investors and other interested parties in the evaluation of companies in our industry. In addition, we believe that these measures are useful in evaluating our operating performance compared to that of other companies in our industry because the calculation of these measures generally eliminates the effects of certain items that items may vary for different companies for reasons unrelated to overall operating performance.
Exclusions of GAAP-Measures from Non-GAAP Measures
We believe that it is appropriate to exclude items from certain of our non-GAAP measues that are not necessarily indicative of ongoing operating performance and, therefore, limit comparability between periods and between us and similar companies. Further explanation of the excluded items is provided below:
- •
- Amortization of purchased intangible assets. Included in
our GAAP financial results is the amortization of purchased intangible assets associated with prior acquisitions and which is non-cash in nature. We exclude these expenses from our
adjusted gross profit, adjusted gross margin, adjusted EBITDA, adjusted EBITDA margin, adjusted income (loss) from operations, adjusted income (loss) from operations margin and adjusted net income
(loss) because we believe they are not indicative of our core operating performance.
- •
- Inventory and accounts receivable
write-offs. Included in our GAAP financial results are non-cash charges for inventory and accounts receivable
write-offs in 2009 in connection with the dissolution of PGT. We exclude this inventory write-off from our adjusted gross profit and adjusted gross margin, and we excluded
these inventory and accounts receivable write-offs from adjusted EBITDA, adjusted EBITDA margin, adjusted income (loss) from operations, adjusted income (loss) from operations margin and
adjusted net income (loss) because we believe these charges related to the dissolution of PGT are not indicative of our core operating performance.
- •
- Stock-based compensation expense. Included in our GAAP financial results are non-cash charges for the fair value of stock options granted to employees. While this is a recurring item, we believe that excluding these charges from our adjusted gross profit, adjusted gross margin, adjusted EBITDA, adjusted EBITDA margin, adjusted income (loss) from operations, adjusted income (loss) from operations margin and adjusted net income (loss) provides for more accurate comparisons of our historical and current results of operations
47
to those of similar companies because various valuation methodologies with subjective assumptions may be used to calculate stock-based compensation expense.
- •
- Acquired in-process research and development
expenses. Included in our GAAP financial results is an acquired in-process research and development charge in 2008. We
exclude acquired in-process research and development expenses from our adjusted EBITDA, adjusted EBITDA margin, adjusted income (loss) from operations, adjusted income (loss) from
operations margin and adjusted net income (loss) because we believe they are not indicative of our core operating performance.
- •
- Severance and liquidation expenses. Included in our GAAP
financial results in 2009 are severance and liquidation expenses related to the down-sizing and dissolution of PGT in late 2009. We exclude severance and liquidation expenses from our adjusted EBITDA,
adjusted EBITDA margin, adjusted income (loss) from operations, adjusted income (loss) from operations margin and adjusted net income (loss) because we believe they are not indicative of our core
operating performance.
- •
- Asset impairment charges. Included in our GAAP financial
results in 2009 and 2008 are non-cash asset impairment charges related primarily to the dissolution of our Italian subsidiary, PGT, in late 2009. We exclude asset impairment charges from
adjusted EBITDA, adjusted EBITDA margin, adjusted income (loss) from operations, adjusted income (loss) from operations margin and adjusted net income (loss) because they are unique to the specific
events and circumstances and we do not believe they are indicative of our core operating performance.
- •
- Preferred stock warrant charge. Included in our GAAP
financial results is a preferred stock warrant charge in 2010. We exclude preferred stock warrant charges from our adjusted EBITDA, adjusted EBITDA margin and adjusted net income (loss) because we
believe they are not indicative of our core operating performance. Additionally, this charge will no longer be applicable subsequent to this initial public offering.
- •
- Depreciation expense. Included in our GAAP financial
results is depreciation expense associated with our capital expenditures. While the use of the capital equipment enables us to generate revenue for our business, we exclude depreciation expenses from
our EBITDA, EBITDA margin, adjusted EBITDA and adjusted EBITDA margin as the exclusion of depreciation expense enable us to compare our financial results with other companies in our industry.
- •
- Interest expense, net. Included in our GAAP financial
results is interest income and interest expense. Although our investing and borrowing activities are elements of our cost structure and provide us the ability to generate revenue and returns for our
owners, we exclude interest income and interest expense from our adjusted EBITDA and adjusted EBITDA margin to provide period-to-period comparability of our core results of
operations unassociated with our investing and borrowing activities.
- •
- Income tax effect of non-GAAP adjustments. This amount adjusts the provision for income taxes to reflect the effect of the non-GAAP adjustments on non-GAAP net
48
income. The adjustments were calculated by applying the effective tax rate of the entity where each non-GAAP adjustment was recorded.
- •
- Provision for income taxes. Included in our GAAP financial results is provision for income taxes. While we are subject to various state and foreign taxes and the payment of such taxes is a necessary element of our operations, we exclude provision for income taxes from our adjusted EBITDA and adjusted EBITDA margin to provide period-to-period comparability of our core results of operations unassociated with the varying effective tax rates to which we are subject.
Material Limitations of Non-GAAP Measures
Although non-GAAP measures are frequently used by investors and securities analysts in their evaluations of companies, non-GAAP measures each have limitations as an analytical tool, and you should not consider them in isolation or as a substitute for analysis of our results of operations as reported under GAAP.
A number of the material limitations of our use and presentation of non-GAAP measures include:
| Non-GAAP Measure |
Limitations |
|
|---|---|---|
Adjusted gross profit and adjusted gross margin |
• Exclusion of amortization of purchased
intangibles does not reflect the costs of acquiring or replacing intangible assets, which may be significant. |
|
Adjusted net income (loss) from operations and adjusted net income (loss) from operations margin |
In addition to the limitations on adjusted gross profit and adjusted gross margin: |
|
|
• Exclusion of acquired in-process research
and development expenses does not necessarily reflect the full economic costs incurred by us in acquiring certain research and development activities, which may be significant. |
|
49
| Non-GAAP Measure |
Limitations |
|
|---|---|---|
Adjusted net income (loss) |
In addition to the limitations on adjusted net income (loss) from operations and adjusted net income (loss) from operations margin: | |
|
• Exclusion of preferred stock warrant charge does not reflect the full economic cost of financing our business. |
|
|
• Exclusion of asset impairment charges does not reflect the cost of acquiring or replacing tangible and intangible assets, which may be significant. |
|
EBITDA and EBITDA margin |
• Exclusion of amortization of purchased
intangibles does not reflect the costs of acquiring or replacing intangible assets, which may be significant. |
|
Adjusted EBITDA and adjusted EBITDA margin |
In addition to the limitations on adjusted net income (loss): |
|
|
• Exclusion of amortization of purchased
intangibles does not reflect the costs of acquiring or replacing intangible assets, which may be significant. |
|
Free cash flow |
• Exclusion of purchases of property and equipment does not reflect the full cash cost of conducting our business, which may be significant. |
|
50
Reconciliation of Non-GAAP Measures to Most Comparable GAAP Measure
The following table reflects the reconciliation of our non-GAAP financial measures to the most comparable GAAP measure, for each of the periods identified.
| |
|
|
|
Six months ended June 30, | |||||||||||||
|---|---|---|---|---|---|---|---|---|---|---|---|---|---|---|---|---|---|
| |
Years ended December 31, | ||||||||||||||||
| Unaudited (in thousands, except percentages) |
|||||||||||||||||
| 2010 |
2009 |
2008 |
2011 |
2010 |
|||||||||||||
Total revenues |
$ | 108,336 | $ | 65,730 | $ | 72,564 | $ | 76,611 | $ | 49,290 | |||||||
Gross profit |
$ | 28,961 | $ | 5,084 | $ | 9,407 | $ | 20,717 | $ | 13,018 | |||||||
Non-GAAP adjustments: |
|||||||||||||||||
Amortization of purchased intangibles |
1,522 | 1,314 | 958 | 383 | 510 | ||||||||||||
PGT Inventory write-offs |
— | 2,800 | — | — | — | ||||||||||||
Stock-based compensation expense |
— | — | 16 | 26 | 0 | ||||||||||||
Adjusted gross profit |
$ | 30,483 | $ | 9,198 | $ | 10,381 | $ | 21,126 | $ | 13,528 | |||||||
Adjusted gross margin |
28.1% | 14.0% | 14.3% | 27.6% | 27.4% | ||||||||||||
Income (loss) from operations |
$ | 11,010 | $ | (35,295 | ) | $ | (29,257 | ) | $ | 9,846 | $ | 4,542 | |||||
Non-GAAP adjustments: |
|||||||||||||||||
Amortization of purchased intangible assets(1) |
2,145 | 2,520 | 1,991 | 694 | 1,174 | ||||||||||||
PGT Inventory and accounts receivable write-offs |
— | 3,400 | — | — | — | ||||||||||||
Acquired in-process research and development |
— | — | 510 | — | — | ||||||||||||
Stock-based compensation expense |
20 | 25 | 54 | 83 | 10 | ||||||||||||
Severance and liquidation expenses |
— | 6,465 | — | — | — | ||||||||||||
Asset impairment charges |
— | 3,221 | 9,841 | — | — | ||||||||||||
Adjusted income (loss) from operations |
$ | 13,175 | $ | (19,664 | ) | $ | (16,861 | ) | $ | 10,623 | $ | 5,726 | |||||
Adjusted income (loss) from operations margin |
12.2% | (29.9 | )% | (23.2 | )% | 13.9% | 11.6% | ||||||||||
Net income (loss) |
$ | 8,889 | $ | (35,466 | ) | $ | (32,224 | ) | $ | 6,874 | $ | 3,705 | |||||
Non-GAAP adjustments: |
|||||||||||||||||
Amortization of purchased intangible assets(1) |
2,145 | 2,520 | 1,991 | 694 | 1,174 | ||||||||||||
PGT Inventory and accounts receivable write-offs |
— | 3,400 | — | — | — | ||||||||||||
Acquired in-process research and development |
— | — | 510 | — | — | ||||||||||||
Stock-based compensation expense |
20 | 25 | 54 | 83 | 10 | ||||||||||||
Severance and liquidation expenses |
— | 6,465 | — | — | — | ||||||||||||
Asset impairment charges |
— | 3,221 | 9,841 | — | — | ||||||||||||
Preferred stock warrant charge |
239 | — | — | — | — | ||||||||||||
Tax effect of non-GAAP adjustments |
(77 | ) | — | — | (134 | ) | (29 | ) | |||||||||
Adjusted net income (loss) |
$ | 11,216 | $ | (19,835 | ) | $ | (19,828 | ) | $ | 7,517 | $ | 4,860 | |||||
Net income (loss) |
$ | 8,889 | $ | (35,466 | ) | $ | (32,224 | ) | $ | 6,874 | $ | 3,705 | |||||
Non-GAAP adjustments: |
|||||||||||||||||
Amortization of purchased intangible assets |
2,145 | 2,520 | 1,991 | 694 | 1,174 | ||||||||||||
Depreciation expense |
2,831 | 6,034 | 4,980 | 1,270 | 1,615 | ||||||||||||
Interest expense, net |
1,328 | 1,617 | 2,148 | 554 | 684 | ||||||||||||
Provision for income taxes |
501 | 128 | 177 | 2,226 | 202 | ||||||||||||
EBITDA |
$ | 15,694 | $ | (25,167 | ) | $ | (22,928 | ) | $ | 11,618 | $ | 7,380 | |||||
EBITDA margin |
14.5% | (38.3 | )% | (31.6 | )% | 15.2% | 15.0% | ||||||||||
Net income (loss) |
$ | 8,889 | $ | (35,466 | ) | $ | (32,224 | ) | $ | 6,874 | $ | 3,705 | |||||
Non-GAAP adjustments: |
|||||||||||||||||
Amortization of purchased intangible assets(1) |
2,145 | 2,520 | 1,991 | 694 | 1,174 | ||||||||||||
PGT Inventory and accounts receivable write-offs |
— | 3,400 | — | — | — | ||||||||||||
Acquired in-process research and development |
— | — | 510 | — | — | ||||||||||||
Stock-based compensation expense |
20 | 25 | 54 | 83 | 10 | ||||||||||||
Depreciation expense |
2,831 | 6,034 | 4,980 | 1,270 | 1,615 | ||||||||||||
Severance and liquidation expenses |
— | 6,465 | — | — | — | ||||||||||||
Asset impairment charges |
— | 3,221 | 9,841 | — | — | ||||||||||||
Interest expense, net |
1,328 | 1,617 | 2,148 | 554 | 684 | ||||||||||||
Preferred stock warrant charge |
239 | — | — | — | — | ||||||||||||
Provision for income taxes |
501 | 128 | 177 | 2,226 | 202 | ||||||||||||
Adjusted EBITDA |
$ | 15,953 | $ | (12,056 | ) | $ | (12,523 | ) | $ | 11,701 | $ | 7,390 | |||||
Adjusted EBITDA margin |
14.7% | (18.3 | )% | (17.3 | )% | 15.3% | 15.0% | ||||||||||
Net cash provided by (used in) operating activities |
$ | 8,233 | $ | (14,766 | ) | $ | (23,176 | ) | $ | 4,523 | $ | 4,040 | |||||
Non-GAAP adjustments: |
|||||||||||||||||
Purchase of property and equipment |
(2,927 | ) | (3,451 | ) | (1,839 | ) | (4,406 | ) | (745 | ) | |||||||
Free cash flow |
$ | 5,306 | $ | (18,217 | ) | $ | (25,015 | ) | $ | 117 | $ | 3,295 | |||||
(1) Reflects amortization of purchased intangible assets included in cost of revenues and operating expenses.
51
Financial operations overview
Total revenues
We derive our revenues from sales of hardware products to module manufacturers and network equipment manufacturers with end market applications in communications and enterprise networks and other emerging end market applications. Geographically, while many design wins are obtained outside of Asia, given the predominance of Asia-based manufacturing, in 2010, 76.3% of our products were shipped to the Asia Pacific region, 16.7% to North America and 7.0% to Europe and the Middle East. We sell our products primarily through our direct sales force and in certain cases in conjunction with manufacturer representatives and distributors. In 2010, we sold our products to more than 180 customers with only one of our customers, Finisar Corporation (15.3% of revenues), representing more than 10.0% of our revenues. We expect that a substantial portion of our revenues will continue to come from a limited number of customers. We closely monitor customer orders and work directly with many of our customers to understand their forward-looking demand profiles, which we use to build our rolling forecast models. Several of our larger customers grant annual or semi-annual percent share awards based on a competitive bidding process. In general, these customers provide us with their demand forecast for a particular product, request a quotation and, if we win the bidding process, the customer allocates a percentage of future unit purchases in a given period. The amount of revenues we recognize in connection with any allocation is based on the customer's percentage of their total spending for the ultimate product. Although these customers are not contractually committed to buy any quantity of products beyond firm purchase orders, because we are allocated a percentage of their total spending for the product, these percent share awards are incorporated into our forecasts and provide us with increased visibility into future revenues. We anticipate that our revenues will increase as a result of increased demand for our products.
Cost of revenues and gross profit
Our cost of revenues consists primarily of the cost to manufacture and test our products, which are assembled at one of our internal manufacturing facilities or our contract manufacturing partners' facilities. We have a diverse set of suppliers to help balance considerations related to product availability, quality and cost. Our cost of revenues also includes labor costs for our employees and contract laborers engaged in the production of our products. Our cost of revenues is impacted by manufacturing variances such as assembly and test yields and production volumes. For new product introductions, our manufacturing yields typically increase over time as we gain manufacturing experience with the product, and increased production volumes provide economies of scale in material procurement unit costs and manufacturing fixed cost distribution. Additionally, our cost of revenues includes charges recorded for excess and obsolete inventory, amortization of certain purchased intangible assets, warranty, shipping and allocated facilities costs. We anticipate our gross margins will improve over time due to increased scale, manufacturing efficiencies and continued introduction of higher performance products with greater component-level intelligence and integrated functionality.
Operating expenses
Our operating expenses have traditionally consisted of research and development, sales and marketing and general and administrative expenses. In addition, in certain periods our
52
operating expenses have also included severance and liquidation expenses and asset impairment charges.
Research and development. Research and development expenses consist primarily of salaries, bonuses and benefits for research and development personnel involved in the design, development and quality testing of new products or enhancements of existing products including engineering services, development software and hardware tools, depreciation of capital equipment and the cost of facilities attributable to research and development. We generally expense research and development as incurred. Property and equipment that are acquired or constructed for research and development activities and that have alternate future uses are capitalized and depreciated over their estimated useful lives on a straight-line basis. We have invested and expect to continue to invest significant time and capital into our research and development operations to support our current and future technology and product roadmaps. Consistent with our strategy, we expect research and development expenses to increase in absolute dollars as we enhance and expand our products in the future.
Sales and marketing. Sales and marketing expenses consist primarily of salaries, bonuses and benefits for our sales and marketing personnel, sales commissions paid to manufacturer representatives, distributors and others, costs related to sales and marketing programs and services and the cost of facilities attributable to sales and marketing operations. We expect sales and marketing expenses to increase in absolute dollars as we increase the number of sales and marketing professionals and sales commissions paid to manufacturer representatives, distributors and others.
General and administrative. General and administrative expenses consist primarily of salaries, bonuses and benefits for our executive, finance, human resources and administrative personnel, as well as the cost of facilities attributable to general and administrative operations, depreciation, legal, accounting and professional service fees and other corporate expenses. We expect general and administrative expenses to increase in the short term, as we develop the infrastructure necessary to operate as a public company, including but not limited to costs and expenses for directors fees, increased personnel costs, increased directors and officers insurance premiums, audit and legal fees, investor relations fees, expenses for compliance with the Sarbanes-Oxley Act of 2002 and rules implemented by the SEC and The NASDAQ Stock Market, LLC.
Severance and liquidation expenses. Severance and liquidation expenses related to costs incurred in connection with the down-sizing and dissolution of PGT in late 2009.
Asset impairment. We record asset impairment charges when it is determined that the carrying value of our assets is not recoverable. In 2009, we recorded an asset impairment charge of $3.2 million related to PGT property and equipment. In 2008, we recorded asset impairment charges of $9.8 million related to the goodwill and intangible assets acquired in the acquisition of PGT.
Interest expense, net
Interest expense, net consists of amounts incurred with respect to our short-term and long-term borrowings offset by interest income received on our cash and cash equivalents.
53
Other (expense) income, net
Other (expense) income, net primarily consists of change in the fair value of preferred stock warrants, foreign exchange gains (losses), gain (loss) on disposal of property and equipment and other income or expense.
Change in the fair value of preferred stock warrants consists of charges recorded to mark our company's outstanding preferred stock warrants to fair value at each reporting date. In connection with this initial public offering, our preferred stock warrants will be reclassified to additional paid-in capital, and they will no longer be required to be classified as a liability and adjusted to their fair market value through earnings each period.
For operations in Mexico, the functional currency is the U.S. dollar. Assets and liabilities of those operations are translated into U.S. dollars using period-end exchange rates; income and expenses are translated using the average exchange rates for the reporting period. Translation adjustments for the operations in Mexico are included in other (expense) income, net. Realized foreign currency transaction gains and losses are included in other (expense) income, net.
Provision for income taxes
Our income (loss) from operations is subject to varying rates of tax in the United States, Mexico and other jurisdictions. Consequently, our effective tax rate is dependent upon the geographic distribution of our earnings or losses and the tax laws and regulations in each geographical region. We expect that our income taxes will vary in relation to our profitability and the geographic distribution of our profits.
Critical accounting policies and estimates
To understand our financial statements, it is important to understand our critical accounting policies and estimates. We prepare our consolidated financial statements in accordance with GAAP. The preparation of consolidated financial statements also requires us to make estimates and assumptions that affect the reported amounts of assets, liabilities, revenue, costs and expenses and related disclosures. We base our estimates on historical experience and on various other assumptions that we believe to be reasonable under the circumstances. Actual results could differ significantly from the estimates made by our management. To the extent that there are differences between our estimates and actual results, our future financial statement presentation, financial condition, results of operations and cash flows will be affected. We believe that the accounting policies discussed below are critical to understanding our historical and future performance, as these policies relate to the more significant areas involving management's judgments and estimates.
Revenue recognition
We generate revenues principally from the sale of hardware products to our customers. Revenues from product sales are recognized when delivery has occurred, persuasive evidence of an agreement exists, the price is fixed or determinable, no further obligation exists and collectability is reasonably assured. Delivery is generally considered to have occurred upon shipment of products. Contracts and/or customer purchase orders are used to determine the existence of an arrangement. We assess whether the price is fixed or determinable based on
54
the payment terms associated with the transaction and whether the sales price is subject to refund or adjustment. We generally do not grant a right of return to our customers. In transactions where a customer's contractual terms include a provision for customer acceptance, revenues are recognized either when such acceptance has been obtained or the acceptance provision has lapsed. We assess collectability based primarily on the creditworthiness of the customer as determined by credit checks and the customer's payment history.
Our terms of sale generally provide that title passes to the buyer upon shipment by us. Amounts billed to clients for shipping and handling of products are classified as total revenues in the consolidated statements of operations.
Valuation of long-lived assets
Long-lived assets, including property and equipment and intangible assets, such as technology and customer relationships, are reviewed for impairment whenever events or changes in circumstances indicate that the carrying amount of an asset may not be recoverable. Recoverability of assets to be held and used is measured by a comparison of the carrying amount of an asset to the future undiscounted cash flows expected to be generated by the assets. If such assets are considered to be impaired, the impairment to be recognized is measured by the amount by which the carrying amount of the assets exceeds the fair value of the assets. An impairment loss would be recognized in the consolidated statement of operations in the period that the impairment occurs. As a result of the significance of our long-lived assets, any recognized impairment loss could have a material adverse impact on our financial position and/or results of operations.
No asset impairment charges were recognized during the year ended December 31, 2010. During the year ended December 31, 2009, an asset impairment charge of $3.2 million was recognized for the impairment of property and equipment at PGT. During the year ended December 31, 2008, we recorded asset impairment charges of $9.8 million, primarily related to the goodwill and intangible assets acquired in the acquisition of PGT. As a result, we had no goodwill balances remaining as of December 31, 2010, 2009 or 2008.
Events giving rise to impairment are an inherent risk in the industry and cannot be predicted. Factors that we consider in deciding when to perform an impairment review include significant under-performance of a product line in relation to expectations, significant negative industry or economic trends, and significant changes or planned changes in our use of the assets.
Valuation of inventories
Inventories are recorded at the lower of cost (using the first-in, first-out method) or market, after we give appropriate consideration to obsolescence and inventories in excess of anticipated future demand. In assessing the ultimate recoverability of inventories, we are required to make estimates regarding future customer demand, the timing of new product introductions, economic trends and market conditions. If the actual product demand is significantly lower than forecasted, we record inventory write-downs that are charged to cost of revenues. Any write-downs have an adverse impact on our gross profit. During the years ended December 31, 2009 and 2008, cost of revenues included $3.7 million (including $2.8 million of PGT inventory write-downs) and $2.0 million, respectively, of inventory write-downs. During the six months ended June 30, 2011, cost of revenues included $0.1 million of inventory write-downs. During the year ended December 31, 2010, the amount of inventory write-down included in our cost of revenues was de minimis.
55
Product warranties
For the majority of our products, we provide a product warranty of one year or less from the date of shipment. We estimate the costs of our warranty obligations based on our historical experience, expectations and future conditions. To the extent we experience increased warranty claim activity or increased costs associated with servicing those claims, our warranty costs will increase resulting in decreases to gross margin. We periodically assess the adequacy of our recorded warranty liabilities and adjust the amounts as necessary. Products are tested against specified functionality requirements prior to delivery, but we nevertheless from time to time experience claims under our warranty guarantees. A provision for estimated future costs related to warranty activities is charged to cost of revenues based upon historical product failure rates and historical costs incurred in correcting product failures. If we experience an increase in warranty claims compared with our historical experience, or if the cost of servicing warranty claims is greater than expected, our gross margin would be adversely affected.
Stock-based compensation
We account for stock options issued to employees using a fair-value-based method, under which we measure the cost of employee services received in exchange for an award of equity instruments, including stock options, based on the grant-date fair value of the award. The resulting cost is recognized for the awards expected to vest over the period during which an employee is required to provide service in exchange for the award, usually the vesting period.
The fair value of the stock options issued to employees was estimated at each grant date using the Black-Scholes option-pricing model. One of the inputs to this model is the estimate of the fair value of the underlying common stock on the date of grant. The other inputs include an estimate of the expected volatility of the stock price, an option's expected term, the risk-free interest rate over the option's expected term, the option's exercise price and our expectations regarding dividends.
We do not have a history of market prices for our common stock because our stock has not been publicly traded. We utilized the observable data for a group of peer companies that grant options with substantially similar terms to assist in developing our volatility assumption. We have derived our expected term assumption based on the simplified method, which results in an expected term based on the midpoint between the vesting date and the contractual term of an option. The simplified method was chosen because we have limited historical option exercise experience due to our company being privately held. The weighted-average risk-free interest rate was based on a zero coupon U.S. Treasury instrument whose term was consistent with the expected life of the stock options. We have not paid and do not anticipate paying cash dividends on our shares of common stock; therefore, the expected dividend yield was assumed to be zero.
56
The value of options issued to nonemployees was insignificant. A summary of the significant assumptions used to estimate the fair value of employee equity awards during the six months ended June 30, 2011 and the years ended December 31, 2010 and 2009 were as follows:
| |
Year ended December 31, | Six Months ended June 30, 2011 |
||||||||
|---|---|---|---|---|---|---|---|---|---|---|
| |
2010 |
2009 |
||||||||
Expected life (in years) |
6.25 | 6.25 | 6.25 | |||||||
Risk-free interest rate |
1.14% | 1.52% | 2.70% | |||||||
Expected volatility |
75% | 75% | 60% | |||||||
Dividend yield |
0% | 0% | 0% | |||||||
If factors change and we employ different assumptions, stock-based compensation expense on future awards may differ significantly from what we have recorded in the past. Higher volatility and longer expected terms result in an increase to stock-based compensation determined at the date of grant. Future stock-based compensation expense and unrecognized stock-based compensation will increase to the extent that we grant additional equity awards to employees or we assume unvested equity awards in connection with acquisitions. If there are any modifications or cancellations of the underlying unvested securities, we may be required to accelerate any remaining unearned stock-based compensation expense or incur incremental cost. Stock-based compensation expense affect our cost of revenue; research and development expenses; sales and marketing expenses; and general and administrative expenses.
Assuming a fair value of our common stock of $2.88 at December 31, 2010, the aggregate intrinsic value of the outstanding and vested options to purchase shares of our common stock outstanding as of December 31, 2010 was $0.5 million and $0.4 million, respectively.
We estimate our forfeiture rate based on an analysis of our actual forfeitures and will continue to evaluate the appropriateness of the forfeiture rate based on actual forfeiture experience, analysis of employee turnover behavior, and other factors. Changes in the estimated forfeiture rate can have a significant effect on reported stock-based compensation expense, because the cumulative effect of adjusting the rate for all expense amortization is recognized in the period the forfeiture estimate is changed. The effect of forfeiture adjustments during 2010 and 2009 and the six months ended June 30, 2011 was insignificant.
Significant factors, assumptions, and methodologies used in estimating fair value of common stock
We performed valuations to estimate the fair value of our common stock for option grants during 2010 and the six months ended June 30, 2011. The fair value of our common stock was estimated at $0.12 during 2010 and $2.88 for the grants on April 26, 2011. The per share
57
exercise prices and Black-Scholes fair values of the option awards as of the respective dates of valuation are as follows:
| Date of grant |
Number of options granted |
Exercise price per share of common stock |
Black-Scholes fair value per option award |
|||||||
|---|---|---|---|---|---|---|---|---|---|---|
April 22, 2010 |
1,767 | $ | 0.52 | $ | 0.05 | |||||
May 24, 2010 |
20,672 | $ | 0.52 | $ | 0.05 | |||||
July 12, 2010 |
4,326 | $ | 0.52 | $ | 0.05 | |||||
November 9, 2010 |
3,652 | $ | 0.52 | $ | 0.05 | |||||
April 26, 2011 |
1,294,599 | $ | 2.37 | $ | 1.81 | |||||
As of June 30, 2011, a total of 1,665,343 common stock options are outstanding.
2010 Grants
The fair value of our common stock for all 2010 grants was based on a valuation that was completed as of November 30, 2009, and took into consideration a number of objective and subjective factors that we believe market participants would consider, including (a) our business, financial condition and results of operations, including related industry trends affecting our operations; (b) our forecasted operating performance and projected future cash flows; (c) the liquid or illiquid nature of our common stock; (d) liquidation preferences, redemption rights and other rights and privileges of our preferred stock; (e) market multiples of our most comparable public peers; (f) recent sales of our securities; and (g) market conditions affecting our industry. We did not update the valuation during 2010 due to the fact that 2010 option grants were not significant as noted in the table above, and therefore, the 2010 option grants do not have a material impact on our consolidated financial statements.
2011 Grants
The fair value of our common stock for the April 26, 2011 grants was based on a valuation that was performed as of December 31, 2010. The exercise price per share of common stock was based on an initial valuation of our common stock as of December 31, 2010. This initial valuation was revised after the April 26, 2011 issuance date of the grants and the revised value was $2.88 per share. Since the revised December 31, 2010 valuation was not available at the time of the April 26, 2011 grant date, our board of directors based the original exercise price on the most recently available valuation, which was the original December 31, 2010 valuation study.
With respect to the revised December 31, 2010 valuation, we used the market approach and the income approach to estimate our equity value. The market approach estimates the value of a company by applying market multiples of publicly-traded companies in the same or similar lines of business to the results and projected results of the company being valued. The income approach involves applying an appropriate risk-adjusted discount rate to projected cash flows based on forecasted revenue and costs. For the December 31, 2010 valuation, we used a risk-adjusted discount rate of 21% to discount the projected cash flows to the valuation date within the income approach. This discount rate is based upon a market-derived weighted average cost of capital, which takes into account the required rate of return for debt and equity investors.
58
When estimating the equity value at each valuation date, we determined an appropriate weighting between the valuations derived from the market and the income approaches. For the revised December 31, 2010 valuation, we placed a 70% weighting on the income approach and a 30% weighting on the market approach. We note that both approaches yielded estimated equity values that were materially consistent as of the valuation date.
We prepared financial forecasts used in the computation of the equity value for both the market approach and the income approach. The financial forecasts were based on assumed revenue growth rates and operating margin levels that took into account our past experience and future expectations. The risks associated with achieving these forecasts were assessed in selecting the appropriate cost of capital rates.
The values derived from weighting the market and income approach were then used to determine an initial estimated equity value. We then used an option pricing model to allocate the calculated equity value between the preferred and common shares outstanding, including estimated liquidation payments to the preferred shareholders for all series of Preferred Stock, inclusive of the Series C-1 Preferred Shares which were issued in January 2011, as this financing was known to us as of December 31, 2010, and therefore, the impact of this financing was considered on a post-money basis. A discount was then applied to reach the final valuation of the common stock based on the fact that, inasmuch as we are a private company, there are impediments to liquidity, including lack of publicly available information and the lack of a trading market. The size of the discount was determined after considering a number of empirical studies related to discounts for lack of marketability, and by using a protective put option model that considers such variables as time to liquidity (2 years), estimated volatility (50%) and yield (0%) of the underlying stock as well as the risk free rate (0.56%). In addition, the current restrictions of the marketability of our common stock were considered. For the December 31, 2010 valuation, we utilized a 25% discount for the lack of marketability.
There is inherent uncertainty in our forecasts and projections and, if we had made different assumptions and estimates than those described previously, the amount of our stock-based compensation expense, net loss, and net loss per share amounts could have been materially different.
We recorded stock-based compensation of $20,000, $25,000, $54,000 and $83,000 during 2010, 2009 and 2008, and the six months ended June 30, 2011, respectively. In future periods, we expect stock-based compensation to increase as we issue additional stock-based awards to continue to attract and retain employees. As of June 30, 2011, we had $1.7 million of unrecognized stock-based compensation expense related to equity instruments previously granted, which is expected to be recognized over a weighted average period of 3.7 years.
Income taxes
We use the liability method of accounting for income taxes as set forth in the authoritative guidance for income taxes. Under this method, we recognize deferred tax liabilities and assets for the expected future tax consequences of temporary differences between the respective carrying amounts and tax bases of our assets and liabilities.
We continue to assess the realizability of our deferred tax assets, which primarily consist of net operating loss, or NOL, carry-forwards. In assessing the realizability of these deferred tax assets, management considers whether it is more likely than not that some portion or all of the deferred tax assets will be realized. We establish valuation allowances when necessary to
59
reduce deferred tax assets to the amounts expected to be realized. The factors used to assess the likelihood of realization include our latest forecast of future taxable income and available tax planning strategies that could be implemented to realize the net deferred tax assets. As of June 30, 2011 and December 31, 2010 and 2009, our deferred tax assets had full valuation allowances on them as we do not currently have sufficient positive evidence to recognize such deferred tax assets at this time.
If our recent trend of profitability continues, we may determine that there is sufficient positive evidence to support a reversal of, or decrease in, the valuation allowance. If we were to reverse all or some part of our valuation allowance our financial statements in the period of reversal would likely reflect an increase in assets on our balance sheet and a corresponding tax benefit to our statement of operations in the amount of the reversal.
As of December 31, 2010, we had U.S. federal net operating loss carryforwards of $186.9 million and state net operating loss carryforwards of $64.8 million which expire in 2022 through 2029. The Tax Reform Act of 1986, or the Act, provides for a limitation of the annual use of net operating loss and research and development tax credit carryforwards following certain ownership changes (as defined by the Act) that limit our ability to utilize carryforwards. As such, we are in the process of completing a study to assess ownership changes that have occurred since our formation and their impact on the value of the NOLs. As a result, we expect that the federal and state net operating loss carryforwards mentioned above will be limited, and we have disclosed our deferred tax asset related to net operating losses based on our best estimate of useable net operating losses. As a consequence of equity transactions consummated in January 2011, we anticipate further limitations on the use of our net operating losses. Our current estimate is that the total available net operating loss carryforwards are approximately $49.0 million for federal purposes and approximately $47.0 million for state purposes. This limit could change upon completion of the study. In addition, we have concluded that there are sufficient net operating loss carryforwards from a federal tax perspective to offset the 2010 federal tax liability.
We adopted Accounting Standards Codification (ASC) 740-10, Accounting for Uncertainty in Income Taxes—an Interpretation of FASB Statement No. 109, on January 1, 2007. We have analyzed our tax position in all jurisdictions where we are required to file an income tax return and have concluded that we do not have any material unrecognized tax benefits. We have filed a U.S. income tax return as well as returns for various state jurisdictions. Our policy is to recognize interest and penalties accrued on any unrecognized tax benefit within the provision for income taxes on the consolidated statement of operations. We have no interest or penalties accrued for any unrecognized tax benefits for any periods presented.
Our annual provision for income taxes and the determination of the resulting deferred tax assets and liabilities involve a significant amount of management judgment. Management's judgments, assumptions and estimates relative to the current provision for income taxes take into account current tax laws, our interpretation of current tax laws and possible outcomes of current and future audits conducted by foreign and domestic tax authorities. We operate within federal, state and international taxing jurisdictions and are subject to audit in these jurisdictions. These audits can involve complex issues that may require an extended period of time to resolve.
We have made no provision for United States taxes on cumulative earnings of $1.8 million of foreign subsidiaries, as those earnings are intended to be reinvested for an indefinite period of time. Upon distribution of these earnings in the form of a dividend, or otherwise, we may be
60
subject to United States income taxes and foreign withholding taxes. It is not practical, however, to estimate the amount of taxes that may be payable upon repatriation of these earnings.
Results of operations
The following tables set forth a summary of our consolidated statement of operations and the related changes for the periods indicated:
| |
|
|
|
Six months ended June 30, |
||||||||||||||
|---|---|---|---|---|---|---|---|---|---|---|---|---|---|---|---|---|---|---|
| |
Year ended December 31, | |||||||||||||||||
| (in thousands, except for percentages, share and per share amounts) |
||||||||||||||||||
| 2010 |
2009 |
2008 |
2011 |
2010 |
||||||||||||||
| |
|
|
|
(unaudited) |
||||||||||||||
Consolidated statement of operations data: |
||||||||||||||||||
Total revenues |
$ | 108,336 | $ | 65,730 | $ | 72,564 | $ | 76,611 | $ | 49,290 | ||||||||
Cost of revenues |
79,375 | 60,646 | 63,157 | 55,894 | 36,272 | |||||||||||||
Gross profit |
28,961 | 5,084 | 9,407 | 20,717 | 13,018 | |||||||||||||
Gross margin |
26.7% | 7.7% | 13.0% | 27.0% | 26.4% | |||||||||||||
Operating expenses: |
||||||||||||||||||
Research and development |
12,010 | 19,540 | 19,031 | 7,324 | 5,754 | |||||||||||||
Sales and marketing |
2,671 | 3,181 | 3,888 | 1,736 | 1,253 | |||||||||||||
General and administrative |
3,270 | $ | 7,972 | 5,904 | 1,811 | 1,469 | ||||||||||||
Severance and liquidation expenses |
— | 6,465 | — | — | — | |||||||||||||
Asset impairment |
— | $ | 3,221 | 9,841 | — | — | ||||||||||||
Total operating expenses |
17,951 | 40,379 | 38,664 | 10,871 | 8,476 | |||||||||||||
Operating income (loss) |
11,010 | (35,295 | ) | (29,257 | ) | 9,846 | 4,542 | |||||||||||
Interest expense, net |
(1,328 | ) | (1,617 | ) | (2,148 | ) | (554 | ) | (684 | ) | ||||||||
Other (expense) income, net |
(292 | ) | 1,574 | (642 | ) | (192 | ) | 49 | ||||||||||
Income (loss) before income taxes |
9,390 | (35,338 | ) | (32,047 | ) | 9,100 | 3,907 | |||||||||||
Provision for income taxes |
501 | 128 | 177 | 2,226 | 202 | |||||||||||||
Net income (loss) |
$ | 8,889 | $ | (35,466 | ) | $ | (32,224 | ) | $ | 6,874 | $ | 3,705 | ||||||
Comparison of six months ended June 30, 2011 and 2010
Total revenues
Total revenues were $76.6 million for the six months ended June 30, 2011 compared to $49.3 million for the six months ended June 30, 2010, an increase of $27.3 million, or 55.4%. $15.0 million of the increase was primarily due to sales to the Access market and supported by the aggressive fiber-to-the-home build out in the Asia-Pacific region and our new components on board product introduction to address this market, $13.7 million of the increase came from sales to the Long Haul/Metro market on the strength of the 10Gbps market expansion and our new small form factor product introductions and $0.8 million of the increase came from sales to our other emerging end markets due to an increase in defense and avionics market activity. These increases were partially offset by sales to the Enterprise/Data Center market contracting by $2.2 million as several older generation products were phased out prior to expected new product introductions.
61
Sales to customers located in the Asia-Pacific region grew by $24.2 million during the six months ended June 30, 2011 compared to June 30, 2010. Our growth was driven by increased unit sales of existing products and new product introductions which in total outpaced downward pressure on our per unit prices, which is typical in our industry. Sales of new products introduced subsequent to June 30, 2010 were $5.4 million for the six months ended June 30, 2011. Weighted average selling prices of individual products which were sold in both periods declined by 10.5% from the six months ended June 30, 2010 to the six months ended June 30, 2011.
Cost of revenues and gross margin
Cost of revenues was $55.9 million for the six months ended June 30, 2011 compared to $36.3 million for the six months ended June 30, 2010, an increase of $19.6 million, or 54.0%. Cost of revenues increased primarily due to higher sales volumes that drove higher material costs of $13.8 million, higher labor costs of $4.5 million and higher overhead, facility costs and related depreciation and amortization costs of $1.4 million.
Gross margin was 27.0% for the six months ended June 30, 2011 compared to 26.4% for the six months ended June 30, 2010. The 55.4% increase in total revenues for the six months ended June 30, 2011 compared to 2010 outpaced the 19.3% increase in overhead, facility costs and related depreciation and amortization primarily due to economies of scale realized as a result of higher levels of manufacturing equipment utilization and improvements in manufacturing yields and cycle times, which were the primary drivers for the increase in gross margins.
Operating expenses
The following table sets forth operating expenses in absolute dollars and as a percentage of revenues:
| |
Six months ended June 30, | |
|
||||||||||||||||||
|---|---|---|---|---|---|---|---|---|---|---|---|---|---|---|---|---|---|---|---|---|---|
| |
2011 | 2010 | Change | ||||||||||||||||||
| (dollars in thousands) |
Amount |
Percentage of revenues |
Amount |
Percentage of revenues |
$ |
% |
|||||||||||||||
| |
(unaudited) |
|
|
||||||||||||||||||
Operating expenses: |
|||||||||||||||||||||
Research and development |
$ | 7,324 | 9.6% | $ | 5,754 | 11.7% | $ | 1,570 | 27.3% | ||||||||||||
Sales and marketing |
1,736 | 2.3% | 1,253 | 2.5% | 483 | 38.5% | |||||||||||||||
General and administrative |
1,811 | 2.4% | 1,469 | 3.0% | 342 | 23.3% | |||||||||||||||
Total operating expenses |
$ | 10,871 | 14.2% | $ | 8,476 | 17.2% | $ | 2,395 | 28.3% | ||||||||||||
Research and development. The increase in research and development expenses was primarily due to $0.5 million in increased utilization of development materials during the six months ended June 30, 2011 to support our current and future technology and product roadmaps, $0.4 million in higher personnel costs resulting from increases in salary, bonuses and benefits to existing employees, the absence in 2011 of $0.4 million of government funding used to offset research and development expenses in 2010 and $0.3 million in increased outside development services.
Sales and marketing. The increase in sales and marketing expenses was primarily attributable to an increase of $0.3 million in sales commissions resulting from higher sales volumes and
62
$0.1 million in higher personnel costs resulting from increases in salary, bonuses and benefits to existing employees.
General and administrative. The increase in general and administrative expenses was primarily due to an increase in general and administrative personnel costs resulting from increases in salary, bonuses and benefits to existing employees of $0.2 million. General and administrative expenses also increased $0.1 million due to the increased use of professional services in support of continued business expansion.
Interest expense, net
Interest expense, net was $0.6 million for the six months ended June 30, 2011 compared to $0.7 million for the six months ended June 30, 2010. The modest decrease of $0.1 million was primarily caused by declining principal balances on our outstanding debt.
Provision for income taxes
Our effective tax rate for the six months ended June 30, 2011 was 24.5% compared to 5.2% in the prior year period. Our expense from income taxes is based on an estimated annual effective tax rate for 2011 of 24.5%. Our estimated annual effective tax rate includes the U.S. federal statutory rate of 35.0%, state income taxes and foreign income taxed at different rates, partially offset by the impact of the expected usage of NOLs that are not currently estimated to be limited. Our effective tax rate for the six months ended June 30, 2010 principally reflected state and foreign taxes, and was lower than the same period in 2011, due to our ability to utilize sufficiently available NOLs without limitation in 2010.
Comparison of the years ended December 31, 2010 and 2009
Total revenues
Total revenues were $108.3 million in 2010 compared to $65.7 million in 2009, an increase of $42.6 million, or 64.8%. $23.2 million of the increase came from sales to the Long Haul/Metro markets on the strength of the 10Gbps market expansion, $16.6 million of the increase came from sales to the Access market supported by the aggressive fiber-to-the-home build out in the Asia-Pacific region, and $5.2 million of the increase came from sales to the Enterprise/Data Center markets. These increases were partially offset by sales to other emerging end market applications contracting by $2.4 million given the scheduled timing of several of our ongoing defense and avionics related programs. Sales to customers located in the Asia-Pacific region grew by $36.2 million in 2010 compared to 2009. Our growth was driven by increased unit sales of existing products and new product introductions, which in total outpaced downward pressure on our per unit prices. Sales of new products introduced subsequent to December 31, 2009 were $21.6 million in 2010. Weighted average selling prices of individual products which were sold in both periods declined by 16.3% from the year ended December 31, 2009 to the year ended December 31, 2010.
Cost of revenues and gross margin
Cost of revenues was $79.4 million for the year ended December 31, 2010 compared to $60.6 million for the year ended December 31, 2009, an increase of $18.8 million, or 31.0%. Cost of revenues increased due to higher sales volumes that drove higher material costs of $19.3 million and higher labor costs of $3.5 million primarily for the Access and Long Haul/Metro products, partially offset by a $2.8 million write-down of certain PGT inventories in 2009
63
and a $1.2 million decrease in overhead, facility costs and related depreciation and amortization for PGT.
Gross margin was 26.7% for the year ended December 31, 2010 compared to 7.7% for the year ended December 31, 2009. This significant improvement in gross margin was due to total revenues for the year ended December 31, 2010 compared to 2009 increasing 64.8% while overhead, facility costs and related depreciation and amortization costs decreased 20% over the comparable period in 2009 as a result of the dissolution of PGT. Additionally, there was a $2.8 million write-down of certain PGT inventories in 2009.
Operating expenses
The following table sets forth operating expenses in absolute dollars and as a percentage of revenue:
| |
Years ended December 31, | |
|
||||||||||||||||||
|---|---|---|---|---|---|---|---|---|---|---|---|---|---|---|---|---|---|---|---|---|---|
| |
2010 | 2009 | |
|
|||||||||||||||||
| |
Change | ||||||||||||||||||||
| |
|
Percentage of revenue |
|
Percentage of revenue |
|||||||||||||||||
| (dollars in thousands) |
Amount |
Amount |
$ |
% |
|||||||||||||||||
| |
(unaudited) |
|
|
||||||||||||||||||
Operating expenses: |
|||||||||||||||||||||
Research and development |
$ | 12,010 | 11.1% | $ | 19,540 | 29.7% | $ | (7,530 | ) | (38.5)% | |||||||||||
Sales and marketing |
2,671 | 2.5% | 3,181 | 4.8% | (510 | ) | (16.0)% | ||||||||||||||
General and administrative |
3,270 | 3.0% | 7,972 | 12.1% | (4,702 | ) | (59.0)% | ||||||||||||||
Severance and liquidation expenses |
— | — | 6,465 | 9.8% | (6,465 | ) | (100.0)% | ||||||||||||||
Asset impairment |
— | — | 3,221 | 4.9% | (3,221 | ) | (100.0)% | ||||||||||||||
Total operating expenses |
$ | 17,951 | 16.6% | $ | 40,379 | 61.4% | $ | (22,428 | ) | 55.5% | |||||||||||
Research and development. The decrease in research and development expenses was primarily related to the absence of $7.7 million of PGT research and development expenses incurred in 2009 that did not recur in 2010 due to the dissolution of PGT in late 2009. The decrease was partially offset by a $0.2 million increase in personnel costs, resulting from increases in salary, bonuses and benefits to existing employees.
Sales and marketing. The decrease in sales and marketing expenses was primarily related to the absence in 2010 of $0.5 million of PGT-related sales and marketing expenses due to the down-sizing and dissolution of PGT in late 2009.
General and administrative. The decrease in general and administrative expenses was primarily related to the absence in 2010 of $5.2 million of PGT-related general and administrative expenses due to the down-sizing and dissolution of PGT in late 2009 (which included a $0.6 million write-off of accounts receivable). This decrease was partially offset by a $0.5 million increase in personnel costs, resulting from increases in salary, bonuses and benefits to existing employees. This decrease was also offset by an increase in information system costs to help support our continued business expansion.
Severance and liquidation expenses. Severance and liquidation expenses of $5.6 million and $0.9 million, respectively, were related to expenses incurred pursuant to the down-sizing and dissolution of PGT and its 137 employees, in late 2009. No such expenses were incurred in 2010.
64
Asset impairment. We record asset impairment charges when it is determined that the carrying value of our assets is not recoverable. In September 2009, in conjunction with our dissolution of PGT, we recorded an asset impairment charge of $3.2 million for the write-off of property and equipment.
Interest expense, net
Interest expense, net was $1.3 million for the year ended December 31, 2010 compared with $1.6 million for the year ended December 31, 2009. The decrease was primarily a result of a reduction in the interest rate on our revolving credit facility for 2010 compared to 2009.
Other (expense) income, net
Other expense, net was $0.3 million for the year ended December 31, 2010 compared to other income, net of $1.6 million for the year ended December 31, 2009. This decrease in other income, net was primarily related to the 2009 settlement between PGT and a customer for termination of an agreement.
Provision for income taxes
Our effective tax rate for the year ended December 31, 2010 was 5.3% compared to (0.4%) in the prior year period. Our tax expense for the year ended December 31, 2010 consisted of state and foreign income taxes. The tax expense for the year ended December 31, 2009 consisted solely of foreign income tax expense. The increase from 2009 to 2010 is due to the generation of U.S. taxable income in 2010.
Comparison of the years ended December 31, 2009 and 2008
Total revenues
Total revenues declined to $65.7 million in 2009 from $72.6 million in 2008, a decrease of $6.9 million, or 9.5%. The decline was due to a decrease in non-recurring PGT-related revenues of $5.3 million and, to a lesser extent, a decrease in sales in the Long Haul/Metro network segments partially offset by an increase in sales in the Access network segment. The decrease in sales in the Long Haul/Metro network segments was primarily related to the macroeconomic downturn that began in late 2008 and continued into the first half of 2009. These net revenue declines, which include the impact of both existing product unit sales decreases as well as downward price pressure on our per unit prices, were partially offset by increased unit sales from new product introductions. Sales of new products introduced subsequent to December 31, 2008 were $21.1 million in 2009. Weighted average selling prices of individual products which were sold in both periods declined by 12.2% from the year ended December 31, 2008 to the year ended December 31, 2009.
Cost of revenues and gross margin
Cost of revenues was $60.6 million for the year ended December 31, 2009 compared to $63.2 million for the year ended December 31, 2008, a decrease of $2.6 million, or 4.1%. Cost of revenues decreased primarily as a result of lower sales volumes and increased manufacturing efficiencies that resulted in material, labor and overhead cost reductions of $2.2 million in our U.S. and Mexican operations, a reduction of $3.1 million in PGT-related costs of revenues as a result of cost reduction measures taken in late 2008 and 2009, partially offset by a $2.8 million write-off of certain PGT inventories in 2009. Our growth was driven by increased unit sales, which outpaced downward pressure on our per unit prices.
Gross margin was 7.7% for the year ended December 31, 2009 compared to 13.0% for the year ended December 31, 2008. The decrease in gross margin was primarily due to a $2.8 million write-off of certain PGT inventories in 2009.
65
Operating expenses
The following table sets forth operating expenses in absolute dollars and as a percentage of revenue:
| |
Years ended December 31, | |
|
||||||||||||||||
|---|---|---|---|---|---|---|---|---|---|---|---|---|---|---|---|---|---|---|---|
| |
2009 | 2008 | Change | ||||||||||||||||
| (dollars in thousands) |
Amount |
Percentage of revenue |
Amount |
Percentage of revenue |
$ |
% |
|||||||||||||
| |
(unaudited) |
|
|
||||||||||||||||
Operating expenses: |
|||||||||||||||||||
Research and development |
$ | 19,540 | 29.7% | $ | 19,031 | 26.2% | $ | 509 | 2.7% | ||||||||||
Sales and marketing |
3,181 | 4.8% | 3,888 | 5.4% | (707 | ) | (18.2)% | ||||||||||||
General and administrative |
7,972 | 12.1% | 5,904 | 8.1% | 2,068 | 35.0% | |||||||||||||
Severance and liquidation expenses |
6,465 | 9.8% | — | — | 6,465 | 100.0% | |||||||||||||
Asset impairment |
3,221 | 4.9% | 9,841 | 13.6% | (6,620 | ) | 67.3% | ||||||||||||
Total operating expenses* |
$ | 40,379 | 61.4% | $ | 38,664 | 53.3% | $ | 1,715 | 4.4% | ||||||||||
* Percentages may not add due to rounding.
Research and development. The increase in research and development expenses was primarily related to the acquisition of PGT in mid-2008, as PGT-related research and development expenses increased by $1.1 million in 2009 compared to 2008. There were five months of operations for PGT in 2008 versus nine months in 2009. This was partially offset by the one-time, in-process $0.5 million research and development charge incurred in 2008.
Sales and marketing. The decrease in sales and marketing expenses was primarily related to the rationalization of PGT sales and marketing expenses in late 2008, which resulted in a $0.7 million reduction in sales and marketing expenses in 2009 compared to 2008.
General and administrative. This increase in general and administrative expenses was primarily related to the acquisition of PGT in mid-2008, as PGT-related general and administrative expenses increased by $1.5 million in 2009 compared to 2008, including $0.6 million write-off of accounts receivable in 2009 related to the dissolution of PGT. There were five months of expenses for PGT in 2008 compared to nine months in 2009. These expenses were primarily related to the transitional service agreement billings associated with PGT.
Severance and liquidation expenses. Pursuant to the downsizing and dissolution of PGT in late 2009, we reduced our PGT employee base by 137 and incurred $5.6 million in related severance expenses. Liquidation expenses of $0.9 million included costs to advertise the sale of PGT assets, fees to a third party liquidator and costs for disbursing assets to purchasers.
Asset impairment. We record asset impairment charges when it is determined that the carrying value of our assets is not recoverable. In 2009, in conjunction with our dissolution of PGT, we recorded an asset impairment charge of $3.2 million related to the writedown of property and equipment to its net realizable value. In 2008, we recorded asset impairment charges of $9.8 million, primarily related to the goodwill and intangible assets acquired in the acquisition of PGT.
66
Interest expense, net
Interest expense, net was $1.6 million for the year ended December 31, 2009 compared with $2.1 million for the year ended December 31, 2008. The decrease was primarily a result of lower interest rates on our borrowings in 2009 as compared to 2008.
Other (expense) income, net
Other income, net was $1.6 million for the year ended December 31, 2009 compared with other expense, net of $0.6 million for the year ended December 31, 2008. This increase was primarily related to the 2009 settlement between PGT and a customer for termination of an agreement.
Provision for income taxes
Our provision for income taxes decreased to $0.1 million for the year ended December 31, 2009 from $0.2 million for the year ended December 31, 2008. Our provision consisted of foreign income taxes for both periods.
Acquisition/dissolution
On July 24, 2008, we purchased PGT for an aggregate purchase price of $47.7 million. The acquisition of PGT enabled us to gain access to PGT's unique tunable laser products and technologies, complementary photonic integrated circuit capabilities and manufacturing infrastructure.
The purchase price was allocated to the assets acquired and the liabilities assumed, based on their estimated fair values at the date of acquisition. In September 2009, as a result of the macroeconomic downturn, we commenced dissolution of PGT and a liquidator was assigned to dissolve the company. We synergized certain PGT products, technology and manufacturing infrastructure into our ongoing operations. The assignment of the liquidator effectively marked our loss of control of PGT. As a result of this loss of control, we were required to deconsolidate the subsidiary. Due to the Italian liquidation of PGT, we retained no interest with value in PGT. We believe we have no material continuing obligations or commitments related to PGT.
During the third quarter of 2009, an asset impairment charge of $3.2 million was recorded, as well as a $2.8 million charge for certain PGT inventories included in cost of revenues, and a $0.6 million charge to write-off certain accounts receivable of PGT. Also in 2009, prior to deconsolidation, PGT incurred expenses related to the down-sizing and dissolution of PGT amounting to $6.5 million. There were no assets and liabilities of PGT presented in our consolidated balance sheet as of December 31, 2010 or 2009. Included in our consolidated statements of operations for 2009 and 2008 were revenues of $3.4 million and $3.5 million and a net loss of $(24.7 million) and $(17.4 million), respectively, for PGT, including impairment charges. Our consolidated statement of cash flows for 2009 reflects the use of cash in the amount of $14.9 million related to PGT, including $6.9 million in support of severance and liquidation activities.
Quarterly results of operations
The following table sets forth our unaudited consolidated revenues and operating expenses for each of the six quarters beginning January 1, 2010 and ending June 30, 2011. You should read this data together with our consolidated financial statements and the related notes included
67
elsewhere in this prospectus. We have prepared the unaudited information on a basis consistent with our audited financial statements and have included all adjustments of a normal and recurring nature, which, in the opinion of management, are considered necessary to fairly present our revenue and operating expenses for the quarters presented. Our historical quarterly revenue and operating expenses are not necessarily indicative of results for any future period.
| |
For the three months ended | ||||||||||||||||||||
|---|---|---|---|---|---|---|---|---|---|---|---|---|---|---|---|---|---|---|---|---|---|
| (in thousands, except for percentages, share and per share amounts) |
|||||||||||||||||||||
| March 31, 2010 |
June 30, 2010 |
September 30, 2010 |
December 31, 2010 |
March 31, 2011 |
June 30, 2011 |
||||||||||||||||
| |
|
|
|
(unaudited) |
|
|
|||||||||||||||
Consolidated statement of operations data: |
|||||||||||||||||||||
Total revenues |
$ | 23,633 | $ | 25,657 | $ | 27,944 | $ | 31,102 | $ | 34,028 | $ | 42,583 | |||||||||
Cost of revenues |
17,742 | 18,530 | 19,727 | 23,376 | 24,759 | 31,135 | |||||||||||||||
Gross profit |
5,891 | 7,127 | 8,217 | 7,726 | 9,269 | 11,448 | |||||||||||||||
Gross margin |
24.9% | 27.8% | 29.4% | 24.8% | 27.2% | 26.9% | |||||||||||||||
Operating expenses: |
|||||||||||||||||||||
Research and development |
2,860 | 2,894 | 2,966 | 3,290 | 3,518 | 3,806 | |||||||||||||||
Sales and marketing |
629 | 624 | 678 | 740 | 801 | 935 | |||||||||||||||
General and administrative |
682 | 787 | 825 | 976 | 863 | 948 | |||||||||||||||
Total operating expenses |
4,171 | 4,305 | 4,469 | 5,006 | 5,182 | 5,689 | |||||||||||||||
Income from operations |
1,720 | 2,822 | 3,748 | 2,720 | 4,087 | 5,759 | |||||||||||||||
Income before income taxes |
1,423 | 2,484 | 3,276 | 2,207 | 3,666 | 5,434 | |||||||||||||||
Provision for income taxes |
78 | 124 | 158 | 141 | 1,384 | 842 | |||||||||||||||
Net income |
$ | 1,345 | $ | 2,360 | $ | 3,118 | $ | 2,066 | $ | 2,282 | $ | 4,592 | |||||||||
Comparison of unaudited quarterly results
From the three months ended March 31, 2010 to the three months ended March 31, 2011, total revenues increased between 8.6% and 11.3% over each quarter, in each case driven by increases in sales volume associated with the strength of the market segments in which we participate and our continued introduction of new products. More recently, revenues for the three months ended June 30, 2011 were up 25.1% sequentially primarily on the strength of the Access market and increased expansion of GPON fiber-to-the-home networks in the Asia-Pacific region. Cost of revenues also correspondingly increased quarter over quarter due largely to increases in materials, labor and related overhead and facility costs resulting from higher sales volumes.
Our gross margin was typically between 27.0% to 29.0% during the periods presented. Our gross margin during the three months ended March 31, 2010 was below that range, which we attribute to lower economies of scale across our fixed cost manufacturing during that period. Our gross margin during the three months ended December 31, 2010 was also below that range due to the nature of our product mix sold in that quarter, increased sales of components on board products and early production ramps of photonic integrated circuit-based components, which resulted in lower production yields.
Operating expenses have generally increased over the prior six quarters. Operating expenses began to increase at a faster rate in the three months ended December 31, 2010 as a result of
68
increased incentive compensation accruals related to the achievement of many of our full-year operating metrics and objectives for 2010. Additionally, during the three months ended December 31, 2010, we stopped receiving certain government funding related to research and development, which we included as an offset to certain research and development expenses in prior quarters. This resulted in higher research and development expenses beginning in the three months ended December 31, 2010.
Our quarterly effective tax rates in 2010 were driven primarily by the availability of NOL carryforwards to offset all federal taxable income during 2010. As a consequence of the equity financing in January 2011, we anticipate further limitation on the use of our NOL carryforwards, and therefore, the effective tax rates increased in the 2011 quarterly periods. The effective tax rate was 37.8% for the three months ended March 31, 2011 based on the estimated limitation of NOL carryforwards per the preliminary results of our study to assess ownership changes and the impact on the value of our NOLs. During the three months ended June 30, 2011, we updated our study, which resulted in a lower estimated limitation of these NOL carryforwards, and therefore, our effective tax rate decreased during this period.
Liquidity and capital resources
Since our inception, we have financed our operations primarily through the sale of preferred stock and borrowings under debt instruments. More recently, we have also financed our operations from cash flows generated from operations. As of June 30, 2011, we had cash and cash equivalents totaling $31.4 million and $58.8 million of working capital.
We believe that our existing cash and cash equivalents and our cash flow from operations will be sufficient to fund our operations and our capital expenditures for at least the next 12 months. Our U.S. operations and cash and cash equivalents are anticipated to be sufficient to satisfy our projected liquidity needs in the United States and to fund foreign operations for an indefinite period of time. Accordingly, we determined that any potential impact of repatriating earnings was not reasonably likely to result in our liquidity decreasing or increasing in a material way. Our future capital requirements will depend on many factors, including our rate of revenue growth, the expansion of our sales and marketing activities, the timing and extent of spending to support product development efforts and expansion into new markets and geographies, the timing of introductions of new products and enhancements to existing products and the continuing market acceptance of our products. Although we are not currently a party to any agreement or letter of intent regarding potential investments in, or acquisitions of, complementary businesses, applications or technologies, we may enter into these types of arrangements, which could require us to seek additional equity or debt financing. Additional funds may not be available on terms favorable to us or at all.
We will also incur costs as a public company that we have not previously incurred, including, but not limited to, costs and expenses for directors fees, increased personnel costs, increased directors and officers insurance premiums, audit and legal fees, investor relations fees, expenses for compliance with the Sarbanes-Oxley Act of 2002 and rules implemented by the SEC and The NASDAQ Stock Market, LLC and various other costs. We cannot currently estimate how much these costs will be.
69
As of June 30, 2011, we have the following indebtedness:
- •
- In May 2008, we entered into a loan and security agreement with Silicon Valley Bank that includes a revolving credit
facility in the aggregate amount of up to $14.0 million and a term loan commitment of up to $2.0 million. All of our property, including all cash accounts, outstanding trade receivables,
inventory, fixed assets and any intellectual property serve as collateral. The term loan shall be repaid by monthly installment payments of interest only in the first year, and thereafter by monthly
installments of principal and interest payments for a period of 36 months. Interest is payable monthly during the term. In December 2009, we amended our existing loan and security agreement
with the bank. The amendment extended the maturity date on the revolving credit facility to December 29, 2011, and reduced the interest rate on this facility by 1% to 6.5% per year. The
amendment did not change the existing terms or rate of interest and expiration date on the term loan. On June 20, 2011, we further amended our existing loan and security agreement with Silicon
Valley Bank. The amendment increased the amount of the credit facility to an aggregate amount of up to $20.0 million. The amendment extended the maturity date on the revolving credit facility
to December 26, 2013, and reduced the interest rate on this facility to Prime Rate plus three-quarters of one percent (3.8% currently). The amended loan and security agreement does not contain
any financial covenants, but contains affirmative covenants, including delivery of financial statements, maintenance of inventory, payment of taxes, maintenance of insurance, creation and monitoring
of bank accounts, protection and registration of intellectual property rights and cooperation in litigation matters, and negative covenants, including restrictions on disposition of assets, changes in
business operations, key members of the management team or business locations, mergers or acquisitions of the company, incurring new indebtedness, creating encumbrances on our assets, making
investments or paying dividends to our stockholders, entering into transactions with affiliates or making payments on subordinated debts. An event of default occurs under the agreement in the event we
fail to make payment when due, violate one of the affirmative or negative covenants, experience a material adverse change, have our assets seized, become insolvent, fail to satisfy a judgment or
default on subordinated indebtedness or other third party agreement or the guaranty on any of the indebtedness terminates. In the event of an event of default, Silicon Valley Bank shall have the
ability to declare all obligations immediately due and payable, stop advancing money or extending credit, apply to the amounts due monies contained in company bank accounts held at Silicon Valley
Bank, seize and dispose of the collateral, or settle or adjust disputes directly with account debtors. The foregoing is not a complete description of the loan and security agreement and is qualified
by the full text of the loan and security agreement filed as an exhibit to the registration statement of which this prospectus is a part. We believe we are in compliance with all covenants as of
June 30, 2011. The outstanding amounts at December 31, 2010 and June 30, 2011 have been classified as long-term due to our intent and ability to refinance those
amounts on a long term basis as occurred in June 2011. $10.2 million is outstanding under the credit line and $0.6 million is outstanding under the term loan at June 30, 2011.
- •
- As part of a previous acquisition in 2005, we received a loan from TriQuint Semiconductor, one of our stockholders, in the amount of $5.6 million. Interest accrued for the initial 23-month period, with total accrued interest as of April 1, 2006 and 2007 added to the principal balance of the loan. Principal and interest payments commenced on April 1, 2007,
70
and are payable over 60 equal monthly installments, through March 1, 2012. $1.0 million is outstanding under this loan at June 30, 2011.
The following table shows selected balance sheet data as well as our cash flows from operating activities, investing activities and financing activities for the stated periods:
| |
As of and for the year ended December 31, | As of and for the six months ended June 30, | ||||||||||||||
|---|---|---|---|---|---|---|---|---|---|---|---|---|---|---|---|---|
| (in thousands) |
2010 |
2009 |
2008 |
2011 |
2010 |
|||||||||||
| |
|
|
|
(unaudited) |
||||||||||||
Cash and cash equivalents |
$ | 12,397 | $ | 9,122 | $ | 35,929 | 31,437 | 11,388 | ||||||||
Cash provided by (used in) operating activities |
8,233 | (14,766 | ) | (23,176 | ) | 4,523 | 4,040 | |||||||||
Cash provided by (used in) investing activities |
(2,854 | ) | (10,338 | ) | 27,888 | (4,387 | ) | (697 | ) | |||||||
Cash provided by (used in) financing activities |
(2,104 | ) | (1,664 | ) | 28,374 | 18,904 | (1,077 | ) | ||||||||
Cash and cash equivalents
Our cash and cash equivalents at June 30, 2011 were held for working capital purposes and were invested primarily in cash and money market accounts. We do not enter into investments for trading or speculative purposes.
Cash flows
Cash provided by (used in) operating activities
Net cash provided by operating activities was $4.5 million and $4.0 million, which included net income of $6.9 million and $3.7 million for the six months ended June 30, 2011 and 2010, respectively. The primary reasons for the increase in net cash provided by operating activities for the six months ended June 30, 2011 was an increase in our net income, offset by an increase in inventory as a result of increased manufacturing activity. The change in operating assets and liabilities resulted in a net use of cash of $4.5 million and $2.5 million for the six months ended June 30, 2011 and 2010, respectively.
Net cash provided by (used in) operating activities was $8.2 million, $(14.8 million) and $(23.2 million) and net income (loss) was $8.9 million, $(35.5 million) and $(32.2 million) for the years ended December 31, 2010, 2009 and 2008, respectively. The primary reason for the increase in net cash provided by operating activities in 2010 was the increase in net income during 2010 offset by increases in inventories and accounts receivable.
We also incurred net non-cash expenses totaling $5.3 million, $12.0 million and $17.6 million for the years ended December 31, 2010, 2009 and 2008, respectively. Non-cash expenses primarily consisted of depreciation and amortization in 2010, and depreciation and amortization asset impairment charges in 2009 and 2008. The change in operating assets and liabilities resulted in a net use of cash of $(6.0 million), $8.7 million and $(8.5 million) for the years ended December 31, 2010, 2009 and 2008, respectively.
Cash provided by (used in) investing activities
Net cash used in investing activities was $4.4 million and $0.7 million for the six months ended June 30, 2011 and 2010, respectively. Cash used in investing activities for the six months ended June 30, 2011 and 2010 was primarily for capital expenditures related to property and equipment as we continued to expand our manufacturing capacity.
71
Net cash used in investing activities was $2.9 million and $10.3 million for the years ended December 31, 2010 and 2009, respectively, and net cash provided by investing activities was $27.9 million for the year ended December 31, 2008. Cash used in investing activities for the year ended December 31, 2010 was primarily for the purchase of property and equipment. Cash used in investing activities for the year ended December 31, 2009 was primarily for capital expenditures of $3.5 million related to property and equipment and $6.9 million of cash used in the dissolution of the PGT business. Cash provided by investing activities for the year ended December 31, 2008 was primarily related to $28.1 million in net cash acquired as a result of the acquisition of the PGT business partially offset by purchase of property and equipment.
Cash provided by (used in) financing activities
Net cash provided by financing activities was $18.9 million for the six months ended June 30, 2011. Net cash used in financing activities was $1.1 million for the six months ended June 30, 2010. Net cash provided by financing activities for the six months ended June 30, 2011 primarily resulted from the net proceeds of a round of financing (Series C-1 preferred stock) of $49.6 million. These proceeds were offset by the repurchase of Common and Preferred stock from investors of $29.6 million. Net cash used in financing activities for the six months ended June 30, 2010 was related to payments on revolving credit facility and terms loans.
Net cash used in financing activities was $2.1 million and $1.7 million for the years ended December 31, 2010 and 2009, respectively. Net cash provided by financing activities was $28.4 million for the year ended December 31, 2008. Net cash used in financing activities for the years ended December 31, 2010 and 2009 was primarily related to payments on our revolving credit facility and terms loans. Net cash provided by financing activities for the year ended December 31, 2008 resulted from proceeds from long-term loans and credit line of $16.7 million and proceeds from the issuance of preferred stock of $20.0 million partially offset by payments on revolving credit facility and term loans of $8.3 million.
Contractual obligations and commitments
We generally do not enter into long-term minimum purchase commitments. Our principal commitments, in addition to those related to our long-term debt discussed above, consist of obligations under facility leases for office space. The following table summarizes our outstanding contractual obligations as of December 31, 2010:
| |
Payments due by period | |||||||||||||||
|---|---|---|---|---|---|---|---|---|---|---|---|---|---|---|---|---|
| (in thousands) |
Total |
Less than 1 year |
1 to 3 years |
3 to 5 years |
More than 5 years |
|||||||||||
Operating lease obligations |
$ | 11,238 | $ | 2,330 | $ | 3,685 | $ | 5,223 | $ | — | ||||||
Debt related payments(1) |
11,145 | 667 | 10,478 | — | — | |||||||||||
TriQuint loan(2) |
1,798 | 1,432 | 366 | — | — | |||||||||||
Total |
$ | 24,181 | $ | 4,429 | $ | 14,529 | $ | 5,223 | $ | — | ||||||
(1) We have a credit line $10,200 and a term loan $945. The amount presented in the table represents the principal portion of the obligations. The debt obligations outstanding as of December 31, 2010 bear interest at rates ranging from the greater of Bank Prime + 1.5% or 6.5% on the credit line and the greater of Bank Prime + 1.5% or 7.5% on the term loan, all of which was subject to fluctuations in interest rates. Interest is paid monthly over the term of the debt arrangements.
(2) The TriQuint Semiconductor loan bears interest at the lesser of 1-year LIBOR + 3.0%, or 8.5%.
72
On June 20, 2011, we amended our existing loan and security agreement with Silicon Valley Bank. The amendment increased the amount of the credit facility to the aggregate amount of up to $20.0 million. The amendment extended the maturity date on the revolving credit facility to December 26, 2013, and reduced the interest rate on this facility to Prime Rate plus three-quarters of one percent (3.8% currently). As a result, the outstanding balance of $10.2 million has been classified in the 1 to 3 years period in the table above. There has been no material change in the obligations since December 31, 2010 other than scheduled payments through June 30, 2011.
Off-balance sheet arrangements
During the years ended December 31, 2010, 2009 and 2008, and the six months ended June 30, 2011, we did not have any relationships with unconsolidated organizations or financial partnerships, such as structured finance or special purpose entities, that would have been established for the purpose of facilitating off-balance sheet arrangements or other contractually narrow or limited purposes.
Recently adopted accounting principles
Recent accounting pronouncements
In January 2010, the Financial Accounting Standards Board, or FASB, issued updated guidance related to fair value measurements and disclosures, which requires a reporting entity to disclose separately the amounts of significant transfers in and out of Level 1 and Level 2 fair value measurements and to describe the reasons for the transfers. In addition, in the reconciliation for fair value measurements using significant unobservable inputs, or Level 3, a reporting entity should disclose separately information about purchases, sales, issuances, and settlements (that is, on a gross basis rather than on a net basis). The updated guidance also requires that an entity should provide fair value measurement disclosures for each class of assets and liabilities and disclosures about the valuation techniques and inputs used to measure fair value for both recurring and non-recurring fair value measurements for Level 2 and Level 3 fair value measurements. The updated guidance is effective for interim or annual financial reporting periods beginning after December 15, 2009, except for the disclosures about purchases, sales, issuances, and settlements in the rollforward activity in Level 3 fair value measurements, which are effective for fiscal years beginning after December 15, 2010 and for interim periods within those fiscal years. We adopted the updated guidance in the first quarter of 2010, and the impact on our consolidated financial statements was not material.
Quantitative and qualitative disclosures about market risk
Market risk represents the risk of loss that may impact our financial position due to adverse changes in financial market prices and rates. Our market risk exposure is primarily a result of fluctuations in interest rates. We do not hold financial instruments for trading purposes.
Interest rate sensitivity
We had cash and cash equivalents of $31.4 million at June 30, 2011, $12.4 million at December 31, 2010, $9.1 million at December 31, 2009 and $35.9 million at December 31, 2008. We held these amounts primarily in cash or money market funds.
73
We hold cash and cash equivalents for working capital purposes. We do not have material exposure to market risk with respect to investments, as our investments consist primarily of highly liquid investments purchased with original maturities of three months or less. We do not use derivative financial instruments for speculative or trading purposes; however, we may adopt specific hedging strategies in the future. Any declines in interest rates, however, will reduce future interest income.
We had total outstanding debt of $11.8 million at June 30, 2011, $12.8 million at December 31, 2010, $14.8 million at December 31, 2009 and $16.3 million at December 31, 2008, primarily all of which was subject to fluctuations in interest rates. As of December 31, 2010, the weighted average interest rate on the $12.8 million of outstanding principal subject to interest rate fluctuations was 6.24%. A hypothetical 10% increase in the interest rate could result in approximately $0.1 million of additional annual interest expense. As of June 30, 2011, the weighted average interest rate on the $11.8 million of outstanding principal subject to interest rate fluctuations was 6.32%. A hypothetical 10% increase in the interest rate could result in approximately $0.1 million of additional annual interest expense. The hypothetical changes and assumptions made above will be different from what actually occurs in the future. Furthermore, the computations do not anticipate actions that may be taken by our management should the hypothetical market changes actually occur over time. As a result, actual impacts on our results of operations in the future will differ from those quantified above.
Foreign currency risk
Foreign currency exchange rates are subject to fluctuation and may cause us to recognize transaction gains and losses in our statement of operations. However, to date the vast majority of our purchased materials and services have been procured in U.S. dollars and we have experienced minimal currency fluctuations. A portion of our business is conducted through our subsidiary in Mexico whose functional currency is the U.S. Dollar. To the extent that transactions by our subsidiary in Mexico are denominated in currencies other than U.S. Dollar, we bear the risk that fluctuations in the exchange rates of the U.S. Dollar in relation to other currencies could increase our costs and expenses. Translation adjustments are included in other income (expense) and were immaterial for all periods presented herein. Realized foreign currency transaction gains and losses are also included in other income (expense) and were immaterial for all periods presented herein.
To date, we have not entered into any hedging transactions in an effort to reduce our exposure to foreign currency exchange risk. While we may decide to enter into hedging transactions in the future, the availability and effectiveness of these hedging transactions may be limited and we may not be able to successfully hedge our exposure.
Inflation risk
Inflationary factors, such as increases in our cost of revenues and operating expenses, may adversely affect our results of operations. Although we do not believe that inflation has had a material impact on our financial position or results of operations to date, an increase in the rate of inflation in the future, particularly in Mexico, may have an adverse affect on our levels of gross profit and operating expenses as a percentage of revenue if the sales prices for our products do not proportionately increase with these increased expenses.
74
Company overview
We are a leading platform-based provider of core optical technologies enabling bandwidth for high-speed networks. Our solutions provide the fundamental building blocks—the creation, modulation, routing and detection of light—for optical networking, which is a high-performance, cost-effective alternative to traditional networking technologies. We produce active components that create and detect light, passive components that guide and combine light, and packaging solutions that integrate active and passive components into compact, high-performance, power- and cost-efficient products. Through our vertically integrated technology and manufacturing platforms, we design, fabricate and package a broad portfolio of optical components—lasers, detectors, transmitters, receivers and modulators—for module manufacturers and systems providers, including network equipment manufacturers, who sell to communication service providers and enterprises in the Access, Enterprise/Data Center and Long Haul/Metro segments of the communications network, and for other emerging end market applications, such as defense and avionics, high performance computing, medical and security.
Network traffic continues to increase rapidly in volume, volatility and complexity, driven by unprecedented demand for bandwidth-intensive, rich content such as streaming and real-time video, the growth of online social networking and cloud-based computing services, and the proliferation of mobile devices. Optical networking is becoming the de facto transport technology due to its attractive bandwidth capacity, reach, reliability, low power consumption and network intelligence capabilities. Within optical networking, innovation at the optical component level is driving increased functionality, higher performance and cost savings. According to Cisco Systems, while optical components represent approximately 19% of the capital expenditures for 10 gigabits per second, or Gbps, systems, they represent approximately 68% of the capital expenditures for 100Gbps systems. While Ovum estimates the overall market for optical components will grow at a 13.4% compound annual growth rate, or CAGR, from $5.6 billion in 2010 to $10.5 billion by 2015, we believe there are specific market segments and geographies which are expected to meaningfully exceed that growth rate, such as the gigabit passive optical network, or GPON, system deployment in the Access segment supporting China's aggressive fiber-to-the-home rollout, and next-generation high speed 40Gbps and 100Gbps deployment in the Enterprise/Data Center and Long Haul/Metro segments.
We believe we are one of the few companies in our industry with vertically integrated technology and manufacturing platforms that span from Indium Phosphide and Silica-on-Silicon fabrication to proprietary, highly automated assembly and test facilities. Our in-house capabilities allow us to offer a dependable supply of quality optical components and modules. Our photonic integrated circuit, or PIC, and components on board, or COB, solutions incorporate greater functionality and intelligence at the component level, which enables us to serve next-generation, higher speed networks. We continue to leverage and expand upon more than 25 years of research, development and investments, including by the former optoelectronics divisions of Lucent Technologies and Bell Labs, which we obtained through our acquisition of a division of TriQuint Semiconductor, Inc. in 2005, and our broad portfolio of proprietary technologies, which form the foundation of our technical expertise and extensive know-how.
We sell our products to a global, diversified customer base that includes module manufacturers and network equipment manufacturers, who in turn sell to communication service providers
75
and enterprises, and to defense and avionics contractors. Our largest customers by revenue during 2010 include Cambridge Industries Group, Ciena Corporation, Finisar Corporation, Huawei Technologies Co., Ltd., Source Photonics, Inc. and Superxon Technology, Ltd., and our largest customer by revenue during 2010 in the defense and avionics markets is Lockheed Martin Corporation. We believe that greater than 70% of our revenue was sole-sourced in 2010, which we believe demonstrates the differentiation of our products, and gives us significant insight into our customers' product and technology roadmaps.
We believe we have an attractive financial profile, with strong top-line performance. Furthermore, our strong, collaboration design relationships with our customers, which provide us with an understanding of forward-looking customer demand profiles and percent share awards, in combination with our backlog levels provides us with a degree of short-term revenue visibility for the following quarter and also helps us manage our short-term cost structure. We have grown our revenue at a 31.3% CAGR from 2005 to 2010 and 55.4% period over period from the six months ended June 30, 2010 to the six months ended June 30, 2011. We have also experienced significant margin expansion, as our income (loss) from operations margin increased from 9.2% in the six months ended June 30, 2010 to 12.9% in the six months ended June 30, 2011. In addition, our non-GAAP adjusted income (loss) from operations margin increased from 11.6% in the six months ended June 30, 2010 to 13.9% in the six months ended June 30, 2011. Adjusted income (loss) from operations margin is not calculated in accordance with GAAP. A reconciliation of this non-GAAP measure to income (loss) from operations margin calculated and presented in accordance with GAAP is included in this prospectus in the "Management's discussion and analysis of financial condition and results of operations—Key business metrics—Use of non-GAAP financial measures." Adjusted income (loss) from operations margin should not be considered as an alternative to income (loss) from operations margin calculated and presented in accordance with GAAP. We incurred aggregate net losses of $96.1 million from 2005 to 2010.
Industry
Network traffic continues to increase rapidly in volume, volatility and complexity, driven by unprecedented demand for bandwidth-intensive, rich content such as streaming and real-time video, the growth of online social networking, cloud-based computing services and the proliferation of mobile devices. According to Cisco System's Visual Networking Index, global Internet protocol traffic is expected to grow from 20 exabytes (1 exabyte = 109 gigabytes) per month in 2010 to 80 exabytes per month in 2015, representing a 31.9% CAGR. To address this trend, communication service providers and enterprises are expanding and upgrading their existing network infrastructures. Notwithstanding their investments, network traffic growth is outpacing service provider revenue growth. As a result, communication service providers and enterprises are investing in higher-data rate, scalable and cost-effective network architectures to increase bandwidth capacity and improve profitability.
Optical networking is becoming the de facto transport technology due to its attractive bandwidth capacity, reach, reliability, low power consumption and network intelligence capabilities. Optical components and modules provide the fundamental building blocks—the creation, modulation, routing and detection of light—for the optical ecosystem, from Long Haul/Metro, Access to the Digital Home, through fiber-to-the-home, to Enterprise/Data Center. Ovum estimates the market for optical components and modules was $5.6 billion in 2010 and is forecasted to grow to $10.5 billion in 2015, representing a 13.4% CAGR. Consumer and enterprise demand for bandwidth-intensive, rich content and services is driving network build
76
outs across the ecosystem. These build outs are in turn requiring capital investment to alleviate bottlenecks across the network, which we believe is resulting in a persistent growth phenomenon across network segments and geographies and, in many cases, outpacing the growth of the overall optical networking market.
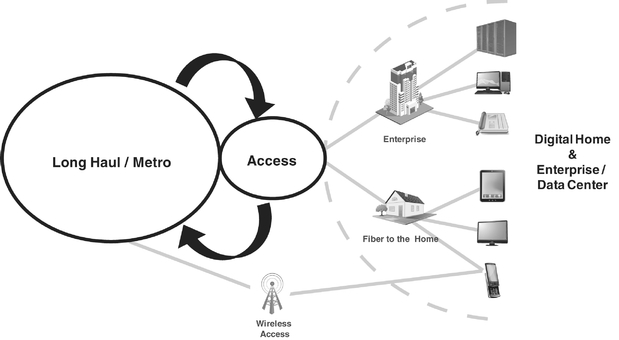
The optical component and module market consists of traditional network segments—Access, Enterprise/Data Center and Long Haul/Metro which are differentiated primarily based on transmission distance—and emerging applications in other end markets:
- •
- Access network segment. The Access segment comprises network
areas with transmission distances of less than 20 kilometers typically used to connect individual enterprise and residential customers to the network. Due to attractive bandwidth, reliability and cost
advantages, Access networks increasingly use high-speed optical fiber as a replacement for copper lines in legacy networks and as a favorable alternative to wireless access technologies in
new deployments. High-speed Access networks can support high-bandwidth content and enable bundled services, such as "quadruple play", that can include voice, video
on-demand, high-speed data and wireless offerings.
In Access networks, we believe communication service providers and enterprises are under considerable pressure to deliver emerging, next-generation applications and services at low costs as traditional voice revenues decline and subscribers of data and video services become increasingly price sensitive and less loyal. We believe network equipment manufacturers increasingly prefer to procure directly from optical component vendors to remove module intermediaries. By doing so, network equipment manufacturers are able to reduce their direct costs and potentially deliver infrastructure solutions to Access communication service providers and enterprises at lower prices.
Passive optical networks, or PONs, are currently the fastest-growing broadband Access technology, enabling 1Gbps and higher transmission speeds to the home, a 100-fold increase over legacy copper networks. Dell'Oro forecasts PON subscribers as a percentage of worldwide broadband subscribers to increase from 10.8% in 2010 to 25.5% in 2015. Communication service providers in the Asia Pacific region have been early adopters of PON technology, demonstrated by large-scale deployments in Japan and, more recently, by China's
77
aggressive fiber-to-the-home rollout, including China Telecom's announcement of their target to connect 100 million subscribers by 2015. GPON has higher data rates, enhanced security and broader multi-protocol support compared to PON. Consequently, it is expected that GPON will continue to gain market share over previous PON technologies. According to Ovum, GPON transceiver sales are projected to grow from $288.5 million in 2010 to $576.7 million in 2015, representing a 14.9% CAGR. Specifically within China, Dell'Oro estimates that GPON revenue to grow by as much as 40% year-over-year in 2011.
- •
- Enterprise/Data Center network segments. Enterprise/Data
Center Network segments provide networking capabilities to clusters of computers and servers in close proximity to each other, such as on a campus, or in an office building or data center. Fueled
primarily by server virtualization and cloud computing, server data transfer rates are doubling every 24 months with the server-to-switch connection rate moving rapidly
from 1 gigabit Ethernet, or GbE, to 10GbE. The adoption of 10GbE on server infrastructure is accelerating the migration of copper to optical fiber and the need for 40GbE and 100GbE on uplinks to the
core of the data centers. Traditionally, links of 10GbE and below relied on only one laser and one receiver per transceiver. These traditional architectures are no longer adequate for 40GbE and
100GbE, which require multi-channel (4x10GbE, 10x10GbE or 4x25GbE) architectures, comprised of multiple lasers and receivers per transceiver, to meet the faceplate density, cost and power consumption
requirements of next-generation switches. According to Ovum, 100GbE transceiver sales will increase from $51.6 million in 2010 to $712.6 million in 2015, representing a 69.1%
CAGR.
- •
- Long Haul/Metro network segments. Long Haul/Metro segments
include networks with longer distance transmission for intra-city, city-to-city and country-to-country transport. Communication service
providers have upgraded many legacy 2.5Gbps networks to 10Gbps and are accelerating deployments of next-generation networks capable of transmission at 40Gbps and 100Gbps. According to
Ovum, revenue from 40Gbps and 100Gbps Long Haul/Metro receivers is forecasted to grow from $66.0 million in 2010 to $494.8 million in 2015, representing a 49.6% CAGR. As these networks
need to handle an increasing amount of Internet protocol or packet based traffic network operators need to find efficient and scalable ways to upgrade their installed base of disparate synchronous
optical networking and synchronous digital hierarchy, Ethernet and dense wavelength division multiplexing, or DWDM, infrastructure. Next generation "packet optical" networks on the basis of 40Gbps and
100Gbps transport produce the needed capital and operational efficiencies by converging formerly disparate network architectural layers and including integrated routing, switching, reconfigurable
optical add-drop multiplexers, DWDM transport and other optical networking functionality. At next-generation higher 40Gbps and 100Gbps network speeds, we believe there will be
considerable technical challenges resulting in market and supply chain disruption. We believe network equipment manufacturers will look to procure optical components directly from vendors in order to
build their own solutions in order to successfully overcome these challenges.
A key emerging technology for next-generation networks is coherent detection, which enables ultra-long reach and efficient spectral bandwidth usage in 40Gbps and 100Gbps transmission. Coherent detection allows for improved receiver sensitivity and superior data integrity by electronically recovering signal information that is normally lost or distorted, while leveraging existing infrastructure such as fiber plants and optical amplifiers. According to Ovum, revenue from 100Gbps coherent modules will increase from $35.3 million in 2010 to $786.5 million in 2015, representing an 86.0% CAGR.
78
- •
- Other emerging end market applications. In addition to traditional telecommunications and networking markets, optical components and modules are increasingly being used in other emerging end market applications, such as defense and avionics, high performance computing, medical and security markets, all of which require high-speed, high-bandwidth data transmission, higher levels of integration and/or high performance laser/receiver solutions. For example, the defense and avionics industry is increasingly using optical solutions to reduce size, weight and power in applications such as next-generation munitions or fiber-based local area networks on aircraft. Other emerging end market applications include: highly reliable, high-power optical lasers in Fiber Optic Gyroscopes on satellites; highly reliable and efficient lasers for integration onto Silicon Photonics chips to enable exascale computing; and lasers with high power and high spectral purity characteristics for gas-sensing in security systems.
Optical network market value chain
The optical network market value chain can be broken down into four segments—components, modules, systems and carriers/providers—that provide the following types of products and services and include the following selected key players:
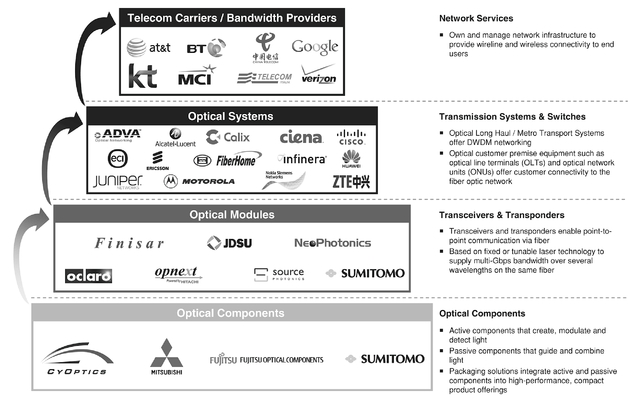
Optical components are typically incorporated into optical modules, which are assembled into systems that are purchased and installed into service provider networks. Demand for increased bandwidth capacity and pressure to control costs is driving higher levels of integration at the product level, delivering increased faceplate density, lower power dissipation and greater system functionality. This trend creates an opportunity for optical component manufacturers to deliver next-generation optical modules and optical COB solutions directly to network equipment manufacturers.
We believe that innovation at the optical component level is driving increased functionality, higher performance and cost savings in optical networking solutions. High-speed Long Haul/
79
Metro network segments, in particular at 40Gbps and 100Gbps transmission speeds, are forecast to be key areas of service provider investment in PICs, tunable lasers and coherent detectors, which are key enablers of these high-speed, long-distance networks.
Innovative optical component solutions, many of which are based on PICs, such as multi-channel 10x10Gbps, 4x25Gbps, 40Gbps/100Gbps coherent transmitters, receivers and transceivers, and tunable lasers are expected to comprise an increasing percentage of total optical system capital expenditures. For example, according to Cisco Systems, while optical components represent approximately 19% of the capital expenditures for 10Gbps systems, they represent approximately 68% of the capital expenditures for 100Gbps systems.
We believe optical module manufacturers and network equipment manufacturers face many challenges, including:
- •
- Demand for high-performance, high-speed optical
solutions. To address increasing network traffic demands, optical module manufacturers and network equipment manufacturers must offer solutions that deliver high
data transmission speed and bandwidth capacity to end customers at a cost competitive to conventional technologies. These solutions must also be interoperable with existing infrastructure, without
requiring costly wholesale infrastructure replacement.
- •
- Increasing system complexity and decreasing time to
market. Network equipment manufacturers are beginning to incorporate optical components, rather than modules, directly into their system architectures to reduce
their time to market if advanced module level technology is not available, to reduce their system cost by eliminating the module manufacturer or to enhance their products' technical performance. The
ability for network equipment manufacturers to be designed into new network architectures is critical, as early design wins and implementations provide a competitive advantage given the prohibitive
cost of redesign for communication service providers and enterprises.
- •
- Demand for reduced service provider capital investment
requirements. Communication service providers and enterprises continue to search for more economical ways to increase network capacity to accommodate the continued
growth in Internet protocol traffic. For example, by integrating DWDM optics as interfaces within routers, communication service providers and enterprises reduce the need for external
optical-electrical-optical transponder racks, cross connects and synchronous optical networking and synchronous digital hierarchy switching layers, resulting in lower up front capital expenditures due
to the need for fewer devices in the network. Furthermore, the move to a DWDM-based optical transport network provides a cost-effective, scalable, high capacity and flexible
network platform by further reducing the number and types of required network element boxes, enabling low cost deployment of 40Gbps and 100Gbps networks.
- •
- Demand for reduced service provider operating expense requirements. Communication service providers target improved operational efficiencies by converging formerly disparate network architectural layers through the migration to "packet optical" networks on the basis of 40Gbps and 100Gbps. Optical module manufacturers and network equipment manufacturers seek to reduce the power required to operate optical systems. Heat from neighboring components or high ambient temperatures degrade the functionality of laser diodes or even require the use of costly thermoelectric coolers, which limit the ability to miniaturize the optical module. The higher levels of integration, lower power requirements and lower heat dissipation of optical components enable greater faceplate density and result in ongoing operating cost savings.
80
Our solutions
We are a leading platform-based provider of core optical technologies enabling bandwidth for high-speed networks. Our solutions provide the fundamental building blocks—the creation, modulation, routing and detection of light—for optical networking, which is a high-performance, cost-effective alternative to traditional networking technologies. Facilitated by our differentiated technologies and in-house proprietary design, manufacturing, packaging and technology capabilities, we produce:
- •
- active components that create, modulate and detect light;
- •
- passive components that guide and combine light; and
- •
- packaging solutions that integrate active and passive components into high-performance, compact products.
We design, fabricate and package a broad portfolio of optical components, including lasers, detectors, transmitters, receivers, and modulators:
| Product type |
Components |
Markets |
||
|---|---|---|---|---|
| Devices | • Die-level lasers and detectors |
Access, Enterprise/Data Center, Long-Haul/Metro | ||
| Large Form Factor Components | • For integration into Transponders or onto linecards for
transmission speeds up to 10Gbps |
Access, Long-Haul/Metro | ||
| Small Form Factor Components | • For integration into pluggable Transceivers for
transmission speeds up to 10Gbps |
Enterprise/Data Center, Long-Haul/Metro | ||
| Components on Board (COB) | • For integration into Customer Premise or Central Office
Equipment for fiber-to-the-home and custom designs |
Access, Emerging end market applications | ||
| PIC-Based Components and Next-generation Modules (Transceivers) | • Integrated coherent receivers for 40Gbps and 100Gbps
|
Enterprise/Data Center, Long-Haul/Metro | ||
| Specialty Components | • Custom packaged lasers and detectors
|
Emerging end market applications | ||
Key benefits of our solutions include:
- •
- High levels of photonic integration. Our in-house Indium Phosphide and Silica-on-Silicon technology platforms and diverse toolbox of device elements enable the efficient design and the scalable, high volume fabrication of a broad variety of PICs. As a result, we are able to achieve high levels of integration either by single chip, or "monolithic," integration in a single Indium Phosphide chip, or by multi-chip, or "hybrid," assemblies using both Indium Phosphide and Silica-on-Silicon, for which we leverage our proprietary, highly automated, sub-micron precision assembly platform. This high level of integration enables us to provide solutions that have significantly smaller size, higher reliability and lower power consumption as compared to traditional discrete components.
81
- •
- High bit rate products. Our high bit rate bidirectional
optical subassembly, or BOSA, components are used in next-generation Access networks (10Gbps or higher). Our PIC-based components and next-generation modules are
used for communication switches in high capacity Enterprise/Data Center networks (40Gbps or higher) and for coherent Long Haul/Metro networks (40Gbps or higher). These products enable communication
service providers and enterprises to deliver bandwidth-intensive rich content and services over significantly longer distances than existing solutions.
- •
- Cost-efficient solutions. Our highly automated
chip fabrication operations and packaging operations enable us to manufacture our products at high yields and low labor cost, while the re-usability, re-configurability and
scalability of our assembly and test equipment reduces our on-going capital needs. Our high levels of automation also enable significant consistency and repeatability throughout the entire
manufacturing process, resulting in high performance and highly reliable products. Our flexible and versatile combination of monolithic and hybrid integration technologies, together with our
sub-micron precision alignment capability, enables us to create highly integrated, application-optimized and miniaturized solutions, which reduces the total cost of ownership for our
customers. We believe these operational efficiencies enable us to deliver products that are at a lower or competitive cost relative to our competitors while maintaining a differentiated product
portfolio.
- •
- Tailored solutions. We leverage our technology platforms and
array of device and packaging technologies across all market segments to customize a broad range of products. Our in-house hybrid and monolithic photonic integration techniques, together
with our highly automated assembly and test manufacturing capabilities, and cooled and uncooled Indium Phosphide laser fabrication capabilities, allows us to tailor these products to each segment of
the communications network. By reusing proprietary technologies, we can often design new devices more rapidly and at lower cost.
- •
- Consistent quality and reliability. Our automated manufacturing and control systems that we have built into our device fabrication, packaging and testing processes enable us to deliver products with stable performance, high quality and a high level of reliability. To date, we have had less than 1 reported laser or detector chip failure in time (FIT), a measure of failure rate in 109 service hours (e.g. 1 FIT = 1 failure in 109 service hours), over an estimated 350 billion service hours in the field since our inception.
Competitive strengths
We believe our key competitive strengths include the following:
- •
- Strong institutional knowledge base and track record of technology
innovation. We develop industry-leading optical components, including PIC-based components, such as multi-channel TOSA/ROSA and coherent receivers, as
well as next-generation modules by leveraging and expanding upon more than 25 years of investments, including those made by the former optoelectronics divisions of Lucent
Technologies and Bell Labs, which we obtained through our acquisition of a division of TriQuint Semiconductor, Inc. in 2005, and our broad portfolio of proprietary technologies, which form the
foundation of our technical expertise and extensive industry know-how. We believe some of our innovations were among the first commercially available in the industry,
including:
- •
- 10Gbps TOSA to enable pluggable transceivers (2003);
82
- •
- the lowest power consumption cooled 2.5Gbps small form factor laser transmitter for integration into pluggable
transceivers (2005);
- •
- 40Gbps/100Gbps coherent receiver with full integration of 90 degree hybrids, detectors, trans-impedance amplifiers and
polarization splitters (2011); and
- •
- 10Gbps TOSA for DWDM in small form factor pluggable plus, or SFP+, transceivers (2011).
- •
- Greater intelligence at the component level. We are well
positioned to capture a higher proportion of the bill of materials of the optical value chain as the industry migrates to higher speed networks. According to Cisco Systems, optical components
represent approximately 19% of the capital expenditures in 10Gbps optical systems, but approximately 68% of the capital expenditures in 100Gbps optical systems, which we believe is a result of
increased system-level consolidation and integration and hence a greater opportunity for differentiation. We are well positioned to capitalize on this industry trend with our PIC and COB solutions,
which provide our customers with significant performance and cost advantages due to the need for fewer components.
- •
- Vertical integration. We believe we are one of the few
companies in our industry with vertically integrated technology and manufacturing platforms that span from Indium Phosphide and Silica-on-Silicon fabrication to proprietary,
highly automated assembly and test facilities. Our comprehensive in-house capabilities allow us to offer our customers a dependable supply of quality optical components and modules, giving
us significant time-to-market, time-to-volume and cost advantages as well as the ability to respond more quickly to changing market and customer
requirements. As a result of the complexity of the design and manufacturing disciplines involved in the creation of our products, we believe it would be difficult for others to replicate the platforms
we have developed.
- •
- Industry-leading market position. We believe we are a leader
in several of the market segments that we serve. For example, we believe that based on Ovum's 2010 market data and our shipment history, our fiber-to-the-home, BOSA products were deployed in 49.5% of
all GPON and Ethernet passive optical network, optical line terminals and 47.3% of all GPON optical network units sold worldwide in 2010. Furthermore, we believe that based on Ovum's
2010 market data and our shipment history, our 2.5Gbps to 10Gbps TOSAs and devices for high-performance, long-reach and temperature controlled applications using a
thermo-electric cooler were deployed in approximately 35.8% of all 2.5 gigabit small form factor pluggable, 10 gigabit form factor pluggable, or XFP, and SFP+ optical transceivers
worldwide. In addition to our strong presence across network segments, we also believe that we have an entrenched position within our existing customer base. For example, we believe that greater than
70% of our revenue was sole-sourced in 2010, which we believe demonstrates the differentiation of our products and gives us significant insight into our customers' product and technology
roadmaps.
- •
- Diversity across network segments, products and customers. Our revenues are diversified across network segments, with approximately 51.8% of our 2010 revenue from Long Haul/Metro, 37.4% from Access and 8.8% from Enterprise/Data Center, allowing us to capitalize on growth in capital investment cycles across the communications network. Our global, diversified customer base includes module manufacturers and network equipment manufacturers who sell to telecom carriers, bandwidth providers and defense and avionics contractors, such as Cambridge Industries Group, Ciena Corporation, Finisar Corporation, Huawei Technologies Co., Ltd., Lockheed Martin Corporation, Source Photonics, Inc. and Superxon Technology, Ltd. Furthermore, our products are deployed in a number of major
83
communication service provider networks. Our revenue is also well diversified by product, with more than 2,500 products across various product types.
- •
- Experienced management team with strong execution track-record. Most of our executive officers have more than 15 years of relevant industry experience, with the substantial majority having more than 25 years of relevant experience. Members of our management team and board of directors also played integral roles in leading Lucent Technologies' optoelectronic components business in 2000. Our key managers have worked side by side in large and small companies and have a proven track record of strong top-line revenue performance throughout varied market cycles. We grew our revenues from $27.8 million in 2005 to $108.3 million in 2010, representing a 31.3% CAGR. We have acquired and successfully integrated five businesses since 2003. Our management is consistently recognized for its visionary leadership and often called upon to present at industry conferences and serve on technical committees that establish industry standards.
Our strategy
Our goal is to become the leading provider of high-performance optical technologies that enable the rapid growth in high-speed optical networking communications. Key elements of our strategy are as follows:
- •
- Extend leadership in fiber-to-the-home. We intend to maintain
our strong position in our core fiber-to-the-home markets and extend our market share in GPON by winning new customers and introducing next generation products. In addition, we plan to take
advantage of market disruption and product cycle transitions by providing an alternative to traditional transceiver vendors through our BOSA product offerings and by developing new products to address
emerging fiber-to-the-home applications and technologies, including the implementation of 10 gigabit Ethernet passive optical networks and wavelength division multiplexing passive optical
networks.
- •
- Capture an increasing share of the Enterprise/Data Center and Long-Haul/Metro market
segments. We intend to leverage our technology leadership, Indium Phosphide and Silica-on-Silicon integration and high-performance packaging
to develop multi-channel PICs in support of 40Gbps and 100Gbps Ethernet TOSA and ROSA receivers and miniaturized tunable laser for coherent applications and tunable 10Gbps TOSA products for both
module manufacturers and network equipment manufacturers. Our goal is to become a leader in these market segments through a combination of high performance, on-time delivery and low manufacturing
cost.
- •
- Continue to grow our defense and avionics business and other emerging end market applications. We intend to continue to leverage our differentiated technologies and U.S.-based design and manufacturing operations to address the growing demand for optical components and modules in the Intelligence, Surveillance and Reconnaissance and munitions industries. We will continue to work with the major US-based defense prime contractors and look to secure agency development contracts. We also intend to grow our presence in other emerging end market applications such as high-performance computing, medical and security.
84
- •
- Continue gross margin expansion. We intend to continue our
gross margin improvement through increased scale across our manufacturing infrastructure and continued introduction of higher performance products with greater component-level intelligence and
integrated functionality to module manufacturers and network equipment manufacturers.
- •
- Selectively pursue complementary acquisitions. We intend to continue to selectively pursue acquisitions that complement our strengths and help us execute our strategies. Our acquisition strategy is designed to accelerate our revenue growth, increase our customer penetration, expand our technology and manufacturing platforms and grow our addressable market. We believe our demonstrated experience with successful integration of past acquisitions provides us an advantage in assessing and integrating companies we may pursue in the future.
Technology
We design and manufacture optical components and modules on the basis of Indium Phosphide and Silica-on-Silicon technologies. Our design and fabrication expertise is based on more than 25 years of investments, including those made by the former optoelectronics divisions of Lucent Technologies and Bell Labs, which we obtained through our acquisition of a division of TriQuint Semiconductor, Inc. in 2005, and our broad portfolio of proprietary technologies, which form the foundation of our technical expertise and extensive industry know-how. Many members of our team are considered innovators in the Indium Phosphide semiconductor photonics market. While most of our competitors in recent years have outsourced their manufacturing, in whole or in part, we believe we are one of the few companies in our industry with vertically integrated technology and manufacturing platforms that span from Indium Phosphide and Silica-on-Silicon Planar Lightguide Circuit, or PLC, chip fabrication to proprietary, highly automated assembly and test facilities. Our in-house capabilities allow us to offer a dependable supply of quality optical components and modules.
We control all phases of the development and manufacturing process in-house and leverage a comprehensive library of proprietary and commercially available design tools to accurately model and optimize the optical, electrical, thermal and mechanical properties prior to fabricating our devices and packages. The increasing complexity of optical devices makes accurate performance modeling necessary to reduce the number of design iterations thereby reducing our customers' time to market and enabling them to make more efficient engineering investments.
We also have developed extensive expertise in the design and large scale fabrication of PICs, and we believe we are one of the few companies with all the key technologies in-house that enable the efficient design and the scalable, reliable, high volume fabrication of monolithic and hybrid PICs. In monolithic or single chip PICs, we leverage our advanced design, process know-how and epitaxial growth techniques to integrate multiple devices and/or functions into a single Indium Phosphide chip. In hybrid PICs, we utilize our highly automated sub-micron precision assembly platform to integrate multi-chip optical devices that are coupled using optical interconnects into a single package.
85
The following technologies and capabilities are key to our business:
- •
- Indium Phosphide fabrication. We have one of the leading
Indium Phosphide fabrication facilities, or Indium Phosphide fabs, in the world with comprehensive, in-house manufacturing from epitaxial growth to wafer and chip fabrication. Optoelectronic design
and manufacturing requires a deep understanding of complex material and their interactions, device structures and the operation of associated complex manufacturing processes and equipment to build the
needed layer structure with atomic-level precision. At the core of our business lies our laser and photo-detector technology, which allows us to efficiently design products that meet or exceed the
power, size, temperature performance and reliability requirements of our customers. In the development and manufacturing of Indium Phosphide based lasers and photo-detectors, we utilize accumulated
knowledge in areas such as semiconductor epitaxial growth, semiconductor material systems, quantum well design and band gap engineering, to achieve high speed performance, wide operating temperature
ranges and precise wavelength control for DWDM, resulting in high manufacturing yield and throughput, and reduced cycle time. In our monolithic PICs, we use a combination of highly flexible,
multi-stage epitaxial growth via metal-organic chemical vapor deposition integration technologies, such as Selective Area Growth, and low loss coupling waveguide interconnects between active and
passive sections, which are the key building blocks enabling the large scale integration of multiple active and passive features in Indium Phosphide on the same chip.
- •
- Silica-on-Silicon PLC
fabrication. Many of our PIC products rely on our Silica-on-Silicon PLC technology. We have developed a broad toolbox of device
elements that provide a variety of optical functions on a single silicon chip. The planar processing enables scalable, high volume production along with high performance and reliability. We use bulk
and thin film capabilities to manufacture our own glass materials on the silicon wafer substrate. By intentionally incorporating impurities, such as Germanium, Boron or Phosphorus, into the Silica
waveguides for the purpose of modifying its optical properties in a controlled manner, a process known as "doping", we can create material structures for lowest optical power loss, highest levels of
integration as well as material that provides optical gain or amplification. In order to achieve a specific functionality, we can vary these doping levels precisely across the wafer and are able to
integrate different elements into optical circuits on a single chip. We routinely utilize micron and submicron scale structures of multiple precision-doped
Silica-on-Silicon PLCs to manufacture and integrate into optical circuits design elements and building blocks for low loss coupling between different waveguides,
wavelength division multiplexer, couplers, splitters, turning mirrors to couple light out of the PLC chip into a photo-detector, DWDM and coarse wavelength division multiplexing, or CWDM,
arrayed waveguide gratings multiplexer and de-multiplexer.
- •
- Assembly and test. We have accumulated a significant knowledge base in laser packaging, and in mechanical, optical, thermal and high frequency design. Laser diodes and photo-detectors are particularly sensitive to external forces, electrostatic fields and chemical environments, so they are typically housed in hermetically sealed packages. The laser diodes and photo-detectors are typically placed on special silicon or ceramic submounts before being packaged into the mechanical housing together with certain electronics and other optical and mechanical elements. Substantial investments have been made since 1995 in our in-house designed and built packaging equipment platforms and we believe that our assembly and
86
test operations have the highest level of versatility and automation in our industry. We use pick-and-place robotics to mount the various optical, electrical and thermal elements in packages that support applications from low cost to high reliability and power, housing micro-optics, hybrid and monolithically integrated devices. The key differentiation of our automation equipment is the capability to achieve sub-micron alignment precision between optical elements within the mechanical housing guaranteeing low optical power loss for hybrid or multi-chip integration. We supplement our internal assembly and test capabilities for higher end, temperature controlled planar packages with the use of contract manufacturers for assembling components in the cylindrical style, or TO-can packages.
Products
We are a leading platform-based provider of core optical technologies enabling bandwidth for high-speed networks. We have one of the most comprehensive optical component portfolios with more than 195 active datasheets, which we sell to most of the leading transceiver vendors and network equipment manufacturers addressing the needs of Access, Enterprise/Data Center, and Long Haul/Metro networks and other emerging end market applications. Our product portfolio primarily consists of chips, subcomponents and components for integration into optical transceivers or transponders or onto linecards. Our product portfolio includes a broad range of optical components—lasers, detectors, transmitters, receivers and modulators—that vary by data rate, level of integration and form factor and are distinguishable by their strong performance across several technical parameters, such as reliability, temperature range, power consumption, wavelength stability or receiver sensitivity.
Our laser diode and transmit optical subassembly, or TOSA, products include tunable lasers, Fabry Perot lasers, directly modulated lasers, or DMLs, at data rates of up to 25Gbps and electro-absorptive modulated, or EAM, lasers at data rates of up to 40Gbps with signal wavelengths between 1270nm and 1600nm. We offer high performance avalanche photo-detectors, and receivers for data rates of up to 10Gbps and PIN photo-detector and receivers for data rates of up to 25Gbps. Our 40Gbps and 100Gbps coherent receivers address the emerging end market for the coherent polarization multiplexed quadrature phase shift keying transmission standard.
In some of our newer products we leverage our proprietary Terabit PICs, or TERAPICSTM, platform. In TERAPICSTM we combine monolithic and hybrid integration to create optical networking solutions for 40Gbps/100Gbps and beyond. Our active laser or detector arrays are monolithically integrated into Indium Phosphide and are mounted on or interconnected to Silica-on-Silicon based PLCs, which encompass passive optical features and functions such as an optical multiplexer or demultiplexer. In addition to our Indium Phosphide and Silica-on-Silicon device technology we leverage our highly automated assembly equipment enabling the very precise and accurate sub-micron mechanical alignment of optical waveguides between these active and passive functional elements achieving highest performance, highest yields and lowest cost. We believe that TERAPICSTM is an important technology platform for addressing some of the key challenges of network equipment manufacturers, namely reduction of power consumption, size and cost. The first products leveraging this platform are the 40Gbps/100Gbps coherent receivers, 40GbE (4x10GbE) and 10x10Gbps DWDM TOSA/ROSA (transmit and receive optical subassembly).
87
The following is a summary of our products in each of our market segments:
Access network segment. We offer one of the broadest portfolios of optical devices and components for the Access network segment serving the optical networking unit at the customer premises and the optical line terminal in the central office.
| Product type |
Products & product description |
Product form factor |
||
|---|---|---|---|---|
Devices |
Chips and TO-can For integration into TO-can or TOSA/ROSA, BOSA (bidirectional optical subassembly) • 2.5Gbps DML • 10Gbps DML • 10Gbps EAM laser • 2.5Gbps and 10Gbps avalanche photo-detectors |

|
||
Components on Board (COB) |
GPON Bidirectional Optical Sub-Assembly (BOSA) |
|
||
Large Form Factor Components |
40Gbps Laser For integration into 300pin Transponder, connecting routers with DWDM Transponder cards • cooled EAM laser for 2km transmission |

|
||

Enterprise/Data Center network segments. We offer a broad portfolio of devices and components for the Enterprise/Data Center market.
| Product type |
Products & product description |
Product form factor |
||
|---|---|---|---|---|
Devices |
Chips For integration into TOSA/ROSA |
|||
• 25Gbps DML chips on carrier on local area network-WDM grid • 40Gbps EAM laser chip on carrier for short reach (2km) application • 25Gbps PIN detectors |
|
|||
Small Form Factor Components |
TOSA For integration into SFP+ or 100G CFP Transceiver • 10Gbps FP • 10Gbps DML • 10Gbps CWDM DML for 40GbE |

|
||
88
| Product type |
Products & product description |
Product form factor |
||
|---|---|---|---|---|
PIC-Based Components and Next-generation Modules (Transceivers) |
40GbE TOSA/ROSA (based on TERAPICSTM platform) For integration into QSFP Transceiver |

|
||
• TOSA integrates 4x10Gbps CWDM DMLs with Optical Multiplexer |
||||
• ROSA integrates 4x10Gbps PIN photo-detectors with Optical Demultiplexer |
||||
• 10km reach |
||||
Long Haul/Metro network segments. Our portfolio for the Long Haul/Metro market includes differentiated products such as tunable lasers with narrow linewidth for coherent applications, one of the most compact integrated coherent receivers for 40Gbps and 100Gbps, DWDM TOSAs with low power dissipation for integration into SFP+ transceivers and miniaturized 10x10G TOSA/ROSA and CFP modules.
| Product type |
Products & product description |
Product form factor |
||
|---|---|---|---|---|
Devices |
Chips and TO-can For integration into TO-can or TOSA/ROSA |
|||
| • 2.5Gbps DWDM/CWDM DMLs | ||||
| • 10Gbps DWDM EAM lasers | ||||
| • 2.5Gbps and 10Gbps PIN and avalanche photo-detector chip or chip-on-carrier | ||||
| • 2.5Gbps 1550nm time division multiplexing or CWDM DML (up to 80km) integrated into a cylindrical TO package | ||||
Devices |
Optical Sub-Assembly For integration into TOSA • Assembly of 10Gbps EAM laser, lens and back facet monitor photo- detector on Silicon Optical Carrier |

|
||
| • 40km, 80km, time division multiplexing (TDM) and DWDM | ||||
Large Form Factor Components |
Tunable Laser, Integrated Tunable Laser Assembly (ITLA) For integration into 300pin Transponders • Full C-Band tunability • High Output power 16dBm • Narrow Linewidth of 100kHz |

|
||
Small Form Factor Components |
Transmit Optical Subassembly (TOSA), Receive Optical Subassembly (ROSA) For integration into 10G Form Factor Pluggable (XFP), Standard Form Factor Pluggable Plus (SFP+) and Standard Form Factor Pluggable (SFP) transceivers, compatible with 10G/s Miniature Device (XMD) Multisource agreement |

|
||
| • 2.5Gbps DML TOSA for up to 200km DWDM and CWDM applications | ||||
| • 10Gbps DML TOSA, CWDM, 1270nm-1610nm | ||||
89
| Product type |
Products & product description |
Product form factor |
||
|---|---|---|---|---|
| • 10Gbps EAM laser TOSA, up to 80km, time division multiplexing, CWDM and DWDM, standard and extended temperature (-40 to 90 degrees Celsius) | ||||
| • 10Gbps EAM laser TOSA, up to 80km, time division multiplexing, CWDM and DWDM for lowest power consumption enabling DWDM in SFP+ | ||||
| • 10Gbps high sensitivity avalanche photo-detectors | ||||
PIC-Based Components and Next-generation Modules (Transceivers) |
40G/100G Integrated Coherent Receiver (based on TERAPICSTM platform) For integration into 300pin Transponders and onto linecards • Integrating polarization splitters, coherent mixers with photo-detectors and Trans-Impedance Amplifier (TIA) Ion Chromatography |

|
||
| • Compact package adhering to the Optical Internetworking Form Implementation Agreement | ||||
PIC-Based Components and Next-generation Modules (Transceivers) |
10x10Gbps TOSA/ROSA (based on TERAPICSTM platform) For integration into CFP Transceiver • TOSA integrates ten channel DWDM 10Gbps EAM laser arrays with Optical Multiplexer |

|
||
| • ROSA integrates 10 10Gbps PIN/avalanche photo-detectors with Optical Demultiplexer | ||||
| • 100GHz channel spacing | ||||
| • 65km reach | ||||
| • 40 channels in C-Band to support 40x10Gbps or 4x100Gbps | ||||
PIC-Based Components and Next-generation Modules (Transceivers) |
10x10Gbps CFP Module (based on TERAPICSTM platform) For integration into Datacom and Telecom switches and routers • Hot pluggable module |

|
||
| • Integrates 10 Transmit and 10 Receive channels each operating at 10.3Gbps | ||||
| • 100GHz channel spacing | ||||
| • 65km reach | ||||
| • 4 variants covering the C-Band to support 40x10Gbps or 4x100Gbps | ||||
Emerging end market applications. We design and manufacture tailored products leveraging our Indium Phosphide, Silica-on-Silicon PLC and automated packaging capabilities for a variety of emerging end market applications, such as the defense and avionics, high performance computing, medical and security markets.
Customer support
We offer our customers a range of support offerings, including on-site product training, application support, product warranties and around the clock multi-level technical support. Our customer support is provided by our employees, and we believe that providing ongoing support is critical to successful long-term relationships with, and follow-on sales to, our customers and partners. We are committed to providing our customers and partners with the highest levels of support.
90
Marketing and sales
We market and sell our products primarily through our direct sales force, supported by marketing, application engineering and product management personnel. We also use distribution or support partners to enter new markets or when requested by a potential customer. Our sales team has significant previous experience with the buying process and sales cycles typical of high-value technology products. We expect to continue to add sales, marketing, application engineering and product management support employees as we grow our business.
The sales process for our products entails substantial collaborations with prospective customers, analyzing their existing technology portfolio and future product roadmap and identifying how they can utilize our tailored-manufacturing, technology and product capabilities. As part of the sales cycle, our customers perform qualification tests and field trials of our products before making a purchasing decision. Upon successful completion, the customer generally accepts the products and may continue with commercial deployment of additional products. We believe that the lengthy, multi-stage nature of the sales cycle in the optical networking industry, from initial contact with a customer through the signing of a purchase agreement, fosters long-term customer partnerships.
Direct sales force. Our sales team sells directly to customers worldwide with strong development and factory support. Our direct sales teams are based in the United States, China and Taiwan.
Indirect sales force. We employ business consultants, resale partners and sales agents to assist in our sales efforts. We work with channel partners to assist our customers in the design and integration of our products into modules and line cards and have entered into distribution and resale agreements to facilitate the sale of products in certain international markets. We maintain an indirect sales presence in many geographies, including the United States, Canada, Brazil, Europe, China, Japan, Korea, Singapore and India.
Marketing, application engineering and product management. Our product management and application engineering team is responsible for defining the new product features and product development roadmaps. They also support our sales efforts with product and application engineering expertise. Our marketing team works to create demand for our products by communicating our value proposition and differentiation through direct customer interaction, including product announcements, tradeshows, industry events and other marketing channels.
Research and development
Our research and development team consists of engineers with optoelectronics expertise in Indium Phosphide and Silica-on-Silicon optical device design, optical, mechanical, thermal and electrical package design, firmware development and module design. We have a rigorous product development process, which includes sampling and engineering verification, design verification testing and volume production verification. In order for a product to move to the next step in the process, it must pass through a series of checkpoints to verify both technical and commercial performance. For example, our research and development activities incorporate design for manufacturing principles to help ensure the high-volume and cost-efficient manufacturability of our products, which are verified at each checkpoint.
91
We have dedicated product development and product engineering teams in Breinigsville, Pennsylvania, South Plainfield, New Jersey, Matamoros, Mexico and Taipei, Taiwan. These teams conduct research, product roadmap definitions, new product development, manufacturing and process engineering, quality control and continuous improvement and cost reduction relating to chip fabrication or package assembly and test.
Research and development expenses were $12.0 million, $19.5 million and $19.0 million in 2010, 2009 and 2008, respectively, and $7.3 million for the six months ended June 30, 2011. Our research and development expenses decreased substantially from 2009 to 2010 due to our dissolution of PGT.
Manufacturing
We have invested significant time and capital to develop and improve the manufacturing process that we use to produce and package our products. This includes significant investments in personnel and the facilities to manufacture and package our products in Breinigsville, Pennsylvania, South Plainfield, New Jersey and Matamoros, Mexico. We also have invested in automating our manufacturing process and in training, maintaining and enhancing the quality of our manufacturing workforce. Our manufacturing processes have been developed over more than 25 years of research, development and investments, including those made by the former optoelectronics divisions of Lucent Technologies and Bell Labs, which we obtained through our acquisition of a division of TriQuint Semiconductor, Inc. in 2005, and are protected by our trade secrets, technical expertise and extensive industry know-how. There are several important aspects of our manufacturing platforms:
- •
- Vertical integration for active and passive devices. We are
vertically integrated with laser and detector device design, device fabrication and final assembly and test of transmitter and receiver packages. In the design and manufacturing process we use our
accumulated knowledge in areas such as Indium Phosphide and Silica-on-Silicon PLC materials and epitaxial growth, wafer processing and packaging automation. We believe
that the combination of our vertically integrated technology and manufacturing platforms and our know-how and expertise enable us to control and continuously innovate at all phases of the
development and manufacturing process and to offer our customers several product benefits, including better and more reliable performance, continuity and quality of supply, higher data rates, lower
cost, smaller form factor, lower power consumption, greater functionality and shorter time to market.
- •
- Comprehensive in-house operations. Our Indium Phosphide cleanroom fabrication operations are comprehensive, ranging from epitaxial growth to wafer and chip processing. Our wafer and chip fab is one of the most highly automated lines of its kind utilizing both commercially available and in-house built proprietary tools. Our broad fabrication competencies include a variety of processes by which we can develop custom, high-performance, high-quality products at high yields. Our core competencies include the precise control of the epitaxial growth parameters, selective area growth and re-growth, low loss coupling waveguide interconnects and advanced device characterization techniques. Moreover, our Indium Phosphide-based laser transmitter and receiver device product development teams are co-located with our fabrication operations in Breinigsville, Pennsylvania. The proximity, alignment and close interaction between our experienced product development teams and our Indium Phosphide fabrication operations enable us to
92
rapidly
develop, test and deliver devices with increasing functionality tailored to our customers' needs in a timely, cost-efficient manner.
We
have comprehensive Silica-on-Silicon PLC fabrication operations in South Plainfield, New Jersey, where we do turn-key cleanroom fabrication from bulk or
thin film deposition to wafer and chip fabrication. Our core competencies are in the integration of waveguide materials with different optical properties on the same chip for optimized performance
with the smallest chip size. We offer our customers not only monolithic integration of active and passive components in Indium Phosphide but also hybrid integration of Indium Phosphide with
Silica-on-Silicon PLCs, thereby increasing the range of integration versus performance options.
Our high volume automated component assembly and test operations for planar style packages are located in Matamoros, Mexico, addressing our commercial products, and in Breinigsville, PA for prototyping and our defense and avionics products. By leveraging proprietary, in-house designed and built pick and place robotics our assembly and test line is one of the most automated lines of its kind in the industry. In addition to the level of automation we provide, we also believe that our sub-micron alignment capability between optical elements is a key differentiator the enables low coupling loss for hybrid or multi-chip photonic integration. This represents a considerable investment that enables us to accelerate the volume production of highly integrated, complex component packages. The combination of our agile manufacturing operations and design competencies enable us to deliver a wider range of single and multi-chip components and packages tailored to our customers' specific needs in a timely, cost-efficient manner.
- •
- Decreased time to market. We believe that our extensive
know-how and in-house control of the entire optical component manufacturing process enables us to respond more quickly to changing market and customer requirements and to
accelerate the market introduction of new products by achieving best in class manufacturing yields and performance consistency, resulting in reduced manufacturing costs that drive market adoption and
penetration.
By using common, high volume, well characterized and well controlled building blocks, or optical submounts, across the device fabrication and package assembly process, we are able to reduce the development time with fewer design iterations for new product introductions. For example, our management team pioneered the use of such building blocks in optical packaging dating back to 1995, when we introduced the Optical Subassembly concept, which still provides a common platform across all laser families.
Our broad portfolio of Indium Phosphide active laser and detector devices, as well as passive devices in Silica-on-Silicon PLCs enables us to perform single chip or multi-chip integration for a number of different application optimized solutions and thereby deliver highly integrated PICs to our customers in a relatively short timeframe. The co-location of our development and manufacturing teams helps to shorten the time to market and achieve or exceed manufacturing cost and quantity targets.
Finally, the versatility and scalability of our automated assembly and test equipment enables the manufacturing of a broad range of package assemblies on the same equipment platforms and allows a fast ramp to volume. The equipment's re-usability and re-configurability for different manufacturing needs enables us to address changing market requirements quickly and reduces our capital investment needs.
93
- •
- High quality standards. We have stringent quality control and management procedures in place for the entire design and manufacturing process from device to package. We follow established introduction processes for new products to ensure product reliability and manufacturability, including our own in-house quality assurance surveillance procedures and industry-standard quality and testing requirements. Our manufacturing facilities are certified to the ISO 9001:2000 standard. We employ a custom database that allows us to automatically track the complete history of a manufactured part across our entire manufacturing operation, from the time the raw materials arrive (i.e., piece part lot information) to the time it ships to our customer (including assembly and test data).
We use numerous raw materials in our manufacturing processes that are generally available from multiple suppliers.
Backlog
Sales of our products generally are made pursuant to purchase orders, often with short lead times. These purchase orders are typically made without deposits and are often subject to revision or cancellation. The quantities actually purchased by our customers, as well as the shipment schedules, are frequently revised to reflect changes in our customers' needs and in our supply of products. Because of the possibility of changes in delivery or acceptance schedules, cancellations, modifications or price reductions with limited or no penalties, we do not believe that backlog is a reliable indicator of our future revenue and do not rely on backlog to manage our business or evaluate our performance. Changes in the amount of our backlog do not necessarily reflect a corresponding change in the level of actual or potential sales. We define backlog to be the total value of sales orders that have been placed by our customers for products that have not yet been delivered. As of June 30, 2011, our backlog was $59.2 million compared to a backlog of $31.2 million as of June 30, 2010.
Intellectual property
We have built an extensive intellectual property portfolio both as a core part of our internal research and development and technical strategies and through our strategic acquisitions, which were driven in part by the acquisition of intellectual property assets. Our intellectual property portfolio extends throughout our vertically integrated operations, from materials, design, integration and wafer fabrication to module and subsystem assembly and test.
Our success as a company depends in part upon our ability to obtain and maintain proprietary protections for our technology and intellectual property and prevent others from infringing these proprietary rights. To accomplish this objective, we rely on a combination of intellectual property rights, including patent, trademark, trade secret, and unfair competition laws, as well as license agreements and other contractual protections. Substantially all of our products include some form of intellectual property that we own or license. We have and will file patent applications to protect our proprietary information, and will pursue such applications, as well as applications for registrations for other intellectual property rights, as applicable. Our patent portfolio covers a broad range of technologies and capabilities, including Indium Phosphide and Silica-on-Silicon device design and manufacturing, DWDM technology and optical package design and manufacturing. Many of our patents are distinct designs or methods related to Photonic Integration, including PIC-specific laser designs, monolithic integration of active and passive device functions in Indium Phosphide, hybrid integration of active and passive functions
94
and hybrid electronics—optical integration and packaging. We have 32 issued patents in the United States. We have not sought patent protection outside of the United States. Our patents will expire between 2020 and 2030.
We also seek to protect our intellectual property rights by having our employees and independent consultants enter into a confidentiality and inventions assignment agreements when they join us. Additionally, we enter into non-disclosure agreements with other third parties who may have access to our proprietary technologies and information.
In addition, we are applying to register the trademark "CyOptics" in the United States and selected other international jurisdictions.
Customers
We have a global customer base that includes most of the leading module manufacturers and network equipment manufacturers that sell into the communications network markets and other emerging end market segments, such as defense and avionics. We sell our products directly to network equipment manufacturers and indirectly to network equipment manufacturers through optical module manufacturers, optical design manufacturers or sub-systems providers.
We collaborate closely with our customers throughout design cycles that often last several years and entail analyzing their existing technology portfolio and future product roadmap and mapping them to our tailored manufacturing, technology and product capabilities. As part of the design cycle, our customers also perform extensive qualification tests and field trials of our products before making a purchasing decision. Due to the lengthy, multi-stage nature of the design cycles and as our technology becomes embedded into our customers' systems or modules, we are able to develop long-term relationships with them. In instances where commercial solutions are not meeting customer requirements or are not available, especially for next generation optical networking and for specialized market segments, we have and will continue to establish very strong customer collaborations through development contracts. In the manufacturing phase, our customers then purchase from us directly or, in many cases, indirectly through their designated contract manufacturers.
During the year ended December 31, 2010, we sold our products to more than 180 customers. Sales to customers in Asia accounted for 76.3%, 70.7% and 62.1% of our total revenue in the years ended December 2010, 2009 and 2008, respectively. Historically, we believe our customers have increasingly located their manufacturing operations in Asia. Many of our customers also maintain design teams in North America and Europe and in 2010, 18.9% of our new design wins were added outside of Asia. Although a large percentage of our sales is made to customers in Asia, we believe that a significant number of the systems and modules designed by these customers and incorporating our products are then sold to end users outside Asia.
The number of leading module manufacturers and network equipment manufacturers is fairly concentrated, and we currently rely, and expect to continue to rely, on this group of customers for more than 50% of our revenue. In the years ended December 2010, 2009 and 2008, our ten largest customers accounted for 61.9%, 60.3% and 61.3%, respectively, of our total revenue. In 2010, our largest customer, Finisar, accounted for 15.3% of our revenue and no other customer accounted for more than 10.0% of sales during this period.
95
Competition
The market for optical components and modules is highly competitive. While we believe that no company competes against us in all of our product areas, our competitors range from large international companies offering a wide range of products to smaller companies operating in niche markets. We believe the principal competitive factors in this market are:
- •
- ability to meet customers' specific requirements;
- •
- price to performance characteristics;
- •
- time-to-market and time-to-volume production;
- •
- ability to design and consistently manufacture products in high volume and high quality;
- •
- ability to meet customer lead time demands;
- •
- depth of relationships with and proximity to key customers globally;
- •
- breadth of product solutions; and
- •
- financial stability.
We believe we compete favorably with respect to these factors; however, a customer could weigh different factors differently and decide that a competitor's offerings are preferable to ours. We believe our principal competitors are the Optical Divisions of large Japanese conglomerates, including Mitsubishi, NEC Corporation, NTT Electronics Corporation, Sumitomo Electric Device Innovations, Inc., and Fujitsu Optical Components, as well as smaller, narrowly focused companies, including Multiplex Inc., BinOptics Corporation, Emcore Corporation, u2t Photonics AG and Picometrix. We also compete with various other companies, including some of our customers who evaluate our capabilities against the merits of manufacturing optical components internally.
Government Regulations
Although the telecommunications industry is subject to numerous governmental rules and regulations, these regulations have not had a material impact on our business to date. Future regulations affecting communications services, our products or our customers' businesses could negatively affect our business. In particular, we anticipate increasing sales of our product offerings to emerging end markets, including defense and avionics. Current and future regulations promulgated by the Department of Homeland Security and the Department of Defense, including International Trafficking in Arms Regulations, could restrict our ability to sell to customers in certain geographies or otherwise impose new requirements that could negatively affect our business.
Employees
As of June 30, 2011, we employed approximately 612 full-time employees, including 10 in sales and marketing, 53 in product development, 13 in general and administrative, 39 in business operations and 497 in manufacturing engineering and operations. As of such date, we had 277 employees in the United States and 335 employees internationally. We also engage a number of temporary employees and consultants. Other than our production employees in our Matamoros, Mexico factory, who are subject to a collective bargaining agreement, none of our employees is represented by a labor union with respect to his or her employment with us. This collective bargaining agreement has an effective date of January 10 of each year. 35% of our global labor force, including employees and contractors, is covered by this collective bargaining
96
agreement, which will expire within one year. We have not experienced any work stoppages and we consider our relations with our employees to be good. Our future success will depend upon our ability to attract and retain qualified personnel. Competition for qualified personnel remains intense and we may not be successful in retaining our key employees or attracting skilled personnel.
Facilities
Our corporate headquarters are located in Breinigsville, Pennsylvania where we lease approximately 117,379 square feet of office, lab, and manufacturing space. The table below summarizes our facilities as of June 30, 2011. We do not own any real property. We consider our facilities sufficient to meet our current and planned operational requirements. We believe that suitable additional or substitute space will be available as needed to accommodate any expansion of our operations.
| Size (approx. square feet) |
Lease expiration |
Functions |
||
|---|---|---|---|---|
| Breinigsville, PA (103,000 sq ft.) |
October 31, 2017 | Manufacturing, Research and Development Lab, Corporate Headquarters | ||
Breinigsville, PA (14,379 sq ft.) |
July 31, 2014 |
Manufacturing, Corporate Headquarters |
||
South Plainfield, NJ (21,104 sq ft.) |
July 31, 2014 |
Research and Development Lab, Office and Warehouse |
||
Matamoros, Mexico (81,750 sq ft.) |
December 31, 2011 |
Manufacturing, Office and Warehouse |
||
New Taipei City, Taiwan (1,800 sq ft.) |
March 15, 2013 |
Office, Research and Development Lab |
||
Environmental, health and safety matters
Our research and development and manufacturing operations and our products are subject to a variety of federal, state, local and foreign environmental, health and safety laws and regulations relating to discharges of pollutants to air, water, and soil; the remediation of soil and groundwater contamination; the use, storage, handling and disposal of hazardous materials; employee health and safety; and the hazardous material content in our products. Liability under environmental, health and safety laws can be joint and several and without regard to fault or negligence. There can be no assurance that violations of these laws will not occur in the future as a result of human error, accident, equipment failure, or other causes. We use, store and dispose of hazardous materials in our manufacturing operations and hazardous materials are present in our products. We incur costs to comply with existing environmental, health and safety requirements, and any failure to comply, or the identification of contamination for which we are found liable, could cause us to incur substantial costs, including cleanup costs, monetary fines, or civil or criminal penalties, and subject us to property damage and personal injury claims, and result in the suspension of production or alteration of our manufacturing processes, or curtailment of sales and adverse publicity. We expect that our operations and products will be affected by new environmental requirements on an ongoing
97
basis. Environmental, health and safety requirements have become more stringent over time, and changes to existing requirements could restrict our ability to expand our facilities, require us to acquire costly pollution control equipment, or cause us to incur other significant expenses or to modify our manufacturing processes or the hazardous material contents of our products. Some jurisdictions in which our products are sold have enacted requirements regarding the hazardous material content of certain products. For example, member states of the European Union, are among a growing number of jurisdictions, which have placed restrictions on the use of lead, among other chemicals, in electronic products, which affects the composition and packaging of our products. The passage of such requirements in additional jurisdictions, or the tightening of standards or elimination of certain exemptions in jurisdictions where our products are already subject to such requirements, could cause us to incur significant expenditures to make our products compliant with new requirements, or could limit the markets into which we may sell our products.
Additionally, given our manufacturing operations, increasing efforts to control emissions of greenhouse gases could significantly increase our operating costs.
Legal proceedings
From time to time, we are involved in various legal proceedings arising from the normal course of business activities. We are not presently a party to any litigation the outcome of which, we believe, if determined adversely to us, would individually or in the aggregate have a material adverse effect on our business, results of operations or financial condition.
98
Executive officers and directors
The following table sets forth the names, ages and positions of our executive officers and directors as of September 15, 2011:
| Name |
Age |
Position |
|||
|---|---|---|---|---|---|
Ettore J. Coringrato, Jr. |
53 | President, Chief Executive Officer and Director | |||
Warren D. Barratt |
51 | Chief Financial Officer and Secretary | |||
Ali A. Abouzari |
56 | Vice President, Sales | |||
Joseph P. Keska |
48 | Vice President, Operations | |||
Leonard J.P. Ketelsen |
53 | Vice President, Product Development | |||
Stefan M. Rochus |
48 | Vice President, Marketing and Business Development | |||
Erel N. Margalit |
50 | Director and Chairman of the Board | |||
Mark J. DeNino(1)(2) |
58 | Director | |||
Robert Finzi(2)(3) |
57 | Director | |||
John V. Pilitsis(1)(3) |
67 | Director | |||
Sean D. S. Sebastian(1)(2) |
49 | Director | |||
Noah D. Yago |
35 | Director | |||
(1) Member of the Audit Committee
(2) Member of the Compensation Committee
(3) Member of the Nominating and Corporate Governance Committee
Executive officers
Ettore J. Coringrato, Jr. has served as our President and Chief Executive Officer and as a member of our board of directors since 2005, and as our Vice President of Business Development from 2003 through the end of 2004. From 2000 until 2003, Mr. Coringrato was co-founder and served as Chief Financial Officer of CENiX, Inc., an optical start-up that developed high-speed optical modules using an automated manufacturing platform. Mr. Coringrato also worked for 18 years at AT&T and Lucent Technologies, where he held positions in engineering, marketing and sales, strategic planning, business development and product management. Mr. Coringrato holds a BS degree in Industrial Engineering and Systems Management and an MBA from The Pennsylvania State University.
Our board of directors believes that Mr. Coringrato is qualified to serve as a director based on his service as our President and Chief Executive Officer, along with his years of leadership and related industry expertise in strategy, business development, operations, product management and finance. Mr. Coringrato brings a deep understanding of our company and the communications market to our board of directors.
Warren D. Barratt has served as our Chief Financial Officer and Corporate Secretary since September 2011. Previously, Mr. Barratt was Executive Vice President and Chief Financial Officer of LECG Corporation, a public consulting and professional services company, from March 2010 to April 2011. Prior to that, he served as Senior Vice President and Chief Financial Officer of Epitome Systems, a private software company, from 2007 to 2009, and as Chief Financial Officer of Oncura, a private medical device company, from 2004 to 2007. Prior to that, from
99
1994 to 2003, Mr. Barratt served as Chief Financial Officer for public and private companies in the technology, healthcare and veterinary services industries. From 2000 to 2002, Mr. Barratt was Senior Vice President and Chief Financial Officer of CB Technologies, Inc., a developer and marketer of life sciences information technology. CB Technologies, Inc. filed for bankruptcy protection under Chapter 11 of the U.S. Bankruptcy Code in February 2003. Mr. Barratt began his career at the public accounting firm Price Waterhouse from 1982 to 1994. Mr. Barratt holds a BS in Commerce from the University of Virginia and an MBA from the University of Pennsylvania's Wharton School of Business.
Ali A. Abouzari has served as our Vice President of Sales since 2003. Previously, Mr. Abouzari was Vice President of Business Development, Sales and Marketing for Opticalis, a private technology company, where he launched the company's US operations and recruited the senior management team. Prior to that, he served as Director of Marketing for Agere Systems, and was responsible for marketing initiatives and product strategies for the Microelectronics Group for the Asia/Pacific and China regions. Prior to that, Mr. Abouzari worked at Lucent Technologies, where he was responsible for marketing optoelectronic components products worldwide to telecom and data networking customers. Mr. Abouzari holds a BS in Mathematics and Industrial Engineering from the University of Utah, and an ME in Mechanical Engineering/Business Administration from the University of Colorado.
Joseph P. Keska has served as our Vice President of Operations since 2005. Previously, he served as the Director of Package Development and Manufacturing Operations at TriQuint Semiconductor, a publicly traded technology company. Before that, he was the Director of Process Development for Agere Systems Inc. Mr. Keska began his career at AT&T where he held positions in manufacturing and engineering, and subsequently joined Bell Labs where he was a member of the technical staff responsible for receiver development. Mr. Keska holds a BS in Electrical Engineering from the University of Scranton.
Leonard J.P. Ketelsen has served as our Vice President of Product Development since 2005. From 2003 to 2005, Dr. Ketelsen worked at TriQuint Semiconductor, first in its Source Laser Research and Development Department and later in its Optoelectronics Research and Development Department. From 1985 to 2003, Dr. Ketelsen worked for Bell Labs, AT&T and Lucent Technologies, where he held positions in the Semiconductor Laser Development Department, Optoelectronics Division and the Photonic Research Laboratory. He holds a BS in Physics from Clarkson College of Technology, and a Masters and a PhD in Physics from the University of Illinois at Urbana-Champaign.
Stefan M. Rochus has served as our Vice President of Marketing and Business Development since 2005. From 2003 to 2005, he served as a Marketing Director for TriQuint Semiconductor's Optoelectronics Division and held various director positions in marketing and product line management at Lucent Technologies and Agere Systems managing their EDFA, pump laser and passives businesses. From 2000 until 2002, Dr. Rochus served as a product line director for Lucent Technologies and Agere Systems Inc. Dr. Rochus also ran Lucent Technologies' European optoelectronics sales and marketing operations from 1998 to 2000. Dr. Rochus holds a Masters of Science in Optoelectronics from the Technical University of Braunschweig and a PhD in Electrical Engineering from the Technical University of Munich.
100
Non-employee directors
Erel N. Margalit has served on our board of directors since 2007 and as Chairman of the Board since October 2007. He also served on our board of directors from 1999 to 2006. Dr. Margalit is the founder and chairman of Jerusalem Venture Partners, a leading Israeli venture capital fund which he founded in 1993. Over the last 18 years, Dr. Margalit has orchestrated some of the largest exits to come out of Israel. Prior to this, Dr. Margalit was the Director of Business Development for the City of Jerusalem. Dr. Margalit also served on the board of directors of Cogent Communications, Inc., a provider of internet, ethernet and co-location services, Allot Communications Ltd., a provider of bandwidth management solutions, and Qlik Technologies, Inc., a provider of enterprise-class analytics and search, as well as on the board of directors of numerous private companies including Siano Mobile Silicon, Inc., maker of receiver chips for mobile digital TV, and Cyber-Ark Software, Ltd., an information security company. He holds a BA in Philosophy from Hebrew University, an MA and a PhD in Philosophy from Columbia University and serves on the Hebrew University Board of Governors.
Our board of directors believes that Dr. Margalit is qualified to serve as a director based on his thorough understanding of our industry and substantial experience in growth-oriented technology companies where he both invested in and served on the board of directors of numerous companies. His industry and investing experience enables him to provide our board of directors with important strategic counsel and guidance.
Mark J. DeNino has served on our board of directors since 2010. Mr. DeNino has been a Managing Director at TL Ventures since 1994. Prior to joining TL Ventures, Mr. DeNino worked at Fidelity Bank (now Wells Fargo), a banking services company, and also helped create a Small Business Investment Company, Fidelcor Capital, to invest in early-stage technology companies. He holds a BS in Finance and Accounting from Boston College and an MBA from Harvard Business School.
Our board of directors believes that Mr. DeNino is qualified to serve as a director based on his extensive experience with technology companies as a venture capitalist, particularly in software, business services, communications and energy. He has served on 47 public and private company boards and provides our board with industry knowledge and strategic direction.
Robert Finzi has served on our board of directors since April 2009. In May 1991, Mr. Finzi joined Sprout Group, a venture capital firm, and since November 2003 served as co-managing partner until April 2010 and is now Managing Partner. From October 1984 to May 1991, Mr. Finzi was a partner of Merrill Lynch Venture Capital, a venture capital firm, and was promoted to general partner in 1985. From May 1983 to October 1984, Mr. Finzi was an associate at Menlo Ventures, a venture capital firm. From August 1976 to August 1981, Mr. Finzi was a consultant at Arthur Andersen's Administrative Services Division, a consultancy now known as Accenture Ltd., a management consulting, technology services and outsourcing company. Mr. Finzi currently serves on the board of directors of Aurora Networks, Inc., maker of optical transport systems for broadband networks, Cleantech Group, provider of market intelligence on investment and cleantech companies, and Teachscape, provider of K-12 teaching web tools, each a privately-held company. Mr. Finzi previously served on the board of directors of Calix Technologies, provider of broadband communications access systems and software, and Concur Technologies, provider of integrated travel and expense management solutions. Mr. Finzi holds an MBA from Harvard Business School, where he received the Baker Scholar Designation, an
101
MS degree in Industrial Engineering from Lehigh University and a BS in Industrial Engineering from Lehigh University.
Our board of directors believes that Mr. Finzi is qualified to serve as a director based on his extensive experience in board governance, financial management, operations and reporting and management information systems.
John V. Pilitsis has served on our board of directors since 2001. Dr. Pilitsis is the Managing Partner of Pilitsis & Associates, LLC., a management consulting firm. From 2001 until 2005, Dr. Pilitsis served as our Chief Executive Officer and President. He served as the CEO of FiTEL Technologies, Inc., currently a publicly traded company in Canada manufacturing products in the field of optical systems, from 1999 until 2001. In addition, he was the CEO of MKE-Quantum Components LLC, a wafer fabricator, from 1998 to 1999 and the President of the Optoelectronics Group of Lucent Technologies, a manufacturer of telecommunications equipment from 1993 until 1999. He also worked as the Vice President of International Marketing and Sales for AT&T Microelectronics, Inc., formerly a division of Lucent Technologies, which manufacture telecommunications equipment, from 1990 to 1993. Dr. Pilitsis served on the board of directors of Syntune, Inc., a private Indium Phosphide photonics components company, until 2009. Dr. Pilitsis holds a BS in Mechanical Engineering from Farleigh Dickinson University, and a Master of Science and a PhD from the University of Buffalo in Systems Engineering.
Our board of directors believes that Dr. Pilitsis is qualified to serve as a director based on his long history with the company, his leadership experience in senior management and his corporate development positions.
Sean D.S. Sebastian has served on our board of directors since 2005. Mr. Sebastian is a Partner at Birchmere Ventures, a venture capital firm, where he has worked since its formation in 1996. Prior to founding Birchmere Ventures, he served in the Corporate Finance Group of PNC Bank, a banking services company. He was previously a founder and CEO of the Telford Group, a technology consulting firm to financial services clients. He also provided management consulting services to major banking and insurance clients at International Systems Services, a provider of facility services. Mr. Sebastian holds a BS in Mechanical Engineering from Worcester Polytechnic Institute and an MBA from Rensselaer Polytechnic Institute.
Our board of directors believes that Mr. Sebastian is qualified to serve as a director based on his substantial investing experience in the technology sector, active participation in updating our audit committee on new accounting developments and experience addressing accounting and finance issues with our independent public accounting firm and management team.
Noah D. Yago has served on our board of directors since January 2011. Mr. Yago is a Principal at Jerusalem Venture Partners, a leading Israeli venture capital fund, where he has worked since 2009 and is a director of several private companies in the group's portfolio. Prior to joining Jerusalem Venture Partners, Mr. Yago was a Vice President at Millennium Technology Ventures, a venture capital firm, and an Associate at Veronis Suhler Stevenson, a private equity firm. He also worked at Saban Capital Group, a private investment firm, following his experience as the co-founder of Subvergent Media Studios, a Los Angeles-based interactive consultancy serving the media and apparel industries. He holds a BA in Computer Science and German from Tufts University and an MBA from the Stanford Graduate School of Business.
102
Our board of directors believes that Mr. Yago is qualified to serve as a director based on his significant operational experience as well as expertise in capital raising, strategic transactions and complex financing structures.
Board composition
Our Board of Directors is currently composed of seven members. Four of our directors are independent within the meaning of the independent director guidelines of The NASDAQ Stock Market. Immediately prior to this offering, our Board of Directors will be divided into three staggered classes of directors. At each annual meeting of stockholders, a class of directors will be elected for a three-year term to succeed the same class whose terms are then expiring. The terms of the directors will expire upon the election and qualification of successor directors at the Annual Meeting of Stockholders to be held during the years 2012 for the Class I directors, 2013 for the Class II directors and 2014 for the Class III directors.
- •
- Our Class I directors will be Mark J. DeNino and John V. Pilitsis.
- •
- Our Class II directors will be Robert Finzi and Noah D. Yago.
- •
- Our Class III directors will be Ettore J. Coringrato, Jr., Erel N. Margalit and Sean D.S. Sebastian.
Our amended and restated certificate of incorporation and bylaws provide that the number of our directors, which is currently seven members, shall be fixed from time to time by a resolution of the majority of our Board of Directors. Each officer serves at the discretion of the Board of Directors and holds office until his successor is duly elected and qualified or until his or her earlier resignation or removal. There are no family relationships among any of our directors or executive officers.
The division of our Board of Directors into three classes with staggered three-year terms may delay or prevent a change of our management or a change of control. See "Description of capital stock—Anti-takeover effects of Delaware law and our certificate of incorporation and bylaws" for a discussion of other anti-takeover provisions found in our certificate of incorporation.
Director independence
Upon the completion of this offering, we anticipate that our common stock will be listed on The NASDAQ Global Select Market. Under the rules of The NASDAQ Stock Market, independent directors must comprise a majority of a listed company's board of directors within a specified period of the completion of this offering. In addition, the rules of The NASDAQ Stock Market require that, subject to specified exceptions, each member of a listed company's audit, compensation and corporate governance and nominating committees be independent. Audit committee members must also satisfy the independence criteria set forth in Rule 10A-3 under the Securities Exchange Act of 1934, as amended. Under the rules of The NASDAQ Stock Market, a director will only qualify as an "independent director" if, in the opinion of that company's board of directors, that person does not have a relationship that would interfere with the exercise of independent judgment in carrying out the responsibilities of a director.
103
In order to be considered to be independent for purposes of Rule 10A-3, a member of an audit committee of a listed company may not, other than in his or her capacity as a member of the audit committee, the board of directors, or any other board committee: (1) accept, directly or indirectly, any consulting, advisory, or other compensatory fee from the listed company or any of its subsidiaries; or (2) be an affiliated person of the listed company or any of its subsidiaries.
In July, 2011, our Board of Directors undertook a review of its composition, the composition of its committees and the independence of each director. Based upon information requested from and provided by each director concerning his background, employment and affiliations, including family relationships, our board of directors has determined that none of Messrs. Finzi, DeNino or Sebastian or Dr. Pilitsis, representing four of our seven directors, has a relationship that would interfere with the exercise of independent judgment in carrying out the responsibilities of a director and that each of these directors is "independent" as that term is defined under the rules of The NASDAQ Stock Market. Our Board of Directors also determined that Messrs. DeNino and Sebastian and Dr. Pilitsis, who comprise our audit committee, Messrs. DeNino, Finzi and Sebastian, who comprise our compensation committee, and Mr. Finzi and Dr. Pilitsis, who comprise our nominating and corporate governance committee, satisfy the independence standards for those committees established by applicable SEC rules and the rules of The NASDAQ Stock Market. In making this determination, our Board of Directors considered the relationships that each non-employee director has with our company and all other facts and circumstances our board of directors deemed relevant in determining their independence, including the beneficial ownership of our capital stock by each non-employee director.
Board committees
Our Board has an audit committee, a compensation committee and a nominating and corporate governance committee, each of which has the composition and the responsibilities described below.
Audit committee. Our audit committee oversees our corporate accounting and financial reporting process and assists the Board of Directors in monitoring our financial systems and our legal and regulatory compliance. Our audit committee is responsible for, among other things:
- •
- appointing, compensating and overseeing the work of our independent auditors;
- •
- approving engagements of the independent auditors to render any audit or permissible non-audit services;
- •
- reviewing the qualifications and independence of the independent auditors;
- •
- monitoring the rotation of partners of the independent auditors on our engagement team as required by law;
- •
- reviewing our financial statements and reviewing our critical accounting policies and estimates;
- •
- reviewing the adequacy and effectiveness of our internal controls; and
- •
- reviewing and discussing with management and the independent auditors the results of our annual audit, our quarterly financial statements and our publicly filed reports.
104
The members of our audit committee are Messrs. DeNino and Sebastian and Dr. Pilitsis. Mr. Sebastian is our audit committee chairman and our board of directors has designated each of Dr. Pilitsis and Mr. Sebastian as an "audit committee financial expert," as defined under the applicable rules of the Securities and Exchange Commission. Our Board of Directors has concluded that the composition of our audit committee meets the requirements for independence under the current requirements of The NASDAQ Stock Market and SEC rules and regulations. We believe that the functioning of our audit committee complies with the applicable requirements of The NASDAQ Stock Market and SEC rules and regulations.
Compensation committee. Our compensation committee oversees our corporate compensation policies, plans and programs. The compensation committee is responsible for, among other things:
- •
- reviewing and recommending policies, plans and programs relating to compensation and benefits of our directors, officers
and employees;
- •
- reviewing and recommending compensation and the corporate goals and objectives relevant to compensation of our Chief
Executive Officer;
- •
- reviewing and approving compensation and corporate goals and objectives relevant to compensation for executive officers
other than our Chief Executive Officer;
- •
- evaluating the performance of our executive officers in light of established goals and objectives;
and
- •
- administering our equity compensations plans for our employees and directors.
The members of our compensation committee are Messrs. DeNino, Finzi and Sebastian. Mr. Finzi is the chairman of our compensation committee. Our Board of Directors has determined that each member of our compensation committee is independent within the meaning of the independent director guidelines of The NASDAQ Stock Market. We believe that the composition of our compensation committee meets the requirements for independence under, and the functioning of our compensation committee complies with, any applicable requirements of The NASDAQ Stock Market and SEC rules and regulations.
Nominating and corporate governance committee. Our nominating and corporate governance committee oversees and assists our Board of Directors in reviewing and recommending corporate governance policies and nominees for election to our Company's Board of Directors. The nominating and corporate governance committee is responsible for, among other things:
- •
- evaluating and making recommendations regarding the organization and governance of the Board of Directors and its
committees;
- •
- assessing the performance of members of the Board of Directors and making recommendations regarding committee and chair
assignments;
- •
- recommending desired qualifications for Board of Directors membership and conducting searches for potential members of the
Board of Directors; and
- •
- reviewing and making recommendations with regard to our corporate governance guidelines.
105
The members of our nominating and corporate governance committee are Mr. Finzi and Dr. Pilitsis. Dr. Pilitsis is the chairman of our nominating and corporate governance committee. Our Board of Directors has determined that each member of our nominating and corporate governance committee is independent within the meaning of the independent director guidelines of The NASDAQ Stock Market.
Our Board of Directors may from time to time establish other committees.
Director compensation
With the exception of Dr. Pilitsis, no members of our board of directors received any compensation from us in their role as directors in the fiscal year ended December 31, 2010, nor did they have any stock option awards vested or outstanding as of December 31, 2010.
The following table sets forth the summary of the compensation we paid to our directors in 2010:
Name(1)
|
Fees Earned or Paid in Cash |
Option Awards |
All Other Compensation |
Total | ||||||||
|---|---|---|---|---|---|---|---|---|---|---|---|---|
John V. Pilitsis |
$ | 6,250 | — | (2) | — | $ | 6,250 | |||||
(1) Dr. Margalit, Mr. DeNino, Mr. Finzi, Mr. Sebastian and Mr. Yago have been omitted from this table because they received no compensation for serving on our board of directors in 2010. Mr. Coringrato's compensation as our President and Chief Executive Officer for 2010 is detailed in "Compensation discussion and analysis" below.
(2) As of December 31, 2010, Dr. Pilitsis had 42,786 stock options vested and outstanding that were awarded to him in March 2002 when he served as our chief executive officer. Dr. Pilitsis did not receive any grants of stock options in 2010.
Upon consummation of our initial public offering, non-employee directors will receive an annual retainer of $ . The chair of the audit committee will be paid an additional annual retainer of $ , and members of the audit committee other than the chair will be paid an additional annual retainer of $ . The chair of the compensation committee will be paid an additional annual retainer of $ , and members of the compensation committee other than the chair will be paid an additional annual retainer of $ . The chair of the corporate governance and nominating committee will be paid an additional annual retainer of $ , and members of the corporate governance and nominating committee other than the chair will be paid an additional annual retainer of $ . The lead independent director will be paid an additional annual retainer of $ .
Under the policy, each non-employee director, who first becomes a non-employee director following the effective date of the first registration statement filed by us and declared effective with respect to any class of our securities, will be automatically granted a stock option to purchase shares of our common stock on the date such person first becomes a non-employee director. A director who is an employee and who ceases to be an employee, but who remains a director will not receive such an initial award.
In addition, each non-employee director will be automatically granted an annual stock option to purchase shares of our common stock on the date of each annual meeting beginning on the date of the first annual meeting that is held at least six months after such non-employee director received his or her initial award. In connection with the pricing of this initial public offering, each non-employee director serving on our Board of Directors at the
106
time of this offering will be automatically granted an option to purchase shares of our common stock at the price per share at which such common stock is sold in this offering.
The exercise price of all stock options granted pursuant to the policy will be equal to the fair market value of our common stock on the date of grant. The term of all stock options will be years. Subject to the adjustment provisions of the 2011 Stock Option and Incentive Plan, initial awards will vest annually over three years, provided such non-employee director continues to serve as a director through each such date. Subject to the adjustment provisions of the 2011 Stock Option and Incentive Plan, the annual awards, including such awards granted in connection with this offering, will vest on the first anniversary of the date of grant, provided such non-employee director continues to serve as a director through such date.
The administrator of the 2011 Stock Option and Incentive Plan in its discretion may change or otherwise revise the terms of awards granted under the outside director equity compensation policy.
In the event of a "change in control," as defined in our 2011 Stock Option and Incentive Plan, with respect to awards granted under the 2011 Stock Option and Incentive Plan to non-employee directors, the participant non-employee director will fully vest in and have the right to exercise awards as to all shares underlying such awards and all restrictions on awards will lapse, and all performance goals or other vesting criteria will be deemed achieved at % of target level and all other terms and conditions met.
Code of business conduct and ethics
Prior to the completion of this offering, we will adopt a code of business conduct that is applicable to all of our employees, officers and directors. In addition, we will adopt a code of ethics that is applicable to our chief executive and senior financial officers.
Compensation committee interlocks and insider participation
None of the members of our compensation committee is an officer or employee of our company. None of our executive officers currently serves, or in the past year has served, as a member of the Board of Directors or compensation committee of any entity that has one or more executive officers serving on our Board of Directors or compensation committee.
107
Compensation discussion and analysis
This Compensation discussion and analysis provides information about the material components of our executive compensation program for:
| Name |
Position(s) |
|
|---|---|---|
| Ettore J. Coringrato, Jr. | President, Chief Executive Officer and Director | |
| Matthew C. Riley(1) | Former Chief Financial Officer and Secretary | |
| Leonard J.P. Ketelsen | Vice President, Product Development | |
| Joseph P. Keska | Vice President, Operations | |
| Stefan M. Rochus | Vice President, Marketing and Business Development | |
- (1)
- Mr. Riley resigned as our Chief Financial Officer and Secretary in September 2011. He will continue to be an employee of the company, as Senior Vice President, Strategic Initiatives, as we transition from a private to a public company.
We refer to these executive officers collectively in this Compensation discussion and analysis and the related compensation tables as the "named executive officers."
Specifically, this Compensation discussion and analysis provides an overview of our executive compensation philosophy, the overall objectives of our executive compensation program and each compensation component that we provide. In addition, we explain how and why the compensation committee of our board of directors, or the Committee, recommended, and our board of directors approved, the specific compensation policies and decisions involving our executive officers during 2010.
This Compensation discussion and analysis contains forward-looking statements that are based on our current plans, considerations, expectations and determinations regarding future compensation programs. The actual compensation programs that we adopt in the future may differ materially from currently planned programs as summarized in this discussion.
Executive compensation philosophy and objectives
Our compensation philosophy is based on the following objectives and principles:
- •
- attract, retain and motivate top-level executive talent;
- •
- provide compensation levels and structures that are both competitive with our peer companies and fiscally responsible;
- •
- create a culture in which executive compensation aligns with our pay-for-performance business
model;
- •
- align the interests of our executive officers and stockholders by providing equity incentives, while avoiding unreasonable
levels of stockholder dilution; and
- •
- maintain simplicity, transparency and ease of administration.
108
Compensation program design
The compensation of our executive officers, including our named executive officers, consists of a base salary, an annual cash bonus opportunity, equity-based awards and employee-benefits programs.
To date, the primary components of our executive compensation program have been base salary and annual cash bonus opportunities. We have emphasized cash compensation, especially bonuses, to focus our employees on the achievement of specific near-term financial, strategic and operational objectives that will further our longer-term growth objectives. Though we believe the cash compensation we offer to our executive officers is competitive, we have historically offered base salaries at the lower end of an identified market range as determined in the collective judgment of our board of directors, and have emphasized cash bonuses to reward outstanding performance. We believe that cash bonuses are the best motivator for our employees and reflect our pay-for-performance philosophy.
In addition, we have granted stock options to purchase shares of our common stock to our executives. We believe that stock options offer our key employees, including our named executive officers, a valuable long-term incentive that aligns their interests with the interests of our stockholders. We also believe that, for technology companies, stock-based compensation in the form of stock options continues to be a significant motivator in attracting and retaining employees. Though historically our equity compensation has been towards the low end for a technology company, as we transition to a public company, we expect that we will rebalance the compensation packages to place greater emphasis on equity compensation, similar to our anticipated peer group companies. We believe this shift in emphasis will encourage our employees to focus on growing our overall enterprise value, and correspondingly, to create sustainable long-term value for our stockholders.
To date, we have not employed any policies or guidelines for allocating compensation between current and long-term compensation, between cash and non-cash compensation, or among different forms of non-cash compensation.
Compensation-setting process
Role of the board and compensation committee
Prior to the formation of the Committee several years ago, our board of directors primarily determined the compensation for our named executive officers. Since its formation, the Committee has been responsible for overseeing our executive compensation philosophy and compensation programs, consulting with management on compensation actions and decisions and recommending compensation packages, including cash compensation, equity awards and benefits, to our board of directors for its approval. Our board of directors has approved a charter for the Committee, which was last revised in May 2010, and we intend to adopt a new charter in connection with this offering to comply with the applicable rules and regulations of a public company listed on The NASDAQ Stock Market.
Following this offering, we intend that the Committee will assume the responsibility of administering our executive compensation program as well as determining and approving the compensation for our executive officers, including the named executive officers, from our board of directors. The Committee intends to review on a periodic basis our executive
109
compensation program, including any incentive compensation plans, to determine whether they are appropriate, properly coordinated and achieve their intended purposes. The Committee will have the authority to establish and implement any modifications or new plans or arrangements.
Role of management
In carrying out their responsibilities, our board of directors and the Committee have worked with members of our management team, including our chief executive officer. Our board of directors and the Committee also work with our chief financial officer to evaluate the financial, accounting and tax implications, and with our outside legal counsel to evaluate the legal implications of our various compensation programs. Historically, our management team has assisted our board of directors and the Committee by providing information on corporate and individual performance, market data and management's perspective and recommendations on compensation matters.
Typically, our chief executive officer has made recommendations to our board of directors and the Committee regarding the compensation of our employees, including our executive officers (except with respect to his own compensation), and attends that portion of the meetings in which compensation matters are discussed (except he recuses himself from that portion of meetings with respect to discussions involving his own compensation).
While our board of directors and the Committee have solicited and reviewed our chief executive officer's recommendations and proposals with respect to compensation-related matters, they have only used these recommendations and proposals as one factor in making compensation decisions for our employees, including our executive officers.
Role of compensation consultant
The Committee is authorized to retain the services of compensation consultants and other advisors from time to time, as it sees fit, in connection with the establishment of cash and equity compensation plans and arrangements and related policies.
In July 2011, the Committee engaged Compensia, Inc., a national compensation consulting firm providing executive compensation advisory services, to assist it in developing a set of executive compensation guiding principles, to evaluate the competitiveness of our executive officers' compensation and to assist the Committee in developing public company-oriented executive and director compensation programs. Compensia serves at the discretion of the Committee. Compensia has not provided any other services to us in 2011.
Use of competitive data
To assess the competitiveness of our executive compensation program and compensation levels going forward, the Committee has instructed Compensia to develop a peer group of comparable technology companies. The companies comprising the peer group will be selected by the Committee, with the assistance of Compensia, on the basis of their similarity to us in size as determined by factors such as revenue and market capitalization, geography and industry sector. Data from this peer group will be used to assess current compensation levels and to assist the Committee in setting compensation levels for 2011 and thereafter. Following development of the initial peer group, the Committee intends to review the peer group at least annually and make adjustments to its composition as necessary. In 2010, the Committee
110
did not use a peer group to assess the competitiveness of our executive compensation program.
Executive compensation program components
The following describes each component of our executive compensation program, the rationale for each component and how awards are determined.
Base salary
Base salary represents the fixed portion of our executive officers' compensation and is set at a minimum level sufficient to attract, retain and motivate highly talented executive officers when included as one component of our overall total compensation opportunity.
In past years, our board of directors and the Committee have reviewed the base salary of our chief executive officer, taking into consideration our chief executive officer's performance, individual contributions, responsibilities, experience, prior salary level and the competitive market for executives in similar positions. In addition, our board of directors and the Committee has reviewed our chief executive officer's base salary recommendations with respect to all other named executive officers, with such recommendations being based on our chief executive officer's subjective assessment of individual contributions, responsibilities, experience and competitive market conditions for executives in similar positions. In the future, we expect the Committee to conduct an annual review of each executive officer's base salary, with input from our chief executive officer, and to make adjustments it determines to be reasonable and necessary after a review of similar considerations and input from third-party compensation consultants.
In April 2010, the Committee, based on the recommendations of our chief executive officer, increased the base salaries of our executive officers, including our named executive officers (other then our chief executive officer and chief financial officer). These base salary increases ranged between 3.2% and 4.1% and were determined and made based on our chief executive officer's subjective assessments of the respective officers' performance during 2009, their anticipated contributions during 2010, and the competitive market for executives in similar positions.
In November 2010, our board of directors, based on the recommendation of the Committee, increased the base salaries of our chief executive officer and chief financial officer. Due in part to the end of year effective date of these increases, the base salary increases for 2010 for our chief executive officer and chief financial officer were 1.5% and 1.2%, respectively. The base salary increase for our chief executive officer was based on the Committee's evaluation of his performance during 2009 and our board of directors' assessment of his anticipated contributions during 2010. The base salary increase of our chief financial officer was in recognition of his performance during 2009, as evaluated by our chief executive officer, and our board of directors' assessment of his anticipated contributions during 2010.
In April 2011, the Committee, increased the base salaries for our named executive officers (other than our chief executive officer and chief financial officer). These base salary increases ranged between 6.2% and 7.8% and were determined and made based on our chief executive officer's subjective assessment of the respective officer's performance during 2010, their anticipated contributions during 2011 and the competitive market for executives in similar positions.
111
Cash bonuses
Historically, the Committee has recommended and our board of directors has established parameters for annual cash bonus payments to our executive officers, including the named executive officers, and other key employees. Bonus payments have been based on the overall financial performance and strategic and operating achievements of the company, as well as the individual performance and overall compensation of the employee, and were considered by the Committee and our board of directors to be appropriate individually and in the aggregate based on our overall performance.
2010 Cash bonus plan In April 2010, following consultations with management, including our chief executive officer, the Committee recommended and our board of directors approved the general parameters for an annual cash bonus plan for 2010 to reward our executive officers, including our named executive officers. The 2010 cash bonus plan was primarily based on the degree of achievement of certain financial performance and operational objectives, but the Committee and our board of directors also desired to retain the flexibility to make final bonus determinations based on each participant's individual performance and contributions to the company. As part of the 2010 cash bonus plan, the Committee recommended and our board of directors approved 2010 target bonus opportunities and target upside bonus amounts for each named executive officer, calculated as a percentage of each officer's base salary (as shown in the table below).
For 2010, the Committee and our board of directors selected revenue, gross margin, net income and end of period cash as the principal corporate financial and operational metrics on which to determine the overall bonus pools, as these metrics were deemed aligned with our financial performance and the creation of stockholder value. Each of these metrics was assigned a weight within each executive officer's target bonus opportunity. Further, the size of each award was determined by whether we achieved at least a threshold performance level for the year in each financial and operational objective. The Committee believed that these financial metrics, conditions and thresholds would encourage our executive officers to manage our business in a cost-effective manner and make decisions that would contribute to revenue growth and overall profitability.
The following weightings were applied for our named executive officers:
- •
- revenue—30%;
- •
- gross margin—15-25%;
- •
- net income—10-15%; and
- •
- end of period cash—10-30%.
The remainder of each target bonus opportunity consisted of company strategic, development and manufacturing objectives that were designed separately for each executive officer. Annual revenue was generally weighted more heavily than the other metrics because, at this point in our development, the Committee and our board of directors believed that revenue growth was the primary driver of near-term value. For 2010, our target revenue was $81.7 million, our target gross margin was 21.3%, our target net income was $(1.9 million) and our target end of period cash was $10.2 million. If we achieved between 80-99.99% of the target for each metric, each executive officer would be paid between 50%-99.99% of his or her target bonus for that metric, calculated on a sliding scale, with no payment for performance less than 80% of the target level. If we achieved between 100-109.99% of the target for a metric, the executive officers would be paid 100% of their target bonus for that metric. If we achieved 110% or
112
above the target for a metric, the executive officers would be paid 110% of their target bonus for that metric, with payment of the full target upside bonus opportunities (as shown in the table below) for performance of 110% or above the targets in all metrics. The Committee and our board of directors believed that the target levels for these financial and operations objectives, and the performance thresholds, were attainable but challenging. In addition, the Committee and our board of directors reserved an additional $100,000 in the bonus pool to use in its discretion to award outstanding individual performance. This bonus structure is similar to the practice we have implemented in prior years.
As part of the 2010 cash bonus plan, the Committee recommended and our board of directors approved 2010 target bonus opportunities and target upside bonus amounts for each named executive officer, calculated as a percentage of each officer's base salary. The Committee recommended, and our board of directors approved, two tiers of target bonus opportunities and target upside bonus amounts for our named executive officers:
- •
- Tier one—for our chief executive officer—set his target bonus opportunity as 36% of his base
salary and his target upside bonus amount as 55% of his base salary; and
- •
- Tier two—for all of the other named executive officers- set their target bonus opportunities as 25% of their base salaries and their target upside bonus amounts as 35% of their base salaries.
The differences in the two tiers was reflective of our board of directors' and the Committee's assessment of the ability of the named executive officers in each tier to impact the overall financial performance and strategic and operating achievements of the company.
In February 2011, following consultation with management, including our chief executive officer, the Committee and our board of directors determined the amount of the overall bonus pool for the payment of annual cash bonuses to our executive officers, as well as the actual cash bonus awards for our executive officers, including our named executive officers, and other key employees for 2010. In making these determinations, the Committee first evaluated our financial and operating performance and the level of achievement against the target levels established for the principal corporate financial and operational metrics for the year.
The Committee and our board of directors determined that we had exceeded the target level objectives for each of the four principal corporate and operational metrics as follows. We achieved:
- •
- 132.6% of its annual revenue target;
- •
- 132.4% of its annual gross margin target;
- •
- 494.7% of its net income target; and
- •
- 121.6% of its end of period cash target.
The Committee and our board of directors then determined that, since our company had exceeded 110% of the target level for each of the four principal corporate financial and operational metrics, these results supported the payment of the target upside bonus amount to each of our named executive officers as set forth below. In addition, the Committee recommended, and our board of directors approved, additional discretionary bonuses to our chief executive officer and chief financial officer of $50,000 and $25,000, respectively, based on
113
their individual contributions, specifically in connection with securing private financing for the company in the first quarter of 2011.
The following table summarizes the actual annual cash bonuses paid to our named executive officers in 2011 for 2010 performance:
| Name |
Target Bonus Opportunity under 2010 Cash Bonus Plan($) |
Target Upside Bonus Opportunity under 2010 Cash Bonus Plan($) |
Actual Bonus Payment under 2010 Cash Bonus Plan($) |
2010 Discretionary Bonus Award($) |
Total Bonus Amounts for 2010 (including any discretionary bonus)($) |
|||||
|---|---|---|---|---|---|---|---|---|---|---|
Ettore J. Coringrato, Jr. |
$80,000 | $120,000 | $120,000 | $50,000 | $170,000 | |||||
Mathew C. Riley(1) |
$49,000 | $68,600 | $68,600 | $25,000 | $93,600 | |||||
Leonard J.P. Ketelsen |
$42,500 | $59,500 | $59,500 | — | $59,500 | |||||
Joseph P. Keska |
$40,000 | $56,000 | $56,000 | — | $56,000 | |||||
Stefan M. Rochus |
$40,000 | $56,000 | $56,000 | — | $56,000 | |||||
- (1)
- Mr. Riley resigned as our Chief Financial Officer and Secretary in September 2011. He will continue to be an employee of the company, as Senior Vice President, Strategic Initiatives, as we transition from a private to a public company.
2011 Cash bonus plan In February 2011, following consultations with management, including our chief executive officer, the Committee recommended and our board of directors approved the general parameters for an annual cash bonus plan for 2011. Structured similar to the 2010 cash bonus plan, the 2011 cash bonus plan is primarily based on certain financial performance and operational objectives, namely revenue, gross margin, net income before taxes and end of period cash. The target bonus opportunities for our named executive officers were set from 25-35% of base salary, and the upside target bonus opportunities were set from 35-50% of base salary. The Committee and our board of directors also tentatively set aside $100,000 for discretionary bonuses to award outstanding individual performance.
Equity compensation
We use equity awards to motivate and reward our executive officers, including the named executive officers, for long-term corporate performance based on the value of our common stock, and to align the interests of our executive officers with those of our stockholders. We believe that stock options, when granted with exercise prices equal to the fair market value of our common stock on the date of grant, provide an appropriate long-term incentive for our executive officers, because they reward them only to the extent that our stock price increases and stockholders realize value following their grant date.
To promote the long-term incentive and retention features of equity compensation, we have typically granted stock options subject to our standard four-year vesting schedule. Under the vesting schedule, 25% of the stock option becomes exercisable one year after a specified vesting commencement date, and then vesting occurs quarterly thereafter over the remaining three-year period. On occasion, we have also granted stock options with non-standard vesting or early exercise features, mostly in case-by-case situations for senior executives, directors, consultants, advisors and other employees.
We have not applied a rigid formula to determine the size of the stock option awards that have been granted to our executive officers. Instead, these awards were determined in the judgment of the Committee and our board of directors taking into consideration, among other things, the performance of the company and the executive officer during the past year, the prospective role and responsibility of the executive officer, competitive factors, the amount of equity-based compensation held by the executive officer and the portion that is vested or
114
unvested and the cash compensation received by the executive officer. Based upon these factors, our board of directors or the Committee has determined the size of each stock option award at levels it considers appropriate to create a meaningful opportunity for long-term incentive predicated on the creation of long-term stockholder value.
To date, we have not granted any equity awards other than stock options to our executive officers. Typically, our executive officers have received an initial stock option grant at the time of hire, with only periodic additional awards thereafter. In connection with this offering, we expect the Committee to oversee the development of a long-term equity incentive plan. While this plan is likely to provide for a variety of different types of equity awards, we expect that, reflecting our focus on long-term growth, the Committee will continue to use stock options as our primary form of long-term incentive compensation. We also expect that the Committee may decide to grant equity awards to our executive officers on a more frequent (for example, annual) basis than in the past, to the extent that the Committee determines it to be in the best interests of the company based upon its review of competitive market data.
There were no equity awards granted to the named executive officers during 2010. In April 2011, the Committee awarded 209,000 stock options to Mr. Coringrato, 61,750 stock options to Mr. Riley, 52,250 stock options to Mr. Keska, 51,300 stock options to Dr. Ketelsen and 47,500 stock options to Dr. Rochus. The stock options are subject to our standard four-year vesting schedule.
Retirement and other benefits
We have established a tax-qualified Section 401(k) retirement savings plan for our executive officers, including the named executive officers and other employees. Under this plan, participants may elect to make pre-tax contributions, not to exceed the applicable statutory income tax limitation (which was $16,500 in 2010). In addition, we may make discretionary contributions to the plan in any year, up to certain limits, although we have not made any such contributions to date. We intend for the plan to qualify under Section 401(a) of the Internal Revenue Code so that contributions by participants to the plan, and income earned on plan contributions, are not taxable to participants until withdrawn from the plan.
Additional benefits received by our executive officers, including the named executive officers, include medical and dental benefits, medical and dependent care flexible spending accounts, short-term and long-term disability insurance, travel, accidental death and dismemberment insurance and basic life insurance coverage. These benefits are provided on the same basis to all of our full-time employees.
We design our employee benefits programs to be affordable and competitive in relation to the market, as well as compliant with applicable laws and practices. We adjust our employee benefits programs as needed based upon regular monitoring of applicable laws and practices and the competitive market.
Historically we have not provided perquisites or other personal benefits to our executive officers. Currently, we do not view perquisites or other personal benefits as a significant component of our executive compensation program. In the future, however, we may provide such items in limited circumstances, such as where we believe it is appropriate to assist an individual in the performance of his or her duties, to make our executive officers more efficient and effective and for recruitment, motivation or retention purposes. All future practices with respect to perquisites or other personal benefits will be approved and subject to periodic review by the Committee.
115
Employment agreements and post-employment compensation
We have entered into employment offer letters with each of our named executive officers other than our chief executive officer, usually as part of the hiring process, that provide for "at-will" employment, base salary, eligibility to participate in the executive bonus plans, standard employee benefit plan participation and recommendations for initial stock option grants. These agreements are subject to our standard proprietary information and invention assignment terms. We have entered into an employment agreement with our chief executive officer that contains certain severance and change of control payments and benefits. This arrangement (including potential payments and terms) is discussed in more detail in the "Executive compensation—Employment agreements and potential payments upon termination or change in control" section below.
We believe that these agreements are an important retention tool, and incent the named executive officers to maintain continued focus and dedication to their assigned duties and to maximize stockholder value. The terms of these agreements were determined after review by the Committee of our retention goals for each named executive officer, as well as analysis of market data and as a result of individual negotiations with each executive officer.
Other compensation policies
Stock ownership guidelines
As of the date of this prospectus, we have not implemented a policy regarding minimum stock ownership requirements for our executive officers, including the named executive officers.
Compensation recovery policy
As of the date of this prospectus, we have not implemented a policy regarding retroactive adjustments to any cash or equity-based incentive compensation paid to our executive officers and other employees where the payments were predicated upon the achievement of financial results that were subsequently the subject of a financial restatement. We intend to adopt a general compensation recovery, or clawback, policy covering our annual and long-term incentive award plans and arrangements once the SEC adopts final rules implementing the requirement of Section 954 of the Dodd-Frank Wall Street Reform and Consumer Protection Act.
Tax and accounting considerations
Deductibility of executive compensation
Generally, Section 162(m) of the Internal Revenue Code disallows a tax deduction to any publicly-held corporation for any remuneration in excess of $1 million paid in any taxable year to its chief executive officer and each of its three next most highly-compensated executive officers (other than its chief financial officer). Remuneration in excess of $1 million may be deducted if, among other things, it qualifies as "performance-based compensation" within the meaning of the Internal Revenue Code. In this regard, the compensation income realized upon the exercise of stock options granted under a stockholder-approved stock option plan generally will be deductible so long as the options are granted by a committee whose members are non-employee directors and certain other conditions are satisfied.
116
As we are not currently publicly-traded, the Committee has not previously taken the deductibility limit imposed by Section 162(m) into consideration in setting compensation for our executive officers. We expect that when the Committee deems advisable, it will adopt a policy that, where reasonably practicable, we will seek to qualify the variable compensation paid to our executive officers for the "performance-based compensation" exemption from this deductibility limit. As such, in approving the amount and form of compensation for our executive officers in the future, the Committee will consider all elements of the cost to us of providing such compensation, including the potential impact of Section 162(m). The Committee may, in its judgment, authorize compensation payments that do not comply with any of the exemptions in Section 162(m) when it believes that such payments are appropriate to attract and retain executive talent.
Taxation of "parachute" payments
Sections 280G and 4999 of the Internal Revenue Code provide that executive officers, persons who hold significant equity interests and certain other highly-compensated service providers may be subject to an excise tax if they receive payments or benefits in connection with a change in control of the company that exceeds certain prescribed limits, and that the company (or a successor) may forfeit a deduction on the amounts subject to this additional tax. We did not provide any executive officer, including any named executive officer, with a "gross-up" or other reimbursement payment for any tax liability that he or she might owe as a result of the application of Sections 280G or 4999 during 2010 and we have not agreed and are not otherwise obligated to provide any executive officer, including any named executive officer, with such a "gross-up" or other reimbursement.
Compensation risk assessment
We believe that although a portion of the compensation provided to our executive officers and other employees is performance-based, our executive compensation program does not encourage excessive or unnecessary risk taking. As a result, we do not believe that our compensation programs are reasonably likely to have a material adverse effect on the company. In fact, our compensation programs are designed to encourage our executive officers and other employees to remain focused on both short-term and long-term strategic goals, in particular in connection with our pay-for-performance compensation philosophy.
117
Summary compensation table
The following table presents, for services rendered to the company during 2010, summary information regarding the total compensation awarded to, earned by or paid to each of the named executive officers.
| Name and principal position |
Base salary($) |
Bonus ($) |
Non-equity incentive plan compensation ($) |
All other compensation ($)(1) |
Total($) |
||||||||||||
|---|---|---|---|---|---|---|---|---|---|---|---|---|---|---|---|---|---|
| Ettore J. Coringrato, Jr. | $ | 223,365 | $ | 50,000 | $ | 120,000 | $ | 9,493 | $ | 402,858 | |||||||
| President, Chief Executive Officer and Director | |||||||||||||||||
Matthew C. Riley(2) |
$ |
198,692 |
$ |
25,000 |
$ |
68,600 |
$ |
7,891 |
$ |
300,183 |
|||||||
| Former Chief Financial Officer and Secretary | |||||||||||||||||
Leonard J.P. Ketelsen |
$ |
176,539 |
— |
$ |
59,500 |
$ |
9,433 |
$ |
245,472 |
||||||||
| Vice President, Product Development | |||||||||||||||||
Joseph P. Keska |
$ |
166,538 |
— |
$ |
56,000 |
$ |
3,961 |
$ |
226,499 |
||||||||
| Vice President, Operations | |||||||||||||||||
Stefan M. Rochus |
$ |
159,904 |
— |
$ |
56,000 |
$ |
9,394 |
$ |
225,298 |
||||||||
| Vice President, Marketing and Business Development | |||||||||||||||||
(1) The amounts reported in the "All other compensation" column consist of medical, dental, life and disability (short and long term) insurance premiums paid by the company on behalf of each named executive officer.
(2) Mr. Riley resigned as our Chief Financial Officer and Secretary in September 2011. He will continue to be an employee of the company, as Senior Vice President, Strategic Initiatives, as we transition from a private to a public company.
Grants of plan-based awards
The following table presents information on plan-based awards for the fiscal year ended December 31, 2010 to our named executive officers:
Grants of plan based awards
| |
|
|
|
All other stock awards: number of shares of stock or units (#) |
All other option awards: number of securities underlying options (#) |
|
|
|||||||||||||||
|---|---|---|---|---|---|---|---|---|---|---|---|---|---|---|---|---|---|---|---|---|---|---|
| |
Estimated possible payouts under non-equity incentive plan awards(1) |
|
|
|||||||||||||||||||
| |
|
Grant date fair value of stock and option awards ($) |
||||||||||||||||||||
| |
Exercise price of option award ($ per share) |
|||||||||||||||||||||
| Name |
Threshold ($) |
Target ($) |
Maximum ($) |
|||||||||||||||||||
Ettore J. Coringrato, Jr. |
40,000 | 80,000 | 120,000 | — | — | — | — | |||||||||||||||
Matthew C. Riley(2) |
24,500 | 49,000 | 68,600 | — | — | — | — | |||||||||||||||
Leonard J.P. Ketelsen |
21,225 | 42,500 | 59,500 | — | — | — | — | |||||||||||||||
Joseph P. Keska |
20,000 | 40,000 | 56,000 | — | — | — | — | |||||||||||||||
Stefan M. Rochus |
20,000 | 40,000 | 56,000 | — | — | — | — | |||||||||||||||
(1) The amounts shown in the threshold, target and maximum columns reflect the minimum, target and maximum amounts potentially payable under our 2010 Cash Bonus Plan, respectively, assuming the minimum performance goals and other conditions were achieved. A threshold of performance of at least 80% of the target level for each financial metric is required for a named executive officer to receive the portion of the bonus attributable to that metric. With performance of 80% of the target for a certain metric, each executive receives 50% of the target bonus attributable to that metric. In addition, the Committee and our board of directors reserve the right to pay discretionary bonuses for exceptional individual performance. Hence the reason for Messrs. Coringrato and Riley earning actual cash bonuses in 2010 (paid in March 2011) in excess of the maximum set forth above.
(2) Mr. Riley resigned as our Chief Financial Officer and Secretary in September 2011. He will continue to be an employee of the company, as Senior Vice President, Strategic Initiatives, as we transition from a private to a public company.
118
Outstanding equity awards at year-end
The following table presents, for each of the named executive officers, information regarding outstanding stock options and other equity awards held as of December 31, 2010.
Outstanding equity awards at fiscal year-end
| |
Option awards | |||||||||||||
|---|---|---|---|---|---|---|---|---|---|---|---|---|---|---|
| Name |
Number of securities underlying unexercised options (#) exercisable |
Number of securities underlying unexercised options (#) unexercisable |
Equity incentive plan awards: number of securities underlying unexercised unearned options (#) |
Option exercise price($) |
Option expiration date |
|||||||||
Ettore J. Coringrato, Jr. |
4,807 | (1) | 0 | 0 | $ | 21.32 | 5/22/13 | |||||||
|
23,034 | (1) | 0 | 0 | $ | 1.04 | 1/20/15 | |||||||
|
17 | (2) | 2 | 0 | $ | 3.64 | 1/31/17 | |||||||
Matthew C. Riley(3) |
17,307 |
(1) |
0 |
0 |
$ |
2.08 |
11/15/15 |
|||||||
|
17 | (2) | 2 | 0 | $ | 3.64 | 1/31/17 | |||||||
Leonard J.P. Ketelsen |
7,692 |
(1) |
0 |
0 |
$ |
1.04 |
7/20/15 |
|||||||
|
3,846 | (1) | 0 | 0 | $ | 2.08 | 11/15/15 | |||||||
|
17 | (2) | 2 | 0 | $ | 3.64 | 1/31/17 | |||||||
Joseph P. Keska |
6,730 |
(1) |
0 |
0 |
$ |
1.04 |
7/20/15 |
|||||||
|
2,884 | (1) | 0 | 0 | $ | 2.08 | 11/15/15 | |||||||
|
17 | (2) | 2 | 0 | $ | 3.64 | 1/31/17 | |||||||
Stefan M. Rochus |
4,230 |
(1) |
0 |
0 |
$ |
1.04 |
7/20/15 |
|||||||
|
576 | (1) | 0 | 0 | $ | 2.08 | 11/15/15 | |||||||
|
17 | (2) | 2 | 0 | $ | 3.64 | 1/31/17 | |||||||
(1) Stock option is fully vested as of December 31, 2010.
(2) Stock option vests at the rate of 25% of the total number of shares of our common stock subject to the option after one year and 6.25% per quarter thereafter for the next three years.
(3) Mr. Riley resigned as our Chief Financial Officer and Secretary in September 2011. He will continue to be an employee of the company, as Senior Vice President, Strategic Initiatives, as we transition from a private to a public company.
Option exercises and stock vested
During the fiscal year ended December 31, 2010, there were no stock option exercises by any of the named executive officers.
Pension benefits
We did not sponsor any defined benefit pension or other actuarial plan for the named executive officers during 2010.
Nonqualified deferred compensation
We did not maintain any nonqualified defined contribution or other deferred compensation plans or arrangements for the named executive officers during 2010.
Employment agreements and potential payments upon termination or change in control
We have entered into written employment agreements or employment offer letters with each of our named executive officers. These agreements provide for "at-will" employment and
119
establish the executive officer's base salary, eligibility to participate in an annual incentive bonus plan, standard employee benefit plan participation as of the time of their execution and recommendations for initial stock option grants.
In addition, Ettore J. Coringrato, Jr., our President and Chief Executive Officer, is eligible to receive certain severance payments and benefits in connection with his termination of employment under various circumstances, including following a change in control of the company. For a summary of the material terms and conditions of the severance and change in control payments and benefits for Mr. Coringrato, as well as the estimated potential severance payments and benefits payable to Mr. Coringrato in the event of termination of employment as of December 31, 2010, see below.
The actual amounts that would be paid or distributed to Mr. Coringrato as a result of one of the termination events occurring in the future may be different than those presented below, as many factors will affect the amount of any payments and benefits upon a termination of employment. For example, some of the factors that could affect the amounts payable include Mr. Coringrato's base salary and the market price of our common stock at the time of the change in control. In addition, although we have entered into a written arrangement to provide severance payments and benefits to Mr. Coringrato in connection with a termination of employment under particular circumstances, we may mutually agree with Mr. Coringrato on severance terms that vary from those provided in the pre-existing arrangement. Finally, in addition to the amounts presented below, Mr. Coringrato would also be able to exercise any vested stock options that he held as of the time of the termination of employment. For more information about the named executive officers outstanding equity awards as of December 31, 2010, see the table captioned "Outstanding equity awards at fiscal year-end" table.
In addition to the severance payments and benefits described in Mr. Coringrato's employment agreement, the named executive offers are eligible to receive any benefits accrued under our broad-based benefit plans, such as disability benefits and accrued vacation pay, in accordance with those plans and policies and cash bonuses as described above in "Executive compensation program components."
Potential payments and benefits upon disability or death
Should Mr. Coringrato's employment be terminated by us due to disability, he shall be entitled (i) to receive his full compensation and (ii) to participate in all of our health plans and programs for a period of six months following such termination. In the event of Mr. Coringrato's death, the cash compensation and benefits payable under his employment agreement shall be paid to his estate or beneficiary for a period of twelve months following his date of death.
Involuntary termination of employment not in connection with change in control
In the event of an involuntary termination of employment (defined as either a termination of employment by us without "cause" or by the executive officer for "good reason") not in connection with a change in control, Mr. Coringrato will be eligible to receive (i) a cash payment equal to six months of his base salary as in effect as of the date of termination, (ii) any annual bonus accrued in a prior year but unpaid as of the termination date plus any
120
accrued portion of the current year's bonus, (iii) six months of continued health coverage under our health plans, and (iv) six months of continued vesting in accordance with his normal vesting schedule. At Mr. Coringrato's option, the payment attributable to his six months of base salary and any accrued but unpaid bonus may be paid in a lump sum.
Involuntary termination of employment in connection with change in control
In the event of an involuntary termination of employment (defined as either a termination of employment by us without "cause" or by the executive officer for "good reason") in connection with a change in control, Mr. Coringrato will be eligible to the same benefits described above with respect to an involuntary termination not in connection with a change in control.
Potential payments and benefits upon termination of employment
The following table sets forth the potential estimated payments and benefits to which Mr. Coringrato would have been entitled to assuming termination of his employment as of December 31, 2010, as specified under the terms and conditions of his employment agreement:
| Executive payments and benefits |
Involuntary termination of employment |
Termination due to disability |
In the event of death |
|||||||
|---|---|---|---|---|---|---|---|---|---|---|
Severance payments upon termination(1) |
$192,500 | $192,500 | ||||||||
Severance payments in the event of death(2) |
$ | 315,000 | ||||||||
Continued vesting of stock options |
(3 | ) | ||||||||
Continued benefits |
$ | 7,732 | $ | 7,732 | $ | 15,464 | ||||
Total |
||||||||||
- (1)
- Consists
of six months of base salary in effect at December 31, 2010 ($122,500) and accrued but unpaid non-discretionary bonus for 2010
($70,000).
- (2)
- Consists
of twelve months of base salary in effect at December 31, 2010 ($245,000) and accrued but unpaid non-discretionary bonus for 2010 ($70,000).
- (3)
- As there was no public trading market for our common stock at the time of vesting of the stock and option awards listed below, the values realized on exercise have been calculated based on our estimated initial public offering price of $ , the midpoint of the range on the front cover of this prospectus.
Potential payments and benefits upon a change in control
Our board of directors has adopted a change in control bonus plan (the "Change in Control Plan") pursuant to which members of our company, including named executive officers, as determined by our board of directors or the Committee, shall be entitled to receive a bonus upon a change in control of the company. The Change in Control Plan will automatically terminate upon the closing of our initial public offering.
Determination of Participants and Allocations. Our board of directors and/or the Committee, in consultation with our chief executive officer, determines the officers, key employees and consultants who are eligible to participate in the Change in Control Plan and the percentage of the aggregate bonus allocable to each participant.
Amount of Bonus. The aggregate bonus amount paid under the Change in Control Plan shall be equal to 10% of the total proceeds eligible for distribution to the our stockholders upon a change in control transaction net of any payments to stockholders who are also participants in
121
the Change in Control Plan. Each participant in the Change in Control Plan will receive a percentage of the aggregate bonus payable under the Change in Control Plan.
Participant Allocations. Our board of directors has approved participation in the Change in Control Plan by each of the following named executive officers but has net yet determined the individual percentage allocations among the plan's participants:
- •
- Ettore J. Coringrato, Jr.
- •
- Matthew C. Riley
- •
- Leonard J.P. Ketelson
- •
- Joseph P. Keska
- •
- Stefan M. Rochus
Effectiveness and Termination Dates. The Change in Control Plan became effective as of August 18, 2004 and terminates on the earliest of (i) August 18, 2013; (ii) the commencement or public announcement of bankruptcy proceedings upon liquidation, dissolution or winding-up of the company and (iii) the consummation of this offering.
Employee stock plans
The following table provides information as of December 31, 2010 regarding the compensation plans under which our equity securities are authorized for issuance:
| Plan category |
Number of securities to be issued upon exercise of outstanding options, warrants and rights |
Weighted average exercise price of outstanding options, warrants and rights |
Number of securities remaining available for future issuance under equity compensation plans(1) |
|||||||
|---|---|---|---|---|---|---|---|---|---|---|
Equity compensation plans approved by stockholders(2) |
404,708 | (3) | $ | 5.516 | 491,856 | |||||
Equity compensation plans not approved by stockholders(4) |
19,230 | $ | 83.20 | 0 | ||||||
Total |
423,938 | 491,856 | ||||||||
(1) Excludes securities to be issued upon exercise of outstanding options, warrants and rights.
(2) Consists of the 1999 Plan and 2007 Plan
(3) Consists of 404,708 shares of common stock underlying stock options.
(4) Represents a grant of s stock option outside the company's stock plans. This grant expired on April 1, 2011.
122
2011 Stock Option and Incentive Plan
Our board of directors has adopted our 2011 (the "2011 Plan"). The 2011 Plan will be effective upon the completion of this offering. The 2011 Plan permits the grant of incentive stock options, within the meaning of Code Section 422, to our employees and any of our subsidiary corporations' employees, and the grant of nonqualified stock options, restricted stock, unrestricted stock, restricted stock units, stock appreciation rights, cash-based awards, performance shares, or dividend equivalents to our employees, directors and consultants and our subsidiary corporations' employees and consultants.
Shares under the plan. We have initially reserved shares of our common stock for the issuance of awards under the 2011 Plan. In addition, the number of shares available for issuance under the 2011 Plan will be annually increased on the first day of each of our fiscal years, beginning with 2012, by an amount equal to the least of:
- •
- a number of shares to be specified;
- •
- % of the outstanding shares of our common stock as of the last day of our immediately preceding fiscal year;
or
- •
- such other amount as our board of directors may determine.
Shares issued pursuant to awards under the 2011 Plan that are forfeited, canceled, reacquired by us prior to vesting, satisfied without the issuance of stock or otherwise terminated (other than by exercise), as well as shares tendered in payment of the exercise price of an award or to satisfy the tax withholding obligations related to an award, will become available for future grant or sale under the 2011 Plan.
Plan administration. The 2011 Plan will be administered by our board of directors which, at its discretion or as legally required, may delegate such administration to our compensation committee and/or one or more additional committees (referred to as the "Administrator"). In the case of awards intended to qualify as "performance-based compensation" within the meaning of Code Section 162(m), the committee will consist of two or more "outside directors" within the meaning of Code Section 162(m).
Subject to the provisions of the 2011 Plan, the Administrator has the power to determine the terms of awards, including the recipients, the exercise price, if any, the number of shares covering each award, the fair market value of a share of our common stock, the vesting schedule applicable to the awards, together with any vesting acceleration, the form of consideration, if any, payable upon exercise of the award and the terms of the award agreement for use under the 2011 Plan. The Administrator also has the authority, subject to the terms of the 2011 Plan, to amend existing awards to reduce or increase their exercise price, to prescribe rules and to construe and interpret the 2011 Plan and awards granted under the 2011 Plan.
Stock options. The Administrator may grant incentive and/or nonqualified stock options under the 2011 Plan, provided that incentive stock options are only granted to employees. The exercise price of such options must equal at least the fair market value of our common stock on the date of grant. The term of an incentive stock option may not exceed ten years; provided, however, that an incentive stock option held by a participant who owns more than 10% of the total combined voting power of all classes of our common stock, or of certain of our subsidiary corporations, may not have a term in excess of five years and must have an
123
exercise price of at least 110% of the fair market value of our common stock on the grant date. The Administrator will determine the methods of payment of the exercise price of an option, which may include cash, shares, broker-assisted cashless exercise, a "net exercise" arrangement or other consideration permitted by applicable law and acceptable to the Administrator. Subject to the provisions of the 2011 Plan, the Administrator determines the remaining terms of the options (e.g., vesting). After the termination of service of an employee, director or consultant, the participant may exercise his or her options, to the extent vested as of such date of termination, for the period of time stated in his or her award agreement. However, in no event may an option be exercised later than the expiration of its term. The specific terms will be set forth in an award agreement.
Restricted stock. Restricted stock may be granted under the 2011 Plan. Restricted stock awards are grants of shares of our common stock that are subject to various restrictions, including restrictions on transferability and forfeiture provisions. Shares of restricted stock will vest, and the restrictions on such shares will lapse, in accordance with terms and conditions established by the Administrator, which may include the achievement of certain performance goals and/or continued employment with us through a specified restricted period. The Administrator, in its sole discretion, may accelerate the time at which any restrictions will lapse or be removed. Recipients of restricted stock awards generally will have voting and dividend rights with respect to such shares upon grant without regard to vesting, unless the Administrator provides otherwise. Shares of restricted stock that do not vest for any reason will be forfeited by the recipient and will revert to us. The specific terms will be set forth in an award agreement.
Unrestricted stock. Unrestricted stock may be granted under the 2011 Plan. Unrestricted stock awards are free from any restrictions under the 2011 Plan. Unrestricted stock may be granted to any participant in recognition of past services or other valid consideration and may be issued in lieu of cash compensation due to such participation.
Restricted stock units. Restricted stock units may be granted under the 2011 Plan. Each restricted stock unit represents the right to ultimately receive one share of our common stock upon satisfaction of certain terms and conditions. The Administrator determines the terms and conditions of restricted stock units including the vesting criteria, which may include achievement of specified performance criteria or continued service to us, and the form and timing of payment. The Administrator, in its sole discretion, may reduce or waive any vesting criteria that must be met to receive a payout. The specific terms will be set forth in an award agreement.
Stock appreciation rights. Stock appreciation rights may be granted under the 2011 Plan. Stock appreciation rights allow the recipient to receive shares of stock having a value equal to the appreciation in the fair market value of our common stock between the exercise date and the date of grant. Subject to the provisions of the 2011 Plan, the Administrator determines the terms of stock appreciation rights, including when such rights vest and become exercisable, except that the per share exercise price for the shares to be issued pursuant to the exercise of a stock appreciation right will be no less than 100% of the fair market value per share on the date of grant. The specific terms will be set forth in an award agreement.
Cash-based awards. The Administrator may grant cash bonuses under the 2011 Plan to participants. The cash bonuses maybe subject to the achievement of certain performance goals.
124
Performance share awards. Performance share awards may be granted under our 2011 Plan. Performance share awards are awards that will result in a payment of shares to a participant only if performance goals established by the Administrator are achieved or the awards otherwise vest. The Administrator determines the terms and conditions of performance share awards including the vesting criteria, which may include achievement of specified performance criteria or continued service, which, depending on the extent to which they are met, will determine the number and/or value of shares to be paid out to participants. After the grant of a performance share award, the Administrator, in its sole discretion, may reduce or waive any performance objectives or other vesting provisions for such award. The specific terms will be set forth in an award agreement.
Dividend equivalents. Dividend equivalents may be granted under the 2011 Plan. Dividend equivalents are credits, paid in cash, equal to the amount of cash dividends paid on shares represented by awards held by participants. Dividend equivalents may be subject to the same vesting restrictions as the shares subject to an award.
Transferability of awards. Unless the Administrator provides otherwise, the 2011 Plan generally does not allow for the transfer of awards and only the recipient of an option or stock appreciation right may exercise such an award during his or her lifetime.
Certain adjustments. In the event of certain changes in our capitalization, to prevent diminution or enlargement of the benefits or potential benefits available under the 2011 Plan, the Administrator will make adjustments to one or more of the number and class of shares that may be delivered under the 2011 Plan and/or the number, class and price of shares covered by each outstanding award.
Merger or change in control. The 2011 Plan provides that in the event of a merger or Change in Control, as defined under the 2011 Plan, each outstanding award will be treated as the Administrator determines, except that if a successor corporation or its parent or subsidiary does not assume or substitute an equivalent award for any outstanding award, then any such award that is an option, stock appreciation right, or award with time-based vesting, conditions or restrictions will fully vest, and all restrictions on such award will lapse, and any such award with performance goals or other vesting criteria applicable to such award may be deemed fully vested and nonforfeitable in the Administrator's discretion. The award will then terminate to the extent unexercised upon the expiration of the specified period of time.
Clawback requirement. The 2011 Plan provides that if the company is required to restate its financial statements due to material noncompliance with financial reporting requirements under the securities laws, executive officers will be required to repay compensation received pursuant to awards under the 2011 Plan during the 12-month period following the first public issuance or filing of the financial document embodying such financial reporting requirement.
Plan amendment, termination. Our board of directors has the authority to amend, alter, suspend or terminate the 2011 Plan provided such action does not impair the existing rights of any participant. The 2011 Plan will automatically terminate in 2021, unless terminated earlier by our board of directors.
2007 Stock Plan
The 2007 Stock Plan (as amended, the "2007 Plan") was adopted by our Board of Directors and approved by our stockholders in 2007 The 2007 Plan provides for the grant of stock options
125
and restricted stock to employees, directors and consultants of us and our related companies. As of the effective date of this offering, the 2007 Plan will be terminated and we will not grant any additional awards under the 2007 Plan. However, the 2007 Plan will continue to govern the terms and conditions of outstanding awards granted thereunder.
Shares under the plan. As of June 30, 2011, there were 707 options to purchase shares of our common stock outstanding and 92,291 shares were available for future grant under the 2007 Plan. Shares subject to options that expire or become unexercisable without having been exercised in full, or that are used to pay the exercise price of an option or to satisfy the tax withholding obligations related to an option (including any shares subject to options or similar awards granted under our 2007 Plan that expire or terminate without having been forfeited to or repurchased by us), will not be returned to the 2007 Plan and will not become available for future grant, following this offering, under the 2011 Plan.
Plan administration. Our board of directors or a committee appointed by our board of directors administers the 2007 Plan. Under the 2007 Plan, the administrator has the power to determine the terms and conditions of the awards, including the recipients, the exercise price, the number of shares covering each award and the vesting schedule of awards. The administrator also has the authority, subject to the terms of the 2007 Plan, to prescribe rules and to construe and interpret the 2007 Plan and awards granted under the 2007 Plan. The administrator also has the authority, subject to the terms of the 2007 Plan, to amend existing options (including to reduce the option's exercise price), to institute an exchange program by which outstanding options may be surrendered in exchange for options that may have different exercise prices and terms and/or cash, to prescribe rules and to construe and interpret the 2007 Plan and options granted under the 2007 Plan.
Option terms. The 2007 Plan permits the grant of stock options. The exercise price of such options has to be at least equal to 100% of the fair market value of a share of our common stock on the date of grant except that the price can not be less than 110% of such fair market value with respect to any person who owned securities of more than 10% of the total combined voting power of all classes of our securities and any securities of our subsidiaries. The option term may not exceed ten years. After termination of continuous service with us or a related company, an optionee may exercise his or her option, to the extent vested as of such date of termination, for the period of time stated in the option agreement (which period of time will be three months if no period is specified). Generally, if termination is due to disability, or in the event of death, the options will remain exercisable for six months. However, an option may not be exercised later than the expiration of its term. The 2007 Plan generally does not allow for the transfer of options other than by will or the laws of descent and distribution, and during the optionee's lifetime, may only be exercised by the optionee.
Restricted stock. The 2007 Plan permits the grant of restricted stock awards. After the administrator determines that it will grant a restricted stock award, the terms, conditions and restrictions related to the award were set forth in a restricted stock agreement. The 2007 Plan generally does not allow the transfer of restricted stock other than by will or the laws of descent and distribution, unless the administrator determines otherwise.
Certain adjustments. In the event of certain changes in our capitalization, including changes in our capitalization resulting from the issuance of any of our shares as a share dividend, the administrator will make adjustments to the number and type of shares and exercise price of shares subject to outstanding options and the number and type of shares that may be
126
delivered under the 2007 Plan. In the event of a proposed liquidation or dissolution, the administrator will notify participants as soon as practicable and all options will terminate to the extent unexercised immediately prior to the consummation of such proposed transaction.
Merger or other transaction. The 2007 Plan provides that in the event of our merger into or consolidation with another entity in which we are not the surviving entity, or we are liquidated or we sell or dispose of all or substantially all of our assets to another entity, then the successor corporation or its parent or subsidiary will assume or substitute an equivalent award for each outstanding award under the 2007 Plan. If there is no assumption or substitution of outstanding options and restricted stock awards, then such options will become fully vested and exercisable, and the right of repurchase will lapse with respect to such restricted stock awards. In addition, the administrator will notify participants in writing or electronically that options under the 2007 Plan will be exercisable for a period of 15 days, and will terminate upon expiration of such period to the extent unexercised.
Plan amendment, termination. Our board of directors has the authority to amend or terminate the 2007 Plan provided such action does not adversely affect the rights of any award holder. Our Board of Directors will terminate the 2007 Plan in connection with this offering.
1999 Stock Option Plan
The Amended and Restated 1999 Stock Option Plan (as amended, the "1999 Plan") was adopted by our Board of Directors and approved by our stockholders in 1999 and 2000, respectively. The 1999 Plan provides for the grant of stock options and restricted stock to employees, directors and consultants of us and our related companies. As of the effective date of this offering, the 1999 Plan will be terminated and we will not grant any additional awards under the 1999 Plan. However, the 1999 Plan will continue to govern the terms and conditions of outstanding awards granted thereunder.
Shares under the plan. As of June 30, 2011, there were 1,664,636 options to purchase shares of our common stock outstanding and 471,622 shares were available for future grant under the 1999 Plan. Shares subject to options that expire or become unexercisable without having been exercised in full, or that are used to pay the exercise price of an option or to satisfy the tax withholding obligations related to an option (including any shares subject to options or similar awards granted under our 1999 Plan that expire or terminate without having been forfeited to or repurchased by us), will become available for future grant, following this offering, under the 2011 Plan.
Plan administration. Our board of directors or a committee appointed by our board of directors administers the 1999 Plan. Under the 1999 Plan, the administrator has the power to determine the terms and conditions of the awards, including the recipients, the exercise price, the number of shares covering each award and the vesting schedule of awards. The administrator also has the authority, subject to the terms of the 1999 Plan, to prescribe rules and to construe and interpret the 1999 Plan and awards granted under the 1999 Plan. The administrator also has the authority, subject to the terms of the 1999 Plan, to amend existing options (including to reduce the option's exercise price), to institute an exchange program by which outstanding options may be surrendered in exchange for options that may have different exercise prices and terms and/or cash, to prescribe rules and to construe and interpret the 1999 Plan and options granted under the 1999 Plan.
127
Option terms. The 1999 Plan permits the grant of stock options. The exercise price of such options has to be at least equal to 100% of the fair market value of a share of our common stock on the date of grant except that the price can not be less than 110% of such fair market value with respect to any person who owned securities of more than 10% of the total combined voting power of all classes of our securities and any securities of our subsidiaries. The option term may not exceed ten years. After termination of continuous service with us or a related company, an optionee may exercise his or her option, to the extent vested as of such date of termination, for the period of time stated in the option agreement (which period of time will be three months if no period is specified). Generally, if termination is due to disability, or in the event of death, the options will remain exercisable for six months. However, an option may not be exercised later than the expiration of its term. The 1999 Plan generally does not allow for the transfer of options other than by will or the laws of descent and distribution, and during the optionee's lifetime, may only be exercised by the optionee.
Restricted stock. The 1999 Plan permits the grant of restricted stock awards. After the administrator determines that it will grant a restricted stock award, the terms, conditions and restrictions related to the award were set forth in a restricted stock agreement. The 1999 Plan generally does not allow the transfer of restricted stock other than by will or the laws of descent and distribution, unless the administrator determines otherwise.
Certain adjustments. In the event of certain changes in our capitalization, including changes in our capitalization resulting from the issuance of any of our shares as a share dividend, the administrator will make adjustments to the number and class of shares and exercise price of shares subject to outstanding options and the number and class of shares that may be delivered under the 1999 Plan. In the event of a proposed liquidation or dissolution, the administrator will notify participants as soon as practicable and all options will terminate to the extent unexercised immediately prior to the consummation of such proposed transaction.
Merger or change in control. The 1999 Plan provides that in the event of our merger or change in control, the successor corporation or its parent or subsidiary will assume or substitute an equivalent award for each outstanding option. If there is no assumption or substitution of outstanding options, the options will become fully vested and exercisable. In addition, the administrator will notify participants in writing or electronically that options under the 1999 Plan will be exercisable for a period of time determined by the administrator, and will terminate to the extent unexercised upon expiration of such period.
Plan amendment, termination. Our board of directors has the authority to amend or terminate the 1999 Plan provided such action does not adversely affect the rights of any award holder. Our Board of Directors will terminate the 1999 Plan in connection with this offering.
Senior Executive Incentive Bonus Plan
On , 2011, our board of directors adopted a Senior Executive Incentive Bonus Plan, or the Bonus Plan, which applies to certain key executives, or the Executives, as selected by the Committee. The Bonus Plan provides for bonus payments based upon the attainment of performance targets established by the Committee and related to financial and operational metrics with respect to the company or any of its subsidiaries, or the Performance Goals, which would include the achievement of specified financial or operational metrics or objectives. Any bonuses paid under the Bonus Plan shall be based upon objectively determinable bonus formulas that tie such bonuses to one or more performance targets
128
relating to the Performance Goals. The bonus formulas shall be adopted in each performance period by the Committee and communicated to each Executive. No bonuses shall be paid under the Bonus Plan unless and until the Committee makes a determination with respect to the attainment of the performance objectives. Notwithstanding the foregoing, the Company may adjust bonuses payable under the Bonus Plan based on achievement of individual performance goals or pay bonuses (including, without limitation, discretionary bonuses) to Executives under the Bonus Plan based upon such other terms and conditions as the Committee may in its discretion determine.
Each Executive shall have a targeted bonus opportunity set for each performance period. The Performance Goals will be measured at the end of each performance period after the Company's financial reports have been published or such other appropriate time as the Committee shall determine. If the Performance Goals are met, payments will be made as soon as practicable following the end of each performance period, but not later than March 15 of the subsequent fiscal year. Subject to the rights contained in any agreement between the Executive and the Company, an Executive must be employed by the Company as of the last day of the performance period in order to be eligible to receive a bonus payment.
Limitation on liability and indemnification matters
Our amended and restated certificate of incorporation and bylaws that will become effective upon the completion of this offering contain provisions that limit the personal liability of our directors for monetary damages to the fullest extent permitted by Delaware law. Consequently, our directors will not be personally liable to us or our stockholders for monetary damages for any breach of fiduciary duties as directors, except liability for:
- •
- any breach of the director's duty of loyalty to us or our stockholders;
- •
- any act or omission not in good faith or that involves intentional misconduct or a knowing violation of law;
- •
- unlawful payments of dividends or unlawful stock repurchases or redemptions as provided in Section 174 of the
Delaware General Corporation Law; or
- •
- any transaction from which the director derived an improper personal benefit.
Our amended and restated certificate of incorporation that will become effective upon the completion of this offering, provides that we indemnify our directors to the fullest extent permitted by Delaware law. In addition, our amended and restated bylaws, that will become effective upon the completion of this offering, provide that we indemnify our directors and officers to the fullest extent permitted by Delaware law. Our amended and restated bylaws, that will become effective upon the completion of this offering, also provide that we shall advance expenses incurred by a director or officer in advance of the final disposition of any action or proceeding, and permit us to secure insurance on behalf of any officer, director, employee or other agent for any liability arising out of his or her actions in that capacity, regardless of whether we would otherwise be permitted to indemnify him or her under the provisions of Delaware law. We have entered and expect to continue to enter into agreements to indemnify our directors, executive officers and other employees as determined by the Board of Directors. With certain exceptions, these agreements provide for indemnification for related expenses including, among others, attorneys' fees, judgments, fines and settlement amounts incurred by any of these individuals in any action or proceeding. We believe that these bylaw
129
provisions and indemnification agreements are necessary to attract and retain qualified persons as directors and officers. We also maintain directors' and officers' liability insurance.
The limitation of liability and indemnification provisions in our amended and restated certificate of incorporation and bylaws, that will become effective upon the completion of this offering, may discourage stockholders from bringing a lawsuit against our directors for breach of their fiduciary duty of care. They may also reduce the likelihood of derivative litigation against our directors and officers, even though an action, if successful, might benefit us and other stockholders. Further, a stockholder's investment may be adversely affected to the extent that we pay the costs of settlement and damage awards against directors and officers. At present, there is no pending litigation or proceeding involving any of our directors, officers or employees for which indemnification is sought, and we are not aware of any threatened litigation that may result in claims for indemnification.
130
Certain relationships and related party transactions
Since January 1, 2008, there has not been, nor is there currently proposed, any transaction or series of similar transactions to which we were or are a party in which the amount involved exceeded or exceeds $120,000 and in which any of our directors, executive officers, holders of more than 5% of any class of our voting securities, or any member of the immediate family of any of the foregoing persons, had or will have a direct or indirect material interest, other than compensation arrangements with directors and executive officers, which are described where required under the "Management" section of this prospectus, and the transactions described below.
Private placement financings
Bridge financing
In February 2008, we sold an aggregate of $4,122,500 in subordinated convertible promissory notes, which contained the following terms: (a) an interest of rate of 6.0% per annum; (b) a maturity date of the earlier of (i) February 20, 2009 or (ii) upon or after the occurrence of an event of default under the terms of such notes; and (c) conversion into equity securities sold in a qualified equity financing at a per security price equal to (i) 100.0% of the price per security if such financing occurred within 90 days of February 20, 2008; (ii) 90.0% of the price per security if such financing occurred within 180 days of February 20, 2008, or (iii) 80.0% of the price per security if such financing occurred more than 180 days after February 20, 2008. Of that amount, we sold $2,714,300 in subordinated convertible promissory notes to investors that are our affiliates, including entities affiliated with Jerusalem Venture Partners, entities affiliated with Sprout Venture Capital entities affiliated with Birchmere Ventures entities affiliated with Soros Fund Management and entities affiliated with TL Ventures. On July 24, 2008, all holders of subordinated convertible promissory notes elected to convert their notes into shares of our Series C Preferred Stock in accordance with their terms. Immediately prior to such conversion, $4,122,500 in principal and $105,039.04 in accrued interest were outstanding under the subordinated convertible promissory notes.
Series C financing
In July 2008 and September 2008, we sold 2,228,666 shares of our Series C preferred stock at an average price of $19.06 per share for an aggregate price of $42,492,842 including, with respect to a portion of the shares, the conversion of outstanding convertible promissory notes issued in 2007 and 2008 with a 10% to 20% discount on the exercise prices. Of that amount, we sold 486,244 shares of our Series C preferred stock for an aggregate price of $5,895,169.28 to investors that are our affiliates, including entities affiliated with Jerusalem Venture Partners (at a per share price of $12.14 for an aggregate purchase price of $1,931,611.13), entities affiliated with Sprout Venture Capital (at a per share price of $12.14 for an aggregate purchase price of $1,115,679.59), entities affiliated with Soros Fund Management (at a per share price of $12.14 for an aggregate purchase price of $1,116,187.63), entities affiliated with TL Ventures (at a per share price of $12.14 for an aggregate purchase price of $1,004,971.76) and entities affiliated with Birchmere Ventures (at a per share price of $12.07 for an aggregate purchase price of $726,719.17).
131
Series C-1 financing
In January 2011, we sold 7,692,307 shares of our Series C-1 preferred stock at a price of $6.50 per share for an aggregate price of $49,999,995. Of that amount, we sold 7,343,846 shares of our Series C-1 preferred stock for an aggregate price of $47,734,999 to investors that are our affiliates, including entities affiliated with Jerusalem Venture Partners, entities affiliated with Sprout Venture Capital, and entities affiliated with Birchmere Ventures.
The following table sets forth the convertible promissory notes issued in our bridge financing in February 2008 and the number of shares and total purchase prices of our Series C Preferred Stock and Series C-1 Preferred Stock issued in July 2008 and January 2011, respectively, to our 5% stockholders and their affiliates:
| Name (1) |
February 2008 Subordinated Convertible Promissory Notes |
Shares of Series C Preferred Stock |
Total Purchase Price of Series C Preferred Stock(2) |
Shares of Series C-1 Preferred Stock |
Total Purchase Price of Series C-1 Preferred Stock |
|||||||||||
|---|---|---|---|---|---|---|---|---|---|---|---|---|---|---|---|---|
Entities affiliated with Jerusalem Venture Partners (3) |
$ | 891,825 | 159,297 | $ | 1,931,611 | 6,316,237 | $ | 41,055,541 | ||||||||
Entities affiliated with Sprout Venture Capital (4) |
$ | 522,391 | 91,936 | $ | 1,115,680 | 769,231 | $ | 5,000,002 | ||||||||
Birchmere Ventures III, LP |
$ | 307,138 | 60,214 | $ | 726,719 | 258,378 | $ | 1,679,457 | ||||||||
Entities affiliated with Soros Fund Management (5) |
$ | 522,391 | 91,979 | $ | 1,116,188 | |||||||||||
Entities affiliated with TL Ventures (6) |
$ | 470,555 | 82,815 | $ | 1,004,972 | |||||||||||
(1) See "Principal Stockholders" for more information about shares held by certain of these entities.
(2) Includes the conversion of subordinated convertible promissory notes issued in 2007 and 2008.
(3) Consists of 2,490 shares of our Series C Preferred Stock purchased by Jerusalem Venture Partners (Israel), L.P.; a subordinated convertible promissory note in the principal amount of $15,606 and 1,984 shares of our Series C Preferred Stock purchased by Jerusalem Venture Partners III (Israel), L.P.; a subordinated convertible promissory note in the principal amount of $42,931 and 5,460 shares of our Series C Preferred Stock purchased by Jerusalem Venture Partners Entrepreneur Fund III, L.P.; a subordinated convertible promissory note in the principal amount of $558,288 and 71,010 shares of our Series C Preferred Stock purchased by Jerusalem Venture Partners III, L.P.; a subordinated convertible promissory note in the principal amount of $150,000 and 38,923 shares of our Series C Preferred Stock purchased by Jerusalem Venture Partners, L.P.; a subordinated convertible promissory note in the principal amount of $125,000 and 39,430 shares of our Series C Preferred Stock purchased by JVP III Annex Fund, L.P.; and 6,316,237 shares of our Series C-1 Preferred Stock purchased by JVP Opportunity Fund, L.P.
(4) Consists of a subordinated convertible promissory note in the principal amount of $463,597.68 and 81,590 shares of our Series C Preferred Stock purchased by CyOptics I LLC; a subordinated convertible promissory note in the principal amount of $29,828.53 and 5,249 shares of our Series C Preferred Stock purchased by CyOptics II LLC; a subordinated convertible promissory note in the principal amount of $1,514.93 and 266 shares of our Series C Preferred Stock, and 2,230 shares of our Series C-1 Preferred Stock purchased by DLJ Capital Corporation; a subordinated convertible promissory note in the principal amount of $27,449.86 and 4,831 shares of our Series C Preferred Stock, and 40,420 shares of our Series C-1 Preferred Stock purchased by Sprout Venture Capital L.P.; 43,923 shares of our Series C-1 Preferred Stock purchased by DLJ EXC II, L.P; and 682,658 shares of our Series C-1 Preferred Stock purchases by Sprout Capital VIII, L.P.
(5) Consists of a subordinated convertible promissory note in the principal amount of $85,972.49 and 15,130 shares of our Series C Preferred Stock purchased by SFM Domestic Investment LLC and a subordinated convertible promissory note in the principal amount of $436,656.51 and 76,849 shares of our Series C Preferred Stock purchased by Tapot LLC.
132
(6) Consists of a subordinated convertible promissory note in the principal amount of $8,000.39 and 1,408 shares of our Series C Preferred Stock purchased by TL Ventures V Interfund L.P. and a subordinated convertible promissory note in the principal amount of $462,554.61 and 81,407 shares of our Series C Preferred Stock purchased by TL Ventures V L.P.
Investor rights agreement
In connection with our Series C-1 financing described above, we entered into an amended and restated investor rights agreement with our preferred stockholders, including entities affiliated with Jerusalem Venture Partners, entities affiliated with Sprout Venture Capital, entities affiliated with Soros Fund Management, entities affiliated with TL Ventures and entities affiliated with Birchmere Ventures. The amended and restated investor rights agreement, among other things:
- •
- grants such stockholders customary demand and "piggy-back" registration rights with respect to shares of our common stock
issuable upon conversion of the shares of the preferred stock held by them;
- •
- provides for the voting of shares with respect to the constituency of the board of directors;
- •
- grants our major investors a right of first offer with respect to sales of our shares by us, subject to specified
exclusions (which exclusions are expected to include the sale of the shares pursuant to this prospectus);
- •
- obligates us to deliver periodic financial statements to our major investors; and
- •
- grants Finisar Corporation, or Finisar, one of our stockholders and our largest customer in 2010, the right of first refusal with respect to any proposed offer from a non-affiliated third party that would result in a change of control. Finisar will have 10 days following receipt of a third-party offer notice to submit to us a written offer to acquire the company in a sale transaction on terms and conditions at least as favorable to us and our stockholders as those proposed by the third-party offer. In addition, Finisar has a right of first offer in the event we seek to initiate a sale process with one or more non-affiliated prospective third party purchasers. Finisar will have seven days following receipt of a notice from us to determine whether it wants to enter into a 37-day exclusive negotiation period to discuss acquiring us in a sale transaction. The parties would need to negotiate in good faith. If no deal is reached, any sale transaction by a third party would remain subject to Finisar's right of first refusal. Both the right of first refusal and the right of first offer shall terminate and cease to be of further force and effect immediately upon the consummation of the offering contemplated by this prospectus.
In addition, under the agreement, Finisar has a right of first negotiation in the event we seek to solicit, encourage, pursue or negotiate an offer from a non-affiliated third-party purchaser to effect a sale of the company, or a Targeted Solicitation. In the event our board of directors has resolved to pursue a Targeted Solicitation, we must deliver to Finisar a notice describing the material terms and conditions of the solicited sale transaction. Finisar then has five days to deliver a negotiation notice if it desires to initiate a process to make an offer to acquire the company. If Finisar fails to deliver the notice, we may proceed towards consummating a Targeted Solicitation. If Finisar delivers the notice, we may not enter into an exclusive negotiating or standstill agreement with any third party for 25 days, during which we are required to negotiate with Finisar in good faith towards effecting a sale transaction. If we are unable to come to an agreement with Finisar during this period, we may enter into a sale transaction in respect of the Targeted Solicitation within the next 12 months, subject to certain extensions if we have entered into an agreement and are working in good faith to consummate the sale transaction. In the event we enter into a letter of intent with Finisar
133
regarding a sale transaction, the agreement must include a reasonable break-up fee in favor of Finisar and a reasonable exclusive negotiating or standstill period. For the sake of clarity, Finisar's right of first negotiation does not compel us to enter into a sale transaction with Finisar. The right of first negotiation described in this paragraph does not have a specified termination date.
The registration rights set forth in the amended and restated investor rights agreement terminate upon the five year anniversary of this offering or, as to any holder that, together with its affiliates, holds less than 1% of our outstanding common stock, the earlier time in which all shares can be sold by the holder in a three-month period without registration in compliance with Rule 144. The covenants in the agreement regarding delivery of financial statements, the right of first offer and the voting of shares for our board of directors terminate upon the closing of the offering.
This is not a complete description of the amended and restated investor rights agreement and is qualified by the full text of the 2011 Amended and Restated Investor Rights Agreement filed as an exhibit to the registration statement of which this prospectus is a part.
For more information regarding this agreement, please refer to "Description of capital stock—Registration rights."
Co-sale agreement
In connection with our Series C-1 financing described above, we entered into an amended and restated co-sale agreement with our preferred stockholders, including entities affiliated with Jerusalem Venture Partners, entities affiliated with Sprout Venture Capital, entities affiliated with Soros Fund Management, entities affiliated with TL Ventures and entities affiliated with Birchmere Ventures. This agreement grants our major investors customary rights of first refusal and co-sale rights with respect to proposed transfers of our securities by other major investors. This agreement automatically terminates upon this offering.
Share Repurchase
In connection with our Series C-1 financing described above, we repurchased 2,785,585 shares of our Series B-3 Preferred Stock and 1,392,792 shares of our Series C Preferred Stock from Pirelli & C. S.p.A., or Pirelli, for a total consideration of $23.5 million. Pirelli acquired the shares in connection with its $20.0 million cash investment in our Series C Preferred Stock and our acquisition from Pirelli of PGT Photonics S.p.A. , or PGT, in July 2008 for aggregate consideration of $47.2 million, which consisted of $34.8 million of our Series B-3 Preferred Stock and $12.4 million of Series C Preferred Stock. Prior to our repurchase, Pirelli held approximately 18.0% of our outstanding capital stock. Following the repurchase, Pirelli no long held any shares of our capital stock.
Product Sales and Purchase Transactions with Certain Investors
During 2010, 2009 and 2008, we entered into various transactions for the purchase of our products in the ordinary course of business by Finisar, one of our stockholders. We recognized $16.5 million, $11.1 million and $8.0 million of revenue pursuant to such sales during the years ended December 31, 2010, 2009 and 2008, respectively.
During 2010, 2009 and 2008, we also entered into various transactions for the purchase of various raw materials and other supplies in the ordinary course of business from Finisar. We incurred $4.6 million, $1.3 million and $1.3 million of expenses pursuant to such purchases during the years ended December 31, 2010, 2009 and 2008, respectively.
134
Stock option awards
Various stock option grants to our directors and executive officers and related option grant policies are described above in this prospectus under the caption "Management."
Employment agreements
We have entered into employment agreements and/or offer letters containing compensation, termination and change of control provisions with, among others, Ettore J. Coringrato, Jr., our President and Chief Executive Officer, as described under the caption "Executive compensation—Employment agreements and potential payments upon termination or change in control" above.
Indemnification of officers and directors
We have also entered into indemnification agreements with each of our directors and executive officers. The indemnification agreements and our certificate of incorporation and bylaws require us to indemnify our directors and executive officers to the fullest extent permitted by Delaware law. See "Management—Limitations on liability and indemnification matters" above.
Policies and Procedures for Related Party Transactions
We have adopted a formal policy that our executive officers, directors and principal stockholders, including their immediate family members and affiliates, are not permitted to enter into a related party transaction with us without the prior consent of our audit committee, or other independent members of our board of directors in the case it is inappropriate for our audit committee to review such transaction due to a conflict of interest. Any request for us to enter into a transaction with an executive officer, director, principal stockholder or any of such persons' immediate family members or affiliates, in which the amount involved exceeds $120,000, must first be presented to our audit committee for review, consideration and approval. All of our directors, executive officers and employees are required to report to our audit committee any such related party transaction. In approving or rejecting the proposed agreement, our audit committee shall consider the relevant facts and circumstances available and deemed relevant to the audit committee, including, but not limited to the risks, costs and benefits to us, the terms of the transaction, the availability of other sources for comparable services or products and, if applicable, the impact on a director's independence. Our audit committee shall approve only those agreements that, in light of known circumstances, are in, or are not inconsistent with, our best interests, as our audit committee determines in the good faith exercise of its discretion.
All of the transactions described above were entered into prior to the adoption of this policy. Accordingly, each was approved by disinterested members of our board of directors after making a determination that the transaction was executed on terms no less favorable than those that could have been obtained from an unrelated third party.
135
The following table sets forth information regarding beneficial ownership of our common stock as of June 30, 2011 and as adjusted to reflect the shares of common stock to be issued and sold in the offering assuming no exercise of the underwriters' over-allotment option, by:
- •
- each person or group of affiliated persons known by us to be the beneficial owner of more than 5% of our common stock;
- •
- each of our named executive officers;
- •
- each of our directors; and
- •
- all executive officers and directors as a group.
We have determined beneficial ownership in accordance with SEC rules. The information does not necessarily indicate beneficial ownership for any other purpose. Under these rules, the number of shares of common stock deemed outstanding includes shares issuable upon exercise of options and warrants held by the respective person or group which may be exercised or converted within 60 days after June 30, 2011. For purposes of calculating each person's or group's percentage ownership, stock options and warrants exercisable within 60 days after June 30, 2011 are included for that person or group but not the stock options or warrants of any other person or group.
Applicable percentage ownership is based on 14,359,377 shares of common stock outstanding at June 30, 2011, assuming the automatic conversion of (i) all outstanding shares of our Series A Preferred Stock, Series B Preferred Stock, Series B-2 Preferred Stock, Series C Preferred Stock and Series C-1 Preferred Stock on a one-for-one basis into 12,399,825 shares of common stock and (ii) all outstanding shares of our Series B-1 Preferred Stock on a one for 1.161144499 basis into 665,013 shares of common stock. For purposes of the table below, we have assumed that shares of common stock will be outstanding upon completion of this offering, based upon an assumed initial public offering price of $ per share.
Unless otherwise indicated and subject to applicable community property laws, to our knowledge, each stockholder named in the following table possesses sole voting and investment power over the shares listed. Unless otherwise noted below, the address of each
136
person listed on the table is c/o CyOptics, Inc., 9999 Hamilton Boulevard, Breinigsville, PA 18031.
| |
Shares beneficially owned prior to the offering |
Shares beneficially owned after the offering |
||||||||||||
|---|---|---|---|---|---|---|---|---|---|---|---|---|---|---|
| Name and address of beneficial owner |
Shares |
Percentage |
Shares |
Percentage |
||||||||||
5% stockholders: |
||||||||||||||
Funds affiliated with Jerusalem Venture Partners(1) |
7,810,984 | 54.4% | 7,810,984 | |||||||||||
Funds affiliated with Sprout Capital(2) |
1,556,036 | 10.8% | 1,556,036 | |||||||||||
Funds affiliated with Soros Fund Management LLC(3) |
787,265 | 5.5% | 787,265 | |||||||||||
Funds affiliated with TL Ventures(4) |
750,690 | 5.2% | 750,690 | |||||||||||
Named executive officers and directors: |
||||||||||||||
Ettore J. Coringrato, Jr.(5) |
27,860 | * | 27,860 | |||||||||||
Matthew C. Riley(6) |
17,326 | * | 17,326 | |||||||||||
Warren D. Barratt |
— | — | — | |||||||||||
Leonard J.P. Ketelsen(7) |
11,557 | * | 11,557 | |||||||||||
Joseph P. Keska(8) |
9,633 | * | 9,633 | |||||||||||
Stefan M. Rochus(9) |
4,825 | * | 4,825 | |||||||||||
Mark J. DeNino(10) |
750,690 | 5.2% | 750,690 | |||||||||||
Robert Finzi(11) |
1,556,036 | 10.8% | 1,556,036 | |||||||||||
Erel N. Margalit(12) |
7,810,984 | 54.4% | 7,810,984 | |||||||||||
John V. Pilitsis(13) |
42,786 | * | 42,786 | |||||||||||
Sean D.S. Sebastian(14) |
692,416 | 4.8% | 692,416 | |||||||||||
Noah D. Yago |
— | * | — | |||||||||||
All directors and executive officers as a group(15) |
10,924,113 | 76.0% | 10,924,113 | |||||||||||
(*) Represents beneficial ownership of less than 1%.
(1) Includes (i) 356,048 shares held by Jerusalem Venture Partners, L.P., (ii) 333,252 shares held by Jerusalem Venture Partners III, L.P., (iii) 220,277 shares held by Jerusalem Venture Partners IV, L.P., (iv) 1,857 shares held by Jerusalem Venture Partners IV-A, L.P., (v) 1,972 shares held by Jerusalem Venture Partners Entrepreneurs Fund IV, L.P., (vi) 25,628 shares held by Jerusalem Venture Partners Entrepreneur Fund III, L.P., (vii) 31,140 shares held by Jerusalem Venture Partners (Israel), L.P., (viii) 9,315 shares held by Jerusalem Venture Partners III (Israel), L.P., (ix) 5,299 shares held by Jerusalem Venture Partners IV (Israel), L.P., (x) 509,959 shares held by JVP III Annex Fund, L.P., and (xi) 6,316,237 shares held by JVP Opportunity Fund, L.P., as nominee for itself, JVP Opportunity Fund-A, L.P., JVP Opportunity Entrepreneur Fund, L.P., Jerusalem Venture Partners IV, L.P., Jerusalem Venture Partners IV-A, L.P., Jerusalem Venture Partners Entrepreneurs Fund IV, L.P., Jerusalem Venture Partners IV (Israel), L.P., JVP IV Annex Fund, L.P., JVP IV Annex Entrepreneur Fund, L.P., JVP Media V, L.P., JVP Media V Entrepreneur Fund, L.P. and JVP Media V (Israel), L.P. Jerusalem Partners, L.P. is the general partner of Jerusalem Venture Partners, L.P. and may be deemed to have sole voting and dispositive power with respect to shares held by that fund. J.V.P. Jerusalem Venture Partners (Israel) Management Ltd. is the general partner of Jerusalem Venture Partners (Israel), L.P. and may be deemed to have sole voting and dispositive power with respect to shares held by that fund. Jerusalem Partners III, L.P. is the general partner of Jerusalem Venture Partners III, L.P. and Jerusalem Venture Partners Entrepreneur Fund III, L.P. and may be deemed to have sole voting and dispositive power with respect to shares held by those funds. Jerusalem Venture Partners III (Israel) Management Company Ltd. is the general partner of Jerusalem Venture Partners III (Israel), L.P. and may be deemed to have sole voting and dispositive power with respect to shares held by that fund. Jerusalem Annex Partners III, L.P. is the general partner of JVP III Annex Fund, L.P. and may be deemed to have sole voting and dispositive power with respect to shares held by that fund. Jerusalem Partners IV, L.P. is the general partner of Jerusalem Venture Partners IV, L.P., Jerusalem Venture Partners IV-A, L.P. and Jerusalem Venture Partners Entrepreneurs Fund IV, L.P. and may be deemed to have sole voting and dispositive power with respect to shares held by those funds. Jerusalem Partners—Venture Capital, L.P. is the general partner of Jerusalem Venture Partners IV (Israel), L.P. and may be deemed to have sole voting and dispositive power with respect to shares held by that fund. JP Media V, L.P. is the general partner of JVP IV Annex Fund, L.P., JVP IV Annex Entrepreneur Fund, L.P., JVP Media V, L.P., JVP Media V Entrepreneur Fund, L.P. and JVP Media V (Israel), L.P. and may be deemed to have sole voting and dispositive power with
137
respect to shares held by those funds. JP Opportunity Fund, L.P. is the general partner of JVP Opportunity Fund, L.P., JVP Opportunity Fund-A, L.P. and JVP Opportunity Entrepreneur Fund, L.P. and may be deemed to have sole voting and dispositive power with respect to shares held by each fund of which it is a general partner. Jerusalem Venture Partners Corporation is the general partner of Jerusalem Partners, L.P., Jerusalem Partners III, L.P. and Jerusalem Annex Partners III, L.P. and may be deemed to have sole voting and dispositive power with respect to the shares held by those funds. JVP Corp IV is the general partner of Jerusalem Partners IV, L.P., JP Media V, L.P. and JP Opportunity Fund and may be deemed to have sole voting and dispositive power with respect to the shares held by those funds. The mailing address of the individuals and entities related to Jerusalem Venture Partners is 156 Fifth Avenue, Suite 410, New York, NY 10010.
(2) Includes 697,568 shares held by CyOptics I LLC, 45,615 shares held by CyOptics II LLC, 682,658 shares held by Sprout Capital VIII, L.P., 81,762 shares held by Sprout Venture Capital L.P., 4,510 shares held by DLJ Capital Corporation and 43,923 shares held by DLJ ESC II, L.P. The mailing address of Sprout Capital is 11 Madison Avenue, 13th Floor New York, NY 10010.
(3) Includes 657,761 shares held by Tapot LLC ("Tapot"), a Delaware limited liability company, and 129,504 shares held by SFM Domestic Investments LLC ("SFMD"), a Delaware limited liability company. Quantum Industrial Partners LDC ("QIP"), an exempted limited duration company formed under the laws of the Cayman Islands, is the sole member and manager of Tapot. QIH Management Investor, L.P. ("QIHMI"), an investment advisory firm organized as a Delaware limited partnership, is a minority stockholder of, and is vested with investment discretion with respect to portfolio assets held for the account of QIP. The sole general partner of QIHMI is QIH Management LLC ("QIH Management"), a Delaware limited liability company. Soros Fund Management LLC ("SFM"), a Delaware limited liability company, is the sole managing member of QIH Management. SFM is also the manager of SFMD. George Soros serves as Chairman of SFM, Robert Soros serves as Deputy Chairman of SFM, and Jonathan Soros serves as President and Deputy Chairman of SFM. The principal address of SFM is at 888 Seventh Avenue, 33rd Floor, New York, New York 10106.
(4) Includes 12,762 shares held by TL Ventures V Interfund L.P. and 737,928 shares held by TL Ventures V, L.P., including the conversion of certain shares of Series B-1 Preferred Stock into common stock at a conversion ratio of 1.161144499 per share. TL Ventures V LLC is the general partner of TL Ventures V Interfund, L.P. and TL Ventures V Management L.P., which is the general partner of TL Ventures V, L.P. and may be deemed to have sole voting and dispositive power with respect to shares held by each fund of which it is a general partner. The mailing address of TL Ventures is 435 Devon Park Drive, 700 Building, Wayne, PA 19087.
(5) Includes options to purchase 27,860 shares of common stock that are exercisable within 60 days of June 30, 2011.
(6) Includes options to purchase 17,326 shares of common stock that are exercisable within 60 days of June 30, 2011.
(7) Includes options to purchase 11,557 shares of common stock that are exercisable within 60 days of June 30, 2011.
(8) Includes options to purchase 9,633 shares of common stock that are exercisable within 60 days of June 30, 2011.
(9) Includes options to purchase 4,825 shares of common stock that are exercisable within 60 days of June 30, 2011.
(10) Includes 12,762 shares held by TL Ventures V Interfund L.P. and 737,928 shares held by TL Ventures V, L.P., including the conversion of certain shares of Series B-1 Preferred Stock into common stock at a conversion ratio of 1.161144499 per share. TL Ventures V LLC is the general partner of TL Ventures V Interfund, L.P. and TL Ventures V Management L.P., which is the general partner of TL Ventures V, L.P. and may be deemed to have sole voting and dispositive power with respect to shares held by each fund of which it is a general partner. Mr. DeNino, a member of our board of directors, is a managing director of TL Ventures and may be deemed to have sole voting and dispositive power with respect to the shares held by funds related to TL Ventures. Mr. DeNino disclaims beneficial ownership of all such shares except to the extent of his pecuniary interest therein.
(11) Includes 697,568 shares held by CyOptics I LLC, 45,615 shares held by CyOptics II LLC, 682,658 shares held by Sprout Capital VIII, L.P., 81,762 shares held by Sprout Venture Capital L.P., 4,510 shares held by DLJ Capital Corporation, 43,923 shares held by DLJ ESC II, L.P. Mr. Finzi is a member of our board of directors, is the managing director of Sprout Group, and may be deemed to have sole voting and dispositive power with respect to the shares held by Sprout Group-related funds. Mr. Finzi disclaims beneficial ownership to all such shares except to the extent of his pecuniary interest therein.
(12) Includes (i) 356,048 shares held by Jerusalem Venture Partners, L.P., (ii) 333,252 shares held by Jerusalem Venture Partners III, L.P., (iii) 220,277 shares held by Jerusalem Venture Partners IV, L.P., (iv) 1,857 shares held by Jerusalem Venture Partners IV-A, L.P., (v) 1,972 shares held by Jerusalem Venture Partners Entrepreneurs Fund IV, L.P., (vi) 25,628 shares held by Jerusalem Venture Partners Entrepreneur Fund III, L.P., (vii) 31,140 shares held by Jerusalem Venture Partners (Israel), L.P., (viii) 9,315 shares held by Jerusalem Venture Partners III (Israel), L.P., (ix) 5,299 shares held by Jerusalem Venture Partners IV (Israel), L.P., (x) 509,959 shares held by JVP III Annex Fund, L.P., and (xi) 6,316,237 shares held by JVP Opportunity Fund, L.P., as nominee for itself, JVP Opportunity Fund-A, L.P., JVP Opportunity Entrepreneur Fund L.P., Jerusalem Venture Partners IV, L.P., Jerusalem Venture Partners IV-A, L.P., Jerusalem Venture Partners Entrepreneurs Fund IV, L.P., Jerusalem Venture Partners IV (Israel), L.P., JVP IV Annex Fund, L.P., JVP IV Annex Entrepreneur Fund, L.P., JVP Media V, L.P., JVP Media V Entrepreneur Fund, L.P. and JVP Media V (Israel), L.P. Jerusalem Partners, L.P. is the general partner of Jerusalem Venture Partners, L.P. and may be deemed to have sole voting and dispositive power with respect to shares held by that fund. J.V.P. Jerusalem Venture Partners (Israel) Management Ltd. is the general partner of Jerusalem Venture Partners (Israel), L.P. and may be deemed to have sole voting and dispositive power with respect to shares held by that fund. Jerusalem Partners III, L.P. is the general partner of Jerusalem Venture Partners III, L.P. and Jerusalem Venture Partners Entrepreneur Fund III, L.P. and may be deemed to have sole voting and dispositive power with respect to shares held by those funds. Jerusalem Venture Partners III (Israel) Management Company Ltd. is the general partner of Jerusalem Venture Partners III (Israel), L.P. and may be deemed to have sole voting and dispositive power with respect to shares held by that fund. Jerusalem Annex Partners III, L.P. is the general partner of JVP III Annex Fund, L.P. and may be deemed to have sole voting and dispositive power with respect to shares held by that fund. Jerusalem Partners IV, L.P. is the general partner of Jerusalem Venture Partners IV, L.P., Jerusalem Venture Partners IV-A, L.P. and Jerusalem
138
Venture Partners Entrepreneurs Fund IV, L.P. and may be deemed to have sole voting and dispositive power with respect to shares held by those funds. Jerusalem Partners—Venture Capital, L.P. is the general partner of Jerusalem Venture Partners IV (Israel), L.P. and may be deemed to have sole voting and dispositive power with respect to shares held by that fund. JP Media V, L.P. is the general partner of JVP IV Annex Fund, L.P., JVP IV Annex Entrepreneur Fund, L.P., JVP Media V, L.P., JVP Media V Entrepreneur Fund, L.P. and JVP Media V (Israel), L.P. and may be deemed to have sole voting and dispositive power with respect to shares held by those funds. JP Opportunity Fund, L.P. is the general partner of JVP Opportunity Fund, L.P., JVP Opportunity Fund-A, L.P. and JVP Opportunity Entrepreneur Fund, L.P. and may be deemed to have sole voting and dispositive power with respect to shares held by each fund of which it is a general partner. Jerusalem Venture Partners Corporation is the general partner of Jerusalem Partners, L.P., Jerusalem Partners III, L.P. and Jerusalem Annex Partners III, L.P. and may be deemed to have sole voting and dispositive power with respect to the shares held by those funds. JVP Corp IV is the general partner of Jerusalem Partners IV, L.P., JP Media V, L.P. and JP Opportunity Fund and may be deemed to have sole voting and dispositive power with respect to the shares held by those funds. Dr. Margalit, a member of our board of directors, is a director of Jerusalem Venture Partners Corporation, J.V.P. Jerusalem Venture Partners (Israel) Management Ltd., Jerusalem Venture Partners III (Israel) Management Company Ltd., and JVP Corp IV and may be deemed to have sole voting and dispositive power with respect to the shares. Dr. Margalit disclaims beneficial ownership of all such shares.
(13) Includes options to purchase 35,094 shares of common stock that are exercisable within 60 days of June 30, 2011.
(14) Includes 692,416 shares held by Birchmere Ventures III, LP. Mr. Sebastian, a member of our board of directors, is a partner of Birchmere Ventures and may be deemed to have sole voting and dispositive power with respect to the shares held by funds related to Birchmere Ventures except to the extent of his pecuniary interest therein.
(15) Consists of (i) 10,817,818 shares held of record by the current directors and executive officers; and (ii) 106,295 shares exercisable within 60 days of June 30, 2011, all of which are vested.
139
General
The following is a summary of the rights of our common stock and preferred stock and certain provisions of our amended and restated certificate of incorporation and amended and restated bylaws, as they will be in effect upon the completion of this offering. For more detailed information, please see our amended and restated certificate of incorporation and bylaws, which are filed as exhibits to the registration statement of which this prospectus is a part.
Immediately following the completion of this offering, our authorized capital stock will consist of 525,000,000 shares, with a par value of $0.001 per share, of which:
- •
- 500,000,000 shares are designated as common stock, and
- •
- 25,000,000 shares are designated as preferred stock.
At June 30, 2011, assuming the conversion of all outstanding shares of our convertible preferred stock into common stock, we had outstanding 14,359,377 shares of common stock, held of record by 142 stockholders.
Common stock
The holders of our common stock are entitled to one vote per share on all matters to be voted on by the stockholders. Subject to preferences that may be applicable to any outstanding shares of preferred stock, holders of common stock are entitled to receive ratably such dividends as may be declared by the board of directors out of funds legally available therefor. In the event we liquidate, dissolve or wind up, holders of common stock are entitled to share ratably in all assets remaining after payment of liabilities and the liquidation preferences of any outstanding shares of preferred stock. Holders of common stock have no preemptive, conversion or subscription rights. There are no redemption or sinking fund provisions applicable to the common stock. All outstanding shares of common stock are, and all shares of common stock to be outstanding upon completion of this offering will be, fully paid and non-assessable.
Preferred stock
Our board of directors has the authority, without further action by the stockholders, to issue from time to time the preferred stock in one or more series, to fix the number of shares of any such series and the designation thereof and to fix the rights, preferences, privileges and restrictions granted to or imposed upon such preferred stock, including dividend rights, dividend rate, conversion rights, voting rights, rights and terms of redemption, redemption prices, liquidation preference and sinking fund terms, any or all of which may be greater than or senior to the rights of the common stock. The issuance of preferred stock could adversely affect the voting power of holders of common stock and reduce the likelihood that such holders will receive dividend payments and payments upon liquidation. Such issuance could have the effect of decreasing the market price of the common stock. The issuance of preferred stock or even the ability to issue preferred stock could have the effect of delaying, deterring or preventing a change in control. We have no present plans to issue any shares of preferred stock.
140
Warrants
As of June 30, 2011, we had outstanding warrants to purchase 6,301 shares of Series B-1 Preferred Stock at any exercise price of approximately $16.00 per share, which represents 7,316 shares of Common Stock on an as converted basis, 18,691 shares of Series B Preferred Stock at an exercise price of approximately $8.02 per share, and 31 shares of common stock at an exercise price of approximately $4.16 per share. Each warrant contains provisions for the adjustment of the exercise price and the number of shares issuable upon the exercise of the warrant in the event of certain stock dividends, stock splits, reclassifications and consolidations. Upon the closing of this offering, the warrants will become exercisable for 26,038 shares of common stock.
Registration rights
The holders of an aggregate of 13,067,700 shares of our common stock and warrants to purchase 26,038 shares of our common stock, or their permitted transferees, are entitled to rights with respect to the registration of these shares under the Securities Act. These rights are provided under the terms of an investor rights agreement between us and the holders of these shares, and include demand registration rights, short-form registration rights and piggyback registration rights. All fees, costs and expenses of underwritten registrations will be borne by us and all selling expenses, including underwriting discounts and selling commissions, will be borne by the holders of the shares being registered.
Demand registration rights. The holders of an aggregate of 13,067,700 shares of our common stock and warrants to purchase 26,038 shares of our common stock, or their permitted transferees, are entitled to demand registration rights. Under the terms of the registration agreement, we will be required, upon the written request of holders of thirty percent (30%) or more of these shares, to use our commercial best efforts to register all or a portion of these shares for public resale. We are required to effect only two registrations pursuant to this provision of the registration agreement. We are not required to effect a demand registration prior to 180 days after the completion of this offering.
Short form registration rights. The holders of an aggregate of 13,067,700 shares of our common stock and warrants to purchase 26,038 shares of our common stock, or their permitted transferees, are also entitled to short form registration rights. If we are eligible to file a registration statement on Form S-3, these holders have the right, upon the written request of holders of thirty percent (30%) or more of these shares, to have such shares registered by us at our expense.
Piggyback registration rights. The holders of an aggregate of 13,067,700 shares of our common stock and warrants to purchase 26,038 shares of our common stock, or their permitted transferees, are entitled to piggyback registration rights. If we register any of our securities either for our own account or for the account of other security holders, the holders of these shares are entitled to include their shares in the registration. Subject to certain exceptions, we and the underwriters may limit the number of shares included in the underwritten offering if the underwriters believe that including these shares would adversely affect the offering.
141
Anti-takeover effects of Delaware law and our certificate of incorporation and bylaws
Upon completion of this offering, we will be subject to the provisions of Section 203 of the Delaware General Corporation Law. In general, Section 203 prohibits a publicly held Delaware corporation from engaging in a "business combination" with an "interested stockholder" for a three-year period following the time that this stockholder becomes an interested stockholder, unless the business combination is approved in a prescribed manner. Under Section 203, a business combination between a corporation and an interested stockholder is prohibited unless it satisfies one of the following conditions:
- •
- before the stockholder became interested, our board of directors approved either the business combination or the
transaction which resulted in the stockholder becoming an interested stockholder;
- •
- upon consummation of the transaction which resulted in the stockholder becoming an interested stockholder, the interested
stockholder owned at least 85% of the voting stock of the corporation outstanding at the time the transaction commenced, excluding for purposes of determining the voting stock outstanding, shares
owned by persons who are directors and also officers, and employee stock plans, in some instances, but not the outstanding voting stock owned by the interested stockholder; or
- •
- at or after the time the stockholder became interested, the business combination was approved by our board of directors and authorized at an annual or special meeting of the stockholders by the affirmative vote of at least two-thirds of the outstanding voting stock which is not owned by the interested stockholder.
Section 203 defines a business combination to include:
- •
- any merger or consolidation involving the corporation and the interested stockholder;
- •
- any sale, transfer, lease, pledge or other disposition involving the interested stockholder of 10% or more of the assets
of the corporation;
- •
- subject to exceptions, any transaction that results in the issuance of transfer by the corporation of any stock of the
corporation to the interested stockholder;
- •
- subject to exceptions, any transaction involving the corporation that has the effect of increasing the proportionate share
of the stock of any class or series of the corporation beneficially owned by the interested stockholder; and
- •
- the receipt by the interested stockholder of the benefit of any loans, advances, guarantees, pledges or other financial benefits provided by or through the corporation.
In general, Section 203 defines an interested stockholder as any entity or person beneficially owning 15% or more of the outstanding voting stock of the corporation and any entity or person affiliated with or controlling or controlled by the entity or person.
Certain provisions of Delaware law, our amended and restated certificate of incorporation and our bylaws contain provisions that could have the effect of delaying, deferring or discouraging another party from acquiring control of us. These provisions, which are summarized below,
142
may have the effect of discouraging coercive takeover practices and inadequate takeover bids. These provisions are also designed, in part, to encourage persons seeking to acquire control of us to first negotiate with our board of directors. We believe that the benefits of increased protection of our potential ability to negotiate with an unfriendly or unsolicited acquiror outweigh the disadvantages of discouraging a proposal to acquire us because negotiation of these proposals could result in an improvement of their terms.
Undesignated preferred stock. As discussed above, our board of directors has the ability to issue preferred stock with voting or other rights or preferences that could impede the success of any attempt to change control of us. These and other provisions may have the effect of deferring hostile takeovers or delaying changes in control or management of our company.
Limits on ability of stockholders to call a special meeting. Our bylaws provide that special meetings of the stockholders may be called only by the board of directors or a committee of the board of directors. A stockholder may not call a special meeting, which may delay the ability of our stockholders to force consideration of a proposal or for holders controlling a majority of our capital stock to take any action, including the removal of directors.
Requirements for advance notification of stockholder nominations and proposals. Our bylaws establish advance notice procedures with respect to stockholder proposals and the nomination of candidates for election as directors. However, our bylaws may have the effect of precluding the conduct of certain business at a meeting if the proper procedures are not followed. These provisions may also discourage or deter a potential acquiror from conducting a solicitation of proxies to elect the acquirer's own slate of directors or otherwise attempting to obtain control of our company.
No cumulative voting. The Delaware General Corporation Law provides that stockholders are not entitled to the right to cumulate votes in the election of directors unless our amended and restated certificate of incorporation provides otherwise. Our amended and restated certificate of incorporation and amended and restated bylaws do not expressly provide for cumulative voting.
Transfer agent and registrar
Upon the completion of this offering, the transfer agent and registrar for our common stock will be .
143
Shares eligible for future sale
Before this offering, there has not been a public market for shares of our common stock. Future sales of substantial amounts of shares of our common stock, including shares issued upon the exercise of outstanding options, in the public market after this offering, or the possibility of these sales occurring, could cause the prevailing market price for our common stock to fall or impair our ability to raise equity capital in the future.
Upon the completion of this offering, a total of shares of common stock will be outstanding, assuming that there are no exercises of options after June 30, 2011. Of these shares, all shares of common stock sold in this offering by us, plus any shares sold upon exercise of the underwriters' over-allotment option, will be freely tradable in the public market without restriction or further registration under the Securities Act, unless these shares are held by "affiliates," as that term is defined in Rule 144 under the Securities Act.
The remaining 14,359,377 shares of common stock will be "restricted securities," as that term is defined in Rule 144 under the Securities Act. These restricted securities are eligible for public sale only if they are registered under the Securities Act or if they qualify for an exemption from registration under Rules 144 or 701 under the Securities Act, which are summarized below.
Subject to the lock-up agreements described below and the provisions of Rules 144 and 701 under the Securities Act, these restricted securities will be available for sale in the public market as follows:
| Date |
Number of shares |
|
|---|---|---|
On the date of this prospectus |
||
Between and days after the date of this prospectus |
||
At various times beginning more than days after the date of this prospectus |
||
In addition, of the shares of our common stock that were subject to stock options outstanding as of June 30, 2011 options to purchase shares of common stock were exercisable as of June 30, 2011 and will be eligible for sale 90 days following the effective date of this offering (includes outstanding options under both our 1999 Stock Option Plan and our 2007 Stock Plan).
Lock-up agreements
We and all of our directors and officers, as well as the other holders of substantially all shares of common stock outstanding immediately prior to this offering, have agreed that, without the prior written consent of J.P. Morgan Securities LLC and Barclays Capital Inc., on behalf of the underwriters, we and they will not, during the period ending 180 days after the date of this prospectus:
- •
- offer, pledge, sell, contract to sell, sell any option or contract to purchase, purchase any option or contract to sell, grant any option, right or warrant to purchase, lend or otherwise transfer or dispose of, directly or indirectly, any shares of our common stock or any securities
144
convertible into or exercisable, or exchangeable for shares of our common stock or publicly disclose the intention to make any such offer, sale, pledge or disposition; or
- •
- enter into any swap or other arrangement that transfers to another, in whole or in part, any of the economic consequences of ownership of our common stock;
whether any transaction described above is to be settled by delivery of shares of our common stock or such other securities, in cash or otherwise. In addition, such directors, officers and stockholders have agreed further that, without the prior written consent of J.P. Morgan Securities LLC and Barclays Capital Inc., on behalf of the underwriters, they will not, during the same period make any demand for or exercise any right with respect to the registration of any shares of our common stock or any security convertible into or exercisable or exchangeable for common stock. The period may be extended by up to 34 days. This agreement is subject to certain exceptions, and is also subject to extension for up to additional days, as set forth in "Underwriting."
Rule 144
In general, under Rule 144 as currently in effect, once we have been subject to public company reporting requirements for at least 90 days, a person who is not deemed to have been one of our affiliates for purposes of the Securities Act at any time during 90 days preceding a sale and who has beneficially owned the shares proposed to be sold for at least six months, including the holding period of any prior owner other than our affiliates, is entitled to sell such shares without complying with the manner of sale, volume limitation or notice provisions of Rule 144, subject to compliance with the public information requirements of Rule 144. If such a person has beneficially owned the shares proposed to be sold for at least one year, including the holding period of any prior owner other than our affiliates, then such person is entitled to sell such shares without complying with any of the requirements of Rule 144.
In general, under Rule 144, as currently in effect, our affiliates or persons selling shares on behalf of our affiliates are entitled to sell upon expiration of the lock-up agreements described above, within any three-month period beginning 90 days after the date of this prospectus, a number of shares that does not exceed the greater of:
- •
- 1% of the number of shares of common stock then outstanding, which will equal
approximately shares
immediately after this offering; or
- •
- the average weekly trading volume of the common stock during the four calendar weeks preceding the filing of a notice on Form 144 with respect to such sale.
Sales under Rule 144 by our affiliates or persons selling shares on behalf of our affiliates are also subject to certain manner of sale provisions and notice requirements and to the availability of current public information about us.
Rule 701
Rule 701 generally allows a stockholder who purchased shares of our common stock pursuant to a written compensatory plan or contract and who is not deemed to have been an affiliate of our company during the immediately preceding 90 days to sell these shares in reliance upon Rule 144, but without being required to comply with the public information, holding period,
145
volume limitation or notice provisions of Rule 144. Rule 701 also permits affiliates of our company to sell their Rule 701 shares under Rule 144 without complying with the holding period requirements of Rule 144. All holders of Rule 701 shares, however, are required to wait until 180 days after the date of this prospectus before selling such shares pursuant to Rule 701.
As of June 30, 2011, shares of our outstanding common stock had been issued in reliance on Rule 701 as a result of exercises of stock options and stock awards. These shares will be eligible for resale in reliance on this rule upon expiration of the lockup agreements described above.
Stock options
We intend to file a registration statement on Form S-8 under the Securities Act covering all of the shares of our common stock subject to options outstanding or reserved for issuance under our stock plans and shares of our common stock issued upon the exercise of options by employees. We expect to file this registration statement as soon as practicable after this offering. In addition, we intend to file a registration statement on Form S-8 or such other form as may be required under the Securities Act for the resale of shares of our common stock issued upon the exercise of options that were not granted under Rule 701. We expect to file this registration statement as soon as permitted under the Securities Act. However, shares registered on Form S-8 that are held by our affiliates will be subject to volume limitations, manner of sale, notice and public information requirements of Rule 144 and all shares registered on Form S-8 will not be eligible for resale until expiration of the lock-up agreements to which they are subject.
Registration rights
Upon completion of this offering, the holders of 13,067,700 shares of our common stock and warrants to purchase 26,038 shares of our common stock or their respective transferees will be entitled to various rights with respect to the registration of these shares under the Securities Act. Registration of these shares under the Securities Act would result in these shares becoming fully tradable without restriction under the Securities Act immediately upon the effectiveness of the registration, except for shares purchased by affiliates. See "Description of capital stock—Registration rights" for additional information.
146
Material United States federal income tax and estate tax
consequences to non-U.S. holders
The following is a summary of the material U.S. federal income tax and estate tax consequences of the ownership and disposition of our common stock to non-U.S. holders, but does not purport to be a complete analysis of all the potential tax considerations relating thereto. This summary is based upon the provisions of the Internal Revenue Code of 1986, as amended (the "Code"), Treasury regulations promulgated thereunder, administrative rulings and judicial decisions, all as of the date hereof. These authorities may be changed, possibly retroactively, so as to result in U.S. federal income or estate tax consequences different from those set forth below.
This summary does not address the tax considerations arising under the laws of any non-U.S., state or local jurisdiction or under U.S. federal gift and estate tax laws, except to the limited extent below. In addition, this discussion does not address tax considerations applicable to an investor's particular circumstances or to investors that may be subject to special tax rules, including, without limitation:
- •
- banks, insurance companies or other financial institutions;
- •
- persons subject to the alternative minimum tax;
- •
- tax-exempt organizations;
- •
- controlled foreign corporations, passive foreign investment companies and corporations that accumulate earnings to avoid
United States federal income tax;
- •
- dealers in securities or currencies;
- •
- traders in securities that elect to use a mark-to-market method of accounting for their securities
holdings;
- •
- persons that own, or are deemed to own, more than five percent of our capital stock (except to the extent specifically set
forth below);
- •
- certain former citizens or long-term residents of the United States;
- •
- persons who hold our common stock as a position in a hedging transaction, "straddle," "conversion transaction" or other
risk reduction transaction;
- •
- persons who do not hold our common stock as a capital asset within the meaning of Section 1221 of the Code
(generally, for investment purposes); or
- •
- persons deemed to sell our common stock under the constructive sale provisions of the Code.
In addition, if a partnership or entity classified as a partnership for U.S. federal income tax purposes holds our common stock, the tax treatment of a partner generally will depend on the status of the partner and upon the activities of the partnership. Accordingly, partnerships that hold our common stock, and partners in such partnerships, should consult their tax advisors.
You are urged to consult your tax advisor with respect to the application of the United States federal income tax laws to your particular situation, as well as any tax consequences of the
147
purchase, ownership and disposition of our common stock arising under the United States federal estate or gift tax rules or under the laws of any state, local, non-U.S. or other taxing jurisdiction or under any applicable tax treaty.
Non-U.S. holder defined
For purposes of this discussion, you are a non-U.S. holder if you are any holder (other than a partnership or entity classified as a partnership for U.S. federal income tax purposes) that is not:
- •
- an individual citizen or resident of the United States;
- •
- a corporation or other entity taxable as a corporation created or organized in the United States or under the laws of the
United States or any political subdivision thereof;
- •
- an estate whose income is subject to U.S. federal income tax regardless of its source; or
- •
- a trust (x) whose administration is subject to the primary supervision of a U.S. court and which has one or more U.S. persons who have the authority to control all substantial decisions of the trust or (y) which has made an election to be treated as a U.S. person.
Distributions
We have not made any distributions on our common stock, and we do not plan to make any distributions for the foreseeable future. However, if we do make distributions on our common stock, those payments will constitute dividends for U.S. tax purposes to the extent paid from our current or accumulated earnings and profits, as determined under U.S. federal income tax principles. To the extent those distributions exceed both our current and our accumulated earnings and profits, they will constitute a return of capital and will first reduce your basis in our common stock, but not below zero, and then will be treated as gain from the sale of stock, subject to the tax treatment described below in "Gain on disposition of common stock."
Any dividend paid to you generally will be subject to U.S. withholding tax either at a rate of 30% of the gross amount of the dividend or such lower rate as may be specified by an applicable income tax treaty. In order to receive a reduced treaty rate, you must provide us with an IRS Form W-8BEN or other appropriate version of IRS Form W-8 certifying qualification for the reduced rate. A non-U.S. holder of shares of our common stock eligible for a reduced rate of U.S. withholding tax pursuant to an income tax treaty may obtain a refund of any excess amounts withheld by filing an appropriate claim for refund with the IRS. If the non-U.S. holder holds the stock through a financial institution or other agent acting on the non-U.S. holder's behalf, the non-U.S. holder will be required to provide appropriate documentation to the agent, which then will be required to provide certification to us or our paying agent, either directly or through other intermediaries.
Dividends received by you that are effectively connected with your conduct of a U.S. trade or business (and, if an income tax treaty applies, attributable to a permanent establishment maintained by you in the United States) are exempt from such withholding tax. In order to obtain this exemption, you must provide us with an IRS Form W-8ECI or other applicable IRS Form W-8 properly certifying such exemption. Such effectively connected dividends, although not subject to withholding tax, are generally taxed at the same graduated rates applicable to
148
U.S. persons, net of certain deductions and credits. In addition, if you are a corporate non-U.S. holder, dividends you receive that are effectively connected with your conduct of a U.S. trade or business may also be subject to a branch profits tax at a rate of 30% or such lower rate as may be specified by an applicable income tax treaty.
Gain on disposition of common stock
You generally will not be required to pay U.S. federal income tax on any gain realized upon the sale or other disposition of our common stock unless:
- •
- the gain is effectively connected with your conduct of a U.S. trade or business (and, if an income tax treaty applies, the
gain is attributable to a permanent establishment maintained by you in the United States);
- •
- you are an individual who is present in the United States for a period or periods aggregating 183 days or more
during the calendar year in which the sale or disposition occurs and certain other conditions are met; or
- •
- we were a "United States real property holding corporation" for U.S. federal income tax purposes (a "USRPHC") at any time within the shorter of the five-year period preceding the disposition or your holding period for our common stock.
In general, we would be a USRPHC if interests in U.S. real property comprised at least 50% of the fair market value of our assets. We believe that we are not currently and will not become a USRPHC. However, because the determination of whether we are a USRPHC depends on the fair market value of our U.S. real property relative to the fair market value of our other business assets, there can be no assurance that we will not become a USRPHC in the future. Even if we become a USRPHC, however, as long as our common stock is regularly traded on an established securities market, such common stock will be treated as a U.S. real property interest only if you actually or constructively hold more than five percent of such regularly traded common stock at any time during the applicable period described above.
If you are a non-U.S. holder described in the first bullet above, you will generally be required to pay tax on the gain derived from the sale (net of certain deductions or credits) under regular graduated U.S. federal income tax rates, and corporate non-U.S. holders described in the first bullet above may be subject to branch profits tax at a 30% rate or such lower rate as may be specified by an applicable income tax treaty. If you are an individual non-U.S. holder described in the second bullet above, you will be required to pay a flat 30% tax on the gain derived from the sale, which tax may be offset by U.S. source capital losses (even though you are not considered a resident of the United States). You should consult any applicable income tax or other treaties that may provide for different rules.
Federal estate tax
Our common stock beneficially owned by an individual who is not a citizen or resident of the United States (as defined for United States federal estate tax purposes) at the time of death will generally be includable in the decedent's gross estate for United States federal estate tax purposes, unless an applicable estate tax treaty provides otherwise.
149
Backup withholding and information reporting
Generally, we must report annually to the IRS the amount of dividends paid to you, your name and address, and the amount of tax withheld, if any. A similar report will be sent to you. Pursuant to applicable income tax treaties or other agreements, the IRS may make these reports available to tax authorities in your country of residence.
Payments of dividends or of proceeds on the disposition of stock made to you may be subject to additional information reporting and backup withholding at a current rate of 28% unless you establish an exemption, for example by properly certifying your non-U.S. status on a Form W-8BEN or another appropriate version of IRS Form W-8. Notwithstanding the foregoing, backup withholding and information reporting may apply if either we or our paying agent has actual knowledge, or reason to know, that you are a U.S. person.
Backup withholding is not an additional tax; rather, the U.S. income tax liability of persons subject to backup withholding will be reduced by the amount of tax withheld. If withholding results in an overpayment of taxes, a refund or credit may generally be obtained from the IRS, provided that the required information is furnished to the IRS in a timely manner.
Additional withholding requirement
Recently enacted legislation generally will impose a U.S. federal withholding tax of 30% on dividends and the gross proceeds of a disposition of our common stock paid to a "foreign financial institution" (as specially defined under these rules) unless such institution enters into an agreement with the U.S. government to withhold on certain payments and to collect and provide to the U.S. tax authorities substantial information regarding U.S. account holders of such institution (which includes certain equity and debt holders of such institution, as well as certain account holders that are foreign entities with U.S. owners). The legislation also will generally impose a U.S. federal withholding tax of 30% on dividends and the gross proceeds of a disposition of our common stock paid to a non-financial foreign entity unless such entity provides the withholding agent with a certification identifying the direct and indirect U.S. owners of the entity. Under certain transition rules, any obligation to withhold under this new legislation with respect to dividends on our common stock will not begin until January 1, 2014 and with respect to gross proceeds on a disposition of our common stock will not begin until January 1, 2015. Under certain circumstances, a non-U.S. holder might be eligible for refunds or credits of such taxes. Prospective investors are encouraged to consult with their own tax advisors regarding the possible implications of this legislation on their investment in our common stock.
150
J.P. Morgan Securities LLC and Barclays Capital Inc., or the Representatives, are acting as the representatives of the underwriters and joint book-running managers in connection with this offering. Under the terms of an underwriting agreement, the form of which will be filed as an exhibit to the registration statement of which this prospectus forms a part, each of the underwriters named below has severally agreed to purchase from us, and have agreed to sell, the respective number of shares of common stock shown opposite its name below:
| Name |
Number of shares |
||||
|---|---|---|---|---|---|
J.P. Morgan Securities LLC |
|||||
Barclays Capital Inc. |
|||||
Needham & Company, LLC |
|||||
Raymond James & Associates, Inc. |
|||||
Roth Capital Partners, LLC |
|||||
Total |
|||||
The underwriting agreement provides that the underwriters' obligation to purchase shares of common stock depends on the satisfaction of the conditions contained in the underwriting agreement, including:
- •
- the obligation to purchase all of the shares of common stock offered hereby (other than those shares of common stock
covered by their option to purchase additional shares as described below), if any of the shares are purchased;
- •
- the representations and warranties made by us to the underwriters are true;
- •
- there is no material adverse change in our business or in the financial markets; and
- •
- we deliver customary closing documents to the underwriters.
Commissions and expenses
The following table summarizes the underwriting discounts and commissions we will pay to the underwriters. These amounts are shown assuming both no exercise and full exercise of the underwriters' option to purchase up to additional shares from us. The underwriting fee is the difference between the initial price to the public and the amount the underwriters pay to us, and we have severally agreed to sell, for the shares.
| Paid by us |
No exercise |
Full exercise |
||||||
|---|---|---|---|---|---|---|---|---|
Per share |
$ | $ | ||||||
Total |
$ | $ | ||||||
The Representatives have advised us that the underwriters propose to offer the shares of common stock directly to the public at the public offering price on the cover of this prospectus and to selected dealers, which may include the underwriters, at such offering price less a selling concession not in excess of $ per share. After the offering, the Representatives may change the offering price and other selling terms.
The expenses of this offering, which are payable by us, are estimated to be approximately $ million (excluding underwriting discounts and commissions).
151
Option to purchase additional shares
We have granted the underwriters an option exercisable for 30 days after the date of this prospectus to purchase, from time to time, in whole or in part, up to an aggregate of shares of common stock at the public offering price less underwriting discounts and commissions. This option may be exercised by the underwriters to cover over-allotments, if any, in connection with this offering. To the extent that the underwriters exercise this option, each underwriter will be committed, so long as the conditions of the underwriting agreement are satisfied, to purchase a number of additional shares of common stock proportionate to that underwriter's initial commitment as indicated in the table above, and we will be obligated to sell the additional shares of common stock to the underwriters.
Lock-up agreements
We, all of our directors and executive officers and holders of substantially all of our outstanding stock, have agreed that, subject to certain exceptions, we and they will not directly or indirectly, without the prior written consent of the Representatives (1) offer, sell, pledge, contract to sell, sell any option or contract to purchase, purchase any option or contract to sell, grant any option, right or warrant to purchase or otherwise dispose of (or enter into any transaction or device that is designed to, or could be expected to, result in the disposition by any person at any time in the future of) any shares of our common stock or securities convertible into or exercisable or exchangeable for our common stock (including, without limitation, shares of common stock that may be deemed to be beneficially owned in accordance with the rules and regulations of the SEC and shares of common stock that may be issued upon exercise of any stock options), or publicly disclose the intention to make any offer, pledge, sale disposition, (2) enter into any swap or other derivatives transaction that transfers to another, in whole or in part, any of the economic benefits or risks of ownership of shares of common stock or such securities, whether any such transaction described in clause (1) or (2) above is to be settled by delivery of common stock or other securities, in cash or otherwise or (3) solely with respect to such directors, executive officers and stockholders, make any demand for or exercise any right or cause to be filed with respect to the registration of any shares of common stock or securities convertible into or exercisable or exchangeable for common stock or any other securities for a period of 180 days after the date of this prospectus.
The 180-day restricted period described in the preceding paragraph will be extended if:
- (1)
- during
the last 17 days of the 180-day restricted period, we issue an earnings release or material news or a material event relating to
us occurs; or
- (2)
- prior to the expiration of the 180-day restricted period, we announce that we will release earnings results during the 16-day period beginning on the last day of the 180-day period,
in which case the restrictions described in the preceding paragraph will continue to apply until the expiration of the 18-day period beginning on the issuance of the earnings release or the announcement of the material news or occurrence of the material event, unless such extension is waived in writing by the Representatives.
The Representatives, in their sole discretion, may release the common stock and other securities subject to the lock-up agreements described above in whole or in part at any time with or without notice. At least three business days before the effectiveness of any release or waiver of
152
the restrictions described above in connection with any transfer of shares of common stock by an officer or director, the Representatives will notify us of the impending release or waiver of any restriction and we have agreed to announce the impending release or waiver by press release through a major news service at least two business days before the effective date of the release or waiver, except where the release or waiver is effected solely to permit a transfer of common stock that is not for consideration and where the transferee has agreed in writing to be bound by the same terms as the lock-up agreements described above to the extent and for the duration that such terms remain in effect at the time of transfer.
Offering price determination
Prior to this offering, there has been no public market for our common stock. The initial public offering price will be negotiated between the Representatives and us. In determining the initial public offering price of our common stock, the Representatives will consider:
- •
- the history and prospects for the industry in which we compete;
- •
- our financial information;
- •
- an assessment of management and our business potential and earning prospects;
- •
- the prevailing securities market conditions at the time of this offering; and
- •
- the recent market prices of, and the demand for, publicly traded shares of generally comparable companies.
Indemnification
We have agreed to indemnify the underwriters against certain liabilities, including liabilities under the Securities Act and liabilities arising from breaches of the representations and warranties contained in the underwriting agreement, and to contribute to payments that the underwriters may be required to make for these liabilities.
Stabilization, short positions and penalty bids
The underwriters may engage in stabilizing transactions, short sales and purchases to cover positions created by short sales, and penalty bids or purchases for the purpose of pegging, fixing or maintaining the price of our common stock, in accordance with Regulation M under the Securities Exchange Act of 1934:
- •
- Stabilizing transactions permit bids to purchase the underlying security so long as the stabilizing bids do not exceed a
specified maximum
- •
- A short position involves a sale by the underwriters of shares in excess of the number of shares the underwriters are obligated to purchase in the offering, which creates the syndicate short position. This short position may be either a covered short position or a naked short position. In a covered short position, the number of shares involved in the sales made by the underwriters in excess of the number of shares they are obligated to purchase is not greater than the number of shares that they may purchase by exercising their option to purchase additional shares. In a naked short position, the number of shares involved is greater than the number of shares in their option to purchase additional shares. The
153
underwriters may close out any short position by either exercising their option to purchase additional shares and/or purchasing shares in the open market. In determining the source of shares to close out the short position, the underwriters will consider, among other things, the price of shares available for purchase in the open market as compared to the price at which they may purchase shares through their option to purchase additional shares. A naked short position is more likely to be created if the underwriters are concerned that there could be downward pressure on the price of the shares in the open market after pricing that could adversely affect investors who purchase in the offering.
- •
- Syndicate covering transactions involve purchases of the common stock in the open market after the distribution has been
completed in order to cover syndicate short positions.
- •
- Penalty bids permit the Representatives to reclaim a selling concession from a syndicate member when the common stock originally sold by the syndicate member is purchased in a stabilizing or syndicate covering transaction to cover syndicate short positions.
These stabilizing transactions, syndicate covering transactions and penalty bids may have the effect of raising or maintaining the market price of our common stock or preventing or retarding a decline in the market price of the common stock. As a result, the price of the common stock may be higher than the price that may otherwise exist in the open market. These transactions may be effected on or otherwise and, if commenced, may be discontinued at any time.
Neither we nor any of the underwriters make any representation or prediction as to the direction or magnitude of any effect that the transactions described above may have on the price of our common stock. In addition, neither we nor any of the underwriters make representation that the Representatives will engage in these stabilizing transactions or that any transaction, once commenced, will not be discontinued without notice.
Electronic distribution
A prospectus in electronic format may be made available on Internet sites or through other online services maintained by one or more of the underwriters and/or selling group members participating in this offering, or by their affiliates. In those cases, prospective investors may view offering terms online and, depending upon the particular underwriter or selling group member, prospective investors may be allowed to place orders online. The underwriters may agree with us to allocate a specific number of shares for sale to online brokerage account holders. Any such allocation for online distributions will be made by the Representatives on the same basis as other allocations.
Other than the prospectus in electronic format, the information on any underwriter's or selling group member's website and any information contained in any other website maintained by an underwriter or selling group member is not part of the prospectus or the registration statement of which this prospectus forms a part, has not been approved and/or endorsed by us or any underwriter or selling group member in its capacity as underwriter or selling group member and should not be relied upon by investors in deciding whether to purchase any shares of common stock.
154
Stock exchange
We intend to apply to have our common stock listed on The NASDAQ Global Select Market under the symbol "CYOP."
Discretionary sales
The underwriters have informed us that they do not intend to confirm sales to discretionary accounts that exceed 5% of the total number of shares offered by them.
Stamp taxes
If you purchase shares of common stock offered in this prospectus outside the United States, you may be required to pay stamp taxes and other charges under the laws and practices of the country of purchase, in addition to the offering price listed on the cover page of this prospectus.
Relationships
The underwriters and certain of their respective affiliates are financial institutions engaged in various activities, which may include securities trading, commercial and investment banking, financial advisory, investment management, investment research, principal investment, hedging, financing and brokerage activities. Certain of the underwriters and their respective affiliates may in the future perform, investment banking and advisory services for us from time to time, for which they may in the future receive customary fees and expenses. The underwriters and their respective affiliates may, from time to time, engage in transactions with or perform services for us in the ordinary course of their business.
In the ordinary course of their various business activities, the underwriters and their respective affiliates may make or hold a broad array of investments and actively trade debt and equity securities (or related derivative securities) and financial instruments (including bank loans) for their own account and for the accounts of their customers, and such investment and securities activities may involve our securities and/or instruments. The underwriters and their respective affiliates may also make investment recommendations and/or publish or express independent research views in respect of such securities or instruments and may at any time hold, or recommend to clients that they acquire, long and/or short positions in such securities and instruments.
Selling restrictions
The common stock is being offered for sale in those jurisdictions in the United States, Europe and elsewhere where it is lawful to make such offers.
European economic area
In relation to each member state of the European Economic Area which has implemented the Prospectus Directive (each, a "Relevant Member State"), including each Relevant Member State that has implemented the 2010 PD Amending Directive with regard to persons to whom an offer of securities is addressed and the denomination per unit of the offer of securities (each, an "Early Implementing Member State"), with effect from and including the date on which the
155
Prospectus Directive is implemented in that Relevant Member State (the "Relevant Implementation Date"), no offer of ordinary shares will be made to the public in that Relevant Member State (other than offers (the "Permitted Public Offers") where a prospectus will be published in relation to the ordinary shares that has been approved by the competent authority in a Relevant Member State or, where appropriate, approved in another Relevant Member State and notified to the competent authority in that Relevant Member State, all in accordance with the Prospectus Directive), except that with effect from and including that Relevant Implementation Date, offers of ordinary shares may be made to the public in that Relevant Member State at any time:
- (a)
- to
"qualified investors" as defined in the Prospectus Directive, including:
- A.
- (in
the case of Relevant Member States other than Early Implementing Member States), legal entities which are authorized or regulated to operate in the
financial markets or, if not so authorized or regulated, whose corporate purpose is solely to invest in securities, or any legal entity which has two or more of (i) an average of at least 250
employees during the last financial year; (ii) a total balance sheet of more than €43.0 million and (iii) an annual turnover of more than
€50.0 million as shown in its last annual or consolidated accounts; or
- B.
- (in
the case of Early Implementing Member States), persons or entities that are described in points (1) to (4) of Section I of
Annex II to Directive 2004/39/EC, and those who are treated on request as professional clients in accordance with Annex II to Directive 2004/39/EC, or recognized as eligible
counterparties in accordance with Article 24 of Directive 2004/39/EC unless they have requested that they be treated as non-professional clients; or
- (b)
- to
fewer than 100 (or, in the case of Early Implementing Member States, 150) natural or legal persons (other than "qualified investors" as defined in the
Prospectus Directive), as permitted in the Prospectus Directive, subject to obtaining the prior consent of the representatives for any such offer; or
- (c)
- in any other circumstances falling within Article 3(2) of the Prospectus Directive,
provided that no such offer of ordinary shares shall result in a requirement for the publication of a prospectus pursuant to Article 3 of the Prospectus Directive or of a supplement to a prospectus pursuant to Article 16 of the Prospectus Directive.
Each person in a Relevant Member State (other than a Relevant Member State where there is a Permitted Public Offer) who initially acquires any ordinary shares or to whom any offer is made will be deemed to have represented, acknowledged and agreed that (A) it is a "qualified investor," and (B) in the case of any ordinary shares acquired by it as a financial intermediary, as that term is used in Article 3(2) of the Prospectus Directive, (x) the ordinary shares acquired by it in the offering have not been acquired on behalf of, nor have they been acquired with a view to their offer or resale to, persons in any Relevant Member State other than "qualified investors" as defined in the Prospectus Directive, or in circumstances in which the prior consent of the Subscribers has been given to the offer or resale, or (y) where ordinary shares have been acquired by it on behalf of persons in any Relevant Member State other than "qualified investors" as defined in the Prospectus Directive, the offer of those ordinary shares to it is not treated under the Prospectus Directive as having been made to such persons.
156
For the purpose of the above provisions, the expression "an offer to the public" in relation to any ordinary shares in any Relevant Member State means the communication in any form and by any means of sufficient information on the terms of the offer of any ordinary shares to be offered so as to enable an investor to decide to purchase any ordinary shares, as the same may be varied in the Relevant Member State by any measure implementing the Prospectus Directive in the Relevant Member State and the expression "Prospectus Directive" means Directive 2003/71 EC (including the 2010 PD Amending Directive, in the case of Early Implementing Member States) and includes any relevant implementing measure in each Relevant Member State and the expression "2010 PD Amending Directive" means Directive 2010/73/EU.
United Kingdom
This document is only being distributed to and is only directed at (i) persons who are outside the United Kingdom or (ii) investment professionals falling within Article 19(5) of the Financial Services and Markets Act 2000 (Financial Promotion) Order 2005 (the "Order") or (iii) high net worth entities, and other persons to whom it may lawfully be communicated, falling within Article 49(2)(a) to (d) of the Order (all such persons together being referred to as "relevant persons"). The securities are only available to and any invitation, offer or agreement to subscribe purchase or otherwise acquire such securities will be enjoyed in only with relevant persons. Any person in the United Kingdom that is not a relevant persons should not act or rely on this document or any of its contents.
Australia
This prospectus is not a formal disclosure document and has not been lodged with the Australian Securities and Investments Commission, or ASIC. It does not purport to contain all information that an investor or their professional advisers would expect to find in a prospectus for the purposes of Chapter 6D.2 of the Australian Corporations Act 2001, or the Act, in relation to the securities or our company.
This prospectus is not an offer to retail investors in Australia generally. Any offer of securities in Australia is made on the condition that the recipient is a "sophisticated investor" within the meaning of section 708(8) of the Act or a "professional investor" within the meaning of section 708(11) of the Act, or on condition that the offer to that recipient can be brought within the exemption for 'Small-Scale Offerings' (within the meaning of section 708(1) of the Act). If any recipient does not satisfy the criteria for these exemptions, no applications for securities will be accepted from that recipient. Any offer to a recipient in Australia any agreement arising from acceptance of the offer, is personal and may only he accepted by the recipient.
If a recipient on-sells their securities within 12 months of their issue, that person will be required to lodge a disclosure document with ASIC unless either:
- •
- the sale is pursuant to an offer received outside Australia or is made to a "sophisticated investor" within the meaning of 708(8) of the Act or a "professional investor" within the meaning of section 708(11) of the Act; or
157
- •
- it can be established that our company issued, and the recipient subscribed for, the securities without the purpose of the recipient on-selling them or granting, issuing or transferring interests in, or options or warrants over them.
Hong Kong
The shares may not be offered or sold by means of any document other than (i) in circumstances which do not constitute an offer to the public within the meaning of the Companies Ordinance (Cap. 32, Laws of Hong Kong), or (ii) to "professional investors" within the meaning of the Securities and Futures Ordinance (Cap. 571, Laws of Hong Kong) and any rules made thereunder, or (iii) in other circumstances which do not result in the document being a "prospectus" within the meaning of the Companies Ordinance (Cap. 32, Laws of Hong Kong) and no advertisement, invitation or document relating to the shares may be issued or may be in the possession of any person for the purpose of the issue (in each case whether in Hong Kong or elsewhere), which is directed at, or the contents of which are likely to be accessed or read by, the public in Hong Kong (except if permitted to do so under the laws of Hong Kong) other than with respect to shares which are or are intended to be disposed of only to persons outside Hong Kong or only to "professional investors" within the meaning of the Securities and Futures Ordinance (Cap. 571, Laws of Hong Kong) or any rules made thereunder.
India
This prospectus has not been and will not be registered as a prospectus with the Registrar of Companies in India. This prospectus or any other material relating to these securities may not be circulated or distributed, directly or indirectly, to the public or any members of the public in India. Further, persons into whose possession this prospectus comes are required to inform themselves about and to observe any such restrictions. Each prospective investor is advised to consult its advisors about the particular consequences to it of an investment in these securities. Each prospective investor is also advised that any investment in these securities by it is subject to the regulations prescribed by the Reserve Bank of India and the Foreign Exchange Management Act and any regulations framed thereunder.
Japan
No registration has been made under Article 4, Paragraph 1 of the Financial Instruments and Exchange Law of Japan (Law No. 25 of 1948, as amended), which we refer to as the FIEL, in relation to the offering of the shares. The shares are being offered in a private placement to up to 49 investors under Article 2, Paragraph 3, Item 2 iii of the FIEL.
Korea
Our securities may not be offered, sold and delivered directly or indirectly, or offered or sold to any person for reoffering or resale, directly or indirectly, in Korea or to any resident of Korea except pursuant to the applicable laws and regulations of Korea, including the Securities and Exchange Act and the Foreign Exchange Transaction Law and the decrees and regulations thereunder. Our securities have not been registered with the Financial Supervisory Commission of Korea for public offering in Korea. Furthermore, our securities may not be resold to Korean residents unless the purchaser of our securities complies with all applicable regulatory
158
requirements (including but not limited to government approval requirements under the Foreign Exchange Transaction Law and its subordinate decrees and regulations) in connection with the purchase of our securities.
Singapore
This prospectus has not been registered as a prospectus with the Monetary Authority of Singapore. Accordingly, this prospectus and any other document or material in connection with the offer or sale, or invitation for subscription or purchase, of the shares may not be circulated or distributed, nor may the shares be offered or sold, or be made the subject of an invitation for subscription or purchase, whether directly or indirectly, to persons in Singapore other than (i) to an institutional investor under Section 274 of the Securities and Futures Act, Chapter 289 of Singapore (the "SFA"), (ii) to a relevant person, or any person pursuant to Section 275 (1A), and in accordance with the conditions, specified in Section 275 of the SFA or (iii) otherwise pursuant to, and in accordance with the conditions of, any other applicable provision of the SFA.
Where the shares are subscribed or purchased under Section 275 by a relevant person which is: (a) a corporation (which is not an accredited investor) the sole business of which is to hold investments and the entire share capital of which is owned by one or more individuals, each of whom is an accredited investor; or (b) a trust (where the trustee is not an accredited investor) whose sole whole purpose is to hold investments and each beneficiary is an accredited investor, shares, debentures and units of shares and debentures of that corporation or the beneficiaries' rights and interest in that trust shall not be transferable for six months after that corporation or that trust has acquired the shares under Section 275 except: (i) to an institutional investor under Section 274 of the SFA or to a relevant person, or any person pursuant to Section 275 (1A), and in accordance with the conditions, specified in Section 275 of the SEA; (ii) where no consideration is given for the transfer; or (iii) by operation of law.
By accepting this prospectus, the recipient hereof represents and warrants that he is entitled to receive it in accordance with the restrictions set forth above and agrees to be bound by limitations contained herein. Any failure to comply with these limitations may constitute a violation of law.
159
The validity of the shares of common stock offered hereby will be passed upon for us by Goodwin Procter LLP, Menlo Park, California. Certain members of, investment partnerships comprised of members of, and persons associated with, Goodwin Procter beneficially holds an aggregate of 186 shares of our common stock, which represents less than 0.01% of our outstanding shares of common stock. Certain legal matters in connection with the offering will be passed upon for the underwriters by Wilson Sonsini Goodrich & Rosati, Professional Corporation, Washington, D.C. Certain members of and persons associated with Wilson Sonsini Goodrich & Rosati, Professional Corporation, beneficially hold an aggregate of 781 shares of our common stock, which represents less than 0.01% of our outstanding shares of common stock.
The consolidated financial statements of CyOptics, Inc. as of December 31, 2010 and 2009, and for each of the three years in the period ended December 31, 2010, appearing in this prospectus and the related registration statement have been audited by Ernst & Young LLP, independent registered public accounting firm, as set forth in their report thereon appearing elsewhere herein, and are included in reliance upon such report given on the authority of such firm as experts in accounting and auditing.
Where you can find more information
We have filed with the SEC a registration statement on Form S-1 under the Securities Act with respect to the shares of common stock we are offering. The registration statement, including the attached exhibits and schedules, contains additional relevant information about us and our common stock. This prospectus does not contain all of the information set forth in the registration statement and the exhibits and schedules thereto. The rules and regulations of the SEC allow us to omit from this prospectus certain information included in the registration statement.
For further information about us and our common stock, you may inspect a copy of the registration statement and the exhibits and schedules to the registration statement without charge at the offices of the SEC at 100 F Street, N.E., Washington, D.C. 20549. You may obtain copies of all or any part of the registration statement from the Public Reference Section of the SEC, 100 F Street, N.E., Washington, D.C. 20549 upon the payment of the prescribed fees.
You may obtain information on the operation of the Public Reference Room by calling the SEC at 1-800-SEC-0330. The SEC maintains a website at www.sec.gov that contains reports, proxy and information statements and other information regarding registrants like us that file electronically with the SEC. You can also inspect our registration statement on this website.
160
Conventions that apply to this prospectus
All references in this prospectus to "we," "us" or "our" are references to CyOptics, Inc., a Delaware corporation, and its subsidiaries.
References in this prospectus to:
- •
- "BOSA" are to bidirectional optical subassembly;
- •
- "CFP" are to C-Form factor pluggable;
- •
- "COB" are to components on board;
- •
- "CWDM" are to coarse wavelength division multiplexing;
- •
- "DMLs" are to directly modulated lasers;
- •
- "DWDM" are to dense wavelength division multiplexing;
- •
- "EAM" are to electro-absorptive modulated lasers
- •
- "GbE" are to gigabit Ethernet;
- •
- "Gbps" are to gigabits per second;
- •
- "GPON" are to gigabit passive optical network;
- •
- "PICs" are to photonic integrated circuits;
- •
- "PLCs" are to planar lightguide circuits;
- •
- "PON" are to passive optical network;
- •
- "ROSA" are to receive optical subassembly;
- •
- "SFP+" are to small form-factor pluggable plus;
- •
- "TERAPICS" are to terabit photonic integrated circuits;
- •
- "TO-can" are cylindrical style packages; and
- •
- "TOSA" are transmit optical subassembly.
161
CyOptics, Inc.
Consolidated financial statements
Contents
| |
Page |
||
|---|---|---|---|
Consolidated financial statements for the years ended December 31, 2010, 2009 and 2008 |
|||
Report of independent registered public accounting firm |
F-2 | ||
Consolidated balance sheets |
F-3 |
||
Consolidated statements of operations |
F-4 |
||
Consolidated statements of convertible preferred stock and stockholders' equity (deficit) |
F-5 |
||
Consolidated statements of cash flows |
F-6 |
||
Notes to consolidated financial statements |
F-7 |
||
Unaudited condensed consolidated financial statements for the six-months ended June 30, 2011 and 2010 |
|||
Condensed consolidated balance sheets |
F-32 |
||
Condensed consolidated statements of operations |
F-33 |
||
Condensed consolidated statements of convertible preferred stock and stockholders' equity (deficit) |
F-34 |
||
Condensed consolidated statements of cash flows |
F-35 |
||
Notes to condensed consolidated financial statements |
F-36 |
||
F-1
Report of independent registered public accounting firm
The Board of Directors and Stockholders of CyOptics, Inc.
We have audited the accompanying consolidated balance sheets of CyOptics, Inc. as of December 31, 2010 and 2009, and the related consolidated statements of operations, convertible preferred stock and stockholders' equity (deficit), and cash flows for each of the three years in the period ended December 31, 2010. These financial statements are the responsibility of the Company's management. Our responsibility is to express an opinion on these financial statements based on our audits.
We conducted our audits in accordance with the standards of the Public Company Accounting Oversight Board (United States). Those standards require that we plan and perform the audits to obtain reasonable assurance about whether the financial statements are free of material misstatement. We were not engaged to perform an audit of the Company's internal control over financial reporting. Our audits included consideration of internal control over financial reporting as a basis for designing audit procedures that are appropriate in the circumstances, but not for the purpose of expressing an opinion on the effectiveness of the Company's internal control over financial reporting. Accordingly, we express no such opinion. An audit also includes examining, on a test basis, evidence supporting the amounts and disclosures in the financial statements, assessing the accounting principles used and significant estimates made by management, and evaluating the overall financial statement presentation. We believe that our audits provide a reasonable basis for our opinion.
In our opinion, the financial statements referred to above present fairly, in all material respects, the consolidated financial position of CyOptics, Inc. as of December 31, 2010 and 2009, and the consolidated results of its operations and its cash flows for each of the three years in the period ended December 31, 2010, in conformity with U.S. generally accepted accounting principles.
| /s/ Ernst & Young LLP |
Philadelphia,
Pennsylvania
August 12, 2011
F-2
CyOptics, Inc.
Consolidated balance sheets
| |
December 31, | |||||||
|---|---|---|---|---|---|---|---|---|
| (in thousands, except for share and per share data) |
2010 |
2009 |
||||||
Assets |
||||||||
Current assets: |
||||||||
Cash and cash equivalents |
$ | 12,397 | $ | 9,122 | ||||
Restricted cash |
100 | — | ||||||
Accounts receivable, net of allowance for doubtful accounts of $77 and $87 at December 31, 2010 and 2009, respectively |
26,894 | 17,591 | ||||||
Inventories, net |
19,526 | 11,070 | ||||||
Prepaid expenses and other current assets |
892 | 995 | ||||||
Total current assets |
59,809 | 38,778 | ||||||
Property and equipment, net |
8,337 | 8,245 | ||||||
Intangible assets, net |
6,165 | 8,310 | ||||||
Long-term restricted cash |
— | 100 | ||||||
Total assets |
$ | 74,311 | $ | 55,433 | ||||
Liabilities, convertible preferred stock, and stockholders' equity (deficit) |
||||||||
Current liabilities: |
||||||||
Current portion of long-term loans |
$ | 667 | $ | 733 | ||||
Current portion of related-party loan |
1,283 | 1,217 | ||||||
Accounts payable |
18,258 | 7,152 | ||||||
Accrued and other current liabilities |
4,623 | 4,044 | ||||||
Total current liabilities |
24,831 | 13,146 | ||||||
Long-term liabilities: |
||||||||
Long-term loans |
278 | 944 | ||||||
Credit line |
10,200 | 10,200 | ||||||
Related-party loan |
366 | 1,656 | ||||||
Preferred stock warrant liability |
239 | — | ||||||
Total liabilities |
35,914 | 25,946 | ||||||
Commitments and contingencies |
||||||||
Convertible preferred stock: |
||||||||
Convertible preferred stock, $0.001 par value per share, 11,061,237 shares authorized; 10,620,038 issued and outstanding (liquidation preference of $210,733 at December 31, 2010) |
122,958 | 122,958 | ||||||
Stockholders' equity (deficit): |
||||||||
Common stock, $0.001 par value per share, 14,807,692 shares authorized; 1,485,178 and 1,521,310 issued and outstanding at December 31, 2010 and 2009, respectively |
1 | 2 | ||||||
Additional paid-in capital |
45,114 | 45,092 | ||||||
Accumulated deficit |
(129,676 | ) | (138,565 | ) | ||||
Total stockholders' equity (deficit) |
(84,561 | ) | (93,471 | ) | ||||
Total liabilities, convertible preferred stock and stockholders' equity (deficit) |
$ | 74,311 | $ | 55,433 | ||||
The accompanying notes are an integral part of these consolidated financial statements.
F-3
CyOptics, Inc.
Consolidated statements of operations
| |
Year ended December 31, | |||||||||||
|---|---|---|---|---|---|---|---|---|---|---|---|---|
| (in thousands, except for share and per share data) |
||||||||||||
| 2010 |
2009 |
2008 |
||||||||||
Total revenues |
$ | 108,336 | $ | 65,730 | $ | 72,564 | ||||||
Cost of revenues |
79,375 | 60,646 | 63,157 | |||||||||
Gross profit |
28,961 | 5,084 | 9,407 | |||||||||
Operating expenses: |
||||||||||||
Research and development |
12,010 | 19,540 | 19,031 | |||||||||
Sales and marketing |
2,671 | 3,181 | 3,888 | |||||||||
General and administrative |
3,270 | 7,972 | 5,904 | |||||||||
Severance and liquidation expenses |
— | 6,465 | — | |||||||||
Asset impairment |
— | 3,221 | 9,841 | |||||||||
Total operating expenses |
17,951 | 40,379 | 38,664 | |||||||||
Income (loss) from operations |
11,010 | (35,295 | ) | (29,257 | ) | |||||||
Other (expense) income: |
||||||||||||
Interest expense, net |
(1,328 | ) | (1,617 | ) | (2,148 | ) | ||||||
Other (expense) income, net |
(292 | ) | 1,574 | (642 | ) | |||||||
Total other income (expense) |
(1,620 | ) | (43 | ) | (2,790 | ) | ||||||
Income (loss) before provision for income taxes |
9,390 | (35,338 | ) | (32,047 | ) | |||||||
Provision for income taxes |
501 | 128 | 177 | |||||||||
Net income (loss) |
$ | 8,889 | $ | (35,466 | ) | $ | (32,224 | ) | ||||
Net income attributable to common stockholders |
$ | 1,115 | $ | (35,466 | ) | $ | (32,224 | ) | ||||
Net income (loss) per common share: |
||||||||||||
Basic |
$ | 0.73 | $ | (23.74 | ) | $ | (22.68 | ) | ||||
Diluted |
$ | 0.73 | $ | (23.74 | ) | $ | (22.68 | ) | ||||
Weighted average number of common shares: |
||||||||||||
Basic |
1,519,124 | 1,494,124 | 1,420,786 | |||||||||
Diluted |
1,523,183 | 1,494,124 | 1,420,786 | |||||||||
The accompanying notes are an integral part of these consolidated financial statements.
F-4
CyOptics, Inc.
Consolidated statements of convertible preferred stock,
and stockholders' equity (deficit)
| |
Convertible preferred stock | Stockholders' equity (deficit) | |||||||||||||||||||||||||
|---|---|---|---|---|---|---|---|---|---|---|---|---|---|---|---|---|---|---|---|---|---|---|---|---|---|---|---|
| |
|
|
|
|
|
|
Accumulated other comprehensive income (loss) |
|
|||||||||||||||||||
| |
Preferred stock | Common stock | Additional paid-in capital |
|
|
||||||||||||||||||||||
| |
Accumulated deficit |
|
|||||||||||||||||||||||||
| (in thousands, except for share data) |
Shares |
Amount |
Shares |
Amount |
Total |
||||||||||||||||||||||
Balance at January 1, 2008 |
6,085,578 | $ | 49,582 | 1,005,238 | $ | 1 | $ | 82,968 | $ | (113,069 | ) | $ | — | $ | (30,100 | ) | |||||||||||
Exercise of stock options |
— | — | 5,051 | — | 3 | — | — | 3 | |||||||||||||||||||
Stock-based compensation expense |
— | — | — | — | 54 | — | — | 54 | |||||||||||||||||||
Issuance of preferred stock |
4,180,931 | 67,228 | — | — | — | — | — | — | |||||||||||||||||||
Issuance of preferred stock as a result of debt conversion to equity |
833,320 | 10,044 | — | — | — | — | — | — | |||||||||||||||||||
Beneficial conversion feature on issuance of convertible debt |
— | — | — | — | 330 | — | — | 330 | |||||||||||||||||||
Conversion of preferred stock in to common stock |
(479,791 | ) | (3,896 | ) | 479,791 | — | 3,896 | — | — | 3,896 | |||||||||||||||||
Comprehensive loss: |
— | ||||||||||||||||||||||||||
Foreign currency translation adjustment |
— | — | — | — | — | — | (2,998 | ) | (2,998 | ) | |||||||||||||||||
Net loss |
— | — | — | — | — | (32,224 | ) | — | (32,224 | ) | |||||||||||||||||
Total comprehensive loss: |
(35,222 | ) | |||||||||||||||||||||||||
Balance at December 31, 2008 |
10,620,038 | 122,958 | 1,490,080 | 1 | 87,251 | (145,293 | ) | (2,998 | ) | (61,039 | ) | ||||||||||||||||
Exercise of stock options |
— | — | 31,230 | 1 | 21 | — | — | 22 | |||||||||||||||||||
Stock-based compensation expense |
— | — | — | — | 25 | — | — | 25 | |||||||||||||||||||
Effect of deconsolidation of subsidiary |
— | — | — | — | (42,205 | ) | 42,194 | 3,036 | 3,025 | ||||||||||||||||||
Comprehensive loss: |
|||||||||||||||||||||||||||
Foreign currency translation adjustment |
— | — | — | — | — | — | (38 | ) | (38 | ) | |||||||||||||||||
Net loss: |
— | — | — | — | — | (35,466 | ) | — | (35,466 | ) | |||||||||||||||||
Total comprehensive loss: |
(35,504 | ) | |||||||||||||||||||||||||
Balance at December 31, 2009 |
10,620,038 | 122,958 | 1,521,310 | 2 | 45,092 | (138,565 | ) | — | (93,471 | ) | |||||||||||||||||
Exercise of stock options |
— | — | 953 | — | 1 | — | — | 1 | |||||||||||||||||||
Stock-based compensation expense |
— | — | — | — | 20 | — | — | 20 | |||||||||||||||||||
Repurchase of common stock |
— | — | (37,085 | ) | (1 | ) | 1 | — | — | — | |||||||||||||||||
Net income and comprehensive income |
— | — | — | — | — | 8,889 | — | 8,889 | |||||||||||||||||||
Balance at December 31, 2010 |
10,620,038 | $ | 122,958 | 1,485,178 | $ | 1 | $ | 45,114 | $ | (129,676 | ) | $ | — | $ | (84,561 | ) | |||||||||||
The accompanying notes are an integral part of these consolidated financial statements.
F-5
CyOptics, Inc.
Consolidated statements of cash flows
| |
Year ended December 31, | |||||||||||
|---|---|---|---|---|---|---|---|---|---|---|---|---|
| (in thousands) |
2010 |
2009 |
2008 |
|||||||||
Cash flows from operating activities |
||||||||||||
Net income (loss) |
$ | 8,889 | $ | (35,466 | ) | $ | (32,224 | ) | ||||
Adjustments to reconcile net income (loss) to net cash provided by (used in) operating activities: |
||||||||||||
Depreciation and amortization |
4,976 | 8,554 | 6,971 | |||||||||
Acquired in-process research and development |
— | — | 510 | |||||||||
Stock based compensation expense |
20 | 25 | 54 | |||||||||
Other non-cash expense |
— | — | 42 | |||||||||
Preferred stock warrant expense |
239 | — | — | |||||||||
(Gain) loss on disposal of property and equipment |
(68 | ) | 37 | (8 | ) | |||||||
Non-cash interest on long term loans |
149 | 149 | 149 | |||||||||
Asset impairment charges |
— | 3,221 | 9,841 | |||||||||
Changes in assets and liabilities: |
||||||||||||
(Increase) in accounts receivable, net |
(9,303 | ) | (4,988 | ) | (2,638 | ) | ||||||
(Increase) decrease in inventory |
(8,456 | ) | 6,348 | (1,489 | ) | |||||||
Decrease (increase) in other current assets |
103 | 3,281 | (3,302 | ) | ||||||||
Increase (decrease) in accounts payable |
11,106 | (1,846 | ) | (352 | ) | |||||||
Increase (decrease) in accrued and other current liabilities |
578 | 5,919 | (730 | ) | ||||||||
Net cash provided by (used in) operating activities |
8,233 | (14,766 | ) | (23,176 | ) | |||||||
Cash flows from investing activities |
||||||||||||
Proceeds from sale of property and equipment |
73 | 12 | 114 | |||||||||
Purchase of property and equipment |
(2,927 | ) | (3,451 | ) | (1,839 | ) | ||||||
Cash acquired in PGT Photonics acquisition |
— | — | 28,111 | |||||||||
Cash used in dissolution of PGT Photonics |
— | (6,906 | ) | — | ||||||||
Change in restricted cash |
— | 7 | 1,502 | |||||||||
Net cash (used in) provided by investing activities |
(2,854 | ) | (10,338 | ) | 27,888 | |||||||
Cash flows from financing activities |
||||||||||||
Proceeds from long-term debt and credit line |
— | — | 16,673 | |||||||||
Payments on revolving credit facility and long-term debt |
(2,105 | ) | (1,685 | ) | (8,339 | ) | ||||||
Proceeds from exercise of stock options |
1 | 21 | 3 | |||||||||
Proceeds from issuance of preferred stock |
— | — | 20,037 | |||||||||
Net cash (used in) provided by financing activities |
(2,104 | ) | (1,664 | ) | 28,374 | |||||||
Effect of exchange rates on cash |
— | (39 | ) | (3,190 | ) | |||||||
Net increase (decrease) in cash and cash equivalents |
3,275 | (26,807 | ) | 29,896 | ||||||||
Cash and cash equivalents at beginning of year |
9,122 | 35,929 | 6,033 | |||||||||
Cash and cash equivalents at end of year |
$ | 12,397 | $ | 9,122 | $ | 35,929 | ||||||
Supplemental cash flow information |
||||||||||||
Cash paid for interest |
$ | 1,223 | $ | 1,580 | $ | 1,251 | ||||||
Cash paid for income taxes |
$ | 173 | $ | 128 | $ | 177 | ||||||
The accompanying notes are an integral part of these consolidated financial statements.
F-6
CyOptics, Inc.
Notes to consolidated financial statements
(in thousands, except for share and per share data)
(1) Description of business
CyOptics Inc. (the Company) was incorporated in January 1999 under the laws of the State of Delaware. The Company is a platform-based provider of core optical technologies enabling bandwith for high-speed networks. The Company serves customers on a global basis.
The Company has expanded its operations through a number of acquisitions in recent years. PGT Photonics S.p.A. (PGT) was acquired on July 24, 2008. This operation was based in Italy and supported the design, manufacture and sale of optical components, modules and systems. CyOptics International Holding Co. and CyOptics International Holding LLC were formed in 2005 to acquire the entire equity interest in the Company's operations in Matamoros, Mexico, CyOptics de Mexico. This operation supports the Company's assembly and test manufacturing operations.
The board of directors of PGT approved the dissolution of PGT effective September 22, 2009. For further discussion of the PGT dissolution, see Note 3 of these consolidated financial statements.
(2) Significant accounting policies
Basis of presentation
The accompanying consolidated financial statements include the accounts of the Company and its wholly owned subsidiaries. All material intercompany balances and transactions have been eliminated. Due to dissolution proceedings commenced on September 22, 2009, PGT was deconsolidated from the Company's consolidated financial statements effective September 22, 2009. As such, the consolidated balance sheets as of December 31, 2010 and 2009, and the consolidated statements of operations, statements of convertible preferred stock and stockholders' equity (deficit), and cash flows for the years ended December 31, 2010 and 2009, do not consolidate the financial statements of PGT after commencement of dissolution.
Use of estimates
The preparation of consolidated financial statements in conformity with accounting principles generally accepted in the United States requires management to make estimates and assumptions that affect the reported amounts of assets and liabilities and disclosures of contingent assets and liabilities at the date of the financial statements and the reported amounts of revenue and expenses during the reporting period. Actual results could differ from those estimates.
On an ongoing basis, the Company evaluates its estimates, including those related to the accounts receivable allowance, inventory valuation, the warranty reserve, the useful lives of long-lived assets and other intangible assets, the value of common stock and assumptions used for the purpose of determining stock-based compensation, the value of Preferred stock warrants, and income taxes, among others. The Company bases its estimates on historical
F-7
experience and on various other assumptions that are believed to be reasonable, the results of which form the basis for making judgments about the carrying value of assets and liabilities as well as reported revenue and expenses during the periods presented.
Foreign currency translation
For operations in Mexico, the functional currency is the U.S. dollar. Assets and liabilities of those operations are translated into U.S. dollars using year-end exchange rates; income and expenses are translated using the average exchange rates for the reporting period. Translation adjustments for the operations in Mexico are included in other (expense) income and were immaterial for all years presented. Realized foreign currency transaction gains and losses are included in other (expense) income and were immaterial for all years presented.
For PGT operations in Italy, the functional currency was the euro. Income and expenses were translated using the average exchange rates for the year ended December 31, 2008 and for the period ended September 22, 2009. Translation adjustments were included in stockholders' equity (deficit) as other comprehensive income (loss).
Cash and cash equivalents
The Company considers all highly liquid investments having an original maturity of three months or less when purchased to be cash equivalents. The Company maintains deposits with financial institutions, the balances of which from time to time exceed the federally insured amount.
Fair value of financial instruments
The estimated fair value of financial instruments has been determined by the Company using available market information and valuation methodologies. Considerable judgment is required in estimating fair values. Accordingly, the estimates may not be indicative of the amounts the Company could realize in a current market exchange.
The carrying amounts of cash and cash equivalents, accounts receivable, other current assets, accounts payable, and accrued expenses approximate their fair values due to the short-term maturity of these instruments.
The carrying amounts of the Company's long-term liabilities approximate their fair value because the interest rate is reflective of rates that the Company could currently obtain on debt with similar terms and conditions. The carrying value of the Preferred stock warrant liability is the estimated fair value of the liability (Note 7).
Accounts receivable
The Company makes estimates regarding the collectability of accounts receivable. When the Company evaluates the adequacy of its allowance for doubtful accounts, it considers multiple factors, including historical write-off experience, the need for specific customer reserves, the aging of receivables, customer creditworthiness and changes in customer payment cycles. Historically, the allowance for doubtful accounts has been adequate based on actual results. If any of the factors used to calculate the allowance for doubtful accounts change or if the allowance does not reflect the Company's future ability to collect outstanding receivables, additional provisions for doubtful accounts may be needed, and future results of operations could be materially affected.
F-8
The following table summarizes the changes in the Company's allowance for doubtful accounts for the period indicated:
| |
Year ended December 31, | |||||||||
|---|---|---|---|---|---|---|---|---|---|---|
| |
2010 |
2009 |
2008 |
|||||||
Balance at the beginning of the period |
$ | 87 | $ | 86 | $ | 70 | ||||
Amounts to expense |
— | 10 | 41 | |||||||
Accounts written off |
(10 | ) | (9 | ) | (25 | ) | ||||
Balance at the end of the period |
$ | 77 | $ | 87 | $ | 86 | ||||
Inventory
Inventories are stated at the lower of cost or market. Cost is determined using the first-in, first-out method. The Company writes down its inventories when there is evidence that the utility of the goods will be less than cost based upon assumptions about future demand and current market conditions. These write-downs represent permanent adjustments to the carrying amount of the affected inventory. If actual market conditions are less favorable than these estimates, additional inventory write-downs may be required in future periods. In the event the Company experiences unanticipated demand and is able to sell a portion of the inventory for an amount greater than its reduced carrying amount, its gross margins will be favorably affected in the period of sale.
Concentration of credit risk
Financial instruments that potentially subject the Company to concentrations of credit risk consist principally of cash and cash equivalents, and trade receivables.
Cash and cash equivalents are invested in major financial institutions in the United States and Mexico. Such deposits in the United States may be in excess of insured limits and are not insured in other jurisdictions. Management believes that the financial institutions that hold the Company's investments are financially sound and, accordingly, minimal credit risk exists with respect to these investments. Concentration of credit risk with respect to trade accounts receivable exists due to the significance of several large telecommunication industry customers. Five customers make up 60% and 57% of trade receivables as of December 31, 2010 and 2009, respectively.
The Company has no foreign exchange contracts, option contracts, or other hedging arrangements.
The Company's operations in Matamoros, Mexico, CyOptics de Mexico, currently operate under a collective bargaining agreement, with an effective date of January 10 of each year. 35% of the Company's global labor force is covered by this collective bargaining agreement, which will expire within one year.
Customer, product and supplier concentration—The Company primarily sells its products directly to module manufacturers and systems providers, including network equipment manufacturers. During the years ended December 31, 2010, and 2009, there was one customer who accounted for 15.3% and 16.6% of the Company's total revenues, respectively. During the year ended
F-9
December 31, 2008, there were two customers who, combined, represented 22.6% of total revenues.
The Company derives a majority of its total revenues from a limited number of products. Products that accounted for 10% or more of our total revenues during the years ended December 31 were as follows:
| |
2010 |
2009 |
2008 |
|||||||
|---|---|---|---|---|---|---|---|---|---|---|
Devices |
35% | 38% | 41% | |||||||
Small Form Factor Components |
28% | 22% | 18% | |||||||
Large Form Factor Components |
19% | 27% | 41% | |||||||
Components on Board |
11% | 11% | — | |||||||
The Company obtains a number of components from single source suppliers due to technology, availability, price, quality or other considerations. The loss of a single source supplier, the deterioration of its relationship with a single source supplier, or any unilateral modification to the contractual terms under which the Company is supplied components by a single source supplier could adversely affect the Company's total revenues and gross margins.
Property and equipment
Property and equipment are stated at cost, net of accumulated depreciation. Maintenance and repairs are expensed as incurred. Depreciation is calculated using the straight-line method over the estimated useful lives of the assets at the following annual rates:
Computers and related equipment |
3 years | |
Office and lab furniture |
5 to 10 years | |
Equipment and machinery |
5 to 10 years | |
Vehicles |
4 to 5 years | |
Leasehold improvements |
Over the shorter of term of the lease or the life of the assets | |
Upon retirement or other disposition of property and equipment, the applicable cost and accumulated depreciation are removed from the accounts and any resulting gains or losses are included in the results of operations.
Impairment of long-lived assets
The Company's long-lived assets are reviewed for impairment whenever events or changes in circumstances indicate that the carrying amount of an asset may not be recoverable. Recoverability of assets to be held and used is measured by a comparison of the carrying amount of an asset to the future undiscounted cash flows expected to be generated by the assets. If such assets are considered to be impaired, the impairment to be recognized is measured by the amount by which the carrying amount of the assets exceeds the fair value of the assets.
In September 2009, prior to dissolution of PGT, an asset impairment charge of $3,221 was recognized for the impairment of PGT property and equipment.
The Company recognized an impairment charge of $2,320 in 2008 related to certain of the acquired assets of PGT. This amount includes a $530 impairment charge related to property and
F-10
equipment, and a $1,790 impairment charge related to intangible assets associated with the Company's 2008 acquisition of PGT. Refer to Footnote 3 for further details.
Intangible assets
The Company amortizes intangible assets on a straight line basis over their estimated useful lives, generally as follows: four to nine years for technology, six to ten years for customer relationships, and one to five years for other intangible assets.
Revenue recognition
The Company generates revenues principally from the sale of hardware products to customers. Revenues from product sales are recognized when delivery has occurred, persuasive evidence of an agreement exists, the vendor's fee is fixed or determinable, no further obligation exists, and collectability is reasonably assured. Delivery is generally considered to have occurred upon shipment of products. Contracts and/or customer purchase orders are used to determine the existence of an arrangement. The Company assesses whether the price is fixed or determinable based on the payment terms associated with the transaction and whether the sales price is subject to refund or adjustment. The Company generally does not grant a right of return to its customers. In transactions where a customer's contractual terms include a provision for customer acceptance, revenues are recognized either when such acceptance has been obtained or the acceptance provision has lapsed. The Company assesses collectability based primarily on the creditworthiness of the customer as determined by credit checks and the customer's payment history.
The Company bears all costs and risks of loss or damage to the goods up to the point that revenue is recognized. Our terms of sale generally provide that title passes to the buyer upon shipment by us. Amounts billed to clients for shipping and handling of products are classified as total revenues in the consolidated statements of operations.
Product warranties
For the majority of the Company's products, a product warranty is provided for one year or less from date of shipment. The Company estimates the costs of its warranty obligations based on its historical experience and expectations and expected future conditions. To the extent the Company experiences increased warranty claim activity or increased costs associated with servicing those claims, the Company's warranty costs will increase resulting in decreases to gross profit. The Company periodically assesses the adequacy of its recorded warranty liabilities and adjusts the amounts as necessary.
The following table summarizes the changes in the Company's warranty reserves for the period indicated:
| |
Year ended December 31, | |||||||||
|---|---|---|---|---|---|---|---|---|---|---|
| |
2010 |
2009 |
2008 |
|||||||
Balance at the beginning of the period |
$ | 310 | $ | 171 | $ | 72 | ||||
Warranty accruals |
— | 139 | 99 | |||||||
Settlements and adjustments |
(161 | ) | — | — | ||||||
Balance at the end of the period |
$ | 149 | $ | 310 | $ | 171 | ||||
F-11
Research and development
Research and development activities are generally charged to operations as incurred. Property and equipment that are acquired or constructed for research and development activities and that have alternate future uses are capitalized and depreciated over their estimated useful lives on a straight-line basis.
In September 2007, the Company entered into a three-year cooperative agreement with the U.S. Department of Commerce as part of its Advanced Technology Program ("ATP"). The ATP award provided three years of partial funding to jointly develop with another supplier next generation technology. Funding amounts received from ATP were $706, $1,326 and $1,062 for the years ended December 31, 2010, 2009 and 2008, respectively, and were treated as research and development cost recovery (contra-expense) by the Company.
Advertising
Advertising costs are expensed as incurred and, to date, have not been significant. Advertising costs include direct marketing, events, public relations, sales collateral materials and partner programs.
Income taxes
Deferred tax assets and liabilities are determined based on temporary differences between the financial reporting bases and the tax bases of assets and liabilities. Deferred tax assets are also recognized for tax net operating loss carryforwards. These deferred tax assets and liabilities are measured using the enacted tax rates and laws that will be in effect when such amounts are expected to reverse or be utilized. The realization of total deferred tax assets is contingent upon the generation of future taxable income. Valuation allowances are provided to reduce such deferred tax assets to amounts more likely than not to be ultimately realized.
The Company uses a more-likely-than-not recognition threshold based on the technical merits of tax positions taken. Tax positions that meet the more-likely-than-not recognition threshold are measured as the largest amount of the tax benefits, determined on a cumulative probability basis, which is more likely than not to be realized upon ultimate settlement. The Company recognizes interest and penalties related to income tax matters in income tax expense.
Stock-based compensation
The Company recognizes the cost of stock-based compensation to employees, including grants of employee stock options, in the consolidated statement of operations based on fair value of those awards at the date of grant over the requisite service period. The Company uses the Black-Scholes option pricing model to determine the fair value of the stock-based compensation awards. The estimated fair value of stock-based compensation awards on the date of grant is amortized on a straight-line basis over the requisite service period. Stock-based compensation expense totaled $20, $25 and $54 for the years ended December 31, 2010, 2009 and 2008, respectively.
Net income (loss) per common share
The Company uses the two-class method to compute net income (loss) per common share because the Company has issued securities, other than common stock, that contractually entitle the holders to participate in dividends and earnings of the Company. The two class method requires earnings for the period to be allocated between common and participating securities based upon their respective rights to receive distributed and undistributed earnings. The
F-12
Company's Series A, Series B, Series B-1, Series B-2, Series B-3, Series C, Series C-1, Series E, Series F, Series F-1 and Series F-2 preferred stock (hereinafter referred to as "Preferred Stock") are each entitled to participate in distributions that are made to common stock shareholders on an as converted basis, when and if declared by the Board of Directors.
For periods with net income, net income per common share information is computed using the two-class method. Under the two-class method, basic net income per common share is computed by dividing the net income attributable to common stockholders by the weighted average number of shares of Common stock outstanding during the period. Basic net income attributable to common stockholders is computed by subtracting from net income the portion of current year earnings that the Preferred shareholders would have been entitled to receive pursuant to their dividend rights had all of the year's earnings been distributed. No such adjustment to earnings is made during periods with a net loss, as the holders of the convertible Preferred shares have no obligation to fund losses. Diluted net income (loss) per common share is computed under the two class method by using the weighted-average number of shares of Common stock outstanding, plus, for periods with net income attributable to common stock, the potential dilutive effects of stock options and warrants. In addition, the Company analyzes the potential dilutive effect of the outstanding Preferred stock under the "if-converted" method when calculating diluted earnings per share, in which it is assumed that the outstanding Preferred stock converts into Common stock at the beginning of the period. The Company reports the more dilutive of the approaches (two class or "if-converted") as their diluted net income per share during the period.
F-13
The following table sets forth the computation of basic and diluted net income (loss) per share for the periods indicated:
| |
Year ended December 31, | ||||||||||||
|---|---|---|---|---|---|---|---|---|---|---|---|---|---|
| |
2010 |
2009 |
2008 |
2010 (Pro forma) |
|||||||||
| |
|
|
|
(unaudited) |
|||||||||
Basic net income (loss) per common share calculation: |
|||||||||||||
Net income (loss) |
$ | 8,889 | $ | (35,466 | ) | $ | (32,224 | ) | 8,889 | ||||
Less: Undistributed earnings allocated to participating securities |
(7,774 | ) | — | — | — | ||||||||
Plus: Charges related to preferred stock warrant liability |
— | — | — | 239 | |||||||||
Net income (loss) attributable to common shareholders—basic |
1,115 | (35,466 | ) | (32,224 | ) | 9,128 | |||||||
Basic weighted average common shares |
1,519,124 | 1,494,124 | 1,420,786 | 12,370,295 | |||||||||
Basic net income (loss) per share |
$ | 0.73 | $ | (23.74 | ) | $ | (22.68 | ) | $ | 0.74 | |||
Diluted net income (loss) per common share calculation: |
|||||||||||||
Net income (loss) |
$ | 8,889 | $ | (35,466 | ) | $ | (32,224 | ) | $ | 8,889 | |||
Less: Undistributed earnings allocated to participating securities |
(7,774 | ) | — | — | — | ||||||||
Plus: Charges related to preferred stock warrant liability |
— | — | — | 239 | |||||||||
Net income (loss) attributable to common shareholders—diluted |
1,115 | (35,466 | ) | (32,224 | ) | 9,128 | |||||||
Weighted average shares used to compute basic net income (loss) per share |
1,519,124 | 1,494,124 | 1,420,786 | 12,370,295 | |||||||||
Effect of potentially dilutive securities: |
|||||||||||||
Employee stock options |
4,059 | — | — | 4,059 | |||||||||
Weighted average shares used to compute diluted net income per share |
1,523,183 | 1,494,124 | 1,420,786 | 12,374,354 | |||||||||
Diluted net income (loss) per share |
$ | 0.73 | $ | (23.74 | ) | $ | (22.68 | ) | $ | 0.74 | |||
For the year ended December 31, 2010, the Company presented diluted net income per common share using the two-class method, which results in the same diluted net income per share value as calculated using the "if-converted" method. For the years ended December 31, 2009 and 2008 in which we reported net losses, there is no dilutive effect under either the two-class or "if-converted" method.
Diluted net (loss) income per share for the years presented do not reflect the following potential common shares, as the effect would be antidilutive:
| |
December 31, | Pro forma December 31, 2010 |
|||||||||||
|---|---|---|---|---|---|---|---|---|---|---|---|---|---|
| |
2010 |
2009 |
2008 |
||||||||||
| |
|
|
|
(unaudited) |
|||||||||
Stock options and warrants |
410,302 | 442,351 | 486,731 | 410,302 | |||||||||
Convertible preferred stock |
— | 10,620,038 | 7,882,879 | — | |||||||||
Total |
410,302 | 11,062,389 | 8,369,610 | 410,302 | |||||||||
F-14
The unaudited pro forma net income per share is computed using the weighted-average number of shares of Common stock outstanding and assumes the conversion of all outstanding shares of Preferred stock into an aggregate of 10,851,171 shares of Common stock upon completion of the Company's planned initial public offering (IPO), as if such conversion had occurred at the beginning of the period. The pro forma effect of the conversion of the Preferred shares is higher than the Preferred shares outstanding during the period, as the Series B-1 Preferred shares convert into Common shares at a ratio of one to 1.16 upon an IPO. In addition, pro forma net income per share assumes that the Preferred stock warrants have been automatically converted to Common stock warrants at the beginning of the period. Accordingly, the amounts recorded to mark the Preferred stock warrants to market have been added back to net income to arrive at net income attributable to common shares—pro forma. The Company believes the unaudited pro forma net income per share provides material information to investors, as the conversion of the Company's Preferred stock to Common stock is expected to occur upon the closing of an IPO and the Preferred stock warrants will be converted to Common stock warrants upon the closing of an IPO, and therefore the disclosure of pro forma net income per share thus provides a measure of net income per share that is comparable to what will be reported by the Company as a public company.
Reverse stock split
During the quarter ended March 31, 2011, the Company effected a 1:52 reverse stock split of its Common stock and Preferred stock. All shares, stock options, warrants to purchase common stock and per share information presented in the consolidated financial statements have been adjusted to reflect the reverse stock split on a retroactive basis for all periods presented.
Recent Accounting Pronouncements
In January 2010, the Financial Accounting Standards Board ("FASB") issued updated guidance related to fair value measurements and disclosures, which requires a reporting entity to disclose separately the amounts of significant transfers in and out of Level 1 and Level 2 fair value measurements and to describe the reasons for the transfers. In addition, in the reconciliation for fair value measurements using significant unobservable inputs, or Level 3, a reporting entity should disclose separately information about purchases, sales, issuances, and settlements (that is, on a gross basis rather than on a net basis). The updated guidance also requires that an entity should provide fair value measurement disclosures for each class of assets and liabilities and disclosures about the valuation techniques and inputs used to measure fair value for both recurring and non-recurring fair value measurements for Level 2 and Level 3 fair value measurements. The updated guidance is effective for interim or annual financial reporting periods beginning after December 15, 2009, except for the disclosures about purchases, sales, issuances, and settlements in the roll-forward activity in Level 3 fair value measurements, which are effective for fiscal years beginning after December 15, 2010 and for interim periods within those fiscal years. The Company adopted the updated guidance in the first quarter of 2010, and the impact on the consolidated financial statements was not material.
(3) Acquisition and dissolution of PGT Photonics, S.p.A.
On July 24, 2008, the Company purchased PGT for an aggregate purchase price of $47,729. The acquisition was accounted for using the purchase method of accounting and accordingly, the
F-15
purchase price has been allocated to the assets acquired and the liabilities assumed, based on their estimated fair values at the date of acquisition. Based upon the valuation of the tangible and intangible acquired assets and assumed liabilities, the Company allocated the total cost of the acquisition as of July 24, 2008 as follows:
Assets acquired |
||||||
Current assets (including cash of $28,111) |
$ | 38,670 | ||||
Property and equipment |
15,200 | |||||
Intangible assets: |
||||||
In-process research and development |
510 | |||||
Customer relationships |
4,980 | |||||
Current technology |
4,300 | |||||
Trade name |
200 | |||||
Goodwill |
7,356 | |||||
Other assets |
1 | |||||
Total assets acquired |
71,217 | |||||
Current liabilities |
23,488 | |||||
Net assets acquired |
$ | 47,729 | ||||
As of December 31, 2008, due to the deterioration and continued uncertainty of the overall economic and industry conditions, the Company's annual impairment test for goodwill determined that the fair value of the Company was less than its carrying value, and the Company concluded that goodwill was impaired, resulting in a goodwill impairment charge of $7,521 during 2008. In addition, the Company recognized an impairment charge of $2,320 during 2008 related to certain property and equipment and intangible assets associated with PGT.
In September 2009, the Company commenced dissolution of PGT. The Company synergized certain products, technology development and manufacturing infrastructure into its ongoing operations. A liquidator was assigned to settle PGT claims with the remaining PGT assets. The assignment of the liquidator effectively marked the Company's loss of control of PGT. As a result of this loss of control, the Company was required to deconsolidate the subsidiary. Due to the Italian liquidation of PGT, the Company retained no interest with value in PGT. While the Company believes it has satisfied all outstanding PGT-related liabilities and has no material continuing obligations or commitments to PGT, it is possible that the Company may be subject to liabilities which, if substantial, could harm results of operations.
During the third quarter of 2009, an asset impairment charge of $3,221 was recorded related to the impairment of property and equipment of PGT. In addition, the Company recorded a charge of $2,800 within costs of revenues related to a write-down of PGT inventory, and a charge of $600 within general and administrative expenses to write off uncollectible PGT receivables. Also in 2009, prior to deconsolidation, PGT incurred expenses totaling $6,465 related to severance and liquidation expenses incurred related to the down-sizing and dissolution of PGT. There were no assets and liabilities of PGT presented in the consolidated balance sheet as of December 31, 2010 or 2009. Included in the Company's consolidated statement of operations for 2009 and 2008 were revenues of $3,384 and $3,487 and a net loss of $(24,747) and $(17,447), respectively, for PGT, including impairment charges. The Company's
F-16
consolidated statement of cash flows for 2009 reflects the use of cash in the amount of $14,855 related to PGT, including $6,906 in support of severance and liquidation activities.
PGT has not been classified as a discontinued operation within the consolidated financial statements due to the migration of significant cash flows to the Company's ongoing operations.
(4) Inventories
The following is a summary of inventories, net:
| |
December 31, | ||||||
|---|---|---|---|---|---|---|---|
| |
2010 |
2009 |
|||||
Raw materials |
$ | 8,443 | $ | 4,561 | |||
Work in progress |
8,917 | 4,612 | |||||
Finished products |
2,166 | 1,897 | |||||
Total |
$ | 19,526 | $ | 11,070 | |||
Cost of revenues include $3,723 and $2,048 of inventory write-downs during the years ended December 31, 2009 and 2008, respectively. During the year ended December 31, 2010, the amount of inventory write-downs included in cost of revenues was de minimis.
(5) Property and equipment
The following is a summary of property and equipment, net:
| |
December 31, | ||||||
|---|---|---|---|---|---|---|---|
| |
2010 |
2009 |
|||||
Computers and related equipment |
$ | 903 | $ | 736 | |||
Office and lab furniture |
893 | 893 | |||||
Equipment and machinery |
21,809 | 18,970 | |||||
Vehicles |
20 | 20 | |||||
Leasehold improvements |
724 | 718 | |||||
Construction in progress |
2,176 | 2,323 | |||||
|
26,525 | 23,660 | |||||
Less accumulated depreciation |
(18,188 | ) | (15,415 | ) | |||
Total |
$ | 8,337 | $ | 8,245 | |||
Depreciation expense totaled $2,831, $6,034 and $4,980 for the years ended December 31, 2010, 2009 and 2008, respectively.
F-17
(6) Intangible assets
Intangible assets consist of the following:
| |
December 31, 2010 | December 31, 2009 | |||||||||||||||||
|---|---|---|---|---|---|---|---|---|---|---|---|---|---|---|---|---|---|---|---|
| |
Gross amount |
Accumulated amortization |
Net amount |
Gross amount |
Accumulated amortization |
Net amount |
|||||||||||||
Technology |
$ | 8,829 | $ | (5,675 | ) | $ | 3,154 | $ | 8,829 | $ | (4,153 | ) | $ | 4,676 | |||||
Customer relationships |
4,826 | (1,815 | ) | 3,011 | 4,826 | (1,192 | ) | 3,634 | |||||||||||
Other |
944 | (944 | ) | — | 944 | (944 | ) | — | |||||||||||
Total |
$ | 14,599 | $ | (8,434 | ) | $ | 6,165 | $ | 14,599 | $ | (6,289 | ) | $ | 8,310 | |||||
Amortization expense amounted to $2,145, $2,520 and $1,991 for the years ended December 31, 2010, 2009 and 2008, respectively.
The following represents the Company's expected amortization expense for the years ending December 31:
2011 |
$ | 1,233 | ||
2012 |
1,079 | |||
2013 |
1,079 | |||
2014 |
1,079 | |||
2015 |
844 | |||
Thereafter |
851 | |||
|
$ | 6,165 | ||
(7) Fair value measurements
Fair value is defined as the price that would be received from selling an asset or paid to transfer a liability in an orderly transaction between market participants at the measurement date. When determining the fair value measurements for assets and liabilities required or permitted to be recorded at fair value, the Company considers the principal or most advantageous market in which it would transact and it considers assumptions that market participants would use when pricing the asset or liability. The Company evaluates the fair value of certain assets and liabilities using the following fair value hierarchy which ranks the quality and reliability of inputs, or assumptions, used in the determination of fair value:
- •
- Level 1—quoted prices in active markets for identical assets and liabilities
- •
- Level 2—inputs other than Level 1 quoted prices that are directly or indirectly observable
- •
- Level 3—unobservable inputs that are not corroborated by market data
The Company evaluates assets and liabilities subject to fair value measurements on a recurring and nonrecurring basis to determine the appropriate level to classify them for each reporting period. This determination requires significant judgments to be made by the Company. The
F-18
following table sets forth the Company's assets and liabilities that were measured at fair value on a recurring basis as of December 31, 2010 and 2009, by level within the fair value hierarchy:
| |
|
Fair value measurement using |
|||||||||||
|---|---|---|---|---|---|---|---|---|---|---|---|---|---|
| |
Amounts at fair value |
||||||||||||
| |
Level 1 |
Level 2 |
Level 3 |
||||||||||
As of December 31, 2010 |
|||||||||||||
Assets |
|||||||||||||
Cash and cash equivalents |
$ | 12,397 | $ | 12,397 | $ | — | $ | — | |||||
Liabilities |
|||||||||||||
Preferred stock warrant liability |
$ | 239 | $ | — | $ | — | $ | 239 | |||||
As of December 31, 2009 |
|||||||||||||
Assets |
|||||||||||||
Cash and cash equivalents |
$ | 9,122 | $ | 9,122 | $ | — | $ | — | |||||
Liabilities |
|||||||||||||
Preferred stock warrant liability |
$ | — | $ | — | $ | — | $ | — | |||||
The carrying amounts of the Company's long-term liabilities approximate their fair value because the interest rate is reflective of rates that the Company could currently obtain on debt with similar terms and conditions.
The Preferred stock warrants are classified as liabilities in the accompanying balance sheets as the warrant entitles the holder to purchase Preferred stock which is considered contingently redeemable. The fair value of the Preferred stock warrant liability is based on Level 3 inputs. The Company's estimate of the fair value of its Preferred stock warrant liability was determined by utilizing a Black-Scholes based option pricing model, which considered the estimated fair value of these preferred stock warrants in both an IPO scenario, in which the warrants have attributes of Common stock warrants and a merger and acquisitions scenario, in which the warrants have attributes of Preferred stock warrants.
As of December 31, 2010, the fair value of the Preferred stock warrants was $239. At December 31, 2009, the fair value of the Preferred stock warrants was de minimis. For the year ended December 31, 2010, the Company recorded a charge for $239 in other expenses to recognize the change in the fair value of the Preferred stock warrants.
(8) Accrued and other current liabilities
Accrued and other current liabilities consist of the following:
| |
December 31, | ||||||
|---|---|---|---|---|---|---|---|
| |
2010 |
2009 |
|||||
Employee related |
$ | 2,939 | $ | 1,602 | |||
Deferred revenue |
583 | 1,722 | |||||
Other accrued liabilities |
1,101 | 720 | |||||
|
$ | 4,623 | $ | 4,044 | |||
F-19