Attached files
| file | filename |
|---|---|
| 8-K - FORM 8-K - PRUDENTIAL FINANCIAL INC | d250297d8k.htm |
 PRUDENTIAL FINANCIAL,
INC.
NOVEMBER
3,
2011
Exhibit 99.1 |
 2
Forward-Looking Statements
Certain of the statements included in this presentation constitute
forward-looking statements within the meaning of the U. S. Private Securities
Litigation
Reform
Act
of
1995.
Words
such
as
“expects,”
“believes,”
“anticipates,”
“includes,”
“plans,”
“assumes,”
“estimates,”
“projects,”
“intends,”
“should,”
“will,”
“shall,”
or variations of such words are generally part of forward-looking
statements. Forward-looking statements are made based on
management’s current expectations and beliefs concerning future developments and their potential effects upon Prudential Financial, Inc. and its
subsidiaries.
There
can
be
no
assurance
that
future
developments
affecting
Prudential
Financial,
Inc.
and
its
subsidiaries
will
be
those
anticipated
by
management.
These
forward-looking
statements
are
not
a
guarantee
of
future
performance
and
involve
risks
and
uncertainties,
and
there
are
certain important factors that could cause actual results to differ, possibly
materially, from expectations or estimates reflected in such forward-
looking statements, including, among others: (1)
general economic, market and political conditions, including the
performance and fluctuations of
fixed income, equity, real estate and other financial markets; (2) the availability
and cost of additional debt or equity capital or external financing for our
operations; (3) interest rate fluctuations or prolonged periods of low
interest rates; (4) the degree to which we choose not to hedge risks, or the
potential ineffectiveness or insufficiency of hedging or risk management strategies
we do implement, with regard to variable annuity or other product
guarantees;
(5)
any
inability
to
access
our
credit
facilities;
(6)
reestimates
of
our
reserves
for
future
policy
benefits
and
claims;
(7)
differences
between actual experience regarding mortality, morbidity, persistency, surrender
experience, interest rates or market returns and the assumptions we
use
in
pricing
our
products,
establishing
liabilities
and
reserves
or
for
other
purposes;
(8)
changes
in
our
assumptions
related
to
deferred
policy
acquisition
costs,
value
of
business
acquired
or
goodwill;
(9)
changes
in
assumptions
for
retirement
expense;
(10)
changes
in
our
financial
strength
or credit ratings; (11) statutory reserve requirements associated with term and
universal life insurance policies under Regulation XXX and Guideline
AXXX;
(12)
investment
losses,
defaults
and
counterparty
non-performance;
(13)
competition
in
our
product
lines
and
for
personnel;
(14)
difficulties
in
marketing
and
distributing
products
through
current
or
future
distribution
channels;
(15)
changes
in
tax
law;
(16)
economic,
political,
currency
and
other
risks
relating
to
our
international
operations;
(17)
fluctuations
in
foreign
currency
exchange
rates
and
foreign
securities
markets;
(18)
regulatory or legislative changes, including the recently enacted Dodd-Frank
Wall Street Reform and Consumer Protection Act; (19) inability to
protect
our
intellectual
property
rights
or
claims
of
infringement
of
the
intellectual
property
rights
of
others;
(20)
adverse
determinations
in
litigation
or
regulatory matters and our exposure to contingent liabilities, including in
connection with our divestiture or winding down of businesses; (21)
domestic or international military actions, natural or man-made disasters
including terrorist activities or pandemic disease, or other events
resulting
in
catastrophic
loss
of
life;
(22)
ineffectiveness
of
risk
management
policies
and
procedures
in
identifying,
monitoring
and
managing
risks;
(23)
effects of acquisitions, divestitures and restructurings, including possible
difficulties in integrating and realizing the projected results of
acquisitions,
including
risks
associated
with
the
acquisition
of
certain
insurance
operations
in
Japan;
(24)
interruption
in
telecommunication,
information
technology
or
other
operational
systems
or
failure
to
maintain
the
security,
confidentiality
or
privacy
of
sensitive
data
on
such
systems;
(25)
changes
in
statutory
or
U.S.
GAAP
accounting
principles,
practices
or
policies;
(26)
Prudential
Financial,
Inc.’s
primary
reliance,
as
a
holding
company, on dividends or distributions from its subsidiaries to meet debt payment
obligations and the ability of the subsidiaries to pay such dividends
or
distributions
in
light
of
our
ratings
objectives
and/or
applicable
regulatory
restrictions;
and
(27)
risks
due
to
the
lack
of
legal
separation
between our Financial Services Businesses and our Closed Block Business. Prudential
Financial, Inc. does not intend, and is under no obligation, to update any
particular forward-looking statement included in this presentation. See
“Risk Factors” included in Prudential Financial, Inc.’s
Annual Report on Form 10-K and Quarterly Reports on Form 10-Q for discussion of
certain risks relating to our businesses and investment in our securities.
_______________________________________________________________________________
Prudential Financial, Inc. of the United States is not affiliated with Prudential
PLC which is headquartered in the United Kingdom. |
 Non–GAAP Measures
This
presentation
includes
references
to
“adjusted
operating
income.”
Adjusted
operating
income
is
a
non-GAAP
measure
of
performance
of
our
Financial
Services
Businesses
(“FSB”).
Adjusted
operating
income
excludes
“Realized
investment
gains
(losses),
net,”
as
adjusted,
and
related
charges
and
adjustments.
A
significant
element
of
realized
investment
gains
and
losses are impairments and credit-related and interest rate-related gains
and losses. Impairments and losses from sales of credit-impaired securities, the timing of which depends largely
on market credit cycles, can vary considerably across periods. The timing of other
sales that would result in gains or losses, such as interest rate-related gains or losses, is largely
subject
to
our
discretion
and
influenced
by
market
opportunities
as
well
as
our
tax
and
capital
profile.
Realized investment gains (losses) within certain of our businesses for which such
gains (losses) are a principal source of earnings, and those associated with terminating hedges of
foreign currency earnings and current period yield adjustments are included in
adjusted operating income. Adjusted operating income excludes realized investment gains and losses from
products
that
contain
embedded
derivatives,
and
from
associated
derivative
portfolios
that
are
part
of
a
hedging
program
related
to
the
risk
of
those
products.
Adjusted
operating
income
also excludes gains and losses from changes in value of certain assets and
liabilities relating to foreign currency exchange movements that have been economically hedged or
considered part of our capital funding strategies for our international
subsidiaries, as well as gains and losses on certain investments that are classified as other trading account assets.
Adjusted operating income also excludes investment gains and losses on trading
account assets supporting insurance liabilities and changes in experience-rated contractholder liabilities
due to asset value changes, because these recorded changes in asset and liability
values are expected to ultimately accrue to contractholders. Trends in the underlying profitability of
our
businesses
can
be
more
clearly
identified
without
the
fluctuating
effects
of
these
transactions.
In
addition,
adjusted
operating
income
excludes
the
results
of
divested
businesses,
which are not relevant to our ongoing operations. Discontinued operations, which is
presented as a separate component of net income under GAAP, is also excluded from adjusted
operating income.
We
believe
that
the
presentation
of
adjusted
operating
income
as
we
measure
it
for
management
purposes
enhances
understanding
of
the
results
of
operations
of
the
Financial
Services
Businesses by highlighting the results from ongoing operations and the underlying
profitability of our businesses. However, adjusted operating income is not a substitute for income
determined in accordance with GAAP, and the adjustments made to derive adjusted
operating income are important to an understanding of our overall results of operations.
Return on equity (“ROE”) based on adjusted operating income is determined
by dividing adjusted operating income after-tax (giving effect to the direct equity adjustment for earnings per
share calculation) by average attributed equity for the Financial Services
Businesses excluding accumulated other comprehensive income related to unrealized gains and losses on
investments and accumulated other comprehensive income related to pension and
postretirement benefits. Beginning on January 1, 2012, ROE will be determined using average
attributed equity for the Financial Services Businesses excluding all of
accumulated other comprehensive income, which is indicated on slide 11 by the reference to “DAC/CTA policy
change.”
Our guidance for Common Stock earnings per share and our expectations of ROE are
based on after-tax adjusted operating income. Because we do not predict future realized
investment gains / losses or recorded changes in asset and liability values that
are expected to ultimately accrue to contractholders, we cannot provide a measure of our Common Stock
earnings
per
share
or
ROE
expectations
based
on
income
from
continuing
operations
of
the
Financial
Services
Businesses,
which
is
the
GAAP
measure
most
comparable
to
adjusted
operating income.
For
additional
information
about
adjusted
operating
income
and
the
comparable
GAAP
measure,
including
reconciliation
between
the
two,
please
refer
to
our
Forms
10-K
and
10-Q
located
on
the
Investor
Relations
website
at
www.investor.prudential.com.
Additional
historical
information
relating
to
the
Company’s
financial
performance
is
also
located
on
the
Investor
Relations website.
The
information
referred
to
above
and
on
the
prior
page,
as
well
as
the
risks
of
our
businesses
described
in
our
Forms
10-K
and
10-Q,
should
be
considered
by
readers
when
reviewing
forward-looking statements contained in this presentation.
3 |
 PRUDENTIAL FINANCIAL,
INC.
NOVEMBER
3,
2011 |
 PRUDENTIAL FINANCIAL, INC.
FINANCIAL OUTLOOK
|
 Assumptions for 2012 Outlook
(1)
1)
Financial Services Businesses [FSB].
6 |
         $3.00
$3.50
$4.00
$4.50
$5.00
$5.50
$6.00
$6.50
$7.00
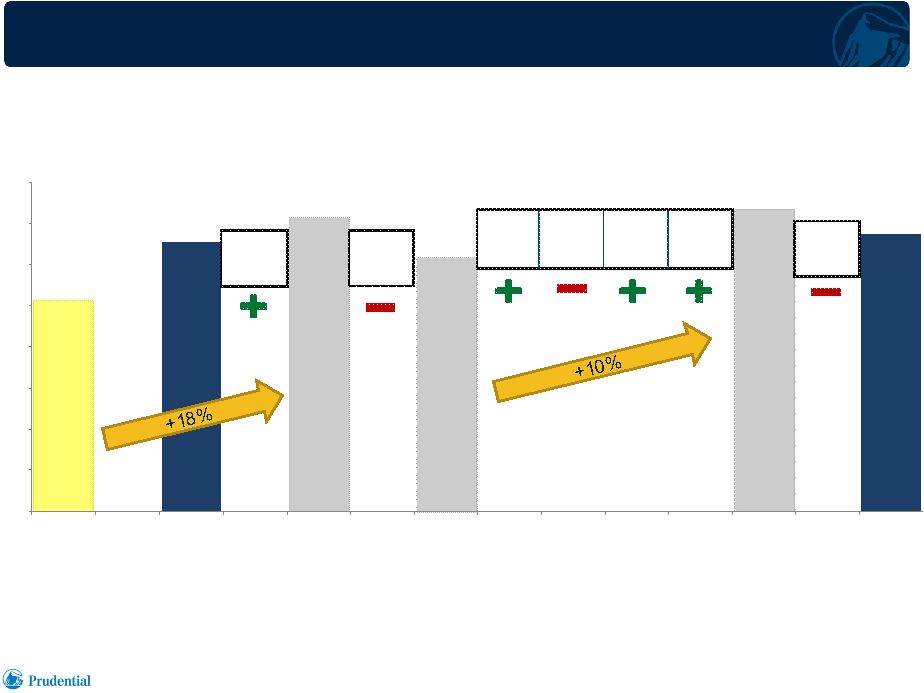
Financial Services Businesses
2012 FSB Earnings Guidance
1) Includes 10 months of Star & Edison earnings.
2011
Projected
[Reported]
(1)
2012
(Excl.
Star/Edison
Integration
Costs)
2012
Guidance
2010
Baseline
(Excl. DAC
Change)
$6.50 -
$6.90
$6.05 -
$6.15
$6.50 -
$6.60
$6.25 -
$6.35
$6.20 -
$6.60
2011
Baseline
Estimate
(Incl. DAC
Change)
(1)
$5.50-
$5.60
2011
Baseline
Estimate
(Excl. DAC
Change)
(1)
Unusual/
Non-
Recurring
Items
DAC
Accounting
Change
Capital
Deployment
Organic
Business
Growth
Corporate
& Other
Star/Edison
Earnings
(Excl.
Integration
Costs)
Star/Edison
Integration
Costs
7 |
     $3.00
$3.50
$4.00
$4.50
$5.00
$5.50
$6.00
$6.50
$7.00
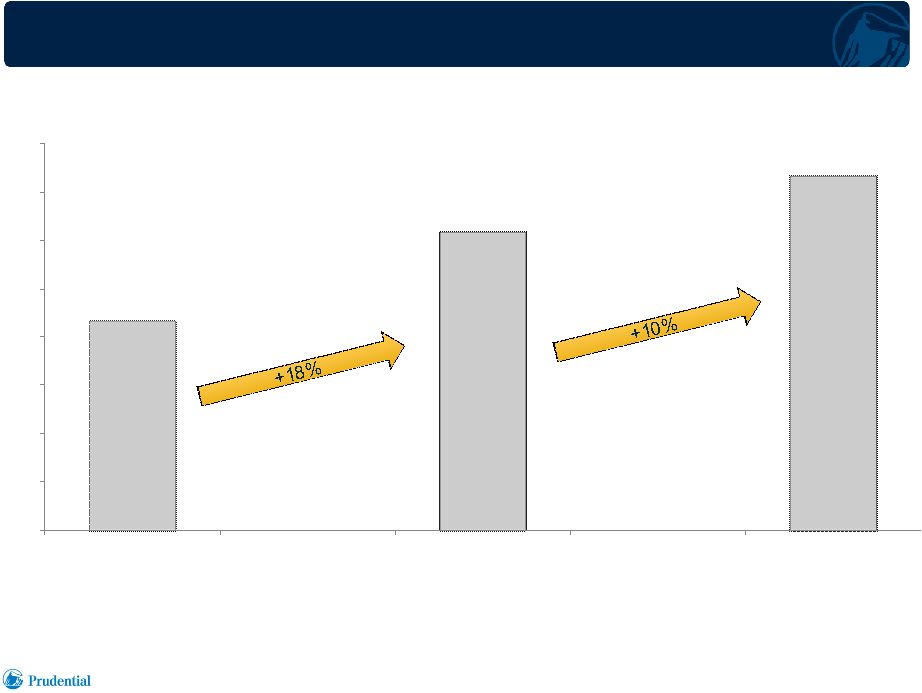
Financial Services Businesses
2012 FSB Earnings Guidance
2011
Baseline
Estimate
(Incl. DAC
Change)
$6.45 -
$6.55
$6.05 -
$6.15
2010
Baseline
(Incl. DAC
Change)
2012
Baseline
Guidance
(Incl. DAC
Change)
$6.50 -
$6.90
$5.10-
$5.20
8 |
 2011
Capital and Liquidity Financial Services Businesses (“FSB”)
1)
Required
Capital
represents
the
amount
of
GAAP
capital
necessary
to
support
business
risk
based
on
AA
rating
targets
at
the
operating
entities.
2)
Excludes accumulated other comprehensive income related to unrealized gains and
losses on investments and pension and postretirement benefits. 3)
Based on targeted Risk Based Capital (“RBC”) ratio of 400% for Prudential
Insurance. 4)
For the purposes of calculating this ratio, PFI’s outstanding hybrid
securities are considered 25% equity and 75% debt. 5)
Net cash includes cash, cash equivalents, and short-term investments, reduced
by commercial paper borrowings and cash held in an intra-company liquidity account at PFI.
6)
Prudential
Insurance
RBC
as
of
the
fiscal
year
end,
December
31,
2010.
The
inclusion
of
RBC
measures
is
intended
solely
for
the
information
of
investors
and
is
not
intended
for
the
purpose of ranking any insurance company or for use in connection with any
marketing, advertising or promotional activities. 7)
Calculated under new solvency margin rules as of fiscal year end March 31,
2011 and March 31, 2012. Gibraltar March 31, 2012 forecast is pro forma for the merger with Star/Edison.
($ in Billions)
12/31/2010 Pro-Forma for
Acquisition of Star/Edison
and Divestiture of Global
Commodities
12/31/2011
Required Capital
(1)
$35.0 –
$35.5
$37.0 -
$37.5
Attributed Equity
(2)
$29.2
$31.2
Capital Debt and Hybrids Outstanding
$10.3
$10.3
Total Capital Outstanding
$39.5
$41.5
Total
Available
On
Balance
Sheet
Capital
(3)
$4.0 –
$4.5
$4.0 -
$4.5
Estimated “Readily Deployable”
Capital
$2.2 –
$2.7
$2.2 -
$2.7
Capital Debt to Capital Ratio
(4)
25%
24%
Prudential Financial, Inc. Net Cash
(5)
~$3.0
~$3.2
Regulatory Capital Ratios
Prudential Insurance RBC
(6)
533%
>500%
POJ Solvency Margin Ratio
(7)
703%
>700%
Gibraltar Solvency Margin Ratio
(7)
657%
>650%
9 |
 Considerations for Long Term ROE
(1)
1)
Financial Services Businesses.
•
Capital Deployment
–
Funding Organic Growth, Acquisitions and/or Share Repurchases
•
Organic Business Growth
•
8% S&P Growth
•
US Dollar @ 78 Yen and 1,110 Won
•
Successful Integration of Star Edison
•
AOCI Treatment Consistent with Peers
•
Debt to Capital @ 25%
10 |
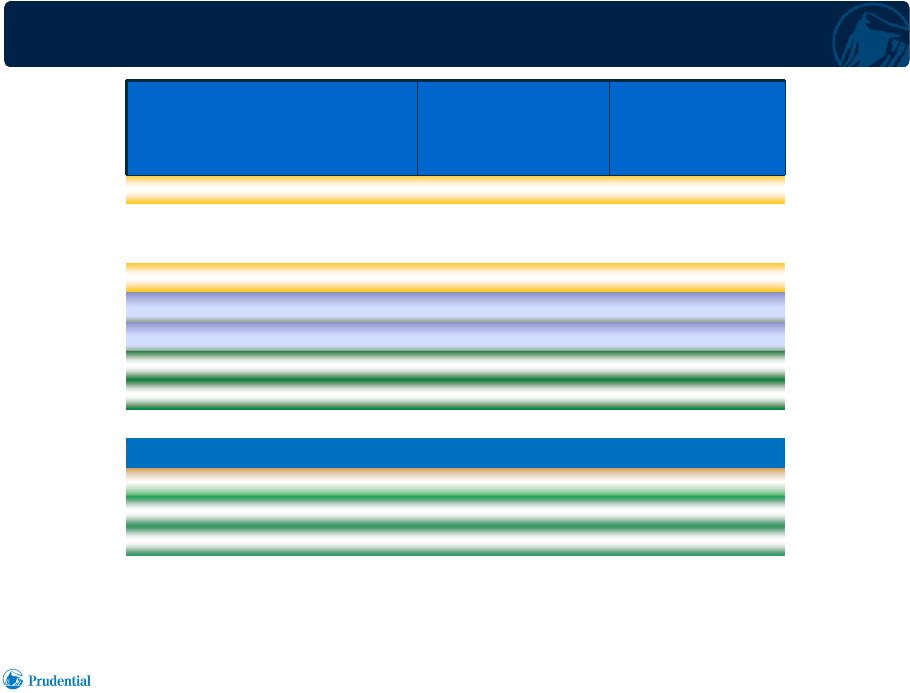
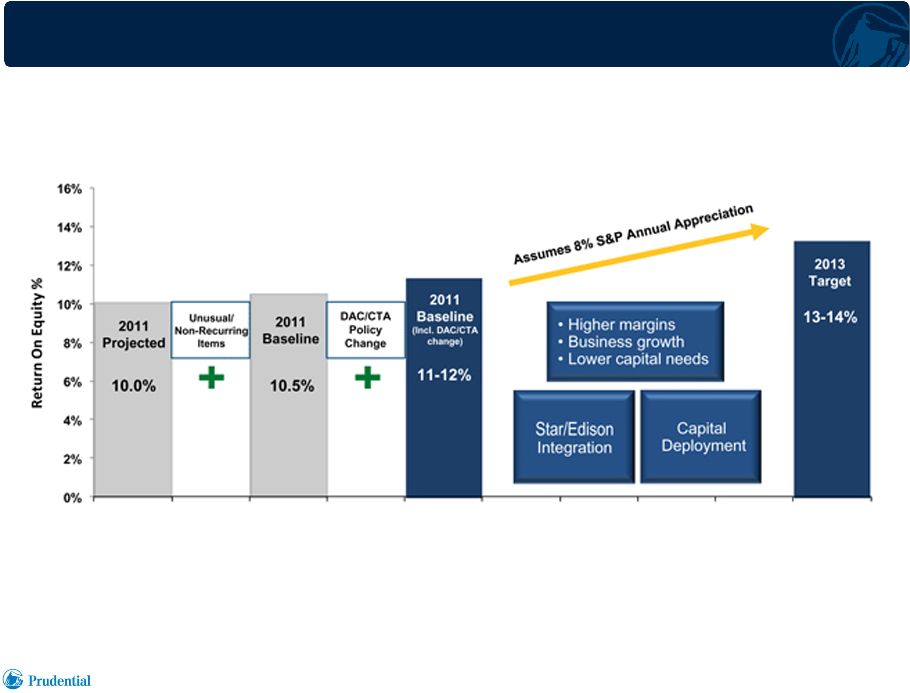 Business Plan for ROE Growth: 2011 –
2013
(1)
1) Financial Services Businesses.
11 |
 QUESTIONS AND ANSWERS PRUDENTIAL FINANCIAL,
INC.
NOVEMBER
3,
2011 |