Attached files
| file | filename |
|---|---|
| 8-K - FORM 8-K - Park Sterling Corp | c24042e8vk.htm |
| EX-99.1 - EX-99.1 - Park Sterling Corp | c24042exv99w1.htm |
Exhibit 99.2

| Park Sterling Corporation 2011Q3 Earnings Conference Call November 2, 2011 |

| Forward Looking Statements and Additional Information Forward Looking Statements This presentation contains, and Park Sterling Corporation and its management may make, certain statements that constitute "forward-looking statements" within the meaning of the Private Securities Litigation Reform Act of 1995. These statements can be identified by the fact that they do not relate strictly to historical or current facts and often use words such as "may," "plan," "contemplate," "anticipate," "believe," "intend," "continue," "expect," "project," "predict," "estimate," "could," "should," "would," "will," "goal," "target" and similar expressions. These forward-looking statements express management's current expectations, plans or forecasts of future events, results and condition, including financial and other estimates and expectations regarding the merger with Community Capital Corporation, the general business strategy of engaging in bank mergers, organic growth including branch openings and anticipated asset size, expansion of product capabilities, anticipated loan growth, refinement of the loan loss allowance methodology, recruiting of key leadership positions, decreases in construction and development loans and other changes in loan mix, changes in deposit mix, capital and liquidity levels, emerging regulatory expectations and measures, net interest income, credit trends and conditions, including loan losses, allowance, charge-offs, delinquency trends and nonperforming loan and asset levels, residential sales activity and other similar matters. These statements are not guarantees of future results or performance and by their nature involve certain risks and uncertainties that are based on management's beliefs and assumptions and on the information available to management at the time that these disclosures were prepared. Actual outcomes and results may differ materially from those expressed in, or implied by, any of these forward-looking statements. You should not place undue reliance on any forward-looking statement and should consider all of the following uncertainties and risks, as well as those more fully discussed in any of Park Sterling's filings with the SEC: failure to realize synergies and other financial benefits from the merger with Community Capital within the expected time frame; increases in expected costs or difficulties related to integration of the Community Capital merger; inability to identify and successfully negotiate and complete additional combinations with potential merger partners or to successfully integrate such businesses into Park Sterling, including the company's ability to realize the benefits and cost savings from and limit any unexpected liabilities acquired as a result of any such business combination; the effects of negative economic conditions, including stress in the commercial real estate markets or delay or failure of recovery in the residential real estate markets; changes in consumer and investor confidence and the related impact on financial markets and institutions; changes in interest rates; failure of assumptions underlying the establishment of our allowance; deterioration in the credit quality of our loan portfolios or in the value of the collateral securing those loans or in the value of guarantor support for those loans, where applicable; deterioration in the value of securities held in our investment securities portfolio; failure of assumptions underlying the utilization of our deferred tax assets; legal and regulatory developments; increased competition from both banks and nonbanks; changes in accounting standards, rules and interpretations, inaccurate estimates or assumptions in accounting and the impact on Park Sterling's financial statements; Park Sterling's ability to attract new employees; and management's ability to effectively manage credit risk, market risk, operational risk, legal risk, and regulatory and compliance risk. Forward-looking statements speak only as of the date they are made, and Park Sterling undertakes no obligation to update any forward-looking statement to reflect the impact of circumstances or events that arise after the date the forward-looking statement was made. Additional Information Certain financial measures contained herein represent non-GAAP financial measures. For more information about these non-GAAP financial measures and the presentation of the most directly comparable financial measures calculated in accordance with GAAP and accompanying reconciliations, see the appendix in this presentation. 2 |
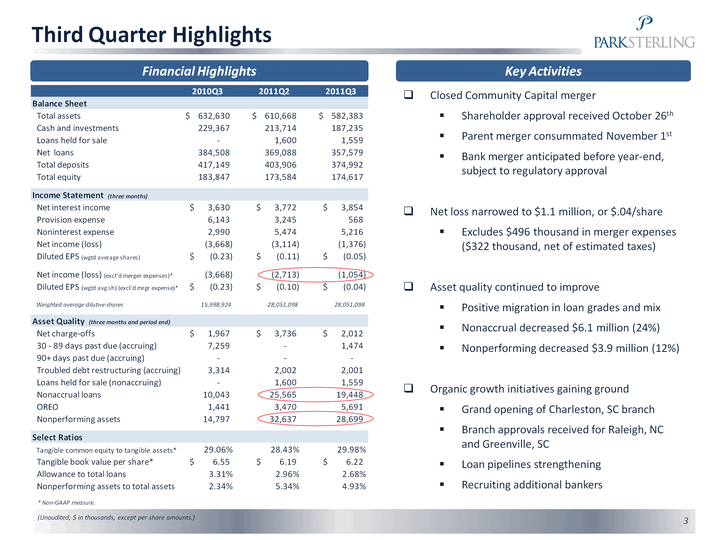
| Third Quarter Highlights 3 Key Activities Financial Highlights Closed Community Capital merger Shareholder approval received October 26th Parent merger consummated November 1st Bank merger anticipated before year-end, subject to regulatory approval Net loss narrowed to $1.1 million, or $.04/share Excludes $496 thousand in merger expenses ($322 thousand, net of estimated taxes) Asset quality continued to improve Positive migration in loan grades and mix Nonaccrual decreased $6.1 million (24%) Nonperforming decreased $3.9 million (12%) Organic growth initiatives gaining ground Grand opening of Charleston, SC branch Branch approvals received for Raleigh, NC and Greenville, SC Loan pipelines strengthening Recruiting additional bankers (Unaudited; $ in thousands, except per share amounts.) |
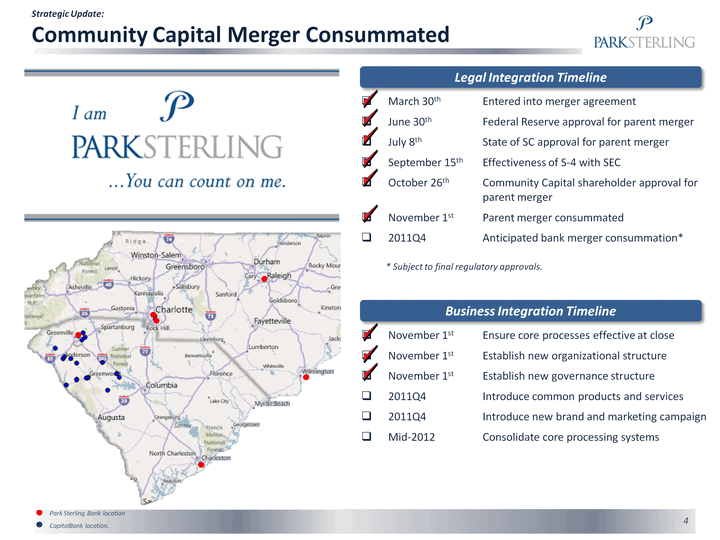
| Strategic Update: Community Capital Merger Consummated March 30th Entered into merger agreement June 30th Federal Reserve approval for parent merger July 8th State of SC approval for parent merger September 15th Effectiveness of S-4 with SEC October 26th Community Capital shareholder approval for parent merger November 1st Parent merger consummated 2011Q4 Anticipated bank merger consummation* * Subject to final regulatory approvals. 4 Legal Integration Timeline Business Integration Timeline November 1st Ensure core processes effective at close November 1st Establish new organizational structure November 1st Establish new governance structure 2011Q4 Introduce common products and services 2011Q4 Introduce new brand and marketing campaign Mid-2012 Consolidate core processing systems Park Sterling Bank location CapitalBank location. |
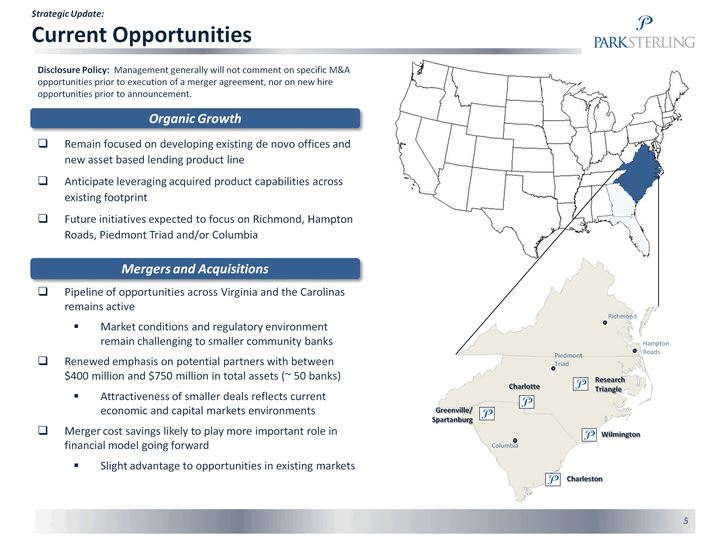
| 5 Disclosure Policy: Management generally will not comment on specific M&A opportunities prior to execution of a merger agreement, nor on new hire opportunities prior to announcement. Charleston Columbia Greenville/ Spartanburg Wilmington Charlotte Research Triangle Piedmont Triad Richmond Hampton Roads Mergers and Acquisitions Organic Growth Remain focused on developing existing de novo offices and new asset based lending product line Anticipate leveraging acquired product capabilities across existing footprint Future initiatives expected to focus on Richmond, Hampton Roads, Piedmont Triad and/or Columbia Pipeline of opportunities across Virginia and the Carolinas remains active Market conditions and regulatory environment remain challenging to smaller community banks Renewed emphasis on potential partners with between $400 million and $750 million in total assets (~ 50 banks) Attractiveness of smaller deals reflects current economic and capital markets environments Merger cost savings likely to play more important role in financial model going forward Slight advantage to opportunities in existing markets Strategic Update: Current Opportunities |
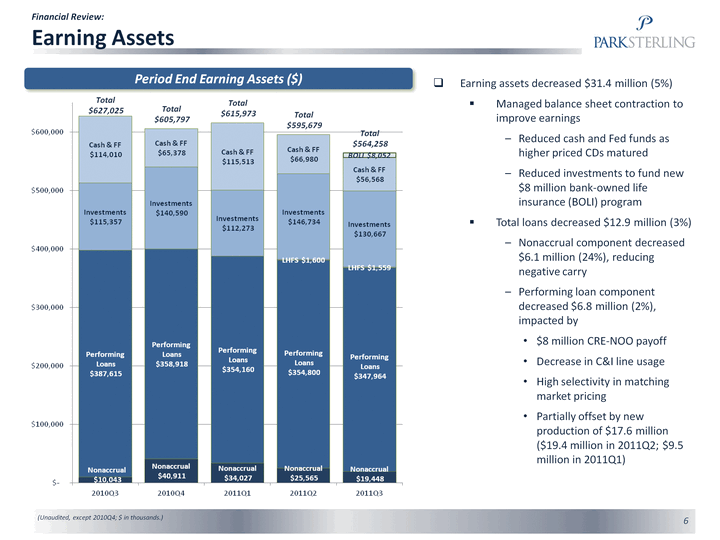
| Financial Review: Earning Assets 6 (Unaudited, except 2010Q4; $ in thousands.) Period End Earning Assets ($) Earning assets decreased $31.4 million (5%) Managed balance sheet contraction to improve earnings Reduced cash and Fed funds as higher priced CDs matured Reduced investments to fund new $8 million bank-owned life insurance (BOLI) program Total loans decreased $12.9 million (3%) Nonaccrual component decreased $6.1 million (24%), reducing negative carry Performing loan component decreased $6.8 million (2%), impacted by $8 million CRE-NOO payoff Decrease in C&I line usage High selectivity in matching market pricing Partially offset by new production of $17.6 million ($19.4 million in 2011Q2; $9.5 million in 2011Q1) |
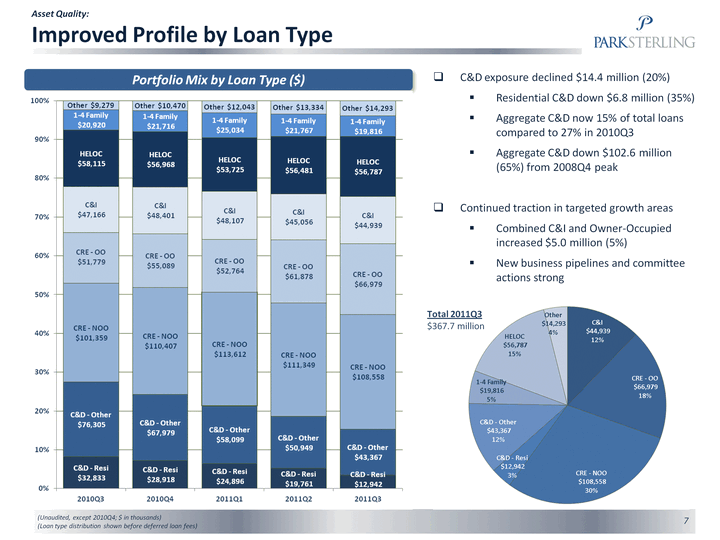
| 7 Portfolio Mix by Loan Type ($) (Unaudited, except 2010Q4; $ in thousands) (Loan type distribution shown before deferred loan fees) Asset Quality: Improved Profile by Loan Type C&D exposure declined $14.4 million (20%) Residential C&D down $6.8 million (35%) Aggregate C&D now 15% of total loans compared to 27% in 2010Q3 Aggregate C&D down $102.6 million (65%) from 2008Q4 peak Continued traction in targeted growth areas Combined C&I and Owner-Occupied increased $5.0 million (5%) New business pipelines and committee actions strong Total 2011Q3 $367.7 million |

| Financial Review: Funding 8 (Unaudited, except 2010Q4; $ in thousands.) Period End Funding ($) Funding profile continues to improve Demand deposits increased $0.7 million (2%) Represent 7% of total funding base, up from 5% in 2010Q3 MMDA, NOW and savings deposits increased $9.1 million (8%) Represent 21% of total funding base, up from 12% in 2010Q3 Local CDs contracted $28.2 million (18%) through lower pricing Represent 22% of total funding base, down from 31% in 2010Q3 Brokered CDs contracted $10.5 million (11%) through release Represent 15% of total funding base, down from 19% in 2010Q3 Funded debt essentially unchanged Extended maturities and reduced rates on $20 million FHLB debt Equity increased to 30.2% of total funding base Capacity for organic growth and M&A opportunities |

| Financial Review: Capital and Liquidity Ratios Remain Strong 9 Tangible Common Equity* / Tangible Assets* (%) Leverage Ratio (%) Peer group percentiles include depository institutions headquartered in Virginia and the Carolinas with $750 million to $4 billion in total assets. (Source: SNL) Source: SNL and PSTB internal data. * Non-GAAP measure Wholesale Funding (%) Liquidity Ratio |
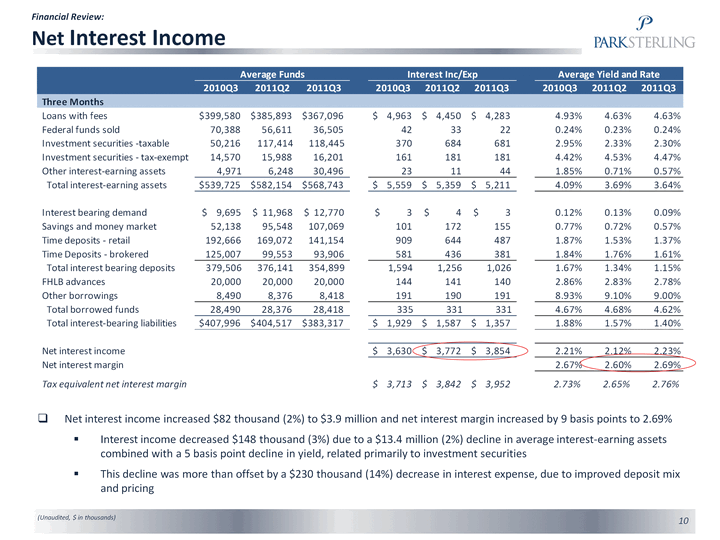
| Financial Review: Net Interest Income 10 Net interest income increased $82 thousand (2%) to $3.9 million and net interest margin increased by 9 basis points to 2.69% Interest income decreased $148 thousand (3%) due to a $13.4 million (2%) decline in average interest-earning assets combined with a 5 basis point decline in yield, related primarily to investment securities This decline was more than offset by a $230 thousand (14%) decrease in interest expense, due to improved deposit mix and pricing (Unaudited, $ in thousands) |
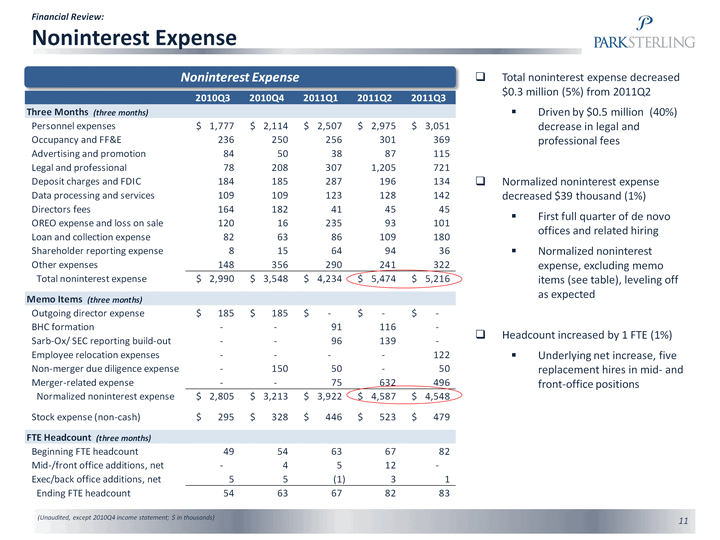
| Financial Review: Noninterest Expense 11 Noninterest Expense Total noninterest expense decreased $0.3 million (5%) from 2011Q2 Driven by $0.5 million (40%) decrease in legal and professional fees Normalized noninterest expense decreased $39 thousand (1%) First full quarter of de novo offices and related hiring Normalized noninterest expense, excluding memo items (see table), leveling off as expected Headcount increased by 1 FTE (1%) Underlying net increase, five replacement hires in mid- and front-office positions (Unaudited, except 2010Q4 income statement; $ in thousands) |
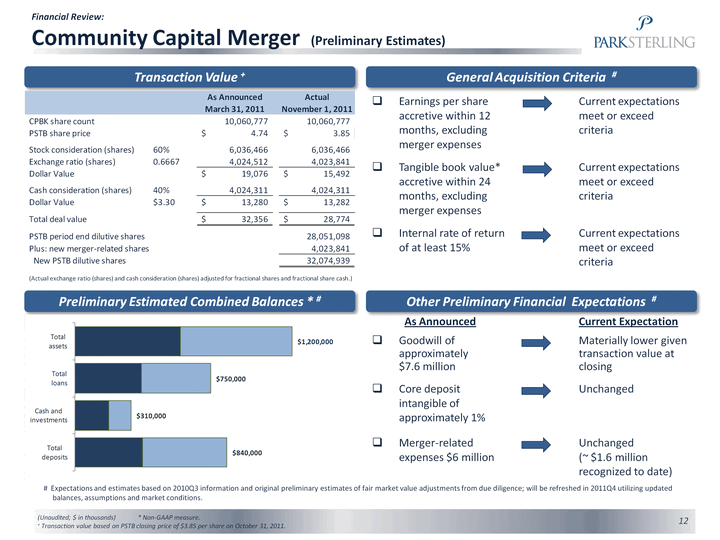
| 12 Transaction Value + General Acquisition Criteria # Earnings per share accretive within 12 months, excluding merger expenses (Unaudited; $ in thousands) * Non-GAAP measure. + Transaction value based on PSTB closing price of $3.85 per share on October 31, 2011. Financial Review: Community Capital Merger (Preliminary Estimates) Tangible book value* accretive within 24 months, excluding merger expenses Internal rate of return of at least 15% As Announced Goodwill of approximately $7.6 million Current expectations meet or exceed criteria Current expectations meet or exceed criteria Current expectations meet or exceed criteria Current Expectation Materially lower given transaction value at closing Preliminary Estimated Combined Balances * # Core deposit intangible of approximately 1% Unchanged Merger-related expenses $6 million Unchanged (~ $1.6 million recognized to date) Other Preliminary Financial Expectations # # Expectations and estimates based on 2010Q3 information and original preliminary estimates of fair market value adjustments from due diligence; will be refreshed in 2011Q4 utilizing updated balances, assumptions and market conditions. |

| 13 Loan Portfolio by Risk Grade ($) (Unaudited; $ in thousands) (Loan grade distribution shown before deferred loan fees) Risk Grades: RG 1-4 Pass; RG 5 Lowest Pass; RG 6 Special Mention; RG 7 Substandard Asset Quality: Improved Profile by Risk Grade Upgrades among RG6 and RG7 credits exceeded downgrades in those categories Classified loans declined $8.2 million (20%) Special Mention decreased $2.9 million (13%) Pass grades increased to 85% of total loans Ratio of downgrades to upgrades of 1.7x Compared to 1.1x in 2011Q2 Compared to 5.7x in 2011Q1 Compared to 16.6x in 2010Q4 Risk Grade Changes ($) |
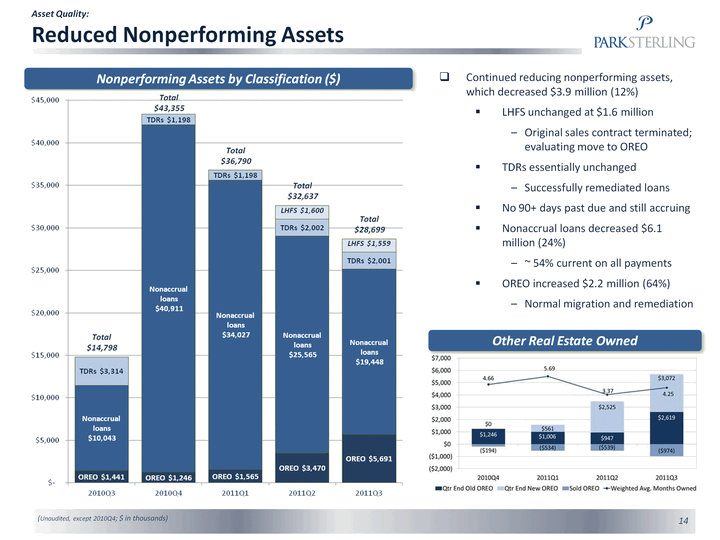
| 14 Nonperforming Assets by Classification ($) (Unaudited, except 2010Q4; $ in thousands) Asset Quality: Reduced Nonperforming Assets Continued reducing nonperforming assets, which decreased $3.9 million (12%) LHFS unchanged at $1.6 million Original sales contract terminated; evaluating move to OREO TDRs essentially unchanged Successfully remediated loans No 90+ days past due and still accruing Nonaccrual loans decreased $6.1 million (24%) ~ 54% current on all payments OREO increased $2.2 million (64%) Normal migration and remediation Other Real Estate Owned |

| 15 Asset Quality: Peer Group Comparisons Peer group percentiles include depository institutions headquartered in Virginia and the Carolinas with $750 million to $4 billion in total assets. (Source: SNL) NPLs to Total Loans (%) NPAs to Total Assets (%) NPAs to Tangible Equity* + ALLL (%) Annualized NCOs to Average Loans (%) Source: SNL and PSTB internal data. * Non-GAAP measure. |

| 16 Allowance for loan losses decreased $1.4 million from 2011Q2 (13%), consistent with reduced risk in portfolio Quantitative component declined $0.4 million (6%) due to improved risk grades Qualitative declined $0.1 million (7%) due to adjustment in portfolio trend factor Specific reserves declined $0.9 million (46%) due to loss recognition of impaired loans Provision expense decreased $2.7 million (83%) and net charge-offs decreased $1.7 million (46%) Five-Quarter Roll Forward Analysis Financial Review: Allowance for Loan Losses (Unaudited, except 2010Q4; $ in thousands) Allowance / Total Loans (%) Peer group percentiles include depository institutions headquartered in Virginia and the Carolinas with $750 million to $4 billion in total assets. (Source: SNL) Components of Allowance ($) |

| 17 |
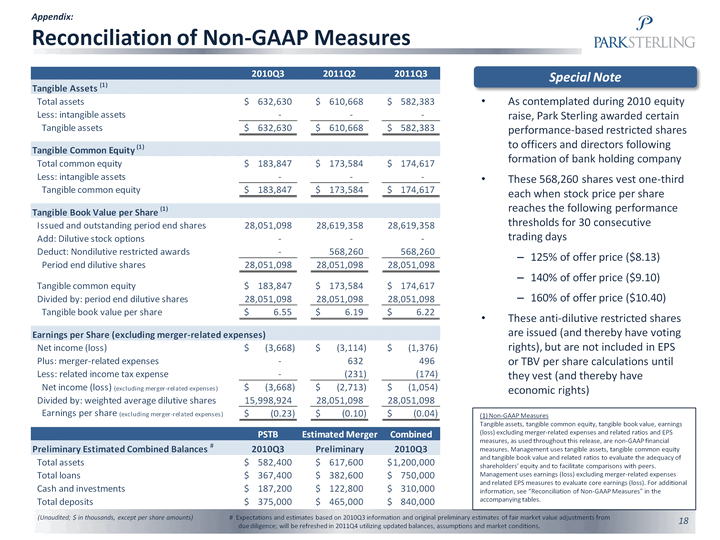
| 18 Appendix: Reconciliation of Non-GAAP Measures (Unaudited; $ in thousands, except per share amounts) (1) Non-GAAP Measures Tangible assets, tangible common equity, tangible book value, earnings (loss) excluding merger-related expenses and related ratios and EPS measures, as used throughout this release, are non-GAAP financial measures. Management uses tangible assets, tangible common equity and tangible book value and related ratios to evaluate the adequacy of shareholders' equity and to facilitate comparisons with peers. Management uses earnings (loss) excluding merger-related expenses and related EPS measures to evaluate core earnings (loss). For additional information, see "Reconciliation of Non-GAAP Measures" in the accompanying tables. Special Note As contemplated during 2010 equity raise, Park Sterling awarded certain performance-based restricted shares to officers and directors following formation of bank holding company These 568,260 shares vest one-third each when stock price per share reaches the following performance thresholds for 30 consecutive trading days 125% of offer price ($8.13) 140% of offer price ($9.10) 160% of offer price ($10.40) These anti-dilutive restricted shares are issued (and thereby have voting rights), but are not included in EPS or TBV per share calculations until they vest (and thereby have economic rights) # Expectations and estimates based on 2010Q3 information and original preliminary estimates of fair market value adjustments from due diligence; will be refreshed in 2011Q4 utilizing updated balances, assumptions and market conditions. |
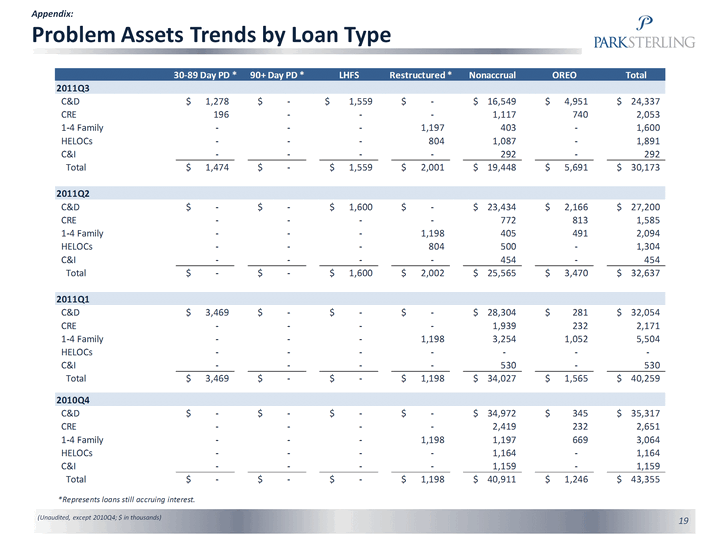
| 19 Appendix: Problem Assets Trends by Loan Type (Unaudited, except 2010Q4; $ in thousands) |
