Attached files
| file | filename |
|---|---|
| 8-K - FORM 8-K - Mastercard Inc | d247321d8k.htm |
| EX-99.1 - PRESS RELEASE - Mastercard Inc | d247321dex991.htm |
Exhibit 99.2
Exhibit 99.2
MasterCard Incorporated
Third-Quarter 2011
Financial Results Conference Call
November 2, 2011
Business Update
Operational Overview
Economic Update
Business Highlights
| 2 |
|
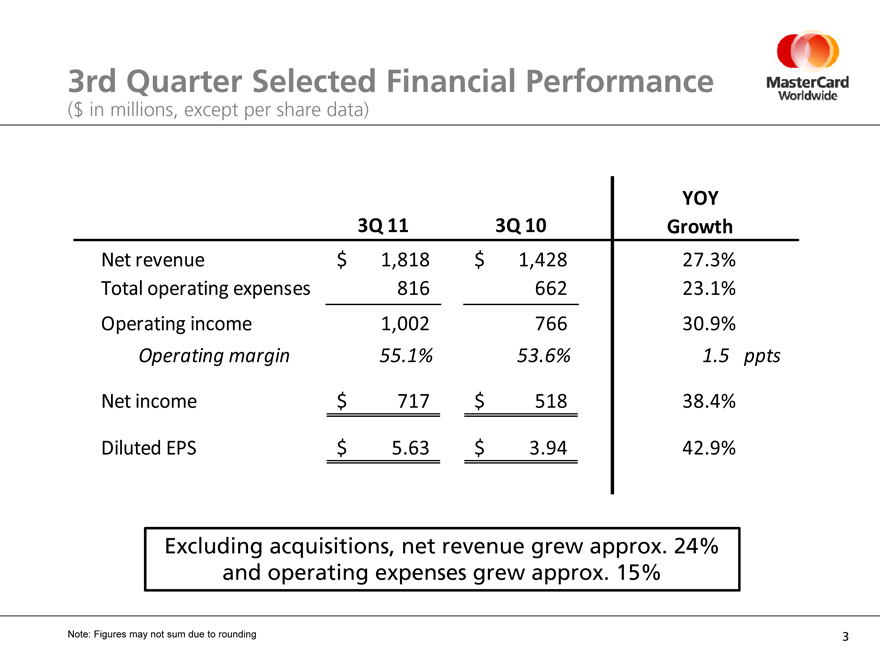
3rd Quarter Selected Financial Performance
($ in millions, except per share data)
YOY
3Q 11 3Q 10 Growth
Net revenue $ 1,818 $ 1,428 27.3%
Total operating expenses 816 662 23.1%
Operating income 1,002 766 30.9%
Operating margin 55.1% 53.6% 1.5 ppts
Net income $ 717 $ 518 38.4%
Diluted EPS $ 5.63 $ 3.94 42.9%
Excluding acquisitions, net revenue grew approx. 24% and operating expenses grew approx. 15%
Note: Figures may not sum due to rounding
| 3 |
|
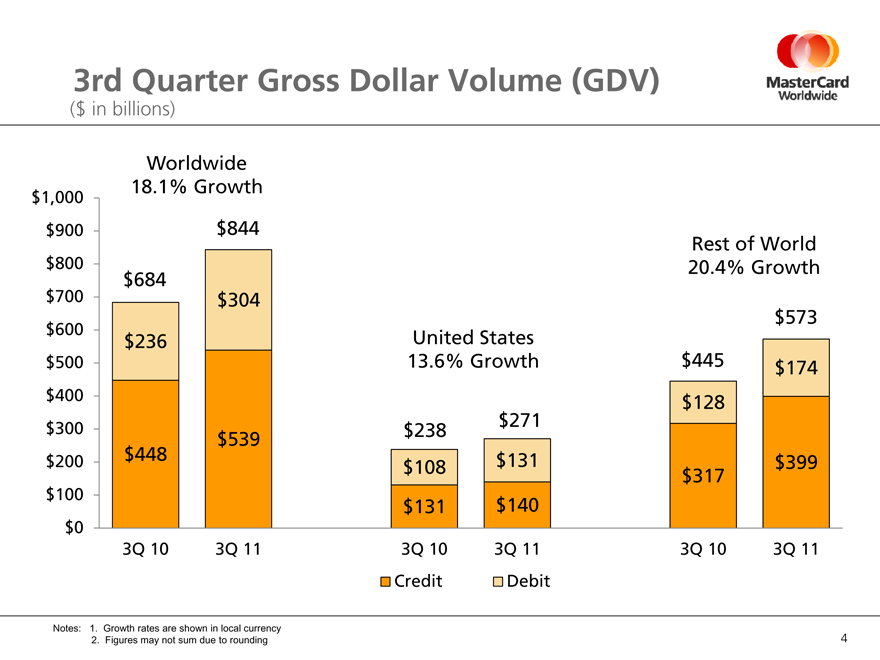
3rd Quarter Gross Dollar Volume (GDV)
($ in billions)
Notes: 1. Growth rates are shown in local currency
2. Figures may not sum due to rounding
$1,000 $900 $800 $700 $600 $500 $300 $200 $100 $0 $400
Worldwide
18.1% Growth
$684 $844 $236 $304 $448 $539
3Q 10 3Q 11
United States
13.6% Growth
$238 $271 $108 $131 $131 $140
3Q 10 3Q 11
Rest of World
20.4% Growth
$445 $573 $128 $174 $317 $399
3Q 10 3Q 11
Credit Debit
| 4 |
|
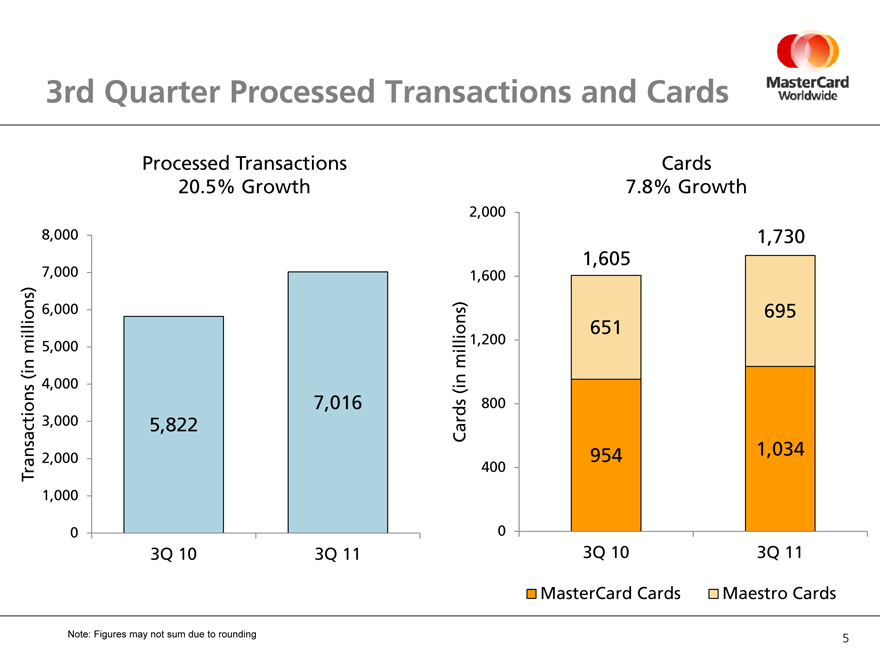
3rd Quarter Processed Transactions and Cards
Processed Transactions
20.5% Growth
Transactions (in millions)
8,000 7,000 6,000 5,000 4,000 3,000 2,000 1,000 0
5,822 7,016
3Q 10 3Q 11
Cards
7.8% Growth
Cards (in millions)
2,000 1,600 1,200 800 400 0
1,605 651 954
1,730 695 1,034
3Q 10 3Q 11
MasterCard Cards Maestro Cards
Note: Figures may not sum due to rounding
| 5 |
|
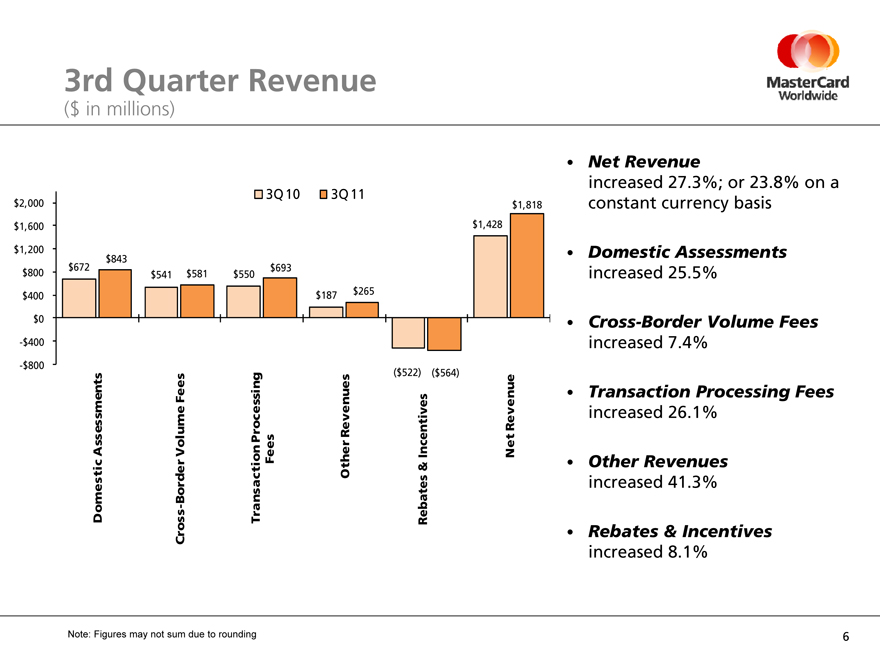
3rd Quarter Revenue
($ in millions)
$2,000 3Q 10 3Q 11
$1,818
$1,600 $1,428
$1,200 $672 $843 $693 $800 $541 $581 $550 $265 $400 $187
$0
-$400
-$800
($522) ($564)
Domestic Assessments
Cross-Border Volume Fees
Transaction Processing
Fees
Other Revenues
Net Revenue
Rebates & Incentives
Net Revenue increased 27.3%; or 23.8% on a constant currency basis
Domestic Assessments increased 25.5%
Cross-Border Volume Fees increased 7.4%
Transaction Processing Fees increased 26.1%
Other Revenues increased 41.3%
Rebates & Incentives increased 8.1%
Note: Figures may not sum due to rounding
| 6 |
|
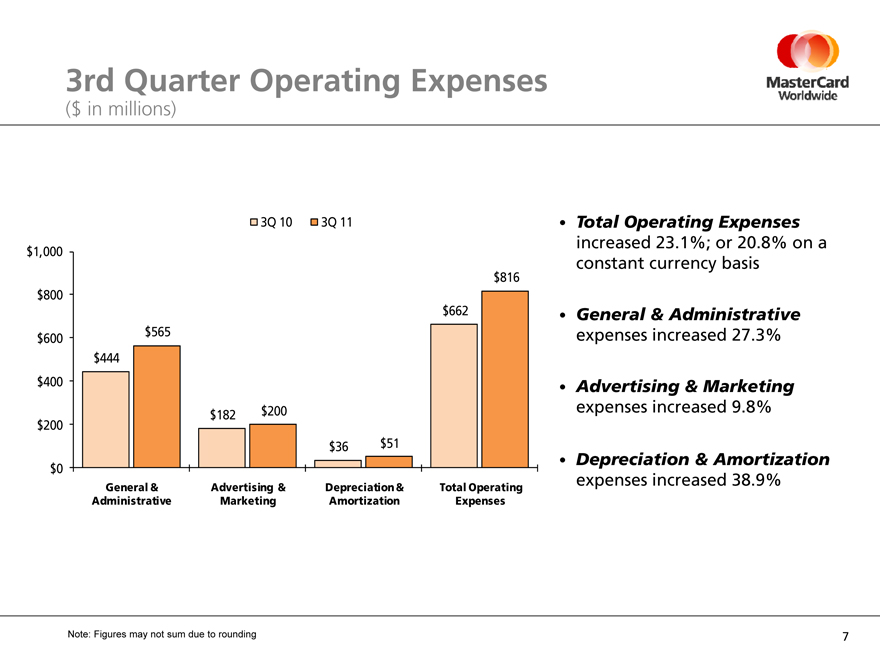
3rd Quarter Operating Expenses
($ in millions)
3Q 10 3Q 11 $1,000
$816 $800 $662 $565 $600 $444
$400
$182 $200 $200
$36 $51 $0
General & Advertising & Depreciation & Total Operating Administrative Marketing Amortization Expenses
Total Operating Expenses increased 23.1%; or 20.8% on a constant currency basis
General & Administrative expenses increased 27.3%
Advertising & Marketing expenses increased 9.8%
Depreciation & Amortization expenses increased 38.9%
Note: Figures may not sum due to rounding
| 7 |
|
3rd Quarter Cash Flow Statement and Balance Sheet Highlights
Cash flow from operations of $1.0 billion in 3Q11
Cash, cash equivalents and other liquid investments of $4.4 billion at September 30, 2011
Share Repurchase Activity
3Q11: 250,100 shares (cost of $77 million) As of October 27, remaining authorization: $879 million
| 8 |
|
Thoughts for the Future
Business update through October 28
Thoughts for 2011
Net Revenue Total Operating Expenses Tax Rate
Long-term financial objectives
9

MasterCard
Worldwide
The Heart of Commerce™
10