Attached files
| file | filename |
|---|---|
| 8-K - FORM 8-K - ION GEOPHYSICAL CORP | h85395e8vk.htm |
| EX-99.1 - EX-99.1 - ION GEOPHYSICAL CORP | h85395exv99w1.htm |
Exhibit 99.2

| ION Earnings Call - Q3 2011 Earnings Call Presentation November 3, 2011 |

| Earnings Call Introduction Corporate Participants & Contact Information CONTACT INFORMATION If you have technical problems during the call, please contact DRG&L at 713 529 6600. If you would like to listen to a replay of today's call, it will be available via webcast in the Investor Relations section of the Company's website - www.iongeo.com for approximately 12 months. BOB PEEBLER ION Geophysical Corporation CEO BRIAN HANSON ION Geophysical Corporation President, COO & CFO 2 |

| Earnings Call Introduction FORWARD-LOOKING STATEMENTS The information included herein contains forward-looking statements within the meaning of Section 27A of the Securities Act of 1933 and Section 21E of the Securities Exchange Act of 1934. Actual results may vary fundamentally from those described in these forward-looking statements. All forward-looking statements reflect numerous assumptions and involve a number of risks and uncertainties. These risks and uncertainties include risk factors that are disclosed by ION from time to time in its filings with the Securities and Exchange Commission. 3 |

| Sequential Improvement & Expected Strong Fourth Quarter - Q3 2011 4 |
| Quarterly Highlights Q3 2011 Sequential improvement over first half of 2011. Marine delivers strong performance. Positioning and software (Orca) product lines. Strong performance of multi-client business. Additional U.S. shale plays & new Arctic opportunity. Steady recovery of data processing. Data processing business expected to be at capacity entering into 2012 and new international opportunities in Mexico and Europe. INOVA new product introductions. Expect solid fourth quarter. 5 |
| Financial Overview Q3 2011 ION delivers $0.06 of diluted EPS for the third quarter. Revenues of $116 million for the third quarter with year-to-date revenues of $295 million compared to $286 million for the prior period. Excluding Legacy Land Systems (INOVA), year-to-date revenues increased 10% to $295 million compared to $269 million. Multi-client revenues grew 29% for year-to-date 2011 compared to the prior period driven by demand for our multi-client marine programs in Africa and Greenland and by land new venture activity in North America. Solutions backlog averaged approximately $110 million for the first three quarters of 2011. During the third quarter, the Software segment achieved a milestone of 50 Orca installations while delivering its best quarter ever in terms of operating income on a Pound Sterling basis. Systems revenues increased 20% for year-to-date 2011 compared to the prior period due to continued strong demand for marine positioning equipment. Year-to-date multi-client investment of $92 million, or approximately 77% of the full-year expected investment of $110 million to $130 million. Expectation of solid fourth quarter financial performance. ION delivers Q3 EPS of $0.06 and expects solid fourth quarter financial performance. 6 |
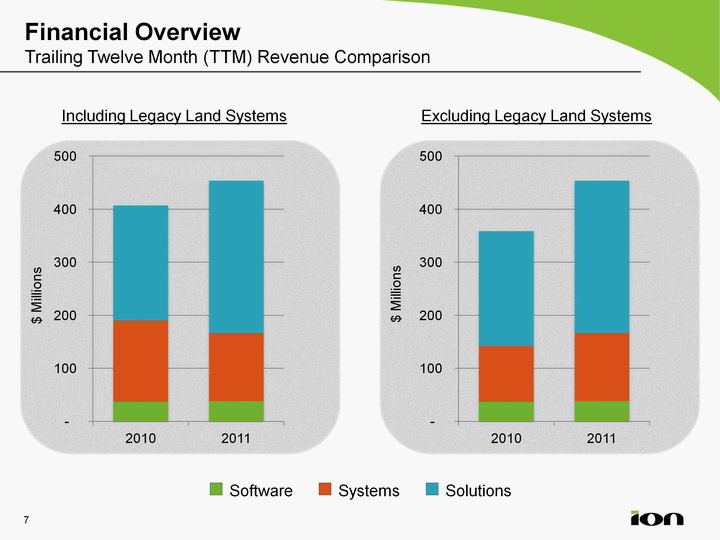
| Financial Overview Trailing Twelve Month (TTM) Revenue Comparison Trailing Twelve Month (TTM) Revenue Comparison Trailing Twelve Month (TTM) Revenue Comparison $ Millions (CHART) Including Legacy Land Systems Excluding Legacy Land Systems Solutions Systems Software $ Millions 7 |
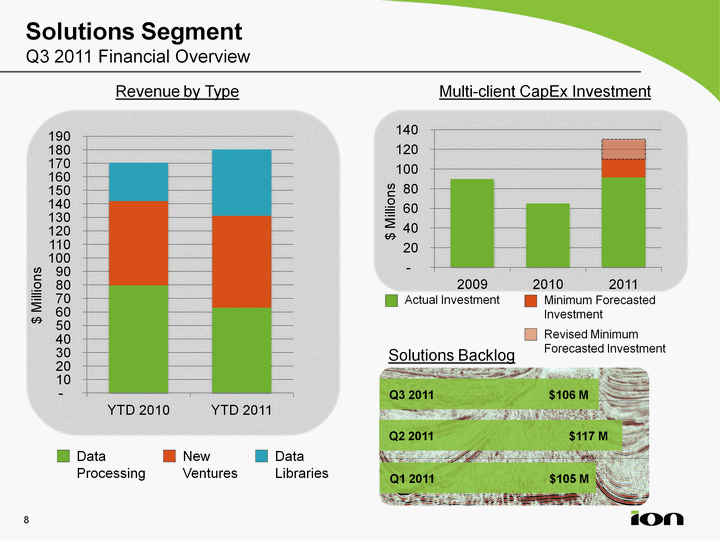
| Solutions Segment Q3 2011 Financial Overview (CHART) (CHART) Revenue by Type Multi-client CapEx Investment Solutions Backlog $ Millions $ Millions Q1 2011 $105 M Actual Investment Minimum Forecasted Investment Data Processing Data Libraries New Ventures Q2 2011 $117 M Revised Minimum Forecasted Investment 8 Q3 2011 $106 M |
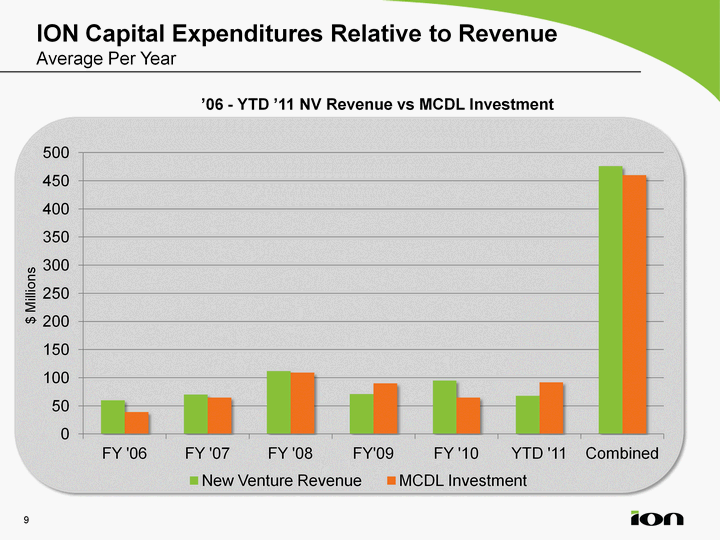
| ION Capital Expenditures Relative to Revenue Average Per Year 9 '06 - YTD '11 NV Revenue vs MCDL Investment (CHART) $ Millions |
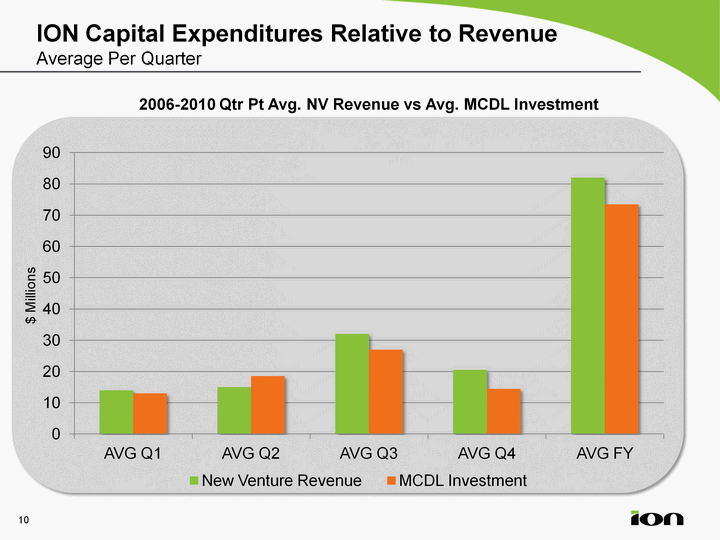
| (CHART) ION Capital Expenditures Relative to Revenue Average Per Quarter 10 2006-2010 Qtr Pt Avg. NV Revenue vs Avg. MCDL Investment $ Millions |
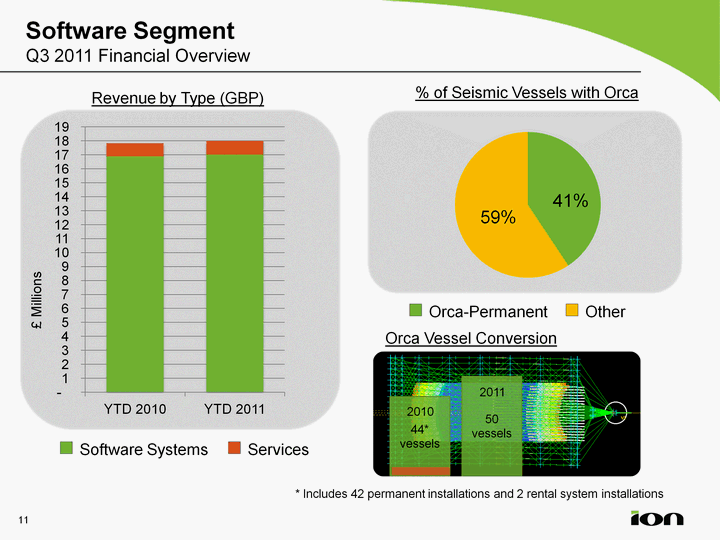
| Software Segment Q3 2011 Financial Overview Q3 2011 Financial Overview Q3 2011 Financial Overview £ Millions Revenue by Type (GBP) Services Software Systems % of Seismic Vessels with Orca Orca Vessel Conversion 50 vessels 2011 (CHART) Orca-Permanent * Includes 42 permanent installations and 2 rental system installations Other 44* vessels 2010 11 |
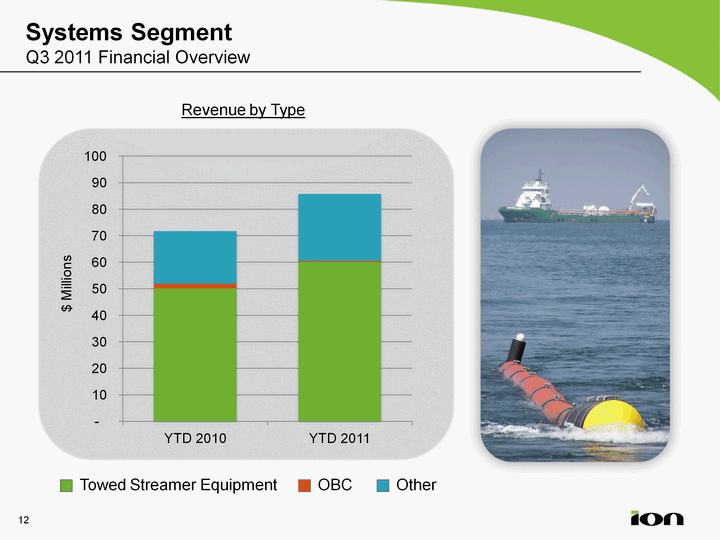
| Systems Segment Q3 2011 Financial Overview Q3 2011 Financial Overview Q3 2011 Financial Overview $ Millions Revenue by Type Towed Streamer Equipment OBC Other 12 |
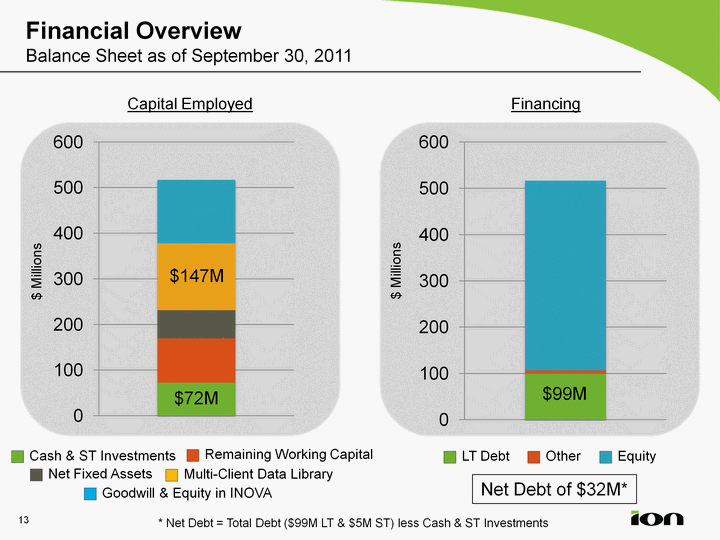
| Financial Overview Balance Sheet as of September 30, 2011 (CHART) (CHART) Capital Employed Financing Cash & ST Investments Net Fixed Assets Multi-Client Data Library Goodwill & Equity in INOVA Equity $ Millions $ Millions Other LT Debt Net Debt of $32M* * Net Debt = Total Debt ($99M LT & $5M ST) less Cash & ST Investments $99M $147M $72M Remaining Working Capital 13 |
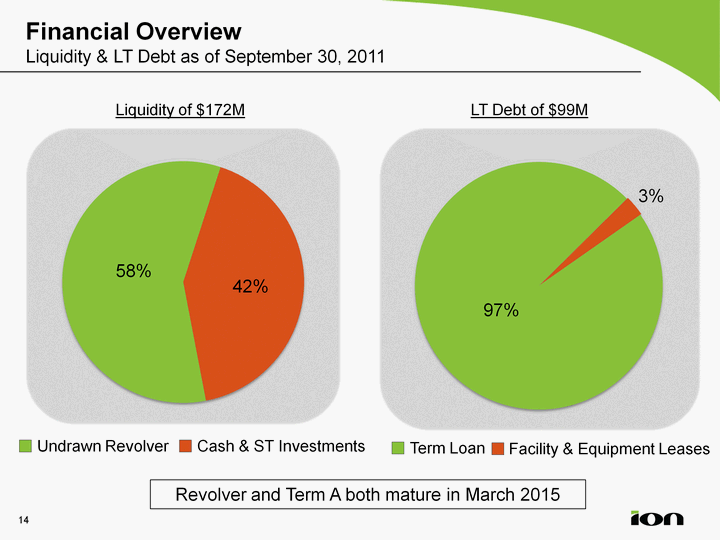
| Financial Overview Liquidity & LT Debt as of September 30, 2011 (CHART) (CHART) Liquidity of $172M LT Debt of $99M Cash & ST Investments Undrawn Revolver Term Loan Facility & Equipment Leases 3% Revolver and Term A both mature in March 2015 14 |
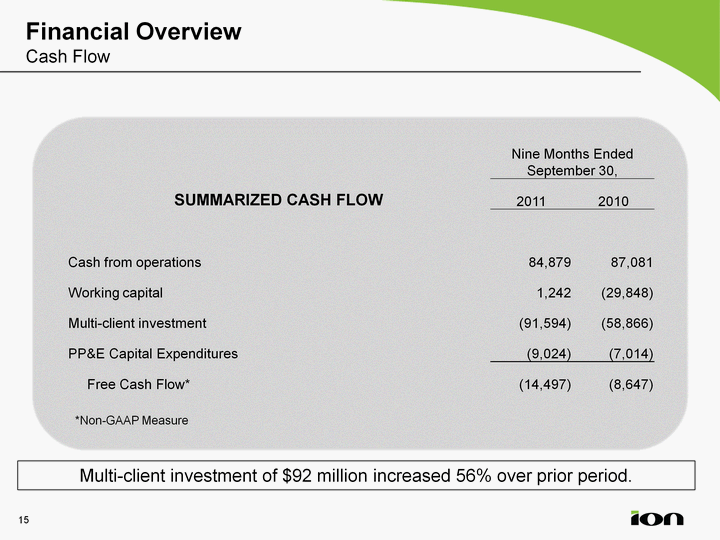
| Financial Overview Cash Flow Nine Months EndedSeptember 30, Nine Months EndedSeptember 30, SUMMARIZED CASH FLOW 2011 2010 Cash from operations 84,879 87,081 Working capital 1,242 (29,848) Multi-client investment (91,594) (58,866) PP&E Capital Expenditures (9,024) (7,014) Free Cash Flow* (14,497) (8,647) Multi-client investment of $92 million increased 56% over prior period. *Non-GAAP Measure 15 |
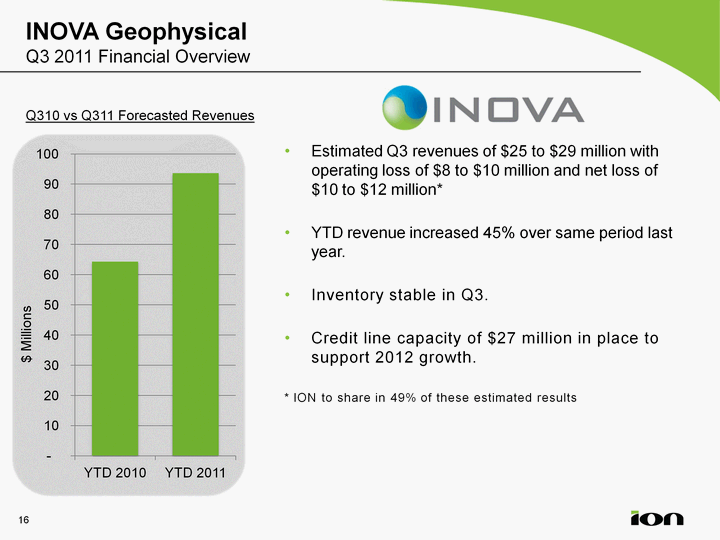
| INOVA Geophysical Q3 2011 Financial Overview (CHART) Q310 vs Q311 Forecasted Revenues $ Millions Estimated Q3 revenues of $25 to $29 million with operating loss of $8 to $10 million and net loss of $10 to $12 million* YTD revenue increased 45% over same period last year. Inventory stable in Q3. Credit line capacity of $27 million in place to support 2012 growth. * ION to share in 49% of these estimated results 16 |

| INOVA Geophysical General Market Observations/Operational Highlights Lower-than-normal vibrator sales in Q3 due to delayed project awards in the Middle East, but offset by FireFly sales and rentals. Continued BGP purchases totaling $12 million for Q3 related to FireFly. FireFly rental for Marcellus project started early July with ION's Geoventures group and continued through Q3. Successful launch of new products in September including a new version of FireFly, a new cable- based system, a first offering of nodes and a new, smaller vibrator. 17 |
| Financial Overview Summary Continue to expect full-year results are expected to be significantly back-end loaded based on the following assumptions: Record investment in multi-client libraries; Revenue recognition of the BGP twelve-streamer system; Increased momentum in our data processing business; and Natural year-end cap ex budget availability in data libraries. 18 |

| 19 |
