Attached files
| file | filename |
|---|---|
| 8-K - FORM 8-K - ASSOCIATED BANC-CORP | d250220d8k.htm |
 Associated Banc-Corp
Investor Presentation
Third Quarter 2011
Exhibit 99.1 |
 Forward-Looking Statements
1
Statements made in this presentation which are not purely historical are forward-looking
statements, as defined in the Private Securities Litigation Reform Act of 1995. This includes
any statements regarding management’s plans, objectives, or goals for future operations,
products or services, and forecasts of its revenues, earnings, or other measures of performance.
Forward-looking statements are based on current management expectations and, by their
nature, are subject to risks and uncertainties. These statements may be identified by the use
of words such as “believe”, “expect”, “anticipate”, “plan”,
“estimate”, “should”, “will”, “intend”, or similar
expressions. Outcomes related to such statements are subject to numerous risk factors and
uncertainties including those listed in the company’s most recent Form10-K and any
subsequent Form 10-Q.
Important
Note
Regarding
Forward-Looking
Statements: |
 Leading Midwest Banking Franchise
•
$22 billion in assets
•
Approximately 270 banking offices
•
Top 50 U.S. bank holding company
•
Largest bank headquartered in Wisconsin
•
#1 mortgage originator
1
and #1 SBA lender in Wisconsin
2
•
Known for its strong relationships with the communities it
serves, with roots that trace back to the First National Bank of
Neenah, founded in 1861
•
Strong capital ratios
•
Tier 1 Common:
12.44%
•
Total Capital Ratio:
15.81%
2
*FDIC market share data 6/30/11
WI
St. Louis
Chicago
Neenah
Rockford
No. 1
Top 4
Top 8
La Crosse
Hudson
Manitowoc
Madison
Minneapolis
Green Bay
Wausau
Stevens Point
Peoria
Milwaukee
1
Based on 2010 number of funded mortgage loans per HMDA data
2
Based on 2011 FY number of funded SBA loans
$3.0B
53
#18 Illinois
#6 Minnesota
#3 Wisconsin
$1.3B
$9.8B
23
194
Deposits*
Offices*
Market Share*
Appleton
MN
IL |
 Attractive Midwest Markets
3
1
Source:
Gross
State
Product:
2010
GDP
by
state
from
the
Bureau
of
Economic
Analysis;
2
Source:
U.S.
Bureau
of
Labor
Statistics,
Sept.
2011;
3
Source:
State
of
Wisconsin
Department
of
Workforce
Development;
4
Source:
FRB
Chicago;
5
Source:
Wisconsin
Department
of
Revenue
Economic
Outlook,
Fall
2011;
6
Source:
Fitch
Ratings
Wisconsin
•
Population: 5.6 million
•
GSP
1
: $248 billion
•
Unemployment
2
: 7.8%
Minnesota
•
Population: 5.3 million
•
GSP
1
: $270 billion
•
Unemployment
2
: 6.9%
Illinois
•
Population: 12.8 million
•
GSP
1
: $652 billion
•
Unemployment
2
: 10.0%
U.S (National)
•
Unemployment
2
: 9.1%
Employment
•
Wisconsin and Minnesota posted job gains in September and continue to
show above average employment levels
•
Gains in Wisconsin are wide-spread, with 67 of 72 counties showing an
improvement
in
unemployment
levels
Output
4
Outlook
5
•
Chicago Fed’s Midwest Manufacturing Index continues to strengthen
•
Midwest Manufacturing is up 7.2% year-over-year (vs. 4.3%
nationally) •
Midwest Machinery output is up 15.5% year-over year
•
Wisconsin expects to add 136,000 jobs by 2014
•
Wisconsin unemployment rate is expected to fall through 2014
•
Wisconsin building permits likely bottomed in mid-2011 and is expected to
grow strongly in 2012, 2013, and 2014
•
Minnesota is expected to have continuing job growth on a year-over-year
basis
and
better
than
5%
sales
growth
year-over-year
in
2012
6
3 |
 ASBC
Vision Statement Associated Banc-Corp will be the most admired
Midwestern financial services company, distinguished by sound,
value-added financial solutions with personal service for our
customers, built upon a strong commitment to our colleagues and the communities we
serve, resulting in exceptional value for our shareholders.
4 |
 Execution of Strategic Plan Well Under Way
5
Management Team
Has Driven Results
•
Aggressively reduced legacy problem credits
•
Realigned credit policies for profitable future originations
•
Improved core profitability by restructuring existing business portfolio
•
The OCC Memorandum of Understanding has been terminated
Well Positioned for
Growth in the
Midwest Market
Improved Credit
Quality Trends
Strong Capital and
Liquidity Position
•
Upper Midwest has outpaced the broader economy
•
Disruptions in major metro markets create opportunities for further market share
gains •
Proven ability to grow loans in challenging economic environment
•
Nonperforming assets at the lowest level since 2008
•
Do not expect bulk loan sales going forward
•
Loan loss reserves now cover nearly 100% of nonaccrual loans
•
Credit ratings outlook is stable from all major agencies (A3/BBB)
•
ASBC capital ratios compare favorably to peers and far exceed well-capitalized
regulatory benchmarks
•
Capital and liquidity exceed Basel III guidelines
TARP Repayment
•
Completed the repurchase of remaining TARP funds through senior note and
preferred stock offerings |
 •
Oliver
Buechse,
Chief
Strategy
Officer
•
John
Utz,
Head
of
Specialized
Industries
•
Donna
Smith,
Head
of
Regional
Commercial
Banking
•
Christopher
Del
Moral-Niles,
Deputy
Chief
Financial
Officer
•
Breck
Hanson,
Head
of
Commercial
Real
Estate
•
Arthur
Heise,
Chief
Risk
Officer
•
Patrick
Derpinghaus,
General
Auditor
•
Scott
Stiverson,
Director
of
Credit
Risk
Management
•
Eldon
Passey,
Head
of
Treasury
Management
Services
•
Liza
Warner,
Chief
Compliance
Officer
•
Tim
Watson,
Treasurer
Management Team –
Driving Results
6
Improved Core Profitability
Addressed OCC M.O.U. &
Repaid TARP
Reduced Problem Credits
Key Recent Hires (2010 –
Present) |
 Growing Commercial Relationships
•
Focus on commercial growth in key markets
–
Net production and line draws of $198 million for 3Q11
•
Portfolio of specialty niches with dedicated resources
–
Mortgage warehouse growth of $70 million in 3Q11
–
Oil & Gas segment growth of $30 million in 3Q11
•
Regional and owner-occupied CRE growth of $39 million in 3Q11
•
Investing in Treasury Management capabilities and talent
7
Commercial &
Business Lending
Commercial Real
Estate Lending
•
Clarified organizational responsibility with expanded expertise in key
markets •
Proactive monitoring of portfolio composition and trends
•
Portfolio grew by $108 million to $3.0 billion in 3Q11
•
Selective geographic expansion
–
Opened offices in Indianapolis and Cincinnati in 1Q11
–
Closed first CRE loans in IN and OH in 2Q11
–
Added commercial bankers to the Indianapolis office in 3Q11 to provide full
relationship banking
Note:
CB&L includes C&I, Leasing, and Owner-occupied CRE
CREL includes Investor CRE and Construction |
 Growing Household Relationships
•
Focusing on core Wealth disciplines and business development activities
•
Leveraging Private Banking as center of client relationship
•
Build out of specialized segments
•
Deepening the bench strength with the addition of new talent
•
Product and service enhancements to drive results in affluent client base
8
Wealth
Retail Banking
•
Strengthening the basics
–
Strengthening our focus on our premier banking customers
–
Enhancing our branch footprint
–
Expanding the scope and reach of our market-leading mortgage franchise
•
Building distinctiveness in core business units: Consumer Banking, Residential
Lending, Business Banking, Retail Payments, Retail Brokerage
•
Focusing on changing environment in payment systems |
 Differentiating Associated in Retail Banking
9
•
We are differentiating ourselves with our retail bank through investments in our
Premier Banking program and leveraging our relationship with the Green Bay
Packers & Aaron Rodgers Packers Banking
Further promoting strong affinity (balances,
cross-sell, retention all over-index)
Introduced partnership with Aaron Rodgers
Premier Banking
Top 7% of Retail Households
At least 1 specially-trained, designated
Premier Banker in each branch
Dedicated concierge number
Immediate funds availability on deposits
New debit and credit cards
Many other benefits, including identity
theft
protection |
 Our
New In-Store Branch Look 10
•
We are differentiating ourselves through investments in our Footprint
project. Pictured below is our new in-store location in Oak
Creek, WI, our first in-store in the Milwaukee area |
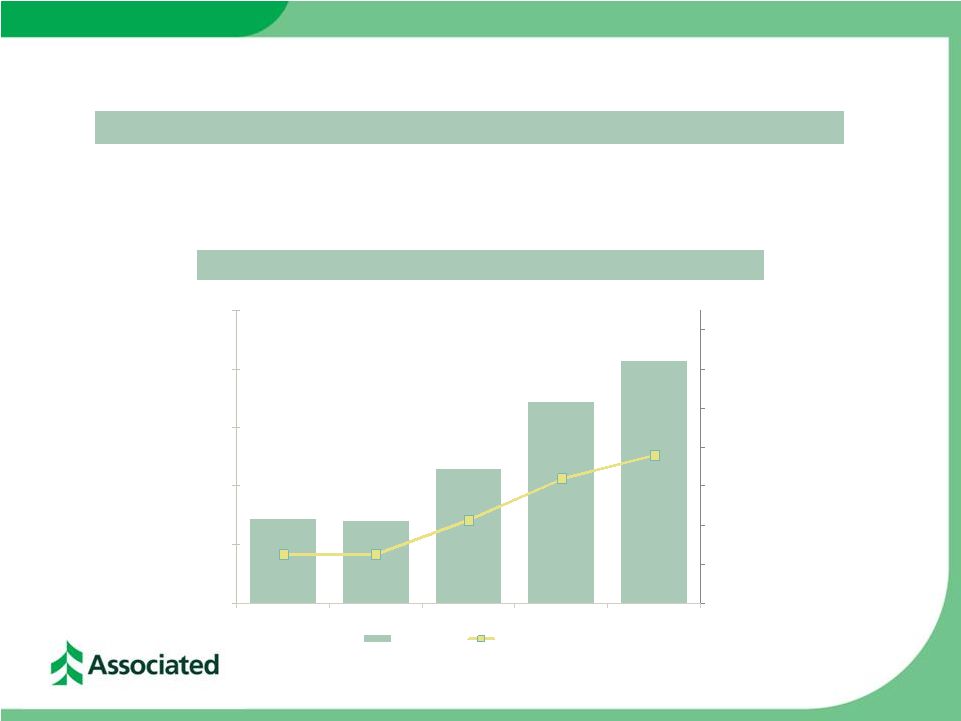 Third Quarter Highlights
11
Net Income and ROAA
Quarterly Results Reflect Positive Trends
•
Net income to common shareholders of $34 million or $0.20 per share
•
Pre-tax income improved 33%, or $15 million, and net income to common
shareholders improved 33%, or $8 million, from the prior quarter
$14
$14
$23
$34
$41
0.00%
0.20%
0.40%
0.60%
0.80%
1.00%
1.20%
1.40%
$0
$10
$20
$30
$40
$50
3Q 2010
4Q 2010
1Q 2011
2Q 2011
3Q 2011
Net Income
ROAA |
 Third Quarter Highlights
•
Total loans of $13.5 billion were up 3% from the end of the second quarter
–
Commercial and business lending (C&I, leasing, and owner-occupied CRE
loans) grew by a net $198 million on a linked-quarter basis
–
Commercial real estate lending (Investor CRE and construction loans) increased by
a net $108 million from the prior quarter
–
Retail loans and residential mortgages grew by a net $108 million during the third
quarter •
Continued improvement in key credit metrics
–
Nonaccrual loans declined 14% from the prior quarter and 45% on a
year-over-year basis to $403 million, the lowest level in seven
quarters –
Provision for loan losses of $4 million was down significantly from the prior
quarter –
Net charge-offs of $30 million were down 32% from $45 million for the second
quarter •
Capital ratios remain very strong with a Tier 1 common ratio of 12.44% and total
capital ratio of 15.81%
12
Quarterly Results Reflect Positive Trends |
 Positioned for Growth in Key Loan Categories
13
Total Loans of $13.5 billion at September 30, 2011
Loan Mix –
4Q 2008 vs 3Q 2011
Total Loans ($ in billions)
+3% QoQ
4Q 2008
3Q 2011
Peak Loans (4Q 2008) $16.3 billion
$12.4
$12.6
$12.7
$13.1
$13.5
$10.5
$12.0
$13.5
$15.0
$16.5
3Q 2010
4Q 2010
1Q 2011
2Q 2011
3Q 2011
CRE Investor
14%
Construction
14%
Commercial &
Business
Lending
35%
Res Mtg
14%
Home Equity
18%
Consumer
5%
CRE Investor
19%
Construction
4%
Commercial &
Business
Lending
33%
Res Mtg
21%
Home Equity
19%
Consumer
4% |
 Significant Improvements in Credit Quality Indicators
14
($ in millions)
3Q 2010
4Q 2010
1Q 2011
2Q 2011
3Q 2011
Provision for loan losses
$ 64.0
$ 63.0
$ 31.0
$ 16.0
$ 4.0
Net charge offs
$ 109.9
$ 108.2
$ 53.4
$ 44.5
$ 30.2
ALLL/Total loans
4.22%
3.78%
3.59%
3.25%
2.96%
ALLL/Nonaccruals
71.72%
83.02%
93.07%
91.09%
99.09%
NPA/Assets
3.47%
2.84%
2.50%
2.33%
2.03%
Nonaccruals/Loans
5.88%
4.55%
3.86%
3.57%
2.99%
NCOs / Avg Loans
3.39%
3.41%
1.71%
1.37%
0.90% |
 Maintaining a Strong Capital Profile
15
3Q 2010
4Q 2010
1Q 2011
2Q 2011
3Q 2011
ASBC
Capital
Ratios
Stockholders’
equity
/
assets
14.21%
14.50%
14.88%
13.60%
13.01%
Tangible common equity / tangible assets
8.03%
8.12%
8.42%
8.49%
8.77%
Tangible equity / tangible assets
10.41%
10.59%
10.93%
9.71%
9.07%
Tier 1 common equity / risk-weighted assets
12.31%
12.26%
12.65%
12.61%
12.44%
Tier 1 leverage ratio
10.78%
11.19%
11.65%
10.46%
9.62%
Tier 1 risk-based capital ratio
17.68%
17.58%
18.08%
16.03%
14.35%
Total risk-based capital ratio
19.16%
19.05%
19.56%
17.50%
15.81% |
 TARP
Repayment •
Completed the repurchase of remaining TARP funds primarily through senior note
and preferred stock offerings
•
OCC Memorandum of Understanding terminated
–
Bank-level capital and dividend constraints removed
16
TARP Repayment in a Shareholder-friendly Manner
Relative Shareholder Friendliness Scale
$430 mm
Senior Notes
$65 mm
8% Retail Preferred
~$30 mm
Cash-on-hand
$0 mm
No Common Stock |
 Summary
17
–
Strong, stable Midwestern franchise; well positioned for growth
–
Execution of our strategic initiatives and continued loan growth
–
Strong balance sheet with ample liquidity
–
Solid long-term strategy to reduce and manage risk
–
Improved systems, processes, and procedures for credit improvement
–
Exited TARP in a shareholder-friendly manner
2011
–
Poised
for
Revenue
Growth
and
Earnings
Expansion
–
Continuing to invest in our brand, our footprint, and our people
–
Our customer centric investments will provide attractive returns
–
Strong headwinds impacting margins and fee income
–
Opportunities to capitalize on pending disruptions in our markets
(M&I, competitor fall-out, and retrenchment)
|
 Appendix
•
Deposit Portfolio
•
Investment Securities Portfolio
•
Loan Portfolio
–
Residential Mortgages
–
Home Equity
–
Investor Commercial Real Estate
–
Construction Loans
–
Commercial & Business Lending Loans
•
Credit Details
–
See attached press release financial tables
18 |
 Strong and Low Cost Funding Profile
19
($ in thousands)
Cost of Funds
Jun 30, 2011
Sep 30, 2011
$ Change
% Change
3Q 2011
Demand
3,218,722
$
3,711,570
$
492,848
15%
Savings
1,007,337
1,013,195
5,858
1%
0.11
%
Interest-bearing demand
1,931,519
2,071,627
140,108
7%
0.18
Money market
4,982,492
5,205,401
222,909
4%
0.30
Brokered CDs
316,670
203,827
(112,843)
-36%
1.29
Other time deposits
2,609,310
2,576,790
(32,520)
-1%
1.50
Total deposits
14,066,050
14,782,410
716,360
5%
0.56
Customer repo sweeps
930,101
871,619
(58,482)
-6%
Customer repo term
1,147,938
1,141,450
(6,488)
-1%
Total customer funding
2,078,039
2,013,069
(64,970)
-3%
Total Deposits and Customer Funding
16,144,089
16,795,479
651,390
4%
Network transaction deposits
824,003
875,630
51,627
6%
Brokered CDs
316,670
203,827
(112,843)
-36%
1.29
Total Networked and Brokered Deposits
1,140,673
1,079,457
(61,216)
-5%
Net Customer Deposits and Funding
15,003,416
$
15,716,022
$
712,606
5%
Jun 11 vs Sep 11
Period End Deposit and Customer Funding Composition |
 Managing the Cost of Funds and Customer Funding Levels
20
Cost of Money Market Deposits
Cost of Interest-Bearing Liabilities
$6.8b
$6.0b
$5.1b
$5.0b
$5.1b
$16.4b
$15.5b
$14.9b
$15.3b
$15.2b
Net Customer Deposits and Funding
($ in billions)
0.54%
0.47%
0.37%
0.33%
0.30%
3Q 2010
4Q 2010
1Q 2011
2Q 2011
3Q 2011
1.03%
0.98%
0.89%
0.91%
0.83%
3Q 2010
4Q 2010
1Q 2011
2Q 2011
3Q 2011
$14.6
$14.2
$14.7
$15.0
$15.7
3Q 2010
4Q 2010
1Q 2011
2Q 2011
3Q 2011 |
 Appendix
•
Deposit Portfolio
•
Investment Securities Portfolio
•
Loan Portfolio
–
Residential Mortgages
–
Home Equity
–
Investor Commercial Real Estate
–
Construction Loans
–
Commercial & Business Lending Loans
•
Credit Details
–
See attached press release financial tables
21 |
 High
Quality Investment Securities Portfolio 22
Investment Portfolio –
September 30, 2011
Market Value Composition –
September 30, 2011
Portfolio Composition Ratings –
September 30, 2011
Type
Bk Value
(000’s)
Mkt Value
(000’s)
TEY
(%)
Duration
(Yrs)
Govt &
Agencies
$ 26,290
$ 26,318
0.68
0.53
MBS
1,455,622
1,559,143
4.58
1.26
CMOs
2,717,182
2,754,018
2.49
1.46
Municipals
782,806
827,385
5.74
4.89
ABS
213,955
213,234
0.41
0.23
Corporates
63,074
62,005
1.33
0.41
Other
9,813
11,713
---
---
TOTAL AFS
$5,268,742
$5,453,816
3.44
1.85
Credit Rating
(& in millions)
Mkt Value
% of Total
Govt & Agency
$ 4,294,998
78.8%
AAA
228,369
4.2%
AA
757,144
13.9%
A
89,933
1.6%
BAA1, BAA2 & BAA3
17,731
0.3%
BA1 & Lower
41,596
0.8%
Non-rated
24,045
0.4%
Total
$5,453,816
100.0%
MBS
29%
CMOs
50%
Municipals
15%
ABS
4%
All Other
1 %
Govt
&
Agencies
1% |
 Appendix
•
Deposit Portfolio
•
Investment Securities Portfolio
•
Loan Portfolio
–
Residential Mortgages
–
Home Equity
–
Investor Commercial Real Estate
–
Construction Loans
–
Commercial & Business Lending Loans
•
Credit Details
–
See attached press release financial tables
23 |
 Loan
Portfolio Trends 24
($ in thousands)
Cost of Funds
Jun 30, 2011
Sep 30, 2011
$ Change
% Change
3Q 2011
Commercial and industrial
3,202,301
$
3,360,502
$
158,201
5%
Lease financing
54,001
54,849
848
2%
Commercial real estate - owner occupied
1,030,060
1,068,616
38,556
4%
Commerical and business lending
4,286,362
4,483,967
197,605
5%
Commercial real estate - investor
2,393,626
2,481,411
87,785
4%
Real estate - construction
533,804
554,024
20,220
4%
Commercial real estate lending
2,927,430
3,035,435
108,005
4%
Total commercial
7,213,792
7,519,402
305,610
4%
4.28
%
Home equity
2,594,029
2,571,404
(22,625)
-1%
Installment
589,714
572,243
(17,471)
-3%
Total retail
3,183,743
3,143,647
(40,096)
-1%
4.78
Residential mortgage
2,692,054
2,840,458
148,404
6%
4.09
Total Loans
13,089,589
$
13,503,507
$
413,918
3%
4.36
Jun 11 vs Sep 11
Period End Loan Composition |
 Residential Mortgage and Home Equity
25
Residential Mortgage portfolio of $2.8 billion
21% of Total Loans, at Sept. 30, 2011
Portfolio Mortgage Balance by State
Home Equity portfolio of $2.6 billion
19% of Total Loans, at Sept. 30, 2011
Home Equity Balance by State
Home Equity NCOs by State
Portfolio Mortgage NCOs by State
Wisconsin
58%
Illinois
26%
Minnesota
8%
Other
8%
Wisconsin
66%
Illinois
16%
Minnesota
18%
Wisconsin
71%
Illinois
16%
Minnesota
11%
Other
2%
Wisconsin
56%
Illinois
20%
Minnesota
24% |
 Investor Commercial Real Estate and Construction
26
Investor CRE portfolio of $2.5 billion
18.4% of Total Loans, at Sept. 30, 2011
Investor CRE Loans by State
Construction portfolio of $554 million
4% of Total Loans, at Sept. 30, 2011
Construction Loans by State
Construction Loans by Collateral
Investor CRE Loans by Collateral
Wisconsin
53%
Illinois
19%
Minnesota
16%
Other
7%
Missouri
3%
Florida
2%
Office/Mixed Use
28%
Multi
-Family
26%
Retail
21%
Other
10%
Industrial
9%
Hotel/Motel
5%
Single
Family/Condo
1%
Land
0%
Wisconsin
35%
Illinois
31%
Minnesota
17%
Colorado
8%
Other
6%
Missouri
3%
Retail
29%
Land
27%
Single
Family/Condo
12%
Other
9%
Multi
-Family
9%
Office
6%
Industrial
4%
Mixed Use
4% |
 Commercial & Business Lending Loans by State
Commercial & Business Lending Loans
27
Commercial
&
Business
Lending
portfolio
of
$4.4
billion,
or
33%
of
Total
Loans,
at
Sept.
30,
2011
Commercial & Business Lending Loans by Collateral
Wisconsin
45%
Illinois
22%
Minnesota
17%
Other
16%
Other
23%
Manufacturing
21%
Real Estate &
Rental/Leasing
14%
Finance
&
Insurance
11%
Wholesale Trade
10%
Retail Trade
8%
Health Care &
Social
Assistance
6%
Professional,
Scientific
, &
Technical
Services, 5%
Transportation &
Warehousing
3% |
 Appendix
•
Deposit Portfolio
•
Investment Securities Portfolio
•
Loan Portfolio
–
Residential Mortgages
–
Home Equity
–
Investor Commercial Real Estate
–
Construction Loans
–
Commercial & Business Lending Loans
•
Credit Details
–
See attached press release financial tables
28 |
 Continuing Decline in Potential Problem Loans
29
3Q 2010
4Q 2010
1Q 2011
2Q 2011
3Q 2011
YoY
Change
Commercial and industrial
$
373,955
(45%)
Commercial real estate
553,126
492,778
465,376
382,056
392,737
(29%)
Real estate -
construction
175,817
91,618
70,824
63,186
37,155
(79%)
Lease financing
2,302
2,617
1,705
1,399
507
(78%)
Total commercial
1,105,200
941,297
886,854
676,048
637,750
(42%)
Home equity
6,495
3,057
4,737
4,515
4,975
(23%)
Installment
692
703
230
216
272
(61%)
Total retail
7,187
3,760
4,967
4,731
5,247
(27%)
Residential mortgage
19,416
18,672
19,710
18,575
16,550
(15%)
Total Potential Problem Loans
$ 1,131,803
$ 963,729
$ 911,531
$ 699,354
$ 659,547
(42%)
($ in millions)
$ 348,949
$ 229,407
$ 207,351
$ 354,284 |