Attached files
| file | filename |
|---|---|
| 8-K - FORM 8-K - PILGRIMS PRIDE CORP | d248675d8k.htm |
 Pilgrim’s
Pride Corporation Financial Results for
Third Fiscal Quarter Ended
September 25, 2011
1
Exhibit 99.1 |
 Cautionary Notes
and Forward-Looking Statements 2
Statements contained in this presentation that share our intentions, beliefs, expectations or
predictions for the future, denoted by the words “anticipate,”
“believe,” “estimate,” “should,” “expect,”
“project,” “plan,” “imply,” “intend,” “foresee” and similar expressions, are forward-looking statements that reflect our
current views about future events and are subject to risks, uncertainties and assumptions.
Such risks, uncertainties and assumptions include the following matters affecting the
chicken industry generally, including fluctuations in the commodity prices of feed ingredients and chicken; actions and decisions of our creditors;
while JBS USA Holdings, Inc. (“JBS USA”) has significant acquisition experience and
historically has been able to realize substantial benefits through synergies, JBS USA
may not be able to fully achieve all of the anticipated synergistic from the sale of 67% of the company’s common stock to JBS USA within the time frames
expected; our ability to obtain and maintain commercially reasonable terms with vendors and
service providers; our ability to maintain contracts that are critical to our
operations; our ability to retain management and other key individuals; certain of our reorganization and exit or disposal activities, including selling assets,
idling facilities, reducing production and reducing workforce, resulted in reduced capacities
and sales volumes and may have a disproportionate impact on our income relative to the
cost savings; risk that the amounts of cash from operations together with amounts available under our exit credit facility will not be
sufficient to fund our operations; management of our cash resources, particularly in light of
our substantial leverage; restrictions imposed by, and as a result of, our substantial
leverage; additional outbreaks of avian influenza or other diseases, either in our own flocks or elsewhere, affecting our ability to conduct our operations
and/or demand for our poultry products; contamination of our products, which has previously
and can in the future lead to product liability claims and product recalls; exposure to
risks related to product liability, product recalls, property damage and injuries to persons, for which insurance coverage is expensive, limited
and potentially inadequate; changes in laws or regulations affecting our operations or the
application thereof; new immigration legislation or increased enforcement efforts in
connection with existing immigration legislation that cause our costs of business to increase, cause us to change the way in which we do
business or otherwise disrupt our operations; competitive factors and pricing pressures or the
loss of one or more of our largest customers; currency exchange rate fluctuations, trade
barriers, exchange controls, expropriation and other risks associated with foreign operations; disruptions in international markets and
distribution channels, including exports to Russia, the anti-dumping proceeding in Ukraine
and the anti-dumping and countervailing duty proceeding in China; and the impact of
uncertainties of litigation as well as other risks described herein and under “Risk Factors” in the Company’s Annual Report on Form 10-K filed with the
Securities and Exchange Commission (the “SEC”).
Actual results could differ materially from those projected in these forward-looking
statements as a result of these factors, among others, many of which are beyond our
control. In making these statements, we are not undertaking, and specifically decline to undertake, any obligation to address or update each or any
factor in future filings or communications regarding our business or results, and we are not
undertaking to address how any of these factors may have caused changes to information
contained in previous filings or communications. Although we have attempted to list comprehensively these important cautionary risk
factors, we must caution investors and others that other factors may in the future prove to be
important and affecting our business or results of operations. We have included certain information regarding our results of operations and components
thereof that have been adjusted to exclude charges associated with the
company’s restructuring under Chapter 11 Bankruptcy protection and other additional
reorganization items. We have included this information as we believe that investors
may be interested in our results excluding these items as this is a way our management analyzes our results from continuing operations.
“EBITDA” is defined as net income (loss) from continuing operations plus interest,
income taxes, depreciation and amortization. “Adjusted EBITDA” is defined as
the sum of EBITDA plus restructuring charges, reorganization items and loss on early
extinguishment of debt less net income attributable to noncontrolling interests. Our
method of computation may or may not be comparable to other similarly titled measures used in filings with the SEC by other companies. See the
consolidated statements of income and consolidated statements of cash flows included in our
financial statements. EBITDA is presented because we believe it provides
meaningful additional information concerning a company’s operating results and its ability to service long-term debt and to fund its growth, and we
believe it is frequently used by securities analysts, investors and other interested parties,
in addition to and not in lieu of results under U.S. Generally Accepted Accounting
Principles (GAAP), to compare the performance of companies. We believe investors would be interested in our Adjusted EBITDA because this is how
our management analyzes EBITDA from continuing operations. The Company also believes that
Adjusted EBITDA, in combination with the Company's financial results calculated in
accordance with GAAP, provides investors with additional perspective regarding the impact of certain significant items on EBITDA and
facilitates a more direct comparison of its performance with its competitors. EBITDA and
Adjusted EBITDA are not measurements of financial performance under GAAP and should not
be considered as an alternative to cash flow from operating activities or as a measure of liquidity or an alternative to net income as indicators
of our operating performance or any other measures of performance derived in accordance with
GAAP. |
 Third Quarter
2011 Financial Review Net loss of $162.5 million, or $0.76 per share, vs. net profit of
$57.9 million, or $0.27 per share for the comparable quarter a year earlier
Even with the non-recurring events, Pilgrim’s generated a positive operating
cash flow of $10.7 million
Total net sales increased 10.0%, or $171.4 million
Quarter with strategic decisions that must be made to generate positive impact on future
quarters and with external non-recurring events that impacted our result:
Total impact of non-recurring events reached US$52.7 million
Recurring EBITDA (excluding non-recurring events) was a loss of $31.4 million vs. a
positive $170 million for the same period a year ago
Overall this
year
we
have
sold
approximately
5
billion
pounds
at
an
average
of
3.8
cents
less
than in the prior year. This equates to almost $200 million less in revenue year over
year. We’ve also incurred grain costs year to date that are $545 million
higher than 2010 3 |
 Results
Highlights 4
* Adjusted for $52.7 million in non-recurring events in COGS and SG&A
Main Indicators ($MM)
3Q10
3Q11
Net Revenue
1,719.8
1,891.2
Gross (Loss) Profit
159.8
(62.4)
Net Income
57.9
(162.5)
EBITDA
170.0
(84.1)
Recurring EBITDA*
170.0
(31.4) |
 Sales
Breakdown Domestic Sales ($MM)
+3.8%
Exports ($MM)
Mexico Sales ($MM)
Domestic: higher volume on lower average price
Exports: higher volume and higher price
Mexico: higher volume on lower average price
+65.6%
+24.8%
5 |
 Market
Prices Bird MW WOG (Without Giblets)
MW Breast Tender Out
MW Wings
MW Leg Quarters
6 |
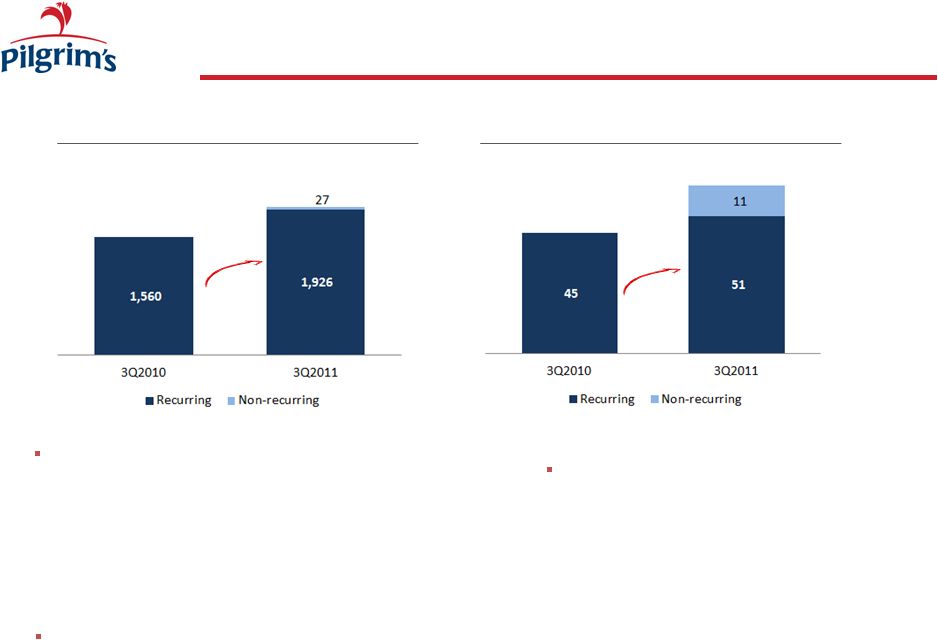 Operating
Costs COGS ($MM)
+23.5%
SG&A ($MM)
7
Non recurring Events:
–
$11.5 MM in Egg/ pullets destruction
–
$6 MM LOCOM
–
$7.9 MM inventory recall costs
–
Uninsured
Losses
in
Marshville:
$1.9MM
Non recurring Events:
–
$8.8 MM in HFS Assets
–
$2.6 MM in Dallas shut-down costs
Other Impacts (below the line) : US$14 MM FX loss on Mexico
+13.5% |
 Feed Costs
Corn ($ per Bushel)
Soymeal ($per ton)
8
65.3%
15.4%
7.65
6.17
382
326
Feed ingredients purchased were approximately $102 million higher during the quarter than
the year-ago period
For the year, feed ingredients purchased were $545 higher than 2010
4.21
Q3 2010
Q3 2011
305
352
Q3 2010
Q3 2011
6.96 |
 Results of
Operations 9
Main Indicators ($MM)
3Q10
3Q11
Change
Net Income
57.9
(162.5)
(220.4)
Net Income per Share
Basic
0.27
(0.76)
(1.03)
Diluted
0.27
(0.76)
(1.03)
Recurring Net Income*
57.9
(109.8)
(170.2)
Recurring
Net
Income
per
Share
Basic
0.27
(0.52)
(0.79)
Diluted
0.27
(0.52)
(0.79)
* Adjusted for $11.5MM in Egg/Hen disposal, $7.9MM in expenses related to a product
recall, $6MM in LOCOM, $1.9MM in Marshville uninsured costs. Also includes
adjustments for $8.8MM in assets that were sold during the period , $2.6MM of Dallas shut-down costs
and $14MM in FX loss in Mexico due to impacts of devaluation of Peso on Mexico Balance Sheet
|
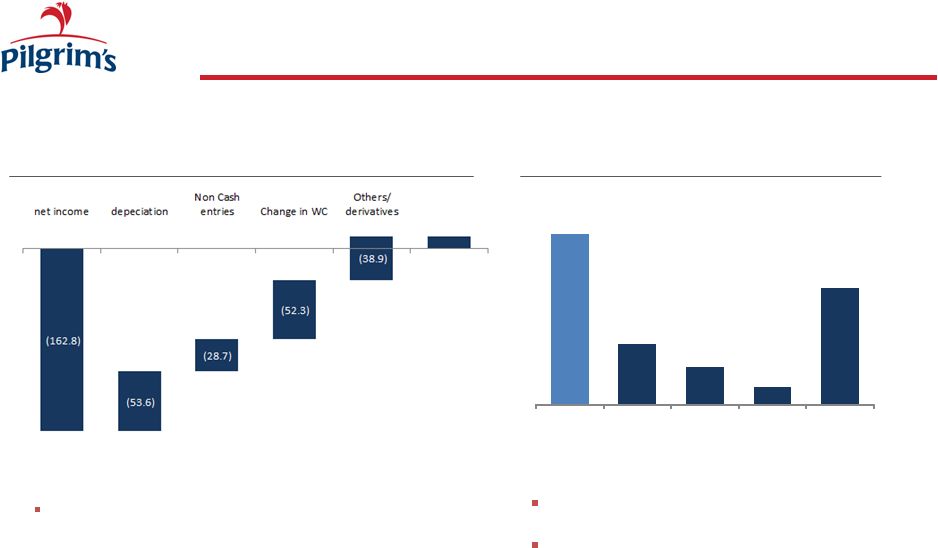 Operating Cash
Flow and CAPEX Operating Cash Flow ($MM)
10
Capex ($ MM)
Tight reign on capital spending
Capex for the year to be around $130
million
Positive Operating Cash Flow in the Quarter
–
Reduction of A/R
–
Optimizing Inventory
–
Non-cash, non-recurring impacts
10.7
179.3
64.0
39.2
18.7
121.9
2010 Total
Q1
Q2
Q3
2011 YTD |
 Total Debt and
Availability 11
Sources of Liquidity
Amount Available
Q1
Q2
Q3
Cash and cash equivalents
63
34.6
46.9
Short-term investments in available-for-
sale securities
1.4
0.8
0.1
Borrowing arrangements:
Exit Credit Facility
334.7
279.8
243.9
ING Credit Facility
46.5
46.8
22.2*
JBS Subordinated Loan Agreement
-
50
50
* The total credit line is $46.8MM, with $22.2 currently committed
Total debt: US$1.5 billion
–
Net Interest: $27.9 MM
Liquidity of $362.8MM |
 Highlights and
Strategy Going Forward Quarter with difficult decisions that must be made to generate
positive impact on future quarters
Grain volatility is here to stay
Chicken Industry is adjusting its offer to meet demand and cold inventories are already below
2010 levels
We remain committed to Become the best managed and most respected company in our
industry:
Relentless pursuit of operational excellence by achieving T25 performance and meeting 400 mm
annualized cost improvement.
Become irreplaceable valued partner to key customers.
Create an ownership culture of accountability and improvement.
Add value to exports
Risk Management
12 |
 IR
Contact Investor Relations:
Rosemary Geelan
E-mail:
rosemary.geelan@pilgrims.com
Phone:
+1 (970) 506-8192
Address:
1770 Promontory Circle
Greeley, CO 80634 USA
Website:
www.pilgrims.com
13 |