Attached files
| file | filename |
|---|---|
| 8-K - FORM 8-K - ONCOR ELECTRIC DELIVERY CO LLC | d248673d8k.htm |
 Oncor Electric
Delivery Third Quarter 2011
Investor Call
October 28, 2011
Exhibit 99.1 |
| 1
Oncor Electric Delivery
Forward Looking Statements
This presentation contains forward-looking statements, which are subject to
various risks and uncertainties.
Discussion of risks and uncertainties that could cause actual results to differ
materially from management’s current projections, forecasts, estimates and
expectations is contained in filings made by Oncor Electric Delivery Company
LLC (Oncor) with the Securities and Exchange Commission (SEC).
Specifically,
Oncor
makes
reference
to
the
section
entitled
“Risk
Factors”
in
its
annual
and
quarterly
reports.
In addition to the risks and uncertainties set forth in Oncor’s SEC filings, the
forward-looking statements in this presentation could be affected by,
among other things: prevailing governmental policies and regulatory
actions;
legal
and
administrative
proceedings
and
settlements;
weather
conditions
and
other
natural phenomena; acts of sabotage, wars or terrorist activities; economic
conditions, including the impact of a recessionary environment; unanticipated
population growth or decline, or changes in market demand and demographic
patterns; changes in business strategy, development plans or vendor relationships;
unanticipated changes in interest rates or rates of inflation; unanticipated changes
in operating expenses, liquidity needs and capital expenditures; inability of
various counterparties to meet their financial obligations to Oncor, including
failure of counterparties to perform under agreements; general industry trends; hazards
customary
to
the
industry
and
the
possibility
that
Oncor
may
not
have
adequate
insurance
to cover losses
resulting from such hazards; changes in technology used by and services offered by
Oncor; significant changes in Oncor’s relationship with its employees;
changes in assumptions used to estimate costs of providing employee benefits,
including pension and other post-retirement employee benefits, and future
funding requirements related thereto; significant changes in critical accounting
policies material to Oncor; commercial bank and financial market conditions,
access to capital, the cost of such capital, and the results of financing and
refinancing efforts, including availability of funds in the capital markets and the potential impact
of disruptions in US credit markets; circumstances which may contribute to future
impairment of goodwill, intangible or other long-lived assets; financial
restrictions under Oncor’s revolving credit facility and indentures
governing its debt instruments; Oncor’s ability to generate sufficient cash flow to make interest
payments on its debt instruments; actions by credit rating agencies; and Oncor’s
ability to effectively execute its operational strategy. Any
forward-looking statement speaks only as of the date on which it is made, and
Oncor undertakes no obligation to update any forward-looking statement to reflect
events or circumstances after the date on which it is made or to reflect the
occurrence of unanticipated events. Regulation G
This presentation includes certain non-GAAP financial measures. A reconciliation
of these measures to the most directly comparable GAAP measures is included in
this presentation, which is available on Oncor’s website,
www.oncor.com,
under
the
‘News’
tab
in
the
Investor
Information
section,
and
also
filed
with
the
SEC. |
| 2
Oncor Electric Delivery
3rd Quarter 2011 Investor Call Agenda
Financial Overview
David Davis
Chief Financial Officer
Operational Review
Bob Shapard
Chairman and CEO
Q&A |
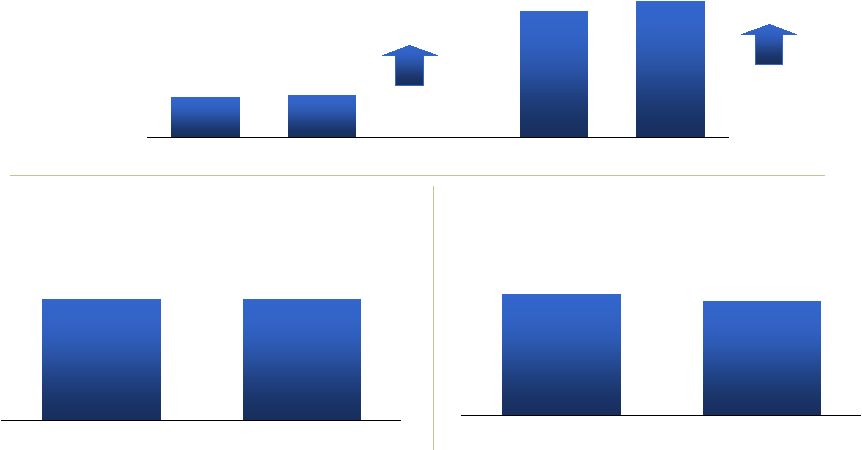
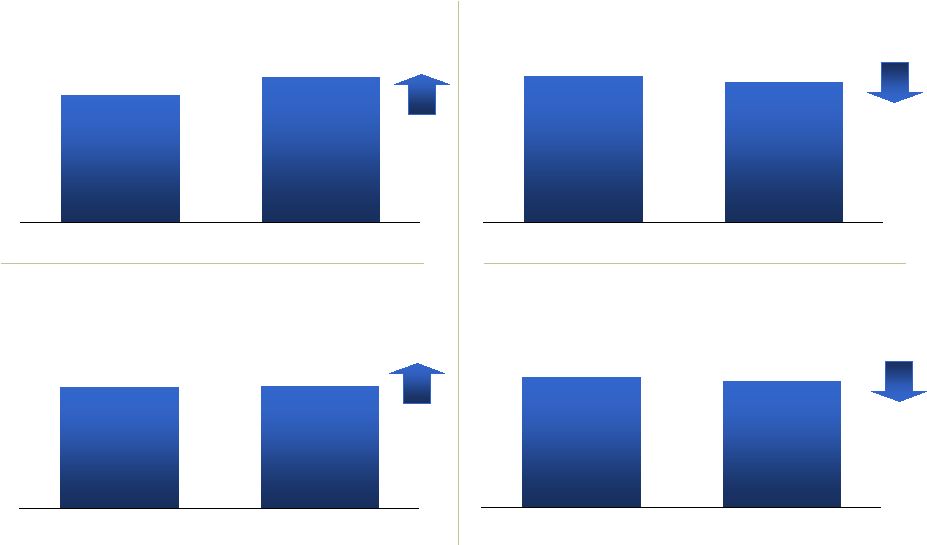 3
Oncor Electric Delivery
Weather Drove Q3 2011 Volumes and Impacted Weather-
Adjusted Response
Avg KWH/Residential Premise, Weather Adj
Q3 ‘10 vs. Q3 ‘11
Residential GWH, Actual
Q3
1
‘10 vs. Q3 ‘11
Residential Points of Delivery
Q3 ‘10 vs. Q3 ‘11; thousands of meters
Residential GWH, Weather Adj
Q3 ‘10 vs. Q3 ‘11
14,133
16,098
Q3 '10
Q3 '11
4,836
4,664
Q3 '10
Q3 '11
13,017
12,671
Q3 '10
Q3 '11
2,693
2,717
At 9/30/2010
At 9/30/2011
0.9%
13.9%
2.7%
3.6%
1
Unless otherwise indicated, reflects three months ended September 30.
|
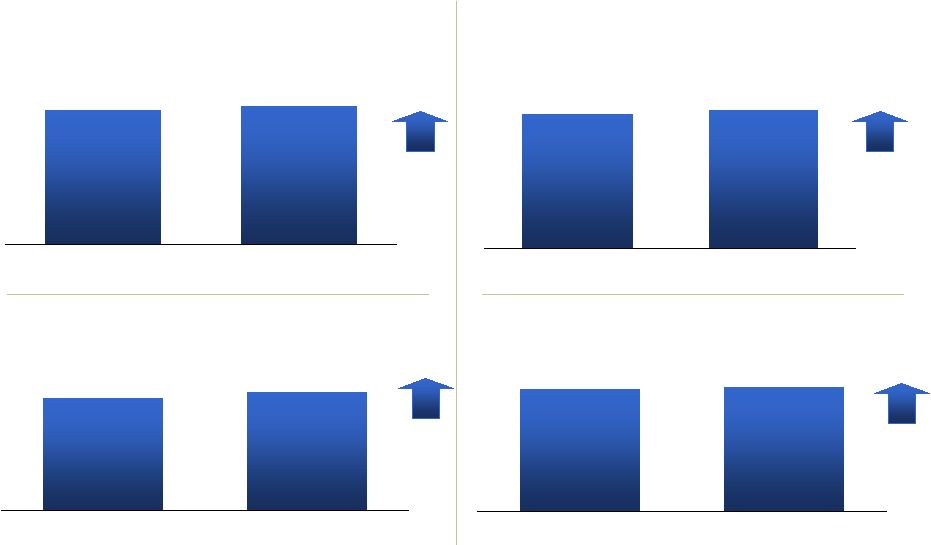 4
Oncor Electric Delivery
Large C&I Demand and Usage Trends Suggest Continued
Economic Recovery
Large C&I GWH, Actual
Q3 ‘10 vs. Q3 ‘11
Large C&I GWH, Weather Adj
Q3 ‘10 vs. Q3 ‘11
18,411
18,722
Q3 '10
Q3 '11
3.4%
2.9%
17,640
18,234
Q3 '10
Q3 '11
Large C&I Billed MW Demand (Avg)
Q3
1
‘10 vs. Q3 ‘11
18,795
19,822
Q3 '10
Q3 '11
17,053
16,575
Q3 '10
Q3 '11
Large C&I Actual MW Demand (Avg)
Q3 ‘10 vs. Q3 ‘11
5.5%
1.7%
1
Three months ended September 30. |
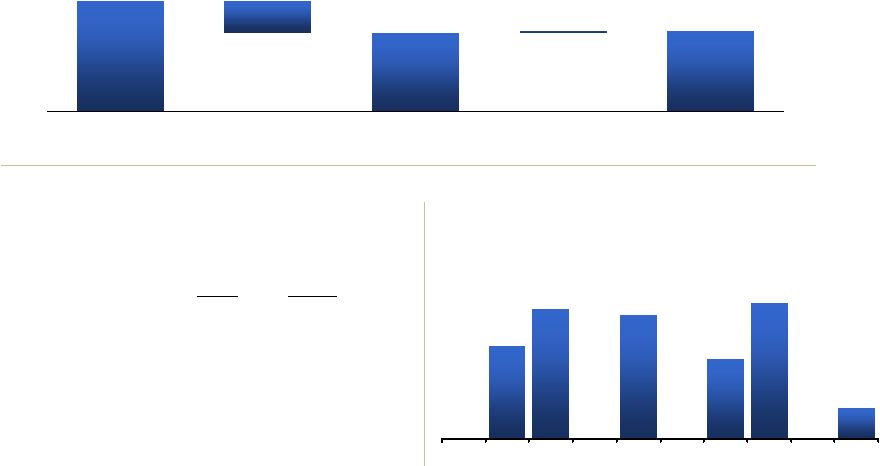
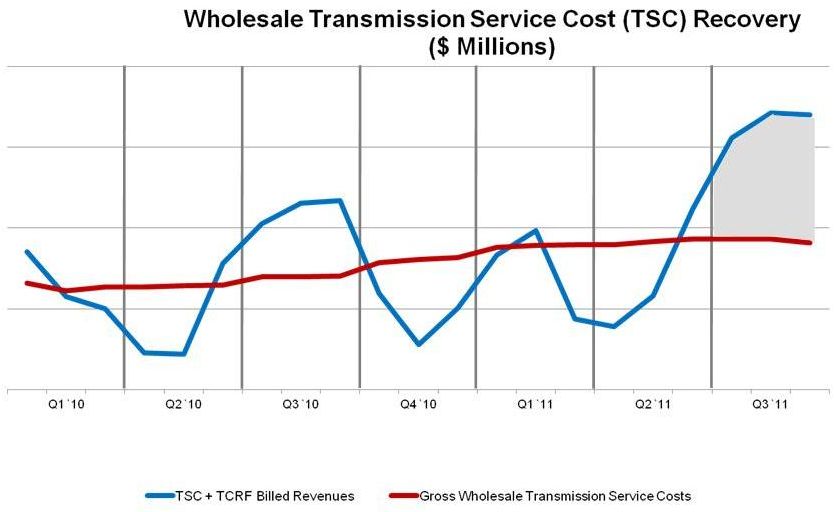 5
Oncor Electric Delivery
Starting Q3 ‘11, Distribution “Book”
Revenue Related to
Recovery of Wholesale Transmission Service Will Match
Expense
1
$143
$144
$147
$153
$158
$160
$160
$144
$130
$172
$133
$150
$147
$204
Includes affiliate transmission costs and excludes impacts of deferrals of accounting recognition to
reflect timing of recovery under PUCT regulations. Numbers indicate amounts TCRF – Transmission Cost Recovery Factor
1
per quarter |
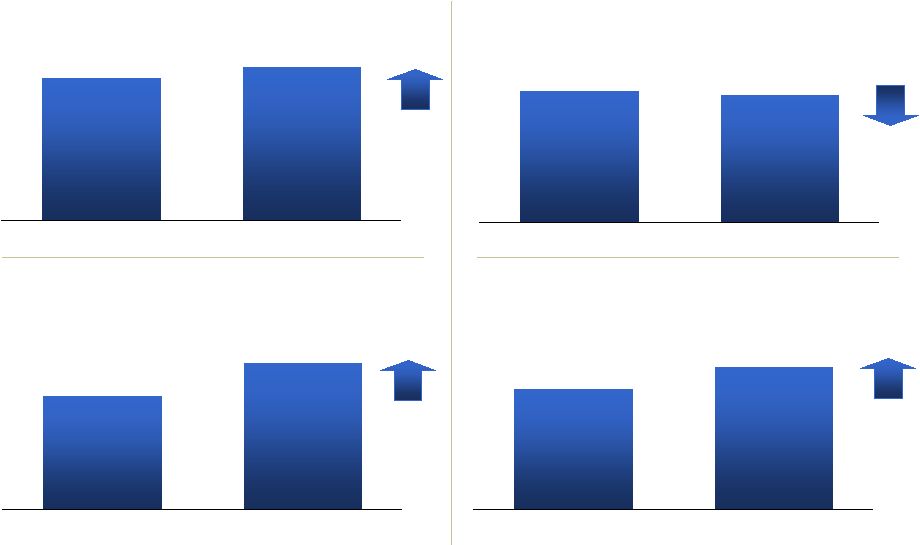 6
Oncor Electric Delivery
Summary of Financial Results
1
Adjusted Net Income
Q3 ‘10 vs. Q3 ‘11; $ millions
146
141
Q3 '10
Q3 '11
Adjusted Operating Revenues
Q3
2
‘10 vs. Q3 ‘11; $ millions
788
851
Q3 '10
Q3 '11
PP&E, net
Q3 ‘10 vs. Q3 ‘11; $ millions
9,529
10,247
At 9/30/2010
At 9/30/2011
Adjusted Operating Cash Flow
Q3 ‘10 vs. Q3 ‘11; $ millions
334
396
Q3 '10
Q3 '11
1
Excludes impacts from transition bond debt, and fair value accounting adjustments associated with the
October 2007 merger. 2
Unless otherwise indicated, reflects three months ended September 30.
8.0%
18.6%
3.4%
7.5% |
 7
Oncor Electric Delivery
Credit Metrics
1
Continue to be Strong
EBITDA
Q3
2
‘10 vs. Q3 ’11 and TME
3
9/30/10 vs TME 9/30/11; $ millions
EBITDA/Cash Interest
TME 9/30/10 vs. TME 9/30/11; Ratio
4.7x
4.7x
TME 9/30/10
TME 9/30/11
Debt/EBITDA
TME 9/30/10 vs. TME 9/30/11; Ratio
3.7x
3.5x
TME 9/30/10
TME 9/30/11
1
Excludes impacts from transition bond debt, a one-time write-off of regulatory assets and fair
value accounting adjustments associated with the October 2007 merger. 2
Three months ended September 30.
3
Twelve months ended.
452
480
1,407
1,509
Q3 '10
Q3 '11
TME 9/30/10
TME 9/30/11
7.2%
6.2% |
 8
Oncor Electric Delivery
Oncor’s Credit Facility Maturity Has Been Extended to
October 2016
Revolver Capacity
Borrowings and
Letters of Credit
Effective Remaining
Capacity
Cash
Total Available
Liquidity
$2.0
billion
Secured
Revolving
Credit
Facility
1
Balances at October 26, 2011; $ millions
$2,000
$564
$1,436
$20
$1,456
Rating
Outlook
Moody’s
Baa1
Stable
Standard & Poor’s
A-
Stable
Fitch Ratings
BBB+
Stable
Solid Credit Ratings
1
Oncor’s $2.0 billion Credit Facility matures in 2016.
2
Excludes transition bond debt.
$376
$524
$500
$324
$550
$126
11
12
13
14
15
16
17
18
19
20
Long-Term Debt
2
Maturity Profile
2011-2020; $ millions |
 9
Oncor Electric Delivery
226
200
230
240
305
325
305
171
180
170
185
200
205
215
164
160
150
257
290
140
135
475
490
202
580
555
390
1,020
1,410
1,250
950
1,000
1,005
1,010
340
155
10
11E
12E
13E
14E
15E
16E
Actual and Estimated Capital Expenditures
10 -
16E; $ millions
New Service
Advanced Metering
CREZ
1
/ Voltage
Support
IT / Maintenance /
General Plant
Transmission Grid
Expansion
Capital Program
1
Oncor currently estimates that the total cost of the CREZ / Voltage Support
projects will be approximately $2.0 billion. |
| 10
Oncor Electric Delivery
3rd Quarter 2011 Investor Call Agenda
Financial Overview
David Davis
Chief Financial Officer
Operational Review
Bob Shapard
Chairman and CEO
Q&A |
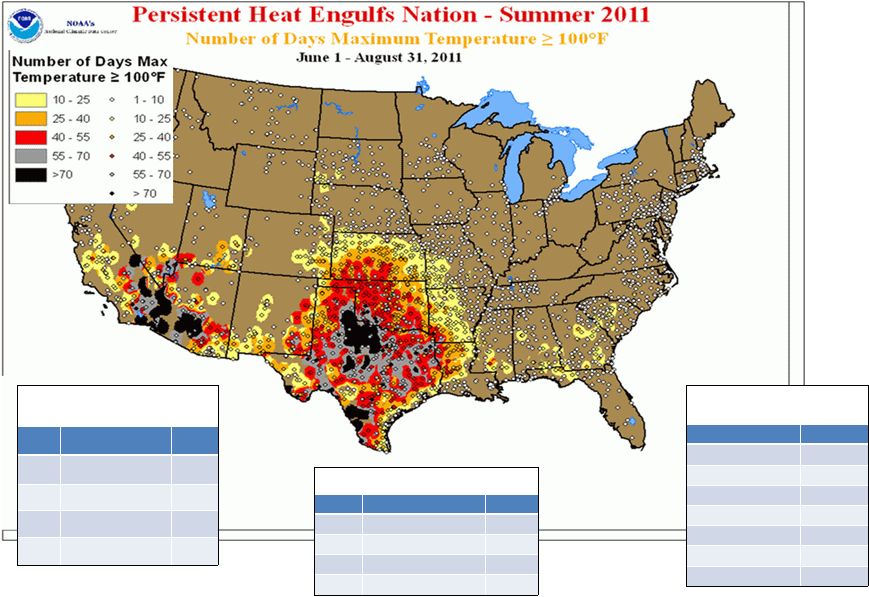 11
Oncor Electric Delivery
Summer Heat of 2011
DFW
Days Low >= 80
o
1
2011
55
2
1998
39
3
2008
27
4
2010
24
5
2006
23
DFW
Days>=105
o
Since 1998
2011
19
2000
10
1998
9
2006
6
1999
5
2008
5
2010
3
2003
2
DFW
Days >= 100
o
1
2011
70
2
1980
69
3
1998
56
4
1954
52
5
1956
48 |
 12
Oncor Electric Delivery
CREZ Update
Competitive Renewable Energy Zones
2011 signals major shift in CREZ
project as it moves from CCN
proceedings to ROW acquisition
and actual construction
Will invest ~$2.0 billion on project
in total, including voltage support,
and $580M in 2011
$689M invested in CREZ through
September 30, 2011; $373M
invested YTD 2011
All 14 CCN’s have been approved |
 13
Oncor Electric Delivery
AMS Initiative on Target for 2012 Completion
Advanced Metering Initiative
More than 2.1M meters installed
through September 30, 2011;
~609,000 meters installed in YTD
‘11
$477M invested in AMS through
September 30, 2011; $117M
invested YTD 2011
Customer education |
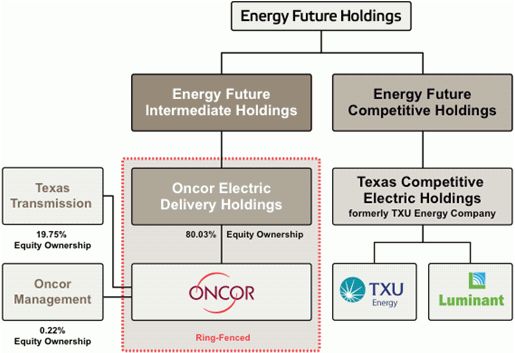 14
Oncor Electric Delivery
Oncor’s Ring-Fencing
Oncor Holdings and Oncor
are ring-fenced entities and
have no obligation to pay
any amounts due on EFH
and EFIH debt that is
secured by EFIH’s equity in
Oncor Holdings.
In the event of a valid
permitted asset transfer
(disposition of EFIH’s
equity interests in Oncor
Holdings), this debt would
become obligations of the
third party transferee. |
 15
Oncor Electric Delivery
Appendix -
Regulation G Reconciliations and Supplemental
Data |
 16
Oncor Electric Delivery
Measure
Definition
TSC
+TCRF Billed Revenues
(non-GAAP)
Charges billed to retail electric providers under Public Utility
Commission of
Texas (PUCT) approved tariffs for the recovery of wholesale transmission
service costs excluding accruals for unbilled deliveries and deferral of
over/under collected amounts calculated under PUCT reconciliation rules
Gross Wholesale Transmission
Service Costs (non-GAAP)
Charges billed to Oncor distribution business under the PUCT’s wholesale
transmission tariff matrix, including Oncor transmission affiliate charges and
excluding deferrals of costs calculated under PUCT reconciliation rules
Adjusted Operating Revenues
(non-GAAP)
Oncor operating revenues, less operating revenues of Oncor Electric Delivery
Transition Bond Company LLC (BondCo)
Adjusted Net Income (non-
GAAP)
Oncor net income, less effects of purchase accounting and net income of
BondCo
Debt (non-GAAP)
Oncor total debt, less transition bonds of BondCo
Adjusted Operating Cash Flow
(non-GAAP)
Oncor cash provided by operating activities, less BondCo cash provided by
operating activities
Total Debt (GAAP)
Oncor long-term debt (including current portion), plus bank loans and
commercial paper
EBITDA (non-GAAP)
Income from continuing operations before interest expense and related
charges and provisions in lieu of income tax, plus depreciation and
amortization and special items. EBITDA is a measure used by Oncor to
assess performance.
Debt/EBITDA (non-GAAP)
Total debt less transition bonds divided by EBITDA. Transition,
or
securitization, bonds are serviced by a regulatory transition charge on wires
rates and are therefore excluded from debt in credit reviews. Debt / EBITDA is
a measure used by Oncor to assess credit quality.
EBITDA/Cash Interest (non-
GAAP)
EBITDA divided by cash interest expense is a measure used by Oncor to
assess credit quality.
Financial Definitions |
 17
Oncor Electric Delivery
Table 1: Oncor TSC + TCRF Billed Revenues and
Wholesale Transmission Service Costs Reconciliation
Three Months Ended Q1 ‘10 –
Q3 ‘11
$ millions
Q1 ‘10
Q2 ’10
Q3 ’10
Q4 ’10
Q1 ’11
Q2 ’11
Q3 ’11
Oncor operating revenues
703
702
831
678
706
756
897
Adjustments:
Operating
revenues
–
Bondco
(41)
(37)
(43)
(32)
(35)
(38)
(46)
Other
revenues
(547)
(504)
(616)
(526)
(552)
(526)
(695)
TCRF revenue deferral
-
-
-
-
-
-
39
Unbilled revenues
29
(31)
-
13
31
(45)
9
TSC + TCRF billed revenues
144
130
172
133
150
147
204
Oncor operation and maintenance expense
249
252
256
252
258
259
281
Less:
Non-wholesale transmission service expense
(151)
(154)
(154)
(156)
(155)
(153)
(168)
Wholesale transmission service expense
98
98
102
96
103
106
113
Plus: Affiliate wholesale transmission service costs
45
46
45
49
50
50
51
Net wholesale transmission cost deferral
-
-
-
8
5
4
(4)
Gross wholesale transmission service costs
143
144
147
153
158
160
160
1
Other revenues consist of distribution base rates other than TSC and TCRF, advanced
metering surcharges, third party transmission revenues and other miscellaneous
revenues 1 |
 18
Oncor Electric Delivery
Table 2: Oncor Adjusted Operating Revenues Reconciliation
Three Months Ended September 30, ‘10 and ‘11
$ millions
Q3 ‘10
Q3 ‘11
Operating revenues –
Oncor
831
897
Less: Operating revenues –
BondCo
(43)
(46)
Adjusted operating revenues, excluding BondCo
788
851 |
 19
Oncor Electric Delivery
Q3 ‘10
Q3 ‘11
Net income –
Oncor
149
144
Less: Effects of fair value accounting (after tax)
(3)
(3)
Adjusted net income, excluding BondCo
146
141
Table 3: Oncor Adjusted Net Income Reconciliation
Three Months Ended September 30, ‘10 and ‘11
$ millions |
 20
Oncor Electric Delivery
Table 4: Oncor Operating Cash Flow Reconciliation
Three Months Ended September 30, ‘10 and ‘11
$ millions
Q3 ‘10
Q3 ‘11
Operating cash flow –
Oncor
368
436
Less: Operating cash flow –
BondCo
(34)
(40)
Operating cash flow, excluding BondCo
334
396 |
 21
Oncor Electric Delivery
Table 5: Oncor EBITDA Reconciliation
Three Months Ended September 30, ‘10 and ‘11
$ millions
Q3 ‘10
Q3 ‘11
Net income –
Oncor
149
144
Plus: Depreciation & amortization –
Oncor
176
190
Provision in lieu of income taxes –
Oncor
79
99
Interest expense –
Oncor
87
89
Equals: EBITDA –
Oncor
491
522
Less: Net income –
BondCo
-
-
Depreciation & amortization –
BondCo
(33)
(38)
Provision in lieu of income taxes –
BondCo
-
-
Interest expense –
BondCo
(9)
(8)
Effects of fair value accounting (pre tax)
(8)
(7)
Regulatory asset amortization
11
11
Oncor EBITDA, excluding BondCo
452
480 |
 22
Oncor Electric Delivery
Table 6: Oncor EBITDA Reconciliation
Twelve Months Ended September 30, ‘10 and ‘11
$ millions
TME ‘10
TME ‘11
Net Income –
Oncor
352
350
Plus: Depreciation & amortization –
Oncor
659
706
Provision in lieu of income taxes –
Oncor
207
238
Interest expense –
Oncor
347
353
Equals: EBITDA –
Oncor
1,565
1,647
Less: Net income –
BondCo
-
-
Depreciation & amortization –
BondCo
(115)
(116)
Provision in lieu of income taxes –
BondCo
-
-
Interest expense –
BondCo
(39)
(33)
Effects of fair value accounting (pre tax)
(35)
(30)
Regulatory asset amortization
41
41
Adjustment of goodwill liability
(10)
-
Oncor EBITDA, excluding BondCo
1,407
1,509 |
 23
Oncor Electric Delivery
Table 7: Oncor Total Debt Reconciliation
At September 30, ‘10 and ‘11
$ millions
‘10
‘11
Short-term debt-
Oncor
428
553
Long-term debt due currently –
Oncor
111
493
Long-term debt, less due currently –
Oncor
5,395
4,882
Total debt –
Oncor, including BondCo
5,934
5,928
Less: Short-term debt –
BondCo
-
-
Long-term debt due currently –
BondCo
(111)
(117)
Long-term debt, less due currently –
BondCo
(591)
(472)
Fair value adjustment –
BondCo
4
2
Total Oncor debt, excluding BondCo
5,236
5,341 |
 24
Oncor Electric Delivery
Table 8: Oncor Interest and Debt Coverages
Twelve Months Ended September 30, ‘10 and ‘11
$ millions
TME ‘10
TME ‘11
Ref
Source
Interest
expense
and
related
charges
–
Oncor
347
353
Amortization
of
debt
fair
value
discount
–
Oncor
(1)
-
Amortization
of
debt
discount
–
Oncor
(7)
(3)
AFUDC
–
Oncor
-
2
Cash
interest
expense
–
Oncor
339
352
Less:
Interest
expense
–
BondCo
(39)
(33)
Cash interest expense, excluding BondCo
300
319
A
EBITDA, excluding BondCo
1,407
1,509
B
Table 5
Total debt, excluding BondCo
5,236
5,341
C
Table 6
EBITDA/cash
interest
–
ratio
(B
/ A)
4.7x
4.7x
Debt/EBITDA
–
ratio
(C
/
B)
3.7x
3.5x |