Attached files
| file | filename |
|---|---|
| 8-K - FORM 8-K - NATIONAL PENN BANCSHARES INC | form8k.htm |
EXHIBIT 99.1
SLIDE PRESENTATION

National Penn Bancshares,
Inc.
Inc.
3nd Quarter 2011
Earnings Webcast
Earnings Webcast

1
Safe Harbor Regarding Forward Looking Statements
This presentation contains forward-looking information about National Penn Bancshares, Inc. that is intended to be covered by the safe harbor for forward-looking
statements provided by the Private Securities Litigation Reform Act of 1995. Forward-looking statements are statements that are not historical facts. These
statements can be identified by the use of forward-looking terminology such as “believe,” “expect,” “may,” “will,” “should,’’ “project,” ”could,” “plan,’’ “goal,” “potential,”
“pro forma,” “seek,” “intend,’’ or “anticipate’’ or the negative thereof or comparable terminology, and include discussions of strategy, financial projections, guidance
and estimates (including their underlying assumptions), statements regarding plans, objectives, expectations or consequences of announced transactions, and
statements about the future performance, operations, products and services of National Penn and its subsidiaries. National Penn cautions readers not to place undue
reliance on these statements.
National Penn’s business and operations are subject to a variety of risks, uncertainties and other factors. Consequently, actual results and experience may
materially differ from those contained in any forward-looking statements. Such risks, uncertainties and other factors that could cause actual results and experience to
differ from those projected include, but are not limited to, the following: increased capital requirements and other requirements or actions mandated by National
Penn’s regulators, National Penn’s ability to raise capital and maintain capital levels, variations in interest rates, deterioration in the credit quality of loans, the effect
of credit risk exposure, declines in the value of National Penn’s assets and the effect of any resulting impairment charges, recent and ongoing changes to the state
and federal regulatory schemes under which National Penn and other financial services companies operate (including the Dodd-Frank Act and regulations adopted
or to be adopted to implement that Act), competition from other financial institutions, interruptions or breaches of National Penn’s security systems, and the
development and maintenance of National Penn’s information technology. These risks and others are described in greater detail in National Penn’s Annual Report on
Form 10-K for the fiscal year ended December 31, 2010, as well as in National Penn’s Quarterly Reports on Form 10-Q and other documents filed by National Penn
with the SEC after the date thereof. National Penn makes no commitment to revise or update any forward-looking statements in order to reflect events or
circumstances occurring or existing after the date any forward-looking statement is made.
This presentation contains supplemental financial information determined by methods other than in accordance with Accounting Principles Generally Accepted in the
United States of America (“GAAP”). National Penn’s management uses these non-GAAP measures in its analysis of National Penn’s performance. These measures
should not be considered a substitute for GAAP basis measures nor should they be viewed as a substitute for operating results determined in accordance with GAAP.
Management believes the presentation of the following non-GAAP financial measures, which exclude the impact of the specified items, provides useful supplemental
information that is essential to a proper understanding of the financial results of National Penn.
l Tangible common equity excludes goodwill and intangible assets and preferred equity. Banking and financial institution regulators also exclude goodwill
and intangible assets from shareholders’ equity when assessing the capital adequacy of a financial institution. Tangible common equity provides a method
to assess the company’s tangible capital trends.
and intangible assets from shareholders’ equity when assessing the capital adequacy of a financial institution. Tangible common equity provides a method
to assess the company’s tangible capital trends.
l Tangible book value expresses tangible common equity on a per-share basis. Tangible book value provides a method to assess the level of tangible net
assets on a per-share basis.
assets on a per-share basis.
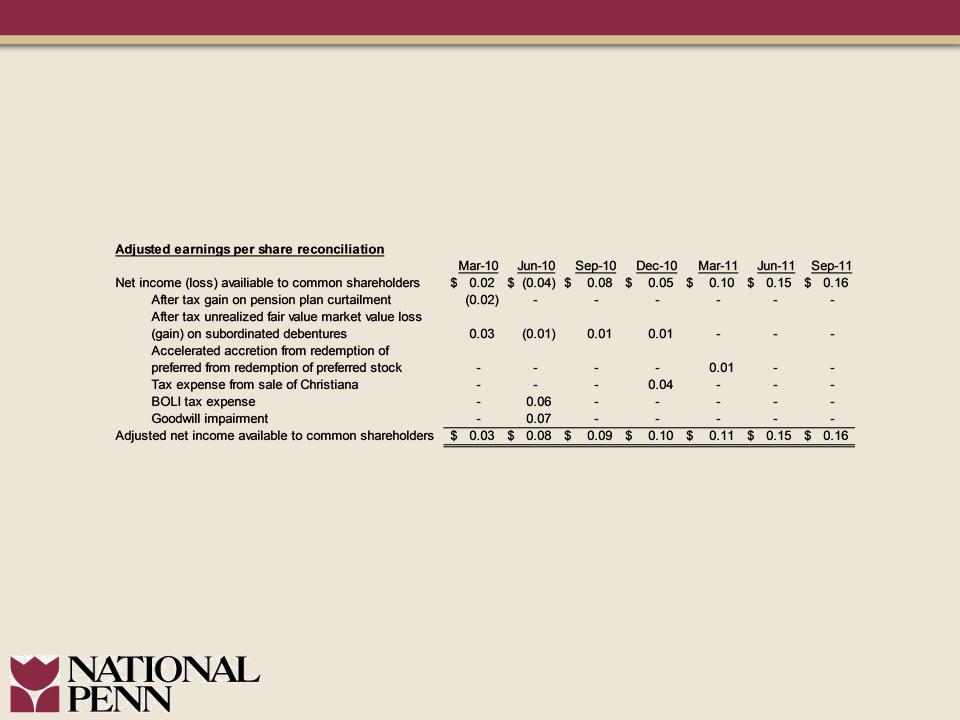
l Adjusted net income excludes the effects of certain gains and losses, adjusted for applicable taxes. Adjusted net income provides a method to assess
earnings performance by excluding items that management believes are not comparable among the periods presented.
earnings performance by excluding items that management believes are not comparable among the periods presented.
l Efficiency ratio expresses operating expenses as a percentage of fully-taxable equivalent net interest income plus non-interest income. Operating
expenses exclude items from non-interest expense that management believes are not comparable among the periods presented. Non-interest income is
adjusted to also exclude items that management believes are not comparable among the periods presented. Efficiency ratio is used as a method for
management to assess its operating expense level and to compare to financial institutions of varying sizes.
Management believes the use of non-GAAP measures will help readers compare National Penn’s current results to those of prior periods as presented in the
accompanying Financial Highlights and financial data tables.
accompanying Financial Highlights and financial data tables.
Non-GAAP Financial Measures

2
3Q 2011 Highlights
• Continued strong earnings and returns
• Continued improvement in asset quality
• Continued strengthening of the balance sheet
• Positioning the company for future growth
3
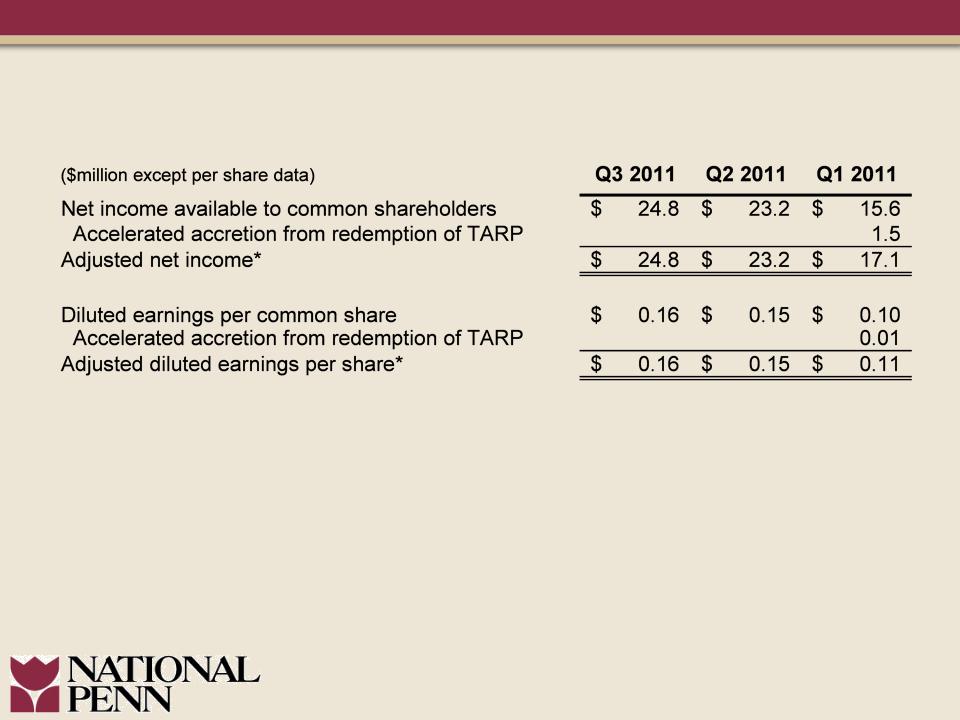
Quarterly Earnings
*A non-GAAP measure.
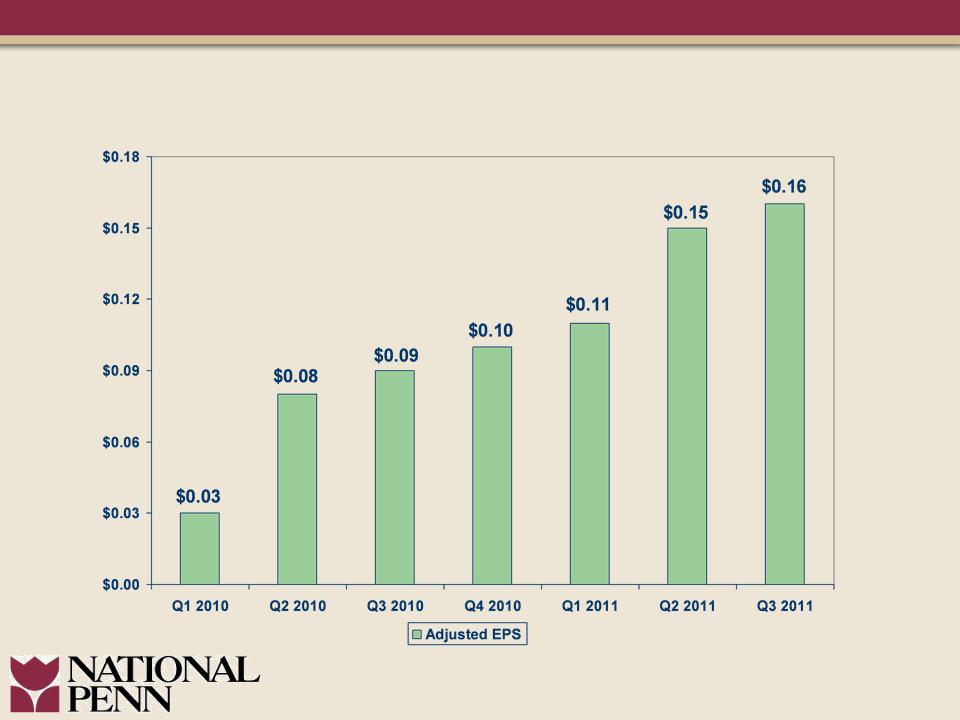
Improving Adjusted Earnings Per Share*
*Refer to Appendix for reconciliation of Non-GAAP measure
4
5
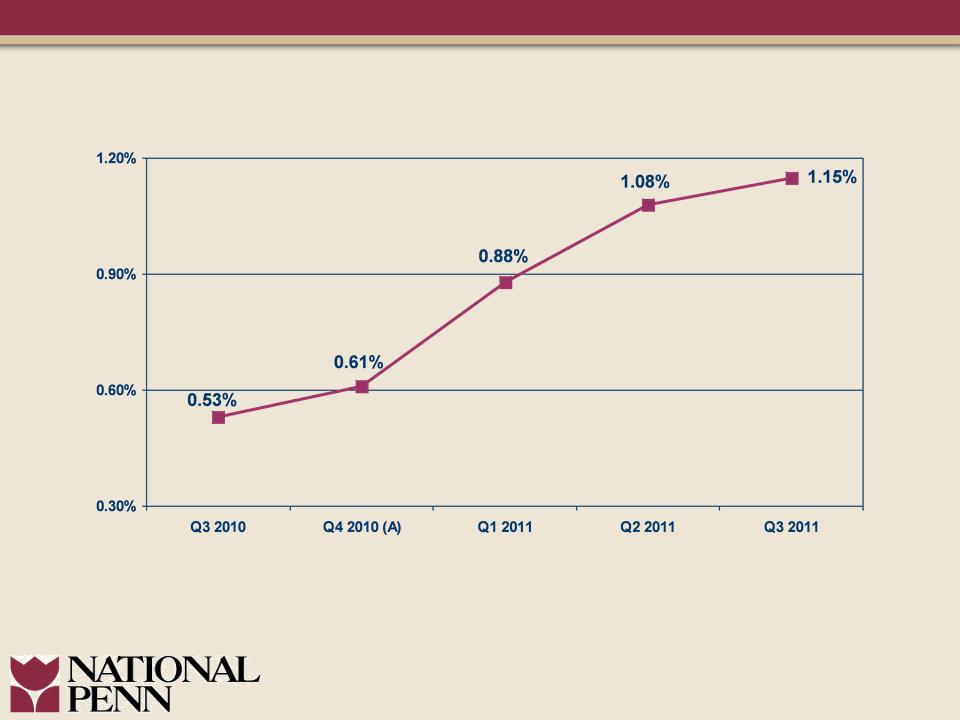
Positive Return on Asset Trend
(A) Excludes charges associated with the divestiture of Christiana
Bank & Trust Company on December 3, 2010
Bank & Trust Company on December 3, 2010
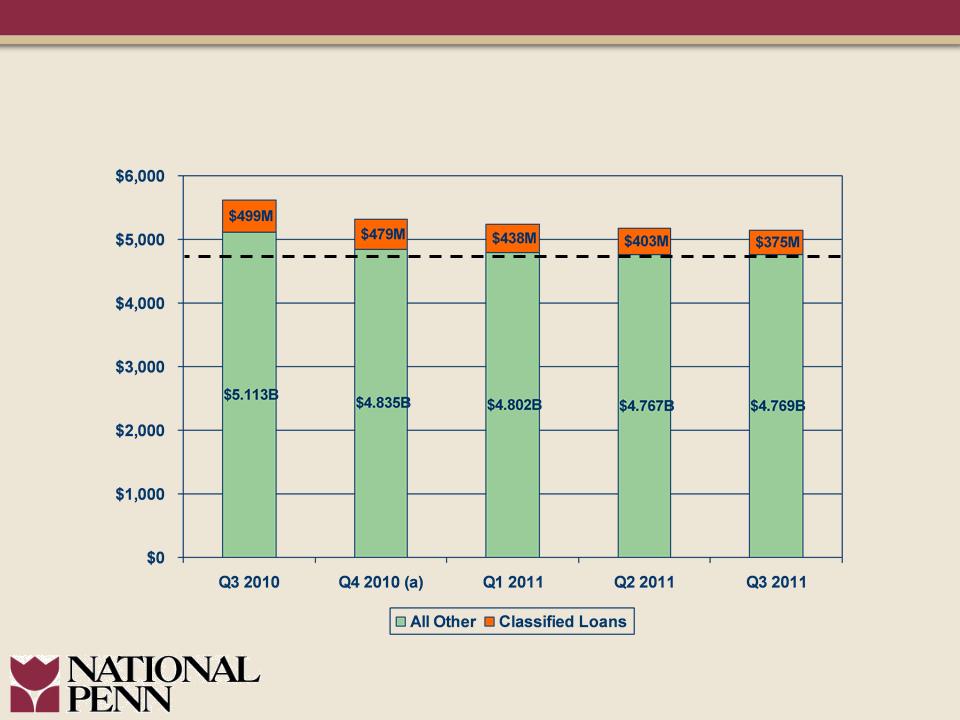
Loan Balances Stable
6
($million)
(a) Christiana Bank & Trust Company divested on December 3, 2010.
7
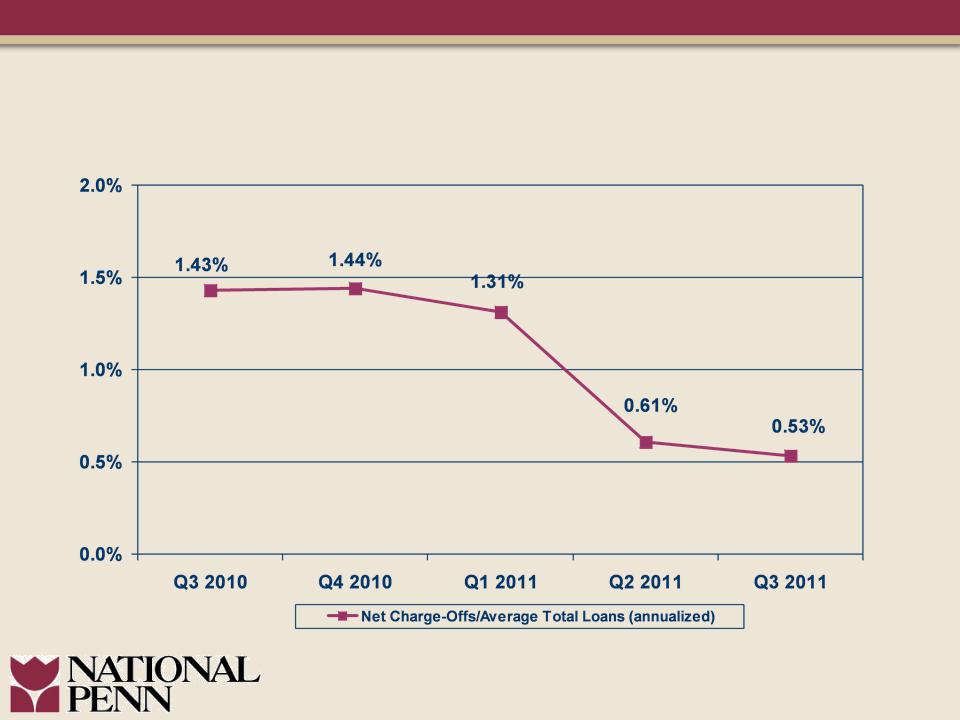
Sustained Asset Quality Improvement
Net Charge-Offs/Average Loans
Net Charge-Offs/Average Loans
Sustained Asset Quality Improvement
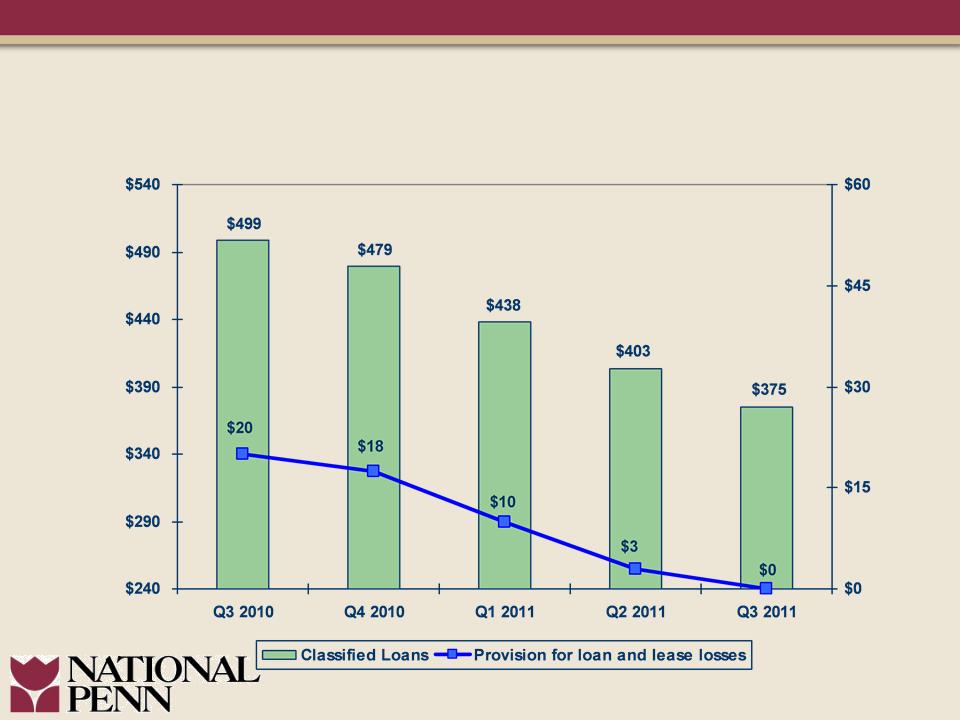
Classified Loans & Provision Trends
Classified Loans & Provision Trends
8
($million)
($million)
9
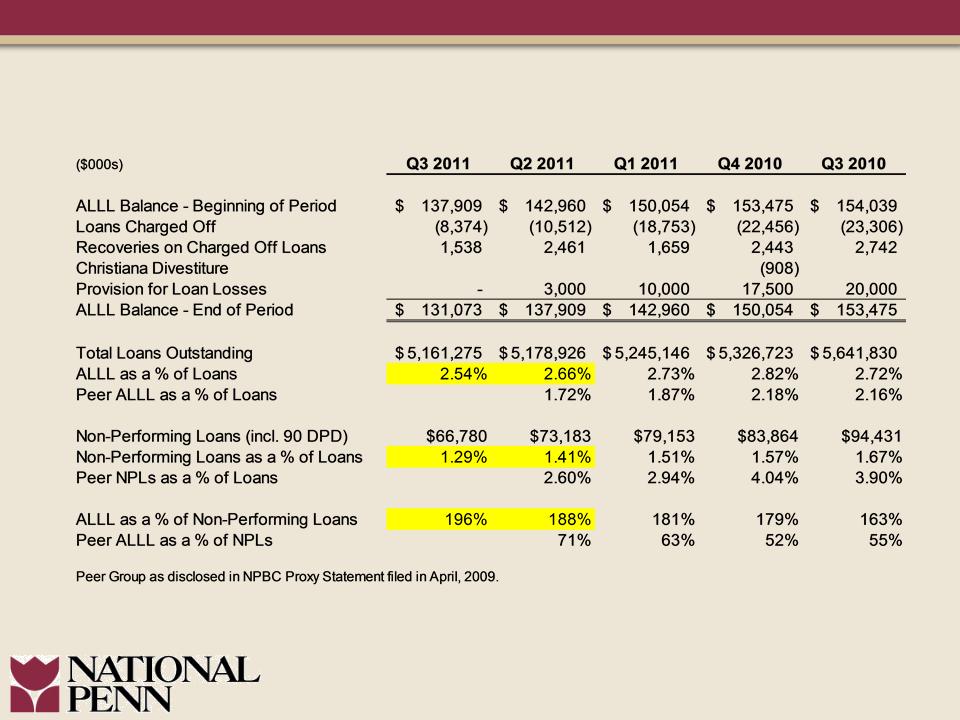
Asset Quality Overview / Peer Comparison
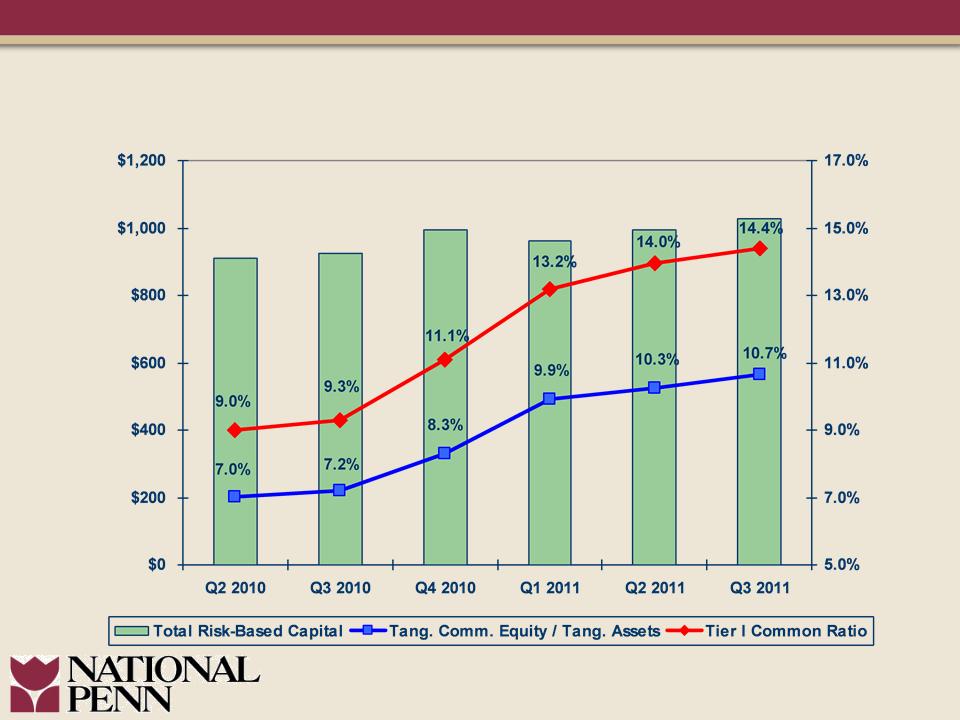
Capital Position Further Enhanced
10
($million)
11
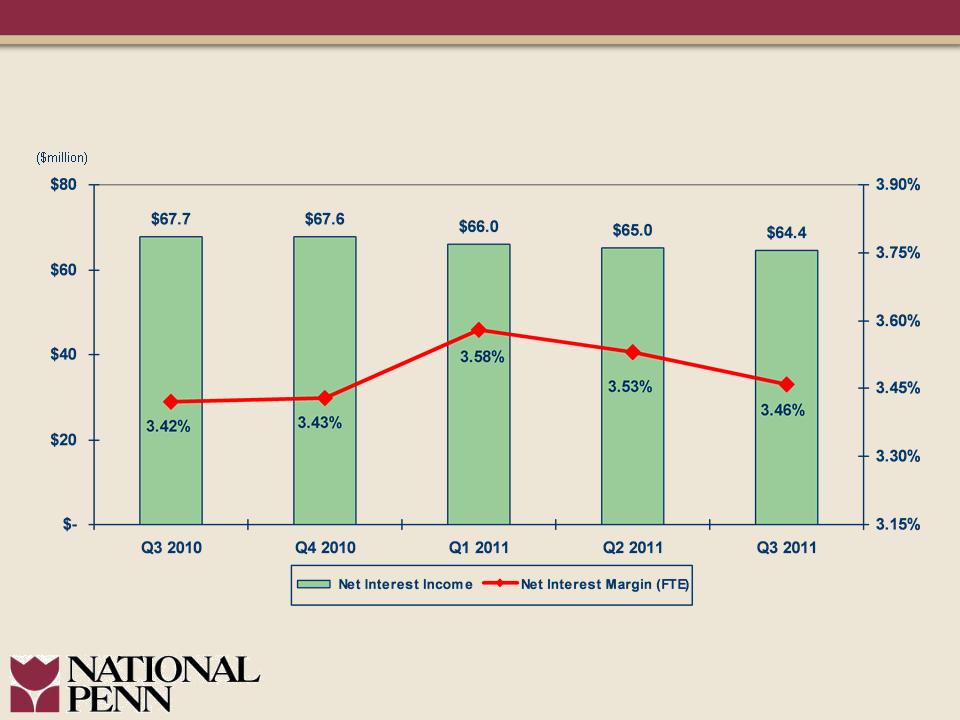
Net Interest Margin

12
• Extension of a portion of “excess” liquidity -
-Approximately $100 million in 3rd quarter.
• Sale of floating rate securities and redeployment into MBS
with duration of 3-4 years and termination of repurchase
agreements.
with duration of 3-4 years and termination of repurchase
agreements.
• Continued focus on deposit pricing including on transaction
accounts.
accounts.
• Third quarter 2011 loan volumes positively impacting 4th
quarter average loans.
quarter average loans.
• Pooled TRUPS swap mature in 4th quarter.
Net Interest Margin Initiatives
13
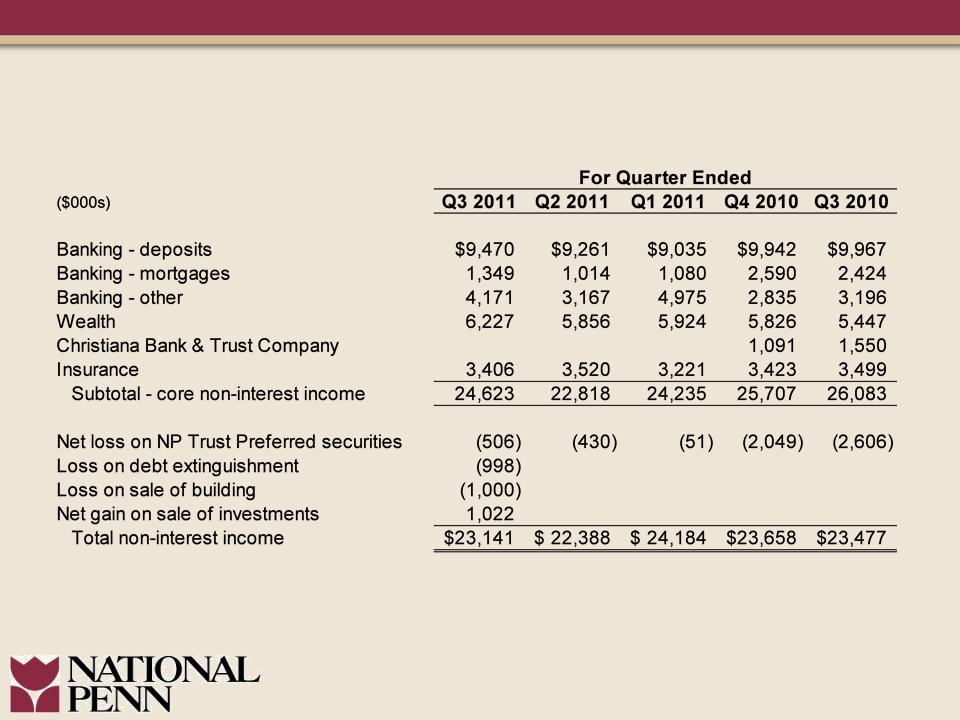
Non-Interest Income
14
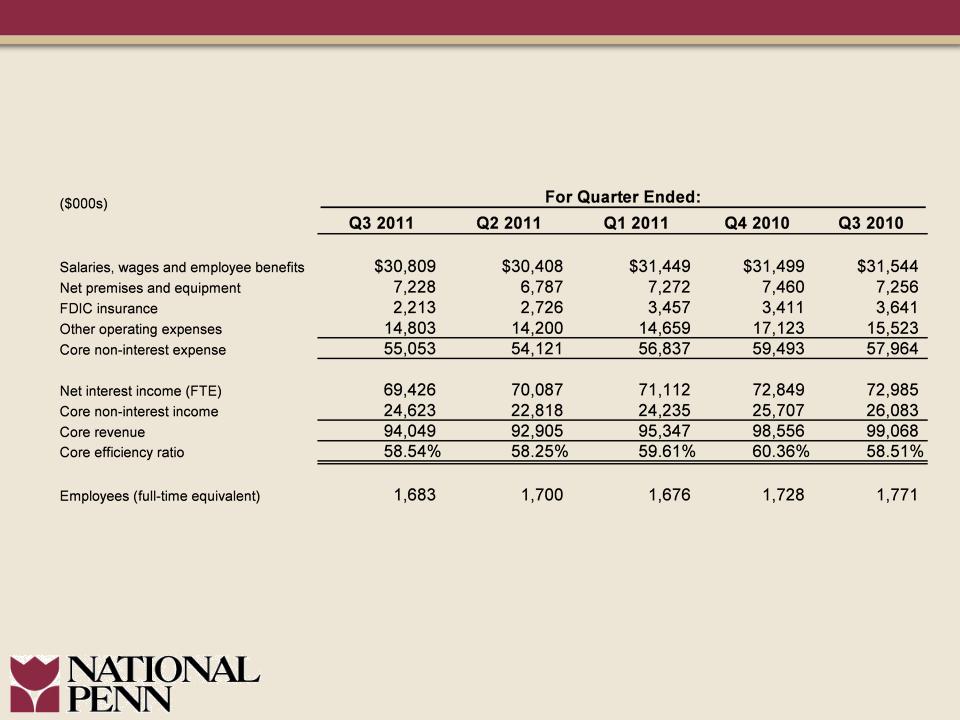
Expense Management Maintained

15
• Capital management strategies
• Continued focus on asset quality
• Manage net interest margin through low interest
rate environment
rate environment
• Win market share
• Re-risk appropriately
• Patient and disciplined approach
Executing on Our Strategic Plan

16

17
Appendix
Loan Risk Profile
September 30, 2011
Loan Risk Profile
September 30, 2011
Appendix
Reconciliation of Non-GAAP Measures
Reconciliation of Non-GAAP Measures
18