Attached files
| file | filename |
|---|---|
| 8-K - FORM 8-K - JOHNSON CONTROLS INC | d248422d8k.htm |
| EX-99.1 - PRESS RELEASE ISSUED BY JOHNSON CONTROLS, INC., DATED OCTOBER 27, 2011 - JOHNSON CONTROLS INC | d248422dex991.htm |
 October 27, 2011
Quarterly update
FY 2011 fourth quarter
Exhibit 99.2 |
 Agenda
Introduction
Glen Ponczak, Vice President, Global Investor Relations
Overview
Steve Roell, Chairman and Chief Executive Officer
Business results and financial review
Bruce McDonald, Executive Vice President and Chief Financial Officer
Q&A
FORWARD-LOOKING STATEMENT
Johnson Controls, Inc. has made forward-looking statements in this document
pertaining to its financial results for fiscal 2012 and beyond that are
based on preliminary data and are subject to risks and uncertainties. All
statements, other than statements of historical fact, are statements that
are,
or
could
be,
deemed
"forward-looking"
statements
and
include
terms
such
as
"outlook,"
"expectations,"
"estimates"
or
"forecasts."
For
those
statements, the Company cautions that numerous important factors, such as
automotive vehicle production levels, mix and schedules, energy and
commodity
prices,
the
strength
of
the
U.S.
or
other
economies,
currency
exchange
rates,
cancellation
of
or
changes
to
commercial
contracts,
changes in the levels or timing of investments in commercial buildings as well as
other factors discussed in Item 1A of Part I of the Company's most recent
Form 10-k filing (filed November 23, 2010) could affect the Company's actual results and could cause its actual consolidated results to
differ materially from those expressed in any forward-looking statement made
by, or on behalf of, the Company. 2 |
 3
Record FY 2011 results despite a mixed
macro environment
-
(+) Benefitted from global automotive recovery
-
(-) Weak Building Efficiency markets
-
(-) Negative impact of Japan earthquake /
tsunami
Outperformed our underlying markets
Increased clarity of AGM growth opportunity
Record level of investments to support growth
2011 full year results
Record sales and earnings
–
$1.4 billion in acquisitions
–
$1.3 billion in capital expenditures
–
FY 2011: Double-digit top and bottom line
improvements, market share gains in all three
businesses |
 2011
full year results Record sales and earnings
Sales: $40.8 billion
vs. $34.3 billion in 2010 (+19%)
Segment income*: $2.4 billion
vs. $1.9 billion in 2010
Net income*: $1.7 billion
vs. $1.4 billion in 2010
EPS*: $2.40 per diluted share
vs. $1.99 in 2010 (+21%)
4
*Excluding non-recurring items |
 Entering 2012
Good momentum
Benefits of strategic M&A and capital growth
investments
Strong backlogs
–
$2.3 billion in newly booked business leading to
Automotive
backlog
of
$4.2
billion
(2012
–
14)
–
Building Efficiency up 8% at end of 2011
Geographic and capacity expansions
in emerging markets
Underlying strength of battery aftermarket
Operational / quality improvements
Johnson Controls
5 |
 2011
fourth quarter Record sales and earnings
Sales: $10.8 billion
vs. $9.0 billion in 2010 (+19%)
Segment income*: $725 million
vs. $586 million in Q4 2010
Net income*: $514 million
vs. $409 million in Q4 2010
EPS*: $0.75 per diluted share
vs. $0.60 in Q4 2010 (+25%)
6
*Excluding non-recurring items in 2011 and 2010 quarters
Q4 results are consistent with the
October 12, 2011 earnings pre-announcement |
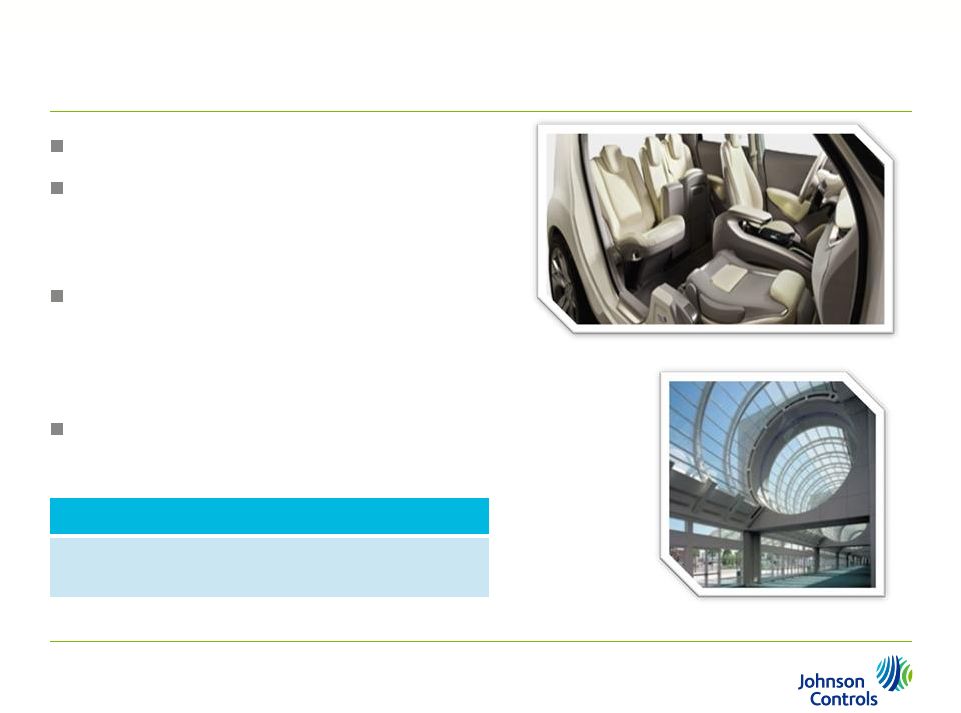
 2011
fourth quarter Automotive Experience
2011
2010
Net sales
$5.1B
$4.1B
24%
Europe up 45%
–
Up 26%, excluding acquisitions
North America up 7%
Asia up 15%; strength in Korea; Japan slightly lower
China sales (mostly non-consolidated): up 20% to $1.1 billion Segment income*
$234M
$129M
81%
Higher volume
Europe: $79 million turnaround vs. Q4 2010
–
Margin of 2.9% vs. loss in prior year
–
“Containment
costs”
trending
lower
Higher JV profitability in Asia
7
2012-2014: $4.2B backlog
2012 $1.0 billion
2013 $1.5 billion
2014 $1.7 billion
71% consolidated; 29%
non-consolidated
53% Europe, 34% Asia,
13% North America
*Excluding non-recurring items
Fiscal Q4 production
North America up 6%
Europe up 5%
China up 8% |
 2011
fourth quarter Building Efficiency
2011
2010
Net sales
$4.1B
$3.6B
14%
Higher revenues in all segments
–
Global Workplace Solutions up 24%
–
North America up 7%
–
Asia up 17%
–
Middle East up 51%
–
Europe up 9%
Segment income*
$278M
$275M
1%
Double
digit
increases
in
Asia
(up
27%),
North
America
systems
(up
13%),
Middle
East
(“Other”
segment,
up
34%)
Lower segment income
–
North America Services: Solutions contract reserves,
acquisition-related costs, investments in infrastructure
–
Global Workplace Solutions: costs associated with new
contracts
NOTE: 9.3% segment income margin excluding GWS
8
Commercial backlog
and orders
(at September 30, 2011)
Record $5.1B, up 8%
Backlog up in all
geographic markets,
strongest in Asia
Orders level with 2010
–
Asia up 18%
–
Europe up 10%
–
N. America flat
Timing of energy
solutions orders
–
Middle East down
*Excluding restructuring and non-recurring items
Global chiller
shipments up 19% |
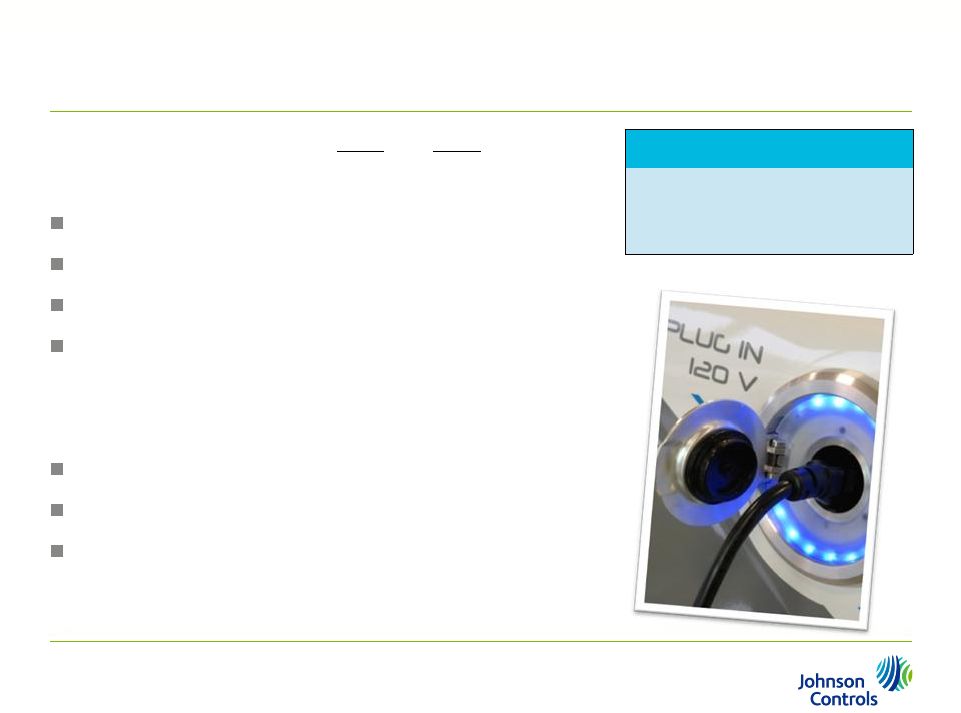 2011
fourth quarter Power Solutions
2011
2010
Net sales
$1.6B
$1.3B
19%
Sales up 12%, excluding lead
Aftermarket unit volume up 4%
OE unit volume up 2%
Benefitting from favorable product mix
Segment income*
$213M
$182M
17%
Improving product mix
Increased vertical integration
Production interruption in China
9
*Excluding non-recurring items
Q4 average lead prices
2011:
$2,558
/
ton
-
up
26%
2010:
$2,030
/
ton |
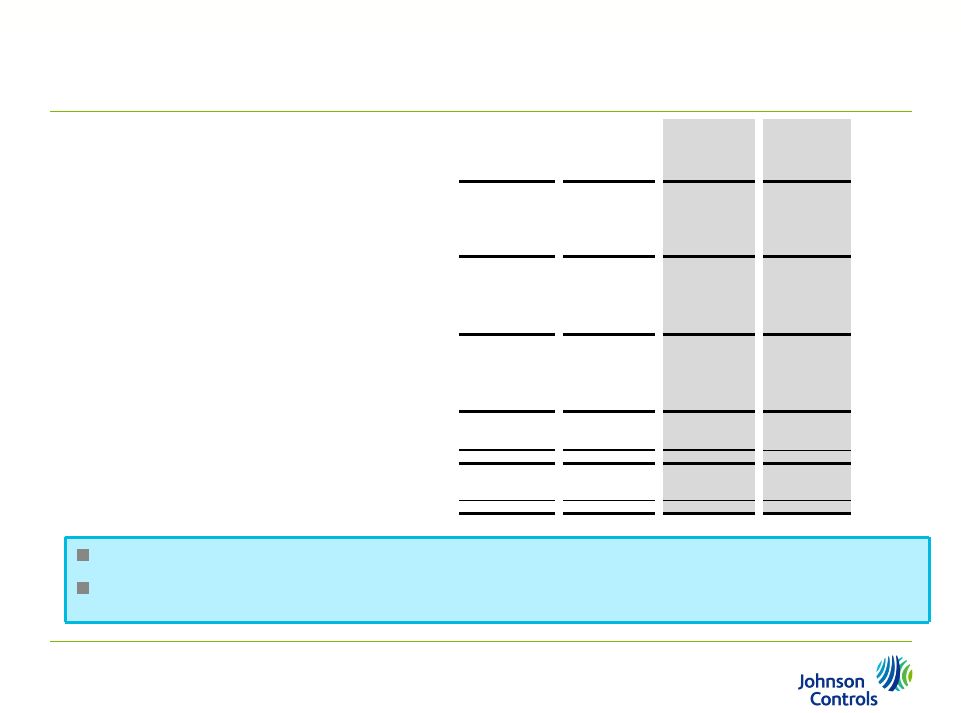
 Fourth quarter 2011
Financial highlights
10
(in millions)
2011*
(excluding items)
2010*
(excluding items)
%
change
2011
(reported)
2010
(reported)
Sales
$10,788
$9,040
19%
$10,788
$9,040
Gross profit
% of sales
1,732
16.1%
1,502
16.6%
15%
1,732
16.1%
1,491
16.5%
SG&A expenses
1,085
975
11%
1,128
985
Equity income
78
59
32%
115
98
Segment income
$725
$586
24%
$719
$604
6.7%
6.5%
6.7%
6.7%
FX
–
Euro
to
U.S.
dollar
average
exchange
rate
at
$1.41
in
Q4
2011
vs.
$1.29
in
2010
Sales
–
Excluding
FX,
sales
up
15%
Gross
profit
–
Higher
volumes
offset
by
product
mix
SG&A
–
Investments
in
innovation
and
growth
opportunities;
70
bps
improvement
vs.
prior
year
as a percentage of sales
* 2011 excludes net one-time income on joint ventures of $37 million and
restructuring charges of $43 million; 2010 excludes an one-time
gain on a Korean JV acquisition of $37 million and an impairment charge of $19 million in
Automotive Experience. |
 Fourth quarter 2011
Financial highlights
Income tax provision –
Underlying 2011 tax rate of 19% vs. 18% in 2010
Non-controlling interests –
Improved profitability in consolidated Automotive JVs
11
(in millions, except earnings per share)
2011*
(excluding
items)
2010*
(excluding
items)
2011
(reported)
2010
(reported)
Segment income
$725
$586
$719
$604
Financing charges -
net
50
53
50
53
Income before taxes
675
533
669
551
Income tax provision
126
96
96
74
Net income
549
437
573
477
Income attributable to non-controlling interests
35
28
35
28
Net income attributable to JCI
$514
$409
$538
$449
Diluted earnings per share
$0.75
$0.60
$0.78
$0.66
* 2011
excludes
net
one-time
income
on
joint
ventures
of
$37
million,
restructuring
charges
of
$43
million
and
non-
recurring tax benefits of $30 million. 2010 excludes an one-time gain on
a Korean JV acquisition of $37 million, an impairment charge of $19 million
in Automotive Experience and non-recurring tax benefits of $22 million. |
 2011
fourth quarter Balance sheet
12
Cash provided by operations of $587 million
Discretionary pension and post-retirement
funding
–
Approximately $175 million in Q4 ($440m in FY11)
Improved Q4 working capital performance
–
Adjusted for discretionary pension / retirement
funding, source of $45 million versus a use of
$200 million in Q4 2010
Increased capital spending to $425 million,
$174 million higher than Q4 2010
Strong balance sheet
Net debt / total capitalization:
31% at year-end |
 2012
outlook 13
Forecast: Fiscal year 2012
Revenues:
$44.2
billion,
up
8%
EPS:
$2.85
-
$3.00,
up
19
–
25%
Q1 2012
$0.60 -
$0.62 / share
9 -
13% improvement Y-O-Y
Near-term outlook
No change to the
October 12, 2011 guidance
Automotive volumes remain stable Operational and quality improvements Integration of
acquisitions
Execution of backlogs
China battery production interruptions |