Attached files
| file | filename |
|---|---|
| 8-K - 8-K - DOMINION ENERGY SOUTH CAROLINA, INC. | a11-28539_18k.htm |
| EX-99.1 - EX-99.1 - DOMINION ENERGY SOUTH CAROLINA, INC. | a11-28539_1ex99d1.htm |
Exhibit 99.2
|
|
Third Quarter 2011 | SCANA CORPORATION Kevin Marsh President - SCANA Jimmy Addison CFO Steve Byrne COO - SCE&G |
|
|
Safe Harbor Statement/Regulation G Information Statements included in this presentation which are not statements of historical fact are intended to be, and are hereby identified as, “forward-looking statements” for purposes of Section 27A of the Securities Act of 1933, as amended, and Section 21E of the Securities Exchange Act of 1934, as amended. Forward-looking statements include, but are not limited to, statements concerning key earnings drivers, customer growth, environmental regulations and expenditures, leverage ratio, projections for pension fund contributions, financing activities, access to sources of capital, impacts of the adoption of new accounting rules and estimated construction and other expenditures. In some cases, forward-looking statements can be identified by terminology such as “may,” “will,” “could,” “should,” “expects,” “forecasts,” “plans,” “anticipates,” “believes,” “estimates,” “projects,” “predicts,” “potential” or “continue” or the negative of these terms or other similar terminology. Readers are cautioned that any such forward-looking statements are not guarantees of future performance and involve a number of risks and uncertainties, and that actual results could differ materially from those indicated by such forward-looking statements. Important factors that could cause actual results to differ materially from those indicated by such forward-looking statements include, but are not limited to, the following: (1) the information is of a preliminary nature and may be subject to further and/or continuing review and adjustment; (2) regulatory actions, particularly changes in rate regulation, regulations governing electric grid reliability, and environmental regulations, and actions affecting the construction of new nuclear units; (3) current and future litigation; (4) changes in the economy, especially in areas served by subsidiaries of SCANA Corporation (SCANA, and together with its subsidiaries, the Company); (5) the impact of competition from other energy suppliers, including competition from alternate fuels in industrial interruptible markets; (6) growth opportunities for SCANA’s regulated and diversified subsidiaries; (7) the results of short- and long-term financing efforts, including future prospects for obtaining access to capital markets and other sources of liquidity; (8) changes in SCANA’s or its subsidiaries’ accounting rules and accounting policies; (9) the effects of weather, including drought, especially in areas where the Company’s generation and transmission facilities are located and in areas served by SCANA's subsidiaries; (10) payment by counterparties as and when due; (11) the results of efforts to license, site, construct and finance facilities for baseload electric generation and transmission; (12) maintaining creditworthy joint venture partners for South Carolina Electric & Gas Company’s (SCE&G) new nuclear generation project; (13) the ability of suppliers, both domestic and international, to timely provide the components, parts, tools, equipment and other supplies needed for our construction program, operations and maintenance; (14) the availability of fuels such as coal, natural gas and enriched uranium used to produce electricity; the availability of purchased power and natural gas for distribution; the level and volatility of future market prices for such fuels and purchased power; and the ability to recover the costs for such fuels and purchased power; (15) the availability of skilled and experienced human resources to properly manage, operate, and grow the Company’s businesses; (16) labor disputes; (17) performance of SCANA’s pension plan assets; (18) changes in taxes; (19) inflation or deflation; (20) compliance with regulations; and (21) the other risks and uncertainties described from time to time in the periodic reports filed by SCANA or SCE&G with the United States Securities and Exchange Commission. The Company disclaims any obligation to update any forward-looking statements. During this presentation, certain non-GAAP measures (as defined by SEC Regulation G) may be disclosed. A reconciliation of those measures to the most directly comparable GAAP measures is included on our website at www.scana.com in the Investor Relations section under Regulation G Information. |
|
|
Announcement Date Company Expected Job Additions Projected Investment July 2011 Masonite Corporation 159 $22M August 2011 Carolina Pacific Briquetting 25 $3M August 2011 Otis Elevator 360 $40M September 2011 TigHitco 350 $30M September 2011 Pactiv Corporation 4 $3M September 2011 Immedion, LLC 20 $6M September 2011 Bridgestone Americas, Inc. 850 $1,250M October 2011 Continential Tire 1,500 $528M October 2011 Ameresco, Inc. 8 $2M Total 3,276 $1,884M 3 | Economy Year to date, total projected investment announced during 2011 is over $2.5 billion, with more than 5,500 expected job additions. |
|
|
Regulated Returns Company Rate Base (millions) Regulatory Actual ROE* Regulatory Allowed ROE* SCE&G Electric $4,831 8.60% 10.70% SCE&G Gas $446 7.72% 10.25% PSNC** $690 11.32% 10.60% TOTAL (weighted) $5,967 8.85% 10.65% * As of 6/30/2011 regulatory filings ** Amounts may not reflect NCUC’s determinations of rate base, capitalization and/or ROE Completed 4 | 2011 Regulated Returns & Regulatory Filings Regulatory Filings |
|
|
Completed 5 | Base Load Review Act (BLRA) Filings & Rate Increases 0.4% 1.1% 2.3% 2.4% 2011 BLRA Filings |
|
|
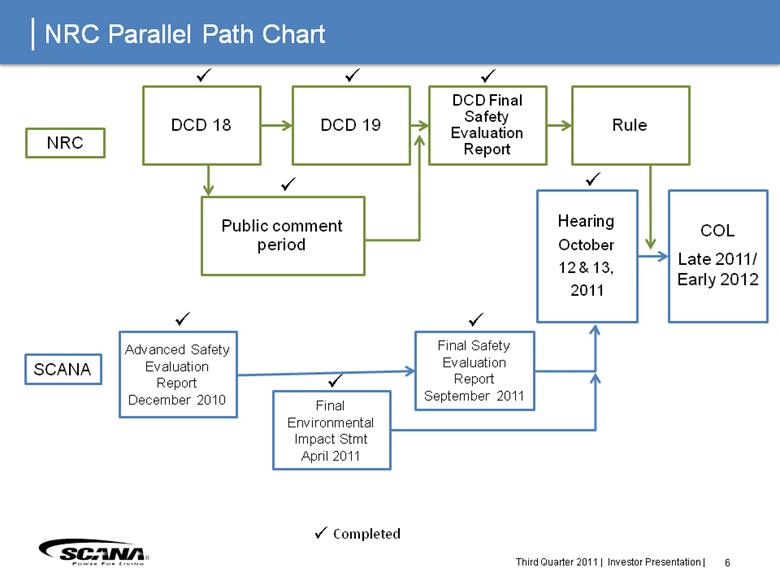
SCANA COL Late 2011/ Early 2012 Final Environmental Impact Stmt April 2011 Final Safety Evaluation Report September 2011 Advanced Safety Evaluation Report December 2010 NRC DCD 18 Hearing October 12 & 13, 2011 Public comment period DCD 19 Rule DCD Final Safety Evaluation Report 6 | NRC Parallel Path Chart Completed |
|
|
Cross State Air Pollution Rule Finalized by EPA on July 6, 2011 Aimed at addressing power plant emissions that may contribute to air pollution in other states Requires states in the Eastern United States to reduce power plant emissions Sulfur Dioxide Nitrogen Oxide 7 | Environmental Regulation |
|
|
$.80 $.81 8 | Basic Earnings and Q3 Variances |
|
|
$2.25 $2.25 9 | YTD Variances 2011 Guidance $2.95 - $3.10 (1) 2010 EPS - GAAP $2.99 2010 EPS - Weather Normal $2.92 (1) Indicates EPS guidance range of $2.95 - $3.10, with an internal target of $3.02. |
|
|
Basic Earnings per Share by Company $0.81 $0.80 $2.25 10 | Third Quarter & YTD Earnings Comparison SCE&G PSNC SEGA Corporate & Other $2.25 ($0.03) ($0.04) ($0.05) ($0.01) |
|
|
Quarter Ended September 30, 2011 2010 % Change Sales (GWh): Residential 2,542 2,603 (2.3) Commercial 2,180 2,236 (2.5) Industrial 1,586 1,567 1.2 Other 169 167 1.2 Total Retail Sales 6,477 6,573 (1.5) Wholesale 619 583 6.2 Total Sales 7,096 7,156 (0.8) Nine Months Ended September 30, 2011 2010 % Change Sales (GWh): Residential 6,609 6,883 (4.0) Commercial 5,769 5,921 (2.6) Industrial 4,536 4,413 2.8 Other 440 440 0.0 Total Retail Sales 17,354 17,657 (1.7) Wholesale 1,618 1,484 9.0 Total Sales 18,972 19,141 (0.9) Customers (Period-End, Thousands) 665 660 0.8 11 | Electric Operating Statistics |
|
|
Quarter Ended September 30, 2011 2010 % Change Sales (Thousand Dekatherms): Residential 4,304 3,962 8.6 Commercial 5,694 5,352 6.4 Industrial 51,525 53,353 (3.4) Total Retail Sales 61,523 62,667 (1.8) Sales for Resale 1,190 1,289 (7.7) Total Sales 62,713 63,956 (1.9) Transportation Volumes 35,849 36,006 (0.4) Nine Months Ended September 30, 2011 2010 % Change Sales (Thousand Dekatherms): Residential 45,041 50,922 (11.5) Commercial 26,947 28,412 (5.2) Industrial 139,871 134,585 3.9 Total Retail Sales 211,859 213,919 (1.0) Sales for Resale 5,807 5,561 4.4 Total Sales 217,666 219,480 (0.8) Transportation Volumes 116,872 111,217 5.1 Customers (Period-End, Thousands) 1,237 1,222 1.2 12 | Gas Operating Statistics |
|
|
13 | Earnings Guidance Assumptions Normal weather O&M is assumed flat with 2011 Customer usage slightly lower Residential customer growth consistent with 2011 Anticipated extension of equity forward to late 2012 SCEG Electric Margins: BLRA rate relief effective 11/11 BLRA rate relief projected 11/12 SCEG Gas Margins: RSA rate increase effective 11/11 PSNC Margins: Decoupling mechanism (CUT) for reduced consumption by residential & commercial customers SCANA Energy - Georgia: $0.22 - $0.24 anticipated EPS (1): Weather Normalized EPS* (2): 2011 EPS Guidance, Internal target $3.02 (3): 2012 EPS Guidance, Internal target $3.17 (2) (3) $2.92 (1) Weather Normalized EPS is a non-GAAP number. See slide 17 for a reconciliation to GAAP. |
|
|
Note: Reflects nuclear capex as filed August 2011 in BLRA Quarterly Report 14 | CAPEX 2011 – 2014 Estimated 2011E 2012E 2013E 2014E TOTAL ($ in Millions) SCE&G - Normal Generation $ 95 $ 142 $ 96 $ 78 $ 411 Transmission & Distribution 202 198 217 190 807 Other 37 26 14 21 98 Gas 50 49 51 57 207 Common 18 14 18 13 63 Total SCE&G - Normal 402 429 396 359 1,586 PSNC Energy 66 57 65 70 258 Other 32 42 40 31 145 Total "Normal" 500 528 501 460 1,989 New Nuclear 478 839 849 641 2,807 Cash Requirements for Construction 978 1,367 1,350 1,101 4,796 Nuclear Fuel 81 57 106 10 254 Total Estimated Capital Expenditures 1,059 1,424 1,456 1,111 5,050 |
|
|
2011E 2012E 2013E 2014E ($ in Millions) Debt Refinancings: SCANA $300 $250 $ - $ - SCE&G 150 - 150 PSNC 150 - - - New Issues: SCE&G 200 450 450 400 PSNC - - - - Total Debt $800 $700 $600 $400 Equity 401(k)/DRIP $ 95 $100 $100 $100 Equity Forward - ~200 - - Additional (estimated) - 275 125 Total Equity $ 95 $300 $375 $225 | Financing Plan 2011 - 2014 Estimated 2010 forward offering of equity expected to be drawn in Q4 of 2012 Complete 15 |
|
|
Questions? 16 |

|
|
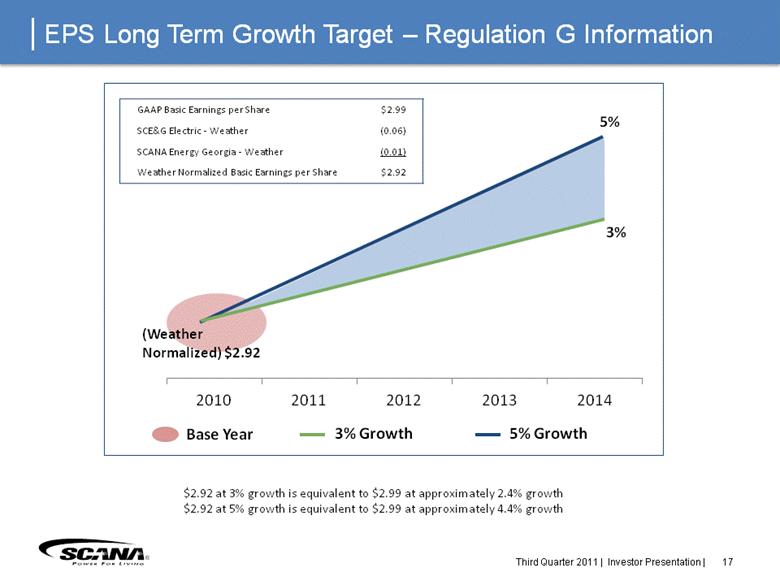
GAAP Basic Earnings per Share $2.99 SCE&G Electric - Weather (0.06) SCANA Energy Georgia - Weather (0.01) Weather Normalized Basic Earnings per Share $2.92 (Weather Normalized) $2.92 5% Base Year 3% $2.92 at 3% growth is equivalent to $2.99 at approximately 2.4% growth $2.92 at 5% growth is equivalent to $2.99 at approximately 4.4% growth | EPS Long Term Growth Target – Regulation G Information 17 |