Attached files
| file | filename |
|---|---|
| 8-K - LIVE FILING - NORTHRIM BANCORP INC | htm_43299.htm |
EXHIBIT 99.1
 |
||
Contact:
|
Joe Schierhorn, Chief Financial Officer (907) 261-3308 |
|
NEWS RELEASE
Northrim BanCorp Year-to-Date 2011 Profits Increase 13% to $8.1 Million, or $1.24 per
Diluted Share
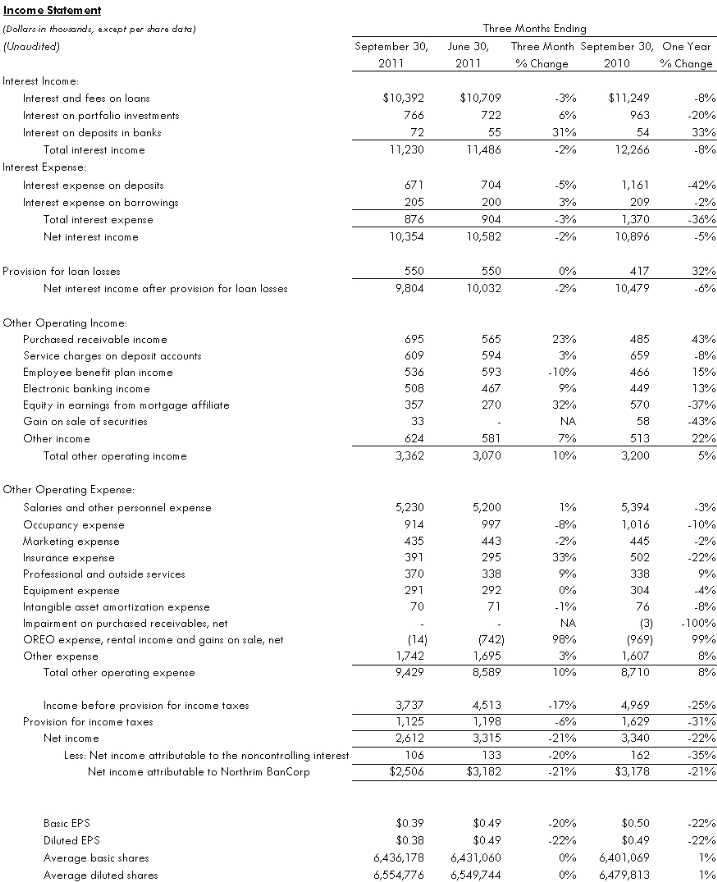
ANCHORAGE, AK—October 25, 2011—Northrim BanCorp, Inc. (NASDAQ: NRIM) today reported that net income increased 13% to $8.1 million, or $1.24 per diluted share, in the first nine months of 2011, compared to $7.2 million, or $1.11 per diluted share in the like period a year ago. Improving asset quality, contributions from affiliates, and lower expenses contributed to profitability for both the third quarter and first nine months of 2011. In the third quarter of 2011, Northrim earned $2.5 million, or $0.38 per diluted share, compared to $3.2 million, or $0.49 per diluted share in both the second quarter of 2011 and the third quarter a year ago. A major factor in the decline in quarterly earnings was the timing of gains on sale of other real estate owned (OREO).
“We continue to generate solid core earnings from our Alaska banking franchise along with the contribution from our growing affiliated financial services businesses,” said Marc Langland, Chairman, President and CEO of Northrim BanCorp, Inc. “We have also been effective at decreasing many of our expenses as we work to achieve greater efficiencies in the future by leveraging our investments in technology and our employees.”
Financial Highlights (at or for the period ended September 30, 2011, compared to June 30, 2011, and September 30, 2010)
| • | Nonperforming assets declined to $16.3 million, or 1.53% of total assets at September 30, 2011, compared to $16.9 million, or 1.61% of total assets at the end of June, and $25.0 million, or 2.41% of total assets a year ago. |
| • | Northrim has actively sold its OREO. Proceeds from the disposal of OREO totaled $618,000, $6.2 million, and $3.3 million for the three-month periods ending September 30, 2011, June 30, 2011, and September 30, 2010, resulting in gains on sale of $54,000, $733,000, and $1.2 million during the same time periods, respectively. |
| • | The allowance for loan losses totaled 2.56% of gross loans at September 30, 2011, compared to 2.46% in the preceding quarter and 2.31% a year ago. The allowance for loan losses to nonperforming loans also increased to 154.1% at September 30, 2011, from 132.6% in the preceding quarter and 105.9% a year ago. |
| • | Other operating income, which includes revenues from service charges, electronic banking and financial services affiliates, contributed 24.5% to third quarter 2011 total revenues and 22.6% of year- to- date revenues. |
| • | Northrim remains well-capitalized with Tier 1 Capital to Risk Adjusted Assets at September 30, 2011 of 15.39%, compared to15.59% at the end of the prior quarter and 14.46% a year ago. Tangible common equity to tangible assets was 10.86% at September 30, 2011, compared to 10.90% at June 30, 2011 and 10.50% a year ago. |
| • | Third quarter 2011 net interest margin (NIM) was 4.45% down from 4.65% for the second quarter of 2011 and 4.77% a year ago. Year-to-date 2011 NIM was 4.60% compared to 5.05% in the first nine months of 2010. |
| • | At September 30, 2011, tangible book value grew 6% to $17.82 per share, and book value per share increased 5% to $19.14 per share from a year ago. |
| • | Northrim pays a quarterly cash dividend of $0.13 per share, compared to quarterly cash dividends of $0.12 per share in the three-month periods ending June 30, 2011, and September 30, 2010, which provides a yield of approximately 2.7% at current market share prices. |
“Supported by a number of marketing and advertising campaigns, our seasoned lending team is beginning to build a stronger pipeline for new loans,” said Joe Beedle, President of Northrim Bank. “We have a concentrated calling program in place to increase our market share and expand our core franchise.”
Alaska Economic Update
With relatively strong prices for commodities, particularly oil, minerals and fisheries, Alaska’s economy continues to be one of the best in the nation. According to figures released by the U.S. Department of Commerce in August of this year, total disposable income in Alaska increased 4% from 2009 to 2010, from $27.7 billion to $28.8 billion — the 5th fastest pace in the nation. Total personal income in Alaska has grown in each of the last five years, from $23.9 million in 2006. Per capita disposable income in Alaska last year was $40,530, the 8th highest in the U.S. and 110% of the U.S. national average.
Employment in Alaska also reached an all-time high in July of this year according to a recent report by the Alaska Department of Labor and Workforce Development. As the report notes, employment in Alaska has grown every year since 1988 except for 2009 when it declined by four-tenths of a percent, only to recoup these losses in 2010 and reach a new high at 355,100 in July of this year.
Northrim Bank sponsors the Alaskanomics blog to provide news, analysis and commentary on Alaska’s economy. With contributions from economists, business leaders, policy makers and everyday Alaskans, Alaskanomics aims to engage readers in an ongoing conversation about our economy, now and in the future. Join the conversation at Alaskanomics.com or for more information on the Alaska economy, visit www.northrim.com and click on the “About Alaska” tab.
Asset Quality and Balance Sheet Review
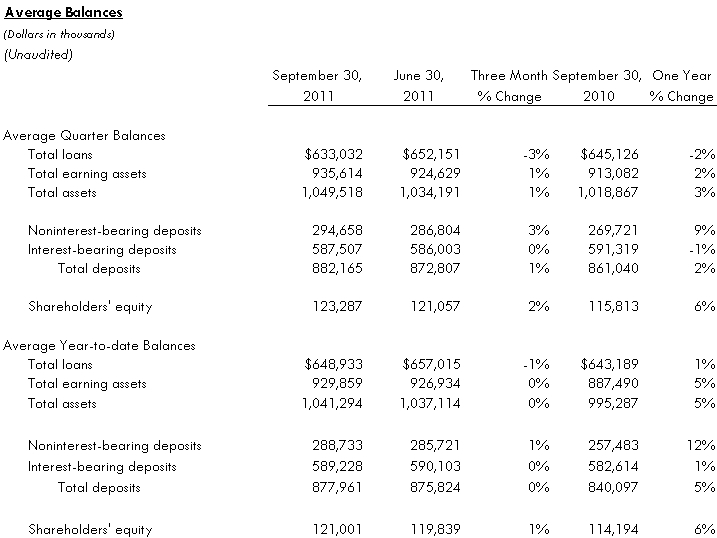
Northrim’s assets totaled $1.07 billion at September 30, 2011, compared to $1.05 billion at June 30, 2011, and $1.04 billion a year ago.
The loan portfolio totaled $629.7 million at September 30, 2011, down from $634.1 million at June 30, 2011, with declines in commercial loans and construction loans partially offset by increases in commercial real estate loans. At September 30, 2011, commercial loans accounted for 36% of the loan portfolio and commercial real estate loans accounted for 50% of the loan portfolio, as compared to 37% and 48%, respectively, a year ago. Construction and land development loans accounted for 7% of the loan portfolio at September 30, 2011 and 8% at June 30, 2011 and September 30, 2010 and were down slightly to $46.0 million at September 30, 2011 from $47.6 million at June 30, 2011 and $51.0 million at September 30, 2010, as there were more pay downs in this segment of the portfolio than loan originations during this period.
Nonperforming assets (NPAs), declined to $16.3 million at September 30, 2011 from $16.9 million in the prior quarter and from $25.0 million at the end of September 2010. The nonperforming assets to total assets ratio stood at 1.53% at the end of September of this year, down from 1.61% three months earlier and 2.41% a year ago.
“We closed the sale of a $3.8 million condominium complex in Anchorage, generating a $449,000 gain in the second quarter of 2011 which contributed to the year-over-year reduction in real estate owned from a year ago,” said Chris Knudson, Chief Operating Officer. “We have also continued with our active collection efforts that have helped us to further decrease our nonperforming loans.”
Loans measured for impairment decreased to $10.9 million at the end of September 2011, compared to $12.7 million at June 30, 2011, and $22.2 million in the third quarter a year ago. Net charge-offs in the third quarter of 2011 totaled $30,000, compared to $115,000 in the prior quarter and $132,000 in the third quarter ending September 30, 2010. Net recoveries in the first nine months of 2011 totaled $38,000 compared to net charge-offs of $1.6 million in the first nine months a year ago.
“We have thirteen restructured loans, which are included in NPAs and totaled $4.1 million at the end of the third quarter of this year,” said Joe Schierhorn, Chief Financial Officer. “There are seven loans with total balances of $2.6 million where the borrowers are current on payments and have pledged collateral to support the loans; however, the borrowers were granted concessions on the terms of their loans due to their financial difficulty. As a result of the modifications to these loans, they are now classified as troubled debt restructured loans and included in nonperforming assets. The remaining $1.5 million in restructured loans are included in nonaccrual loans.”
The coverage ratio of the allowance for loan losses to nonperforming loans increased to 154.1% at the end of September 2011, compared to 132.6% at June 30, 2011, and to 105.9% a year ago. The allowance for loan losses was $16.1 million, or 2.56% of total loans at quarter end, compared to $15.6 million, or 2.46% of total loans at June 30, 2011, and $14.7 million, or 2.31% of total loans a year ago.
Investment securities totaled $218.2 million at the end of the third quarter of 2011, up 1% from $215.0 million a year ago. At September 30, 2011, the investment portfolio was comprised of 66% U.S. Agency securities (primarily Federal Home Loan Bank and Federal Farm Credit Bank debt), 9% Alaskan municipality, utility, or state agency securities, 20% corporate bonds, 4% U.S. Treasury Notes, and 1% stock in the Federal Home Loan Bank of Seattle. The average estimated duration of the investment portfolio is less than two years.
“Our deposit base continues to be generated from our home markets of greater Anchorage and Fairbanks and includes a strong mix of consumer and business accounts,” said Beedle. At the end of September 2011, total deposits were $893.6 million, compared to $884.2 million at June 30, 2011, and $878.7 million a year ago. Year-to-date, average deposit balances grew 5% to $878.0 million from $840.1 million in the like period a year ago.
Noninterest-bearing demand deposits at September 30, 2011, increased 9% from a year ago and accounted for 34% of total deposits. Interest-bearing demand deposits at the end of September 2011 grew 6% year-over-year. Money market balances at the end of the third quarter of 2011 were up 16% from year ago levels and savings account balances were down 1% from a year ago. The Alaska CD (a flexible certificate of deposit program) was down 14% at the end of the third quarter of 2011, while time deposit balances fell 15% compared to the third quarter a year ago. At the end of the third quarter of 2011, noninterest-bearing demand deposits accounted for 34% of total deposits, interest-bearing demand accounts were 15%, savings deposits were 9%, money market balances accounted for 17%, the Alaska CD accounted for 11% and time certificates were 14% of total deposits.
Shareholders’ equity increased 6% to $123.3 million, or $19.14 per share, at September 30, 2011, compared to $116.8 million, or $18.22 per share, a year ago. Tangible book value per share was $17.82 at the end of September 2011, compared to $16.86 a year ago. Northrim remains well-capitalized with Tier 1 Capital to Risk Adjusted Assets of 15.39% at September 30, 2011.
Review of Operations
Net Interest Income after Provision for Loan Losses
Third quarter 2011 net interest income, before the provision for loan losses, was down 5% year-over-year to $10.4 million from $10.9 million in the third quarter of 2010. Net interest income before the provision for loan losses for the nine month period ending September 30, 2011 was down 5% to $31.6 million from $33.3 million in the first nine months a year ago.
“With yields on earning assets continuing to fall while costs of funding, particularly deposits, have bottomed out, our margin has contracted this year. Nevertheless, we continue to generate a net interest margin well above peer averages,” said Schierhorn. Northrim’s net interest margin (net interest income as a percentage of average earning assets on a tax equivalent basis) was 4.45% in the third quarter of 2011, compared to 4.65% in the prior quarter and 4.77% in the third quarter a year ago. For the first nine months of 2011, the net interest margin was down 45 basis points to 4.60% from 5.05% in the first nine months of 2010.
Reflecting the continuing improvement in credit quality, the loan loss provision in the third quarter of 2011 totaled $550,000, in line with $550,000 recorded in the preceding quarter and up slightly from $417,000 in the third quarter a year ago. For the first nine months of 2011, the loan loss provision totaled $1.6 million down from $3.2 million a year ago.
Other Operating Income
Total other operating income increased 10% to $3.4 million in the third quarter of 2011, compared to $3.1 million for the second quarter ended June 30, 2011, due to growth in affiliate income. In the third quarter a year ago, Northrim’s other operating income totaled $3.2 million. Total other operating income for the first nine months of 2011 increased 2% to $9.2 million as compared to the same period in 2010, with lower service charges on deposit accounts and fewer gains from sale of securities offset by growth in affiliate revenues.
“Our ability to offer a full range of financial services to our commercial customers is one of Northrim’s competitive advantages,” said Beedle. “In addition to traditional loans and savings accounts, Northrim offers receivables financing in our Alaska markets and the greater Seattle area, health insurance plans, mortgages, and wealth management including business and employee retirement services through a variety of affiliates in which we share an ownership position. Affiliate income is a steady contributor to profits accounting for more than $1.7 million of revenues in the third quarter of 2011 and $4.3 million of revenues in the first nine months of 2011. “
“Receivable financing continues to grow, and we are providing a valuable and attractive alternative to conventional loans for businesses to augment working capital,” said Beedle. Purchased receivables income contributed $695,000 to third quarter revenues and $1.9 million to revenues in the first nine months of 2011.
Income from Northrim Benefits Group, Northrim’s employee benefit plan affiliate, contributed $536,000 to third quarter revenues and $1.6 million to the first nine months of 2011 revenues. “Our business customers like to work with us to source health benefit plans for their employees, because we offer service, value and a wide choice of plans,” noted Knudson. “Our two wealth management affiliates in which we have an ownership interest, Elliott Cove Capital and Pacific Wealth Advisors, also added $92,000 to third quarter revenues and $208,000 to revenues in the first nine months of this year.”
In the third quarter of 2011, service charges on deposit accounts were down 8% from the third quarter a year ago. Year- to- date 2011 service charges on deposit accounts fell 19% from a year ago. “While many banks are seeing lower revenues for overdraft services, we have benefited from other revenue streams,” said Knudson. “We are seeing higher volumes of electronic banking transactions, which help to offset lower services charges,” Knudson continued. Electronic banking fees increased 9% in the third quarter of 2011 as compared to the preceding quarter and 13% from a year ago. For the nine month period ending September 30, 2011, electronic banking income grew 11% over the same period of 2010, reflecting increased debit card transactions .”
Other Operating Expenses
“Many of our overhead expenses were down in the third quarter of 2011, but total expenses were up because we had lower gains on sale and rental income from OREO,” added Beedle. OREO gains and rental income reduced operating expenses by just $14,000 in the third quarter of 2011, compared to $742,000 in the preceding quarter and $969,000 in the third quarter a year ago. Through September 30, 2011, on a year-to-date basis, OREO gains and rental income reduced expenses by $895,000 compared to $907,000 a year ago. During this same time period, total other operating expenses decreased by 4% to $27.3 million as compared to $28.4 million a year ago due to lower salary and benefit costs and decreased insurance expense and impairment on purchased receivables.
Third quarter 2011 other operating expenses were $9.4 million compared to $8.6 million in the second quarter of 2011 and $8.7 million in the third quarter a year ago. For the first nine months of the year, other operating expenses were $27.3 million compared to $28.4 million in the year ago period.
About Northrim BanCorp
Northrim BanCorp, Inc. is the parent company of Northrim Bank, a commercial bank that provides personal and business banking services through locations in Anchorage, Eagle River, Wasilla, and Fairbanks, Alaska, and a factoring/asset based lending division in Washington. The Bank differentiates itself with a “Customer First Service” philosophy. Affiliated companies include Elliott Cove Insurance Agency, LLC; Elliott Cove Capital Management, LLC; Residential Mortgage, LLC; Northrim Benefits Group, LLC; and Pacific Wealth Advisors, LLC.
www.northrim.com
This release may contain “forward-looking statements” that are subject to risks and uncertainties. Readers should not place undue reliance on forward-looking statements, which reflect management’s views only as of the date hereof. All statements, other than statements of historical fact, regarding our financial position, business strategy and management’s plans and objectives for future operations are forward-looking statements. When used in this report, the words “anticipate,” “believe,” “estimate,” “expect,” and “intend” and words or phrases of similar meaning, as they relate to Northrim or management, are intended to help identify forward-looking statements within the meaning of the Private Securities Litigation Reform Act of 1995. Although we believe that management’s expectations as reflected in forward-looking statements are reasonable, we cannot assure readers that those expectations will prove to be correct. Forward-looking statements are subject to various risks and uncertainties that may cause our actual results to differ materially and adversely from our expectations as indicated in the forward-looking statements. These risks and uncertainties include our ability to maintain or expand our market share or net interest margins, and to implement our marketing and growth strategies. Further, actual results may be affected by our ability to compete on price and other factors with other financial institutions; customer acceptance of new products and services; the regulatory environment in which we operate; and general trends in the local, regional and national banking industry and economy as those factors relate to our cost of funds and return on assets. In addition, there are risks inherent in the banking industry relating to collectibility of loans and changes in interest rates. Many of these risks, as well as other risks that may have a material adverse impact on our operations and business, are identified in our other filings with the SEC. However, you should be aware that these factors are not an exhaustive list, and you should not assume these are the only factors that may cause our actual results to differ from our expectations.