Attached files
| file | filename |
|---|---|
| EX-32.1 - CERTIFICATIONS OF CEO AND CFO PURSUANT TO SECTION 906 - DreamWorks Animation, LLC | dwaex3219302011.htm |
| EX-31.2 - CERTIFICATION OF CFO PURSUANT TO SECTION 302 - DreamWorks Animation, LLC | dwaex3129302011.htm |
| EX-31.1 - CERTIFICATION OF CEO PURSUANT TO SECTION 302 - DreamWorks Animation, LLC | dwaex3119302011.htm |
| EXCEL - IDEA: XBRL DOCUMENT - DreamWorks Animation, LLC | Financial_Report.xls |
UNITED STATES
SECURITIES AND EXCHANGE COMMISSION
WASHINGTON, D.C. 20549
___________________________
FORM 10-Q
___________________________
QUARTERLY REPORT PURSUANT TO SECTION 13 OR 15(d) OF
THE SECURITIES EXCHANGE ACT OF 1934
For the quarterly period ended September 30, 2011
Commission file number 001-32337
DREAMWORKS ANIMATION SKG, INC.
(Exact name of registrant as specified in its charter)
Delaware | 68-0589190 |
(State or other jurisdiction of incorporation or organization) | (I.R.S. employer identification no.) |
1000 Flower Street
Glendale, California 91201
(Address of principal executive offices) (Zip code)
(818) 695-5000
(Registrant's telephone number, including area code)
Indicate by check mark whether the registrant (1) has filed all reports required to be filed by Section 13 or 15(d) of the Securities Exchange Act of 1934 during the preceding 12 months (or for such shorter period that the registrant was required to file such reports), and (2) has been subject to such filing requirements for the past 90 days. Yes x No o.
Indicate by check mark whether the registrant has submitted electronically and posted on its corporate Web site, if any, every Interactive Data File required to be submitted and posted pursuant to Rule 405 of Regulation S-T (§232.405 of this chapter) during the preceding 12 months (or for such shorter period that the registrant was required to submit and post such files). Yes x No o
Indicate by check mark whether the registrant is a large accelerated filer, an accelerated filer, a non-accelerated filer, or a smaller reporting company. See the definition of “large accelerated filer,” “accelerated filer” and “smaller reporting company” in Rule 12b-2 of the Exchange Act. (Check one):
Large accelerated filer | T | Accelerated filer | o |
Non-accelerated filer | o (Do not check if a smaller reporting company) | Smaller reporting company | o |
Indicate by check mark whether the registrant is a shell company (as defined in Rule 12b-2 of the Exchange Act). Yes o No x.
Indicate the number of shares outstanding of each of the registrant's classes of common stock: As of October 14, 2011, there were 72,704,717 shares of Class A common stock and 10,838,731 shares of Class B common stock of the registrant outstanding.
TABLE OF CONTENTS
Page | ||
PART I. | ||
Item 1. | ||
Item 2. | ||
Item 3. | ||
Item 4. | ||
PART II. | ||
Item 1. | ||
Item 1A. | ||
Item 2. | ||
Item 5. | ||
Item 6. | ||
Unless the context otherwise requires, the terms “DreamWorks Animation,” the “Company,” “we,” “us” and “our” refer to DreamWorks Animation SKG, Inc., its consolidated subsidiaries, predecessors in interest, and the subsidiaries and assets and liabilities contributed to it by the entity then known as DreamWorks L.L.C. (“Old DreamWorks Studios”) on October 27, 2004 in connection with our separation from Old DreamWorks Studios, including Pacific Data Images, Inc. and its subsidiary, Pacific Data Images, LLC.
1
PART I—FINANCIAL INFORMATION
Item 1. | Financial Statements |
DREAMWORKS ANIMATION SKG, INC.
CONSOLIDATED BALANCE SHEETS
(Unaudited)
September 30, 2011 | December 31, 2010 | ||||||
(in thousands, except par value and share amounts) | |||||||
Assets | |||||||
Cash and cash equivalents | $ | 149,596 | $ | 163,819 | |||
Trade accounts receivable, net of allowance for doubtful accounts | 28,839 | 40,136 | |||||
Income taxes receivable | 2,388 | 310 | |||||
Receivable from Paramount, net of allowance for doubtful accounts | 177,252 | 242,629 | |||||
Film and other inventory costs, net | 896,759 | 772,668 | |||||
Prepaid expenses | 24,838 | 21,795 | |||||
Other assets | 13,898 | 9,889 | |||||
Property, plant and equipment, net of accumulated depreciation and amortization | 171,334 | 174,803 | |||||
Deferred taxes, net | 268,101 | 295,602 | |||||
Goodwill | 34,216 | 34,216 | |||||
Total assets | $ | 1,767,221 | $ | 1,755,867 | |||
Liabilities and Equity | |||||||
Liabilities: | |||||||
Accounts payable | $ | 2,485 | $ | 3,515 | |||
Accrued liabilities | 110,631 | 143,098 | |||||
Payable to former stockholder | 296,371 | 329,590 | |||||
Deferred revenue and other advances | 27,225 | 20,793 | |||||
Total liabilities | 436,712 | 496,996 | |||||
Commitments and contingencies (Note 13) | |||||||
Stockholders’ equity: | |||||||
Class A common stock, par value $.01 per share, 350,000,000 shares authorized, 97,520,150 and 97,436,947 shares issued, as of September 30, 2011 and December 31, 2010, respectively | 975 | 975 | |||||
Class B common stock, par value $.01 per share, 150,000,000 shares authorized, 10,838,731 and 10,838,731 shares issued and outstanding, as of September 30, 2011 and December 31, 2010, respectively | 108 | 108 | |||||
Additional paid-in capital | 1,014,338 | 979,177 | |||||
Retained earnings | 1,029,456 | 966,935 | |||||
Less: Class A Treasury common stock, at cost, 24,815,433 and 23,834,081 shares, as of September 30, 2011 and December 31, 2010, respectively | (714,368 | ) | (688,324 | ) | |||
Total stockholders’ equity | 1,330,509 | 1,258,871 | |||||
Total liabilities and stockholders’ equity | $ | 1,767,221 | $ | 1,755,867 | |||
See accompanying notes.
2
DREAMWORKS ANIMATION SKG, INC.
CONSOLIDATED STATEMENTS OF INCOME
(Unaudited)
Three Months Ended | Nine Months Ended | ||||||||||||||
September 30, | September 30, | ||||||||||||||
2011 | 2010 | 2011 | 2010 | ||||||||||||
(in thousands, except per share amounts) | |||||||||||||||
Revenues | $ | 160,762 | $ | 188,882 | $ | 487,054 | $ | 509,120 | |||||||
Costs of revenues | 107,966 | 107,664 | 321,304 | 312,581 | |||||||||||
Gross profit | 52,796 | 81,218 | 165,750 | 196,539 | |||||||||||
Product development | 724 | 1,450 | 1,147 | 2,057 | |||||||||||
Selling, general and administrative expenses | 26,851 | 26,478 | 86,533 | 77,739 | |||||||||||
Operating income | 25,221 | 53,290 | 78,070 | 116,743 | |||||||||||
Interest income, net | 142 | 160 | 403 | 390 | |||||||||||
Other income, net | 1,334 | 2,343 | 5,393 | 6,440 | |||||||||||
Decrease (increase) in income tax benefit payable to former stockholder | 555 | (18,012 | ) | 5,319 | (34,868 | ) | |||||||||
Income before income taxes | 27,252 | 37,781 | 89,185 | 88,705 | |||||||||||
Provision (benefit) for income taxes | 7,598 | (1,980 | ) | 26,663 | 3,300 | ||||||||||
Net income | $ | 19,654 | $ | 39,761 | $ | 62,522 | $ | 85,405 | |||||||
Basic net income per share | $ | 0.24 | $ | 0.47 | $ | 0.75 | $ | 1.00 | |||||||
Diluted net income per share | $ | 0.23 | $ | 0.47 | $ | 0.74 | $ | 0.98 | |||||||
Shares used in computing net income per share | |||||||||||||||
Basic | 83,405 | 83,946 | 83,640 | 85,491 | |||||||||||
Diluted | 84,791 | 85,496 | 84,764 | 87,503 | |||||||||||
See accompanying notes.
3
DREAMWORKS ANIMATION SKG, INC.
CONSOLIDATED STATEMENTS OF CASH FLOWS
(Unaudited)
Nine Months Ended | |||||||
September 30, | |||||||
2011 | 2010 | ||||||
(in thousands) | |||||||
Operating activities | |||||||
Net income | $ | 62,522 | $ | 85,405 | |||
Adjustments to reconcile net income to net cash provided by operating activities: | |||||||
Amortization and write-off of film and other inventory costs | 257,403 | 269,840 | |||||
Stock-based compensation expense | 22,134 | 22,403 | |||||
Depreciation and amortization | 2,597 | 4,693 | |||||
Revenue earned against deferred revenue and other advances | (69,287 | ) | (56,699 | ) | |||
Deferred taxes, net | 27,501 | (1,236 | ) | ||||
Changes in operating assets and liabilities: | |||||||
Trade accounts receivable | 13,776 | (1,128 | ) | ||||
Receivable from Paramount | 65,377 | 51,293 | |||||
Film and other inventory costs | (350,783 | ) | (342,498 | ) | |||
Prepaid expenses and other assets | (5,621 | ) | (17,134 | ) | |||
Accounts payable and accrued liabilities | (33,424 | ) | 9,312 | ||||
Payable to former stockholder | (33,219 | ) | 12,299 | ||||
Income taxes payable/receivable, net | (2,204 | ) | (2,140 | ) | |||
Deferred revenue and other advances | 89,279 | 45,736 | |||||
Net cash provided by operating activities | 46,051 | 80,146 | |||||
Investing activities | |||||||
Purchases of property, plant and equipment | (28,928 | ) | (37,777 | ) | |||
Investment in unconsolidated affiliate | (5,000 | ) | — | ||||
Net cash used in investing activities | (33,928 | ) | (37,777 | ) | |||
Financing activities | |||||||
Receipts from exercise of stock options | 6 | 8,801 | |||||
Excess tax benefits from employee equity awards | 30 | 1,139 | |||||
Deferred financing costs | (338 | ) | — | ||||
Purchase of treasury stock | (26,044 | ) | (113,954 | ) | |||
Net cash used in financing activities | (26,346 | ) | (104,014 | ) | |||
Decrease in cash and cash equivalents | (14,223 | ) | (61,645 | ) | |||
Cash and cash equivalents at beginning of period | 163,819 | 231,245 | |||||
Cash and cash equivalents at end of period | $ | 149,596 | $ | 169,600 | |||
Supplemental disclosure of cash flow information: | |||||||
Cash paid during the period for income taxes, net of amounts refunded | $ | 1,790 | $ | 5,513 | |||
Cash paid during the period for interest, net of amounts capitalized | $ | 484 | $ | 404 | |||
See accompanying notes.
4
DREAMWORKS ANIMATION SKG, INC.
NOTES TO UNAUDITED CONSOLIDATED FINANCIAL STATEMENTS
1. | Business and Basis of Presentation |
Business
The businesses and activities of the DreamWorks Animation SKG, Inc. (“DreamWorks Animation” or the “Company”) primarily include the development, production and exploitation of animated films and its characters in the worldwide theatrical, home entertainment, television, merchandising and licensing and other markets (such as the creation of television specials/series and live performances based on the characters). The Company's films are distributed on a worldwide basis, except for in the merchandising and licensing markets, by Paramount Pictures Corporation, a subsidiary of Viacom Inc. (“Viacom”), and its affiliates (collectively, “Paramount”) pursuant to a distribution agreement and a fulfillment services agreement (collectively, the “Paramount Agreements”). The Company generally retains all other rights to exploit its films, including commercial tie-in and promotional rights with respect to each film, as well as merchandising, interactive, literary publishing, music publishing and soundtrack rights, live performance and television production rights.
Basis of Presentation and Use of Estimates
The consolidated financial statements of the Company present the financial position, results of operations and cash flows of DreamWorks Animation and its wholly owned subsidiaries. All significant intercompany accounts and transactions have been eliminated. The accompanying unaudited financial data as of September 30, 2011 and for the three and nine months ended September 30, 2011 and 2010 has been prepared by the Company pursuant to the rules and regulations of the Securities and Exchange Commission (the “SEC”) and in accordance with United States generally accepted accounting principles (“GAAP”) for interim financial information. Accordingly, certain information and footnote disclosures normally included in comprehensive financial statements have been condensed or omitted pursuant to such rules and regulations. The consolidated balance sheet as of December 31, 2010 was derived from the audited financial statements at that date, but does not include all the information and footnotes required by GAAP. These financial statements should be read in conjunction with the consolidated financial statements and related notes included in the Company's Annual Report on Form 10-K for the year ended December 31, 2010 (the “2010 Form 10-K”).
The accompanying unaudited consolidated financial statements reflect all adjustments, consisting of only normal recurring items, which in the opinion of management, are necessary for a fair statement for the periods shown. The results of operations for such periods are not necessarily indicative of the results expected for the full year, or for any future period, as fluctuations can occur based upon the timing of our films' theatrical and home entertainment releases, and television special broadcasts.
The preparation of financial statements in conformity with United States GAAP requires management to make estimates and assumptions that affect the amounts reported in the financial statements and accompanying notes, including estimates of ultimate revenues and ultimate costs of film, television product and live performances, estimates of product sales that will be returned and the amount of receivables that ultimately will be collected, the potential outcome of future tax consequences of events that have been recognized in the Company's financial statements, loss contingencies, and estimates used in the determination of the fair value of equity awards for stock-based compensation or their probability of vesting. Actual results could differ from those estimates. To the extent that there are material differences between these estimates and actual results, the Company's financial condition or results of operations will be affected. Estimates are based on past experience and other assumptions that management believes are reasonable under the circumstances, and management evaluates these estimates on an ongoing basis.
2. | Recent Accounting Pronouncements |
In September 2011, the Financial Accounting Standards Board ("FASB") issued an accounting standard update to simplify the annual goodwill impairment test. The guidance provides companies with the option to first assess qualitative factors to determine whether it is more likely than not that the fair value of a reporting unit is less than its carrying amount. If a greater than 50 percent likelihood exists that the fair value is less than the carrying amount then a company must apply the existing quantitative two-step goodwill impairment test. This guidance is effective for the Company's annual and interim periods beginning after December 15, 2011, with early adoption permitted. The Company plans to adopt the new guidance effective January 1, 2012 and does not expect the guidance to impact its consolidated financial statements.
5
In June 2011, the FASB issued an accounting standard update relating to the presentation of other comprehensive income. The accounting update eliminates the option to present components of other comprehensive income as part of the statement of stockholders’ equity. Instead, companies must report comprehensive income in either a single continuous statement of comprehensive income (which would contain the current income statement presentation followed by the components of other comprehensive income and a total amount for comprehensive income), or in two separate but consecutive statements. This guidance is effective for the Company's fiscal year beginning January 1, 2012. The Company does not expect the guidance to impact its consolidated financial statements.
In May 2011, the FASB issued an accounting standard update related to fair value measurements and disclosures to improve the comparability of fair value measurements presented and disclosed in financial statements prepared in accordance with United States GAAP and International Financial Reporting Standards. This guidance includes amendments that clarify the intent about the application of existing fair value measurement requirements, while other amendments change a principle or requirement for measuring fair value or for disclosing information about fair value measurements. Specifically, the guidance requires additional disclosures for fair value measurements that are based on significant unobservable inputs. The updated guidance is to be applied prospectively and is effective for the Company's interim and annual periods beginning January 1, 2012. The adoption of this guidance is not expected to have a material impact on the Company's consolidated financial statements.
3. | Financial Instruments |
The fair value of cash and cash equivalents, accounts receivable, accounts payable and advances approximates carrying value due to the short-term maturity of such instruments. The Company has short-term money market investments which are classified as cash and cash equivalents on the balance sheet. The fair value of these investments at September 30, 2011 and December 31, 2010 was measured based on quoted prices in active markets.
4. | Film and Other Inventory Costs |
Film, television, live performance and other inventory costs consist of the following (in thousands):
September 30, 2011 | December 31, 2010 | ||||||
In release, net of amortization(1) | $ | 347,188 | $ | 384,863 | |||
In production(2) | 508,842 | 355,678 | |||||
In development(3) | 40,729 | 32,127 | |||||
Total film, television, live performance and other inventory costs, net | $ | 896,759 | $ | 772,668 | |||
____________________
(1) | Includes $20.7 million and $13.6 million of live performance costs at September 30, 2011 and December 31, 2010, respectively. |
(2) | Includes $21.6 million and $5.6 million of live performance costs at September 30, 2011 and December 31, 2010, respectively. |
(3) | Includes $2.1 million of live performance costs at December 31, 2010. |
The Company anticipates that 49% and 86% of the above “in release” film costs as of September 30, 2011 will be amortized over the next 12 months and three years, respectively.
5. | Accrued Liabilities |
Accrued liabilities consist of the following (in thousands):
September 30, 2011 | December 31, 2010 | ||||||
Employee compensation | $ | 45,349 | $ | 63,931 | |||
Participations and residuals | 36,100 | 46,746 | |||||
Deferred rent | 6,452 | 2,550 | |||||
Other accrued liabilities | 22,730 | 29,871 | |||||
Total accrued liabilities | $ | 110,631 | $ | 143,098 | |||
6
As of September 30, 2011, the Company estimates that over the next 12 months it will pay approximately $29.3 million of its accrued participation and residual costs.
6. | Deferred Revenue and Other Advances |
The following is a summary of deferred revenue and other advances included in the consolidated balance sheets as of September 30, 2011 and December 31, 2010 and the related amounts earned and either recorded as revenue in the consolidated statements of income or recorded as an offset to other costs (as described below) for the three- and nine-month periods ended September 30, 2011 and 2010 (in thousands):
Amounts Earned | |||||||||||||||||||||
Three Months Ended | Nine Months Ended | ||||||||||||||||||||
September 30, | December 31, | September 30, | September 30, | ||||||||||||||||||
2011 | 2010 | 2011 | 2010 | 2011 | 2010 | ||||||||||||||||
Home Box Office Inc. Advance(1) | $ | — | $ | — | $ | 15,000 | $ | — | 45,000 | 13,333 | |||||||||||
Licensing Advances | 9,939 | 12,967 | 1,204 | 16 | 7,228 | 20,067 | |||||||||||||||
Deferred Revenue | 9,830 | 3,795 | 611 | 376 | 4,289 | 8,341 | |||||||||||||||
Strategic Alliance/Development Advances(2) | 2,917 | 1,667 | 6,550 | 9,295 | 19,650 | 14,250 | |||||||||||||||
Other Advances | 4,539 | 2,364 | 487 | 958 | 6,680 | 10,013 | |||||||||||||||
Total deferred revenue and other advances | $ | 27,225 | $ | 20,793 | |||||||||||||||||
____________________
(1) | The Company remains a participant of an exclusive multi-picture domestic pay television license agreement originally entered into between Old DreamWorks Studios and Home Box Office, Inc. ("HBO"), pursuant to which the Company receives advances against license fees payable for future film product. In September 2011, the agreement was amended and is currently set to expire at the end of 2012. |
(2) | Of the total amounts earned against the “Strategic Alliance/Development Advances,” $3.3 million and $7.4 million, respectively, for the three months ended September 30, 2011 and 2010, and $11.0 million and $9.3 million, respectively, for the nine months ended September 30, 2011 and 2010, were capitalized as an offset to property, plant and equipment. Additionally, during the nine months ended September 30, 2011, of the total amounts earned against the “Strategic Alliance/Development Advances,” $2.1 million was recorded as a reduction to other assets. |
7. | Financing Arrangements |
Revolving Credit Facility. The Company has a revolving credit facility with a number of banks which terminates in June 2013. In May 2011, pursuant to the terms of the revolving credit facility agreement, the Company and the facility banks agreed to increase the total amount that can be drawn upon from $125.0 million to a maximum of $200.0 million. There was no debt outstanding during the three and nine months ended September 30, 2011 and 2010. The revolving credit facility requires the Company to maintain a specified leverage ratio and, subject to specific exceptions, prohibits the Company from taking certain actions without the lenders' consent, such as granting liens or entering into any merger or other significant transaction. The revolving credit facility also prohibits the Company from paying dividends on its capital stock if, after giving pro forma effect to such dividend, an event of default would occur or exist under the revolving credit facility. The Company is required to pay a commitment fee on undrawn amounts at an annual rate of 0.375%. Interest on borrowed amounts is determined by reference to i) either the lending banks' base rate plus 0.50% per annum or ii) LIBOR plus 1.50% per annum. Interest costs incurred as a result of the commitment fee were $0.2 million and $0.1 million for the three months ended September 30, 2011 and 2010, respectively. Interest costs incurred as a result of the commitment fee were $0.5 million and $0.3 million for the nine months ended September 30, 2011 and 2010, respectively.
As of September 30, 2011, the Company was in compliance with all applicable financial debt covenants.
7
8. | Income Taxes |
Set forth below is a reconciliation of the components that caused the Company's provision for income taxes (including the income statement line item “Decrease (increase) in income tax benefit payable to former stockholder”) to differ from amounts computed by applying the U.S. Federal statutory rate of 35% for the three and nine months ended September 30, 2011 and 2010.
Three Months Ended | Nine Months Ended | ||||||||||
September 30, | September 30, | ||||||||||
2011 | 2010 | 2011 | 2010 | ||||||||
Provision for income taxes (combined with decrease/increase in income tax benefit payable to former stockholder)(1)(2)(3) | |||||||||||
U.S. Federal statutory rate | 35.0 | % | 35.0 | % | 35.0 | % | 35.0 | % | |||
U.S. state taxes, net of Federal benefit | 0.3 | (0.5 | ) | 0.1 | 0.3 | ||||||
Export sales exclusion/manufacturer's deduction | (5.9 | ) | (2.7 | ) | (8.2 | ) | (2.4 | ) | |||
Revaluation of deferred tax assets, net | — | (2.7 | ) | 0.9 | (3.3 | ) | |||||
Return-to-provision | (1.8 | ) | (1.5 | ) | (0.6 | ) | 0.7 | ||||
Other | (1.1 | ) | 1.2 | (1.7 | ) | 0.6 | |||||
Total provision for income taxes (combined with decrease/increase in income tax benefit payable to former stockholder)(1)(2)(3) | 26.5 | % | 28.8 | % | 25.5 | % | 30.9 | % | |||
Less: decrease/increase in income tax benefit payable to former stockholder(1)(2)(3) | |||||||||||
U.S. state taxes, net of Federal benefit | 0.1 | — | 3.6 | (0.4 | ) | ||||||
Export sales exclusion/manufacturer's deduction | 3.1 | 1.4 | 3.9 | 1.4 | |||||||
Revaluation of deferred tax assets, net | — | (23.5 | ) | — | (21.7 | ) | |||||
Return-to-provision | (0.3 | ) | (8.6 | ) | — | (6.5 | ) | ||||
Other | (0.8 | ) | (1.6 | ) | (1.2 | ) | (1.0 | ) | |||
Total decrease/increase in income tax benefit payable to former stockholder(1)(2)(3) | 2.1 | % | (32.3 | )% | 6.3 | % | (28.2 | )% | |||
Total provision (benefit) for income taxes | 28.6 | % | (3.5 | )% | 31.8 | % | 2.7 | % | |||
____________________
(1) | As a result of a partial increase in the tax basis of our tangible and intangible assets attributable to transactions entered into by affiliates controlled by a former stockholder at the time of the Company's 2004 initial public offering, the Company may pay reduced tax amounts to the extent it generates sufficient taxable income in the future. The Company is obligated to remit to an affiliate of the former stockholder 85% of any cash savings in U.S. Federal income tax, California franchise tax and certain other related tax benefits. Refer to the Company's 2010 Form 10-K for a more detailed description. |
(2) | For the nine months ended September 30, 2011, includes an aggregate benefit of $4.3 million related to the Company's establishment of a position, during the first quarter of 2011, claiming certain tax deductions related to prior years. For the nine months ended September 30, 2010, includes an adjustment primarily related to deferred tax assets (net of valuation allowance) of approximately $2.1 million associated with prior year taxes. |
(3) | Certain reclassifications have been made to the prior period presentation to conform to current period presentation. |
The Company's California Franchise tax returns for the years ended December 31, 2004 through 2007 are currently under examination by the Franchise Tax Board (“FTB”). The Internal Revenue Service (“IRS”) had previously concluded its audits of the Company's federal income tax return for the periods through December 31, 2006. The Company's federal income tax returns for the tax years ended December 31, 2007 and 2008 are currently under examination by the IRS. All tax years since the Company's separation from Old DreamWorks Studios remain open to audit by all state and local taxing jurisdictions.
8
9. | Stockholders’ Equity |
Class A Common Stock
Stock Repurchase Program. In July 2010, the Company's Board of Directors authorized a stock repurchase program pursuant to which the Company may repurchase up to an aggregate of $150.0 million of its outstanding stock. During the nine months ended September 30, 2010, the Company repurchased 3.1 million shares of its outstanding Class A Common Stock for $110.8 million (all of which was repurchased under the authorization that was in effect prior to July 2010). During the three months ended September 30, 2011, the Company did not repurchase any of its outstanding stock. During the nine months ended September 30, 2011, the Company repurchased 0.9 million shares of its outstanding Class A Common Stock for $25.0 million. As of September 30, 2011, the Company's remaining authorization under the stock repurchase program was $125.0 million.
Class B Common Stock
In March 2010, 580,730 shares of the Company's Class B common stock were converted into an equal amount of shares of the Company's Class A common stock at the request of David Geffen, a significant stockholder, who owned such shares. Mr. Geffen, in turn, donated these shares to a charitable foundation that was established by him. These transactions had no impact on the total amount of the Company's shares outstanding.
10. | Equity-Based Compensation |
The Company recognizes compensation costs for equity awards granted to its employees based on their grant-date fair value. Most of the Company's equity awards contain vesting conditions dependent upon the completion of specified service periods or achievement of established sets of performance criteria. Compensation cost for service-based equity awards is recognized ratably over the vesting period. Compensation cost for certain performance-based awards is adjusted to reflect the estimated probability of vesting. The Company has granted performance-based awards where the value of the award upon vesting will vary depending on the level of performance ultimately achieved. The Company recognizes compensation cost for these awards based on the level of performance expected to be achieved. The Company will recognize the impact of any change in estimate in the period of the change.
Generally, equity awards are forfeited by employees who terminate prior to vesting. However, certain employment contracts for certain named executive officers provide for the acceleration of vesting in the event of a change in control or specified termination events. In addition, the Company has granted equity awards of stock appreciation rights and restricted shares subject to market-based conditions. Compensation costs related to awards with a market-based condition will be recognized regardless of whether the market condition is satisfied, provided that the requisite service has been provided. The Company currently satisfies exercises of stock options and stock appreciation rights, the vesting of restricted stock and the delivery of shares upon the vesting of restricted stock units with the issuance of new shares.
The impact of stock options (including stock appreciation rights) and restricted stock awards on net income (excluding amounts capitalized) for the three- and nine-month periods ended September 30, 2011 and 2010, respectively, was as follows (in thousands):
Three Months Ended | Nine Months Ended | ||||||||||||||
September 30, | September 30, | ||||||||||||||
2011 | 2010 | 2011 | 2010 | ||||||||||||
Total equity-based compensation | $ | 6,588 | $ | 7,193 | $ | 22,134 | $ | 22,403 | |||||||
Tax impact(1) | (1,746 | ) | (2,072 | ) | (5,644 | ) | (6,923 | ) | |||||||
Reduction in net income, net of tax | $ | 4,842 | $ | 5,121 | $ | 16,490 | $ | 15,480 | |||||||
____________________
(1) | Tax impact is determined at the Company's combined effective tax rate, which includes the income statement line item “Increase in income tax benefit payable to former stockholder” (see Note 8). |
Stock-based compensation cost capitalized as a part of film costs was $4.5 million and $3.1 million for the three-month periods ended September 30, 2011 and 2010, respectively, and $13.1 million and $9.1 million for the nine-month periods ended September 30, 2011 and 2010, respectively.
9
The following tables set forth the number and weighted average grant-date fair value of equity awards granted during the three- and nine-month periods ended September 30, 2011 and 2010:
Three Months Ended | Nine Months Ended | |||||||||||
September 30, | September 30, | |||||||||||
Number Granted | Weighted Average Grant-Date Fair Value | Number Granted | Weighted Average Grant-Date Fair Value | |||||||||
(in thousands) | (in thousands) | |||||||||||
2011 | ||||||||||||
Stock appreciation rights | 10 | $ | 8.39 | 315 | $ | 10.28 | ||||||
Restricted stock and restricted stock units | 11 | $ | 21.86 | 301 | $ | 26.62 | ||||||
2010 | ||||||||||||
Stock appreciation rights | 47 | $ | 12.64 | 87 | $ | 14.58 | ||||||
Restricted stock and restricted stock units | 248 | $ | 31.16 | 382 | $ | 34.50 | ||||||
As of September 30, 2011, the total compensation cost related to unvested equity awards granted to employees (excluding equity awards with performance objectives not probable of achievement) but not yet recognized was approximately $66.1 million and will be amortized on a straight-line basis over a weighted average period of 1.7 years.
11. | Concentrations of Credit Risk |
A substantial portion of the Company's revenue is derived directly from Paramount. Paramount represented 80.7% and 86.7% of the Company's total revenue for the three-month periods ended September 30, 2011 and 2010, respectively, and 83.2% and 76.4% for the nine-month periods ended September 30, 2011 and 2010, respectively.
12. | Related Party Transactions |
The Company has entered into an aircraft sublease (the “Sublease”) agreement with an entity controlled by Jeffrey Katzenberg, the Company's Chief Executive Officer and a significant stockholder, for use of an aircraft that such entity leases from the aircraft owner, a company jointly owned indirectly by Mr. Katzenberg and Mr. Spielberg (who is also a stockholder in the Company). Under the Sublease, the Company pays all the aircraft operating expenses on Mr. Katzenberg's Company-related flights. In addition, in the event that Mr. Katzenberg uses the aircraft for Company-related travel more than 36 hours in any calendar year, the Company pays the subleasing entity a specified hourly rate for those hours. For the three months ended September 30, 2011 and 2010, costs incurred for use of this plane were not material. For the nine months ended September 30, 2011 and 2010, the Company incurred $0.5 million and $0.5 million, respectively.
From time to time, the Company uses a private airplane that is owned by David Geffen, a former director and one of the Company's controlling stockholders, for Company business. The Company's use of this aircraft is pursuant to a customary charter arrangement, under which the Company generally pays an hourly rate as well as certain additional flight-related charges, such as crew expenses, catering and landing fees. During the three months ended September 30, 2011, the Company incurred $0.3 million for use of this plane. During the three months ended September 30, 2010, costs incurred for use of this plane were not material. The Company incurred $0.4 million during each of the nine-month periods ended September 30, 2011 and 2010 for use of this plane.
Consulting Agreement with David Geffen
The Company has entered into a consulting agreement with David Geffen, pursuant to which Mr. Geffen provides consulting services to the Company with respect to the Company's operations, overall direction, projects and strategic matters. Mr. Geffen receives $2.0 million annually for these services and is entitled to be reimbursed for reasonable travel and other expenses in the performance of his duties. The term of the agreement expires in July 2013, although either party may terminate the agreement sooner upon notice to the other party. During the three and nine months ended September 30, 2011, the Company incurred $0.5 million and $1.5 million, respectively, related to this agreement. During the three and nine months ended September 30, 2010, the Company incurred $0.5 million related to this agreement. As of September 30, 2011, the Company had also recorded a prepaid asset of $0.5 million related to this agreement.
10
13. | Commitments and Contingencies |
Legal Proceedings. From time to time, the Company is involved in legal proceedings arising in the ordinary course of its business, typically intellectual property litigation and infringement claims related to the Company's feature films, which could cause the Company to incur significant expenses or prevent the Company from releasing a film. The Company also has been the subject of patent and copyright claims relating to technology and ideas that it may use or feature in connection with the production, marketing or exploitation of the Company's feature films, which may affect the Company's ability to continue to do so. While the resolution of these matters cannot be predicted with certainty, the Company does not believe, based on current knowledge, that any existing legal proceedings or claims are likely to have a material effect on its financial position, results of operations or liquidity.
14. | Net Income Per Share |
The following table sets forth the computation of basic and diluted net income per share (in thousands, except per share amounts):
Three Months Ended | Nine Months Ended | ||||||||||||||
September 30, | September 30, | ||||||||||||||
2011 | 2010 | 2011 | 2010 | ||||||||||||
Numerator: | |||||||||||||||
Net income | $ | 19,654 | $ | 39,761 | $ | 62,522 | $ | 85,405 | |||||||
Denominator: | |||||||||||||||
Weighted average common shares and denominator for basic calculation: | |||||||||||||||
Weighted average common shares outstanding | 83,534 | 84,275 | 83,795 | 85,924 | |||||||||||
Less: Unvested restricted stock | (129 | ) | (329 | ) | (155 | ) | (433 | ) | |||||||
Denominator for basic calculation | 83,405 | 83,946 | 83,640 | 85,491 | |||||||||||
Weighted average effects of dilutive equity-based compensation awards: | |||||||||||||||
Employee stock options and stock appreciation rights | 1 | 319 | 12 | 776 | |||||||||||
Restricted stock awards | 1,385 | 1,231 | 1,112 | 1,236 | |||||||||||
Denominator for diluted calculation | 84,791 | 85,496 | 84,764 | 87,503 | |||||||||||
Net income per share—basic | $ | 0.24 | $ | 0.47 | $ | 0.75 | $ | 1.00 | |||||||
Net income per share—diluted | $ | 0.23 | $ | 0.47 | $ | 0.74 | $ | 0.98 | |||||||
The following table sets forth (in thousands) the weighted average number of options to purchase shares of common stock, stock appreciation rights, restricted stock awards and equity awards subject to performance or market conditions which were not included in the calculation of diluted per share amounts because the effects would be anti-dilutive:
Three Months Ended | Nine Months Ended | ||||||||||
September 30, | September 30, | ||||||||||
2011 | 2010 | 2011 | 2010 | ||||||||
Options to purchase shares of common stock and restricted stock awards | 2,509 | 922 | 2,447 | 162 | |||||||
Stock appreciation rights | 5,894 | 2,508 | 5,762 | 1,727 | |||||||
Total | 8,403 | 3,430 | 8,209 | 1,889 | |||||||
11
The following table sets forth (in thousands) the number of equity awards that are contingently issuable which were not included in the calculation of diluted shares as the required market and/or performance conditions had not been met as of September 30, 2011 nor 2010:
Three Months Ended | Nine Months Ended | ||||||
September 30, | September 30, | ||||||
2011 | 2010 | 2011 | 2010 | ||||
Options to purchase shares of common stock and restricted stock awards | 890 | 708 | 890 | 708 | |||
Stock appreciation rights | 800 | 800 | 800 | 800 | |||
Total | 1,690 | 1,508 | 1,690 | 1,508 | |||
12
Item 2. | Management’s Discussion and Analysis of Financial Condition and Results of Operations |
This section and other parts of this Quarterly Report on Form 10-Q (the “Quarterly Report”) contain forward-looking statements that involve risks and uncertainties. Our actual results may differ significantly from the results discussed in the forward-looking statements. You should read the following discussion and analysis in conjunction with our unaudited consolidated financial statements and the related notes thereto contained elsewhere in this Quarterly Report, and our audited consolidated financial statements and related notes thereto, “Management’s Discussion and Analysis of Financial Condition and Results of Operations” and the “Risk Factors” section included in our Annual Report on Form 10-K for the year ended December 31, 2010 (the “2010 Form 10-K”). We urge you to carefully review and consider the various disclosures made by us in this Quarterly Report and in our other reports filed with the Securities and Exchange Commission (the “SEC”), including our 2010 Form 10-K and Current Reports on Form 8-K, before deciding to purchase, hold or sell our common stock.
Our Business and Distribution and Servicing Arrangements
Our business is primarily devoted to developing, producing and exploiting animated feature films and its characters, as well as creating television specials/series and live performances based on such characters. Our films are distributed in the worldwide theatrical, home entertainment and television markets by Paramount Pictures Corporation, a subsidiary of Viacom Inc., and its affiliates (collectively, “Paramount”) pursuant to a distribution agreement and a fulfillment services agreement (collectively, the “Paramount Agreements”). We generally retain all other rights to exploit our films, including commercial tie-in and promotional rights with respect to each film, as well as merchandising, interactive, literary publishing, music publishing and soundtrack rights. Please see “Part I—Item 1—Business—Distribution and Servicing Arrangements” in our 2010 Form 10-K for a discussion of our distribution and servicing arrangements with Paramount.
Our Revenues and Costs
Our feature films are currently the source of a significant percentage of our revenues. We derive revenue from our distributor’s worldwide exploitation of our feature films in theaters and in markets such as home entertainment, pay and free broadcast television and other ancillary markets. Pursuant to the Paramount Agreements, prior to reporting any revenue for one of our feature films to us, Paramount is entitled to (i) retain a fee of 8.0% of gross revenue (without deduction for distribution and marketing costs and third-party distribution fees and sales agent fees), and (ii) recoup all of its permissible distribution and marketing costs with respect to the exploitation of our films on a film-by-film basis. As such, under the Paramount Agreements, each film’s total expenses and fees are offset against that film’s revenues on a worldwide basis across all markets, and Paramount reports no revenue to the Company until the first period in which an individual film’s cumulative worldwide gross revenues exceed its cumulative worldwide gross distribution fee and costs, which may be several quarters after a film’s initial theatrical release. Additionally, as the cumulative revenues and cumulative costs for each individual film are commingled between all markets and geographical territories and Paramount only reports additional revenue to the Company for a film in those reporting periods in which that film’s cumulative worldwide gross revenues continue to exceed its cumulative worldwide gross costs, the Company’s reported revenues in any period are often a result of gross revenues with respect to an individual film generated in one or several territories being offset by the gross costs of both related and unrelated territories for such film.
In addition, we generate royalty-based revenues from the licensing of our character and film elements to consumer product and home entertainment companies worldwide. We have also entered into business activities beyond our core feature film business, including the development, production and licensing of animated television specials/series and live performances. Revenue and cost activities related to live performances and certain television specials/series are not typically subject to the Paramount Agreements and, accordingly, we receive payment and record revenues directly from third parties.
Our primary operating expenses include:
• | Costs of Revenues—Our costs of revenues primarily include the amortization of capitalized costs related to feature films and television specials/series (which consists of production, overhead and interest costs), participation and residual costs for our feature films and television specials/series and write-offs of amounts previously capitalized for titles not expected to be released or released titles not expected to recoup their capitalized costs. Generally, given the structure of our distribution arrangements with Paramount, our costs of revenues do not include distribution and marketing costs or third-party distribution and fulfillment services fees associated with our feature films. However, our television specials/series and live performances are typically not subject to the Paramount Agreements, and accordingly, we may directly incur distribution and marketing costs, which are classified as costs of revenues. In addition, costs of revenues also include direct costs for sales commissions to outside third parties for the licensing and merchandising of our characters and marketing and promotion costs. |
13
• | Selling, General and Administrative Expenses—Our selling, general and administrative expenses consist primarily of employee compensation (including salaries, bonuses, stock-based compensation and employee benefits), rent, insurance and fees for professional services. |
For a detailed description of our revenues and operating expenses, please see “Management’s Discussion and Analysis of Financial Condition and Results of Operations—Our Revenues and Costs” in our 2010 Form 10-K.
Our films are distributed in foreign countries and, in recent years, we have derived on average 63% of our worldwide box office and 49% of our feature film revenue from foreign countries. A significant amount of our transactions in foreign countries are conducted in the local currencies and, as a result, fluctuations in foreign currency exchange rates can affect our business, results of operations and cash flow. For a detailed discussion of our foreign currency risk, please see “Item 7A. Quantitative and Qualitative Disclosures About Market Risk” of our 2010 Form 10-K.
Seasonality
The timing of revenue reporting and receipt of cash remittances to us from our distributor fluctuate based upon the timing of our films’ theatrical and home entertainment releases and the recoupment position of our distributor on a film-by-film basis, which varies depending upon a film’s overall performance. Furthermore, revenues related to our television specials/series fluctuate based upon the timing of their broadcast and the licensing of our character and film elements are influenced by seasonal consumer purchasing behavior. As a result, our annual or quarterly operating results for any period are not necessarily indicative of results to be expected for future periods.
Results of Operations
Overview of Financial Results
The following table sets forth, for the periods presented, certain data from our unaudited consolidated statements of income. This information should be read in conjunction with our unaudited consolidated financial statements and the notes thereto included elsewhere in this Quarterly Report.
Three Months Ended September 30, | Nine Months Ended September 30, | ||||||||||||||||||||||||||||
2011 | 2010 | $ Change | % Change | 2011 | 2010 | $ Change | % Change | ||||||||||||||||||||||
(in millions, except percentages and per share data) | |||||||||||||||||||||||||||||
Revenues | $ | 160.8 | $ | 188.9 | $ | (28.1 | ) | (14.9 | )% | $ | 487.0 | $ | 509.1 | $ | (22.1 | ) | (4.3 | )% | |||||||||||
Costs of revenues | 108.0 | 107.7 | 0.3 | 0.3 | % | 321.3 | 312.6 | 8.7 | 2.8 | % | |||||||||||||||||||
Product development | 0.7 | 1.5 | (0.8 | ) | (53.3 | )% | 1.1 | 2.1 | (1.0 | ) | (47.6 | )% | |||||||||||||||||
Selling, general and administrative expenses | 26.9 | 26.4 | 0.5 | 1.9 | % | 86.5 | 77.7 | 8.8 | 11.3 | % | |||||||||||||||||||
Operating income | 25.2 | 53.3 | (28.1 | ) | (52.7 | )% | 78.1 | 116.7 | (38.6 | ) | (33.1 | )% | |||||||||||||||||
Interest income, net | 0.1 | 0.2 | (0.1 | ) | (50.0 | )% | 0.4 | 0.4 | — | — | % | ||||||||||||||||||
Other income, net | 1.3 | 2.3 | (1.0 | ) | (43.5 | )% | 5.4 | 6.4 | (1.0 | ) | (15.6 | )% | |||||||||||||||||
Decrease (increase) in income tax benefit payable to former stockholder | 0.6 | (18.0 | ) | 18.6 | 103.3 | % | 5.3 | (34.8 | ) | 40.1 | 115.2 | % | |||||||||||||||||
Income before income taxes | 27.2 | 37.8 | (10.6 | ) | (28.0 | )% | 89.2 | 88.7 | 0.5 | 0.6 | % | ||||||||||||||||||
Provision (benefit) for income taxes | 7.6 | (2.0 | ) | 9.6 | NM | 26.7 | 3.3 | 23.4 | 709.1 | % | |||||||||||||||||||
Net income | $ | 19.6 | $ | 39.8 | $ | (20.2 | ) | (50.8 | )% | $ | 62.5 | $ | 85.4 | $ | (22.9 | ) | (26.8 | )% | |||||||||||
Diluted net income per share | $ | 0.23 | $ | 0.47 | $ | (0.24 | ) | (51.1 | )% | $ | 0.74 | $ | 0.98 | $ | (0.24 | ) | (24.5 | )% | |||||||||||
Diluted shares used in computing diluted net income per share | 84.8 | 85.5 | (0.8 | )% | 84.8 | 87.5 | (3.1 | )% | |||||||||||||||||||||
____________________
NM: Not meaningful
14
Three Months Ended September 30, 2011 Compared to Three Months Ended September 30, 2010
The following table sets forth (in millions), for the periods presented, our revenues by film. This information should be read in conjunction with our unaudited consolidated financial statements and the notes thereto included elsewhere in this Quarterly Report.
____________________
(1) | For each period shown, “Current year theatrical release” consists of revenues attributable to films released in the current year, “Prior year theatrical releases” consists of revenues attributable to films released during the immediately prior year, and “All Other” consists of revenues attributable to films released during all previous periods, including our library titles, as well as revenues from any other sources. |
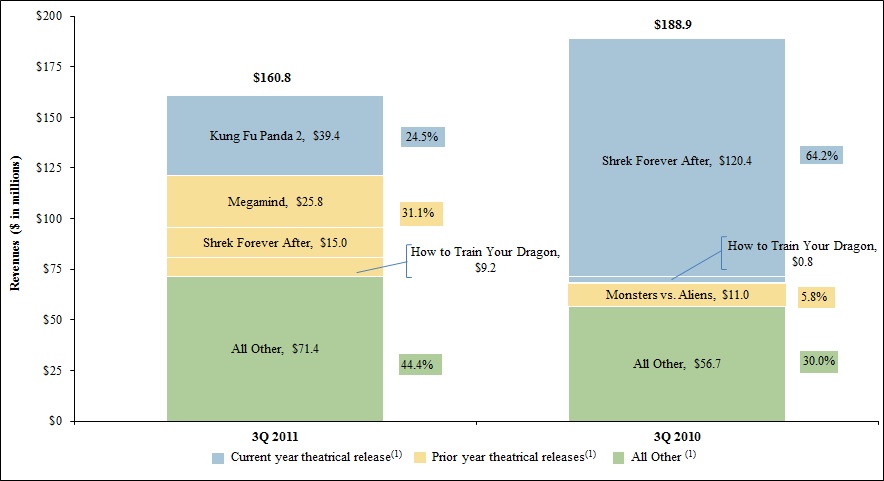
Revenues. For the three months ended September 30, 2011, our revenue was $160.8 million, a decrease of $28.1 million, or 14.9%, as compared to $188.9 million for the three months ended September 30, 2010. As illustrated in the revenue chart above, revenues contributed by the "Current year theatrical release" category were lower for the three months ended September 30, 2011 when compared to the same period of the prior year, primarily as a result of the earlier international theatrical release of Kung Fu Panda 2 during the second quarter of 2011 as compared to Shrek Forever After in the same period for 2010. The impact of releasing Kung Fu Panda 2 earlier during the second quarter period resulted in a substantial portion of Kung Fu Panda 2's international results being reflected in our 2011 second quarter results, while, a significant portion of Shrek Forever After's international theatrical results were reflected in our results for the third quarter of 2010. Additionally, to a lesser extent, the third quarter of 2010 as compared to the same quarter in 2011 benefited from the stronger worldwide theatrical performance of Shrek Forever After relative to the performance of Kung Fu Panda 2. This overall decrease in "Current year theatrical release" revenues was offset by an increase in revenues contributed by 2011's "Prior year theatrical release" category, which was driven by the inclusion of additional films in 2011's "Prior year theatrical release" category compared to the number that comprised 2010's "Prior year theatrical release" category. Additionally, our "All Other" category increased $14.7 million, which was primarily driven by our non-film initiatives and revenues earned from our library titles.
Revenue for the quarter ended September 30, 2011 was comprised of amounts earned by a variety of films. Our most recent release, Kung Fu Panda 2 (released in the second quarter of 2011), contributed $39.4 million, or 24.5% of revenues, primarily earned in the international theatrical markets. Our 2011 "Prior year theatrical releases" contributed an aggregate of $50.0 million, or 31.1%, to current quarter revenues, and were primarily earned in the worldwide television and home entertainment markets. Lastly, our "All Other" category, which is mainly comprised of our library titles, contributed $71.4 million earned across several markets and also includes $18.8 million of revenues attributable to our non-film initiatives.
15
Revenue for the quarter ended September 30, 2010 was primarily driven by Shrek Forever After (released in the second quarter of 2010), which generated revenues of $120.4 million primarily earned in the international theatrical markets. Our first quarter 2010 theatrical release, How to Train Your Dragon, contributed $0.8 million of ancillary revenue. During the third quarter of 2010, our distributor reported no revenue to us for this title as the revenues generated during this period did not recoup the home entertainment distribution costs incurred in preparation for the title's home entertainment release in October 2010. 2010's "Prior Year Theatrical Release", Monsters vs. Aliens, contributed $11.0 million or 5.8% of revenue, which was primarily earned in the worldwide home entertainment and international pay television markets. Lastly, our “All other” category, which is mainly comprised of our library of titles, contributed $56.7 earned across several markets (and also included $12.6 million attributable to our non-film initiatives).
Costs of Revenues. Costs of revenues for the three months ended September 30, 2011 totaled $108.0 million, an increase of $0.3 million, compared to $107.7 million for the three months ended September 30, 2010. Costs of revenues, the primary component of which is film amortization costs, as a percentage of revenues were 67.2% for the three months ended September 30, 2011 as compared to 57.0% for the three months ended September 30, 2010. The increase in amortization as a percentage of revenues for the three months ended September 30, 2011 was partially due to the overall stronger performance of 2010's "Current year theatrical release," Shrek Forever After, as compared to 2011's, Kung Fu Panda 2. This increase was partially offset by a lower rate of amortization of our library titles during the three months ended September 30, 2011 when compared to the same period of the prior year.
Product Development. Product development costs decreased $0.8 million to $0.7 million for the quarter ended September 30, 2011 from $1.5 million for the quarter ended September 30, 2010. Product development costs primarily represent software research and development costs that are not related to an individual film. During the quarter ended September 30, 2010, product development costs also included costs to develop our online virtual world.
Selling, General and Administrative Expenses. Total selling, general and administrative expenses increased $0.5 million to $26.9 million (including $6.4 million of stock-based compensation expense) for the quarter ended September 30, 2011 from $26.4 million (including $6.4 million of stock-based compensation expense) for the quarter ended September 30, 2010. This aggregate 1.9% increase spans across several selling, general and administrative categories and is mainly attributable to higher salaries and benefits expense driven by an increase in headcount to support our non-film initiatives, which was partially offset by downward adjustments in executive compensation that resulted from the departure of one of our senior executives.
Operating Income. Operating income decreased to $25.2 million for the three months ended September 30, 2011 compared to $53.3 million million for the three months ended September 30, 2010. This $28.1 million, or 52.7%, decrease was largely driven by a lower gross profit contributed by our "Current year theatrical releases" in the current quarter compared to the same quarter of the prior year.
Interest Income, Net. For the three months ended September 30, 2011 and 2010, the amounts recorded as interest income (net) were immaterial.
Other Income, Net. For the three months ended September 30, 2011 and 2010, other income was $1.3 million and $2.3 million, respectively. Other income in both years consisted primarily of income recognized in connection with preferred vendor arrangements with certain of our strategic alliance partners.
Decrease (Increase) in Income Tax Benefit Payable to Former Stockholder. As a result of a partial increase in the tax basis of our tangible and intangible assets attributable to transactions entered into by affiliates controlled by a former stockholder at the time of our 2004 initial public offering (“Tax Basis Increase”), we may pay reduced tax amounts to the extent we generate sufficient taxable income in the future. As discussed in “—Critical Accounting Policies and Estimates—Provision for Income Taxes” of our 2010 Form 10-K, we are obligated to remit to such affiliates 85% of any cash savings in U.S. Federal income tax, California franchise tax and certain other related tax benefits, subject to repayment if it is determined that these savings should not have been available to us.
For the quarter ended September 30, 2011, our payable to the former stockholder decreased as a result of our ability to claim additional tax deductions, a portion of which were recognized in conjunction with the filing of our annual corporate tax return. Accordingly, we recorded $0.6 million as a decrease in income tax benefit payable to the former stockholder in our income statement. For the quarter ended September 30, 2010, we recorded $21.2 million in net tax benefits associated with the Tax Basis Increase as a reduction in the provision for income taxes and recorded an expense of $18.0 million, representing 85% of these recognized benefits, as an increase in income tax benefit payable to former stockholder.
Provision for Income Taxes. For the three months ended September 30, 2011, we recorded a provision for income taxes of $7.6 million, or an effective tax rate of 28.6%. For the three months ended September 30, 2010, we recorded a benefit from income taxes of $2.0 million, or an effective tax rate of (3.5)%. When our provision for (or benefit from) income taxes is
16
combined with the amounts associated with the Decrease (Increase) in Income Tax Benefit Payable to Former Stockholder (see above), the combined effective percentages for the three months ended September 30, 2011 and 2010 were 26.5% and 28.8%, respectively. Our effective tax rate and our combined effective tax rate for both periods were lower than the 35% statutory federal rate because of the Company's ability to benefit from certain prior year tax deductions and the net tax benefits recognized from the Tax Basis Increase as described above.
Net Income. Net income for the three months ended September 30, 2011 was $19.6 million, or $0.23 per diluted share, as compared to a net income of $39.8 million, or $0.47 net income per diluted share, in the corresponding period in 2010.
Nine Months Ended September 30, 2011 Compared to Nine Months Ended September 30, 2010
The following table sets forth (in millions), for the periods presented, our revenues by film. This information should be read in conjunction with our unaudited consolidated financial statements and the notes thereto included elsewhere in this Quarterly Report.
____________________
(1) | For each period shown, “Current year theatrical release” consists of revenues attributable to films released in the current year, “Prior year theatrical releases” consists of revenues attributable to films released during the immediately prior year, and “All Other” consists of revenues attributable to films released during all previous periods, including our library titles, as well as revenues from any other sources. |
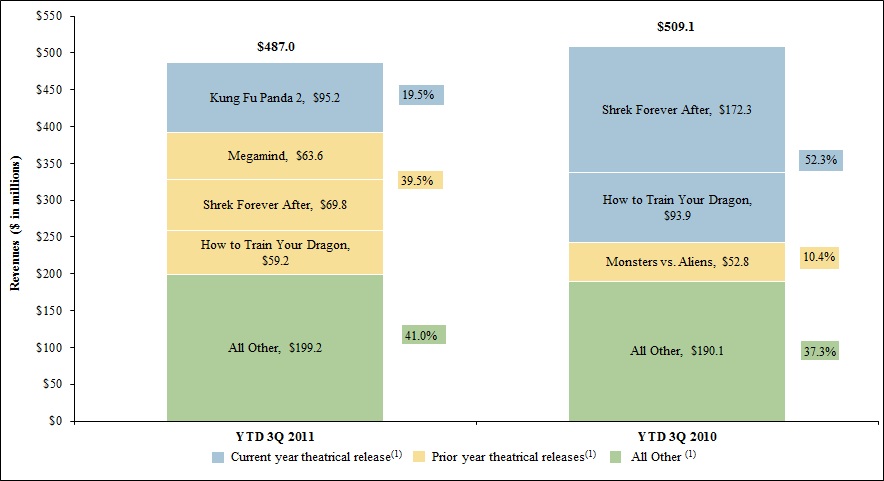
Revenues. For the nine months ended September 30, 2011, our revenue was $487.0 million, a decrease of $22.1 million, or 4.3%, as compared to $509.1 million for the nine months ended September 30, 2010. As illustrated in the revenue chart above, revenues contributed by the "Current year theatrical release" category were lower for the nine months ended September 30, 2011 when compared to the same period of the prior year as a result of the decrease in the number of films released in this category. This decrease in revenues was offset by higher revenues contributed by 2011's "Prior year theatrical releases" during the nine months ended September 30, 2011, compared to revenues contributed by 2010's "Prior year theatrical release" category, largely attributable to the inclusion of additional films for this category in 2011. Lastly, our "All Other" category increased $9.1 million, which was attributable to an increase in revenues contributed by our non-film initiatives (largely driven by our live performance productions).
Revenue for the nine months ended September 30, 2011 was comprised of amounts earned by a variety of films. As illustrated in the chart above, our most recent release, Kung Fu Panda 2, contributed $95.2 million or 19.5% of revenues, primarily earned in the worldwide theatrical markets. Our 2011 "Prior year theatrical releases" contributed an aggregate of
17
$192.6 million, or 39.5%, of revenues, which were primarily earned in the worldwide television and home entertainment markets. Lastly, our "All Other" category, which is comprised of our library titles and non-film initiatives, contributed $199.2 million, half of which was attributable to Madagascar: Escape 2 Africa and Kung Fu Panda (both titles' revenues were primarily earned in the international television market), as well as our non-film initiatives (which contributed $41.8 million of revenues). The remainder of the revenues that comprise our "All Other" category was generated primarily by our library titles.
Revenue for the nine months ended September 30, 2010 was primarily driven by Shrek Forever After (released in the second quarter of 2010) which generated $172.3 million primarily earned in the worldwide theatrical markets, and How to Train Your Dragon (released in the first quarter of 2010) which generated $93.9 million primarily earned in the worldwide theatrical and ancillary (such as merchandising and licensing) markets. Our 2010 "Prior year theatrical release," Monsters vs. Aliens, contributed $52.8 million or 10.4% of revenue, which was primarily earned in the worldwide pay television markets. Lastly, our “All other” category, which is mainly comprised of our library of titles, contributed $190.1 million which was largely driven by Madagascar: Escape 2 Africa, Shrek the Third, and Bee Movie, earned across several markets. For the nine months ended September 30, 2010, our “All other” category included $21.4 million of revenues attributable to non-film initiatives.
Costs of Revenues. Costs of revenues for the nine months ended September 30, 2011 totaled $321.3 million, an increase of $8.7 million, compared to $312.6 million for the nine months ended September 30, 2010. Costs of revenues, the primary component of which is film amortization costs, as a percentage of revenues were 66.0% for the nine months ended September 30, 2011 and 61.4% for the nine months ended September 30, 2010. The increase in amortization as a percentage of revenues for the nine months ended September 30, 2011 was partially due to the overall stronger combined performance of Shrek Forever After and How to Train Your Dragon (since each of the titles' releases in 2010) as compared to the performance of Kung Fu Panda 2 (2011’s “Current year theatrical release”). In addition, costs of revenues for 2011 were higher than that for 2010 as a result of operating and marketing costs associated with the production of our Shrek The Musical touring show and our non-touring version of the show in London (which debuted in May 2011).
Product Development. Product development costs decreased $1.0 million to $1.1 million for the nine months ended September 30, 2011 from $2.1 million for the nine months ended September 30, 2010. Product development costs primarily represent research and development costs that are not related to an individual film. During the nine months ended September 30, 2010, product development costs also included costs to develop our online virtual world.
Selling, General and Administrative Expenses. Total selling, general and administrative expenses increased $8.8 million to $86.5 million (including $21.5 million of stock-based compensation expense) for the nine months ended September 30, 2011 from $77.7 million (including $20.4 million of stock-based compensation expense) for the nine months ended September 30, 2010. This 11.3% aggregate increase was attributable to $5.2 million of higher salaries and benefits (including stock-based compensation) driven by increased headcount to support our newer businesses and $2.6 million in increased professional fees. The remaining increase was attributable to other higher selling, general and administrative expenses, none of which were individually material.
Operating Income. Operating income for the nine months ended September 30, 2011 was $78.1 million compared to $116.7 million for the comparable period of 2010. This decrease of $38.6 million in operating income for the nine months ended September 30, 2011 was largely due to lower gross profit contributed by our "Current year theatrical release" category, increased selling, general and administrative expenses, as well as higher operating and marketing costs associated with our Shrek The Musical live performance shows (as previously described).
Interest Income, Net. For the nine months ended September 30, 2011 and 2010, the amounts recorded as interest income (net) were immaterial.
Other Income, Net. For the nine months ended September 30, 2011 and 2010, total other income was $5.4 million and $6.4 million, respectively. Other income in both years consisted mainly of income recognized in connection with preferred vendor arrangements with certain of our strategic alliance partners.
Decrease (Increase) in Income Tax Benefit Payable to Former Stockholder. As a result of the Tax Basis Increase, we are obligated to remit to the stockholder's affiliate 85% of any such cash savings in U.S. Federal income tax and California franchise tax and certain other related tax benefits, subject to repayment if it is determined that these savings should not have been available to us. For the nine months ended September 30, 2011, our payable to the former stockholder decreased as a result of our ability to claim certain tax deductions. Accordingly, we recorded $5.3 million as a decrease in income tax benefit payable to the former stockholder in our income statement. For the nine months ended September 30, 2010, we recorded $41.0 million in net tax benefits associated with the Tax Basis Increase as a reduction in the provision for income taxes and recorded an expense of $34.8 million, representing 85% of these recognized benefits, as an increase in income tax benefit payable to
18
former stockholder.
Provision for Income Taxes. For the nine months ended September 30, 2011 and 2010, we recorded a provision for income taxes of $26.7 million and $3.3 million, respectively, or an effective tax rate of 31.8% and 2.7%, respectively. However, when our provision for income taxes is combined with the amounts associated with the Decrease (Increase) in Income Tax Benefit Payable to Former Stockholder (see above), the combined effective percentages for the nine months ended September 30, 2011 and 2010 are 25.5% and 30.9%, respectively. Our effective tax rate and our combined effective tax rate for both periods was lower than the 35% statutory federal rate because of the Company's ability to benefit from certain prior year tax deductions and the net tax benefits recognized from the Tax Basis Increase as described above.
Net Income. Net income for the nine months ended September 30, 2011 was $62.5 million, or $0.74 per diluted share, as compared to a net income of $85.4 million, or $0.98 net income per diluted share, in the corresponding period in 2010.
Financing Arrangements
In May 2011, pursuant to the terms of the revolving credit facility agreement, the total amount that can be drawn upon was increased from $125.0 million to a maximum of $200.0 million. There were no other material changes during the period covered by this Quarterly Report, outside of the ordinary course of business, to the financing arrangements specified in the section “Management’s Discussion and Analysis of Financial Condition and Results of Operations” included in our 2010 Form 10-K.
As of September 30, 2011, we were in compliance with all applicable financial debt covenants.
For a more detailed description of our various financing arrangements, please see Note 7 to the unaudited consolidated financial statements contained in Part I, Item 1 of this Quarterly Report and the “Management’s Discussion and Analysis of Financial Condition and Results of Operations” section of our 2010 Form 10-K.
Liquidity and Capital Resources
Current Financial Condition
Our operating activities and cash on hand during the nine months ended September 30, 2011 were adequate to meet our operating cash needs. For the next 12 months, we expect that cash on hand, cash from operations and funds available under our revolving credit facility will be sufficient to satisfy our anticipated cash needs for working capital (e.g. selling, general and administrative costs, participation and residual payments and our production and development costs related to film and non-film initiatives) and capital expenditures. We expect our cash balance to decline over the next three quarters due to production and development expenses associated with our upcoming film slate, as well as upcoming income tax and other operating cost payments.
As of September 30, 2011, we had cash and cash equivalents totaling $149.6 million. Our cash and cash equivalents consist of cash on deposit and short-term money market investments, principally U.S. government securities, that are rated AAA and with maturities of three months or less when purchased. Our cash and cash equivalents balance at September 30, 2011 decreased by $14.2 million from that of $163.8 million at December 31, 2010. Components of this change in cash for the nine months ended September 30, 2011, as well as for the nine months ended September 30, 2010, are provided below in more detail.
Operating Activities
Net cash provided by operating activities for the nine months ended September 30, 2011 and 2010 was as follows (in thousands):
2011 | 2010 | ||||||
Net cash provided by operating activities | $ | 46,051 | $ | 80,146 | |||
During the nine months ended September 30, 2011, our main source of cash from operating activities was attributable to the collection of revenue from Paramount related to Kung Fu Panda 2's worldwide theatrical release, Shrek Forever After's and How to Train Your Dragon’s worldwide television and home entertainment revenues, and to a lesser extent, the collection of worldwide television and home entertainment revenues from our other films. In addition, operating cash flows for the nine months ended September 30, 2011 benefited from additional pay television revenue fees related to an increased number of films that are available in 2011. Cash used in operating activities for the first nine months of 2011 was primarily attributable to $38.2 million paid related to annual incentive compensation payments, as well as $27.9 million paid to an affiliate of a former
19
stockholder related to tax benefits realized in 2011 from the Tax Basis Increase. The cash from operating activities was also partially offset by production spending for our films, television specials/series and live performances, as well as participation and residual payments.
Net cash provided by operating activities for the first nine months of 2010 was primarily attributable to the collection of revenue from Paramount related to Shrek Forever After's and How to Train Your Dragon's worldwide theatrical releases, Monsters vs. Aliens' worldwide home entertainment and domestic television revenues, Kung Fu Panda's worldwide home entertainment and television revenues, Madagascar: Escape 2 Africa's worldwide home entertainment and television revenues and, to a lesser extent, the collection of worldwide television and home entertainment revenues from our other films. Cash used in operating activities for the first nine months of 2010 was primarily attributable to $23.5 million paid related to annual incentive compensation payments, $22.6 million paid to an affiliate of a former stockholder related to tax benefits realized in 2010 from the Tax Basis Increase, and spending for the production of our feature films, television specials, live theatrical performances, and online virtual worlds.
Investing Activities
Net cash used in investing activities for the nine months ended September 30, 2011 and 2010 was as follows (in thousands):
2011 | 2010 | ||||||
Net cash used in investing activities | $ | (33,928 | ) | $ | (37,777 | ) | |
Net cash used in investing activities for the nine months ended September 30, 2011 and 2010 was primarily related to the investment in property, plant and equipment. Additionally, during the nine months ended September 30, 2011, we made a cash contribution as a minority investment in an unconsolidated entity.
Financing Activities
Net cash used in financing activities for the nine months ended September 30, 2011 and 2010 was as follows (in thousands):
2011 | 2010 | ||||||
Net cash used in financing activities | $ | (26,346 | ) | $ | (104,014 | ) | |
Net cash used in financing activities for the nine months ended September 30, 2011 and 2010 was primarily comprised of repurchases of our Class A common stock. During the nine months ended September 30, 2011, we repurchased 0.9 million shares of our Class A common stock compared to 3.1 million shares repurchased during the same period of the prior year.
Contractual Obligations
There have been no material changes during the period covered by this Quarterly Report, outside of the ordinary course of business, to the contractual obligations specified in the table of contractual obligations included in the section “Management’s Discussion and Analysis of Financial Condition and Results of Operations” included in our 2010 Form 10-K.
As of September 30, 2011 we had non-cancelable talent commitments totaling approximately $27.5 million that are payable over the next five years.
Critical Accounting Policies and Estimates
Our significant accounting policies are outlined in Note 2 to the audited consolidated financial statements contained in our 2010 Form 10-K. We prepare our consolidated financial statements in accordance with United States generally accepted accounting principles (“GAAP”). In doing so, we have to make estimates and assumptions that affect our reported amounts of assets, liabilities, revenues and expenses, as well as related disclosure of contingent assets and liabilities including estimates of ultimate revenues and costs of film and television product, estimates of product sales that will be returned, the potential outcome of future tax consequences of events that have been recognized in our financial statements and estimates used in the determination of the fair value of stock options and other equity awards for the determination of stock-based compensation. In some cases, changes in the accounting estimates are reasonably likely to occur from period to period. Accordingly, actual results could differ materially from our estimates. To the extent that there are material differences between these estimates and actual results, our financial condition or results of operations will be affected. We base our estimates on past experience and other assumptions that we believe are reasonable under the circumstances, and we evaluate these estimates on an ongoing basis.
20
An accounting policy is deemed to be critical if it requires an accounting estimate to be made based on assumptions about matters that are highly uncertain at the time the estimate is made, if different estimates reasonably could have been used, or if changes in the estimate that are reasonably likely to occur could materially impact the financial statements. Management believes there have been no material changes during the period covered by this Quarterly Report to the items that we disclosed as our critical accounting policies and estimates in “Management’s Discussion and Analysis of Financial Condition and Results of Operations” in our Annual Report on Form 10-K for the fiscal year ended December 31, 2010.
Recent Accounting Pronouncements
For a discussion of recent accounting pronouncements please see Note 2 to the unaudited consolidated financial statements contained in Part I, Item 1 of this Quarterly Report.
Item 3. | Quantitative and Qualitative Disclosures About Market Risk |
Market and Exchange Rate Risk
For quantitative and qualitative disclosures about our interest rate, foreign currency, and credit risks, please see “Part II—Item 7A—Quantitative and Qualitative Disclosures About Market Risk,” of our 2010 Form 10-K. Exposure to our interest rate, foreign currency and credit risks have not changed materially since December 31, 2010.
Item 4. | Controls and Procedures |
(a) | Evaluation of disclosure controls and procedures. |
Our management, with the participation of our chief executive officer and chief financial officer, evaluated the effectiveness of our disclosure controls and procedures pursuant to Rule 13a-15 under the Securities Exchange Act of 1934, as amended, as of the end of the period covered by this Quarterly Report. In designing and evaluating the disclosure controls and procedures, management recognized that any controls and procedures, no matter how well designed and operated, can provide only reasonable assurance of achieving the desired control objectives, and management is required to apply its judgment in evaluating the cost-benefit relationship of possible controls and procedures.
Based on that evaluation, our chief executive officer and chief financial officer concluded that our disclosure controls and procedures were effective as of the end of the period covered by this Quarterly Report to provide reasonable assurance that information we are required to disclose in reports that we file or submit under the Securities Exchange Act of 1934, as amended, is accurately recorded, processed, summarized and reported within the time periods specified in SEC rules and forms, and that such information is accumulated and communicated to our management, including our chief executive officer and chief financial officer, as appropriate, to allow timely decisions regarding required disclosure.
(b) | Changes in internal controls over financial reporting. |
There were no changes in our internal control over financial reporting that occurred during the period covered by this Quarterly Report that have materially affected, or are reasonably likely to materially affect, our internal control over financial reporting.
21
PART II—OTHER INFORMATION
Item 1. | Legal Proceedings |
See discussion of Legal Proceedings in Note 13 to the unaudited consolidated financial statements contained in Part I, Item 1 of this Quarterly Report.
Item 1A. | Risk Factors |
Information concerning certain risks and uncertainties appears in “Part I—Item 1A—Risk Factors” of the Company’s 2010 Form 10-K. You should carefully consider these risks and uncertainties before making an investment decision with respect to shares of our Class A common stock. Such risks and uncertainties could materially adversely affect our business, financial condition or operating results.
During the period covered by this Quarterly Report, there have been no material changes from the risk factors previously disclosed in the Company’s 2010 Form 10-K or filings subsequently made with the SEC.
Item 2. | Unregistered Sales of Equity Securities and Use of Proceeds |
The following table shows Company repurchases of its Class A common stock for the three months ended September 30, 2011.
Total Number of Shares Purchased(1) | Average Price Paid per Share | Total Number of Shares Purchased as Part of Publicly Announced Plan or Program(2) | Maximum Number (or Approximate Dollar Value) of Shares That May Yet Be Purchased Under the Plan or Program(2) | ||||||||||
July 1–July 31, 2011 | — | $ | — | — | $ | 125,000,000 | |||||||
August 1–August 31, 2011 | — | $ | — | — | $ | 125,000,000 | |||||||
September 1–September 30, 2011 | — | $ | — | — | $ | 125,000,000 | |||||||
Total | — | $ | — | — | |||||||||
____________________
(1) | Does not include shares forfeited to the Company upon the expiration or cancellation of unvested restricted stock awards. |
(2) | In July 2010, the Company’s Board of Directors terminated the then-existing stock repurchase program and authorized a new stock repurchase program pursuant to which the Company may repurchase up to an aggregate of $150 million of its outstanding stock. |
Item 3 is not applicable and has been omitted.
Item 5. | Other Information |
None.
22
Item 6. | Exhibits |
Exhibit 10.1 | Amended and Restated Employment Agreement, dated as of October 19, 2011, by and between DreamWorks Animation SKG, Inc. and Lewis Coleman (incorporated by reference from Exhibit 99.1 to the Company's Current Report on Form 8-K filed on October 25, 2011) |
Exhibit 10.2 | Amended and Restated Employment Agreement, dated as of October 19, 2011, by and between DreamWorks Animation SKG, Inc. and Anne Globe (incorporated by reference from Exhibit 99.2 to the Company's Current Report on Form 8-K filed on October 25, 2011) |
Exhibit 31.1 | Certification of Chief Executive Officer Pursuant to Exchange Act Rule 13a-14(a) or 15d-14(a), as Adopted Pursuant to Section 302 of the Sarbanes-Oxley Act of 2002. |
Exhibit 31.2 | Certification of Chief Financial Officer Pursuant to Exchange Act Rule 13a-14(a) or 15d-14(a), as Adopted Pursuant to Section 302 of the Sarbanes-Oxley Act of 2002. |
Exhibit 32.1 | Certifications of Chief Executive Officer and Chief Financial Officer Pursuant to 18 U.S.C. Section 1350, as Adopted Pursuant to Section 906 of the Sarbanes-Oxley Act of 2002. |
Exhibit 101 | The following financial information from the Company’s Quarterly Report on Form 10-Q for the quarter ended September 30, 2011 formatted in eXtensible Business Reporting Language: (i) Unaudited Consolidated Statements of Operations for the three and nine months ended September 30, 2011 and 2010; (ii) Unaudited Consolidated Balance Sheets at September 30, 2011 and December 31, 2010; (iii) Unaudited Consolidated Statements of Cash Flows for the nine months ended September 30, 2011 and 2010; and (iv) Notes to the Unaudited Consolidated Financial Statements. |
23
SIGNATURES
Pursuant to the requirements of the Securities Exchange Act of 1934, the Registrant has duly caused this report to be signed on its behalf by the undersigned thereunto duly authorized.
DREAMWORKS ANIMATION SKG, INC. | |||
Date: October 25, 2011 | By: | /S/ LEWIS W. COLEMAN | |
Name: | Lewis W. Coleman | ||
Title: | President and Chief Financial Officer | ||
(Principal Financial Officer and Duly Authorized Officer) | |||
24
EXHIBIT INDEX
Exhibit Number | Description |
Exhibit 10.1 | Amended and Restated Employment Agreement, dated as of October 19, 2011, by and between DreamWorks Animation SKG, Inc. and Lewis Coleman (incorporated by reference from Exhibit 99.1 to the Company's Current Report on Form 8-K filed on October 25, 2011) |
Exhibit 10.2 | Amended and Restated Employment Agreement, dated as of October 19, 2011, by and between DreamWorks Animation SKG, Inc. and Anne Globe (incorporated by reference from Exhibit 99.2 to the Company's Current Report on Form 8-K filed on October 25, 2011) |
Exhibit 31.1 | Certification of Chief Executive Officer Pursuant to Exchange Act Rule 13a-14(a) or 15d-14(a), as Adopted Pursuant to Section 302 of the Sarbanes-Oxley Act of 2002. |
Exhibit 31.2 | Certification of Chief Financial Officer Pursuant to Exchange Act Rule 13a-14(a) or 15d-14(a), as Adopted Pursuant to Section 302 of the Sarbanes-Oxley Act of 2002. |
Exhibit 32.1 | Certifications of Chief Executive Officer and Chief Financial Officer Pursuant to 18 U.S.C. Section 1350, as Adopted Pursuant to Section 906 of the Sarbanes-Oxley Act of 2002. |
Exhibit 101 | The following financial information from the Company’s Quarterly Report on Form 10-Q for the quarter ended September 30, 2011 formatted in eXtensible Business Reporting Language: (i) Unaudited Consolidated Statements of Operations for the three and nine months ended September 30, 2011 and 2010; (ii) Unaudited Consolidated Balance Sheets at September 30, 2011 and December 31, 2010; (iii) Unaudited Consolidated Statements of Cash Flows for the nine months ended September 30, 2011 and 2010; and (iv) Notes to the Unaudited Consolidated Financial Statements. |
25