Attached files
| file | filename |
|---|---|
| 8-K - ARROW ELECTRONICS, INC. 8-K - ARROW ELECTRONICS INC | a50042455.htm |
| EX-99.1 - EXHIBIT 99.1 - ARROW ELECTRONICS INC | a50042455-ex991.htm |
Exhibit 99.2
Third-Quarter 2011 CFO Commentary
As reflected in our earnings release, there are a number of items that impact the comparability of our results with those in the trailing quarter and the third quarter of last year. Any discussion of our results will exclude these items to give you a better sense of our operating results. As always, the operating information we provide to you should be used as a complement to GAAP numbers. For a complete reconciliation between our GAAP and Non-GAAP results, please refer to our earnings release or the earnings reconciliation found at the end of this document.
Third-Quarter Summary
Record third-quarter revenue of $5.2 billion increased 11% year over year and was in line with our guidance. Earnings per share of $1.20 represent the highest third-quarter level in company history and the 6th consecutive quarter of record earnings. Based on our guidance for the fourth quarter, we are on track to achieve earnings per share in excess of $5 per share, an increase of more than 20% from 2010’s record level. Gross margin increased 60 basis points year over year, representing the 7th consecutive quarter of year-over-year improvement. This quarter was again strong for cash flow generation, as we generated almost $120 million in cash from operations. Our returns reflect our ability to create shareholder value:
|
●
|
Return on invested capital of 11.7%, well in excess of our weighted average cost of capital
|
|
●
|
Return on working capital of nearly 28%
|
Our strategic priorities for the future are clear and have not changed. We remain focused on outgrowing the market in our core businesses; expanding into faster growing, high-margin products and services; growing profits faster than sales; and increasing returns on capital.
Sales in our ECS business reached a record third-quarter level of $1.5 billion and increased 26% year over year, with strength in both the Americas and Europe. Sales growth was in line with normal seasonality driven by impressive year-over-year growth in all of our product lines led by services, software, proprietary servers, industry-standard servers, and storage. Enterprise spending is expected to remain solid and we look forward to a seasonally strong fourth quarter as our global teams leverage our industry-leading position and complete portfolio of data center offerings.
In global components, sales increased 6% year over year, with growth in the Americas and Europe partially offset by weakness in the Asia Pacific region, reflecting difficult market conditions. Since we reported our second-quarter earnings in late July, macroeconomic conditions around the world have weakened with increasing volatility in global markets and cautiousness across our customer base. Given the lack of visibility and choppy market conditions, we expect our global components business to be below normal seasonality in the fourth quarter, with the Americas and Asia Pacific in line with normal seasonality and Europe below normal seasonality due to macro and sovereign debt concerns.
1
Consolidated Overview – Third Quarter
P&L Highlights –
($ in millions, except per share data, may reflect rounding)
|
3Q11
|
Y/Y Change
|
Y/Y Change
Pro forma
|
Q/Q
Change
|
||||
|
Sales
|
$5,187
|
+11%
|
+2%
|
-6%
|
|||
|
Gross Profit Margin
|
13.7%
|
+60bps
|
Flat
|
-20bps
|
|||
|
Operating Exp/Sales
|
9.5%
|
+70bps
|
Flat
|
+20bps
|
|||
|
Operating Income
|
$218.0
|
+10%
|
+2%
|
-14%
|
|||
|
Operating Margin
|
4.2%
|
-10bps
|
Flat
|
-40bps
|
|||
|
Net Income
|
$138.3
|
+8%
|
+1%
|
-14%
|
|||
|
Diluted EPS
|
$1.20
|
+11%
|
+3%
|
-12%
|
|
●
|
Second quarter sales of $5.2 billion increased 11% year over year
|
|
o
|
Decreased 6% on a sequential basis
|
|
■
|
Pro forma for acquisitions, sales were up 2% year over year and declined 7% sequentially
|
|
■
|
Pro forma for acquisitions and excluding FX, sales were down 1% year over year and down 6% sequentially
|
|
●
|
Consolidated gross profit margin was 13.7%
|
|
o
|
Increased 60 basis points year over year and was down 20 basis points sequentially
|
|
o
|
Pro forma for acquisitions, gross profit margin was flat year over year
|
|
●
|
Operating expenses as a percentage of sales was 9.5%
|
|
o
|
Increased 70 basis points year over year and up 20 basis points sequentially
|
|
o
|
On an absolute dollar basis, operating expenses increased year over year as acquisitions added $76 million this quarter, a weakening dollar added another $15 million due to translation, and efficiency gains lowered expenses in the base business by $10 million
|
|
o
|
Pro forma for acquisitions and excluding FX, operating expenses were down 1% year over year and are flat as a percentage of sales
|
|
●
|
Operating income was $218.0 million
|
|
o
|
Increased 10% year over year and declined 14% sequentially
|
|
o
|
Pro forma for acquisitions, operating income increased 2% year over year
|
|
●
|
Operating income as a percentage of sales was 4.2%
|
|
o
|
Decreased 10 basis points year over year and 40 basis points sequentially
|
|
o
|
Pro forma for acquisitions, operating income as a percentage of sales was flat year over year
|
|
●
|
Effective tax rate for the quarter was 29.0%
|
|
●
|
Net income was $138.3 million
|
|
o
|
Increased 8% compared with last year and decreased 14% sequentially
|
|
o
|
Pro forma for acquisitions, net income was up 1% year over year
|
|
●
|
Earnings per share were $1.22 and $1.20 on a basic and diluted basis, respectively
|
|
o
|
Record third-quarter EPS
|
|
o
|
Diluted EPS increased 11% year over year and decreased 12% sequentially
|
|
o
|
Pro forma for acquisitions, EPS increased 3% year over year
|
2
Global Components
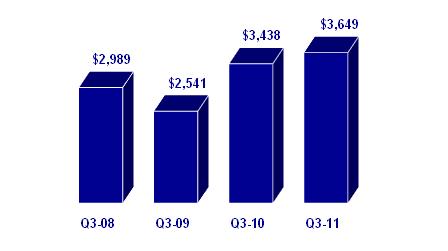
$2,989 2,541 $3,438 $3,649 Q3-08 Q3-09 Q3-10 Q3-11
Sales ($ in millions)
|
●
|
Sales increased 6% year over year and were down 6% sequentially
|
|
o
|
Sales below normal seasonality on a sequential basis
|
|
o
|
Pro forma for acquisitions and excluding FX, sales decreased 6% year over year and 5% sequentially
|
|
●
|
Gross margin increased 50 basis points year over year due primarily to the impact of recently acquired businesses
|
|
o
|
Sequentially, gross margin declined 40 basis points
|
|
o
|
Gross margin in our core customer base of small and medium size customers decreased 10 basis points year over year and 30 basis points sequentially
|
|
●
|
Our leading indicators (book-to-bill ratios, cancellations rates, and lead times) point to below seasonal levels on a global basis
|
|
●
|
Operating profit decreased 1% year over year
|
|
o
|
Operating margin decreased 40 basis points year over year to 5.3%
|
|
o
|
Pro forma for acquisitions, operating margin was down 30 basis points year over year
|
|
●
|
Return on working capital declined 440 basis points year over year reflecting lower profitability and increased inventory levels
|
3
Americas Components Region
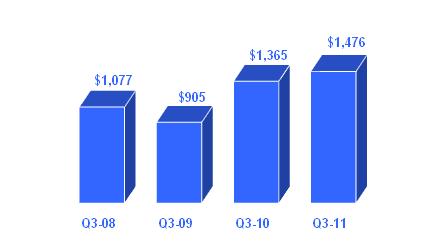
$1,077 $905 $1,365 $1,476 Q3-08 Q3-09 Q3-10 Q3-11
Sales ($ in millions)
|
●
|
Sales increased 8% year over year and decreased 6% sequentially
|
|
o
|
Pro forma for acquisitions, sales decreased 4% year over year and were below normal seasonality on a sequential basis
|
|
●
|
Operating income decreased 6% year over year
|
|
o
|
Operating margin decreased 110 basis points year over year due to mix
|
|
o
|
Pro forma for acquisitions, operating margin decreased 90 basis points year over year
|
4
Europe Components Region
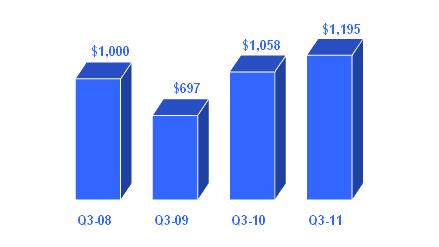
$1,000 $697 $1,058 $1,195 Q3-08 Q3-09 Q3-10 Q3-11
Sales ($ in millions)
|
●
|
Sales increased 13% year over year and declined 8% sequentially
|
|
o
|
Pro forma for acquisitions and excluding FX, sales increased 1% year over year and declined 6% sequentially
|
|
o
|
Sequentially, sales growth was in line with normal seasonality
|
|
●
|
Northern Europe continues to see sales growth year over year
|
|
o
|
Cautious market conditions in Central Europe
|
|
●
|
Vertical markets continue to show growth
|
|
o
|
Automotive, lighting and medical grew 5%, 5% and 3%, respectively
|
|
●
|
Operating income grew 8% year over year
|
|
o
|
Operating margin declined 30 basis points year over year due to mix
|
5
Asia Pacific Components Region
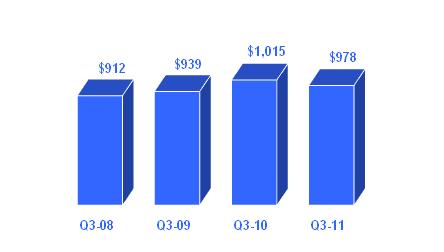
$912 $939 $1,015 $978 Q3-08 Q3-09 Q3-10 Q3-11
Sales ($ in millions)
|
●
|
Sales declined 4% year over year and 4% sequentially
|
|
o
|
Pro forma for acquisitions, sales decreased 11% year over year and 4% sequentially
|
|
o
|
Below normal seasonality on a sequential basis
|
|
o
|
Mobile-handsets components business rebounded as sales increased 6% sequentially
|
|
■
|
First sequential increase since Q1 2010
|
|
●
|
Core Asia sales declined 4% year over year
|
|
o
|
Decreased market demand in Hong Kong, Taiwan, and South Asia somewhat offset by increased demand in mainland China
|
|
o
|
Sequentially, the core business decreased 7%
|
|
●
|
Vertical market growth led by lighting and transportation, which increased 29% and 27% year over year, respectively
|
|
●
|
Operating profit declined 14% year over year
|
|
o
|
Operating margin declined 30 basis points year over year
|
6
Global Enterprise Computing Solutions
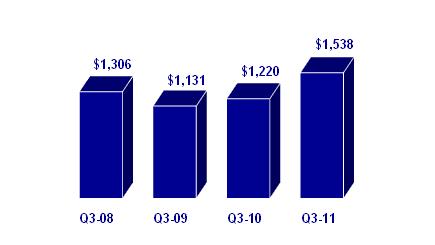
$1,306 $1,131 $1,220 $1,538 Q3-08 Q3-09 Q3-10 Q3-11
Sales ($ in millions)
|
●
|
Sales increased 26% year over year and declined 8% sequentially
|
|
o
|
Record third quarter revenue
|
|
o
|
Pro forma and excluding FX, sales increased 13% year over year and decreased 8% sequentially
|
|
●
|
Sales in line with high end of normal seasonality on a sequential basis
|
|
o
|
Extremely strong year-over-year growth in all product lines led by services (+40%), software (+32%), proprietary servers (+18%), storage (+17%), industry-standard servers (+6%), and unified communications (+4%)
|
|
o
|
Robust growth in faster-growing product lines with networking and virtualization up 62% and 35% year over year, respectively
|
|
●
|
Gross margin increased 140 basis points year over year driven by the addition of acquisitions and changes in product mix
|
|
o
|
Pro forma for acquisitions, gross profit decreased 10 basis points year over year
|
|
o
|
Gross margin increased 20 basis points sequentially, driven by product mix
|
|
●
|
Operating income grew 51% year over year and increased nearly 2x faster than sales
|
|
o
|
Operating margin increased 60 basis points year over year to 3.5%
|
|
■
|
Highest Q3 level since 2007
|
|
●
|
Return on working capital continues to excel
|
7
ECS America
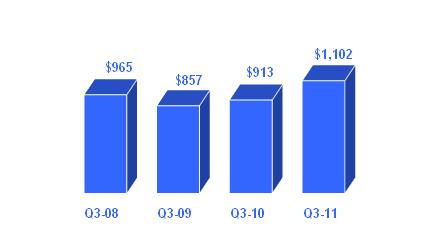
$965 $857 $913 $1,102 Q3-08 Q3-09 Q3-10 Q3-11
Sales ($ in millions)
|
●
|
Sales increased 21% year over year and declined 5% sequentially
|
|
o
|
Pro forma for acquisitions, sales increased 12% year over year and decreased 6% sequentially
|
|
●
|
Sales growth in line with normal seasonality on a sequential basis
|
|
o
|
Solid federal spending season
|
|
o
|
Impressive double-digit year-over-year growth in nearly all product lines
|
|
■
|
Services (+45%), software (+34%), storage (+20%), proprietary servers (+13%), and industry-standard servers (+11%)
|
|
●
|
Gross profit increased 250 basis points year over year and 60 basis points sequentially
|
|
o
|
Year-over-year increase driven by strength in our core North American value-added distribution business, changes in product mix, and the addition of Shared Technologies
|
|
●
|
A combination of top-line growth and improved gross profit resulted in operating income growth of 46% year over year
|
|
o
|
Operating income grew more than 2x faster than sales year over year
|
|
o
|
Operating margin expanded 80 basis points year over year
|
8
ECS Europe
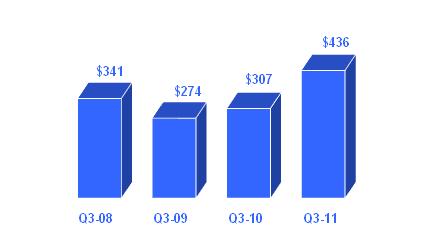
$341 $274 $307 $436 Q3-08 Q3-09 Q3-10 Q3-11
Sales ($ in millions)
|
●
|
Sales increased 42% year over year and declined 13% sequentially
|
|
o
|
Pro forma and excluding FX, sales increased 17% year over year and declined 11% sequentially
|
|
●
|
Sales growth in line with normal seasonality on a sequential basis
|
|
o
|
Double-digit growth in Western and Central regions, increasing 52% and 21% year over year, respectively
|
|
■
|
UK continues to struggle
|
|
o
|
Impressive year-over-year growth in proprietary servers (+50%), software (+30%), storage (+10%), and services (+9%)
|
|
●
|
Gross profit declined 180 basis points year over year and 60 basis points sequentially due primarily to product mix
|
|
o
|
Pro forma for acquisitions, gross profit declined 150 basis points year over year
|
|
●
|
Operating profit increased 52% year over year
|
|
o
|
Operating margin improved 10 basis points year over year
|
9
Cash Flow and Balance Sheet Highlights
|
●
|
Working Capital
|
We continue to effectively manage all levers of our working capital and working capital to sales of $.15 is within our long-term target range. Return on working capital of 27.8% is a near record third-quarter level.
|
●
|
Return on Invested Capital
|
Return on invested capital of 11.7% is well in excess of our weighted average cost of capital. This is a key driver in creating lasting shareholder value.
|
●
|
Cash Flow from Operations
|
We generated $119 million in cash from operations in the third quarter. On a trailing twelve month basis, we generated $436 million in cash from operations, during a period where we were growing the business.
|
●
|
Share Buyback
|
We completed our previously announced $100 million stock buyback authorization during the third quarter bringing the total amount returned to shareholders over the past four years to $550 million. The average price of the repurchases was $32.07. Our board just approved an incremental $150 million repurchase authorization as we believe this is an effective method of returning capital to investors.
|
●
|
Debt and Liquidity
|
Our balance sheet and capital structure remain strong with conservative debt levels, and a net debt to EBITDA ratio of approximately 1.7x. We further strengthened our financial position during the third quarter, as we entered into a new $1.2 billion 5-year credit facility. This transaction brings our total available liquidity to $1.8 billion in addition to our cash of more than $500 million. Thus we now have the flexibility to take advantage of opportunities in the marketplace.
10
Fourth-Quarter 2011 Guidance
|
●
|
Consolidated Sales
|
$5.29Bn to $5.69Bn |
|
o
|
Global Components
|
$3.29Bn to $3.49Bn |
|
o
|
Global ECS
|
$2.0Bn to $2.2Bn |
|
●
|
Diluted EPS
|
$1.25 to $1.37 |
Our guidance assumes that the average Euro to USD exchange rate for the third quarter is 1.38 to 1.
In the fourth quarter, we would expect global ECS sales to be in line with the low end of normal seasonality. Sales in our core global components business are expected to be below normal seasonality, reflecting weaker global macroeconomic conditions. The outlook reflects selective targeted operating expense reductions across both businesses.
Based on our current guidance for the fourth quarter, we expect 2011 earnings per share to be in the range of $5.06 to $5.18, representing another record year for our company and year-over-year growth of 24%. We expect to be cash flow positive in the fourth quarter and for 2011.
11
Arrow Electronics Revenue Seasonality*
Core Global Components**
|
GLOBAL
|
GLOBAL
|
||||||||||
|
NAC
|
EUR ex FX
|
A/P
|
COMPONENTS
|
COMP ex FX
|
|||||||
|
Q1
|
Flat to +2%
|
+13%
|
Flat to -13%
|
+2% to +4%
|
+3% to +5%
|
||||||
|
Q2
|
Flat to -3%
|
-2% to -7%
|
+3% to +14%
|
+1% to -1%
|
Flat to -1%
|
||||||
|
Q3
|
Flat to -2%
|
Flat to -10%
|
+15% to +20%
|
+2% to +3%
|
Flat to +2%
|
||||||
|
Q4
|
Flat to -7%
|
-4% to +1%
|
-4% to -5%
|
-2% to -5%
|
-3% to -8%
|
||||||
Global ECS
|
GLOBAL
|
GLOBAL
|
|||||||||
|
NA
|
EUR ex FX
|
ECS
|
ECS ex FX
|
|||||||
|
Q1
|
-25% to -35%
|
-16% to -28%
|
-30% to -35%
|
-25% to -35%
|
||||||
|
Q2
|
+20% to +22%
|
+7% to +11%
|
+15% to +20%
|
+17% to +18%
|
||||||
|
Q3
|
-1% to -9%
|
-8% to -12%
|
-5% to -15%
|
-8% to -12%
|
||||||
|
Q4
|
+29% to +35%
|
+31% to +69%
|
+35% to +45%
|
+30% to +43%
|
||||||
Consolidated
|
TOTAL
|
|||
|
ARROW, Ex FX
|
|||
|
Q1
|
-6% to -11%
|
||
|
Q2
|
+5% to +6%
|
||
|
Q3
|
-1% to +1%
|
||
|
Q4
|
+5% to +12%
|
||
* Revenue seasonality based on historical sequential sales growth for 2007-2008; does not include 2009-2010
**Core global components, excluding acquisitions
12
Risk Factors
The discussion of the company’s business and operations should be read together with the risk factors contained in Item 1A of its 2010 Annual Report on Form 10-K, filed with the Securities and Exchange Commission, which describe various risks and uncertainties to which the company is or may become subject. If any of the described events occur, the company’s business, results of operations, financial condition, liquidity, or access to the capital markets could be materially adversely affected. In addition to the risk factors contained in Item 1A in the 2010 Annual Report for Form 10-K, we have added the following risk factor:
The recent earthquake and tsunami, and other collateral events, in Japan may negatively impact our supply of products or cause shortages of some components, which could have a material adverse effect on the company’s business.
As a result of the effects of the earthquake and tsunami that recently occurred in Japan, including the resultant nuclear crisis, certain of the company’s vendors may be unable to deliver sufficient quantities of components or deliver them in a timely manner. Further, depending on the length of these disruptions, we may need to locate alternate suppliers to fulfill our customers’ needs. While it is too early to predict what impact this crisis will have, it could have a material adverse affect on the company’s business.
Certain Non-GAAP Financial Information
In addition to disclosing results that are determined in accordance with Generally Accepted Accounting Principles ("GAAP"), the company provides certain non-GAAP financial information relating to operating income, net income attributable to shareholders and net income per basic and diluted share, each as adjusted for certain charges, credits and losses that the company believes impact the comparability of its results of operations. These charges, credits and losses arise out of the company's efficiency enhancement initiatives, acquisitions, prepayment of debt, and settlement of certain legal matters. A reconciliation of the company's non-GAAP financial information to GAAP is set forth in the table below.
The company believes that such non-GAAP financial information is useful to investors to assist in assessing and understanding the company's operating performance and underlying trends in the company's business because management considers the charges, credits and losses referred to above to be outside the company's core operating results. This non-GAAP financial information is among the primary indicators management uses as a basis for evaluating the company's financial and operating performance. In addition, the company's Board of Directors may use this non-GAAP financial information in evaluating management performance and setting management compensation.
13
The presentation of this additional non-GAAP financial information is not meant to be considered in isolation or as a substitute for, or alternative to, operating income, net income attributable to shareholders and net income per basic and diluted share determined in accordance with GAAP. Analysis of results and outlook on a non-GAAP basis should be used as a complement to, and in conjunction with, data presented in accordance with GAAP.
Earnings Reconciliation
($ in thousands, except per share data)
| Q3 2011 | Q2 2011 | Q3 2010 | ||||||||||
|
Operating income, as Reported
|
$209,162 | $248,330 | $184,519 | |||||||||
|
Restructuring, integration, and other charges
|
8,848 | 5,221 | 14,338 | |||||||||
|
Operating income, as Adjusted
|
$218,010 | $253,551 | $198,857 | |||||||||
|
Net income attributable to shareholders, as Reported
|
$132,216 | $156,197 | $118,502 | |||||||||
|
Restructuring, integration, and other charges
|
6,048 | 3,584 | 9,506 | |||||||||
|
Net income attributable to shareholders, as Adjusted
|
$138,264 | $159,781 | $128,008 | |||||||||
|
Diluted EPS, as Reported
|
$1.15 | $1.33 | $1.00 | |||||||||
|
Restructuring, integration, and other charges
|
.05 | .03 | .08 | |||||||||
|
Diluted EPS, as Adjusted
|
$1.20 | $1.36 | $1.08 | |||||||||
The sum of the components for net income per share, as Adjusted, may not agree to totals, as presented, due to rounding.
Earnings Reconciliation
References to restructuring and other charges refer to the following incremental charges taken in the periods indicated:
Q3-11 Restructuring, Integration, and Other Charges: During the third quarter of 2011, the company recorded restructuring, integration, and other charges of $8.8 million ($6.0 million net of related taxes or $.05 per share on both a basic and diluted basis) primarily related to initiatives taken by the company to improve operating efficiencies.
Q2-11 Restructuring, Integration, and Other Charges: During the second quarter of 2011, the company recorded restructuring, integration, and other charges of $5.2 million ($3.6 million net of related taxes or $.03 per share on both a basic and diluted basis) primarily related to initiatives taken by the company to improve operating efficiencies.
14
Q3-10 Restructuring, Integration, and Other Charges: During the third quarter of 2010, the company recorded restructuring, integration, and other charges of $14.3 million ($9.5 million net of related taxes or $.08 per share on both a basic and diluted basis) primarily related to initiatives taken by the company to improve operating efficiencies.
15