Attached files
| file | filename |
|---|---|
| 8-K - FORM 8-K - SIGMA ALDRICH CORP | d246500d8k.htm |
| EX-99.1 - PRESS RELEASE - SIGMA ALDRICH CORP | d246500dex991.htm |
 Sigma-Aldrich Corporation
Q3 2011 Earnings Review & 2011 Outlook
•
Enabling Science to Improve the Quality of Life
Exhibit 99.2 |
 2
2
Cautionary Statements
Our presentation today will include forward looking statements relating to the
Company’s future performance, goals, strategic actions and initiatives
and similar intentions and beliefs, including expectations, outlook, goals, beliefs, intentions and the like regarding future sales,
earnings, free cash flow, share repurchases, acquisitions and other matters. These
statements are based on assumptions regarding Company operations, investments
and acquisitions and conditions in the markets the Company serves. We believe that these
assumptions
are
reasonable
and
well-founded.
The
forward-looking
statements
in
this
presentation
are
subject
to
risks
and
uncertainties
including, among others, certain economic, political and technological factors.
Actual results could differ materially from those stated or implied during
this review or contained in other Company communications due to, but not limited to, such factors as (1) global economic
conditions, (2) changes in pricing and the competitive environment and the global
demand for our products, (3) fluctuations in foreign currency
exchange
rates,
(4)
changes
in
research
funding
and
the
success
of
research
and
development
activities,
(5)
failure
of
planned
sales initiatives in our Research and SAFC businesses, (6) dependence on
uninterrupted manufacturing operations, (7) failure to achieve planned cost
reductions in global supply chain initiatives and restructuring actions, (8) changes in the regulatory environment in which the
Company operates, (9) changes in worldwide tax rates or tax benefits from domestic
and international operations, including the matters described
in
Note
10–Income
Taxes–
to
the
Consolidated
Financial
Statements
in
the
Company’s
Form
10-K
report
for
the
year
ended
December 31, 2010, (10) exposure to litigation, including product liability
claims, (11) the ability to maintain adequate quality standards, (12)
reliance
on
third
party
package
delivery
services,
(13)
an
unanticipated
increase
in
interest
rates,
(14)
other
changes
in
the
business
environment in which the Company operates, (15) the outcome of the outstanding
matters described in Note 11-Contingent Liabilities and Commitments to
the Consolidated Financial Statements-in the Company’s Form 10-K report for the year ended December 31, 2010, and
(16) acquisitions or divestitures of businesses. A further discussion of risk
factors can be found in Item 1A of Part 1 of the Company’s Form
10-K report for the year ended December 31, 2010. The Company does not undertake any obligation to publicly update the matters
covered in this presentation.
With over 60% of sales denominated in currencies other than the U.S. dollar,
management uses currency adjusted sales growth when analyzing
Company
performance,
and
believes
it
is
useful
as
well
to
investors,
to
judge
the
Company’s
performance.
Organic
sales
growth
data
presented
in
this
review
excludes
currency
and
acquisitions
impacts.
The
Company
calculates
the
impact
of
changes
in
foreign
currency rates by multiplying current period activity by the difference between
current period exchange rates and prior period exchange rates, the result is
the defined impact of “changes in foreign currency exchange rates”. While we are able to report currency impacts after
the
fact,
we
are
unable
to
estimate
changes
that
may
occur
later
in
2011
to
applicable
exchange
rates.
Any
significant
changes
in
currency
exchange
rates
would
likely
have
a
significant
impact
on
our
reported
growth
rates
due
to
the
volume
of
our
sales
denominated
in
foreign
currencies.
Management also uses adjusted net income and EPS and adjusted operating income and
operating income margins and free cash flow, non-GAAP
measures,
to
judge
its
performance
and
ability
to
pursue
opportunities
that
enhance
shareholder
value.
Due
to
the
uncertain
timing
of
future
restructuring
and
other
special
charges,
we
are
unable
to
include
these
charges
in
the
2011
diluted
adjusted
EPS
forecast
or provide a reconciliation to the corresponding GAAP measures. Management believes
this non-GAAP information is useful to investors as well. Management
believes this non-GAAP information is useful to investors as well. Reconciliations of GAAP to non-GAAP information
are included in the Company’s October 25, 2011 earnings release posted on its
website, www.sigma-aldrich.com, and in the Appendix –
Reconciliation of GAAP to Non-GAAP Financial Measures beginning on Slide
15. |
 3
Third Quarter 2011 Financial Results
($ in millions, except per share amounts)
3
YEAR-OVER-YEAR
Net
Income
and
Diluted
EPS
Up
25%
As
Reported
Q3 2011
Excluding
Restructuring
As
Reported
Excluding
Restructuring
and Impairment
Net Income
$ 117
$ 118
26%
15%
Diluted EPS
$0.95
$0.96
25%
16%
Free Cash Flow
$ 90
26%
Q3 2011
As
Reported
Excluding
Currency and
Acquisition
Impacts
Sales
$ 626
11%
4%
YEAR-OVER-YEAR
(1)
(1)
See page 20 for reconciliation of Net Cash Provided by Operating Activities to Free Cash Flow
|
 4
First Nine Months
2011 Financial Results
($ in millions, except per share amounts)
4
YEAR-OVER-YEAR
Year-to-Date Sales and Earnings On-Track
Excluding
Restructuring
As
Reported
Excluding
Restructuring
and Impairment
Net Income
$ 349
$ 354
20%
16%
Diluted EPS
$ 2.84
$ 2.88
20%
16%
Free Cash Flow
$ 300
10%
Nine
Months
2011
As
Reported
Excluding
Currency and
Acquisition
Impacts
Sales
$1,895
12%
6%
YEAR-OVER-YEAR
Nine
Months
2011
(1)
See page 20 for reconciliation of Net Cash Provided by Operating Activities to
Free Cash Flow (1) |
 5
5
2011 Sales Growth
RESEARCH
71%
29%
SAFC
Sales Mix (YTD)
Double Digit Reported Sales Growth in 2011
Research
SAFC
Total
Company
Organic*
*Adjusted for Currency & Acquisitions
Reported
Q3 2011 / Q3 2010
Organic*
Reported
Nine Months 2011/
Nine Months 2010
13%
4%
12%
4%
8%
2%
14%
9%
11%
12%
6%
4% |
 6
25.4%
100 basis points
40 basis points
6
Margin Analysis
Adjusted Operating Margins Show Improvement Year-Over-Year
PERCENTAGE OF SALES
25.6%
0.4
0.4
YTD
25.7%
0.4
0.4
Reported Operating Margin -
2011
Q3
26.1%
Restructuring Costs
Adjusted Operating Margin -
2011
Acquisitions
26.4%
26.5%
Adjusted Operating Margin -
2010
Improvement |
 7
7
Free Cash Flow
(in millions)
2011
$349
79
(85)
30
373
(73)
$300
Net Income
Free Cash Flow
Net Cash Provided by Operating Activities
Less Capital Expenditures
Other
Changes in Performance Working Capital*
Depreciation & Amortization
2010
$290
69
(24)
62
397
(65)
$332
*Accounts Receivable + Inventory –
Accounts Payable
NINE MONTHS ENDED SEPTEMBER 30
Working Capital Increase to Support Sales Growth |
 8
Strategic Priorities for Growth
•
Research Business Growth
•
Innovation and product leadership in faster growing segments
•
Leverage broad offering, customer service and distribution
•
New
products
in
proteomics,
epigenomics
and
molecular
biology
•
SAFC Growth
•
Cell culture media for biological drugs and suite of capabilities for biological
manufacturing customers
•
Chemicals for electronic applications (LEDs, semiconductors, solar panels,
other) Driving Growth Along Several Fronts |
 9
Strategic Priorities for Growth
•
Geographic Growth
•
Focus on faster growing emerging markets in Asia Pacific and Latin America
•
E-
Commerce
•
Enhanced search experience
•
Expand local language capability
•
M&A
•
Robust pipeline
Driving Growth through Channel and Footprint Expansion
|
 10
10
Q3 Sales Performance
Innovation
Reported
Organic
(1)
•
Analytical, Biology, Materials Science
Sales Growth
(2)
10-22%
3-10%
SAFC Sales
•
Build on momentum in key product segments
8%
2%
Geographic Growth
•
North America
6%
3%
•
Europe
11%
2%
•
Asia Pacific/Latin America
22%
9%
•
Focus Markets –
India, China, Brazil
46%
25%
eCommerce Sales
% of Research Sales
•
Research Sales via eCommerce
channels
50%
Initiatives Collectively on Track
(1)
Adjusted for currency and acquisitions. See pages 18 & 19 for
reconciliation of reported growth to organic growth. (2)
Varies for individual product lines |
 11
11
Third Quarter 2011 Highlights
•
ZFN technology applications growing with increased market penetration
•
Introduced ZFN modified Chinese Hamster Ovary cell lines for bioproduction
•
Established collaboration to develop novel energy and electronics materials
including rare earth materials and quasicrystals
•
Wuxi, China facility is on pace to open near year end 2011
•
Completed expansion of Bangalore, India facility to provide expanded
distribution and packaging
•
Increased capacity for liquid media
•
Taiwan SAFC Hitech facility construction expected to be completed in Q1 2012
Continued Focus on Long-term Growth Opportunities |
 12
12
2011 Guidance
Organic Revenue Growth
Free Cash Flow
Mid-single digits
~$400M
*Excludes any restructuring and other extraordinary special charges
Diluted Adjusted EPS*
Q1
Q2
Q3
Q4
Full Year
$0.98
28%
Tax Rate
$0.93
28%
$0.96
$0.85 -
$0.93
$3.73 -
$3.81
27%
28% -
29%
30% -
31% |
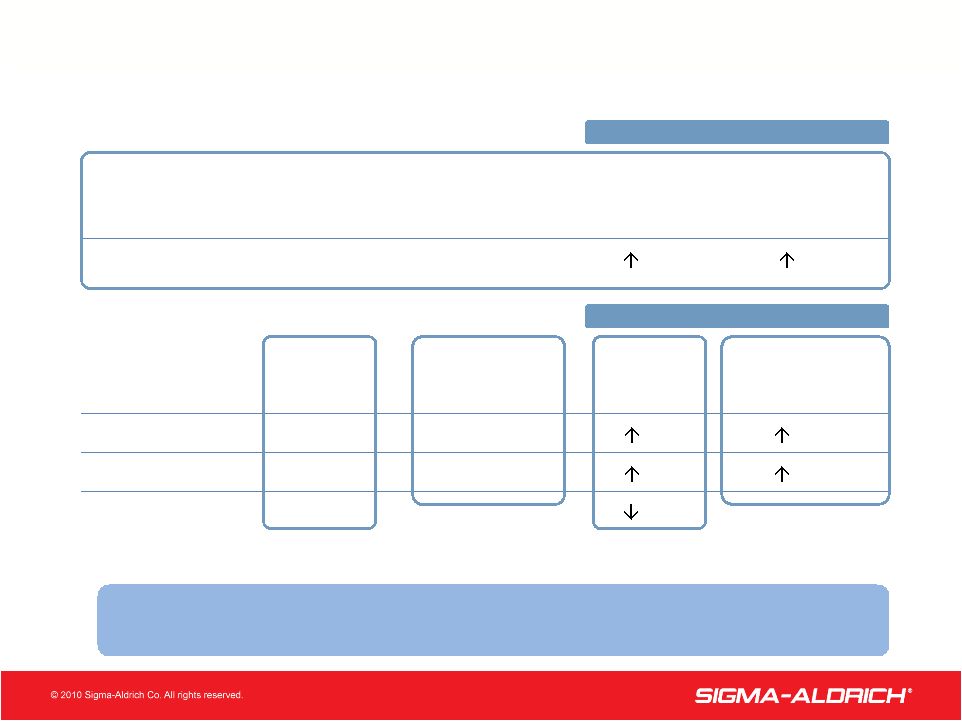
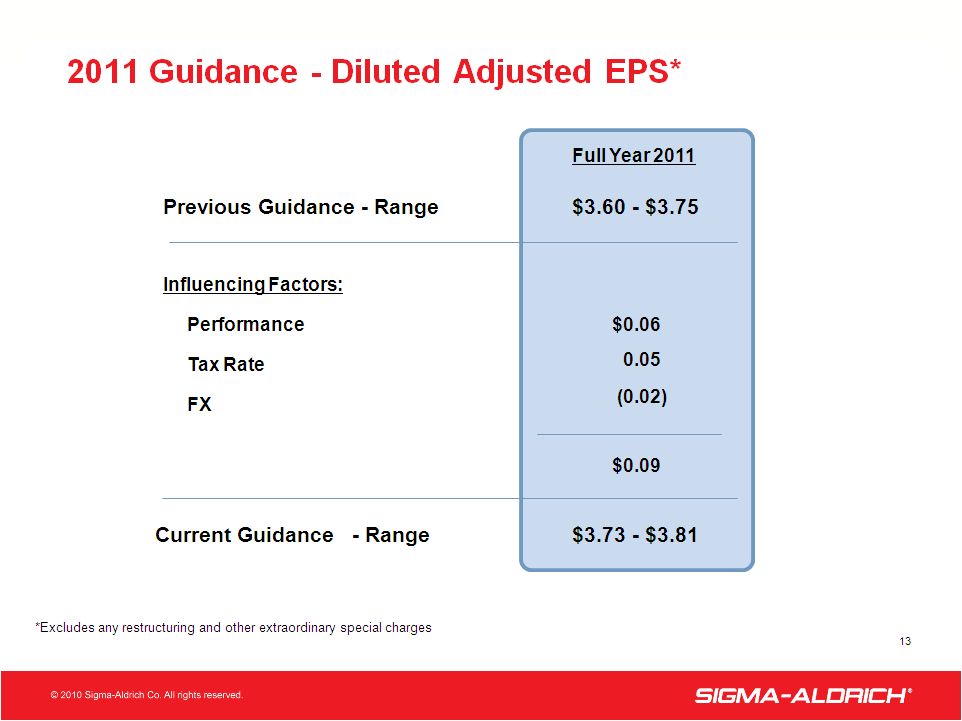 2011
Guidance - Diluted Adjusted EPS* |
 14
QUESTIONS?
Sigma-Aldrich Corporation
Q3 2011 Earnings Review |
 15
Appendix
Reconciliation of GAAP to Non-GAAP
Financial Measures |
 16
Reconciliation of Reported Net Income and Diluted Earnings
Per Share to Adjusted Net Income and Adjusted Diluted
Earnings Per Share (Unaudited)
2011
2010
2011
2010
Reported net income
117
$
93
$
0.95
$
0.76
$
Restructuring costs
1
3
0.01
0.02
Impairment costs
-
7
-
0.05
Adjusted net income
118
$
103
$
0.96
$
0.83
$
2011
2010
2011
2010
Reported net income
349
$
290
$
2.84
$
2.36
$
Restructuring costs
5
9
0.04
0.07
Impairment costs
-
7
-
0.05
Adjusted net income
354
$
306
$
2.88
$
2.48
$
(in millions)
Per Share
Nine Months Ended
Nine Months Ended
Net Income
Diluted Earnings
Net Income
Diluted Earnings
(in millions)
Per Share
September 30,
September 30,
September 30,
September 30,
Three Months Ended
Three Months Ended |
 17
Reconciliation of Reported Operating Income Margin to
Adjusted Operating Income Margin (Unaudited)
2011
2010
2011
2010
Reported operating income margin
25.6%
23.4%
25.7%
24.9%
Restructuring costs
0.4%
0.7%
0.4%
0.8%
Impairment Costs
-
1.3%
-
0.4%
Operating income margin excluding restructuring
26.0%
25.4%
26.1%
26.1%
and impairment costs
Acquisitions
0.4%
0.4%
Adjusted operating income margin
26.4%
25.4%
26.5%
26.1%
Three Months Ended
Nine Months Ended
September 30,
September 30, |
 18
Reconciliation of Reported Sales Growth to Adjusted (Organic)
Sales Growth (Unaudited)
Three Months Ended September 30, 2011
Reported
FX Impact
Acquisitions
Organic
•
Analytical, Biology, Materials Science Sales
Growth 10-22%* 6-7%* 0-12%* 3-10%*
Geographic Growth
•
North
America
6%
–% 3%
3%
•
Europe
11%
9% –%
2%
•
Asia Pacific/Latin
America
22%
8% 5%
9%
•
Focus
Markets
–
India, China,
Brazil
46%
5%
16% 25% *Varies for individual
product areas |
 19
Reconciliation of Reported Sales Growth to Adjusted (Organic)
Sales Growth (Unaudited)
Currency
Acquisition
Adjusted
Reported
Benefit
Benefit
(Organic)
Research Essentials
15%
6%
3%
6%
Research
Specialties 12%
6%
4%
2%
Research
Biotech 12%
6%
-
6%
Research
Chemicals 13%
6%
3%
4%
SAFC
8%
4%
2%
2%
Total Customer
Sales 11%
5%
2%
4%
Currency
Acquisition
Adjusted
Reported
Benefit
Benefit
(Organic)
Research Essentials
13%
5%
2%
6%
Research
Specialties 11%
5%
3%
3%
Research
Biotech 10%
5%
-
5%
Research
Chemicals 12%
5%
3%
4%
SAFC
14%
4%
1%
9%
Total Customer
Sales 12%
5%
1%
6%
Ended September 30, 2011
Nine Months
Three Months
Ended September 30, 2011 |
 20
Reconciliation of Net Cash Provided by Operating Activities to
Free Cash Flow (Unaudited)
In millions
2011
2010
Net cash provided by operating activities
119
$
150
$
Less: Capital expenditures
(29)
(28)
Free cash flow
90
$
122
$
2011
2010
Net cash provided by operating activities
373
$
397
$
Less: Capital expenditures
(73)
(65)
Free cash flow
300
$
332
$
Three Months Ended
September 30,
September 30,
Nine Months Ended |