Attached files
| file | filename |
|---|---|
| 8-K - FORM 8-K - PEABODY ENERGY CORP | btu8k20111025b.htm |
Exhibit 99.1
 Macarthur Coal Acquisition
Investor Presentation
October 25, 2011
 Statement on Forward-Looking Information
Some of the following information contains forward-looking statements within the meaning of Section 27A of the Securities Act of 1933 and Section 21E of the Securities Exchange Act of 1934, as amended, and is intended to come within the safe-harbor protection provided by those sections.
Our forward-looking statements are based on numerous assumptions that the company believes are reasonable, but they are open to a wide range of uncertainties and business risks that may cause actual results to differ materially from expectations as of October 25, 2011. These factors are difficult to accurately predict and may be beyond the company's control. The company does not undertake to update its forward-looking statements. Factors that could affect the company's results include, but are not limited to: demand for coal in the United States and the seaborne thermal and metallurgical coal markets; price volatility and demand, particularly in higher-margin products and in our trading and brokerage businesses; impact of weather and natural disasters on demand, production and transportation; reductions and/or deferrals of purchases by major customers and ability to renew sales contracts; credit and performance risks associated with customers, suppliers, co-shippers, trading, banks and other financial counterparties; geologic, equipment, permitting and operational risks related to mining; transportation availability, performance and costs; availability, timing of delivery and costs of key supplies, capital equipment or commodities such as diesel fuel, steel, explosives and tires; successful implementation of business strategies, including our Btu Conversion and generation development initiatives; negotiation of labor contracts, employee relations and workforce availability; changes in postretirement benefit and pension obligations and funding requirements; replacement and development of coal reserves; availability, access to and the related cost of capital and financial markets; effects of changes in interest rates and currency exchange rates (primarily the Australian dollar); ability to fund, complete, and integrate Macarthur and other acquisitions; economic strength and political stability of countries in which we have operations or serve customers; legislation, regulations and court decisions or other government actions, including new environmental and mine safety requirements, changes in income tax regulations or other regulatory taxes; litigation, including claims not yet asserted; and other risks detailed in the company's reports filed with the Securities and Exchange Commission (SEC). The use of “Peabody,” “the company,” and “our” relate to Peabody, its subsidiaries and majority-owned affiliates.
EBITDA or Adjusted EBITDA is defined as income from continuing operations before deducting net interest expense, income taxes, asset retirement obligation expense, and depreciation, depletion and amortization. EBITDA, which is not calculated identically by all companies, is not a substitute for operating income, net income or cash flow as determined in accordance with United States generally accepted accounting principles. Management uses EBITDA as a key measure of operating performance and also believes it is a useful indicator of the company's ability to meet debt service and capital expenditure requirements.
Adjusted EPS is defined as diluted earnings per share excluding the impact of the remeasurement of foreign income tax accounts. Management has included this measurement because, in management's opinion, excluding such impact is a better indicator of the company's ongoing effective tax rate and diluted earnings per share, and is therefore more useful in comparing the company's results with prior and future periods.
10/25/11
2
 Topics
Transaction Overview
Growing Market for Metallurgical and PCI Coal
Macarthur Production and Growth Profile
Peabody's New Australia Platform
Transaction Financing
Next Steps
3

Overview of Acquisition of Macarthur Coal (ASX: MCC)
Transaction Description Purchase of up to 100% of the shares of Macarthur Coal
Transaction Structure Takeover under Australian securities law
Equity Purchase Price A$16.00 per share x 302 million shares = A$4.8 billion; US$5.0 billion A$16.25 per share if 90% relevant interest = A$4.9 billion; US$5.1 billion
Peabody Share Up to 100% (ArcelorMittal intends to sell 40% interest)
Financing Cash and debt
Status Control achieved; Offer now declared unconditional Offer period open to Nov. 11, 2011
Sales Macarthur: 4.2 Mt in FY 2011 from two active mines Guidance of 5.5 - 5.8 Mt in FY 2012 (ending June 30)
Growth Platform Expanding mines and new growth projects Reserves of 286 MT on 100% basis (184 MT attributable basis); Resources of 2.6 BT on 100% basis (1.9 BT attributable basis)
US$ conversion assumes currency exchange of 1.04 AUD:USD; Tons shown in short tons, unless otherwise noted; Reserves and resources based on Macarthur June 30, 2011 reporting using JORC basis; FY refers to fiscal year ended June 30; Ownership references and other data about the acquisition is as of October 25, 2011.
4
 Acquisition Adds Benchmark PCI Supply And Significant Growth Projects
Creates synergies with existing base
Increases access to highest growth regions
Expands pipeline of growth opportunities
Extends resource base for future development
Expected to be earning
a year
5
 Transaction Valued on Major Growth Profile and Large Resource Base
Price Competitive With Comparable Australian Transactions
Enterprise Value per Resource Ton Macarthur Acquisition at A$16/Share US$2.44/t Average Australia Transaction Multiple US$2.40/t
EV/EBITDA 1 year forward Macarthur Acquisition 10.5x Average Transaction Multiple 12.6x 2 years forward Macarthur Acquisition 9.1x Average Transaction Multiple 9.2x
Source: UBS. US$ conversion assumes currency exchange of 1.04 AUD:USD; Based on Australian market precedent transactions since 2008 involving coal assets in production or ramp up stage and for which consensus estimates are available; Based on consensus estimates of forward EBITDA at the time the transactions were announced (IBES estimates); If 90% acceptance, price moves to $16.25/share
6
 The Market: Met Coal Use Expected to Rise >500 Million Tonnes by 2020
Global Met Coal Demand (Tonnes in Millions) 2010 920 2015 1185 2020 1440 Growth ~30% ~60% CAGR ~5% ~5%
Global PCI Market Also Growing at 5% CAGR
Source: Peabody Global Energy Analytics.
7
 PCI in Growing Demand from Global Steel Producers
 PCI Overview
Pulverized Coal Injection (PCI) a replacement for coke made from coking coal
Steelmakers trying to expand PCI use to reduce costs
Majority of high quality, low-vol PCI supply from Australia
Low-vol PCI typically priced at 70% to 80% of HQ Hard Coking Coal Q4 settlement at $208/tonne
STEEL MAKING PROCESS USING LV PCI COAL COKING COAL COKE OVEN COKE IRON ORE FLUX HOT AIR LV PCI COAL BLAST FURNACE SLAG PIG IRON STEEL PRODUCTION
Source: Macarthur Coal
8
 Macarthur: Active Production Base With Major Growth Pipeline
Queensland Abbott Point Dalrymple Bay Gladstone Wiggins Island Burton North Goonyella Eaglefield Millennium Olive Downs Coppabella Moorvale Codrilla Vermont East Middlemount BTU Met Coal Mine Port MCC Mine MCC Development
Producing mines million short tons Coppabella Resources 100% 214 Attributable 157 Reserves 65 48 Production FY 2011 2.3 Moorvale 126 93 47 34 1.9
Announced Projects Middlemount 135 68 106 53 0 Codrilla 88 64 55 40 0
Development Projects Vermont East / Wilunga 541 466 TBD TBD 0 Olive Downs North 140 103 13 9 0 Olive Downs South 300 270 TBD TBD 0
Exploration / Concept Projects Potential exploration projects provide additional resources of more than 1 billion tons (100% basis) or 720 million tons (attributable basis).
Macarthur data based on June 30, 2011 public filings; Resources and reserves shown on a JORC basis and converted to short tons.
9
 Mines Produce Leading Seaborne Low-Vol PCI Supply
Mines Produce Leading Seaborne Low-Vol PCI Supply
Coppabella open-cut mine; benchmark low-vol PCI product
Produced 2.3 million tons FY 2011; 3.0 million tons FY 2010
Moorvale open-cut mine
Produced 1.9 million tons in FY 2011; 2.6 million tons FY 2010
MCC targets Middlemount saleable tons of 0.8 to 0.9 million tons in FY 2012 as it ramps up
Macarthur Targeting Fiscal Year 2012 Sales of 5.5 - 5.8 Million Tons
Information based on Macarthur June 30, 2011 public filings and production guidance for the fiscal year ended June 30, 2012; ultimate production and timing subject to future investments and other factors; Volumes converted to short tons.
10
 Macarthur Expands Peabody's Australian Reserve Base
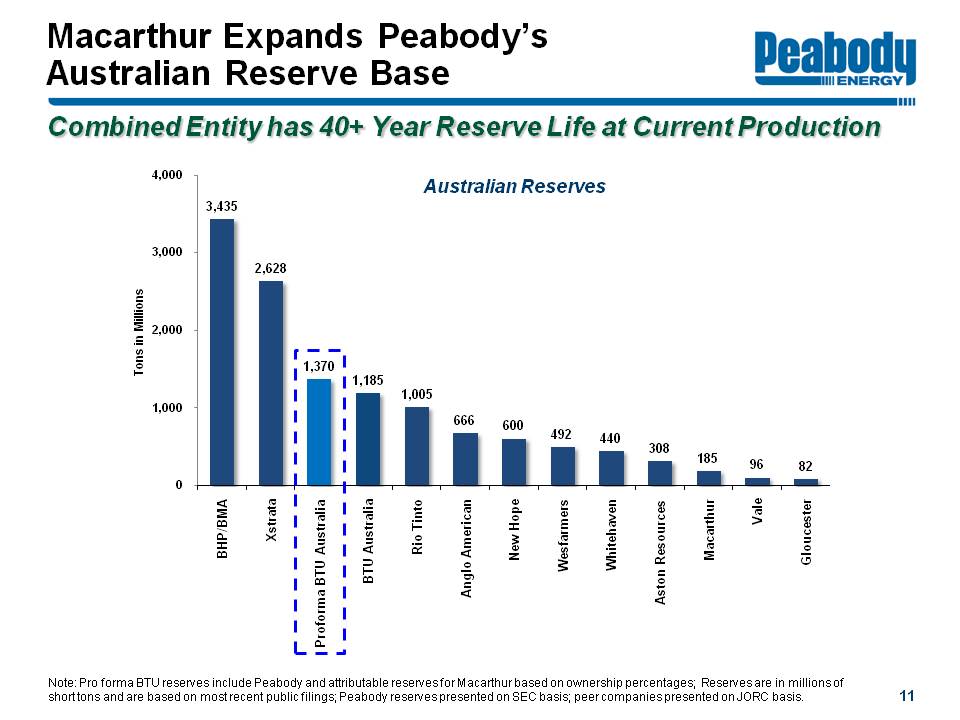
Combined Entity has 40+ Year Reserve Life at Current Production
Australian Reserves
Tons in Millions
BHP/BMA 3,435
Xstrata 2,628
ProformaBTU Australia 1,370
BTUAustralia 1,185
Rio Tinto 1,005
Anglo American 666
New Hope 600
Wesfarmers 492
Whitehaven 440
Aston Resources 308
Macarthur 185
Vale 96
Gloucester 82
Note: Pro forma BTU reserves include Peabody and attributable reserves for Macarthur based on ownership percentages; Reserves are in millions of short tons and are based on most recent public filings; Peabody reserves presented on SEC basis; peer companies presented on JORC basis.
11
 Transaction Significantly Strengthens Peabody's Position in Australia
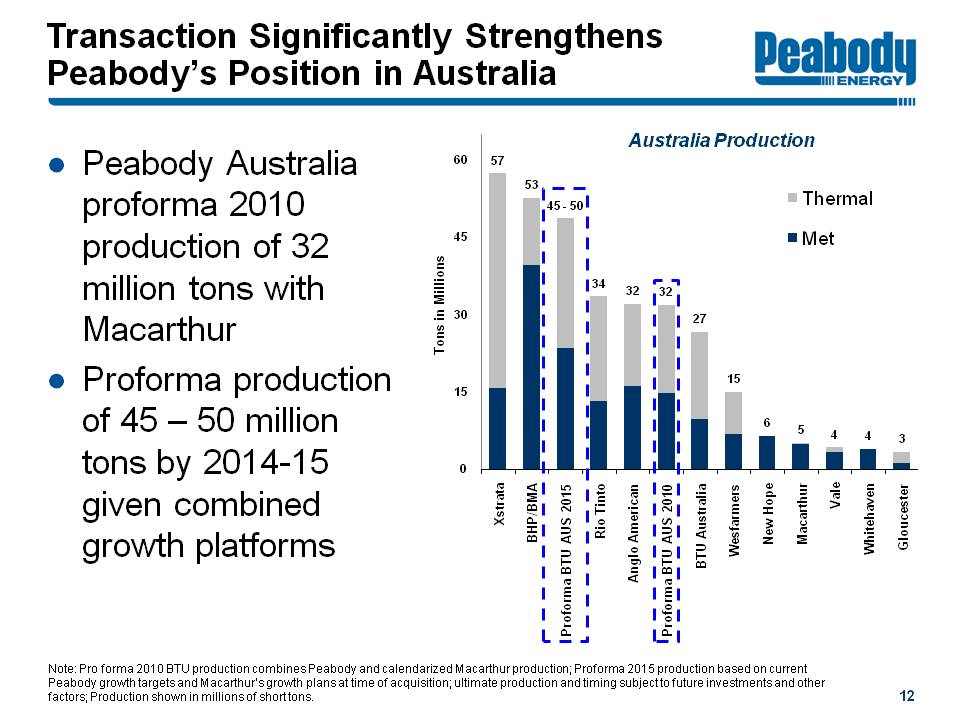
Peabody Australia proforma 2010 production of 32 million tons with Macarthur
Proforma production of 45 - 50 million tons by 2014-15 given combined growth platforms
Australian Production
Thermal
Met
Tons in Millions
Xstrata 57
BHP/BMA 53
ProformaBTU Australia2015 45-50
Rio Tinto 34
Anglo American 32
ProformaBTU Australia2010 32
BTU Australia 27
Wesfarmers 15
New Hope 6
Macarthur 5
Vale 4
Whitehaven 4
Gloucester 3
Note: Pro forma 2010 BTU production combines Peabody and calendarized Macarthur production; Proforma 2015 production based on current Peabody growth targets and Macarthur's growth plans at time of acquisition; ultimate production and timing subject to future investments and other factors; Production shown in millions of short tons.
12
 Macarthur's Production Base Expected to Grow to 10 Million Tons by FY 2014
Peabody/Macarthur Proforma Met Volumes: 22 - 25 MTPY* by 2014-2015
Projected Coal Sales Target For FY2014
Mt (MCC attributable share)
Coppabella & Moorvale
Middlemount
Codrilla
Sales Target 9.2Mt
Macarthur has the assets, operational capability, strong balance sheet and access to port capacity to meet its 9.2Mtpa sales target by 30 June 2014.
Source: Macarthur Coal FY11 Annual Report; Volumes in Metric Tons
Information based on Macarthur plans at time of acquisition; ultimate production and timing subject to future investments and other factors. *MTPY represents million short tons per year, calculated using Macarthur's 10 million short ton target and Peabody's 12 to 15 million short ton target.
13
 Macarthur: Significant Planned Pipeline of Growth
Significant Development Pipeline
Vermont East
West Walker
Capricorn
North/West Burton
Yeerun R
West Rolleston R
Olive Downs South
Coppabella Underground
Moorvale West
MDL 162 *
Willunga * R
Moorvale Underground
Monto *
Olive Downs North
Codrilla R selected as 4th mine project
Middlemount R
Coppabella
Moorvale
Exploration/Concept
Pre-feasibility Study
Feasibility study
Development
Operating assets
Future potential projects
Potential future project or extension of existing assets
Extends life of existing operating assets or operating mines
Current entitlement to convert loan to a 90% interest of MDL 162 2
R Increase in JORC resource or reserve (announced in last 12 months)
* Advance pre-feasibility study stage
Source: Macarthur Coal FY11 Results Presentation
Information based on Macarthur public filings and production guidance; ultimate production and timing subject to future investments and other factors.
14
 Fully Financed With Cash and Debt; Debt Levels Very Manageable
Funding expected from cash and additional debt
Funded leverage within targeted debt-to-cap ranges
Peabody's Debt-to-Capital Ratio (%)
Target Zone: 40 - 60
2006* 57
2007 52
2008 47
2009 42
2010 37
9/2011 32
Post-MCC Expected Leverage: Mid 50% Range
Sufficient Cash and Debt to Fund Macarthur Transaction
Debt-to-cap calculations above assume 100% ownership in Macarthur (ultimate funding levels and debt-to-cap percentage dependent upon ownership percentage achieved). *2006 ratio reflects proforma June 30, 2006 data used at the time of the Excel Coal acquisition.
15
 Macarthur Acquisition: Next Steps
Complete acquisition and implement transition plan
Achieve synergies
Operational performance
Supply chain efficiencies
Marketing/blending potential
Improve mining plan and equipment efficiency at Coppabella Mine in coming months
Advance growth projects to build production pipeline
16
 Acquisition Delivers Value Via Increased Global Access, Earnings Expansion
Macarthur acquisition expands Peabody's presence with quality met product in high-growth region
Provides major growth opportunities, large reserve base and significant potential synergies
Continues global buildout and earnings contribution from international assets
17
 Macarthur Coal Acquisition
18