Attached files
| file | filename |
|---|---|
| 8-K - CURRENT REPORT ON FORM 8-K - PACCAR INC | d245327d8k.htm |
Exhibit 99.1

|
PACCAR Inc Public Affairs Department P.O. Box 1518 Bellevue, WA 98009 |
| Contact: | Robin Easton (425) 468-7676
|
FOR IMMEDIATE RELEASE
PACCAR Achieves Record Quarterly Revenues
Global Business Initiatives Accelerate
October 25, 2011, Bellevue, Washington – “PACCAR reported strong quarterly revenues and net income for the third quarter of 2011. PACCAR’s third quarter revenues of $4.26 billion were the highest quarterly revenues in company history,” said Mark Pigott, chairman and chief executive officer. “Increased truck deliveries, higher aftermarket sales and a growing financial services business worldwide contributed to increased profits. Our customers in North America are benefiting from increased freight tonnage and higher fleet utilization which are driving the replacement of their aging fleets, resulting in increased demand for PACCAR products and services. European truck registrations have improved versus 2010, but recent Eurozone economic uncertainties have resulted in lower industry truck orders. I am very proud of our 23,000 employees who have delivered industry leading products and services to our customers worldwide.”
“PACCAR’s excellent balance sheet, including $2.73 billion in manufacturing cash and marketable securities, and operating cash flow of over $1.15 billion in 2011 have enabled ongoing investments which extend PACCAR’s geographic presence, enhance operating efficiency and support the development of innovative new products. These investments will contribute to the company’s long-term growth,” said Pigott. “Suppliers’ performance has improved significantly as they have invested in capacity and production efficiency to meet increased market demand.”
PACCAR earned $281.6 million ($.77 per diluted share) for the third quarter of 2011, a 135% increase, compared to the $119.9 million ($.33 per diluted share) earned in the third quarter last year. Third quarter net sales and financial services revenues were a record $4.26 billion compared to $2.54 billion in 2010. Net sales and financial services revenues for the first nine months of 2011 were $11.50 billion compared to $7.24 billion in the prior year. For the first nine months of 2011, PACCAR reported net income of $714.6 million ($1.95 per diluted share) more than double the $287.8 million ($.79 per diluted share) earned in the first nine months of 2010.
Global Truck Markets
DAF’s premium-quality vehicles have achieved industry leadership in many countries in Europe. “DAF is the market share leader in European tractor sales with over 19 percent market share,” said Harrie Schippers, DAF president. “DAF achieved a market share in the above 15-tonne market of 15.2 percent for the first nine months of 2011. The estimate for 2011 industry sales in the above 15-tonne truck market in Europe is 235,000-245,000 units. It is anticipated that industry sales in 2012 will be in the range of 225,000-250,000 units,” said Schippers.
“Class 8 industry retail sales in the U.S. and Canada are expected to be in the range of 185,000-200,000 vehicles in 2011. Our customers are benefiting from higher freight tonnage and improved freight rates,” said Dan Sobic, PACCAR executive vice president. “For the first nine months of 2011, PACCAR achieved a record Class 8 retail market share in the U.S. and Canada of 27.7 percent as customers benefited from Kenworth and Peterbilt vehicles’ low operating cost advantage. Estimates for industry Class 8 retail sales in 2012 are in the range of 205,000-230,000 units, driven primarily by ongoing replacement of the aging fleet. Annual replacement demand for the U.S. and Canadian truck market is approximately 225,000 units,” added Sobic.
Financial Highlights – Third Quarter 2011
Highlights of PACCAR’s financial results during the third quarter of 2011 include:
| • | Record quarterly consolidated sales and revenues of $4.26 billion. |
| • | Net income of $281.6 million. |
| • | Manufacturing cash and marketable securities of $2.73 billion. |
| • | Cash generated from operations of $359.3 million. |
| • | Financial Services pretax income of $61.8 million. |
| • | Research and development expenses of $70.0 million. |
| • | Repurchase of 7.38 million common shares for $270.0 million. |
| • | Medium-term note issuances of $500.0 million. |
| • | Moody’s improved PACCAR’s debt rating outlook to stable. |
Financial Highlights – Nine Months 2011
Financial highlights for the first nine months of 2011 include:
| • | Consolidated sales and revenues of $11.50 billion. |
| • | Net income of $714.6 million. |
| • | Cash generated from operations of $1.15 billion. |
| • | Financial Services pretax income of $169.0 million on assets of $8.83 billion. |
| • | Research and development expenses of $215.9 million. |
| • | Capital investments of $358.3 million. |
| • | Medium-term note issuances of $982 million. |
Share Repurchase Update
During the third quarter of 2011, PACCAR repurchased 7.38 million of its common shares for $270.0 million. PACCAR had 358.1 million outstanding common shares as of September 30, 2011. “PACCAR’s excellent net profits and strong cash flow make the company’s shares an attractive investment,” said Ron Armstrong, PACCAR president. PACCAR has earned a profit for 72 consecutive years and has paid a dividend every year since 1941.
Improved South American Business
In August, PACCAR announced plans to construct its new DAF Brasil assembly facility on a 569-acre site in the city of Ponta Grossa in the state of Paraná. “PACCAR is pleased to invest $200 million in its DAF facility in the dynamic and progressive state of Paraná,” commented Bob Christensen, PACCAR executive vice president. Construction of the 330,000-square-foot assembly facility is projected to begin later this year and be completed in 2013. The new facility will be designed to assemble the DAF LF, CF and XF models, to meet current and future requirements of the Brasilian transport industry. “The Brasil truck market over six tons is 170,000 units and is expected to grow in coming years,” added Christensen.

DAF CF85 in Sao Paulo, Brasil
PACCAR continues to grow throughout South America. PACCAR has earned a significant market share in many of the South American countries west of the Andes for over 40 years with its Kenworth vehicles. In 2010, PACCAR opened a parts distribution center in Santiago, Chile. Through September 2011, PACCAR achieved approximately 40% Class 8 market share in Colombia, launched the DAF CF range in the Andean region, and achieved strong South American truck sales.
PACCAR China
PACCAR’s Shanghai office was expanded in 2011 to support increased component purchases for production and aftermarket operations. PACCAR has also achieved higher sales of PACCAR engines to Chinese bus and coach manufacturers. “China is the largest truck market in the world and PACCAR is benefiting from its expanded presence in the region,” said Dan Sobic, PACCAR executive vice president. “DAF continues to expand in Taiwan and is now the second largest truck manufacturer in the above 15-tonne segment with a 27% market share.”
PACCAR India Technical Center
PACCAR recently launched its new PACCAR Technical Center in Pune, India. The center will eventually have approximately 200 employees and will focus on engineering, information technology, and component sourcing for worldwide production and aftermarket operations. “The PACCAR India Technical Center will deliver quality resources to our global engineering and IT organizations, and enable PACCAR to accelerate new product development,” said Todd Coulter, PACCAR India executive director.
European Growth
In August, DAF entered into a contract to acquire 19% ownership in TATRA a.s. based in the Czech Republic. TATRA produces a range of versatile, off-road vehicles which will be sold by DAF dealers throughout Europe, complementing DAF’s premium range of construction vehicles. As a part of this agreement, DAF will supply TATRA with the PACCAR MX engine and the DAF CF cab. “DAF’s relationship with TATRA will further strengthen DAF’s industry-leading position in the heavy-duty truck segment in Central Europe,” said Harrie Schippers, DAF president.
Environmental Leadership
In September, Peterbilt Motors received Environmental Protection Agency (EPA) accreditation for the industry’s first SmartWay designated alternative fuel vehicle. Peterbilt’s Model 386 liquefied natural gas (LNG) vehicle joins the Peterbilt family of SmartWay designated vehicles, including the Model 587 and Model 384. “Peterbilt is proud that the Model 386 LNG has been recognized as the industry’s first alternative fuel vehicle to obtain SmartWay designation,” said Bill Jackson, Peterbilt general manager.
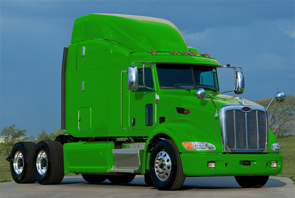
Peterbilt Model 386 LNG
Financial Services Companies Achieve Strong Results
PACCAR Financial Services (PFS) has a portfolio of over 139,000 trucks and trailers, with total assets of $8.83 billion. PACCAR Leasing, a major full-service truck leasing company in North America and Europe, with a fleet of over 31,000 vehicles, is included in this segment. “During the third quarter and first nine months of 2011, profit increased as a result of better finance margins and improved portfolio performance,” said Bob Bengston, PACCAR vice president. Third quarter pretax income was $61.8 million compared to the $41.5 million earned in the third quarter last year. Finance margin increased in the third quarter of 2011 to $96.5 million versus $76.3 million in the third quarter of 2010 due to growth in the portfolio, higher used truck prices and lower borrowing costs. Third quarter revenues were $264.1 million compared to $238.3 million in the same quarter of 2010. For the nine-month period, revenues were $763.1 million compared to $724.0 million during the same period a year ago and pretax income was $169.0 million compared with $103.6 million in 2010.
“PACCAR’s excellent balance sheet, complemented by its A+/A1 credit ratings, enables PFS to offer competitive retail financing to Kenworth, Peterbilt and DAF dealers and customers in 20 countries on three continents,” said Todd Hubbard, PACCAR Financial president. “Higher freight volumes and increasing freight rates have improved our customers’ profitability leading to lower past dues and provisions for credit losses compared to 2010. Used truck prices also continue to improve from prior year levels by 15-20 percent.”
Capital Investments, Product Development and Industry Recognition
PACCAR’s innovative application of information technology earned the company the #1 technology position in InformationWeek magazine’s 2011 Top 500 company listing. PACCAR earned the recognition as a result of the development of its new TruckerLink application that builds upon the PACCAR Connected Truck program. The TruckerLink product, developed in partnership with Signalset, delivers advanced “carrier-switching” technology that enables a truck’s telematics system to operate seamlessly nationwide with uninterrupted coverage on multiple wireless
networks. “The TruckerLink application is a state-of-the-art truck tracking solution that provides advanced fleet management and vehicle monitoring capabilities,” shared Kyle Quinn, PACCAR chief information officer. “The solution is integrated with PACCAR’s in-dash telematics, truck navigation, and driver support systems.”
PACCAR’s excellent long-term profits, strong balance sheet and intense focus on quality, technology and productivity have enabled the company to invest $4.4 billion in capital projects, innovative products and new technologies during the past decade. In 2011, capital investments of $450-$500 million and research and development expenses of $280-$300 million are being invested in new PACCAR products. PACCAR is planning to increase capital investments in 2012 for product development programs and construction of the DAF factory in Brasil. “Capital expenditures are projected to be $450-$550 million and research and development expenses are estimated at $275-$325 million in 2012 as Kenworth, Peterbilt and DAF invest in industry-leading products and services to enable our customers to continue to deliver profitable results in their businesses,” said George West, PACCAR vice president.
Leyland Trucks was awarded the prestigious Shingo Bronze Medallion. BusinessWeek magazine has described the Shingo Prize for Manufacturing Excellence as “the Nobel prize of manufacturing.” The Shingo Prize was established in 1988 to educate, assess and recognize world-class organizations for creating a culture of continuous improvement through employee-empowerment and effective leadership. “The award reflects the dedication and commitment of Leyland Trucks’ employees who produce high quality DAF Trucks for the global market,” said Andrea Thompson, Leyland Trucks managing director.
PACCAR is a global technology leader in the design, manufacture and customer support of high-quality light- medium-, and heavy-duty trucks under the Kenworth, Peterbilt and DAF nameplates. PACCAR also designs and manufactures advanced diesel engines and provides financial services and information technology and distributes truck parts related to its principal business.
PACCAR will hold a conference call with securities analysts to discuss third quarter earnings on October 25, 2011, at 9:00 a.m. Pacific time. Interested parties may listen to the call by selecting “Live Webcast” at PACCAR’s homepage. The Webcast will be available on a recorded basis through November 4, 2011. PACCAR shares are listed on the NASDAQ Global Select Market, symbol PCAR, and its homepage can be found at www.paccar.com.
This release contains “forward-looking statements” within the meaning of the Private Securities Litigation Reform Act. These statements are based on management’s current expectations and are subject to uncertainty and changes in circumstances. Actual results may differ materially from those included in these statements due to a variety of factors. More information about these factors is contained in PACCAR’s filings with the Securities and Exchange Commission.
# # #
PACCAR Inc
SUMMARY INCOME STATEMENTS
(in millions except per share amounts)
| Three Months Ended September 30 |
Nine Months Ended September 30 |
|||||||||||||||
| 2011 | 2010 | 2011 | 2010 | |||||||||||||
| Truck and Other: |
||||||||||||||||
| Net sales and revenues |
$ | 3,993.0 | $ | 2,304.2 | $ | 10,738.3 | $ | 6,513.3 | ||||||||
| Cost of sales and revenues |
3,484.0 | 2,019.2 | 9,347.4 | 5,741.9 | ||||||||||||
| Research and development |
70.0 | 59.9 | 215.9 | 173.1 | ||||||||||||
| Selling, general and administrative |
113.1 | 94.3 | 331.6 | 285.7 | ||||||||||||
| Interest and other expense, net |
4.0 | 1.0 | 7.1 | 9.1 | ||||||||||||
|
|
|
|
|
|
|
|
|
|||||||||
| Truck and Other Income Before Income Taxes |
321.9 | 129.8 | 836.3 | 303.5 | ||||||||||||
| Financial Services: |
||||||||||||||||
| Revenues |
264.1 | 238.3 | 763.1 | 724.0 | ||||||||||||
| Interest and other |
167.6 | 162.0 | 490.1 | 505.8 | ||||||||||||
| Selling, general and administrative |
24.0 | 21.9 | 71.8 | 65.9 | ||||||||||||
| Provision for losses on receivables |
10.7 | 12.9 | 32.2 | 48.7 | ||||||||||||
|
|
|
|
|
|
|
|
|
|||||||||
| Financial Services Income Before Income Taxes |
61.8 | 41.5 | 169.0 | 103.6 | ||||||||||||
| Investment income |
11.0 | 5.5 | 28.9 | 14.3 | ||||||||||||
|
|
|
|
|
|
|
|
|
|||||||||
| Total Income Before Income Taxes |
394.7 | 176.8 | 1,034.2 | 421.4 | ||||||||||||
| Income taxes |
113.1 | 56.9 | 319.6 | 133.6 | ||||||||||||
|
|
|
|
|
|
|
|
|
|||||||||
| Net Income |
$ | 281.6 | $ | 119.9 | $ | 714.6 | $ | 287.8 | ||||||||
|
|
|
|
|
|
|
|
|
|||||||||
| Net Income Per Share: |
||||||||||||||||
| Basic |
$ | .78 | $ | .33 | $ | 1.96 | $ | .79 | ||||||||
|
|
|
|
|
|
|
|
|
|||||||||
| Diluted |
$ | .77 | $ | .33 | $ | 1.95 | $ | .79 | ||||||||
|
|
|
|
|
|
|
|
|
|||||||||
| Weighted Average Shares Outstanding: |
||||||||||||||||
| Basic |
363.3 | 364.9 | 365.0 | 364.8 | ||||||||||||
|
|
|
|
|
|
|
|
|
|||||||||
| Diluted |
364.2 | 366.1 | 366.2 | 365.9 | ||||||||||||
|
|
|
|
|
|
|
|
|
|||||||||
| Dividends declared per share |
$ | .18 | $ | .09 | $ | .42 | $ | .27 | ||||||||
|
|
|
|
|
|
|
|
|
|||||||||
PACCAR Inc
CONDENSED BALANCE SHEETS
(in millions)
| September 30 2011 |
December 31 2010 |
|||||||
| ASSETS |
||||||||
| Truck and Other: |
||||||||
| Cash and marketable debt securities |
$ | 2,729.7 | $ | 2,432.5 | ||||
| Trade and other receivables, net |
1,015.2 | 610.4 | ||||||
| Inventories |
725.1 | 534.0 | ||||||
| Property, plant, and equipment, net |
1,867.8 | 1,673.7 | ||||||
| Equipment on operating lease and other |
1,182.5 | 1,105.3 | ||||||
| Financial Services Assets |
8,834.0 | 7,878.2 | ||||||
|
|
|
|
|
|||||
| $ | 16,354.3 | $ | 14,234.1 | |||||
|
|
|
|
|
|||||
| LIABILITIES AND STOCKHOLDERS’ EQUITY |
||||||||
| Truck and Other: |
||||||||
| Accounts payable, deferred revenues and other |
$ | 3,549.5 | $ | 2,634.1 | ||||
| Long-term debt |
150.0 | 150.0 | ||||||
| Financial Services Liabilities |
7,060.9 | 6,092.2 | ||||||
| STOCKHOLDERS’ EQUITY |
5,593.9 | 5,357.8 | ||||||
|
|
|
|
|
|||||
| $ | 16,354.3 | $ | 14,234.1 | |||||
|
|
|
|
|
|||||
| Common Shares Outstanding |
358.1 | 365.3 | ||||||
|
|
|
|
|
|||||
GEOGRAPHIC REVENUE DATA
| Three Months Ended September 30 |
Nine Months Ended September 30 |
|||||||||||||||
| 2011 | 2010 | 2011 | 2010 | |||||||||||||
| United States and Canada |
$ | 2,352.9 | $ | 1,307.0 | $ | 6,019.3 | $ | 3,674.8 | ||||||||
| Europe |
1,264.2 | 771.1 | 3,756.5 | 2,333.6 | ||||||||||||
| Other |
640.0 | 464.4 | 1,725.6 | 1,228.9 | ||||||||||||
|
|
|
|
|
|
|
|
|
|||||||||
| $ | 4,257.1 | $ | 2,542.5 | $ | 11,501.4 | $ | 7,237.3 | |||||||||
|
|
|
|
|
|
|
|
|
|||||||||
PACCAR Inc
CONDENSED CASH FLOW STATEMENTS
(in millions)
| Nine Months Ended September 30 |
2011 | 2010 | ||||||
| OPERATING ACTIVITIES: |
||||||||
| Net income |
$ | 714.6 | $ | 287.8 | ||||
| Depreciation and amortization: |
||||||||
| Property, plant and equipment |
146.4 | 142.2 | ||||||
| Equipment on operating leases and other |
359.3 | 319.3 | ||||||
| Net (increase) decrease in wholesale receivables on new trucks |
(429.1 | ) | 75.5 | |||||
| Net (increase) decrease in sales-type finance leases and dealer direct loans on new trucks |
(18.6 | ) | 101.2 | |||||
| All other operating activities |
378.7 | 236.8 | ||||||
|
|
|
|
|
|||||
| Net Cash Provided by Operating Activities |
1,151.3 | 1,162.8 | ||||||
| INVESTING ACTIVITIES: |
||||||||
| Acquisition of property, plant and equipment |
(214.7 | ) | (115.8 | ) | ||||
| Acquisition of equipment for operating leases |
(1,013.6 | ) | (478.4 | ) | ||||
| Net (increase) decrease in financial services receivables |
(321.7 | ) | 407.6 | |||||
| Net increase in marketable securities |
(473.1 | ) | (137.5 | ) | ||||
| All other investing activities |
237.8 | 167.3 | ||||||
|
|
|
|
|
|||||
| Net Cash Used in Investing Activities |
(1,785.3 | ) | (156.8 | ) | ||||
| FINANCING ACTIVITIES: |
||||||||
| Cash dividends paid |
(153.1 | ) | (98.3 | ) | ||||
| Purchase of treasury stock |
(250.2 | ) | ||||||
| Stock compensation transactions |
4.4 | 9.8 | ||||||
| Net increase (decrease) in debt |
911.2 | (772.8 | ) | |||||
|
|
|
|
|
|||||
| Net Cash Provided by (Used in) Financing Activities |
512.3 | (861.3 | ) | |||||
| Effect of exchange rate changes on cash |
(39.5 | ) | .5 | |||||
|
|
|
|
|
|||||
| Net (Decrease) Increase in Cash and Cash Equivalents |
(161.2 | ) | 145.2 | |||||
| Cash and cash equivalents at beginning of period |
2,040.8 | 1,912.0 | ||||||
|
|
|
|
|
|||||
| Cash and cash equivalents at end of period |
$ | 1,879.6 | $ | 2,057.2 | ||||
|
|
|
|
|
|||||