Attached files
| file | filename |
|---|---|
| EX-23.1 - CONSENT OF PRICEWATERHOUSECOOPERS LLP - GCT SEMICONDUCTOR INC | d211280dex231.htm |
| EX-10.40 - SECOND AMENDMENT TO PROMISSORY NOTE - GCT SEMICONDUCTOR INC | d211280dex1040.htm |
Table of Contents
As filed with the Securities and Exchange Commission on October 25, 2011
Registration No. 333 -176845
UNITED STATES
SECURITIES AND EXCHANGE COMMISSION
Washington, D.C. 20549
AMENDMENT NO. 1
To
FORM S-1
REGISTRATION STATEMENT
UNDER
THE SECURITIES ACT OF 1933
GCT SEMICONDUCTOR, INC.
(Exact name of registrant as specified in its charter)
| Delaware | 3674 | 94-3302894 | ||
| (State or other jurisdiction of incorporation or organization) |
(Primary Standard Industrial Classification Code Number) |
(I.R.S. Employer Identification Number) |
2121 Ringwood Avenue
San Jose, California 95131
(408) 434-6040
(Address, including zip code, and telephone number, including area code, of registrant’s principal executive offices)
Kyeongho Lee, Ph.D.
President and Chief Executive Officer
GCT Semiconductor, Inc.
2121 Ringwood Avenue
San Jose, California 95131
(408) 434-6040
(Name, address, including zip code, and telephone number, including area code, of agent for service)
Copies to:
| Thomas W. Kellerman, Esq. E. John Park, Esq. Albert Lung, Esq. Morgan, Lewis & Bockius LLP 2 Palo Alto Square 3000 El Camino Real, Suite 700 Palo Alto, California 94306 (650) 843-4000 |
Robert P. Latta, Esq. Mark Baudler, Esq. Rezwan Pavri, Esq. Wilson Sonsini Goodrich & Rosati, P.C. 650 Page Mill Road Palo Alto, California 94304 (650) 493-9300 |
Approximate date of commencement of proposed sale to the public: As soon as practicable after the effective date of this registration statement.
If any of the securities being registered on this Form are to be offered on a delayed or continuous basis pursuant to Rule 415 under the Securities Act of 1933, check the following box. ¨
If this Form is filed to register additional securities for an offering pursuant to Rule 462(b) under the Securities Act, check the following box and list the Securities Act registration statement number of the earlier effective registration statement for the same offering. ¨
If this Form is a post-effective amendment filed pursuant to Rule 462(c) under the Securities Act, check the following box and list the Securities Act registration statement number of the earlier effective registration statement for the same offering. ¨
If this Form is a post-effective amendment filed pursuant to Rule 462(d) under the Securities Act, check the following box and list the Securities Act registration number of the earlier effective registration statement for the same offering. ¨
Indicate by check mark whether the registrant is a large accelerated filer, an accelerated filer, a non-accelerated filer, or a smaller reporting company. See the definitions of “large accelerated filer,” “accelerated filer” and “smaller reporting company” in Rule 12b-2 of the Exchange Act (check one):
| Large accelerated filer | ¨ | Accelerated filer | ¨ | |||
| Non-accelerated filer | þ (Do not check if a smaller reporting company) | Smaller reporting company | ¨ |
The registrant hereby amends this registration statement on such date or dates as may be necessary to delay its effective date until the registrant shall file a further amendment that specifically states that this registration statement shall thereafter become effective in accordance with Section 8(a) of the Securities Act of 1933, as amended, or until the registration statement shall become effective on such date as the Securities and Exchange Commission, acting pursuant to said Section 8(a), may determine.
Table of Contents
The information in this preliminary prospectus is not complete and may be changed. We may not sell these securities until the registration statement filed with the Securities and Exchange Commission is effective. This preliminary prospectus is not an offer to sell these securities and we are not soliciting others to buy these securities in any jurisdiction where the offer or sale is not permitted.
Subject to Completion, dated October 25, 2011

Shares
GCT SEMICONDUCTOR, INC.
Common Stock
This is the initial public offering of shares of common stock of GCT Semiconductor, Inc.
GCT Semiconductor, Inc. is offering shares of its common stock.
Prior to this offering, there has been no public market for our common stock. We currently estimate that the initial public offering price per share will be between $ and $ . We intend to list our common stock on The NASDAQ Global Market under the symbol “GCTS.”
See “Risk Factors” on page 11 to read about factors you should consider before buying shares of our common stock.
Neither the Securities and Exchange Commission nor any state securities regulators has approved or disapproved of these securities or passed upon the accuracy or adequacy of this prospectus. Any representation to the contrary is a criminal offense.
| Per Share | Total | |||||||
| Initial public offering price |
$ | $ | ||||||
| Underwriting discount |
$ | $ | ||||||
| Proceeds, before expenses, to GCT Semiconductor, Inc. |
$ | $ | ||||||
To the extent that the underwriters sell more than shares of our common stock, the underwriters have the option to purchase up to an additional shares from us at the initial public offering price less the underwriting discount.
The underwriters expect to deliver the shares against payment in New York, New York on .
| Goldman, Sachs & Co. | BofA Merrill Lynch | |
| Cowen and Company | Oppenheimer & Co. | |
Prospectus dated , 2011.
Table of Contents

Table of Contents
| ii | ||||
| 1 | ||||
| 11 | ||||
| 34 | ||||
| 36 | ||||
| 39 | ||||
| 41 | ||||
| 44 | ||||
| Management’s Discussion and Analysis of Financial Condition and Results of Operations |
47 | |||
| 78 | ||||
| 94 | ||||
| 102 | ||||
| 130 | ||||
| 134 | ||||
| 137 | ||||
| 142 | ||||
| Material U.S. Federal Tax Considerations for Non-U.S. Holders |
145 | |||
| 149 | ||||
| 153 | ||||
| 153 | ||||
| 154 | ||||
| F-1 |
You should rely only on the information contained in this prospectus or in any free writing prospectus we may authorize to be delivered or made available to you. We have not, and the underwriters have not, authorized anyone to provide you with additional or different information. We are not, and the underwriters are not, making an offer to sell these securities in any jurisdiction where an offer or sale is not permitted. The information contained in this prospectus is accurate only as of the date of this prospectus, regardless of the time of delivery of this prospectus or any sale of shares of our common stock. Our business, financial condition, results of operations and prospects may have changed since that date.
Through and including , 2011 (the 25th day after the date of this prospectus), all dealers effecting transactions in these securities, whether or not participating in this offering, may be required to deliver a prospectus. This delivery requirement is in addition to the obligation of dealers to deliver a prospectus when acting as underwriters and with respect to their unsold allotments or subscriptions.
No action is being taken in any jurisdiction outside the United States to permit a public offering of our common stock or possession or distribution of this prospectus in that jurisdiction. Persons who come into possession of this prospectus in a jurisdiction outside the United States are required to inform themselves about, and to observe any restrictions as to, this offering and the distribution of this prospectus applicable to that jurisdiction.
i
Table of Contents
CONVENTIONS THAT APPLY TO THIS PROSPECTUS
All references in this prospectus to “GCT Semiconductor,” “GCT,” “we,” “us” or “our” are references to GCT Semiconductor, Inc., a Delaware corporation and its subsidiaries. References in this prospectus to:
| • | “4G” are to the fourth generation of cellular wireless standards. |
| • | “AMPS” are to Advanced Mobile Phone Service, one of the first modern analog cellular phone systems. |
| • | “GPRS” are to General Packet Radio Service, a packet-oriented wireless data service on the 3G and 2G cellular communication systems. |
| • | “kbps” are to kilobits per second, a unit of data transfer rate equal to 1,000 bits per second. |
| • | “KRW” are to Korean won, the currency of the Republic of Korea. |
| • | “LIBOR” are to London InterBank Offered Rate. |
| • | “LTE Advanced” are to Long Term Evolution Advanced, a wireless communication standard for 4G technology and a further evolution from the LTE standard. |
| • | “Mbps” are to megabits per second, a unit of data transfer rate equal to 1,000,000 bits per second. |
| • | “nm” are to nanometers, which is one billionth of a meter. |
| • | “Sdn Bhd” are to Sendirian Berhad, a form of business organization in Malaysia that is equivalent to a corporation in the United States. |
| • | “um” are to micrometer, which is one millionth of a meter. |
| • | “U.S.” are to the United States. |
| • | “WiMAX Forum” are to a not-for-profit organization that certifies and promotes the compatibility and interoperability of broadband wireless products based upon IEEE Standard 802.16. |
| • | “WLAN” are to wireless local area network, which links two or more devices using a certain type of wireless distribution method instead of traditional wired connections or cables. It is also commonly referred to as “WiFi”. |
We use various trademarks and trade names in our business, including without limitation “GCT®”. This prospectus also contains trademarks and trade names of other businesses that are the property of their respective holders.
ii
Table of Contents
This summary highlights information contained elsewhere in this prospectus and does not contain all of the information that you should consider in making your investment decision. Before investing in our common stock, you should carefully read this entire prospectus, including our consolidated financial statements and the related notes and the information set forth under the headings “Risk Factors” and “Management’s Discussion and Analysis of Financial Condition and Results of Operations,” in each case included elsewhere in this prospectus.
GCT Semiconductor, Inc.
Overview
We are a leading fabless designer and supplier of advanced 4G mobile semiconductor solutions. Our products are system-on-a-chip (SoC) solutions that integrate radio frequency (RF), baseband modem and digital signal processing (DSP) functions onto a single die for the 4G Long-Term Evolution (LTE) and Worldwide Interoperability for Microwave Access (WiMAX) markets. We were the first to commercialize single-chip solutions for LTE and WiMAX and believe we are currently the only company selling commercialized single-chip LTE solutions. We believe our proprietary technology and system-level expertise enable us to provide complete 4G platform solutions, which are differentiated by their small form factors, low power consumption, high performance, high reliability and cost effectiveness. Our solutions have been designed into smartphones, USB dongles, wireless routers, customer premise equipment (CPE), femto access points, public safety devices and embedded modules for notebook and tablet devices.
Our core differentiation results from our distinctive RF complementary metal oxide semiconductor (CMOS) capabilities combined with our ability to integrate multiple functions, including RF, wireless modem and DSP, onto a single die. We have also developed multiple orthogonal frequency-division multiple access (OFDMA) modem and multiple-input multiple-output (MIMO) antenna capabilities, two technologies that are critical for delivering LTE and WiMAX solutions and for integrated wireless local area network (WLAN) functionality.
We work closely with wireless operators to drive adoption of our solutions by collaborating with them on the designs of our products. These operators include AT&T, MetroPCS Wireless, Inc., Verizon Wireless (Verizon), Vodafone Limited (Vodafone) and Yota for LTE and Clearwire Corporation (Clearwire), KT Corp., SK Telecom Co. Ltd., Sprint Nextel Corp. (Sprint), UQ Communications, Inc., Yota, YTL Communications Sdn Bhd (YTL) for WiMAX. Our primary customers are device original equipment manufacturers (OEMs) and original design manufacturers (ODMs). Our customers include Infomark Co. Ltd., Inkel Corporation Ltd., Interbro Inc., Kyocera Corporation, LG Electronics, Inc. (LG), LG Innotek Co. Ltd, Modacom Co. Ltd., Quanta Computer, Inc., Seowon Intech Co. Ltd. and YTL.
As of June 30, 2011, we have shipped over 960,000 LTE semiconductors in support of the initial LTE deployments by AT&T, Verizon and Vodafone and over 4.7 million WiMAX semiconductors supporting many major WiMAX operators globally. Our revenue was $22.4 million, $33.1 million and $68.6 million for the fiscal years ended June 30, 2009, 2010 and 2011, respectively. Our revenue attributed to LTE products was $0, $0.9 million and $35.2 million for fiscal years 2009, 2010 and 2011, respectively; our revenue attributed to WiMAX products was $16.7 million, $25.5 million and $30.2 million for fiscal years 2009, 2010 and 2011, respectively; and our revenue attributed to RF and other products was $5.7 million, $6.7 million and $3.3 million for fiscal years 2009, 2010 and 2011, respectively. Our net loss was $14.5 million, $19.9 million and $11.5 million for fiscal years ended June 30, 2009, 2010 and 2011, respectively. We commenced operations in 1998 and have incurred losses on an annual basis since inception. As of June 30, 2011, our accumulated deficit was $192.7 million.
1
Table of Contents
Industry Background
The mobile communications industry is in the early stages of a multi-year upgrade cycle driven by changes in the way customers access the Internet using a wide variety of mobile devices. The introduction of 4G technology has dramatically improved the technical performance and usability of the mobile network, allowing for a rich media experience on mobile devices. According to Cisco Systems, Inc., mobile data traffic is expected to grow 26-fold between 2010 and 2015. (Source: Cisco Visual Networking Global Mobile Data Transfer Forecast, 2010-2015). The improved user experience, along with new and more user-friendly device applications, is driving the next wave of mobile device sales. IDC estimates that shipments of 4G-enabled mobile phones will increase from approximately 13.9 million units in 2011 to approximately 219.0 million units in 2015, representing a compound annual growth rate (CAGR) of 99%.
The two dominant technologies in the 4G standard are LTE and WiMAX. LTE networks are currently being deployed by major 3G cellular operators to take advantage of the benefits of increased capacity and throughput offered by 4G technologies. WiMAX is most often deployed in emerging markets by greenfield operators, which offer fixed wireless broadband internet service, because it takes less time to deploy and is more cost effective than traditional wireline internet service such as DSL.
Robust growth in both the LTE and WiMAX ecosystems is creating significant business opportunities for industry participants. We believe that a successful 4G semiconductor solutions provider must be differentiated along several dimensions, including:
| • | Broad-based technical knowledge and expertise; |
| • | Highly-integrated solutions; |
| • | Accelerated time-to-market and risk mitigation; |
| • | Well-established relationships with industry participants; and |
| • | Multi-mode capabilities and backward compatibility with 3G networks. |
Our Competitive Strengths
We believe that the following core strengths position us well to address the challenges of delivering 4G semiconductor solutions.
| • | RF CMOS and integration capabilities. Our foundational strength in RF CMOS design enables us to offer solutions that deliver outstanding RF performance as well as the benefits of CMOS, including integration capability and cost effectiveness. We have developed and patented proprietary technology to implement RF in CMOS and to overcome the traditional drawbacks of RF CMOS integration, including noise, interference and performance degradation. |
| • | OFDMA, MIMO and dual modem implementation expertise. Our core competency in OFDMA, a modulation technique enabling more efficient use of bandwidth than 3G technologies, and in MIMO, a leading mobile antenna technology, has helped us to develop and commercialize WiMAX, LTE and high-speed WLAN solutions. We have experience in the integration of multiple modems such as combining WiMAX with WLAN, and we are leveraging this experience with LTE. Currently, we are sampling a single-chip WiMAX/WLAN solution, and we are developing a similar single-chip LTE/WLAN solution. |
| • | Software and system-level expertise. Our software and system-level knowledge and expertise enable us to provide our customers with platform solutions that enable our customers to reduce their |
2
Table of Contents
| time-to-market with complete and proven solutions. This effort also assists our customers in identifying suppliers of other components typically required in mobile devices. |
| • | Track record of execution and 4G market leadership. We have a history of successfully delivering multiple generations of high quality WiMAX and CDMA RF semiconductor solutions in high volume. We believe we have achieved a number of industry “firsts,” including: |
| • | World’s first single-chip WiMAX device; |
| • | World’s first single-chip Frequency-Division Duplexing (FDD)-LTE solution; and |
| • | World’s first single-chip, dual-mode WiMAX/WLAN device. |
| • | Key relationships with wireless operators, OEM/ODM customers and base station suppliers. We employ a dual-pronged approach to the market that focuses on both operators and our OEM/ODM customers. Our relationships with wireless operators help cultivate strong endorsement of our products among OEM/ODM customers. In addition, to reduce both time-to-market and the risk of technical incompatibility for our customers, we work with base station suppliers to ensure that our products interoperate seamlessly with their equipment. |
| • | Strong Asia presence. Given Asia’s importance to our market opportunity, we have invested significantly to build a strong presence in the region. We believe having a strong presence in close proximity to local customers helps us win business in Asia. |
Our Growth Strategy
Our strategy is to enable the 4G revolution and successive generations of technology by delivering first-to-market, differentiated and cost-effective solutions. Core elements of our growth strategy include:
| • | Continue to develop and deploy leading integrated LTE solutions. We intend to leverage our technological expertise and track record of execution by continuing to develop and commercialize successive generations of leading single-chip LTE solutions at smaller process nodes, with higher performance levels, higher degrees of integration and lower power consumption. |
| • | Expand our addressable market opportunity within LTE technologies. Our current products address the stand-alone LTE market, which we believe will represent an increasingly significant portion of the 4G market opportunity over time. We also intend to address additional segments of the LTE opportunity by offering products with 3G backward compatibility. For example, we are currently working with VIA Telecom Co., Ltd. to offer a solution with 3G Evolution-Data Optimized (EVDO) and LTE chips in a single package. |
| • | Grow our market position in WiMAX. We intend to increase our market share in WiMAX by leveraging our existing partnerships and design wins from leading WiMAX operators. We remain committed to WiMAX as reflected in our recent product releases, including a single-chip dual-mode WiMAX/WLAN SoC. We are also currently sampling a single-chip SoC for the emerging 802.16m, or “WiMAX 2,” standard. |
| • | Continue to build and strengthen our network of industry relationships. We believe that developing and marketing the world’s first single-chip FDD-LTE and WiMAX solutions has provided us with a strong reputation for innovation and execution with many operators, OEMs and ODMs. We intend to continue to leverage this reputation to both broaden and deepen our relationships and ultimately drive our market opportunity. |
| • | Seek and invest in opportunities to expand our wireless capabilities into new markets. We intend to invest in opportunities beyond the traditional 4G market, where our core strengths can drive |
3
Table of Contents
| differentiation and value for our customers. For example, we are currently working with Motorola Solutions, Inc. to enable a portfolio of LTE-based public safety devices using the 700MHz wireless spectrum for government use and with our other customers to enable a 4G-based smart grid. |
Risks Affecting Us
Our business is subject to numerous risks, which are highlighted in the section entitled “Risk Factors” immediately following this prospectus summary. These risks represent challenges to the successful implementation of our strategy and to the growth and future profitability of our business. Some of these risks are:
| • | Our operating results may fluctuate from period to period, making it difficult to predict our quarterly results; |
| • | The LTE market may not develop or develops more slowly than expected; |
| • | We derive a significant portion of our revenues from our solutions for the WiMAX market, which may decline; |
| • | The commercial deployment and upgrades of 4G wireless network may be delayed or unsuccessful; |
| • | We have a history of losses and may not be able to achieve or sustain profitability; |
| • | We may not be able to compete effectively if operators require backward compatibility of 4G products with an integrated 2G/3G/4G chipset solution; |
| • | We may be unsuccessful in developing and selling new products or in penetrating new markets; |
| • | We may not be able to secure adequate manufacturing capacity from our third-party foundries; and |
| • | We rely on a small number of customers for a significant percentage of our revenue. |
For further discussion of these and other risks you should consider before making an investment in our common stock, see the section entitled “Risk Factors” immediately following this prospectus summary.
Corporate Information
We were incorporated in California in June 1998 as Global Communication Technology, Inc. and reincorporated in Delaware in February 2001. Our principal executive offices are located at 2121 Ringwood Avenue, San Jose, California 95131, and our telephone number is (408) 434-6040. Our website address is www.gctsemi.com. The information on, or accessible through, our website is not part of this prospectus.
4
Table of Contents
THE OFFERING
| Common stock offered by us |
shares of common stock | |
| Common stock outstanding after the offering |
shares of common stock | |
| Over-allotment option |
We have granted the underwriters an option for a period of 30 days to purchase up to additional shares of common stock | |
| Use of proceeds |
We intend to use approximately $12.1 million of the net proceeds from this offering to repay the outstanding balances under our bank loans and to use the remaining net proceeds for other working capital and general corporate purposes, which may include funding research and development of new products and technologies, expansion of our sales and marketing efforts, general and administrative expenditures and other capital expenditures to support our operations. See “Use of Proceeds.” | |
| Risk factors |
You should read the “Risk Factors” section of this prospectus for a discussion of factors to consider carefully before deciding to invest in shares of our common stock. | |
| Proposed NASDAQ Global Market symbol |
“GCTS” | |
The number of shares of common stock to be outstanding immediately after this offering is based on shares outstanding as of June 30, 2011, and excludes:
| • | 56,500,000 shares of common stock reserved for issuance under our 2011 Incentive Compensation Plan (2011 Plan), which became effective upon adoption by our board of directors on September 12, 2011 and serves as the successor to our 2010 Stock Option/Stock Issuance Plan and 2002 Special Stock Option/Stock Issuance Plan (Predecessor Plans), as well as any automatic increases in the number of shares of our common stock reserved for future issuance under the 2011 Plan, including: |
| • | 50,678,762 shares of common stock issuable upon exercise of stock options outstanding under the Predecessor Plans as of June 30, 2011, at a weighted average exercise price of $0.53 per share, which stock options, and the shares underlying them, were transferred to the 2011 Plan; and |
| • | 3,430,874 shares of common stock available for issuance under the Predecessor Plans, which shares were added to the shares reserved under our 2011 Plan. |
| • | 3,000,000 shares of common stock reserved for issuance under our 2011 Employee Stock Purchase Plan (ESPP), which will become effective immediately upon the execution of the underwriting agreement for this offering, as well as any automatic increases in the number of shares of our common stock reserved for future issuance under the ESPP. |
Except as otherwise indicated, all information in this prospectus assumes:
| • | the automatic conversion of all outstanding shares of our convertible preferred stock (preferred stock) into an aggregate of 182,115,586 shares of common stock upon completion of this offering; |
| • | the issuance of shares of common stock as payment for all unpaid and accrued dividends to holders of our preferred stock pursuant to our existing certificate of incorporation, assuming an initial public |
5
Table of Contents
| offering price of $ per share, the mid-point of the price range set forth on the cover page of this prospectus and assuming the payment occurs on ; |
| • | the exercise of outstanding warrants to purchase 9,303,029 shares of our preferred stock as of June 30, 2011. Such exercise includes the assumed exercise, on a net exercise basis where allowed, of the remaining outstanding warrants to purchase 7,636,363 shares of our preferred stock immediately prior to this offering, and the concomitant conversion of the shares of preferred stock acquired upon exercise into shares of common stock upon completion of this offering, assuming an initial public offering price of $ per share, the mid-point of the price range set forth on the cover page of this prospectus; |
| • | no exercise by the underwriters of their option to purchase up to an additional shares of common stock from us; and |
| • | the filing of our amended and restated certificate of incorporation prior to completion of this offering. |
Because the number of shares of common stock that will be issued upon the exercise of the warrants and as payment of dividends to holders of our preferred stock depend upon the actual initial public offering price per share in this offering and, in the case of the payment of dividends and the convertible notes, the closing date of this offering, the actual number of shares issuable upon such exercise, payment and conversion will likely differ from the respective number of shares set forth above.
6
Table of Contents
SUMMARY CONSOLIDATED FINANCIAL DATA
The following table summarizes our consolidated financial data. We have derived the summary consolidated statement of operations data for the years ended June 30, 2009, 2010 and 2011 from our audited consolidated financial statements included elsewhere in this prospectus. Our historical results are not necessarily indicative of the results that may be expected in the future. The following summary consolidated financial data should be read in conjunction with “Management’s Discussion and Analysis of Financial Condition and Results of Operations” and our consolidated financial statements and related notes included elsewhere in this prospectus.
| Years Ended June 30, | ||||||||||||
| 2009 | 2010 | 2011 | ||||||||||
| (In thousands, except share and per share amounts) | ||||||||||||
| Consolidated Statement of Operations Data: |
||||||||||||
| Revenues |
$ | 22,428 | $ | 33,079 | $ | 68,644 | ||||||
| Cost of revenues(1) |
19,455 | 24,288 | 45,398 | |||||||||
|
|
|
|
|
|
|
|||||||
| Gross profit |
2,973 | 8,791 | 23,246 | |||||||||
| Operating expenses: |
||||||||||||
| Research and development (net of NRE and government grants of $5.3 million, $1.1 million and $7.7 million during 2009, 2010 and 2011)(1) |
11,589 | 17,821 | 12,675 | |||||||||
| Sales and marketing(1) |
4,508 | 4,780 | 5,279 | |||||||||
| General and administrative(1) |
3,730 | 3,257 | 5,853 | |||||||||
|
|
|
|
|
|
|
|||||||
| Total operating expenses |
19,827 | 25,858 | 23,807 | |||||||||
|
|
|
|
|
|
|
|||||||
| Income (loss) from operations |
(16,854 | ) | (17,067 | ) | (561 | ) | ||||||
| Interest income |
76 | 49 | 43 | |||||||||
| Interest expense |
(782 | ) | (1,540 | ) | (2,315 | ) | ||||||
| Other income (expense), net |
3,588 | (1,171 | ) | (8,918 | ) | |||||||
|
|
|
|
|
|
|
|||||||
| Loss before income taxes |
(13,972 | ) | (19,729 | ) | (11,751 | ) | ||||||
| Provision for (benefit from) income taxes |
569 | 196 | (222 | ) | ||||||||
|
|
|
|
|
|
|
|||||||
| Net loss |
$ | (14,541 | ) | $ | (19,925 | ) | $ | (11,529 | ) | |||
|
|
|
|
|
|
|
|||||||
| Net loss attributable to common stockholders |
$ | (23,431 | ) | $ | (28,856 | ) | $ | (20,741 | ) | |||
|
|
|
|
|
|
|
|||||||
| Net loss per share attributable to common stockholders, basic and diluted(2) |
$ | (1.17 | ) | $ | (1.39 | ) | $ | (0.98 | ) | |||
|
|
|
|
|
|
|
|||||||
| Weighted average shares used in computing net loss per share attributable to common stockholders, basic and diluted(2) |
19,989,386 | 20,769,991 | 21,066,802 | |||||||||
|
|
|
|
|
|
|
|||||||
| Pro forma net loss per share attributable to common stockholders, basic and diluted(2) |
$ | |||||||||||
|
|
|
|||||||||||
| Weighted average shares used in computing pro forma net loss per share attributable to common stockholders, basic and diluted(2) |
||||||||||||
|
|
|
|||||||||||
7
Table of Contents
| As of June 30, 2011 | ||||||||||||
| Actual | Pro Forma(3) | Pro Forma as Adjusted(4) |
||||||||||
| (In thousands) | ||||||||||||
| Consolidated Balance Sheet Data: |
||||||||||||
| Cash and cash equivalents |
$ | 18,227 | $ | $ | ||||||||
| Working capital (deficit) |
(18,369 | ) | ||||||||||
| Total assets |
58,748 | |||||||||||
| Total short-term indebtedness(5) |
42,439 | |||||||||||
| Total long-term indebtedness(6) |
2,503 | |||||||||||
| Redeemable convertible preferred stock warrant liability |
4,063 | — | ||||||||||
| Foreign currency derivative |
1,165 | |||||||||||
| Mandatorily redeemable convertible preferred stock |
165,428 | — | ||||||||||
| Total stockholders’ deficit |
(191,979 | ) | ||||||||||
| (1) | Our stock-based compensation was as follows: |
| Years Ended June 30, | ||||||||||||
| 2009 | 2010 | 2011 | ||||||||||
| (In thousands) | ||||||||||||
| Cost of revenues |
$ | 3 | $ | 2 | $ | 32 | ||||||
| Research and development |
46 | 48 | 756 | |||||||||
| Sales and marketing |
16 | 21 | 215 | |||||||||
| General and administrative |
7 | 8 | 332 | |||||||||
|
|
|
|
|
|
|
|||||||
| Total stock-based compensation |
$ | 72 | $ | 79 | $ | 1,335 | ||||||
|
|
|
|
|
|
|
|||||||
| (2) | See Note 10 to our audited consolidated financial statements for an explanation of the calculations of our basic and diluted net loss per share and pro forma net loss per share attributable to common stockholders. |
| (3) | The pro forma column in the consolidated balance sheet data table above reflects (i) the automatic conversion of all outstanding share of our preferred stock as of June 30, 2011 into an aggregate of 182,115,586 shares of common stock upon completion of this offering; (ii) the issuance of shares of common stock to be issued as payment for all unpaid and accrued dividends to holders of our preferred stock pursuant to our existing certificate of incorporation, assuming an initial public offering price of $ per share, the mid-point of the price range set forth on the cover page of this prospectus, and assuming the payment occurs on , 2011; (iii) the exercise of outstanding warrants to purchase 9,303,029 shares of our preferred stock as of June 30, 2011, such exercise includes the assumed exercise, on a net exercise basis where allowed, of the outstanding warrants to purchase 7,636,363 shares of our preferred stock, immediately prior to this offering, and the concomitant conversion of the shares of preferred stock acquired upon exercise into shares of common stock upon completion of this offering, assuming an initial public offering price of $ per share, the mid-point of the price range set forth on the cover page of this prospectus; and (iv) the resulting reclassification of the liabilities related to our convertible notes to additional paid-in capital and the settlement of the liabilities related to our foreign currency derivative instruments. |
| (4) | The pro forma as adjusted column in the consolidated balance sheet data table above reflects the transactions described above and the sale of shares of common stock in this offering at an assumed initial public offering price of $ per share, the mid-point of the price range set forth on the cover page of this prospectus, after deducting estimated underwriting discounts and commissions and estimated offering expenses payable by us. |
| (5) | Total short-term indebtedness includes $12.1 million in bank borrowings, $1.0 million convertible notes payable to a related party and $29.3 million in convertible notes payable. |
8
Table of Contents
| (6) | Total long-term indebtedness includes $1.5 million notes payable to a related party and $1.0 million in convertible notes payable. |
Non-GAAP Financial Measures
We believe that the use of Adjusted EBITDA is helpful for an investor in determining whether to invest in our common stock. Adjusted EBITDA is a financial measure that is not calculated in accordance with generally accepted accounting principles (GAAP). We have provided a reconciliation of Adjusted EBITDA, a non-GAAP financial measure, to our net loss, the most directly comparable financial measure calculated and presented in accordance with GAAP. Adjusted EBITDA should not be considered as an alternative to net loss, operating income or any other measure of financial performance calculated and presented in accordance with GAAP. Our Adjusted EBITDA may not be comparable to similarly titled measures of other organizations because other organizations may not calculate Adjusted EBITDA in the same manner as we do. We have included Adjusted EBITDA in this prospectus because it is a basis upon which our management assesses financial performance, and it eliminates the impact of items that we do not consider indicative of our core operating performance. In evaluating Adjusted EBITDA, you should be aware that in the future we will incur expenses similar to the adjustments in this presentation. Our presentation of Adjusted EBITDA should not be construed as an inference that our future results will be unaffected by these expenses or any unusual or non-recurring items.
We include Adjusted EBITDA in this prospectus because (i) we seek to manage our business to a consistent level of Adjusted EBITDA, (ii) it is one of the key bases upon which our management assesses our operating performance and (iii) it is one of the metrics investors may use in evaluating companies’ performance in our industry.
We define Adjusted EBITDA as net income (loss) less interest, provision for income taxes, depreciation and amortization, foreign currency exchange gain (loss), remeasurement charges related to our preferred stock warrants and embedded foreign currency derivatives and stock-based compensation expense.
We use Adjusted EBITDA as a key performance measure because we believe it facilitates operating performance comparisons from period to period by excluding potential differences caused by variations in capital structures (affecting interest expense), tax positions (such as the impact on periods or companies of changes in effective tax rates or fluctuations in permanent differences or discrete quarterly items), the impact of depreciation and amortization expense on our fixed assets, charges related to the fair value remeasurements of our preferred stock warrants and embedded foreign currency derivatives and the impact of stock-based compensation expense. Because Adjusted EBITDA facilitates internal comparisons of our historical operating performance on a more consistent basis, we also use Adjusted EBITDA for business planning purposes and in evaluating acquisition opportunities.
In addition, we believe Adjusted EBITDA and similar measures are widely used by investors, securities analysts, ratings agencies and other interested parties in our industry as a measure of financial performance and debt-service capabilities. Our use of Adjusted EBITDA has limitations as an analytical tool, and you should not consider it in isolation or as a substitute for analysis of our results as reported under GAAP. Some of these limitations are:
| • | Adjusted EBITDA does not reflect our cash expenditures for capital equipment or other contractual commitments; |
| • | Although depreciation and amortization are non-cash charges, the assets being depreciated and amortized may have to be replaced in the future, and Adjusted EBITDA does not reflect cash capital expenditure requirements for such replacements; |
9
Table of Contents
| • | Adjusted EBITDA does not reflect changes in, or cash requirements for, our working capital needs; |
| • | Adjusted EBITDA does not reflect the significant interest expense or the cash requirements necessary to service interest or principal payments on our indebtedness; |
| • | Adjusted EBITDA does not reflect certain tax payments that may represent a reduction in cash available to us; |
| • | Adjusted EBITDA does not reflect foreign currency exchange gains and losses resulting from transactions denominated in currencies other than the U.S. dollar; and |
| • | Other companies, including companies in our industry, may calculate Adjusted EBITDA measures differently, which reduces their usefulness as a comparative measure. |
Because of these limitations, Adjusted EBITDA should not be considered as a measure of discretionary cash available to us to invest in the growth of our business. When evaluating our performance, you should consider Adjusted EBITDA alongside other financial performance measures, including our net loss and other GAAP results.
The following table presents a reconciliation of Adjusted EBITDA to our net income (loss), the most comparable GAAP measure, for each of the periods indicated:
| Years Ended June 30, | ||||||||||||
| 2009 | 2010 | 2011 | ||||||||||
| (In thousands) | ||||||||||||
| Net loss |
$ | (14,541 | ) | $ | (19,925 | ) | $ | (11,529 | ) | |||
| Non-GAAP adjustments: |
||||||||||||
| Interest expense (income), net |
706 | 1,491 | 2,272 | |||||||||
| Provision for (benefit from) income taxes |
569 | 196 | (222 | ) | ||||||||
| Depreciation and amortization |
961 | 574 | 434 | |||||||||
| Remeasurement of liability upon modification of warrants |
— | — | 1,066 | |||||||||
| Remeasurement of warrant liability and foreign currency derivative instruments (gain) loss |
(4,634 | ) | (206 | ) | 5,326 | |||||||
| Foreign currency exchange (gain) loss |
(105 | ) | 1,176 | 2,649 | ||||||||
| Stock-based compensation |
72 | 79 | 1,335 | |||||||||
|
|
|
|
|
|
|
|||||||
| Adjusted EBITDA |
$ | (16,972 | ) | $ | (16,615 | ) | $ | 1,331 | ||||
|
|
|
|
|
|
|
|||||||
10
Table of Contents
Investing in our common stock involves a high degree of risk. You should carefully consider the following risk factors, as well as the other information in this prospectus, before deciding whether to invest in shares of our common stock. The occurrence of any of the following risks, or other risks that are currently unknown or unforeseen by us, could harm our business, financial condition, results of operations or growth prospects. In that case, the trading price of our common stock could decline, and you may lose all or part of your investment.
Risks Related to Our Business
Our operating results may fluctuate from period to period and difficulty in predicting our quarterly operating results could cause the market price of our common stock to decline.
Our revenue and operating results have fluctuated significantly from period to period in the past and will do so in the future. Factors that may cause our operating results to fluctuate include:
| • | changes in the size, growth or growth prospects of the LTE and WiMAX markets; |
| • | timing and success of commercial deployments of and upgrades to 4G wireless networks; |
| • | our ability to develop and sell new products and penetrate into new markets; |
| • | our ability to successfully design and release new products in a timely manner that meet our customers’ needs; |
| • | changes in the competitive dynamics of our market, including new entrants or pricing pressures, and our ability to compete in the LTE and WiMAX markets; |
| • | claims by third parties against us for infringing their intellectual property rights; |
| • | changes in orders and cancellation by our major customers; |
| • | changes in manufacturing costs, including wafer, test and assembly costs; |
| • | availability of adequate manufacturing capacity for our products; and |
| • | general economic conditions globally and in regions where we operate. |
Moreover, sales of our semiconductor solutions fluctuate from period to period due to cyclicality in the semiconductor industry and the short product life cycles and wide fluctuations in product supply and demand characteristics of this industry. We expect these cyclical conditions to continue. Due to our limited operating history, we have yet to experience an established pattern of seasonality. However, business activities generally slow down following holiday seasons, including the Lunar New Year in Asia, which may negatively impact our sales and results of operations during the period. If revenue levels are below our expectations, we may experience declines in margins and profitability or incur a loss from our operations. As a result, our quarterly operating results are difficult to predict, and you should not rely on period-to-period comparisons of our operating results as an indication of our future performance. In addition, the difficulty in predicting our future results may cause the market price of our stock to decline.
If the LTE market does not develop or develops more slowly than expected, or if we fail to accurately predict market requirements or market demand for LTE solutions, our business will be harmed.
We have invested substantial time and resources in developing products that support LTE, and we began commercial shipment of LTE products in December 2010. If we fail to accurately predict market requirements or market demand for LTE, or if our solutions are not successfully developed or adopted by our customers, our revenue will decline and our business will suffer. If LTE networks are deployed to a lesser extent or more slowly
11
Table of Contents
than we currently anticipate, or if other competing 4G protocols achieve greater market acceptance or operators do not migrate to LTE, we may not realize any benefits from this investment, which will have an adverse effect on our business, financial condition and results of operations.
We currently derive a significant portion of our revenue from sales of our semiconductor solutions for the WiMAX market. If the WiMAX market declines, our results of operations will be harmed.
We currently derive a significant portion of our revenue from the sale of our semiconductor solutions for the WiMAX market and expect this trend to continue. If the WiMAX market declines, our results of operations would be materially harmed. In addition to the impact of factors unique to the WiMAX market and the impact of global and regional economic factors, the WiMAX market may decline significantly in anticipation of LTE deployments. If customers believe LTE deployments will provide the same or superior coverage as WiMAX networks in the near future, customers may prefer to adopt LTE services and products instead of WiMAX, which in turn is likely to cause the WiMAX market to grow at a slower pace than expected or to decline. If the WiMAX market declines prior to the commercial production and acceptance of our LTE solutions, or if we fail to predict accurately market requirements or market demand for WiMAX, our business, financial condition and operating results will be harmed.
We depend on the commercial deployment and upgrades of 4G wireless communications equipment, products and services to grow our business, and our business may be harmed if wireless network operators delay or are unsuccessful in the commercial deployment or upgrade of 4G technology or if they deploy other technologies.
We depend upon the commercial deployment and upgrades of 4G wireless communications equipment, products and services based on our technology. Although wireless network operators have commercially deployed 3G networks, we cannot predict the timing or success of further commercial deployments, expansions or upgrades of 3G networks. Deployment of new networks by operators requires significant capital expenditures, well in advance of any revenue from these networks. In the past, operators have cancelled or delayed planned deployments of 4G networks. If existing deployments are not commercially successful or do not continue to grow their subscriber base, or if new commercial deployments of 4G networks are delayed or unsuccessful, our business and financial results may be harmed. During network deployment, operators often anticipate a certain rate of subscriber additions and in response, operators typically procure devices and products to satisfy the forecasted subscriber needs. If the 4G networks are not as widely deployed by operators, or if the 4G technology and devices are not widely accepted by consumers, the rate of subscriber additions may be slower than expected, which may cause inventory build up from OEM/ODM customers. This in turn could negatively impact sales and profit margins of our semiconductor solutions. A number of wireless operators have started testing 4G networks utilizing OFDMA and MIMO technology, but the timing and extent of 4G network deployments are uncertain, and we might not be successful in developing and marketing our semiconductor solutions targeting 4G markets.
We have a history of losses, and we may not achieve or sustain profitability in the future, on a quarterly or annual basis.
We began operations in 1998 and have incurred losses on an annual basis since inception. We experienced net losses of $14.5 million, $19.9 million and $11.5 million during the years ended June 30, 2009, 2010 and 2011, respectively. As of June 30, 2011, our accumulated deficit was $192.7 million. In addition, as of June 30, 2011, we had short-term debt in the amount of $42.4 million, which consisted of bank borrowings, convertible notes and convertible notes to a related party. We expect to incur significant expenses related to the research and development of our products and expansion of our business. The audit report accompanying our consolidated financial statements for the year ended June 30, 2011 contains an explanatory paragraph stating that our net loss for the year ended June 30, 2011 and our accumulated deficit and our outstanding debt at June 30, 2011 of $44.9 million, raise substantial doubt about our ability to continue as a going concern. If we are unable to successfully complete this offering, we will need to seek alternative financing or operational plans to continue as
12
Table of Contents
a going concern. Furthermore, the rapidly evolving wireless communications markets in which we sell our products as well as other factors, make it difficult for us to forecast quarterly and annual revenue accurately. As a result, we could experience cash flow management problems, unexpected fluctuations in our results of operations and other difficulties, any of which would make it difficult for us to meet our debt obligations and achieve and maintain profitability. In addition, as a public company, we will also incur significant legal, accounting and other expenses that we did not incur as a private company. As a result of these increased expenditures, we will have to generate and sustain substantially increased revenue to achieve profitability. We may not be able to sustain our revenue growth or achieve or maintain profitability, and we may continue to incur significant losses in the future, which may have an adverse effect on the market price of our common stock.
If certain wireless operators, OEMs or ODMs require 4G solutions to have backwards compatibility with 2G/3G protocols and to have full 2G/3G/4G functionality integrated into one chipset solution, the companies that provide such a solution may compete more effectively than we can.
Our semiconductor solutions currently focus on 4G protocols, notably WiMAX and LTE. While our 4G solutions can be incorporated into a device alongside 2G/3G solutions, it does not integrate 2G/3G protocols and functionalities into a single chip. In addition, until sufficient 4G coverage is established and Voice over Internet Protocol (VoIP) becomes more pervasive in 4G devices, 2G/3G functionality will be required for voice services. Some wireless operators, or OEMs or ODMs serving these operators, that have deployed substantial 3G networks or that prefer to deal with a single company for their 2G/3G and 4G solutions may require 4G semiconductor solutions to have backwards compatibility and integrate 2G/3G functionality with 4G products. As a result, to compete effectively for design wins with these operators, OEMs or ODMs, we may be required to develop or license an integrated or multi-chip solution compatible with 2G/3G protocols or to partner with an entity that offers such a solution. These requirements would take considerable time and investment, and our competitors that provide a solution with integrated 2G/3G/4G functionality may be able to compete more effectively for those design opportunities, which may have an adverse effect on our business, financial condition and results of operations.
If we are unsuccessful in developing and selling new products or in penetrating new markets, our business and operating results would suffer.
The markets in which we and our customers compete or plan to compete are characterized by rapidly changing technologies and industry standards and technological obsolescence. Our ability to compete successfully depends on our ability to design, develop, market and support new products and enhancements on a timely and cost effective basis. A fundamental shift in technologies in any of our target markets could harm our competitive position within these markets. Our failure to anticipate these shifts, develop new technologies or react to changes in existing technologies could delay our development of new products, which could result in product obsolescence, decreased revenue and loss of design wins.
The development of new technologies and products generally requires substantial investment before they become commercially viable, and we have created a roadmap to build and increase our product offerings. Under this roadmap, we intend to continue making substantial investments to develop new technologies and products, and our development efforts may not be successful, and our new technologies and products may not produce meaningful revenue. For example, we currently invest significant resources to develop WiMAX and LTE multi-protocol semiconductor solutions. We are also investing in multi-mode modem technology that will allow us to offer 4G/WLAN solutions. In addition, we may be required, on a case by case basis, to invest additional resources to develop multiple chip solutions in response to changing market demand. If the semiconductor solutions we develop fail to meet market or customer requirements or do not achieve market acceptance, we may not be able to execute our roadmap successfully. In addition, our products have long sales cycles that involve numerous steps, and during this time we may expend substantial financial resources and management time and effort without any assurance that product sales will result. Our sales cycle typically begins when one of our products has been provided to our end customers for evaluation, and thereafter it can take 12 or more months to achieve successful commercialization. The anticipated long sales cycle for our products makes it difficult to predict the quarter in which sales may occur.
13
Table of Contents
The success of our new products will depend on accurate forecasts of long-term market demand, customer and consumer requirements and future technological developments, as well as a variety of specific implementation factors, including:
| • | accurate prediction of the size and growth of the WiMAX and LTE markets; |
| • | accurate prediction of the market requirements for 2G/3G backward compatibility and our need and ability to offer competitive solutions to meet this requirement; |
| • | accurate prediction of changes in device manufacturer requirements, technology, industry standards or consumer expectations, demands and preferences; |
| • | timely and efficient completion of product design and transfer to manufacturing, assembly and test, and securing sufficient manufacturing capacity to allow us to continue to timely and efficiently deliver products to our customers; |
| • | market acceptance, adequate consumer demand and commercial production of the products in which our mobile and wireless broadband semiconductor solutions are incorporated; |
| • | the quality, performance and reliability of the product as compared to competing products and technologies; |
| • | effective marketing, sales and service; and |
| • | the ability to obtain licenses to use third-party technology to support the development of our products. |
If we fail to introduce new products that meet the demands of our customers or our target markets, or if we fail to penetrate new markets, our revenue will likely decrease over time and our financial condition could suffer.
We rely on a small number of customers for a significant percentage of our revenue, and the loss of, or a reduction in, orders from these customers could result in a substantial decline in our revenue.
We sell our products to OEM/ODM customers either directly or indirectly through distributors. We depend on a small number of customers for a large percentage of our annual revenue. During the year ended June 30, 2011, sales to LGE accounted for 48% of our total revenue. All of our sales to LG consisted of LTE products. We sell our products to LG on a purchase order basis, and LG does not have any long-term commitment or agreement with us to purchase our products. Sales to our five largest OEM/ODM end customers (including direct sales and indirect sales through distributors) accounted for approximately 83% of our total revenue during the year ended June 30, 2011. Sales through our largest distributor, Daejin Semiconductor Co., Ltd., accounted for approximately 19% of our total revenue during the year ended June 30, 2011. We entered into a standard distributor agreement with Daejin in March 2007, pursuant to which Daejin serves as our non-exclusive distributor of our products for customers located in Korea. This agreement is currently effective and will remain effective unless terminated early by either party by providing advance written notice to the other party. We expect that sales to a limited number of customers will continue to account for a significant percentage of our revenue for the foreseeable future. Additionally, consolidation among OEMs in some of our markets could result in an increased concentration in our sources of revenue. It is possible that any of our major customers could terminate its purchasing arrangements with us or significantly reduce or delay the amount of our products that it orders, purchase products from our competitors or develop its own products internally. The loss of, or a reduction in, orders from any major customer could cause a decline in revenue and adversely affect our business, financial condition and results of operations.
14
Table of Contents
If customers do not design our semiconductor solutions into their product offerings or if our customers’ product offerings are not commercially successful, we would have difficulty selling our semiconductor solutions and our business would suffer.
We sell our semiconductor solutions both directly and indirectly through distributors to OEM/ODM customers. Our OEM/ODM customers incorporate our semiconductor solutions in their products and include our semiconductor solutions in the products they supply to their customers. Our semiconductor solutions are generally incorporated into our customers’ products at the design stage. As a result, we rely on OEM/ODM customers to design our semiconductor solutions into the products they sell. Without these design wins, our business would be materially and adversely affected. We often incur significant expenditures on the development of a new semiconductor solution without any guarantees that an OEM/ODM customer will select our semiconductor solution for design into its own product. Once an OEM/ODM customer designs a competitor’s semiconductor into its product offering, it becomes significantly more difficult for us to sell our semiconductor solutions to that customer because changing suppliers involves significant cost, time, effort and risk for the customer. Furthermore, even if an OEM/ODM customer designs one of our semiconductor solutions into its product offering, we cannot be assured that its product will be commercially successful and that we will receive any revenue from that customer. If our customers’ products incorporating our semiconductor solutions fail to meet the demands of their customers or otherwise fail to achieve market acceptance, our revenue and business may suffer.
In addition, we employ a dual-pronged approach to the market that focuses on both operators and OEM/ODM customers in order to facilitate design wins of our products. Under this approach, we rely on key relationships with wireless operators to help create strong endorsement of our products to OEM/ODM customers. If we are not able to provide wireless operators with access to leading OEMs/ODMs that can deliver our solutions in volume, or if these operators choose not to work with our OEM/ODM customers, it may make it more difficult for us to achieve design wins and cause a delay in the deployment of our products, which may have an adverse effect on our business, financial condition and results of operations.
If we are unable to compete effectively, we may not increase or maintain our revenue or market share.
Competition in the wireless semiconductor business continues to increase at a rapid pace as consumers, businesses and governments realize the market potential of wireless products and services. To remain competitive, companies must have highly trained engineering talent and make significant capital investments over long development cycles. We may not be able to compete successfully against current or potential competitors. If we do not compete successfully, our revenue and market share may decline. In the LTE market, we compete and expect to compete with semiconductor companies such as Broadcom Corporation, Intel Corporation, Marvell Technology Group Ltd., Qualcomm Inc., Samsung Electronics Co., Ltd., ST-Ericsson N.V. and potentially other companies focused on developing LTE SoCs. In the WiMAX market, we compete and expect to compete with semiconductor companies such as Broadcom Corporation, which acquired Beceem Communications Inc., Intel Corporation, MediaTek Inc., Samsung Electronics, Co., Ltd., Sequans, Inc. and potentially other companies that offer WiMAX SoCs.
Many of our competitors have longer operating histories and customer relationships, significant legacy products and technologies, greater resources and brand recognition, more industry influence and a larger customer base than us. This may allow them to respond more quickly than us to new or emerging technologies or changes in customer requirements and to provide backward compatibility in their products as required by some operators. In addition, these competitors may have greater credibility with our existing and potential customers. Moreover, our competitors may have been doing business with customers for a longer period of time and have established relationships, which may provide them with information regarding future trends and requirements that may not be available to us. In addition, some of our larger competitors may be able to provide greater incentives to customers through rebates, marketing funds and similar programs. Some of our competitors may also adopt aggressive or predatory pricing policies to offset what we believe are the performance and cost
15
Table of Contents
advantages of our solutions. Our competitors with multiple product lines may bundle their products to offer a broader product portfolio or integrate wireless functionality into other products that we do not sell, which may make it difficult for us to gain or maintain market share.
Our ability to compete will depend on a number of factors, including:
| • | our ability to anticipate market and technology trends and successfully develop products that meet market needs; |
| • | our success in identifying and penetrating new markets, applications and customers; |
| • | our ability to accurately understand the price points and performance metrics of competing products in the marketplace; |
| • | our products’ performance and cost-effectiveness relative to that of competitors’ products; |
| • | our ability to develop and maintain relationships with wireless operators, base station suppliers and OEM/ODM customers; |
| • | our ability to expand international operations in a timely and cost-efficient manner; |
| • | our ability to secure sufficient manufacturing capacity and deliver products in large volume on a timely basis at competitive prices; |
| • | our ability to participate in or influence the process for setting wireless industry standards; |
| • | our ability to conform to industry standards on a timely basis, while developing new and proprietary technologies to offer products and features previously not available in the 4G marketplace; |
| • | our ability to recruit design and application engineers with expertise in wireless broadband communications technologies and sales and marketing personnel; and |
| • | our ability to obtain third-party licenses for supporting technologies to develop new products. |
Our potential competitors may also establish cooperative relationships among themselves or with third parties, acquire companies that provide similar products to ours, or consolidate with other competitors. As a result, new competitors or alliances between our competitors may emerge that could acquire significant market share. In addition, future development efforts by our competitors could render our products obsolete. Any of these factors, alone or in combination with others, could harm our business and result in a loss of market share, an increase in pricing pressure or inability to achieve and sustain profitability.
The average selling prices of semiconductor solutions in our markets have historically decreased over time and will likely do so in the future, which could harm our revenue and gross profits.
Average selling prices of semiconductor products in the markets we serve have historically decreased over time, and we expect such declines to continue to occur for our products over time. Our gross profits and financial results will suffer if we are unable to offset reductions in our average selling prices by reducing our costs, developing new or enhanced semiconductor solutions on a timely basis with higher selling prices or gross profits, or increasing our sales volumes. Additionally, because we do not operate our own manufacturing, assembly or testing facilities and because of our smaller scale relative to these competitors, we may not be able to reduce our costs as rapidly, and our costs may even increase, which could also reduce our margins. Furthermore, from time to time we have and may in the future enter into agreements with selected customers to provide them with favorable pricing arrangement based on volume shipment or other criteria. These agreements may prevent us from offsetting the reduction in our average selling prices of our products. In response to future competitive pricing pressures, we may need to reduce the prices of our semiconductor solutions to remain competitive, which may adversely affect our results of operations, including our product margins.
16
Table of Contents
If we do not sustain our growth rate, or if we are unable to manage any future growth, we may not be able to execute our business plan and our operating results could suffer.
We have experienced significant growth in a short period of time. Our total revenue increased from $22.4 million during the year ended June 30, 2009 to $33.1 million during the year ended June 30, 2010, and to $68.6 million during the year ended June 30, 2011. We may not achieve similar growth rates in future periods. You should not rely on our revenue growth, gross margins or operating results for any prior quarterly or annual periods as an indication of our future operating performance. If we are unable to maintain adequate revenue growth, our financial results could suffer and our stock price could decline.
Our future operating results depend to a large extent on our ability to successfully manage any expansion and growth. To manage our growth successfully and handle the responsibilities of being a public company, we believe we must effectively, among other things:
| • | recruit, hire, train and manage additional qualified engineers for our research and development activities, especially in the positions of design engineering, product and test engineering, and applications engineering; |
| • | add additional sales personnel and expand sales offices; |
| • | add additional finance and accounting personnel; |
| • | implement and improve our administrative, financial and operational systems, procedures and controls; and |
| • | enhance our information technology support for enterprise resource planning and design engineering by adapting and expanding our systems and tool capabilities, and properly training new hires as to their use. |
We are increasing our investment in research and development, sales and marketing, general and administrative and other functions to grow our business. We are likely to incur the costs associated with these increased investments earlier than some of the anticipated benefits, and the return on these investments, if any, may be lower than we expect, may develop more slowly than we expect, or may not materialize.
If we are unable to manage our growth effectively, we may not be able to take advantage of market opportunities or develop new products, and we may fail to satisfy customer requirements, maintain product quality, execute our business plan, or respond to competitive pressures.
Our customers may cancel their orders, change production quantities, delay production or require price reductions in our products, and if we fail to forecast demand for our products accurately, we may incur product shortages, delays in product shipments or excess or insufficient product inventory.
All of our sales are made on a purchase order basis which permit our customers to cancel, change or delay product purchase commitments with little or no notice to us and without penalty. Because production lead times often exceed the amount of time required to fulfill orders, we often must manufacture in advance of orders, relying on a demand forecast to project volumes and product mix. Our ability to accurately forecast demand can be adversely affected by a number of factors, including inaccurate forecasting by our customers, changes in market conditions, adverse changes in our product order mix and demand for our customers’ products. Even after an order is received, our customers may cancel or reduce these orders, or require us to reduce the prices of our product. These cancellations, reductions, or price changes may subject us to a number of risks, including the following:
| • | our projected sales will not materialize on schedule or at all; |
| • | unanticipated reduction in revenue and net profit; and |
| • | increase in excess or obsolete inventory which we may be unable to sell to other customers. |
17
Table of Contents
Alternatively, if we are unable to project customer requirements accurately, we may not manufacture sufficient semiconductor solutions, which could lead to delays in product shipments and lost sales opportunities in the near term, as well as force our customers to identify alternative sources, which could affect our ongoing relationships with these customers. In the past, we have experienced customers significantly increasing their orders with little or no advance notice. If we do not fulfill customer demands in a timely manner, our customers may cancel their orders, or may decide not to order from us in the future. In addition, we may be subject to customer claims for cost of replacement. Either underestimating or overestimating demand could lead to insufficient, excess or obsolete inventory, which could harm our business, financial condition, results of operations, as well as our customer relationships.
We outsource our wafer fabrication, packaging, testing, warehousing and shipping operations to third parties, and if these parties fail to produce and deliver our products according to requested demands in specification, quantity, cost and time, our reputation, customer relationships and operating results could suffer.
We are a fabless company and rely on third parties for all of our manufacturing operations, including wafer fabrication, assembly, testing, warehousing and shipping and logistics. We rely on UMC Group (USA) (UMC) to manufacture substantially all of the wafers for our WiMAX products, and Samsung Semiconductor System LSI Division (Samsung LSI) for substantially all of the wafers for our LTE products. We use third-party vendors to assemble, package and test our products. We primarily use the services of ASE Test Limited (ASE) and STATS ChipPAC Ltd. for assembly, and ASE, Giga Solution Tech Co., Ltd. (Giga Solution), Hana Micron Co., Ltd. and United Test and Assembly Center Ltd. (UTAC) for testing. We depend on these third-party vendors to supply us with services and material of a requested quantity in a timely manner that meets our standards for yield, cost and manufacturing quality. We do not have long-term supply agreements with our third-party vendors other than the minimum capacity agreements with UTAC and Giga Solution. The agreement with UTAC has an initial term of 12 months commencing on February 1, 2011, and the agreement with Giga Solution has an initial term of 6 months commencing on May 1, 2011. Each agreement requires the parties to negotiate in good faith to extend the agreement at the end of the initial term. If one or more of these vendors terminates its relationship with us, or if we encounter any problems with our manufacturing supply chain, it could adversely impact our ability to ship our products to our customers on time and in the quantity required, which in turn could cause an unanticipated decline in our sales and possibly damage our customer relationships.
We do not have long-term capacity agreements with our foundries and they may not allocate sufficient capacity to allow us to meet future demands for our products, and there is no guarantee that we will be able to secure capacity agreements in the future.
We currently do not have long-term capacity agreements with our main foundries, UMC and Samsung LSI, primarily because historically we have placed only a limited quantity of orders. Accordingly, our foundries are not obligated to perform services or supply wafers to us for any specific period, in any specific quantities, or at any specific price, except as may be provided in a particular purchase order. Foundry capacity allocated to us has in the past been reduced due to strong demand by other foundry customers. The ability of our foundry vendors to provide us with semiconductor products is limited by available capacity and existing obligations. Because none of our third-party foundries has provided contractual assurances to us that adequate capacity will be available to us to meet future demand for our products, foundry capacity may not be available when we need it or at reasonable prices. The foundries may allocate capacity to the production of other companies’ products while reducing deliveries to us on short or without notice. In particular, our foundries may reallocate capacity to other customers that are larger and better financed than us or that have long-term agreements with our foundry during a period of high demand. For example, we experienced a significant increase in customer demand for our WiMAX products during the fiscal quarters ended September 30 and December 31, 2010, for which we were not able to secure sufficient wafer capacity to meet all of these demands, which resulted in a loss or delay of shipment of our products during the quarters. In addition, we expect that we may need to secure additional capacity from our foundries in the immediate future to support increasing demand for our products, and there is no guarantee that we will be able to secure this increased capacity to meet our needs.
18
Table of Contents
As we continue to grow our business, we intend to negotiate long-term supply agreements with our main foundries in order to secure capacity commitment. There can be no assurance that we will be able to negotiate these agreements successfully or in a timely fashion, or that any agreements we enter into will provide us with favorable pricing or sufficient capacity to meet our customer demand. Our failure to secure suitable long-term capacity agreements with our foundries may limit our ability to expand our market and may have an adverse effect on our business, financial condition and results of operations.
Any increase in the manufacturing cost of our products could reduce our gross margins and operating profit.
The semiconductor business experiences ongoing competitive pricing pressure from customers and competitors. Accordingly, any increase in the cost of our products, whether by adverse changes in purchase price or adverse manufacturing cost, will reduce our gross margins and operating profit. In general, we do not have long-term supply agreements with our foundry, test, assembly and other vendors other than a framework agreement with UMC and minimum capacity agreements with UTAC and Giga Solution. As a result, we typically negotiate pricing on a purchase order basis. Therefore, we may not be able to obtain price reductions or anticipate or prevent future price increases from our suppliers. There is no assurance that our manufacturing suppliers will be able to deliver raw materials, goods and services to us at reasonable prices and the required volume. These and other related factors could impair our ability to meet our customers’ needs and have an adverse effect on our operating results.
If our foundry vendors do not achieve satisfactory yields or quality, our reputation, customer relationships and financial performance could be harmed.
The fabrication of chipsets is a complex and technically demanding process. Minor deviations in the manufacturing process can cause substantial decreases in yields, and in some cases, cause production to be suspended. Our foundry vendor could, from time to time, experience manufacturing defects and reduced manufacturing yields. Changes in manufacturing processes or the inadvertent use of defective or contaminated materials by our foundry vendor could result in lower than anticipated manufacturing yields or unacceptable performance. Many of these problems are difficult to detect at an early stage of the manufacturing process and may be time consuming and expensive to correct. Poor yields from our foundry vendor, or defects, integration issues or other performance problems in our products could cause us significant customer relations and business reputation problems, harm our financial results and result in financial or other damages to our customers. Our customers could also seek damages from us for their losses. A product liability claim brought against us, even if unsuccessful, would likely be time consuming and costly to defend.
Our semiconductor solutions are manufactured at a limited number of locations. If we experience manufacturing problems at a particular location, we would be required to transfer manufacturing to a backup location or supplier. Converting or transferring manufacturing from a primary location or supplier to a backup fabrication facility could be expensive and may not be completed for an extended period of time. During such a transition, we would be required to meet customer demand from our then-existing inventory, as well as any partially finished goods that can be modified to the required product specifications. We do not seek to maintain sufficient inventory to address a lengthy transition period because we believe it is not economical to keep more than minimal inventory on hand. As a result, we may not be able to meet customer needs during a transition, which could delay shipments, cause a production delay or stoppage for our customers, result in a decline in our sales and damage our customer relationships. In addition, a significant portion of our sales are to customers that practice just-in-time order management from their suppliers which gives us a very limited amount of time to process and complete these orders. As a result, delays in our production or shipping by the parties to whom we outsource these functions could reduce our sales, damage our customer relationships and our reputation in the marketplace, any of which could harm our business, results of operations and financial condition.
19
Table of Contents
We may experience difficulties in transitioning to new wafer fabrication process technologies or in achieving higher levels of design integration, which may result in reduced manufacturing yields, delays in product deliveries or increased costs.
We currently use standard 130-nanometer, 110-nanometer and 65-nanometer standard RF, mixed-signal and digital CMOS production processes. We are also developing our next generation of products using 40-nanometer process technology. To remain competitive, we expect to continue to transition our semiconductor products to progressively smaller geometries and to achieve higher levels of design integration. These ongoing efforts require us from time to time to modify the manufacturing processes for our products and to redesign some products, which in turn may result in delays in product deliveries. We periodically evaluate the benefits of migrating to new process technologies to reduce cost and improve performance. We may face difficulties, delays and increased expenses as we transition our products to new processes and potentially to new foundries. We depend on our relationships with our existing wafer foundries to transition to new processes successfully. There is no assurance that these foundries will be able to effectively manage the transition or that we will be able to maintain our relationship with them or develop relationships with new foundries. In addition, as new processes become more prevalent, we expect to continue to integrate greater levels of functionality, as well as end customer and third-party intellectual property, into our products. However, we may not be able to achieve higher levels of design integration or deliver new integrated products on a timely basis. If we or our wafer foundries experience significant delays in transitioning to smaller geometries or fail to efficiently implement transitions and new processes, we could experience reduced manufacturing yields, delays in product deliveries and increased costs, any or all of which could harm our relationships with our customers, and our business, financial condition and operating results.
The complexity of our semiconductor solutions could result in unforeseen delays or expenses from undetected defects, errors or bugs in hardware or software, which could reduce the market acceptance for our new semiconductor solutions, damage our reputation with current or prospective customers and adversely affect our operating costs.
Highly complex semiconductor solutions such as ours frequently contain defects, errors and bugs when they are first introduced or as new versions are released. We have in the past and may in the future experience these defects, errors and bugs. If any of our semiconductor solutions have reliability, quality, or compatibility problems, we may not be able to successfully correct these problems in a timely manner or at all. In addition, if any of our proprietary features contain defects, errors or bugs when first introduced or as new versions are released, we may be unable to correct these problems. Consequently, our reputation may be damaged and customers may be reluctant to buy our semiconductor solutions, which could harm our ability to retain existing customers and attract new customers and our financial results. In addition, these defects, errors or bugs could interrupt or delay sales to our customers. If any of these problems are not found until after we have commenced commercial production of a new semiconductor solution, we may be required to incur additional development costs and product recalls, repairs or replacement costs. These problems may also result in claims against us by our customers or others.
The loss of any of our key personnel could seriously harm our business, and our failure to attract or retain specialized technical, management or sales and marketing talent could impair our ability to grow our business.
We believe our future success will depend in large part upon our ability to attract, retain and motivate highly skilled management, engineering, sales and marketing personnel. The loss of any key employees or the inability to attract, retain or motivate qualified personnel, including engineers and sales and marketing personnel, could delay the development and introduction of and harm our ability to sell our semiconductor solutions. We believe that our future success is dependent on the contributions of Kyeongho Lee, Ph.D., our President and Chief Executive Officer. The loss of the services of Dr. Lee, other executive officers or certain other key personnel could adversely affect our business, financial condition and results of operations. All of our employees are
20
Table of Contents
at-will. For example, if any of these individuals were to leave unexpectedly, we could face substantial difficulty in hiring qualified successors and could experience a loss in productivity during the search for any such successor and while any successor is integrated into our business and operations.
Our key technical and engineering personnel represent a significant asset and serve as the source of our technological and product innovations. We plan to recruit design and application engineers with expertise in wireless communications technologies. We may not be successful in attracting, retaining and motivating sufficient numbers of technical and engineering personnel to support our anticipated growth.
In addition, to expand our customer base and increase sales to existing customers, we will need to hire additional qualified sales and marketing personnel. The competition for qualified marketing, sales, technical and engineering personnel in our industry is very intense. If we are unable to hire, train and retain qualified marketing, sales, technical and engineering personnel in a timely manner, our ability to grow our business will be impaired. In addition, if we are unable to retain our existing sales personnel, our ability to maintain or grow our current level of revenue will be adversely affected.
Our failure to protect our intellectual property rights adequately could impair our ability to compete effectively or to defend ourselves from litigation, which could harm our business, financial condition and results of operations.
We rely primarily on patent, copyright, trademark and trade secret laws, as well as confidentiality and non-disclosure agreements and other methods, to protect our proprietary technologies and know-how. As of June 30, 2011, we had 41 issued patents and 5 pending patent applications in the United States, 43 issued patents and 8 pending patent applications in Korea, 9 patents issued in China, 9 patents issued in Japan, 8 patents issued in Taiwan, and 4 patents issued in India. Even if the pending patent applications are granted, the rights granted to us may not be meaningful or provide us with any commercial advantage. For example, these patents could be opposed, contested, circumvented or designed around by our competitors or be declared invalid or unenforceable in judicial or administrative proceedings. The failure of our patents to adequately protect our technology might make it easier for our competitors to offer similar products or technologies. Our foreign patent protection is generally not as comprehensive as our U.S. patent protection and may not protect our intellectual property in some countries where our products are sold or may be sold in the future. Many U.S.-based companies have encountered substantial intellectual property infringement in foreign countries, including countries where we sell products. Even if foreign patents are granted, effective enforcement in foreign countries may not be available.
The legal standards relating to the validity, enforceability and scope of protection of intellectual property rights are uncertain and evolving. There is no assurance that others will not develop or patent similar or superior technologies, products or services, or that our patents, trademarks and other intellectual property will not be challenged, invalidated or circumvented by others.
Unauthorized copying or other misappropriation of our proprietary technologies could enable third parties to benefit from our technologies without paying us for doing so, which could harm our business. Monitoring unauthorized use of our intellectual property is difficult and costly. Although we are not aware of any unauthorized use of our intellectual property in the past, it is possible that unauthorized use of our intellectual property may have occurred or may occur without our knowledge. There is no assurance that the steps we have taken will prevent unauthorized use of our intellectual property. Our failure to effectively protect our intellectual property could reduce the value of our technology in licensing arrangements or in cross-licensing negotiations. We may in the future need to initiate infringement claims or litigation. Litigation, whether we are a plaintiff or a defendant, can be expensive, time-consuming and may divert the efforts of our technical staff and managerial personnel, which could harm our business, whether or not such litigation results in a determination favorable to us. If we are unable to protect our proprietary rights or if third parties independently develop or gain access to our or similar technologies, our business, revenue, reputation and competitive position could be harmed.
21
Table of Contents
Assertions by third parties of infringement by us of their intellectual property rights could result in significant costs and cause our operating results to suffer.
The semiconductor industry is characterized by vigorous protection and pursuit of intellectual property rights and positions, which has resulted in protracted and expensive litigation for many companies. We have in the past received and, particularly as a public company, we expect that in the future we may receive, communications from various industry participants alleging our infringement of their patents, trade secrets or other intellectual property rights, including suits challenging our products implementing LTE and WiMAX standards. Any lawsuits resulting from such allegations could subject us to significant liability for damages and invalidate our proprietary rights. Any potential intellectual property litigation also could force us to do one or more of the following:
| • | stop or delay selling products or using technologies that contain the allegedly infringing intellectual property; |
| • | lose the opportunity to license our technology to others or to collect royalty payments based upon successful protection and assertion of our intellectual property against others; |
| • | incur significant legal expenses; |
| • | pay substantial damages to the party whose intellectual property rights we may be found to be infringing; |
| • | redesign those products that contain the allegedly infringing intellectual property; or |
| • | attempt to obtain a license to the relevant intellectual property from third parties, which may not be available on reasonable terms or at all, or may result in our being required to pay royalties to a third-party on our products. |
Our customers could also become the target of litigation relating to the patent and other intellectual property rights of others. This could trigger technical support and indemnification obligations in some of our licenses or customer agreements. These obligations could result in substantial expenses, including the payment by us of costs and damages relating to claims of intellectual property infringement. In addition to the time and expense required for us to provide support or indemnification to our customers, any such litigation could disrupt the businesses of our customers, which in turn could hurt our relationships with our customers and cause the sale of our products to decrease. There is no assurance that claims for indemnification will not be made or that if made, such claims would not have an adverse effect on our business, operating results or financial condition.
The wireless standards that we implement in our products, LTE and WiMAX, are subject to numerous patents held by a number of different third parties. In order to encourage the adoption of these standards, two patent pools are expected to be created to facilitate the licensing of patents that are essential to the LTE and WiMAX standards. These patent pools will license all of the patents contributed to the pool on a reasonable and non-discriminatory basis. However, there can be no assurance that all parties that hold patents to the LTE and WiMAX standards will make their patents available for licensing through these patent pools, or that the terms offered by the patent pools will be acceptable to the industry. Further, if we or our customers are unable to obtain licenses to all of the necessary patents to implement the LTE and WiMAX standards through these patent pools, we or our customers may have to negotiate individual licenses with a number of different entities in addition to obtaining a license from the patent pools. Obtaining these additional licenses could increase the cost of our products or that of our customer’s products and perhaps delay the adoption of our products or those of our customers. Moreover, there is no assurance that the entities that hold patents that are essential to the LTE and WiMAX standards will not seek to sue us or our customers for patent infringement rather than offering to license their patents on reasonable terms individually or through a patent pool.
22
Table of Contents
We may not be able to obtain reimbursements from our customers for costs related to research and development activities.
In connection with government grants and product development agreements with certain customers, we received non-recurring engineering (NRE) fees to reimburse costs incurred in the research, development and design of our products. These arrangements are motivated primarily by the opportunity to engage customers and at the same time, jointly progress our own research and development activities with the associated development compensation. We use these NRE amounts to defray a portion of our research and development expenses, and it has the effect of reducing our operating expenses. During the years ended June 30, 2009, 2010 and 2011, we recognized $5.3 million, $1.1 million and $7.7 million, respectively, related to these NRE contracts and government grants as a reduction to research and development expenses. Generally, these NRE reimbursements are paid upon the completion of specified milestones in our product development contracts. However, there is no guarantee that we will be able to satisfy these milestones, and failure to do so may delay or prevent us from receiving NRE fees. In addition, there is no assurance that we will be able to negotiate or obtain NRE reimbursements in future product development agreements, and failure to receive and recognize NRE reimbursements, and any significant reduction in the amount of NRE reimbursements we receive, could increase our operating expenses and adversely affect our results of operations.
We rely upon third parties for supporting technology that is integrated into some of our products, and if we are unable to continue to use this technology and future technology, our ability to sell technologically advanced products would be limited.
We rely on third parties for supporting technology that is integrated into some of our products. If we are unable to continue to use or license on reasonable terms third-party technologies used in some of our products, we may not be able to secure alternatives on a timely basis and our business could be harmed. Even if we are able to secure an alternative license to replace the loss of an existing technology, our transition to this new technology may require additional time and expenses. Any delay or incurrence of additional costs could have an adverse effect on our business, financial condition and results of operations.
Rapidly changing standards could make our semiconductor solutions obsolete, which would cause our operating results to suffer.
We design our semiconductor solutions to conform to standards set by industry standards bodies, including the Institute of Electrical and Electronics Engineers, Inc., or IEEE, and the 3rd Generation Partnership Project, or 3GPP. We also depend on industry groups , including the WiMAX Forum, to certify and maintain certification of our semiconductor solutions. If our customers adopt new or competing industry standards with which our semiconductor solutions are not compatible, or such industry groups fail to adopt standards with which our semiconductor solutions are compatible, our existing semiconductor solutions would become less desirable to our customers and our sales would suffer. The emergence of markets for our products is affected by a variety of factors beyond our control. In particular, our semiconductor solutions are designed to conform to current specific industry standards. Competing standards may emerge that are preferred by our customers, which could also reduce our sales and require us to make significant expenditures to develop new semiconductor solutions. Governments and foreign regulators may adopt standards with which our semiconductor solutions are not compatible, favor alternative technologies or adopt stringent regulations that would impair or make commercially unviable the deployment of our semiconductor solutions. In addition, products that implement existing standards may be challenged as infringing upon third-party intellectual property rights and may become obsolete.
23
Table of Contents
We have material weaknesses in our internal control over financial reporting. If we fail to establish and maintain an effective system of internal control, we may not be able to accurately or timely report our financial results and detect or prevent fraud, which could adversely affect our stock price and investor confidence.
Prior to completion of this offering, we have been a private company with limited accounting personnel to adequately execute our accounting processes and other supervisory resources with which to address our internal control over financial reporting. This lack of adequate accounting resources contributed to audit adjustments to our financial statements in the past.
In connection with the audit of our consolidated financial statements for the fiscal years ended June 30, 2009, June 30, 2010 and June 30, 2011, our independent registered public accounting firm identified and communicated to us material weaknesses, including a material weakness related to our failure to maintain a sufficient number of personnel with an appropriate level of knowledge, experience and training in the application of generally accepted accounting principles in the U.S. (U.S. GAAP) for complex transactions necessary to satisfy our financial reporting requirements. A material weakness is a control deficiency, or a combination of control deficiencies, in internal control over financial reporting, such that there is a reasonable possibility that a material misstatement of our annual or interim financial statements will not be prevented or detected on a timely basis. This material weakness contributed to multiple audit adjustments and also contributed to the following individual material weaknesses:
| • | We did not maintain effective controls related to the completeness and accuracy of the valuation for the accounting for our preferred stock warrant transactions; |
| • | We did not maintain effective controls related to the completeness and accuracy of the accounting for income taxes in regards to transfer pricing and outside basis differences; |
| • | We did not maintain effective controls related to the accuracy and valuation of accounting for deferred margin transactions; and |
| • | We did not maintain effective controls related to the accuracy and valuation of accounting for inventory variances. |
Each of the material weaknesses described above could result in a misstatement of our accounts or disclosures that would result in a material misstatement of our annual or interim consolidated financial statements that would not be prevented or detected.
We are in the process of implementing measures designed to improve our internal control over financial reporting to remediate these material weaknesses. For example, we recently hired a new Chief Financial Officer. We also hired a Corporate Controller with requisite experience in financial reporting for a publicly traded company. We also have plans to add more accounting personnel, including a SEC reporting and Sarbanes-Oxley implementation manager and a financial planning and analysis position. In addition, we have retained consultants to assist with the accounting for income taxes, conduct a transfer pricing study, and review tax strategies. We also expect to retain additional consultants to advise us on making further improvements to our internal controls related to these accounting areas in the future. We believe that these additional resources would enable us to broaden the scope and quality of our internal review of underlying information related to financial reporting and to further enhance our financial review procedures, including the accounting processes for income taxes, deferred margin transactions, inventory variances and complex transactions as they occur.
We cannot assure you that the measures we have taken to date, or any measures we may take in the future, will be sufficient to remediate the material weaknesses in our internal control over financial reporting or to avoid potential future material weaknesses.
24
Table of Contents
In addition, as a U.S.-listed public company, we will be subject to reporting obligations under the United States securities laws, including Section 404 of the Sarbanes-Oxley Act of 2002, as amended (Sarbanes-Oxley Act). For the fiscal year ending June 30, 2013, our management will be required to deliver a report that assesses the effectiveness of our internal control over financial reporting. In addition, our independent registered public accounting firm will also be required to deliver an attestation report on the effectiveness of our internal control over financial reporting beginning with the year ending June 30, 2013, unless we qualify for an exemption as a non-accelerated filer under the applicable SEC rules and regulations.
Our management may conclude that our internal control over financial reporting is not effective. Moreover, even if our management concludes that our internal control over financial reporting is effective, our independent registered public accounting firm may decline to issue an opinion as to the effectiveness of our internal control over financial reporting, or may issue a report that is qualified or adverse. During the course of the evaluation of internal control over financial reporting, we or our independent registered public accounting firm may identify control deficiencies that we may not be able to remediate prior to the date of our first assessment of internal control over financial reporting. Our failure to achieve and maintain effective internal control over financial reporting could result in the loss of investor confidence in the reliability of our financial statements, which in turn could harm our business and negatively impact the trading price of our stock.
We will incur additional costs to comply with regulatory requirements as a public company, including Section 404 of the Sarbanes-Oxley Act of 2002, and we may not be able to successfully manage these additional obligations.
We have not operated as a public company in the past and will incur significant legal, accounting, and other expenses that we did not incur as a private company. The individuals who constitute our management team have limited experience managing a publicly traded company, and limited experience complying with the increasingly complex and changing laws pertaining to public companies, including rules and regulations promulgated by the U.S. Securities and Exchange Commission (SEC) and The NASDAQ Stock Market. Our management team and other personnel will need to devote a substantial amount of time to new compliance initiatives, and we may not successfully or efficiently manage our transition into a public company. We expect rules and regulations, such as the Sarbanes-Oxley Act and the Consumer Protection Act enacted in July 2010, to increase our legal, accounting and finance compliance costs and to make some activities more time consuming and costly. Furthermore, in anticipation of becoming a public company, we have created board committees and will adopt additional internal controls and disclosure controls and procedures. We also intend to hire additional accounting and finance personnel with technical accounting and financial reporting experiences, including compliance with the internal control requirements under Section 404 of the Sarbanes-Oxley Act. Any inability to recruit and retain the accounting personnel we require may have an adverse impact on our ability to accurately and timely prepare our financial statements, and we expect to incur additional costs associated with preparing, filing and distributing period public reports. These rules and regulations could increase our administrative costs and divert our management’s attention, which may adversely affect our business, financial condition and results of operations.
We cannot predict our future capital needs and we may not be able to obtain additional financing to fund our operations.
We may need to raise additional funds in the future. Our ability to continue to meet our obligations and to achieve our intended business objectives is dependent upon, among other things, refinancing the debt obligations or raising additional capital in order to satisfy those obligations which are due during the twelve months ending June 30, 2012. There can be no assurance that sufficient debt or equity financing will be available at all or, if available, that such financing will be at terms and conditions acceptable to us. Should we fail to refinance the debt or raise additional capital, we may not be able to achieve our longer term business objectives and may face other serious adverse consequences. If we raise additional funds by issuing equity securities or convertible debt, investors may experience significant dilution of their ownership interest, and the newly-issued securities may have rights senior to those of the holders of our common stock. If we raise additional funds by obtaining loans
25
Table of Contents
from third parties, the terms of those financing arrangements may include negative covenants or other restrictions on our business that could impair our operational flexibility. Furthermore, if our cash flows and capital resources are insufficient to fund our interest payments under these loans, we may be forced to take alternative measures to meet our cash requirements, including sales and disposition of our assets used as collateral for the loans, which may have an adverse effect on our business and results of operations. If additional financing is not available when required or is not available on acceptable terms, we may have to scale back our operations or limit our production activities, and we may not be able to expand our business, develop or enhance our products, take advantage of business opportunities or respond to competitive pressures, which could result in lower revenue and reduce the competitiveness of our products.
Our business depends on international customers, suppliers and operations in Asia, which subjects us to additional risks, including increased complexity and costs of managing international operations and geopolitical instability.
We rely on, and expect to continue to rely on, customers and suppliers located primarily in the Asia-Pacific region. We also have, and will continue to have, research and development facilities in Korea and sales offices in China, Japan, Korea and Taiwan. As a result of our international focus, we are subject to a number of risks, including:
| • | increased complexity and costs of managing international operations; |
| • | longer and more difficult collection of receivables; |
| • | difficulties in enforcing contracts generally; |
| • | geopolitical and economic instability, terrorist attacks and armed conflicts; |
| • | limited protection of our intellectual property and other assets; |
| • | restrictions on our ability to export our technology from the U.S. and other countries; |
| • | compliance with local laws and regulations and unanticipated changes in local laws and regulations, including tax laws and regulations; |
| • | complexities in the accounting and financial management of our operations; |
| • | trade and foreign exchange restrictions and higher tariffs; |
| • | travel restrictions; |
| • | timing and availability of import and export licenses and other governmental approvals, permits and licenses, including export classification requirements; |
| • | foreign currency exchange fluctuations relating to our international operating activities; |
| • | transportation delays and limited local infrastructure and disruptions, such as large scale outages or interruptions of service from utilities or telecommunications providers; |
| • | difficulties in staffing international operations; |
| • | heightened risk of terrorism; |
| • | local business and cultural factors that differ from our normal standards and practices; |
| • | differing employment practices and labor issues; and |
| • | regional health issues and natural disasters. |
In addition, although we do not conduct any business in North Korea, any future increase in political or military tensions between South Korea and North Korea, or between the U.S. and North Korea, may adversely affect our business, financial condition and results of operations.
26
Table of Contents
Our business operations could be significantly harmed by natural disasters or global epidemics.
We have research and development facilities located in San Jose, California which could suffer significant business disruption due to earthquakes. A significant portion of our products are manufactured by third-party contractors located in the Pacific Rim region, including Taiwan. The risk of an earthquake or tsunami in Taiwan and elsewhere in the Pacific Rim region is significant due to the proximity of major earthquake fault lines to the facilities of our foundry vendors and assembly and test subcontractors. In addition, a number of our customers and suppliers have maintained facilities in Japan that were affected by the March 2011 Sendai earthquake. Even if these customers and suppliers are not located near the epicenter of the March 2011 Sendai earthquake, they may be affected by the consequences of the natural disaster that has affected Japan, which have included rolling blackouts, decreased access to raw materials and limited ability to ship inventory. If these conditions persist, we may experience delay or cancellation of orders from our customers if they are unable to obtain adequate supplies of components needed for the manufacture of their products that incorporate our components. We may also experience shortages of key materials required for the assembly of our own products, which could limit our ability to manufacture and ship these products. In either event, our net sales and results of operations could be adversely affected. We are not currently covered by insurance against business disruption caused by earthquakes.
Our business could be adversely affected by epidemics or outbreaks such as avian flu or H1N1 flu, also known as swine flu. An outbreak of avian flu or H1N1 flu in the human population, or another similar health crisis, could adversely affect the economies and financial markets of many countries, particularly in Asia. Moreover, any related disruptions to transportation or the free movement of persons could hamper our operations and force us to close our offices temporarily.
The occurrence of any of the foregoing or other natural or man-made disasters could cause damage or disruption to us, our employees, operations, distribution channels, markets and customers, which could result in significant delays in deliveries or substantial shortages of our products and adversely affect our business results of operations, financial condition, or prospects.
Our failure to comply with obligations under open source licenses could require us to release our source code to the public or cease distribution of our products, which could harm our business, financial condition and results of operations.
Some of the software used with our products, as well as that of some of our customers, may be derived from so-called “open source” software that is generally made available to the public by its authors and/or other third parties. This open source software is often made available to us under licenses, such as the GNU General Public License, which impose certain obligations on us in the event we were to make available derivative works of the open source software. These obligations may require us to make source code for the derivative works available to the public, and/or license such derivative works under a particular type of license, rather than the forms of license customarily used to protect our intellectual property. In addition, there is little or no legal precedent for interpreting the terms of certain of these open source licenses, including the determination of which works are subject to the terms of such licenses. While we believe we have complied with our obligations under the various applicable licenses for open source software, in the event the copyright holder of any open source software were to successfully establish in court that we had not complied with the terms of a license for a particular work, we could be required to release the source code of that work to the public and/or stop distribution of that work, which may adversely affect our business, financial condition and results of operations.
Failure to comply with governmental laws and regulations could harm our business.
Our business is subject to regulation by various federal, state, local and foreign governmental agencies, including agencies responsible for monitoring and enforcing employment and labor laws, workplace safety, product safety, environmental laws, consumer protection laws, anti-bribery laws, import/export controls, federal securities laws and tax laws and regulations. In certain jurisdictions, these regulatory requirements are more
27
Table of Contents
stringent than in the United States. It is expected that new environmental laws and regulations will impact our products and operations, and although we cannot predict the ultimate impact of any such changes, they may increase our operating and manufacturing costs or result in increased penalties, which could harm our business. Noncompliance with applicable regulations or requirements could subject us to investigations, sanctions, mandatory product recalls, enforcement actions, fines, damages, civil and criminal penalties or injunctions. If any governmental sanctions are imposed, or if we do not prevail in any possible civil or criminal litigation, our business, operating results and financial condition could be adversely affected. In addition, we may incur significant costs to respond to or defend against adverse government proceedings, and these actions may divert our management’s attention and resources. Enforcement actions and sanctions could harm our business, operating results and financial condition.
The enactment of legislation implementing changes in the U.S. taxation of international business activities or the adoption of other tax reform policies could materially impact our financial position and results of operations.
The U.S. government has made public statements indicating that it has made international tax reform a priority, and key members of the U.S. Congress have conducted hearings and proposed new legislation. Recent changes to U.S. tax laws, including limitations on the ability of taxpayers to claim and utilize foreign tax credits and the deferral of certain tax deductions until earnings outside of the United States are repatriated to the United States, as well as changes to U.S. tax laws that may be enacted in the future, could impact the tax treatment of our foreign earnings. Due to the large and expanding scale of our international business activities, any changes in the U.S. taxation of such activities may increase our worldwide effective tax rate and harm our financial condition, and results of operations.
Risks Related to Our Industry
The semiconductor and communications industries have historically experienced significant fluctuations with prolonged downturns, which could impact our operating results, financial condition and cash flows.
The semiconductor industry has historically exhibited a pattern of cyclicality, which at various times has included significant downturns in customer demand. Because a significant portion of our expenses is fixed in the near term or is incurred in advance of anticipated sales, we may not be able to decrease our expenses rapidly enough to offset any unanticipated shortfall in revenue. If this situation were to occur, it could adversely affect our operating results, cash flow and financial condition. Furthermore, the semiconductor industry has periodically experienced increased demand and production constraints. If this happens in the future, we may not be able to produce sufficient quantities of our products to meet the increased demand. We may also have difficulty in obtaining sufficient wafer, assembly and test resources from our subcontract manufacturers. Any factor adversely affecting the semiconductor industry in general, or the particular segments of the industry that our products target, may adversely affect our ability to generate revenue and could negatively impact our operating results.
The communications industry has, in the past, experienced pronounced downturns, and these cycles may continue in the future. A future decline in global economic conditions could have adverse, wide-ranging effects on demand for our products and for the products of our customers, particularly wireless communications equipment manufacturers or other members of the wireless industry, such as wireless network operators. Inflation, deflation and economic recessions that adversely affect the global economy and capital markets also adversely affect our customers and our end consumers. For example, our customers’ ability to purchase or pay for our products and services, obtain financing and upgrade wireless networks could be adversely affected, which may lead to many networking equipment providers slowing their research and development activities, canceling or delaying new product development, reducing their inventories and taking a cautious approach to acquiring our products, which would have a significant negative impact on our business. If this situation were to occur, it could adversely affect our operating results, cash flow and financial condition. In the future, any of these trends may
28
Table of Contents
also cause our operating results to fluctuate significantly from year to year, which may increase the volatility of the price of our stock.
The mobile phone industry is characterized by short product cycles, significant fluctuations in supply and demand, and rapidly changing technologies, and we may not be able to meet these challenges successfully.
A substantial portion of our products is incorporated into mobile phones. The mobile phone markets into which we sell our products are characterized by high growth, short product cycles, significant fluctuations in supply and demand, and rapidly changing technologies. In order to remain competitive, mobile phone manufacturers must continuously develop new technologies, deliver new products and otherwise adjust their business strategies to meet these challenges. We may not be able to implement the necessary measures timely, or if at all, to mitigate these industry-wide forces. For example, we may not be able to reduce our expenses timely to offset the impact of lower revenue in a cyclical downturn due to a reduction in demand, or it may be difficult for us to shift quickly the direction of our research and development efforts in response to new market requirements. Our failure to do so could have an adverse effect on our financial condition and results of operations.
Changes in current laws or the imposition of new laws regulating the wireless network and radio frequency emission could impede the sale of our products or otherwise harm our business.
Wireless networks can only operate in the frequency bands, or spectrum, allowed by regulators and in accordance with rules governing how the spectrum can be used. The Federal Communications Commission, or the FCC, in the United States, as well as regulators in foreign countries, have broad jurisdiction over the allocation of frequency bands for wireless networks. We therefore rely on the FCC and international regulators to provide sufficient spectrum and usage rules. For example, countries such as China, Taiwan, Japan, or Korea heavily regulate all aspects of their wireless communication industries, and may restrict spectrum allocation or usage. If further restrictions were to be imposed over the frequency range where our semiconductor solutions are designed to operate, we may have difficulty in selling our products in those regions. In addition, our semiconductor solutions operate in the 2 and 3 gigahertz, or GHz, band, which in some countries is also used by government and commercial services such as military and commercial aviation. The FCC and European regulators have traditionally protected government uses of the 2 and 3 GHz bands by setting power limits and indoor and outdoor designation and requiring that wireless local area networking devices not interfere with other users of the band such as government and civilian satellite services. Changes in current laws or regulations or the imposition of new laws and regulations in the United States or elsewhere regarding the allocation and usage of the 2 and 3 GHz band on us, our customers or the industries in which we operate may materially and adversely impact the sale of our products and our business, financial condition and results of operations.
In addition, concern over the effects of radio frequency emissions, even if unfounded, may have the effect of discouraging the use of wireless devices, which may decrease demand for our products and those of our licensees and customers. In recent years, the FCC and foreign regulatory agencies have updated the guidelines and methods they use for evaluating radio frequency emissions from radio equipment, including wireless phones and other wireless devices. In addition, interest groups have requested that the FCC investigate claims that wireless communications technologies pose health concerns and cause interference with airbags, hearing aids and medical devices. Concerns have also been expressed over the possibility of safety risks due to a lack of attention associated with the use of wireless devices while driving. In May 2011, the World Health Organization announced the result of a scientific study on cell phone safety, which indicates that radio frequency electromagnetic fields is a possible carcinogen to humans. The study also found some evidence of increase in certain type of brain cancer for prolonged use of mobile phones. Any legislation that may be adopted, or any negative public sentiment that may have developed in response to these concerns could reduce demand for our products and those of our customers, which may adversely affect our business, financial condition and results of operations.
29
Table of Contents
The large amount of capital required to obtain radio frequency licenses, deploy and expand wireless networks and obtain new subscribers could slow the growth of the wireless communications industry and adversely affect our business.
Our growth is dependent upon the increased use of wireless communications services that utilize our technology. In order to provide wireless communications services, wireless operators must obtain rights to use specific radio frequencies. The allocation of frequencies is regulated in the United States and other countries throughout the world, and limited spectrum space is allocated to wireless communications services. Industry growth may be affected by the amount of capital required to obtain licenses to use new frequencies, deploy wireless networks to offer voice and data services, expand wireless networks to grow voice and data services and obtain new subscribers. The significant cost of licenses, wireless networks and subscriber additions may slow the growth of the industry if wireless operators are unable to obtain or service the additional capital necessary to implement or expand 4G wireless networks. Our growth could be adversely affected if this occurs.
We may experience a decrease in market demand due to uncertain economic conditions in the United States and in international markets, which has been further exacerbated by the concerns of terrorism, war and social and political instability.
Economic growth in the United States and international markets has slowed significantly and the United States economy has recently been in a recession, and the timing of a full economic recovery is uncertain. The uncertainty in the economic environment may contribute to the volatility in the United States stock markets, which has experienced significant fluctuations recently. In addition, terrorist attacks in the United States and turmoil in the Middle East have increased the uncertainty in the United States economy and may contribute to a decline in economic conditions, both domestically and internationally. Terrorist acts and similar events, or war in general, could contribute further to a slowdown of the market demand for goods and services, including demand for our products. If the economy declines as a result of the recent economic, political and social turmoil, including any potential default or downgrade in the rating of United States debt obligations, or if there are further terrorist attacks in the United States or elsewhere, we may experience decreases in the demand for our products and services, which may harm our operating results.
Risks Related to this Offering and Ownership of our Common Stock
There has been no prior trading market for our common stock, and an active trading market may not develop or be sustained following this offering.
Prior to this offering, there has been no public market for our common stock, and there is no assurance that an active trading market will develop or be sustained after this offering. The initial public offering price will be negotiated between us and representatives of the underwriters and may not be indicative of the market price of our common stock after this offering.
The market price of our common stock may be volatile, which could cause the value of your investment to decline.
Prior to this offering, our common stock has not been traded in a public market. We cannot predict the extent to which a trading market will develop or how liquid that market might become. The initial public offering price may not be indicative of prices that will prevail in the trading market. The trading price of our common stock following this offering is therefore likely to be highly volatile and could be subject to wide fluctuations in price in response to various factors, some of which are beyond our control. These factors include:
| • | changes in financial estimates, including our ability to meet our future revenue and operating profit or loss projections; |
| • | changes in earnings estimates or recommendations by securities analysts; |
30
Table of Contents
| • | fluctuations in our operating results or those of our customers, operators or other semiconductor companies; |
| • | commercial deployment and upgrade of 4G wireless networks; |
| • | economic developments in the semiconductor or mobile and wireless industries as a whole; |
| • | general economic conditions and slow or negative growth of related markets; |
| • | announcements by us or our customers or competitors of acquisitions, new products, significant contracts or orders, commercial relationships or capital commitments; |
| • | announcements regarding intellectual property litigation involving us or our competitors; |
| • | changes in the financial estimates of our competitors; |
| • | our ability to develop and market new and enhanced products on a timely basis; |
| • | changes in the pricing and costs of manufacturing; |
| • | commencement of or our involvement in litigation; |
| • | any major change in our board of directors or management; |
| • | political or social conditions in the markets where we sell our products; and |
| • | changes in governmental regulations. |
In addition, the stock market in general, and the market for semiconductor and other technology companies in particular, have experienced extreme price and volume fluctuations that have often been unrelated or disproportionate to the operating performance of those companies. These fluctuations may be even more pronounced in the trading market shortly following this offering. These broad market and industry factors may cause the market price of our common stock to decrease, regardless of our actual operating performance. These trading price fluctuations may also make it more difficult for us to use our common stock as a means to make acquisitions or to use options to purchase our common stock to attract and retain employees. If the market price of shares of our common stock after this offering does not exceed the initial public offering price, you may not realize any return on your investment in us and may lose some or all of your investment. In addition, in the past, following periods of volatility in the overall market and the market price of a company’s securities, securities class action litigation has often been instituted against these companies. This litigation, if instituted against us, could result in substantial costs and a diversion of our management’s attention and resources for our business operations.
Purchasers in this offering will immediately experience substantial dilution in net tangible book value.
The initial public offering price of our common stock is substantially higher than the prices paid for our common stock in the past and higher than the book value of the shares we are offering. In other words, you are paying a price per share that substantially exceeds the value of our assets after subtracting our liabilities. Accordingly, if you purchase common stock in the offering, you will incur immediate dilution of approximately $ per share in the net tangible book value per share from the price you pay for our common stock based on the assumed initial public offering price of $ per share. If the holders of outstanding stock options exercise those securities, you will incur additional dilution. In addition, we may raise additional capital through public or private equity or debt offerings, subject to market conditions. To the extent that additional capital is raised through the sale of equity or convertible debt securities, the issuance could result in further dilution to our stockholders. For a further description of the dilution that you will experience immediately after this offering, see the section of this prospectus entitled “Dilution.”
The price of our stock could decrease as a result of shares being sold in the market after this offering.
Additional sales of our common stock in the public market after this offering, or the perception that these sales may occur, could cause the market price of our shares to decline. Upon the completion of this offering, we
31
Table of Contents
will have approximately shares of common stock outstanding, assuming no exercise of the underwriters’ option to purchase additional shares in this offering. All of the shares sold in this offering will be freely transferable without restriction or additional registration under the Securities Act of 1933, as amended (Securities Act). Our directors, officers and other existing security holders will be subject to lock-up agreements described under the caption “Shares Eligible for Future Sale” in this prospectus. Subject to the restrictions under Rule 144 under the Securities Act, these securities will be available for sale following the expiration of these lock-up agreements. These lock-up agreements expire 180 days after the date of this prospectus, which may be extended under certain circumstances. Approximately shares of our common stock will be eligible for resale under Rule 144 immediately upon the expiration of the applicable lock-up period. In addition, the representatives of the underwriters in the offering may also release shares subject to the lock-up prior to the expiration of the lock-up period at their discretion.
In addition, after this offering, the holders of approximately shares of common stock, including shares of common stock issuable upon conversion of our preferred stock upon the completion of this offering, will be entitled to rights to cause us to register the sale of those shares under the Securities Act. Registration of these shares under the Securities Act would result in these shares becoming freely tradable without restriction under the Securities Act immediately upon the effectiveness of the registration.
We intend to file a registration statement under the Securities Act covering 59,500,000 shares of common stock reserved for issuance under our stock plans. This registration statement is expected to be filed after the date of this prospectus and will automatically become effective upon filing. Accordingly, shares registered under this registration statement will be available for sale in the open market unless those shares are subject to vesting restrictions with us or the contractual restrictions described above.
If securities analysts or industry analysts downgrade our stock, publish negative research or reports, or do not publish reports about our business, our stock price and trading volume could decline.
The trading market for our common stock will be influenced by the research and reports that industry or securities analysts publish about us, our business and our market. If one or more analysts adversely change their recommendation regarding our stock or our competitors’ stock, our stock price could decline. If one or more analysts cease coverage of us or fail to regularly publish reports on us, we could lose visibility in the financial markets, which in turn could cause our stock price or trading volume to decline.
A limited number of stockholders will have the ability to influence the outcome of director elections and other matters requiring stockholder approval.
After this offering, our directors and executive officers and their affiliates will beneficially own, in the aggregate, approximately 37% of our outstanding common stock, assuming no exercise of the underwriters’ option to purchase additional shares in this offering. These stockholders, if they acted together, could exert substantial influence over matters requiring approval by our stockholders, including electing directors, adopting new compensation plans and approving mergers, acquisitions or other business combination transactions. This concentration of ownership may discourage, delay or prevent a change of control of our company, which could deprive our stockholders of an opportunity to receive a premium for their stock as part of a sale of our company and might reduce our stock price. These actions may be taken even if they are opposed by our other stockholders, including those who purchase shares in this offering.
Our management will have broad discretion over the use of proceeds from this offering.
The net proceeds from this offering may be used to repay the outstanding balances under our bank loans and for working capital and other general corporate purposes. In addition, we may use a portion of the net proceeds to acquire or invest in complementary businesses or products or to obtain the right to use complementary technologies. However, we do not have any agreements or commitments for any specific acquisitions at this
32
Table of Contents
time. Our management will have considerable discretion in the application of the net proceeds, and you will not have the opportunity, as part of your investment decision, to assess whether the proceeds are being used appropriately. The net proceeds may be used for corporate purposes that do not increase our operating results or market value. Until the net proceeds are used, they may be placed in investments that do not produce significant income or that may lose value.
Delaware law and our amended and restated certificate of incorporation and bylaws contain provisions that could delay or discourage takeover attempts that stockholders may consider favorable.
Provisions in our amended and restated certificate of incorporation and bylaws, as they will be in effect upon the completion of this offering, may have the effect of delaying or preventing a change of control or changes in our management. These provisions include the following:
| • | the right of the board of directors to elect a director to fill a vacancy created by the expansion of the board of directors or due to the resignation or departure of an existing board member; |
| • | the prohibition of cumulative voting in the election of directors, which would otherwise allow less than a majority of stockholders to elect director candidates; |
| • | the requirement for the advance notice of nominations for election to the board of directors or for proposing matters that can be acted upon at a stockholders’ meeting; |
| • | the ability of our board of directors to alter our bylaws without obtaining stockholder approval; |
| • | the ability of the board of directors to issue, without stockholder approval, up to 10,000,000 shares of preferred stock with terms set by the board of directors, which rights could be senior to those of our common stock; |
| • | the elimination of the rights of stockholders to call a special meeting of stockholders and to take action by written consent in lieu of a meeting; and |
| • | the required approval of at least a majority of the shares entitled to vote at an election of directors to remove directors without cause. |
In addition, because we are incorporated in Delaware, we are governed by the provisions of Section 203 of the Delaware General Corporation Law. These provisions may prohibit large stockholders, particularly those owning 15% or more of our outstanding voting stock, from merging or combining with us. These provisions in our amended and restated certificate of incorporation and bylaws and under Delaware law could discourage potential takeover attempts and could reduce the price that investors might be willing to pay for shares of our common stock in the future and could result in our market price being lower than it would without these provisions.
We do not intend to pay dividends on our common stock and, consequently, your ability to achieve a return on your investment will depend on appreciation in the price of our common stock.
We do not intend to declare and pay dividends on our capital stock for the foreseeable future. We currently intend to invest our future earnings, if any, to fund our growth. Additionally, the terms of our credit facility restrict our ability to pay dividends. Therefore, you are not likely to receive any dividends on your common stock for the foreseeable future and the success of an investment in shares of our common stock will depend upon any future appreciation in their value. There is no guarantee that shares of our common stock will appreciate in value or even maintain the price at which our stockholders have purchased their shares.
33
Table of Contents
SPECIAL NOTE REGARDING FORWARD-LOOKING STATEMENTS
This prospectus, particularly the sections entitled “Prospectus Summary,” “Risk Factors,” “Management’s Discussion and Analysis of Financial Condition and Results of Operations,” and “Business,” contains forward-looking statements. All statements other than present and historical facts and conditions contained in this prospectus, including statements regarding our future results of operations and financial positions, business strategy, plans and our objectives for future operations, are forward looking statements. When used in this prospectus the words “anticipate,” “objective,” “may,” “might,” “should,” “could,” “can,” “intend,” “expect,” “believe,” “estimate,” “predict,” “potential,” “plan,” “is designed to” or the negative of these and similar expressions identify forward-looking statements. We have based these forward-looking statements largely on our current expectations and future events and financial trends that we believe may affect our financial condition, results of operations, business strategy and financial needs. Forward-looking statements include, but are not limited to, statements about:
| • | the markets in which we compete and in which our products are sold, including statements and growth rates regarding the LTE and WiMAX markets; |
| • | commercial deployment and upgrade of 4G wireless communications networks; |
| • | our expectations regarding our expenses, sales and operations; |
| • | our sales and marketing strategies and customer and operator relationships; |
| • | our ability to anticipate the future market demands and future needs of our customers; |
| • | our ability to achieve new design wins; |
| • | our intent to develop products that are compatible with current wireless networks; |
| • | anticipated features and benefits of our current and future products; |
| • | our growth strategy elements and our growth rate; |
| • | our ability to acquire third-party licenses to use supporting technologies; |
| • | our intellectual property, third-party intellectual property and claims related to infringement thereof; |
| • | our ability to secure manufacturing capacity for our products; |
| • | general economic conditions in our domestic and international markets; |
| • | our anticipated trends and challenges in the markets in which we operate, including average selling price reductions, cyclicality in the networking industry and transitions to new process technologies; and |
| • | expectations regarding the use of net proceeds from this offering. |
All forward-looking statements involve risks, assumptions and uncertainties. The occurrence of the events described, and the achievement of the expected results, depend on many factors, some or all of which are not predictable or within our control. Actual results may differ materially from expected results. See the section titled “Risk Factors” and elsewhere in this prospectus for a more complete discussion of these risks, assumptions and uncertainties and for other risks and uncertainties. These risks, assumptions and uncertainties are not necessarily all of the important factors that could cause actual results to differ materially from those expressed in any of our forward-looking statements. Other unknown or unpredictable factors also could harm our results.
All forward-looking statements attributable to us or persons acting on our behalf are expressly qualified in their entirety by the cautionary statements set forth in this prospectus. Other than as required by applicable securities laws, we are under no obligation to update any forward-looking statement, whether as a result of new information, future events or otherwise.
You should not rely upon forward-looking statements as predictions of future events. We undertake no obligation, and specifically decline any obligation, to update publicly or revise any forward-looking statements, whether as a result of new information, future events or otherwise, unless required by U.S. federal securities laws.
34
Table of Contents
MARKET, INDUSTRY AND OTHER DATA
Unless otherwise indicated, information contained in this prospectus concerning our industry and the markets in which we operate, including our general expectations and market position, market opportunity and market size, is based on information from various sources, on assumptions that we have made that are based on those data and other similar sources and on our knowledge of the markets for our services. These data involve a number of assumptions and limitations, and you are cautioned not to give undue weight to such estimates. We have not independently verified any third-party information and cannot assure you of its accuracy or completeness, but we believe such third-party information is accurate. While we believe the market position, market opportunity and market size information included in this prospectus is generally reliable, such information is inherently imprecise. In addition, projections, assumptions and estimates of our future performance and the future performance of the industry in which we operate is necessarily subject to a high degree of uncertainty and risk due to a variety of factors, including those described in “Risk Factors” and elsewhere in this prospectus. These and other factors could cause results to differ materially from those expressed in the estimates made by the independent parties and by us.
35
Table of Contents
We estimate that our net proceeds from the sale of the common stock that we are offering will be $ million, assuming an initial public offering price of $ per share, the mid-point of the price range set forth on the cover page of this prospectus, after deducting estimated underwriting discounts and commissions and estimated offering expenses payable by us. If the underwriters’ option to purchase additional shares from us is exercised in full, we estimate that our net proceeds would be approximately $ million after deducting estimated underwriting discounts and commission and estimated offering expenses payable by us. A $1.00 increase (decrease) in the assumed initial public offering price of $ per share would increase (decrease) the net proceeds to us from this offering by $ million, assuming the number of shares offered by us, as set forth on the cover page of this prospectus, remains the same. We may also increase or decrease the number of shares we are offering. Each increase (decrease) of 1,000,000 shares in the number of shares offered by us would increase (decrease) the net proceeds to us from this offering by approximately $ million, assuming that the assumed initial public offering price remains the same, and after deducting the estimated underwriting discounts and commissions and estimated offering expenses payable by us. We do not expect that a change in the offering price or the number of shares by these amounts would have a material effect on our uses of the net proceeds from this offering, although it may impact when we may need to seek additional capital.
We intend to use approximately $12.1 million of our net proceeds from this offering to pay the principal amount outstanding under the following bank loans:
| • | A loan and security agreement with Comerica Bank, which provides a revolving line of credit based on our outstanding accounts receivables. The line of credit carries an interest rate of 1.0% per annum over the lender’s prime rate; provided that such prime rate shall not be less than the daily adjusted LIBOR rate plus 2.5% per annum. Interest rate in effect as of June 30, 2011 was 4.3%. The revolving loans may be borrowed, repaid and reborrowed until July 3, 2012, at which time all amounts borrowed under the loan agreement must be repaid. The loan agreement is subject to an annual nonrefundable fee of $15,000 due in July of each year until the facility is terminated. The principal amount outstanding under this loan and security agreement was $2.9 million as of June 30, 2011. |
| • | A term loan agreement with Kookmin Bank, which carries a fixed interest of 9.9% per annum (as of June 30, 2011) and has a maturity date of November 16, 2011. The principal amount outstanding under this loan agreement was $4.2 million as of June 30, 2011. |
| • | A term loan agreement with Korea Development Bank, which carries a fixed interest of 6.4% per annum and has a maturity date of April 30, 2012. The principal amount outstanding under this loan agreement was $3.7 million as of June 30, 2011. |
| • | A term loan agreement with Industrial Bank of Korea, which carries a fixed interest of 16.8% per annum and has a maturity date of November 4, 2011. The principal amount outstanding under this loan agreement was $0.8 million as of June 30, 2011. |
| • | A loan facility with Industrial Bank of Korea, which carries a monthly variable interest rate based on Public Capital Management Fund lending rate in Korea less 0.5%, which was 2.75% as of June 30, 2011. The maturity date of this loan is March 15, 2012. The principal amount outstanding under this loan facility was $0.5 million as of June 30, 2011. |
We intend to use the remaining net proceeds from this offering for working capital and other general corporate purposes, which may include funding research and development of new products and technologies, expansion of our sales and marketing efforts, general and administrative expenditures and other capital expenditure to support our operations. We may also use a portion of the net proceeds of this offering to expand our current business through acquisitions of, or investments in, other complementary businesses, products or technologies. However, we have no agreements or commitments with respect to any such acquisitions at this time.
36
Table of Contents
Pending the uses described above, we intend to invest the net proceeds in a variety of capital preservation instruments, including short-term, interest-bearing, investment grade instruments, certificates of deposit or direct or guaranteed obligations of the U.S. government.
The expected use of the net proceeds of this offering represents our current intentions based upon our present plans and business conditions, and our management will have broad discretion in using the net proceeds from this offering.
37
Table of Contents
DIVIDEND POLICY
We have never declared or paid any cash dividend on our common stock. We currently intend to retain any future earnings and do not expect to pay any dividends on our common stock in the foreseeable future.
The holders of our Series C, D, E and F redeemable convertible preferred stock are entitled to receive, prior to and in preference of the holders of Series A and B redeemable convertible preferred stock and common stock, cumulative dividends at the rate of $0.05, $0.08, $0.09 and $0.10 per share respectively, when and if declared by the board of directors. In May 2011, we amended our certificate of incorporation to specify that we will pay the cumulative dividends for the Series C, D, E and F redeemable convertible preferred stock in shares of common stock upon the automatic conversion of these shares in connection with a qualified underwritten initial public offering. The number of shares of common stock to be issued as a result of these payments will be determined by dividing the calculated U.S. dollar amount of the cumulative dividends by the per share initial public offering price.
Any determination to pay dividends in the future will be at the discretion of our board of directors and will be dependent on a number of factors, including our earnings, capital requirements and overall financial conditions. In addition, we are currently restricted from paying dividends on our capital stock until our outstanding obligations under our bank borrowings are repaid in full.
38
Table of Contents
The following table sets forth our capitalization as of June 30, 2011 as follows:
| • | our actual capitalization as of June 30, 2011; |
| • | our pro forma capitalization as of June 30, 2011 after giving effect to: |
| • | the automatic conversion of all outstanding shares of our preferred stock as of June 30, 2011 into an aggregate of 182,115,586 shares of common stock upon completion of this offering; |
| • | the issuance of shares of common stock as payment for all unpaid and accrued dividends to holders of our preferred stock pursuant to our existing certificate of incorporation, assuming an initial public offering price of $ per share, the mid-point of the price range set forth on the cover page of this prospectus and assuming the payment occurs on ; |
| • | the exercise of outstanding warrants to purchase 9,303,029 shares of our preferred stock as of June 30, 2011, such exercise includes the assumed exercise, on a net exercise basis where allowed, of the outstanding warrants to purchase 7,636,363 shares of our preferred stock, immediately prior to this offering, and the concomitant conversion of the shares of preferred stock acquired upon exercise into shares of common stock upon completion of this offering, assuming an initial public offering price of $ per share, the mid-point of the price range set forth on the cover page of this prospectus; and |
| • | the resulting reclassification of the liabilities related to the convertible notes to additional paid-in capital and the settlement of the liabilities related to the foreign currency derivative instruments; and |
| • | our pro forma as adjusted capitalization as of June 30, 2011 after giving effect to the transactions described above and the sale of shares of common stock in this offering at an assumed initial public offering price of $ per share, the mid-point of the price range set forth on the cover page of this prospectus, after deducting estimated underwriting discounts and commissions and estimated offering expenses payable by us. |
39
Table of Contents
You should read this table together with “Management’s Discussion and Analysis of Financial Condition and Results of Operations” and our audited consolidated financial statements and the related notes appearing elsewhere in this prospectus.
| As of June 30, 2011 | ||||||||||||
| Actual | Pro Forma |
Pro Forma as Adjusted |
||||||||||
| (In thousands, except share and per share data) | ||||||||||||
| Bank borrowings |
12,072 | |||||||||||
| Notes payable—related party |
1,475 | |||||||||||
| Convertible notes payable |
30,357 | — | ||||||||||
| Convertible notes payable—related party |
1,038 | — | ||||||||||
| Foreign currency derivatives |
1,165 | — | ||||||||||
| Preferred stock warrant liability |
4,063 | — | ||||||||||
| Mandatorily redeemable convertible preferred stock, par value $0.001 per share: 193,180,806 shares authorized, 157,090,863 shares issued and outstanding, actual; no shares authorized, issued and outstanding pro forma and pro forma as adjusted (unaudited) |
165,428 | — | ||||||||||
| Stockholders’ equity (deficit): |
||||||||||||
| Common stock, par value $0.001 per share: 305,374,718 shares authorized, 23,689,499 shares issued and outstanding, actual ; 400,000,000 shares authorized, shares issued and outstanding pro forma (unaudited); shares issued and outstanding pro forma as adjusted (unaudited) |
24 | |||||||||||
|
|
|
|
|
|
|
|||||||
| Additional paid-in capital |
— | |||||||||||
| Accumulated other comprehensive income |
709 | |||||||||||
| Accumulated deficit |
(192,712 | ) | ||||||||||
|
|
|
|
|
|
|
|||||||
| Total stockholders’ deficit |
(191,979 | ) | ||||||||||
|
|
|
|
|
|
|
|||||||
| Total capitalization |
$ | 23,619 | $ | $ | ||||||||
|
|
|
|
|
|
|
|||||||
If the underwriters’ overallotment option were exercised in full, pro forma as adjusted cash and cash equivalents, common stock and additional paid-in capital, stockholders’ equity (deficit) and shares issued and outstanding as of June 30, 2011 would be $ million, $ million, $ million and shares, respectively.
The number of shares of common stock issued and outstanding actual, pro forma and pro forma as adjusted in the table above excludes the following shares:
| • | 56,500,000 shares of common stock reserved for issuance under our 2011 Plan, which became effective upon adoption by our board of directors on September 12, 2011 and serves as the successor to our 2010 Stock Option/Stock Issuance Plan and 2002 Special Stock Option/Stock Issuance Plan (Predecessor Plans), as well as any automatic increases in the number of shares of our common stock reserved for future issuance under the 2011 Plan, including: |
| • | 50,678,762 shares of common stock issuable upon exercise of stock options outstanding under the Predecessor Plans as of June 30, 2011, at a weighted average exercise price of $0.53 per share, which stock options, and the shares underlying them, were transferred to the 2011 Plan, and |
| • | 3,430,874 shares of common stock available for issuance under the Predecessor Plans, which shares were added to the shares reserved under our 2011 Plan. |
| • | 3,000,000 shares of common stock reserved for issuance under our ESPP, which will become effective immediately upon the execution of the underwriting agreement for this offering, as well as any automatic increases in the number of shares of our common stock reserved for future issuance under the ESPP. |
40
Table of Contents
If you invest in our common stock in this offering, your ownership interest will be diluted to the extent of the difference between the initial public offering price per share of our common stock and the pro forma as adjusted net tangible book value per share of our common stock immediately after this offering. The dilution per share to new investors represents the difference between the amount per share paid by purchasers of shares of our common stock in this offering and the pro forma as adjusted net tangible book value per share of our common stock immediately after completion of this offering.
Net tangible book value per share is determined by dividing our total tangible assets less our total liabilities by the number of shares of common stock outstanding. Our historical net tangible book value (deficit) as of June 30, 2011 was a deficit of $(26.6) million, or $(1.12) per share. Our pro forma net tangible book value (deficit) as of June 30, 2011 was a deficit of $ million, or $ per share, based on the total number of shares of our common stock outstanding as of June 30, 2011, after giving effect to (i) the automatic conversion of all outstanding shares of our preferred stock as of June 30, 2011 into an aggregate of 182,115,586 shares of common stock upon completion of this offering; (ii) the issuance of shares of common stock to be issued as payment for all unpaid and accrued dividends to holders of our preferred stock pursuant to our existing certificate of incorporation, assuming an initial public offering price of $ per share, the mid-point of the price range set forth on the cover page of this prospectus and assuming the payment occurs on , 2011; (iii) the exercise of outstanding warrants to purchase 9,303,029 shares of our preferred stock as of June 30, 2011, including the assumed exercise, on a net exercise basis where allowed, of the remaining outstanding warrants to purchase 7,636,363 shares of Series F redeemable convertible preferred stock, immediately prior to this offering, and the concomitant conversion of the shares of preferred stock acquired upon exercise into shares of common stock upon completion of this offering, assuming an initial public offering price of $ per share, the mid-point of the price range set forth on the cover page of this prospectus; and (iv) the resulting reclassification of the liabilities related to our convertible notes to additional paid-in capital and the settlement of the liabilities related to our foreign currency derivative instruments.
After giving effect to our sale of shares of common stock in this offering at an assumed initial public offering price of $ per share, the mid-point of the price range set forth on the cover page of this prospectus, and after deducting estimated underwriting discounts and commissions and estimated offering expenses payable by us, our pro forma as adjusted net tangible book value as of June 30, 2011 would have been $ , or $ per share. This represents an immediate increase in net tangible book value of $ per share to existing stockholders and an immediate dilution in net tangible book value of $ per share to purchasers of common stock in this offering, as illustrated in the following table:
| Initial public offering price per share |
$ | |||||||
| Pro forma net tangible book value (deficit) per share as of June 30, 2011 |
$ | |||||||
| Increase in pro forma net tangible book value (deficit) per share attributable to new investors |
||||||||
| Pro forma as adjusted net tangible book value per share after this offering |
||||||||
|
|
|
|||||||
| Dilution per share to investors in this offering |
$ | |||||||
|
|
|
|||||||
Each $1.00 increase (decrease) in the assumed initial public offering price of $ per share, the mid-point of the price range set forth on the cover page of this prospectus, would increase (decrease) our pro forma as adjusted net tangible book value by $ million, or $ per share, and the pro forma dilution per share to investors in this offering by $ per share, assuming that the number of shares offered by us, as set forth on the cover page of this prospectus, remains the same and after deducting estimated underwriting discounts and commissions and estimated offering expenses payable by us. We may also increase or decrease the number of shares we are offering. An increase of 1.0 million shares in the number of shares offered by us would result in a pro forma as adjusted net tangible book value of $ million, or $ per share, and the pro forma dilution
41
Table of Contents
per share to investors in this offering would be $ per share. Similarly, a decrease of 1.0 million shares in the number of shares offered by us would result in a pro forma as adjusted net tangible book value of $ million, or $ per share, and the pro forma dilution per share to investors in this offering would be $ per share. The pro forma as adjusted information discussed above is illustrative only and will be adjusted based on the actual initial public offering price and other terms of this offering determined at pricing.
If the underwriters’ over-allotment option to purchase additional shares from us is exercised in full, the pro forma as adjusted net tangible book value per share after this offering would be $ per share, the increase in pro forma as adjusted net tangible book value per share to existing stockholders would be $ per share and the dilution to new investors purchasing shares in this offering would be $ per share.
The table below summarizes as of June 30, 2011, on the pro forma as adjusted basis described above, the number of shares of our common stock we issued and sold, the total consideration we received and the average price per share (1) paid to us by existing stockholders; (2) to be paid by new investors purchasing our common stock in this offering at the assumed initial public offering price of $ per share, the mid-point of the price range set forth on the cover page of this prospectus, before deducting estimated underwriting discounts and commissions and estimated offering expenses payable by us; and (3) the average price per share paid by existing stockholders and by new investors who purchase shares of common stock in this offering:
| Shares Purchased | Total Consideration(1) | Average Price per Share |
||||||||||||||
| Number | Percent | Amount | Percent | |||||||||||||
| Existing stockholders |
% | % | $ | |||||||||||||
| New investors |
||||||||||||||||
|
|
|
|
|
|
|
|
|
|||||||||
| Totals |
100 | % | 100 | % | ||||||||||||
|
|
|
|
|
|
|
|
|
|||||||||
| (1) | Each $1.00 increase (decrease) in the assumed initial public offering price of $ per share, the mid-point of the price range set forth on the cover page of this prospectus, would increase (decrease) the total consideration paid to us by new investors and total consideration paid to us by all stockholders by $ million, assuming that the number of shares offered by us, as set forth on the cover page of this prospectus, remains the same, and after deducting estimated underwriting discounts and commissions and estimated offering expenses payable by us. An increase (decrease) of 1.0 million shares in the number of shares offered by us would increase (decrease) the total consideration paid to us by new investors and total consideration paid to us by all stockholders by $ million assuming a price of $ per share, the mid-point of the price range set forth on the cover page of this prospectus, and after deducting estimated underwriting discounts and commissions and estimated offering expenses payable by us. |
The foregoing calculations exclude the following shares:
| • | 56,500,000 shares of common stock reserved for issuance under our 2011 Plan, which became effective upon adoption by our board of directors on September 12, 2011 and serves as the successor to the Predecessor Plans, as well as any automatic increases in the number of shares of our common stock reserved for future issuance under the 2011 Plan, including: |
| • | 50,678,762 shares of common stock issuable upon exercise of stock options outstanding under the Predecessor Plans as of June 30, 2011, at a weighted average exercise price of $0.53 per share, which stock options, and the shares underlying them, were transferred to the 2011 Plan, and |
| • | 3,430,874 shares of common stock available for issuance under the Predecessor Plans, which shares were added to the shares reserved under our 2011 Plan; and |
42
Table of Contents
| • | 3,000,000 shares of common stock reserved for issuance under our ESPP, which will become effective immediately upon the execution of the underwriting agreement for this offering, as well as any automatic increases in the number of shares of our common stock reserved for future issuance under the ESPP. |
If the underwriters exercise their option to purchase additional shares of our common stock in full, our existing stockholders would own % and our new investors would own % of the total number of shares of our common stock outstanding upon completion of this offering. The total consideration paid by our existing stockholders would be approximately $ million, or %, and the total consideration paid by our new investors would be $ million, or %.
To the extent that any of our outstanding options and warrants are exercised, there will be further dilution to investors participating in this offering. If all our outstanding options and warrants had been exercised, the pro forma net tangible book value as of June 30, 2011 would have been $ , or $ per share, and the pro forma as adjusted net tangible book value after this offering would have been $ , or $ per share, causing dilution to new investors of $ per share.
Effective upon the closing of this offering, an aggregate of up to 59,500,000 shares of our common stock will be reserved for future issuance under our equity benefit plans, and the number of reserved shares will also be subject to automatic annual increases in accordance with the terms of the plans. To the extent that new options are issued under our equity benefit plans or we issue additional shares of common stock in the future, there will be further dilution to investors purchasing common stock in this offering.
43
Table of Contents
SELECTED CONSOLIDATED FINANCIAL DATA
The selected consolidated statement of operations data for the years ended June 30, 2009, 2010 and 2011 and the consolidated balance sheet data as of June 30, 2010 and 2011 are derived from our audited consolidated financial statements included elsewhere in this prospectus. The selected consolidated statement of operations data for the years ended June 30, 2007 and 2008 and the consolidated balance sheet data as of June 30, 2007, 2008 and 2009 are derived from our audited consolidated financial statements which are not included in this prospectus. Our historical results are not necessarily indicative of the results that may be expected in the future. You should read the following selected consolidated historical financial data below in conjunction with the section titled “Management’s Discussion and Analysis of Financial Condition and Results of Operations” and the consolidated financial statements and related notes included elsewhere in this prospectus.
| Years Ended June 30, | ||||||||||||||||||||
| 2007 | 2008 | 2009 | 2010 | 2011 | ||||||||||||||||
| (In thousands, except share and per share data) | ||||||||||||||||||||
| Consolidated Statement of Operations Data: |
||||||||||||||||||||
| Revenues |
$ | 29,232 | $ | 41,381 | $ | 22,428 | $ | 33,079 | $ | 68,644 | ||||||||||
| Cost of revenues(1) |
17,494 | 29,130 | 19,455 | 24,288 | 45,398 | |||||||||||||||
|
|
|
|
|
|
|
|
|
|
|
|||||||||||
| Gross profit |
11,738 | 12,251 | 2,973 | 8,791 | 23,246 | |||||||||||||||
| Operating expenses: |
||||||||||||||||||||
| Research and development (net of NRE and government grants of $0.5 million, $4.9 million, $5.3 million, $1.1 million and $7.7 million during 2007, 2008, 2009, 2010 and 2011)(1) |
22,466 | 17,072 | 11,589 | 17,821 | 12,675 | |||||||||||||||
| Sales and marketing(1) |
5,529 | 7,853 | 4,508 | 4,780 | 5,279 | |||||||||||||||
| General and administrative(1) |
4,468 | 4,823 | 3,730 | 3,257 | 5,853 | |||||||||||||||
|
|
|
|
|
|
|
|
|
|
|
|||||||||||
| Total operating expenses |
32,463 | 29,748 | 19,827 | 25,858 | 23,807 | |||||||||||||||
|
|
|
|
|
|
|
|
|
|
|
|||||||||||
| Income (loss) from operations |
(20,725 | ) | (17,497 | ) | (16,854 | ) | (17,067 | ) | (561 | ) | ||||||||||
| Interest income |
458 | 250 | 76 | 49 | 43 | |||||||||||||||
| Interest expense |
(733 | ) | (1,019 | ) | (782 | ) | (1,540 | ) | (2,315 | ) | ||||||||||
| Other income (expense), net |
170 | 2,109 | 3,588 | (1,171 | ) | (8,918 | ) | |||||||||||||
|
|
|
|
|
|
|
|
|
|
|
|||||||||||
| Loss before income taxes |
(20,830 | ) | (16,157 | ) | (13,972 | ) | (19,729 | ) | (11,751 | ) | ||||||||||
| Provision for (benefit from) income taxes |
321 | 2,450 | 569 | 196 | (222 | ) | ||||||||||||||
|
|
|
|
|
|
|
|
|
|
|
|||||||||||
| Net loss |
$ | (21,151 | ) | $ | (18,607 | ) | $ | (14,541 | ) | $ | (19,925 | ) | $ | (11,529 | ) | |||||
|
|
|
|
|
|
|
|
|
|
|
|||||||||||
| Net loss attributable to common stockholders(2) |
$ | (28,191 | ) | $ | (26,312 | ) | $ | (23,431 | ) | $ | (28,856 | ) | $ | (20,741 | ) | |||||
|
|
|
|
|
|
|
|
|
|
|
|||||||||||
| Net loss per share attributable to common stockholders, basic and diluted(2) |
$ | (1.50 | ) | $ | (1.36 | ) | $ | (1.17 | ) | $ | (1.39 | ) | $ | (0.98 | ) | |||||
|
|
|
|
|
|
|
|
|
|
|
|||||||||||
| Weighted average shares used in computing net loss per share attributable to common stockholders, basic and diluted(2) |
18,793,531 | 19,363,678 | 19,989,386 | 20,769,991 | 21,066,802 | |||||||||||||||
|
|
|
|
|
|
|
|
|
|
|
|||||||||||
| Pro forma net loss per share attributable to common stockholders, basic and diluted(2) |
$ | |||||||||||||||||||
|
|
|
|||||||||||||||||||
| Weighted average shares used in computing pro forma net loss per share attributable to common stockholders, basic and diluted(2) |
||||||||||||||||||||
|
|
|
|||||||||||||||||||
44
Table of Contents
| As of June 30, | ||||||||||||||||||||
| 2007 | 2008 | 2009 | 2010 | 2011 | ||||||||||||||||
| (In thousands) | ||||||||||||||||||||
| Consolidated Balance Sheet Data: |
||||||||||||||||||||
| Cash and cash equivalents |
$ | 4,420 | $ | 6,178 | $ | 8,171 | $ | 3,928 | $ | 18,227 | ||||||||||
| Working capital (deficit) |
(8,880 | ) | (2,446 | ) | 6,682 | (12,275 | ) | (18,369 | ) | |||||||||||
| Total assets |
22,628 | 25,839 | 26,522 | 16,456 | 58,748 | |||||||||||||||
| Total short-term indebtedness |
8,075 | 7,135 | 3,459 | 6,095 | 42,439 | |||||||||||||||
| Total long-term indebtedness |
4,527 | 3,007 | 18,358 | 17,697 | 2,503 | |||||||||||||||
| Redeemable convertible preferred stock warrant liability |
390 | 5,549 | 987 | 800 | 4,063 | |||||||||||||||
| Foreign currency derivative |
— | — | 101 | 82 | 1,165 | |||||||||||||||
| Mandatorily redeemable convertible preferred stock |
103,731 | 129,733 | 139,113 | 142,627 | 165,428 | |||||||||||||||
| Total stockholders’ deficit |
(116,619 | ) | (138,457 | ) | (154,950 | ) | (178,048 | ) | (191,979 | ) | ||||||||||
| (1) | Our stock-based compensation was as follows: |
| Years Ended June 30, | ||||||||||||||||||||
| 2007 | 2008 | 2009 | 2010 | 2011 | ||||||||||||||||
| (In thousands) | ||||||||||||||||||||
| Cost of revenues |
$ | 4 | $ | 5 | $ | 3 | $ | 2 | $ | 32 | ||||||||||
| Research and development |
42 | 48 | 46 | 48 | 756 | |||||||||||||||
| Sales and marketing |
7 | 23 | 16 | 21 | 215 | |||||||||||||||
| General and administrative |
— | 9 | 7 | 8 | 332 | |||||||||||||||
|
|
|
|
|
|
|
|
|
|
|
|||||||||||
| Total stock-based compensation |
$ | 53 | $ | 85 | $ | 72 | $ | 79 | $ | 1,335 | ||||||||||
|
|
|
|
|
|
|
|
|
|
|
|||||||||||
| (2) | See Note 10 to our audited consolidated financial statements for an explanation of the calculations of our basic and diluted net loss per share and pro forma net loss per share attributable to common stockholders. |
Non-GAAP Financial Measures
We believe that the use of Adjusted EBITDA is helpful for an investor in determining whether to invest in our common stock. Adjusted EBITDA is a financial measure that is not calculated in accordance with generally accepted accounting principles (GAAP). We have provided a reconciliation of Adjusted EBITDA, a non-GAAP financial measure, to our net loss, the most directly comparable financial measure calculated and presented in accordance with GAAP. Adjusted EBITDA should not be considered as an alternative to net loss, operating income or any other measure of financial performance calculated and presented in accordance with GAAP. Our Adjusted EBITDA may not be comparable to similarly titled measures of other organizations because other organizations may not calculate Adjusted EBITDA in the same manner as we do. We have included Adjusted EBITDA in this prospectus because it is a basis upon which our management assesses financial performance, and it eliminates the impact of items that we do not consider indicative of our core operating performance. In evaluating Adjusted EBITDA, you should be aware that in the future we will incur expenses similar to the adjustments in this presentation. Our presentation of Adjusted EBITDA should not be construed as an inference that our future results will be unaffected by these expenses or any unusual or non-recurring items.
We include Adjusted EBITDA in this prospectus because (i) we seek to manage our business to a consistent level of Adjusted EBITDA, (ii) it is one of the key bases upon which our management assesses our operating performance and (iii) it is one of the metrics investors may use in evaluating companies’ performance in our industry. We define Adjusted EBITDA as net income (loss) less interest income (expense), provision for (benefit from) income taxes, depreciation and amortization, foreign currency exchange gain (loss), remeasurement charges related to our preferred stock warrants and embedded foreign currency derivatives and stock-based compensation expense.
We use Adjusted EBITDA as a key performance measure because we believe it facilitates operating performance comparisons from period to period by excluding potential differences caused by variations in capital structures (affecting interest expense), tax positions (such as the impact on periods or companies for changes in effective tax rates or fluctuations in permanent differences or discrete quarterly items), the impact of depreciation
45
Table of Contents
and amortization expense on our fixed assets, charges related to the fair value remeasurements of our preferred stock warrants and embedded foreign currency derivatives and the impact of stock-based compensation expense. Because Adjusted EBITDA facilitates internal comparisons of our historical operating performance on a more consistent basis, we also use Adjusted EBITDA for business planning purposes and in evaluating acquisition opportunities.
In addition, we believe Adjusted EBITDA and similar measures are widely used by investors, securities analysts, ratings agencies and other interested parties in our industry as a measure of financial performance and debt-service capabilities. Our use of Adjusted EBITDA has limitations as an analytical tool, and you should not consider it in isolation or as a substitute for analysis of our results as reported under GAAP. Some of these limitations are:
| • | Adjusted EBITDA does not reflect our cash expenditures for capital equipment or other contractual commitments; |
| • | Although depreciation and amortization are non-cash charges, the assets being depreciated and amortized may have to be replaced in the future, and Adjusted EBITDA does not reflect cash capital expenditure requirements for such replacements; |
| • | Adjusted EBITDA does not reflect changes in, or cash requirements for, our working capital needs; |
| • | Adjusted EBITDA does not reflect the significant interest expense or the cash requirements necessary to service interest or principal payments on our indebtedness; |
| • | Adjusted EBITDA does not reflect certain tax payments that may represent a reduction in cash available to us; |
| • | Adjusted EBITDA does not reflect foreign currency exchange gains and losses resulting from transactions denominated in currencies other than the U.S. dollar; and |
| • | Other companies, including companies in our industry, may calculate Adjusted EBITDA measures differently, which reduces their usefulness as a comparative measure. |
Because of these limitations, Adjusted EBITDA should not be considered as a measure of discretionary cash available to us to invest in the growth of our business. When evaluating our performance, you should consider Adjusted EBITDA alongside other financial performance measures, including our net loss and other GAAP results.
The following table presents a reconciliation of Adjusted EBITDA to our net income (loss), the most comparable GAAP measure, for each of the periods indicated:
| Years Ended June 30, | ||||||||||||||||||||
| 2007 | 2008 | 2009 | 2010 | 2011 | ||||||||||||||||
| (In thousands) | ||||||||||||||||||||
| Net loss |
$ | (21,151 | ) | $ | (18,607 | ) | $ | (14,541 | ) | $ | (19,925 | ) | $ | (11,529 | ) | |||||
| Non-GAAP adjustments: |
||||||||||||||||||||
| Interest (income) expense, net |
275 | 769 | 706 | 1,491 | 2,272 | |||||||||||||||
| Provision for (benefit from) income taxes |
321 | 2,450 | 569 | 196 | (222 | ) | ||||||||||||||
| Depreciation and amortization |
1,137 | 1,275 | 961 | 574 | 434 | |||||||||||||||
| Remeasurement of liability upon modification of warrants |
— | — | — | — | 1,066 | |||||||||||||||
| Remeasurement of warrant liability and foreign currency derivative instruments (gain) loss |
(167 | ) | (1,140 | ) | (4,634 | ) | (206 | ) | 5,326 | |||||||||||
| Foreign currency exchange (gain) loss |
73 | (970 | ) | (105 | ) | 1,176 | 2,649 | |||||||||||||
| Stock-based compensation |
53 | 85 | 72 | 79 | 1,335 | |||||||||||||||
|
|
|
|
|
|
|
|
|
|
|
|||||||||||
| Adjusted EBITDA |
$ | (19,459 | ) | $ | (16,138 | ) | $ | (16,972 | ) | $ | (16,615 | ) | $ | 1,331 | ||||||
|
|
|
|
|
|
|
|
|
|
|
|||||||||||
46
Table of Contents
MANAGEMENT’S DISCUSSION AND ANALYSIS OF FINANCIAL CONDITION AND RESULTS OF OPERATIONS
The following discussion and analysis of our financial condition and results of operations should be read in conjunction with our consolidated financial statements and related notes included elsewhere in this prospectus. This discussion contains forward-looking statements that involve risks and uncertainties. Our actual results could differ materially from those discussed below. Factors that could cause or contribute to such differences include, but are not limited to, those identified below and those discussed in the section entitled “Risk Factors” included elsewhere in this prospectus.
Overview
We are a leading fabless designer and supplier of advanced 4G mobile semiconductor solutions. Our products are system-on-a-chip (SoC) solutions that integrate radio frequency (RF), baseband modem, and digital signal processing (DSP) functions onto a single die for the 4G Long-Term Evolution (LTE) and Worldwide Interoperability for Microwave Access (WiMAX) markets. We were the first to develop single-chip solutions for LTE and WiMAX and believe we are currently the only company selling commercialized single-chip LTE solutions. We believe our proprietary technology and system-level expertise enable us to provide complete 4G platform solutions, which are differentiated by their small form factors, low power consumption, high performance, high reliability, and cost effectiveness. Our solutions have been designed into smartphones, USB dongles, wireless routers, customer premise equipment (CPE), femto access points, public safety devices, and embedded modules for notebook and tablet devices.
The following summarizes some of our significant corporate, product and financial milestones:
| • | we were incorporated in 1998; |
| • | since inception, we received cash proceeds of an aggregate of $90.0 million from the issuance of our preferred shares and related warrants; |
| • | during the year ended June 30, 2005, we shipped our first fully integrated Personal Handy-Phone system (PHS) CMOS transceivers, with approximately 17 million units shipped to date; |
| • | during the year ended June 30, 2005, we shipped our first mobile digital TV product, with approximately 4 million units shipped to date; |
| • | during the year ended June 30, 2006, we shipped our first Code Division Multiple Access (CDMA) fully integrated CMOS transceivers, with over 30 million units shipped to date; |
| • | during the year ended June 30, 2006, we shipped our single-chip WiMAX device; |
| • | during the year ended June 30, 2008, we shipped the world’s first dual-mode WiMAX/WLAN device; |
| • | during the year ended June 30, 2009, we entered into a product development agreement with LG for our LTE solutions; |
| • | during the year ended June 30, 2010, we began shipment of our single-chip FDD-LTE solution for mobile handsets in support of 4G network deployment by major U.S. operators, including Verizon; |
| • | our revenue during the year ended June 30, 2011 increased to $68.6 million, a 108% increase from the year ended June 30, 2010; |
| • | in June 2011, we announced the use of our LTE single-chip solution in LG’s smartphone, “Revolution by LG”, launched by Verizon in May 2011; and |
| • | in July 2011, we announced a new WiMAX 2 single-chip solution that offers 4x4 MIMO system and 150 Mbps throughput. |
47
Table of Contents
Prior to fiscal year 2008, we focused our core technology on RF CMOS to develop single-chip mobile digital TV and handset RF products, which generated the majority of our revenues. Since fiscal year 2008, our revenue has been driven primarily by increased sales volume of our products due to various trends in the 4G wireless communications markets. These trends included initial deployment and broader adoption of the commonly accepted 4G protocols, first WiMAX and followed by LTE, and a significant increase in the number and type of devices consumers use to access the wireless network. Accordingly, we have recently experienced a major shift in the primary source of our revenue from the traditional mobile digital TV and handset RF products to newer single-chip WiMAX, and increasingly LTE, semiconductor solutions. As the growth of the 4G market continues, we expect our revenue opportunities will depend substantially on our ability to design and develop WiMAX and LTE products.
To drive early adoption of our solutions, we employ a dual-pronged approach to the market that focuses on both wireless operators and our OEM/ODM customers. Our relationships with wireless operators help cultivate strong endorsement of our products among OEM/ODM customers. In addition, to reduce both time-to-market and the risk of technical incompatibility for our customers, we work with base station suppliers to ensure that our products interoperate seamlessly with their equipment. We are a fabless semiconductor design company and rely on third-party foundries, assembly contractors, and test contractors for manufacturing our products. This outsourcing approach allows us to focus our resources on the design, development, sales and marketing of our products. Our foundry vendors are UMC Group (USA) (UMC) and Samsung Semiconductor System LSI Division. The use of these commercially available standard processes enables us to produce cost effective products. We use third-party vendors to assemble, package and test our products. In general, we do not have supply agreements with our foundry, test, assembly, and other vendors other than minimum capacity agreements with two testing suppliers.
As of June 30, 2011, we have shipped over 960,000 LTE semiconductors in support of the initial LTE deployments by AT&T, Verizon and Vodafone and over 4.7 million WiMAX semiconductors supporting many major WiMAX operators around the world. Our revenue was $22.4 million, $33.1 million and $68.6 million during the years ended June 30, 2009, 2010 and 2011, respectively. Our net loss was $14.5 million, $19.9 million and $11.5 million during the years ended June 30, 2009, 2010 and 2011, respectively. We have incurred losses on an annual basis since inception in 1998. As of June 30, 2011, our accumulated deficit was $192.7 million.
Factors Affecting our Financial Performance
Industry growth and demand for products and applications using our solutions.
The overall adoption of 4G solutions will influence the growth and demand for our solutions and impact our financial performance. The pace of commercial deployment and upgrade of 4G wireless communications networks, products and services is expected to drive the sales of our products. During network deployment, operators often anticipate a certain rate of subscriber additions, and in response, operators typically procure devices and products to satisfy the forecasted subscriber needs. If 4G networks are not as widely or quickly deployed by operators as expected or if 4G technology and devices are not as widely accepted by consumers, the rate of subscriber additions may be slower than expected, which in turn could negatively impact the sales and profit margin of our semiconductor solutions.
Successful execution on the 4G market opportunities.
We currently derive a significant portion of our revenue from the sale of our semiconductor solutions for the WiMAX market and expect this trend to continue. Given the growth in the LTE market, we expect our LTE products to constitute an increasingly larger percentage of our revenue going forward. Our ability to take advantage of the growth in 4G market opportunities depends heavily on the timely introduction of new LTE and WiMAX solutions that meet our customers’ specification and to achieve design wins for these products. Our sales cycle typically begins when one of our products, has been provided to our end customers for evaluation,
48
Table of Contents
and thereafter it can take 12 or more months to achieve successful commercialization. We expect to incur significant expenditures on the development of new 4G solutions. There is no assurance that a design win can be secured and failure to do so may adversely affect our financial performance.
Revenue driven by significant customers and the commercial success of their products.
We depend on a small number of customers and customer products for a large percentage of our revenues. During the year ended June 30, 2011, sales to LG accounted for 48% of our total revenue, although these sales were made in support of launches of 4G networks from major wireless operators. All of our sales to LG consist of LTE products. We sell our products to LG on a purchase order basis, and LG does not have any long-term commitment or agreement with us to purchase our products. Sales to our five largest OEM/ODM end customers (including direct sales and indirect sales through distributors) accounted for approximately 83% of our total revenue during the year ended June 30, 2011. While we strive to expand and diversify our customer base and we expect customer concentration to decline over time, we anticipate that sales to a limited number of customers will continue to account for a significant percentage of our revenue for the foreseeable future. The concentration of major customers may cause our financial performance to fluctuate significantly from period to period based on the sales patterns of these customers and the success of their products, and the loss of any significant customer may have an adverse effect on our results of operations.
Pricing and margins of our products.
Our gross profit and margin has been and will continue to be affected by a variety of factors, including the timing and pace of new product introductions and upgrades to existing products, changes in customer and product mixes, shipment volumes, changes in our purchase price of fabricated wafers and assembly and test service costs, changes in pricing and inventory write downs. In general, products with more complex components and higher performance tend to be priced higher and have higher gross margins. We also expect our gross profit and margin will fluctuate over time depending upon competitive pricing pressures. In addition, erosion of average selling prices as products mature is typical in our industry. Consistent with this historical trend, we expect that average selling prices of our products will decline as they mature. As a normal course of business, we seek to offset the effect of declining average selling prices by reducing manufacturing costs of existing products and introducing new and higher value-added products.
General economic conditions and geographic concentration.
A global economic slowdown or financial crisis, similar to the one that occurred beginning in late calendar year 2008, would likely have a significant impact on the wireless semiconductor industry and our financial results. As the economy slows, consumer confidence may decline, and because our products serve consumer electronic applications, any decline may adversely affect our sales and revenues. Moreover, because our sales have been concentrated in a few selected markets, including Korea and China, amongst others, our financial results will be impacted by general economic and political conditions in such markets.
Revenue
We derive our revenue from sales of 4G mobile semiconductor solutions, consisting of our product and platform solutions, to vendors in the wireless semiconductor industry. Our products are system-on-a-chip solutions for the 4G mobile LTE and WiMAX markets. Our proprietary technology and system-level expertise enable us to provide complete 4G platform solutions. As discussed further in “Critical Accounting Policies and Estimates—Revenue Recognition”, revenue is recognized when persuasive evidence of an arrangement exists, delivery has occurred, the price is fixed or determinable and collection is probable.
49
Table of Contents
During the years ended June 30, 2009, 2010 and 2011, we recognized revenue attributable to our LTE, WiMAX and RF and other products as follows:
| Years Ended June 30, | ||||||||||||
| 2009 | 2010 | 2011 | ||||||||||
| (In thousands) | ||||||||||||
| LTE |
$ | — | $ | 929 | $ | 35,183 | ||||||
| WiMAX |
16,719 | 25,468 | 30,210 | |||||||||
| RF and other products(1) |
5,709 | 6,682 | 3,251 | |||||||||
|
|
|
|
|
|
|
|||||||
| Total |
$ | 22,428 | $ | 33,079 | $ | 68,644 | ||||||
|
|
|
|
|
|
|
|||||||
| (1) | Other products include our WLAN, CDMA and other products related to prior generation technologies. |
We sell our products to our customers directly or through distributors, with substantially all of our revenue coming from outside the United States because many of our customers or their contract manufacturers are located in Asia. The percentage of our total revenues for each geographic region, based on the billing address of our customers, is as follows:
| Years Ended June 30, | ||||||||||||
| 2009 | 2010 | 2011 | ||||||||||
| United States |
1 | % | 1 | % | 1 | % | ||||||
| Korea |
57 | 70 | 87 | |||||||||
| China |
25 | 20 | 4 | |||||||||
| Japan |
6 | 1 | 1 | |||||||||
| Taiwan |
10 | 7 | 7 | |||||||||
| Other |
1 | 1 | — | |||||||||
|
|
|
|
|
|
|
|||||||
| Total |
100 | % | 100 | % | 100 | % | ||||||
|
|
|
|
|
|
|
|||||||
During the periods presented, we generated a majority of our total revenue from a small number of key customers. During the year ended June 30, 2011, 87% of our revenues were derived from customers with billing addresses in Korea, including certain significant customers. However, most of the products purchased by these customers were incorporated into their devices that were sold and shipped to their customers throughout the United States and other countries. Our revenues attributable to our largest customers during the years ended June 30, 2009, 2010 and 2011 were as follows (as a percentage of total revenues):
| Years Ended June 30, | ||||||||||||
| 2009 | 2010 | 2011 | ||||||||||
| China Electronic Appliance Shenzhen Co., Ltd (CEAC). |
14 | % | 19 | % | * | |||||||
| Daejin Semiconductor Co., Ltd |
11 | % | 42 | % | 19 | % | ||||||
| LG Electronics, Inc. |
* | * | 48 | % | ||||||||
| SK Telecom Co. Ltd. |
29 | % | * | * | ||||||||
| * | less than 10% |
Cost of Revenues and Gross Profit
Cost of revenues consists of direct and indirect costs related to the manufacture of our products. Direct costs include costs of wafers manufactured by third-party foundries and costs relating to assembly and testing performed by third-party manufacturing suppliers. Indirect costs consist of allocated overhead for employee benefits and facility costs and the amortization of our mask sets, royalties, personnel costs, including share-based compensation expense and valuation provisions for excess and obsolete inventory and warranty costs. Our
50
Table of Contents
historical experience has been that over the life cycle of a particular product, the cost of revenues as a percentage of total revenue has typically declined as a result of decreases in our product costs. The decrease in cost generally results from an increase in the volume purchased from manufacturing suppliers, as well as yield improvements and assembly and test enhancements.
Our gross profit fluctuates due to several factors, including new product introductions and upgrades to existing products, changes in customer and product mixes, the mix of product demand, shipment volumes, our product costs, pricing and inventory write downs. We expect cost of revenues to increase in absolute dollars as our sales continue to increase.
Operating Expenses
Operating expenses consist primarily of research and development, sales and marketing, and general and administrative expenses. Personnel costs, which consist of salaries, bonuses, benefits and stock-based compensation, are the most significant component of each of these expense categories. Professional services costs primarily consist of fees for outside legal, accounting and tax services. We expect our operating expenses to continue to grow in absolute dollars in the near term, although they are likely to fluctuate as a percentage of revenue.
Research and Development
Research and development expenses are expensed as incurred. Our primary research and development function is performed in South Korea. Research and development costs include personnel costs, consultant costs, prototype expenses, mask set costs that are not expected to be used in production manufacturing, allocated facilities costs and depreciation of equipment used in our research and development activities. In addition, amounts received in connection with government grants and work performed under development contracts (nonrecurring engineering or “NRE”) prior to completion of related milestones are deferred and recognized as an offset to the research and development expense upon achievement and acceptance of the specified milestones. During the years ended June 30, 2009, 2010 and 2011, we recognized the following amounts related to these NRE contracts and government grants as offsets to research and development expenses:
| Years Ended June 30, | ||||||||||||
| 2009 | 2010 | 2011 | ||||||||||
| (In thousands) | ||||||||||||
| Gross research and development |
$ | 16,931 | $ | 18,924 | $ | 20,366 | ||||||
| NRE and government grants |
(5,342 | ) | (1,103 | ) | (7,691 | ) | ||||||
|
|
|
|
|
|
|
|||||||
| Research and development expense |
$ | 11,589 | $ | 17,821 | $ | 12,675 | ||||||
|
|
|
|
|
|
|
|||||||
We expect our research and development expenses to increase for the foreseeable future as we continue to invest substantial internal resources to develop and improve our systems and expand into other or adjacent vertical markets. However, our research and development expenses have historically been significantly impacted by the timing and recognition of NRE reimbursements and government grants. Our NRE reimbursements and government grants will fluctuate depending upon our selection of NRE bearing opportunities that align with our strategic goals and product roadmap. We expect our NRE reimbursements and government grants to decline as we are able to be more selective in our criteria for pursuing these NRE arrangements. As a result, we currently cannot estimate the extent of our future NRE arrangements as they are generally event and negotiation driven and may not coincide with the future plans of our business.
Sales and Marketing
Our sales and marketing expenses consist primarily of personnel costs, sales commissions, travel costs, costs for marketing programs and industry conferences and allocated facilities costs. We plan to continue to invest in sales and marketing and increase the number of our sales personnel worldwide.
51
Table of Contents
General and Administrative
Our general and administrative expenses consist primarily of personnel costs, allocated facilities costs and other expenses for outside professional services, including legal, audit, tax and accounting services. We expect to incur additional expenses as a result of operating as a public company, including costs to comply with the rules and regulations applicable to companies listed on the NASDAQ Stock Market, including Sarbanes-Oxley compliance and SEC reporting and compliance, as well as increased expenses related to additional insurance, investor relations and other increases related to needs for additional human resources and professional services.
Interest Income
Interest income consists primarily of interest received on our cash and cash equivalent balances.
Interest Expense
Interest expense consists primarily of interest on our outstanding bank borrowings, convertible notes payable, convertible notes to a related party and related party notes payable.
Other Income (Expense)
Other income (expense) primarily includes gains and losses from the remeasurement of our liabilities related to our preferred stock warrants and foreign currency derivative instruments to fair value at each period end and the impact of gains or losses related to the remeasurement of monetary accounts denominated in non-U.S. currencies, such as intercompany accounts receivables and payables, third-party accounts payables, notes payable to a related party, convertible notes or bank borrowings, to the U.S. dollar. We will continue to record adjustments to the fair value of our preferred stock warrants reflecting changes in the underlying value of the shares until the earlier of the exercise or expiration of the warrants, the conversion of the underlying shares of our preferred stock, or the completion of a liquidation event, including the completion of an initial public offering, at which time all unexercised warrants will expire. We will also continue to record adjustments to the fair value of our foreign currency derivative instruments until the related convertible notes are converted to preferred stock, the conversion of the underlying shares of preferred stock, or the completion of a liquidity event, including the completion of an initial public offering, at which time the embedded derivatives will be settled.
Provision for (Benefit from) Income Taxes
We are subject to income taxes in both the United States and foreign jurisdictions and use estimates in determining our provision for income taxes. This process involves estimating actual current tax assets and liabilities together with assessing temporary differences resulting from differing treatment of items for tax and accounting purposes. These differences result in deferred tax assets and liabilities, which are recorded on the consolidated balance sheets. Net deferred tax assets are recorded to the extent we believe that these assets will more likely than not be realized. In making such determination, all available positive and negative evidence is considered, including scheduled reversals of deferred tax liabilities, projected future taxable income, tax planning strategies and recent financial operations. We maintained a full valuation allowance against our net deferred tax assets as of June 30, 2010 and 2011 because we believe that it is not more likely than not that the gross deferred tax assets will be realized. While we have considered future taxable income and ongoing prudent and feasible tax planning strategies in assessing the need for a valuation allowance, in the event we were to determine that we would be able to realize our deferred tax assets in the future, an adjustment to the deferred tax assets would increase net income in the period such a determination was made.
Deferred tax assets and liabilities are recognized for the future tax consequences attributable to differences between financial statement carrying amounts of existing assets and liabilities and their respective tax basis, as well as operating loss and tax credit carry forwards. Deferred tax assets and liabilities are measured using enacted
52
Table of Contents
tax rates expected to be applied to taxable income in the years in which those temporary differences are expected to be recovered or settled. The effect on deferred tax assets and liabilities of a change in tax rates is recognized in income in the period that includes the enactment date.
Results of Operations
The following tables set forth our results of operations for the periods presented and as a percentage of our total revenue for those periods. The period-to-period comparison of financial results is not necessarily indicative of financial results to be achieved in future periods. The following two tables present our historical operating results first in dollars and then as a percentage of total revenues for the periods presented:
| Years Ended June 30, | ||||||||||||||||||||||||
| 2009 | 2010 | 2011 | ||||||||||||||||||||||
| $ | % of revenue |
$ | % of revenue |
$ | % of revenue |
|||||||||||||||||||
| (In thousands) | ||||||||||||||||||||||||
| Revenues |
$ | 22,428 | 100 | % | $ | 33,079 | 100 | % | $ | 68,644 | 100 | % | ||||||||||||
| Cost of revenues(1) |
19,455 | 87 | 24,288 | 73 | 45,398 | 66 | ||||||||||||||||||
|
|
|
|
|
|
|
|
|
|
|
|
|
|||||||||||||
| Gross profit |
2,973 | 13 | 8,791 | 27 | 23,246 | 34 | ||||||||||||||||||
| Operating expenses: |
||||||||||||||||||||||||
| Research and development(1) |
11,589 | 52 | 17,821 | 54 | 12,675 | 18 | ||||||||||||||||||
| Sales and marketing(1) |
4,508 | 20 | 4,780 | 14 | 5,279 | 8 | ||||||||||||||||||
| General and administrative(1) |
3,730 | 16 | 3,257 | 10 | 5,853 | 9 | ||||||||||||||||||
|
|
|
|
|
|
|
|
|
|
|
|
|
|||||||||||||
| Total operating expenses |
19,827 | 88 | 25,858 | 78 | 23,807 | 35 | ||||||||||||||||||
|
|
|
|
|
|
|
|
|
|
|
|
|
|||||||||||||
| Income (loss) from operations |
(16,854 | ) | (75 | ) | (17,067 | ) | (51 | ) | (561 | ) | (1 | ) | ||||||||||||
| Interest income |
76 | — | 49 | — | 43 | — | ||||||||||||||||||
| Interest expense |
(782 | ) | (3 | ) | (1,540 | ) | (5 | ) | (2,315 | ) | (3 | ) | ||||||||||||
| Other income (expense), net |
3,588 | 16 | (1,171 | ) | (3 | ) | (8,918 | ) | (13 | ) | ||||||||||||||
|
|
|
|
|
|
|
|
|
|
|
|
|
|||||||||||||
| Loss before income taxes |
(13,972 | ) | (62 | ) | (19,729 | ) | (59 | ) | (11,751 | ) | (17 | ) | ||||||||||||
| Provision for (benefit from) income taxes |
569 | 3 | 196 | 1 | (222 | ) | — | |||||||||||||||||
|
|
|
|
|
|
|
|
|
|
|
|
|
|||||||||||||
| Net loss |
$ | (14,541 | ) | (65 | )% | $ | (19,925 | ) | (60 | )% | $ | (11,529 | ) | (17 | )% | |||||||||
|
|
|
|
|
|
|
|
|
|
|
|
|
|||||||||||||
| (1) | Our stock-based compensation was as follows: |
| Years Ended June 30, | ||||||||||||
| 2009 | 2010 | 2011 | ||||||||||
| (In thousands) | ||||||||||||
| Cost of revenues |
$ | 3 | $ | 2 | $ | 32 | ||||||
| Research and development |
46 | 48 | 756 | |||||||||
| Sales and marketing |
16 | 21 | 215 | |||||||||
| General and administrative |
7 | 8 | 332 | |||||||||
|
|
|
|
|
|
|
|||||||
| Total stock-based compensation |
$ | 72 | $ | 79 | $ | 1,335 | ||||||
|
|
|
|
|
|
|
|||||||
53
Table of Contents
Comparison of the Years Ended June 30, 2010 and 2011
The following table presents our historical operating results and the changes in these results in dollars and as a percentage for the periods presented:
| Years Ended June 30, | Increase / (Decrease) |
% Increase / (Decrease) |
||||||||||||||
| 2010 | 2011 | |||||||||||||||
| (Dollars in thousands) | ||||||||||||||||
| Revenues |
$ | 33,079 | $ | 68,644 | $ | 35,565 | 108 | % | ||||||||
| Cost of revenues |
24,288 | 45,398 | 21,110 | 87 | ||||||||||||
|
|
|
|
|
|
|
|||||||||||
| Gross profit |
8,791 | 23,246 | 14,455 | 164 | ||||||||||||
| Operating expenses: |
||||||||||||||||
| Research and development |
17,821 | 12,675 | (5,146 | ) | (29 | ) | ||||||||||
| Sales and marketing |
4,780 | 5,279 | 499 | 10 | ||||||||||||
| General and administrative |
3,257 | 5,853 | 2,596 | 80 | ||||||||||||
|
|
|
|
|
|
|
|||||||||||
| Total operating expenses |
25,858 | 23,807 | (2,051 | ) | (8 | ) | ||||||||||
|
|
|
|
|
|
|
|||||||||||
| Income (loss) from operations |
(17,067 | ) | (561 | ) | (16,506 | ) | (97 | ) | ||||||||
| Interest income |
49 | 43 | (6 | ) | (12 | ) | ||||||||||
| Interest expense |
(1,540 | ) | (2,315 | ) | 775 | 50 | ||||||||||
| Other income (expense), net |
(1,171 | ) | (8,918 | ) | 7,747 | 662 | ||||||||||
|
|
|
|
|
|
|
|||||||||||
| Loss before income taxes |
(19,729 | ) | (11,751 | ) | (7,978 | ) | (40 | ) | ||||||||
| Provision for (benefit from) income taxes |
196 | (222 | ) | (418 | ) | (213 | ) | |||||||||
|
|
|
|
|
|
|
|||||||||||
| Net loss |
$ | (19,925 | ) | $ | (11,529 | ) | $ | (8,396 | ) | (42 | ) | |||||
|
|
|
|
|
|
|
|||||||||||
Revenues
Revenues for the year ended June 30, 2011 were $68.6 million, an increase of $35.6 million, or 108%, compared to revenues of $33.1 million for the year ended June 30, 2010. The overall increase was primarily due to the introduction of our LTE single-chip solution for 4G mobile terminals in the year ended June 30, 2010 and the subsequent $34.2 million increase in LTE revenues during the year ended June 30, 2011 to $35.2 million from $1.0 million in the year ended June 30, 2010, which was primarily due to a significant increase in the volume of sales of the LTE products as they were introduced late in the year ended June 30, 2010. Our increased revenues also reflected a $4.7 million increase in WiMAX revenues during the year ended June 30, 2011 to $30.2 million from $25.5 million in the year ended June 30, 2010, due primarily to a 40% increase in the volume of sales of our WiMAX solutions for 4G mobile terminals, which was partially offset by a 10% decrease in average selling prices for these products. These increases, however, were partially offset by a $3.4 million decrease in our RF and other product revenues during the year ended June 30, 2011 to $3.3 million from $6.7 million in the year ended June 30, 2010, due primarily to a 59% decrease in the volume of sales of our RF and other products.
Cost of Revenues and Gross Profit
Cost of revenues for the year ended June 30, 2011 was $45.4 million, an increase of $21.1 million, or 87%, compared to cost of revenues of $24.3 million for the year ended June 30, 2010. Similarly, gross profit for the year ended June 30, 2011 was $23.2 million, an increase of $14.5 million, or 164%, compared to gross profit of $8.8 million for the year ended June 30, 2010. The increases in cost of revenues and gross profit were primarily the result of the volume increases in sales of our LTE and WiMAX solutions during the year ended June 30, 2011. Our gross margins increased from 27% for the year ended June 30, 2010 to 34% for the year ended June 30, 2011. This increase in gross margins was due primarily to changes in product mix and yield, and the magnitude of this increase was partially offset by reduced sales of our WiMAX platforms, which generally produce higher average gross margins, during the year ended June 30, 2011 compared to the same period in 2010. In addition, inventory write-downs through cost of revenues were $3.1 million during the year ended June 30, 2010, compared to a write-down of $1.4 million during the year ended June 30, 2011. Inventory write-downs in the year ended June 30, 2010 were primarily a result of excess inventory due to a general slowdown in
54
Table of Contents
the economy related to the financial crisis that occurred during the year ended June 30, 2009, which continued into the year ended June 30, 2010, combined with product transitions during this period.
Research and Development
Gross research and development expenses were $20.4 million for the year ended June 30, 2011, an increase of $1.5 million or 8%, compared to gross research and development expenses for the year ended June 30, 2010. Research and development expenses, net of NRE and government grants, were $12.7 million for the year ended June 30, 2011, a decrease of $5.1 million, or 29%, compared to research and development expenses of $17.8 million for the year ended June 30, 2010. This decrease was driven primarily by the achievement of NRE development contract milestones, which were recognized as an offset to research and development expenses, in the amount of $1.1 million during the year ended June 30, 2010 compared to $7.7 million during the year ended June 30, 2011.
Sales and Marketing
Sales and marketing expenses were $5.3 million for the year ended June 30, 2011, an increase of $0.5 million, or 10%, compared to sales and marketing expenses of $4.8 million during the year ended June 30, 2010. This slight increase was primarily the result of increased personnel cost.
General and Administrative
General and administrative expenses were $5.9 million for the year ended June 30, 2011, an increase of $2.6 million, or 80%, compared to general and administrative expenses of $3.3 million for the year ended June 30, 2010. This increase was comprised primarily of increased personnel cost but also increased professional services such as legal, audit and other accounting expenses as we grew our business and began contemplating our initial public offering (IPO).
Interest Income
Interest income was $43,000 for the year ended June 30, 2011, a decrease of $6,000, or 12%, compared to interest income of $49,000 for the year ended June 30, 2010. This decrease was due primarily to us carrying lower average cash and cash equivalent balances combined with lower average interest rates during the year ended June 30, 2011.
Interest Expense
Interest expense was $2.3 million for the year ended June 30, 2011, an increase of $0.8 million, or 50%, compared to interest expense of $1.5 million for the year ended June 30, 2010. This increase was primarily due to the incremental interest expense associated with the issuance of $21.6 million in convertible notes payable during the year ended June 30, 2011. Total indebtedness, consisting of bank borrowings, notes payable to a related party, convertible notes payable and convertible notes payable to a related party, increased from $23.8 million as of June 30, 2010 to $44.9 million as of June 30, 2011.
Other Income (Expense), net
Other expense was $8.9 million for the year ended June 30, 2011, an increase of $7.7 million, or 662%, compared to other expense of $1.2 million for the year ended June 30, 2010. This increase was primarily due to charges reflecting the increase in the fair value of the liabilities related to our preferred stock warrants issued to our lenders in the amount of $5.3 million and foreign currency derivative instruments embedded in our Korean won based notes payable in the amount of $1.1 million.
55
Table of Contents
Provision for (Benefit from) Income Taxes
Our benefit from income taxes was $0.2 million for the year ended June 30, 2011 compared to the provision for income taxes of $0.2 million for the year ended June 30, 2010. The change to the income taxes was primarily a result of the reversal of uncertain tax positions due to the statutes of limitation expiring for our Korean subsidiaries during the year ended June 30, 2011.
Comparison of the Years Ended June 30, 2009 and 2010
| Years Ended June 30, | Increase / |
% Increase / (Decrease) |
||||||||||||||
| 2009 | 2010 | |||||||||||||||
| (Dollars in thousands) | ||||||||||||||||
| Revenues |
$ | 22,428 | $ | 33,079 | $ | 10,651 | 47 | % | ||||||||
| Cost of revenues |
19,455 | 24,288 | 4,833 | 25 | ||||||||||||
|
|
|
|
|
|
|
|||||||||||
| Gross profit |
2,973 | 8,791 | 5,818 | 196 | ||||||||||||
| Operating expenses: |
||||||||||||||||
| Research and development |
11,589 | 17,821 | 6,232 | 54 | ||||||||||||
| Sales and marketing |
4,508 | 4,780 | 272 | 6 | ||||||||||||
| General and administrative |
3,730 | 3,257 | (473 | ) | (13 | ) | ||||||||||
|
|
|
|
|
|
|
|||||||||||
| Total operating expenses |
19,827 | 25,858 | 6,031 | 30 | ||||||||||||
|
|
|
|
|
|
|
|||||||||||
| Loss from operations |
(16,854 | ) | (17,067 | ) | 213 | 1 | ||||||||||
| Interest income |
76 | 49 | (27 | ) | (36 | ) | ||||||||||
| Interest expense |
(782 | ) | (1,540 | ) | 758 | 97 | ||||||||||
| Other income (expense), net |
3,588 | (1,171 | ) | (4,759 | ) | (133 | ) | |||||||||
|
|
|
|
|
|
|
|||||||||||
| Loss before income taxes |
(13,972 | ) | (19,729 | ) | 5,757 | 41 | ||||||||||
| Provision for income taxes |
569 | 196 | (373 | ) | (66 | ) | ||||||||||
|
|
|
|
|
|
|
|||||||||||
| Net loss |
$ | (14,541 | ) | $ | (19,925 | ) | $ | 5,384 | 37 | |||||||
|
|
|
|
|
|
|
|||||||||||
Revenues
Revenues for the year ended June 30, 2010 were $33.1 million, an increase of $10.7 million, or 47%, compared to revenues of $22.4 million for the year ended June 30, 2009. This increase was primarily due to a $8.7 million increase in WiMAX revenues for the year ended June 30, 2010 due to both a 22% increase in volume sales of our WiMAX solutions for 4G mobile terminals as well as a 16% increase in average selling prices for these products. In addition, we also recognized a $0.9 million increase in LTE revenues due to an increase in sales of our LTE products which were introduced during the year ended June 30, 2010. We also recognized a $1.0 million increase in our RF and other revenues during the year ended June 30, 2010 due primarily to a 56% increase in the volume of sales of our RF and other products. These increases in sales of our products were primarily the result of the recovery of the economy after the global recession, which began in the early part of our fiscal year ended June 30, 2009, and the related increase in customer demand and average selling prices of our WiMAX products.
Cost of Revenues and Gross Profit
Cost of revenues for the year ended June 30, 2010 was $24.3 million, an increase of $4.8 million, or 25%, compared to cost of revenues of $19.5 million for the year ended June 30, 2009. Similarly, gross profit for the year ended June 30, 2010 was $8.8 million, an increase of $5.8 million, or 196%, compared to gross profit of $3.0 million for the year ended June 30, 2009. These increases in cost of revenues and gross profit were primarily the result of the volume increases in sales of our WiMAX solutions during the year ended June 30, 2010, as a result of increased customer demand following the financial crisis in the early part of our fiscal year ended June 30, 2009. Inventory write-downs for excess and obsolete inventories were $5.1 million during the year ended June 30, 2009 compared to inventory write-downs of $3.1 million during the year ended June 30, 2010. Inventory write-downs in the year ended June 30, 2010 were primarily a result of excess inventory due to a
56
Table of Contents
general slowdown in the economy related to the financial crisis that occurred during the year ended June 30, 2009, which continued into the year ended June 30, 2010, combined with product transitions during this period. In addition, gross margins increased significantly to 27% for the year ended June 30, 2010 from 13% for the year ended June 30, 2009. This increase was primarily the result of higher average selling prices and increased volume shipment during the year ended June 30, 2010 due to increased customer demand, but also, to a lesser extent, product mix within our WiMAX products, including increases in sales of our WiMAX platforms during the year which generally produce higher average gross margins.
Research and Development
Gross research and development expenses were $18.9 million for the year ended June 30, 2010, a decrease of $2.0 million or 12%, compared to gross research and development expenses for the year ended June 30, 2009. Research and development expenses, net of NRE and government grants, were $17.8 million for the year ended June 30, 2010, an increase of $6.2 million, or 54%, compared to research and development expenses of $11.6 million for the year ended June 30, 2009. This increase was driven primarily by the achievement of NRE development contract milestones, which are deferred and recognized as an offset to research and development expenses, in the amount of $5.3 million during the year ended June 30, 2009 compared to $1.1 million during the year ended June 30, 2010. This decrease was primarily due to the application of a more selective criteria for entering into these NRE arrangements during the year ended June 30, 2010. In addition, we made additional investments aimed to enhance our product offerings, which caused a general increase in our research and development activities. Research and development expenses included a $3.2 million increase in pre-production expenses, including costs related to pre-production masks and wafers, third-party design automation support, test development and product reliability activities, during the year ended June 30, 2010. These increases were partially offset by a reduction in personnel cost in the amount of $1.3 million necessitated by the general economic downturn and lower average headcount in our research and development function and certain salary decreases during the year ended June 30, 2010 compared to the year ended June 30, 2009. We also recognized an out-of-period adjustment during the year ended June 30, 2009 to correct an expense in the year ended June 30, 2008 related to our preferred stock warrants which reduced research and development expense by $1.1 million.
Sales and Marketing
Sales and marketing expenses were $4.8 million for the year ended June 30, 2010, an increase of $0.3 million, or 6%, compared to sales and marketing expenses of $4.5 million for the year ended June 30, 2009, primarily due to increases in travel related expenses for our sales team, which were partially offset by a decrease in personnel cost in the amount of $0.4 million and in advertising and promotional samples in the amount of $0.4 million during the year ended June 30, 2010.
General and Administrative
General and administrative expenses were $3.3 million for the year ended June 30, 2010, a decrease of $0.5 million, or 13%, compared to general and administrative expenses of $3.7 million for the year ended June 30, 2009, primarily due to a reduction in personnel cost in the amount of $0.7 million resulting from the timing of the hiring and termination of our general and administrative staff during the respective periods and certain salary decreases during the year ended June 30, 2010.
Interest Income
Interest income was $49,000 for the year ended June 30, 2010, a decrease of $27,000, or 36%, compared to interest income of $76,000 for the year ended June 30, 2009. This decrease was due primarily to us carrying lower average cash and cash equivalent balances during the year ended June 30, 2010.
57
Table of Contents
Interest Expense
Interest expense was $1.5 million for the year ended June 30, 2010, an increase of $0.8 million, or 97%, compared to interest expense of $0.8 million for the year ended June 30, 2009. This increase was primarily due to the timing of when we entered into or paid off our indebtedness during the respective periods as well as the incremental interest expense associated with the increases in our outstanding indebtedness during the year ended June 30, 2010. Total indebtedness, consisting of bank borrowings, notes payable to a related party, convertible notes payable and convertible notes payable to a related party, increased from $21.8 million as of June 30, 2009 to $23.8 million as of June 30, 2010.
Other Income (Expense), net
Other expense was $1.2 million for the year ended June 30, 2010 compared to other income of $3.6 million for the year ended June 30, 2009. This change primarily relates to gains on the remeasurement of the fair value of our preferred stock warrant liability in the amount of $4.6 million during the year ended June 30, 2009 compared to a gain of $0.2 million during the year ended June 30, 2010. The remeasurement of the warrants during the year ended June 30, 2009 resulted in a gain due to the declining fair value of the underlying preferred stock while, in the year ended June 30, 2010, the remeasurement resulted in a charge as a result of the increasing fair value of the preferred stock. This decrease in gains was partially offset by gains from the remeasurement of monetary balances denominated in non-U.S. currencies. We also recognized an out of period adjustment to correct an expense related to our preferred stock warrants which reduced other income (expense) by $0.4 million during the year ended June 30, 2009.
Provision for (Benefit from) Income Taxes
Our provision for income taxes for the year ended June 30, 2010 was $0.2 million, a decrease of $0.4 million, or 66%, compared to our provision of $0.6 million for the year ended June 30, 2009. This decrease was primarily due to a $0.5 million decrease in taxes payable by our Korean subsidiaries.
58
Table of Contents
Quarterly Results of Operations
The following unaudited quarterly consolidated statements of operations for the six quarters in the period ended June 30, 2011 have been prepared on a basis consistent with our audited annual consolidated financial statements and include, in the opinion of management, all normal recurring adjustments necessary for the fair statement of the financial information contained in those statements. The following consolidated quarterly financial data should be read in conjunction with our annual consolidated financial statements and the related notes included elsewhere in this prospectus.
| Three Months Ended | ||||||||||||||||||||||||
| March 31, 2010 |
June 30, 2010 |
September 30, 2010 |
December 31, 2010 |
March 31, 2011 |
June 30, 2011 |
|||||||||||||||||||
| (In thousands) | ||||||||||||||||||||||||
| Consolidated Statement of Operations Data: |
||||||||||||||||||||||||
| Revenues(1) |
$ | 7,068 | $ | 10,830 | $ | 6,718 | $ | 19,672 | $ | 20,932 | $ | 21,322 | ||||||||||||
| Cost of revenues |
4,939 | 7,736 | 4,078 | 12,533 | 13,929 | 14,858 | ||||||||||||||||||
|
|
|
|
|
|
|
|
|
|
|
|
|
|||||||||||||
| Gross profit |
2,129 | 3,094 | 2,640 | 7,139 | 7,003 | 6,464 | ||||||||||||||||||
| Operating expenses: |
||||||||||||||||||||||||
| Research and development(2) |
5,014 | 5,595 | 3,773 | 3,368 | 2,719 | 2,815 | ||||||||||||||||||
| Sales and marketing |
1,301 | 1,285 | 1,007 | 1,209 | 1,448 | 1,615 | ||||||||||||||||||
| General and administrative |
871 | 1,061 | 931 | 969 | 1,146 | 2,807 | ||||||||||||||||||
|
|
|
|
|
|
|
|
|
|
|
|
|
|||||||||||||
| Total operating expenses |
7,186 | 7,941 | 5,711 | 5,546 | 5,313 | 7,237 | ||||||||||||||||||
|
|
|
|
|
|
|
|
|
|
|
|
|
|||||||||||||
| Income (loss) from operations |
(5,057 | ) | (4,847 | ) | (3,071 | ) | 1,593 | 1,690 | (773 | ) | ||||||||||||||
| Interest income |
8 | 18 | 7 | 8 | 9 | 19 | ||||||||||||||||||
| Interest expense |
(406 | ) | (443 | ) | (465 | ) | (582 | ) | (632 | ) | (636 | ) | ||||||||||||
| Other income (expense), net |
(889 | ) | 1,718 | (2,908 | ) | (1,840 | ) | (2,478 | ) | (1,692 | ) | |||||||||||||
|
|
|
|
|
|
|
|
|
|
|
|
|
|||||||||||||
| Loss before income taxes |
(6,344 | ) | (3,554 | ) | (6,437 | ) | (821 | ) | (1,411 | ) | (3,082 | ) | ||||||||||||
| Provision for (benefit from) income taxes |
268 | 12 | (229 | ) | (261 | ) | (100 | ) | 368 | |||||||||||||||
|
|
|
|
|
|
|
|
|
|
|
|
|
|||||||||||||
| Net loss |
$ | (6,612 | ) | $ | (3,566 | ) | $ | (6,208 | ) | $ | (560 | ) | $ | (1,311 | ) | $ | (3,450 | ) | ||||||
|
|
|
|
|
|
|
|
|
|
|
|
|
|||||||||||||
| Net loss attributable to common stockholders |
$ | (8,845 | ) | $ | (5,799 | ) | $ | (8,441 | ) | $ | (2,792 | ) | $ | (3,544 | ) | $ | (5,964 | ) | ||||||
|
|
|
|
|
|
|
|
|
|
|
|
|
|||||||||||||
| Net loss per share attributable to common stockholders, basic and diluted |
$ | (0.42 | ) | $ | (0.27 | ) | $ | (0.40 | ) | $ | (0.13 | ) | $ | (0.16 | ) | $ | (0.27 | ) | ||||||
|
|
|
|
|
|
|
|
|
|
|
|
|
|||||||||||||
| Weighted average shares used in computing net loss per share attributable to common stockholders, basic and diluted |
20,812,917 | 21,204,335 | 21,320,928 | 21,356,231 | 21,528,865 | 22,173,484 | ||||||||||||||||||
|
|
|
|
|
|
|
|
|
|
|
|
|
|||||||||||||
|
(1) We recognized revenue attributable to our LTE, WiMAX and RF and other products as follows:
|
| |||||||||||||||||||||||
| Three Months Ended | ||||||||||||||||||||||||
| March 31, 2010 |
June 30, 2010 |
September 30, 2010 |
December 31, 2010 |
March 31, 2011 |
June 30, 2011 |
|||||||||||||||||||
| (In thousands) | ||||||||||||||||||||||||
| LTE |
$ | 6 | $ | 923 | $ | 2,133 | $ | 11,965 | $ | 9,786 | $ | 11,299 | ||||||||||||
| WiMAX |
4,661 | 8,166 | 3,836 | 6,972 | 10,514 | 8,888 | ||||||||||||||||||
| RF and other products |
2,401 | 1,741 | 749 | 735 | 632 | 1,135 | ||||||||||||||||||
|
|
|
|
|
|
|
|
|
|
|
|
|
|||||||||||||
| Total revenues |
$ | 7,068 | $ | 10,830 | $ | 6,718 | $ | 19,672 | $ | 20,932 | $ | 21,322 | ||||||||||||
|
|
|
|
|
|
|
|
|
|
|
|
|
|||||||||||||
| (2) We recognized the following amounts from NRE contracts and government grants as an offset to research and development expenses as follows:
|
| |||||||||||||||||||||||
| Three Months Ended | ||||||||||||||||||||||||
| March 31, 2010 |
June 30, 2010 |
September 30, 2010 |
December 31, 2010 |
March 31, 2011 |
June 30, 2011 |
|||||||||||||||||||
| (In thousands) | ||||||||||||||||||||||||
| Gross research and development |
$ | 5,114 | $ | 5,595 | $ | 3,773 | $ | 4,451 | $ | 5,006 | $ | 7,136 | ||||||||||||
| NRE and government grants |
(100 | ) | — | — | (1,083 | ) | (2,287 | ) | (4,321 | ) | ||||||||||||||
|
|
|
|
|
|
|
|
|
|
|
|
|
|||||||||||||
| Research and development |
$ | 5,014 | $ | 5,595 | $ | 3,773 | $ | 3,368 | $ | 2,719 | $ | 2,815 | ||||||||||||
59
Table of Contents
Quarterly Trends
Revenues
Our total revenue increased sequentially in each of the quarters presented, with the exception of the quarter ended September 30, 2010, primarily due to the fluctuation of WiMAX sales as described below. Total revenue thereafter increased each quarter primarily as a result of the introduction of our LTE single-chip solution for 4G mobile terminals and subsequent increases in the volume of our WiMAX and LTE products sold. Within the different product lines, we experienced multiple fluctuations between LTE, WiMAX and RF and other products during the quarters presented primarily as a result of changes in product mix and average selling prices during the respective periods. In particular, our LTE revenue increased each quarter until March 31, 2011 when a decrease occurred primarily related to lower average selling prices (ASP) for our LTE product sold to our lead LTE customer. This occurred as part of the anticipated transition to the next generation of lower ASP LTE products. As planned, this reduction was mostly offset by increased sales volume to our lead LTE customer for these products which continued through the quarter ended June 30, 2011. Our WiMAX sales fluctuated during the quarters presented as a result of several factors, including customer purchase patterns, supply availability, wireless operators’ ramp and ASP. As our focus shifted more towards our LTE and WiMAX products, we experienced a general decline in our sales of our RF and other products during the quarters presented; however, an increase occurred during the quarter ended June 30, 2011 as a result of a large sell-through order for a new product with higher ASPs.
Cost of Revenues
Similar to our total revenue, our total cost of revenues increased sequentially in each of the quarters presented, with the exception of the quarter ended September 30, 2010. Total cost of revenues thereafter increased primarily as a result of the introduction of our LTE single-chip solution for 4G mobile terminals and subsequent increases in the volume of our WiMAX and LTE products sold during the year ended June 30, 2011. We also recognized inventory write-downs through cost of revenues in the amount of $0.5 million, $1.0 million, $1.2 million, $0.1 million and $0.2 million during the quarters ended March 31, June 30 and December 31, 2010, March 31 and June 30, 2011, respectively, but did not recognize any inventory write-downs during the quarter ended September 30, 2010. The inventory write-downs during our fiscal year ended June 30, 2010 were primarily a result of excess inventory due to a general slowdown in the economy related to the financial crisis that occurred during the year ended June 30, 2009, which continued into the year ended June 30, 2010. We also recognized an inventory write-down during the quarters ended December 31, 2010 and June 30, 2011 as a result of a buildup of early generation LTE products during the year ended June 30, 2011 as our customers moved to newer products. During the quarters presented we also experienced some fluctuations between the cost of revenues related to our LTE, WiMAX and RF and other products as a result of changes in customer and product mixes and yield.
Gross Profit
Our gross profit has fluctuated over the periods presented based on customer and product mixes, changes in inventory reserves and manufacturing variances. Except for a small decrease during the quarter ended September 30, 2010, gross profit increased quarter over quarter through December 31, 2010 due to an overall increase in sales volume. Gross profit was slightly lower in the quarter ended March 31, 2011 as a result of reduction of LTE platform sales after initial purchases of LTE platforms used for the ramped introduction of LG’s smartphone, “Revolution by LG,’’ launched by Verizon, and these platforms generally carry higher margins.
Similar to the gross profit, our gross margins experienced fluctuations over the period presented ranging from a low of 29% during the quarter ended June 30, 2010 to a high of 39% during the quarter ended September 30, 2010. Gross margins increased during the quarter ended September 30, 2010 to 39% as a result of
60
Table of Contents
changes in product mix and yield as well as an increase in sales volume of our LTE and WiMAX chips. The lower gross margin of 29% during the quarter ended June 30, 2010 was due primarily to inventory adjustments in the amount of $1.0 million for slow-moving and obsolete inventory. Our gross margins of 33% and 30% during the quarters ended March 31 and June 30, 2011, respectively, were influenced by lower margins for the ramp-up of LTE products to our lead LTE customer, partially offset by favorable manufacturing variances as cost reduction programs were put into place. The gross margin of 30% for the quarter ended June 30, 2011 was also negatively impacted by the warrants and concessions issued to our lead LTE customer as these warrant charges and concessions in the amount of $0.7 million were recognized as a reduction to our LTE revenue during the quarter.
Research and Development
Our gross research and development expenses, excluding NRE offsets, increased sequentially since the quarter ended September 30, 2010 due primarily to the development and introduction of our LTE single-chip solution for 4G mobile terminals. Our net research and development expenses decreased after the quarter ended June 30, 2010 until a slight increase during the quarter ended June 30, 2011. The general decrease in our net research and development expenses was primarily a result of quarterly changes in the recognition of NRE development contract milestones, which are recognized as an offset to research and development expenses.
Sales and Marketing
Except for slight decreases during the quarters ended June 30 and September 30, 2010, our sales and marketing expense has since increased during the periods presented primarily due to increased personnel cost as we have expanded our sales team.
General and Administrative
Except for a slight decrease during the quarter ended September 30, 2010, our general and administrative expense generally increased during the periods presented primarily due to the addition of staff and professional services to support our expanding operations. A more significant increase occurred during the quarter ended June 30, 2011 as we began to prepare for the proposed IPO.
We base our planned operating expenses on our expectations of future net revenue. If net revenue for a particular quarter is lower than expected, we may be unable to proportionately reduce our operating expenses. As a result, we believe that period-to-period comparisons of our past operating results should not be relied upon as an indication of our future performance.
Interest Expense, net
Interest expense trended higher over the periods presented primarily as a result of incremental interest expense associated with increases in outstanding indebtedness.
Other Income (Expense), net
Other income (expense) fluctuations are mainly due to gains and losses from the remeasurement of our liabilities related to our preferred stock warrants and foreign currency derivative instruments to fair value at each period end and the impact of gains or losses related to the remeasurement of monetary accounts denominated in non-U.S. currencies, such as intercompany accounts receivables and payables, third-party accounts payables, notes payable to a related party, convertible notes and bank borrowings, to the U.S. dollar. If the fair value of the shares of stock underlying our convertible preferred stock warrants increases, we expect the fair value and the related remeasurement charges to increase and subsequent remeasurement charges could be significant. We will continue to record adjustments to the fair value of our preferred stock warrants reflecting changes in the
61
Table of Contents
underlying value of the shares until the earlier of the exercise or expiration of the warrants, the conversion of the underlying shares of preferred stock, or the completion of a liquidity event, including the completion of an IPO, at which time all unexercised warrants will expire. We will also continue to record adjustments to the fair value of our foreign currency derivative instruments until the related convertible notes are converted to preferred stock, the conversion of the underlying shares of preferred stock, or the completion of a liquidity event, including the completion of an IPO, at which time the embedded derivatives will be settled.
Non-GAAP Financial Measures
We believe that the use of Adjusted EBITDA is helpful for an investor in determining whether to invest in our common stock. Adjusted EBITDA is a financial measure that is not calculated in accordance with generally accepted accounting principles (GAAP). We have provided a reconciliation of Adjusted EBITDA, a non-GAAP financial measure, to our net loss, the most directly comparable financial measure calculated and presented in accordance with GAAP. Adjusted EBITDA should not be considered as an alternative to net loss, operating income or any other measure of financial performance calculated and presented in accordance with GAAP. Our Adjusted EBITDA may not be comparable to similarly titled measures of other organizations because other organizations may not calculate Adjusted EBITDA in the same manner as we do. We have included Adjusted EBITDA in this prospectus because it is a basis upon which our management assesses financial performance and it eliminates the impact of items that we do not consider indicative of our core operating performance. In evaluating Adjusted EBITDA, you should be aware that in the future we will incur expenses similar to the adjustments in this presentation. Our presentation of Adjusted EBITDA should not be construed as an inference that our future results will be unaffected by these expenses or any unusual or non-recurring items.
We include Adjusted EBITDA in this prospectus because (i) we seek to manage our business to a consistent level of Adjusted EBITDA, (ii) it is one of the key bases upon which our management assesses our operating performance and (iii) it is one of the metrics investors may use in evaluating companies performance in our industry. We define Adjusted EBITDA as net income (loss) less interest income (expense), provision for income taxes, depreciation and amortization, foreign currency exchange gain (loss), remeasurement charges related to our preferred stock warrants and embedded foreign currency derivatives and stock-based compensation expense.
We use Adjusted EBITDA as a key performance measure because we believe it facilitates operating performance comparisons from period to period by excluding potential differences caused by variations in capital structures (affecting interest expense), tax positions (such as the impact on periods or companies of changes in effective tax rates or fluctuations in permanent differences or discrete quarterly items), the impact of depreciation and amortization expense on our fixed assets, charges related to the fair value remeasurements of our preferred stock warrants and embedded foreign currency derivatives and the impact of stock-based compensation expense. Because Adjusted EBITDA facilitates internal comparisons of our historical operating performance on a more consistent basis, we also use Adjusted EBITDA for business planning purposes and in evaluating acquisition opportunities.
In addition, we believe Adjusted EBITDA and similar measures are widely used by investors, securities analysts, ratings agencies and other interested parties in our industry as a measure of financial performance and debt-service capabilities. Our use of Adjusted EBITDA has limitations as an analytical tool, and you should not consider it in isolation or as a substitute for analysis of our results as reported under GAAP. Some of these limitations are:
| • | Adjusted EBITDA does not reflect our cash expenditures for capital equipment or other contractual commitments; |
| • | Although depreciation and amortization are non-cash charges, the assets being depreciated and amortized may have to be replaced in the future, and Adjusted EBITDA does not reflect cash capital expenditure requirements for such replacements; |
62
Table of Contents
| • | Adjusted EBITDA does not reflect changes in, or cash requirements for, our working capital needs; |
| • | Adjusted EBITDA does not reflect the significant interest expense or the cash requirements necessary to service interest or principal payments on our indebtedness; |
| • | Adjusted EBITDA does not reflect certain tax payments that may represent a reduction in cash available to us; |
| • | Adjusted EBITDA does not reflect foreign currency exchange gains and losses resulting from transactions denominated in currencies other than the U.S. dollar; and |
| • | Other companies, including companies in our industry, may calculate Adjusted EBITDA measures differently, which reduces their usefulness as a comparative measure. |
Because of these limitations, Adjusted EBITDA should not be considered as a measure of discretionary cash available to us to invest in the growth of our business. When evaluating our performance, you should consider Adjusted EBITDA alongside other financial performance measures, including our net loss and other GAAP results.
The following table presents a reconciliation of Adjusted EBITDA to our net income (loss), the most comparable GAAP measure, for each of the periods indicated:
| Three Months Ended | ||||||||||||||||||||||||
| March 31, 2010 |
June 30, 2010 |
September 30, 2010 |
December 31, 2010 |
March 31, 2011 |
June 30, 2011 |
|||||||||||||||||||
| (In thousands) | ||||||||||||||||||||||||
| Net loss |
$ | (6,612 | ) | $ | (3,566 | ) | $ | (6,208 | ) | $ | (560 | ) | $ | (1,311 | ) | $ | (3,450 | ) | ||||||
| Non-GAAP adjustments: |
||||||||||||||||||||||||
| Interest expense (income), net |
398 | 425 | 458 | 574 | 623 | 617 | ||||||||||||||||||
| Provision for (benefit from) income taxes |
268 | 12 | (229 | ) | (261 | ) | (100 | ) | 368 | |||||||||||||||
| Depreciation and amortization |
104 | 104 | 103 | 114 | 95 | 122 | ||||||||||||||||||
| Remeasurement of liability upon modification of warrants |
— | — | 680 | — | 386 | — | ||||||||||||||||||
| Remeasurement of warrant liability and foreign currency derivative instruments (gain) loss |
(22 | ) | (280 | ) | 883 | 1,668 | 1,648 | 1,127 | ||||||||||||||||
| Foreign currency exchange (gain) loss |
694 | (1,428 | ) | 1,347 | 190 | 535 | 577 | |||||||||||||||||
| Stock-based compensation |
20 | 19 | 15 | 40 | 82 | 1,198 | ||||||||||||||||||
|
|
|
|
|
|
|
|
|
|
|
|
|
|||||||||||||
| Adjusted EBITDA |
$ | (5,150 | ) | $ | (4,714 | ) | $ | (2,951 | ) | $ | 1,765 | $ | 1,958 | $ | 559 | |||||||||
|
|
|
|
|
|
|
|
|
|
|
|
|
|||||||||||||
Liquidity and Capital Resources
Liquidity and Capital Expenditures
Since inception, our operations have been financed primarily by net proceeds of $90.0 million from the issuance of shares of our preferred stock and related warrants and $71.1 million in proceeds from the issuance of indebtedness, consisting of bank borrowings, notes payable to a related party, convertible notes payable and convertible notes payable to a related party. As of June 30, 2011, we carried $18.2 million of cash and cash equivalents. In addition, we have access to an unused line of credit in the amount of $4.5 million as of June 30, 2011.
Our primary uses of cash are to fund operating expenses, purchase inventory and acquire property and equipment. Cash used to fund operating expenses is impacted by our collection of accounts receivable and the timing of when we pay these operating expenses as reflected in the change in our outstanding accounts payable and accrued expenses. We acquired property and equipment of $0.1 million, $0.2 million and $1.1 million during the years ended June 30, 2009, 2010 and 2011, respectively.
63
Table of Contents
We also use cash to repay our outstanding indebtedness. During the years ended June 30, 2009, 2010 and 2011, we used cash of $2.0 million, $0.6 million and $4.1 million, respectively, to repay outstanding bank borrowings and notes payable to a related party. As of June 30, 2011, we had $44.9 million in outstanding indebtedness consisting of bank borrowings, notes payable to a related party, convertible notes payable and convertible notes payable to a related party, of which $42.4 million is considered short-term as it is due for repayment before June 30, 2012. Of these amounts, $22.5 million of the total indebtedness (including accrued interest) is related to our convertible notes payable and convertible notes payable to a related party that will be converted into our preferred stock immediately prior to a filing of a Registration Statement on Form S-1 with the SEC, and $8.9 million of this indebtedness (including accrued interest) is related to our convertible notes payable that will be converted into our preferred stock immediately prior to the completion of our IPO. On September 15, 2011, we filed a registration statement on Form S-1 and as a result, all $22.7 million of convertible notes payable and convertible notes payable to a related party were converted into an aggregate of 18,887,782 shares of our preferred stock. In addition, on or about September 30, 2011 all of the remaining $8.7 million of our convertible notes payable were converted by the holders of these notes into an aggregate of 6,136,941 shares of our preferred stock. Accordingly, we currently do not have any convertible notes outstanding.
We have incurred substantial losses from our operations and therefore have historically relied upon external sources of capital to fund our operations. Our future capital requirements will depend on many factors, including our rate of revenue growth, the expansion of our sales and marketing activities and the timing and extent of our spending to support our research and development efforts and expand into other markets. Our ability to continue to meet our obligations and to achieve our intended business objectives is dependent upon, among other things, refinancing our debt obligations or raising additional capital in order to satisfy those obligations which are due during the 12 months ending June 30, 2012. There can be no assurance that sufficient debt or equity financing will be available at all or, if available, that such financing will be at terms and conditions acceptable to us. The sale of additional equity securities could result in additional dilution to our stockholders and those securities may have rights senior to those of our common stock. The incurrence of indebtedness would result in increased debt service obligations and could result in operating and financing covenants that would restrict our operations. Should we fail to refinance the debt or raise additional capital, we may not be able to achieve our longer term business objectives and may face other serious adverse consequences.
The following table summarizes our cash flows for the periods indicated:
| Year Ended June 30, | ||||||||||||
| 2009 | 2010 | 2011 | ||||||||||
| (In thousands) | ||||||||||||
| Cash used in operating activities |
$ | (15,143 | ) | $ | (4,646 | ) | $ | (19,155 | ) | |||
| Cash used in investing activities |
(11 | ) | (146 | ) | (1,043 | ) | ||||||
| Cash provided by financing activities |
17,277 | 524 | 34,492 | |||||||||
Cash Flows from Operating Activities
Cash used in operating activities for the year ended June 30, 2011 included the effects of our net loss of $11.5 million offset by non-cash charges of $0.4 million for depreciation and amortization, $1.4 million for additional reserves on our inventory due to obsolescence of certain inventory items during the period and $6.4 million for the change in fair value of our liabilities related to our convertible preferred stock warrants and foreign currency derivative instruments. Our short-term working capital accounts, excluding cash and cash equivalents, increased from a deficit of $16.2 million as of June 30, 2010 to a deficit of $36.6 million as of June 30, 2011. The increase in accounts receivable of $12.8 million was due to the overall growth of our business with days sales outstanding remaining flat and an increase in inventory of $14.6 million primarily to support new product as we ramped volume production of our LTE single-chip solutions earlier in the year combined with the overall growth of our business. Similarly, the aggregate increase in accounts payable and accrued liabilities of
64
Table of Contents
$5.4 million was primarily the result of the growth of our business. Also, the increase in customer deposits of $7.1 million was due to the acquisition of a significant new customer for our LTE products during the period.
Cash used in operating activities for the year ended June 30, 2010 included the effects of our net loss of $19.9 million partially offset by non-cash items of $0.6 million for depreciation and amortization and $3.1 million for additional reserves on our inventory due to obsolescence of certain inventory items during the period. Our short-term working capital accounts, excluding cash and cash equivalents, increased from a deficit of $1.5 million as of June 30, 2009 to a deficit of $16.2 million as of June 30, 2010. The decrease in accounts receivable of $3.6 million was due primarily to the timing of payment receipts. The aggregate increase in accounts payable and accrued and other liabilities of $8.3 million was due primarily to the timing of the related payment of payables and extension of payment terms of a significant supplier.
Cash used in operating activities for the year ended June 30, 2009 included the effects of our net loss of $14.5 million and non-cash items such as $1.0 million from the recovery of bad debts and $4.6 million for the change in fair value of our liabilities related to our convertible preferred stock warrants and foreign currency derivative instruments which were partially offset by non-cash items of $1.0 million for depreciation and amortization and $5.1 million for additional reserves on our inventory as a result of the excess inventory due to a general slowdown in the economy. Our short-term working capital accounts, excluding cash and cash equivalents, decreased from a deficit of $8.6 million as of June 30, 2008 to a deficit of $1.5 million as of June 30, 2009. The increase in accounts receivable of $0.3 million was due to a slowing of payments from our customers during the financial crisis that was taking place during the year. The aggregate decrease in accounts payable and accrued and other liabilities of $1.1 million was primarily related to the slowdown in the economy and the related slowdown in spending. The increase in deferred margin of $5.2 million was attributable to the deferral of revenue for several distributors.
Cash Flows from Investing Activities
Cash used in investing activities was primarily related to our acquisition of property and equipment which amounted to $0.1 million, $0.2 million and $1.1 million for the years ended June 30, 2009, 2010 and 2011.
Cash Flows from Financing Activities
Cash provided by financing activities for the year ended June 30, 2011 of $34.5 million was comprised of proceeds of $21.6 million from the issuance of convertible notes and convertible notes to a related party and $16.7 million from the exercise of warrants. These increases were partially offset by $4.1 million of notes payable to a related party and bank borrowing repayments.
Cash provided by financing activities for the year ended June 30, 2010 of $0.5 million was comprised of $1.0 million from the additional issuance of notes to a related party, which was partially offset by $0.6 million of note and bank borrowing repayments.
Cash provided by financing activities for the year ended June 30, 2009 of $17.3 million was due primarily to the receipt of proceeds from issuances of $6.5 million in convertible notes payable, $7.7 million in bank borrowings and notes to a related party and $4.9 million in proceeds raised through sales of our Series F preferred stock. These increases were partially offset by repayments on our bank borrowings and notes to a related party of $2.0 million.
65
Table of Contents
Contractual Obligations and Other Commitments
The following table summarizes our contractual obligations as of June 30, 2011:
| Payments Due by Period (In thousands) |
||||||||||||||||||||
| Contractual Obligations: |
Less Than 1 Year |
1 to 3 Years |
3 to 5 Years |
More Than 5 Years(3) |
Total | |||||||||||||||
| Purchase obligations(1) |
$ | 541 | $ | — | $ | — | $ | — | $ | 541 | ||||||||||
| Bank borrowings and notes payable to related party |
12,146 | — | — | 1,475 | 13,621 | |||||||||||||||
| Convertible notes payable and convertible notes payable to a related party |
30,367 | 1,028 | — | — | 31,395 | |||||||||||||||
| Capital lease |
6 | 7 | 6 | — | 19 | |||||||||||||||
| Interest on bank borrowings, notes payable to related party, convertible notes payable, convertible notes payable to a related party and capital lease(4) |
3,250 | 92 | — | — | 3,342 | |||||||||||||||
| Operating leases(2) |
677 | 141 | 41 | — | 859 | |||||||||||||||
|
|
|
|
|
|
|
|
|
|
|
|||||||||||
| Total contractual obligations |
$ | 46,987 | $ | 1,268 | $ | 47 | $ | 1,475 | $ | 49,777 | ||||||||||
|
|
|
|
|
|
|
|
|
|
|
|||||||||||
| (1) | Amounts included within purchase obligations are based on outstanding purchase orders as of June 30, 2011 related to the manufacture of certain wafers that we utilize in which production has started. These production agreements are cancellable at any time with the company required to pay all costs incurred through the cancellation date. However, we rarely cancel these agreements once production has started. We do not otherwise have any outstanding non-cancellable purchase commitments as of June 30, 2011. |
| (2) | Operating leases include total future minimum rent payments under non-cancellable operating lease agreements. |
| (3) | Note payable to related party amounting to $1.5 million does not have a fixed maturity date. |
| (4) | Consisted solely of future interests. |
We made regular rental payments under our non-cancellable operating leases and outstanding indebtedness subsequent to the year ended June 30, 2011 but did not enter into any new lease or debt agreements during this period.
As of June 30, 2011, we had an agreement with one of our suppliers and our obligations under this agreement are collateralized by all of our assets, excluding intellectual property, and this security interest is set to expire on May 6, 2014.
Off-Balance Sheet Arrangements
Through June 30, 2011, we had not entered into any off-balance sheet arrangements and did not have any holdings in variable interest entities.
Segment Information
We have one business activity, which is designing, developing and marketing integrated circuits for the wireless communications industry, and operate in one operating segment. Our chief operating decision-maker is considered to be our chief executive officer. The chief operating decision-maker allocates resources and assesses financial performance of the business on a consolidated level as one operating segment.
66
Table of Contents
Quantitative and Qualitative Disclosures about Market Risk
We are exposed to market risks in the ordinary course of our business. These risks primarily include interest rate and foreign exchange rate sensitivities as follows:
Interest Rate Risk
We had cash and cash equivalents of $18.2 million as of June 30, 2011 which consists of bank deposits and money market funds. Such interest-earning instruments carry a degree of interest rate risk; however, historical fluctuations in interest income have not been significant. We had total outstanding debt of $44.9 million as of June 30, 2011, of which 94%, or $42.4 million is due within 12 months. Our outstanding indebtedness consists of bank borrowings of $12.1 million, notes payable to a related party of $1.5 million and convertible notes payable and convertible notes payable to a related party of $31.4 million. All of our debt obligations carry fixed interest rates with the exception of our revolving line of credit with Comerica and a loan facility with Industrial Bank of Korea, which may vary.
We do not enter into investments for trading or speculative purposes and have not used any derivative financial instruments to manage our interest rate risk exposure. We have not been exposed nor do we anticipate being exposed to material risks due to changes in interest rates. In addition, on September 15, 2011 our outstanding convertible notes and convertible notes to a related party in the amount of $22.5 million (including accrued interest) were converted into shares of our preferred stock upon the filing of our initial Registration Statement on Form S-1 with the SEC. Also, on or about September 30, 2011, the outstanding convertible notes in the amount of $8.9 million (including accrued interest) were converted by their holders into shares of our preferred stock. These conversions have significantly reduced our exposure to these interest rate risks. A hypothetical 10% change in interest rates during any of the periods presented would not have had a material impact on our consolidated financial statements.
Foreign Currency Exchange Risk
Our sales contracts are predominately denominated in U.S. dollars and therefore substantially all of our revenue is not subject to foreign currency translation risk. However, a substantial portion of our operating expenses incurred outside the U.S. are denominated in foreign currencies and are subject to fluctuations due to changes in foreign currency exchange rates, particularly changes in the Korean won. We also have various intercompany accounts receivables and payables and bank borrowings. To date, we have not entered into any hedging contracts, however, the Korean won denominated notes contain fixed exchange rate features that are considered embedded derivatives. These embedded derivatives are separated from the debt host contract and accounted for at fair value with the changes in fair value recognized as other income (expense), net. As of June 30, 2011, the carrying value of these embedded derivatives was $1.2 million. A hypothetical 10% appreciation or depreciation in the value of the U.S. dollar relative to the Korean won or other currencies in which our loan obligations and expenses are denominated during the year ended June 30, 2011 would have impacted our results of operations by $3.8 million or $4.6 million, respectively. For the year ended June 30, 2011, we recognized a charge of $1.1 million in relation to the embedded derivatives in the consolidated statement of operations.
Critical Accounting Policies and Estimates
Our consolidated financial statements are prepared in accordance with generally accepted accounting principles in the United States (U.S. GAAP) The preparation of these consolidated financial statements requires us to make estimates and assumptions that affect the reported amounts of assets, liabilities, revenues, costs and expenses and related disclosures. We base our estimates on historical experience and on various other assumptions that we believe to be reasonable under the circumstances. In many instances, we could have
67
Table of Contents
reasonably used different accounting estimates, and in other instances changes in the accounting estimates are reasonably likely to occur from period-to-period. Accordingly, actual results could differ significantly from the estimates made by our management. To the extent that there are material differences between these estimates and actual results, our future financial statement presentation, financial condition, results of operations and cash flows will be affected. We believe that the accounting policies discussed below are critical to understanding our historical and future performance, as these policies relate to the more significant areas involving management’s judgments and estimates.
Revenue Recognition
We recognize revenue when persuasive evidence of an arrangement with a customer exists, delivery has occurred, the fee is considered to be fixed or determinable and collectability of the fee is reasonably assured.
Our revenue is generated through two channels, a direct sales force and distributors. Sales to direct customers and some distributors are made primarily pursuant to standard purchase orders for delivery of products and are recognized upon shipment of the product.
For sales to distributors with agreements allowing for or having a history of returns or credits under certain circumstances, or where collectability is not reasonably assured, we defer recognition of revenue and the related costs until the distributor has resold the products to their end customer. Our agreements with our significant distributors generally transfer title to inventory upon shipment to the distributors. We evaluate each distributor relationship to determine whether the price to the distributor is substantially fixed or determinable at the date of sale or whether we have a history of providing credits to reduce the distributors price prior to the distributor resale of the product, whether the distributor is obligated to pay or whether there is an implicit expectation that the distributor is not obligated to pay until it resells the product, whether the distributor has economic substance sufficient to carry the inventory risk prior to resale of product, whether there are significant obligations for future performance to bring about the resale of the product and whether the returns can be reasonably estimated. Where revenue is deferred upon shipment to a distributor, we rely upon point of sale reports from our distributors to record revenue. Point of sale reports provide the date of delivery by distributors to the end customers. At the time of shipment to distributors, we record a trade receivable for the selling price as there is a legally enforceable obligation of the distributor to pay for the product delivered, reduce inventory for the carrying value of goods shipped, and record the net of these amounts as deferred margin on the consolidated balance sheet. This deferred margin represents the gross margin on the initial sales to the distributor; however, the amount of gross margin recognized in future consolidated statements of operations may be less than the originally recorded deferred margin as a result of credits which are not estimable at the time of shipment due to the variability of negotiated prices. We do not reduce deferred margin by estimated credits, instead such amounts are recorded when incurred. The recognition of revenue from deferred margin on shipments to distributors is ultimately contingent upon delivery of product to the distributor’s customer, at which point persuasive evidence of an arrangement exists, delivery has occurred, the price is fixed or determinable, and collectability is reasonably assured.
Warranty
We generally provide warranties on our products for 12 months. We provide for the estimated cost of product warranties at the time revenue is recognized. We regularly monitor product returns for warranty purposes and maintain a reserve for warranty expenses based upon our historical experience and any specifically identified failures. We utilize judgment in estimating these product warranties. As of June 30, 2010 and 2011, our warranty accruals were $0.2 million and $0.3 million, respectively.
Allowances for Doubtful Accounts
We record a provision for doubtful accounts based on our historical experience and a detailed assessment of the collectability of our accounts receivable. To assist with the estimate, our management considers, among other
68
Table of Contents
factors, the aging of the accounts receivable, including trends within the age of the accounts receivable, our historical write-offs, the credit-worthiness of each purchaser, the economic conditions of the purchaser’s industry and general economic conditions. In cases where we are aware of circumstances that may impair a specific purchaser’s ability to meet their financial obligations to us, we record a specific allowance against amounts due from the customer, and thereby reduce the net recognized receivable to the amount we reasonably believe will be collected. There is significant judgment involved in estimating the allowance for doubtful accounts.
Share-Based Compensation
We recognize compensation costs related to stock options granted to employees based on the estimated fair value of the awards on the date of grant, net of estimated forfeitures. We estimate the grant date fair value, and the resulting stock-based compensation expense, using the Black-Scholes option-pricing model. The grant date fair value of the stock-based awards is generally recognized on a straight-line basis over the requisite service period, which is generally the vesting period of the respective awards.
The fair value of the awards granted during the years ended June 30, 2009, 2010 and 2011 was calculated using the Black-Scholes option-pricing model with the following weighted-average assumptions:
| Years Ended June 30, | ||||||
| 2009 | 2010 | 2011 | ||||
| Expected term (in years) |
5.7 | 5.9 | 5.7-5.9 | |||
| Expected volatility |
65% | 65% | 60% | |||
| Risk-free interest rate |
2.3-3.3% | 2.5% | 1.6-2.5% | |||
| Expected dividend yield |
0% | 0% | 0% | |||
The Black-Scholes option-pricing model requires the use of highly subjective and complex assumptions which determine the fair value of stock-based awards, including the expected term and the price volatility of the underlying stock. These assumptions include:
| • | Expected term—The expected term represents the period that the stock-based awards are expected to be outstanding. We used the simplified method to determine the expected term as provided by the SEC. The simplified method calculates the expected term as the average of the time-to-vesting period and the contractual life of the options; |
| • | Expected volatility—The expected volatility is derived from historical volatilities of several unrelated publicly listed peer companies over a period approximately equal to the expected term of the award. We use this approach because we have limited information on the volatility of our common stock due to the lack of trading history. When making the selections of our industry peer companies to be used in the volatility calculation, we considered the size, operational and economic similarities to our principle business operations; |
| • | Risk-free interest rate—The risk-free interest rate is based on the U.S. Treasury yield in effect at the time of grant for zero coupon U.S. Treasury notes with maturities approximately equal to the expected term of the awards; and |
| • | Expected dividend yield—The expected dividend yield is assumed to be zero as we have never paid dividends and have no current plans to pay any dividends on our common stock. |
In addition to the assumptions used in the Black-Scholes option-pricing model, we must also estimate a forfeiture rate to calculate the stock-based compensation for our awards. We will continue to use judgment in evaluating the expected volatility, expected terms and forfeiture rates utilized for our stock-based compensation calculations on a prospective basis.
We are also required to determine the fair market value of the common stock underlying our stock-based awards when performing the fair value calculations with the Black-Scholes option-pricing model. The fair
69
Table of Contents
market value of the common stock underlying our stock-based awards was determined on each grant date by our board of directors, based on input from management and a concurrent or recent valuation of the common stock prepared by an independent appraiser. Our board of directors is comprised of a majority of non-employee directors with significant experience in operating companies in the semiconductor industry. Therefore, we believe that our board of directors has the relevant experience and expertise to determine the fair market value of our common stock on each respective grant date after taking into account the independent valuations of our common stock conducted on a periodic basis. Given the absence of a public trading market of our common stock, and in accordance with the American Institute of Certified Public Accountants Practice Guide, Valuation of Privately-Held-Company Equity Securities Issued as Compensation, our board of directors exercised reasonable judgment and considered numerous objective and subjective factors, including the independent third-party valuations, to determine the fair market value of our common stock.
Although independent valuations performed by unrelated third-party specialists were utilized by our board of directors to assist with determining the valuation of the common stock, management and our board have assumed full responsibility for the determination of such value.
For the June and December 2010 and the March and June 2011 valuations, the independent appraiser utilized only the market approach, specifically the market multiple method, to estimate the fair value of the common stock. The enterprise value determined by the market approach was then allocated to the common stock using either the option pricing method (OPM) or the probability weighted expected return method (PWERM). Over time, as certainty developed regarding possible discrete events, including an IPO, the allocation methodology utilized to allocate our enterprise value to the common stock transitioned from the OPM, which was last utilized in the June 30, 2010 valuation, to the PWERM, which was utilized for all subsequent valuations.
We have granted the following stock options to our employees since July 1, 2010:
| Grant Date |
Number of Option Shares Granted |
Exercise Price |
Fair Value |
|||||||||
| October 28, 2010 |
454,352 | 0.25 | 0.25 | |||||||||
| March 4, 2011 |
7,183,328 | 0.53 | 0.53 | |||||||||
| June 24, 2011 |
17,616,000 | 0.93 | 0.93 | |||||||||
No single event caused the valuation of our common stock to increase or decrease from July 2010 through June 2011. Instead, a combination of factors described in greater detail in the individual valuation discussions below led to the changes in the fair market value of the underlying common stock. Primarily, the increase was attributable to business developments during this intervening period. Specifically, our revenues, shipments and bookings were increasing during each of the four quarters in the year ended June 30, 2011. In addition, we began to notice a significant increase in traction for our 4G LTE products during the quarter ended December 2010 as evidenced by increased shipments of our 4G LTE products during that quarter, particularly increased shipments based on a significant agreement with LG. In addition to the increase as a result of business developments, the increase in valuation was also due to our progress towards an IPO, including initial, informal discussions in March 2011 with investment bankers and others in the IPO process soon followed by expanded and more formal discussions with these parties and an organizational meeting that was held in April 2011. Also during this period, the US and world economies as well as the stock markets, including the market for IPOs, rebounded from the downturn during 2008 and 2009. Specifically, the Dow Jones Industrial Average increased 14% and the NASDAQ increased 15% during this period.
To assist our board of directors in setting the exercise price of our stock options at the fair market value of our common stock on the applicable grant date, we obtained third-party valuations of our common stock as of June 30 and December 31, 2010 and March 31 and June 30, 2011. An analysis of our valuations and determinations of the exercise price and the fair market value of the underlying common stock for our stock-based awards granted on or between the respective valuation dates are discussed further below.
70
Table of Contents
As of June 30, 2010, the board determined the fair market value of the common stock to be $0.04 per share. In reaching this determination, a contemporaneous independent valuation of the common stock was prepared as of June 30, 2010 on a minority, non-marketable basis assuming our business was in the bridge stage of development. This valuation was developed using the market approach, specifically the market multiple method, by analyzing the financial performance of seven publicly traded peer companies in the semiconductor industry. The independent appraiser chose to utilize multiples determined by dividing the guideline companies’ enterprise values by their revenues for the projected calendar year which was the median of the multiples evaluated.
The aggregate enterprise value was then allocated to the common stock using two scenarios. The first scenario assumed an IPO in which the preferred stock would lose its liquidation preference and participation rights, and the second scenario assumed the preferred stock retains its rights and privileges. The probability of the two scenarios reflected the expectation of an IPO, in addition to outside factors such as our open IPO window, and the potential for receiving an attractive acquisition offer in lieu of an IPO. The estimated probability of a liquidity event through an IPO was 10% and through another event, such as an acquisition, was 90%. The enterprise value was then allocated to the common stock utilizing an OPM with the following assumptions: a time to a liquidity event of 1.5 years, risk-free rate of 0.5%, dividend yield of 0% and volatility of 60% over the time to a liquidity event. The combined fair market value of our common stock from the acquisition and IPO scenarios, as determined by an OPM and after applying a marketability discount of 20%, was determined to be $0.04 per share.
Subsequent to the date of this valuation, our board granted 454,352 options on October 28, 2010 with an exercise price of $0.25 per share. This exercise price was based on its estimate of the fair market value of the underlying common stock on the grant date. In making its determination, the board reviewed business developments during the intervening period between the grant date and the earlier valuation date which caused the fair market value of our common stock to change during the intervening period. The fair value of $0.25 per share was also used for financial accounting purposes. No other stock-based awards were granted through the date of the December 31, 2010 valuation.
As of December 31, 2010, the board determined the fair market value of the common stock to be $0.53 per share. In reaching this determination, a contemporaneous independent valuation of the common stock was prepared as of December 31, 2010 on a minority, non-marketable basis assuming our business was in the bridge stage of development. Like the June 30, 2010 valuation, this valuation also utilized the market approach, specifically the market multiple method, by analyzing the financial performance of six publicly traded companies in the semiconductor industry. The independent appraiser chose to utilize multiples for the guideline companies’ enterprise values compared to projected 2012 revenue for the respective periods. The OPM is preferred when future outcomes are difficult to predict. PWERM becomes useful when discrete future outcomes become more predictable. During the period between June and December 31, 2010, the range of discrete events, specifically IPO scenarios, became fairly well established in the board’s view; therefore, the PWERM was utilized by the independent appraiser to estimate the fair market value of the common stock during this period with the following scenario probabilities and assumptions:
| Scenario |
Pre-emptive M&A | IPO - Low | IPO - High | M&A | Low M&A | |||||
| Timing |
Q3 2011 | Q3 2011 | Q3 2011 | Q4 2012 | Q4 2012 | |||||
| Probability estimate |
30% | 15% | 5% | 10% | 40% |
Based on the processes described above and after applying a marketability discount of 15%, the fair market value of the common stock was determined to be $0.53 per share.
The marketability discount was reduced from 20% to 15% from the June 30, 2010 valuation to the December 31, 2010 valuation. The reduction in the discount rate was due primarily to a decrease in the average estimated time for a liquidity event to approximately 0.5 years. Based on the analysis of the empirical studies quantifying discounts for lack of marketability, the quantitative analysis from the put option models, and certain
71
Table of Contents
other company-specific factors such as the size of our business, management team, leverage, financial performance, prospects and estimated time for a liquidity event (approximately 0.5 years), volatility (55% - 65%), an expected range between 6% and 22% was noted within the respective models so the board estimated a discount for lack of marketability to be 15%.
The board granted 7,183,328 options on March 4, 2011 with an exercise price of $0.53 per share. This exercise price was based upon the fair market value of the underlying common stock as determined in the December 2010 valuation. For financial reporting purposes and the related stock-based compensation, we also utilized a fair value of $0.53 per share for the underlying common stock. Our management and board determined that the fair market value of $0.53 per share was appropriate as of the March 4, 2011 grant date because there were no significant business developments during this period and, as a result, the board believed that the fair market value did not change during this intervening period.
As of March 31, 2011, the board determined the fair market value of the common stock to be $0.76 per share. In reaching this determination, a contemporaneous valuation of the common stock was prepared as of March 31, 2011 on a minority, non-marketable basis assuming our business was in the IPO stage of development because we had started informal planning for our IPO. Like our June 30, 2010 and December 31, 2010 valuations, this valuation also utilized the market approach, specifically the market multiple method, by analyzing the financial performance of six publicly traded companies in the semiconductor industry. The valuation utilized multiples determined by dividing the guideline companies’ fair values by the projected 2011 and 2012 revenue for the respective periods. For this valuation, the independent appraiser selected the same guideline companies utilized in the December 2010 valuation, which were based on size, business model, industry and business descriptions.
The PWERM was utilized to estimate the fair market value of the common stock as of March 31, 2011 with the following scenario probabilities and assumptions:
| Scenario |
Pre-emptive M&A | IPO - Low | IPO - High | M&A | Low M&A | |||||
| Timing |
Q3 2011 | Q3 2011 | Q3 2011 | Q4 2012 | Q4 2012 | |||||
| Probability estimate |
30% | 20% | 5% | 10% | 35% |
Based on the processes described above and after applying a marketability discount of 15%, the fair market value of the common stock was determined to be $0.76 per share.
The board determined the probability estimates above based on its view of the future prospects of our business as determined through discussions of such estimates with the independent third-party valuation firm, as well as informal discussions with bankers and others familiar with estimating such probabilities. As a result of these discussions and based on its own experiences, the board did not feel that it could reasonably place a probability higher than 25% toward the IPO occurring at the time of this valuation. As a result, the board allocated the remaining 75% amongst the different M&A scenarios, including a probability of 35% for a distressed sale since the board did not feel confident in the prospects of a high-end merger or acquisition based on current experiences of the board and management team as of March 31, 2011.
The increase in the fair value as of March 31, 2011 to $0.76 per share was primarily attributed to our reassessment of the probability of an IPO later in March 2011. As of the end of March 2011, we had first approached investment banks to determine whether an IPO was possible in calendar year 2011 and several banks indicated that they were willing to pursue an IPO for us within that time frame. Therefore, as of March 31, 2011, we were in the process of deciding the best future paths and which investment banks would be involved in any IPO process, which ultimately led to an organizational meeting in April 2011. As a result of this progress, the probability of an IPO was increased by 5% while the probability of an M&A exit was reduced equally by 5% for
72
Table of Contents
the March 31, 2011, and this probability shift resulted in an increase in our enterprise value, as our IPO value is higher than our M&A value.
As of June 30, 2011, the board determined the fair market value of the common stock to be $0.91 per share. In reaching this determination, a contemporaneous valuation of the common stock as of June 30, 2011 was prepared on a minority, non-marketable basis assuming our business was in the IPO stage of development. Like prior valuations, this valuation also utilized the market approach, specifically the market multiple method, by analyzing the financial performance of six publicly traded companies in the semiconductor industry. The independent appraiser chose to utilize multiples determined by dividing the guideline companies’ fair values by the projected 2011 and 2012 revenue for the respective periods.
The PWERM was utilized to estimate the fair market value of the common stock as of June 30, 2011 with the following scenario probabilities and assumptions:
| Scenario |
Pre-emptive M&A | IPO - Low | IPO - High | M&A | Low M&A | |||||
| Timing |
Q4 2011 | Q4 2011 | Q4 2011 | Q4 2012 | Q4 2012 | |||||
| Probability estimate |
30% | 30% | 15% | 10% | 15% |
Based on the processes described above and after applying a marketability discount of 10%, the fair market value of the common stock value was determined to be $0.91 per share.
This reduction in the marketability discount was due primarily to a decrease in the average estimated time for a liquidity event to approximately 0.33 years.
The board updated the above probabilities based on its current view of the future prospects of our business and, specifically, an IPO occurring in the near term. During the period between the March 31, 2011 and June 30, 2011 valuations, we held formal discussions with investment bankers and officially kicked off the IPO process with an Organization Meeting in April 2011. In addition, the stock market remained strong during this quarter. As a result, the board adjusted the probabilities to have a heavier weighting toward an IPO by increasing the combined high and low IPO probabilities to 45% from a combined probability of 25% for the March 31, 2011 valuation. The Board determined that this range was appropriate at the time of the June 30, 2011 valuation because the IPO was in progress but a substantial amount of work still remained to complete the initial filing of a registration statement for an IPO, and, therefore, the probability should not be any higher at this point.
The 20% increase in the IPO probabilities was offset by a 20% decrease in the low M&A scenario. The board determined that the probability of this scenario is the proper offset for this change because the prospects of a low M&A should be decreasing as a result of the increasing prospects of our business combined with the improved operating results. The pre-emptive and typical M&A scenarios remained unchanged from the March 31, 2011 valuation.
Also, the marketability discount for the June 30, 2011 valuation was reduced to 10% from the 15% discount rate used in the March 31, 2011 valuation.
Prior to the date of June 30, 2011 valuation, the board granted 17,616,000 options on June 24, 2011 with an exercise price of $0.93 per share. This exercise price was based on a preliminary valuation of the common stock performed by the independent appraiser prior to the June 30, 2011 valuation. For financial statement reporting purposes and the related stock-based compensation, we utilized a fair value of $0.91 per share for the underlying common stock based on the fair market value determined in the June 30, 2011 valuation. No other stock-based awards were granted from April 1, 2011 through the date of the June 30, 2011 valuation.
73
Table of Contents
Stock-based compensation expense included in operating results during the years ended June 30, 2009, 2010 and 2011 was included in cost of revenues and in operating expenses as follows (in thousands):
| Years Ended June 30, | ||||||||||||
| 2009 | 2010 | 2011 | ||||||||||
| Cost of revenues |
$ | 3 | $ | 2 | $ | 32 | ||||||
| Research and development |
46 | 48 | 756 | |||||||||
| Sales and marketing |
16 | 21 | 215 | |||||||||
| General and administrative |
7 | 8 | 332 | |||||||||
|
|
|
|
|
|
|
|||||||
| Total stock-based compensation |
$ | 72 | $ | 79 | $ | 1,335 | ||||||
|
|
|
|
|
|
|
|||||||
The intrinsic value of all outstanding options as of June 30, 2011 was $ million based on the estimated fair value for our common stock of $ per share, the mid-point of the price range set forth of the cover page of this prospectus. As of June 30, 2011, we had $8.4 million of unrecognized stock-based compensation expense, net of estimated forfeitures, that is expected to be recognized over a weighted average period of 3.5 years. In future periods, our stock-based compensation expense is expected to increase as a result of our existing unrecognized stock-based compensation to be recognized as these awards vest and as we issue additional stock-based awards to attract and retain employees.
Inventory
We value our inventory at the lower of cost or market value with cost being determined by actual cost on a first-in, first-out basis. Our inventory is concentrated in high technology parts and components that may be specialized in nature or subject to rapid technological obsolescence. These factors, including age of inventory on hand and that the inventory may be returned from distributors, historical sales levels, estimated future demand within the next six months, inventory commitments or potential product revisions, are considered in estimating reserves required to report inventories at the lower of cost or market. We record inventory write-downs for the valuation of inventory when required based on the analysis of the information immediately above and these inventory balances are not readjusted until sold. During the years ended June 30, 2009, 2010 and 2011, we recorded write-downs for excess and obsolete inventories of $5.1 million, $3.1 million and $1.4 million in cost of revenues, respectively.
We routinely evaluate inventory balances for excess quantities and obsolescence which requires significant management judgment, specifically in regards to evaluating the expected returns from distributors and estimated future demand of our inventory. Unanticipated changes in technology or customer demand could result in a decrease in demand for our products, which may require additional inventory write-downs that could materially affect our results of operations.
Warrants
Warrants to purchase shares of our preferred stock, primarily Series F preferred stock, are classified as a liability on the consolidated balance sheet at fair value because the warrants may conditionally obligate us to transfer assets to the holders at a future date under certain circumstances, such as a change in control. The warrants are subject to remeasurement at each balance sheet date, and any change in fair value will be recognized as a component of other income (expense), net in the consolidated statements of operations for the years ended June 30, 2009, 2010 and 2011. We use management judgment to estimate the fair value of these warrants and these estimates could differ significantly in the future. We determined the fair value of the outstanding preferred
74
Table of Contents
stock warrants at the end of each reporting period using the Black-Scholes option-pricing model with the following assumptions:
| Years Ended June 30, | ||||||
| 2009 | 2010 | 2011 | ||||
| Estimated term (in years) |
0.9 – 3.8 | 0.3 – 2.7 | 0.6 – 1.1 | |||
| Expected volatility |
65% | 60% | 60% | |||
| Risk-free interest rate |
0.5 – 2.0% | 0.2 – 0.9% | 0.1 – 0.2% | |||
| Expected dividend yield |
15.9% | 13.1% | 6.5% | |||
The above assumptions were determined as follows:
| • | Term—The term represents either (i) the remaining contractual term of the warrants or (ii) a weighted average of the remaining term under probable scenarios used to determine the fair value of the underlying stock; |
| • | Expected volatility—The expected volatility is derived from historical volatilities of several unrelated publicly listed peer companies over a period approximately equal to the term of the warrants because we have limited information on the volatility of our preferred stock since we have no trading history. When making the selections of our industry peer companies to be used in the volatility calculation, we considered the size, operational and economic similarities to our principle business operations; |
| • | Risk-free interest rate—The risk-free interest rate is based on the U.S. Treasury yield in effect at the time of grant for zero coupon U.S. Treasury notes with maturities approximately equal the term of the warrants; and |
| • | Expected dividend yield—The expected dividend yield is based on the $0.096 per share cumulative dividends for the underlying shares of Series F preferred stock. |
We are also required to estimate the fair value of the Series F preferred stock underlying these warrants when performing the fair value calculations with the Black-Scholes option-pricing model. The fair value of the Series F preferred stock underlying our warrants was estimated on each issuance or remeasurement date. Management considered the common stock valuations discussed in the stock-based compensation section of these critical accounting policies and utilized substantially similar methodologies. These Series F preferred stock valuations determined the fair value of the Series F preferred stock to be $0.73 and $1.48 per share as of June 30, 2010 and 2011.
As of June 30, 2011, we had outstanding warrants to purchase 7,636,363 shares of Series F preferred stock with exercise prices of $1.10 per share and warrants to purchase 1,666,666 shares of Series F preferred stock with exercise price of $1.20 per share. During the year ended June 30, 2010, we recognized a gain through other income (expense) in the amount of $0.2 million as a result of the remeasurement of our redeemable convertible preferred stock warrants. During the year ended June 30, 2011, we recognized a charge through other income (expense) in the amount of $5.3 million as a result of the periodic remeasurement. In April 2011, warrants to purchase 13,874,998 shares of Series F redeemable convertible preferred stock were exercised and are no longer outstanding. We will continue to record adjustments to the fair value of the remaining warrants until they are exercised, expire or convert into warrants to purchase shares of our common stock. Also upon the completion of a liquidity event, including the completion of an IPO, all outstanding warrants will expire if not exercised. At that time, we will no longer record any related periodic fair value adjustments.
Foreign Currency Derivative Financial Instruments
We issue Korean won based convertible notes with exchange rate features that are considered to be embedded derivatives. We account for these derivative financial instruments initially at fair value on the date entered into and subsequently remeasure the instruments to fair value each period end. Changes in the fair value
75
Table of Contents
of derivative financial instruments are recognized in the consolidated statements of operations. We also utilize significant judgment in estimating the fair value of the embedded derivatives, including estimates for the fair value of the underlying preferred stock at the valuation date, risk-free interest rates and the expected volatility of the underlying stock. These estimates could fluctuate significantly in the future.
We determined the fair value of the foreign currency derivatives at the end of each reporting period by estimating the probability that the Korean won based convertible notes will convert into Series F redeemable convertible preferred shares and the probability that the won will appreciate relative to the U.S. dollar. These probabilities were derived by using the Black-Scholes option-pricing model. As of June 30, 2010 and 2011, liabilities related to the foreign currency derivative instruments were $0.1 million and $1.2 million, respectively. During the year ended June 30, 2010, we recognized a gain through other income (expense) in the amount of $19,000 as a result of the remeasurement of the embedded derivative. During the year ended June 30, 2011, we recognized a charge through other income (expense) in the amount of $1.1 million as a result of the periodic remeasurement.
Nonrecurring engineering and grants
Amounts received by us in connection with government grants and work performed under development contracts with certain customers and operators (nonrecurring engineering or “NRE”) prior to completion of certain milestones, such as the completion of engineering samples built to prescribed specification on performance capabilities, interoperability testing or product acceptance by the customer, are deferred and recognized as an offset to the research and development expense upon achievement and acceptance of the specified milestones. We determined that the milestones were substantive because they were determined to be reasonable, solely related to past performance, and commensurate with either the effort required to achieve the milestone or the enhanced value of the delivered item(s) that resulted from achievement of the milestones.
Amounts received from development contracts were recorded as an offset to research and development expenses. These amounts are not recorded as revenue because they are not part of our ongoing central business activities. These arrangements are motivated primarily by the opportunity to engage customers and at the same time, jointly progress our own research and development activities with the associated development compensation. All amounts received under the development contracts were recognized as an offset to research and development expenses, as we were performing development activities on behalf of other parties, were being compensated for these activities and could not practically separate the efforts or costs related to these activities from our own research and development. During the years ended June 30, 2009, 2010 and 2011, we recognized $5.3 million, $1.1 million and $7.7 million, respectively, related to these NRE contracts and government grants as a reduction to research and development expenses.
Income Taxes
Our provision for income taxes is recognized for the amount of taxes payable or refundable for the current year. In addition, deferred tax assets and liabilities are recognized for the expected future tax consequences of temporary differences between the financial reporting and tax bases of assets and liabilities, and for operating losses and tax credit carryforwards. Management must make assumptions, judgments and estimates to determine our current provision for income taxes and also our deferred tax assets and liabilities and any valuation allowance to be recorded against a deferred tax asset.
Our assumptions, judgments and estimates relative to the current provision for income taxes take into account current tax laws, our interpretation of current tax laws and possible outcomes of current and future audits conducted by foreign and domestic tax authorities. We have established reserves for income taxes to address potential exposures involving tax positions that could be challenged by tax authorities. Although we believe our assumptions, judgments and estimates are reasonable, changes in tax laws or our interpretation of tax laws and the resolution of potential tax audits could significantly impact the amounts provided for income taxes in our consolidated financial statements.
Our assumptions, judgments and estimates relative to the carrying value of a deferred tax asset take into account predictions of the amount and category of future taxable income, such as income from operations or
76
Table of Contents
capital gains income. Actual operating results and the underlying amount and category of income in future years could render our current assumptions, judgments and estimates of recoverable net deferred taxes inaccurate. Any of the assumptions, judgments and estimates mentioned above could cause our actual income tax obligations to differ from our estimates, thus materially impacting our financial position and results of operations.
Internal Control over Financial Reporting
Prior to completion of this offering, we have been a private company with limited accounting personnel to adequately execute our accounting processes and other supervisory resources with which to address our internal control over financial reporting. This lack of adequate accounting resources contributed to audit adjustments to our financial statements in the past.
In connection with the audit of our consolidated financial statements for the fiscal years ended June 30, 2009, June 30, 2010 and June 30, 2011, our independent registered public accounting firm identified and communicated to us material weaknesses, including a material weakness related to our failure to maintain a sufficient number of personnel with an appropriate level of knowledge, experience and training in the application of generally accepted accounting principles in the United States (U.S. GAAP) for complex transactions necessary to satisfy our financial reporting requirements. A material weakness is a control deficiency, or a combination of control deficiencies, in internal control over financial reporting, such that there is a reasonable possibility that a material misstatement of our annual or interim financial statements will not be prevented or detected on a timely basis. This material weakness contributed to multiple audit adjustments and also contributed to the following individual material weaknesses:
| • | We did not maintain effective controls related to the completeness and accuracy of the valuation for the accounting for our preferred stock warrant transactions; |
| • | We did not maintain effective controls related to the completeness and accuracy of the accounting for income taxes in regards to transfer pricing and outside basis differences; |
| • | We did not maintain effective controls related to the accuracy and valuation of accounting for deferred margin transactions; and |
| • | We did not maintain effective controls related to the accuracy and valuation of accounting for inventory variances. |
Each of the material weaknesses described above could result in a misstatement of our accounts or disclosures that would result in a material misstatement of our annual or interim consolidated financial statements that would not be prevented or detected.
We are in the process of implementing measures designed to improve our internal control over financial reporting to remediate these material weaknesses. For example, we recently hired a new Chief Financial Officer. We also hired a Corporate Controller with requisite experience in financial reporting for a publicly traded company. We also have plans to add more accounting personnel, including a SEC reporting and Sarbanes-Oxley implementation manager and a financial planning and analysis position. In addition, we have retained consultants to assist with the accounting for income taxes, conduct a transfer pricing study, and review tax strategies. We also expect to retain additional consultants to advise us on making further improvements to our internal controls related to these accounting areas in the future. We believe that these additional resources would enable us to broaden the scope and quality of our internal review of underlying information related to financial reporting and to further enhance our financial review procedures, including the accounting processes for income taxes, deferred margin transactions, inventory variances and complex transactions as they occur.
We cannot assure you that the measures we have taken to date, or any measures we may take in the future, will be sufficient to remediate the material weaknesses in our internal control over financial reporting or to avoid potential future material weaknesses.
77
Table of Contents
Overview
We are a leading fabless designer and supplier of advanced 4G mobile semiconductor solutions. Our products are system-on-a-chip (SoC) solutions that integrate radio frequency (RF), baseband modem and digital signal processing (DSP) functions onto a single die for the 4G Long-Term Evolution (LTE) and Worldwide Interoperability for Microwave Access (WiMAX) markets. We were the first to commercialize single-chip solutions for LTE and WiMAX and believe we are currently the only company selling commercialized single-chip LTE solutions. We believe our proprietary technology and system-level expertise enable us to provide complete 4G platform solutions, which are differentiated by their small form factors, low power consumption, high performance, high reliability and cost effectiveness. Our solutions have been designed into smartphones, USB dongles, wireless routers, customer premise equipment (CPE), femto access points, public safety devices and embedded modules for notebook and tablet devices.
Our core differentiation results from our distinctive RF complementary metal oxide semiconductor (CMOS) capabilities combined with our ability to integrate multiple functions, including RF, wireless modem and DSP, onto a single die. We believe our RF CMOS integration capability enables us to design products with low costs, small form factors and low power consumption without sacrificing performance. In addition, we have developed multiple orthogonal frequency-division multiple access (OFDMA) modem and multiple-input multiple-output (MIMO) antenna capabilities. These are two technologies that are critical for delivering LTE and WiMAX solutions and for enabling the integration of our solutions with wireless local area network (WLAN) functionality, an important part of our strategic and product roadmap.
We work closely with wireless operators to drive adoption of our solutions by collaborating with them on the designs of our products. These operators include AT&T, MetroPCS Wireless, Inc. (MetroPCS), Verizon Wireless (Verizon), Vodafone Limited (Vodafone) and Yota for LTE and Clearwire Corporation (Clearwire), KT Corp., SK Telecom Co. Ltd., Sprint Nextel Corp. (Sprint), UQ Communications, Inc., Yota and YTL Communications Sdn Bhd (YTL) for WiMAX. Our primary customers are device original equipment manufacturers (OEMs) and original design manufacturers (ODMs). Our customers include Infomark Co. Ltd., Inkel Corporation Ltd., Interbro Inc., Kyocera Corporation, LG Electronics, Inc. (LG), LG Innotek Co. Ltd., Modacom Co. Ltd., Quanta Computer, Inc., Seowon Intech Co. Ltd. and YTL.
As of June 30, 2011, we have shipped over 960,000 LTE semiconductors in support of the initial LTE deployments by AT&T, Verizon, and Vodafone and over 4.7 million WiMAX semiconductors supporting many major WiMAX operators around the world. Our revenue was $22.4 million, $33.1 million and $68.6 million during the years ended June 30, 2009, 2010 and 2011, respectively. Our net loss was $14.5 million, $19.9 million and $11.5 million during the years ended June 30, 2009, 2010 and 2011, respectively. We began operations in 1998 and have incurred losses on an annual basis since inception. As of June 30, 2011, our accumulated deficit was $192.7 million.
Industry Overview
The mobile communications industry is in the early stages of a multi-year upgrade cycle driven by changes in the way customers access the Internet using a wide variety of mobile devices. In contrast to the limited bandwidth provided by legacy technologies, such as Code Division Multiple Access (CDMA) and High Speed Packet Access (HSPA), the introduction of 4G technology has dramatically improved the technical performance and usability of the mobile network allowing for a rich media experience on mobile devices. Accordingly, consumers are shifting an increasing portion of their digital media consumption away from wired network devices to wireless devices. According to Cisco Systems, Inc., mobile data traffic is expected to grow 26-fold between 2010 and 2015. (Source: Cisco Visual Networking Global Mobile Data Transfer Forecast, 2010-2015).
78
Table of Contents
Furthermore, this improved user experience, along with new device applications that allow for easier access, creation and consumption of content is driving the next wave of mobile device sales. IDC estimates that shipments of 4G-enabled mobile phones will increase from approximately 13.9 million units in 2011 to approximately 219.0 million units in 2015, representing a compound annual growth rate (CAGR) of 99%.
Evolution of Wireless Technologies
Over the last several decades, wireless networks have undergone a transformation, transitioning from primarily providing voice-centric communications to now providing a combination of voice and data traffic. As an evolution from analog cellular networks, 2nd generation, or 2G, digital networks were designed to expand voice communications capabilities and provide low speed data rates (9.6-14.4 kbps) by significantly enhancing frequency spectrum efficiency. Within the 2G protocol, two competing technologies emerged: CDMA and Global System for Mobile Communication (GSM), each with their respective trade-offs. While GSM-based systems coupled with their subsequent enhancements supported higher performance in the form of lower latency and higher voice and data throughput, CDMA-based (initially called “cdmaOne”) systems allowed site operators to service larger numbers of phones and thus were more economical.
As the cellular industry continued to evolve and proliferate, operators sought to increase network capacity and improve the user experience by deploying the next generation of wireless technology. For example, in GSM networks, Evolved Data Rates for GSM Evolution (EDGE) protocol provided a relatively easy “bolt-on” upgrade allowing operators to achieve “2.5G” capabilities, resulting in a step-up in performance with improved peak data rates of 384 kbps. Alternatively, cdmaOne operators were able to upgrade their networks to CDMA2000, an evolutionary upgrade that provided “2.5G” capabilities in the same frequency allocations, making it easier to deploy in existing spectrum.
With increasing consumer demand for rich content and applications on mobile devices, operators pursued additional upgrades of existing wireless network infrastructure. However, to achieve a true 3G capability, GSM operators were required to transition to Universal Mobile Telecommunications System (UMTS), a CDMA-based system that involved new base stations and new frequency allocations, increasing both cost and time required for deployment. Additional enhancements, such as Evolution-Data Optimized (EVDO), a 3G upgrade for CDMA2000 networks, and HSPA for UMTS networks, provided benefits such as enhanced throughput and reduced latency. For example, HSPA technologies increased peak downlink data rates to 14.4 Mbps with additional enhancements such as Evolved High Speed Packet Access (HSPA+), enabling “3.5G” performance with theoretical peak downlink data rates of up to 42 Mbps. While these deployments increased capacity and transmission speeds, they were not sufficient to maintain pace with the growth in mobile data traffic in a cost-effective manner. As a result, OFDMA modem technology was developed to achieve greater throughput than existing 3G or “3.5G” solutions.
OFDMA technologies, often referred to as 4G technologies, are differentiated from existing 3G or “3.5G” CDMA technologies. OFDMA utilizes a more efficient digital modulation schema as well as MIMO antenna technology to realize higher data throughput and signal range without requiring additional bandwidth or transmit power. These technologies allow base stations to service a larger coverage region and provide greater network bandwidth, thereby reducing capital expenditure requirements for operators. In addition to performance improvements, 4G technologies work with complementary wireless technologies to drive higher data traffic, thus creating additional revenue opportunities for operators. For example, WLAN tethering allows 4G mobile devices to act as wireless hotspots, connecting WLAN-enabled devices such as notebooks and tablets to the 4G network. In addition, we also expect operators to begin offering 4G voice services using Voice over Internet Protocol (VoIP) for mobile devices.
The two dominant technologies in the 4G standard, LTE and WiMAX, are capable of providing theoretical peak downlink speeds of 100 Mbps and 46 Mbps, respectively. Two access schemes were developed to accommodate the LTE and WiMAX wireless networks: Frequency-Division Duplexing (FDD) uses different
79
Table of Contents
frequencies to transmit and receive signals simultaneously, and Time-Division Duplexing (TDD) uses a time-sharing scheme that transmits and receives signals on the same frequency. While WiMAX is commonly deployed almost exclusively in one of a limited number of TDD frequency bands, LTE can be used with either TDD, or the more common FDD, system structure. FDD-LTE is expected to be more prominent in the United States, Europe, Japan, Russia and Korea, and TDD-LTE networks are expected to be deployed in China and India. The following table illustrates the evolution of cellular technologies:
Comparison of Cellular Technologies
| Generation | Standard | Peak Data Rate (est.) | Availability | |||
| 1G |
AMPS | 9.6 kbps | 1983-2008 | |||
| 2G |
D-AMPs (IS-54; IS-136) | 9.6 kbps | 1990-2008 | |||
| GSM | 9.6 kbps | 1991 | ||||
| cdmaOne (IS-95A) | 14.4 kbps | 1995 | ||||
| GPRS | 144 kbps | 2001 | ||||
|
2.5G |
CDMA2000 (1x-RTT) | 153 kbps | 2001 | |||
| EDGE | 384 kbps | 2003 | ||||
| UMTS | 384 kbps | 2002 | ||||
|
3G |
CDMA2000 (1xEVDO) | 2.4 Mbps | 2002 | |||
| HSPA | 14.4 Mbps | 2006 | ||||
| 3.5G |
HSPA+ | 42 Mbps | 2008 | |||
| WiMAX (802.16e) | 46 Mbps | 2006 | ||||
|
4G |
LTE | 100 Mbps | 2010 | |||
| WiMAX 2 (802.16m) | 150 Mbps (est.) | 2012 (est.) | ||||
| LTE Advanced | 1 Gbps | 2013 (est.) |
LTE Deployments
According to a 2011 GSA report, 237 operators in 85 countries are investing in LTE deployments trials or studies in 2011. We expect LTE to be the dominant 4G standard given its interoperability with existing 3G infrastructure. LTE networks are currently being deployed by major 3G cellular operators, who believe that the benefits of increased capacity and throughput offered by 4G technologies justify the related cost of upgrading their existing 3G networks. In the United States in 2010, Verizon launched its FDD-LTE services, and in 2011 AT&T announced plans to launch its FDD-LTE services. Commercial deployments of TDD-LTE networks are expected by wireless operators such as China Mobile within the next two years.
WiMAX Deployments
WiMAX is most often deployed in emerging markets by greenfield operators, which offer fixed wireless broadband internet service, because it takes less time to deploy and is more cost effective than traditional wireline internet service such as DSL. In developed countries, operators deploying WiMAX networks often expect to gain an immediate advantage over competitors using 2G and 3G networks by delivering high data throughput at competitive prices using their existing or newly allocated frequency spectrum. For example, Sprint and Clearwire launched their WiMAX services in the United States in September 2008 and January 2009, respectively, and additional WiMAX networks have been deployed in Japan, Korea and Malaysia. According to the WiMAX Maps database, a collaboration between the WiMAX Forum and Informa Telecoms & Media, more than 583 WiMAX networks have been deployed in over 150 countries as of May 2011.
80
Table of Contents
Key Challenges for 4G Semiconductor Solution Providers
Robust growth in the 4G ecosystem is creating significant business opportunities for industry participants, and we expect the market for 4G semiconductor solutions to attract the interest of many semiconductor suppliers. While the initial challenge for 4G semiconductor solution providers will be meeting the core 4G performance requirements, achieving market leadership will be predicated on the ability to deliver silicon solutions that facilitate superior 4G network service and an enhanced user experience in a cost effective manner. We believe that a successful 4G semiconductor solutions provider must be differentiated along several dimensions, including:
Broad-based technical knowledge and expertise.
Delivering an integrated 4G solution is complex and requires expertise in a number of disciplines, including OFDMA and MIMO-based modem and antenna expertise, software and reference design capabilities and the ability to facilitate the co-existence of cellular networks and other connectivity standards, including WLAN. In addition, VoIP software and hardware expertise will be required to provide voice functionality on 4G-only devices.
Highly-integrated solutions.
Customers seek solutions that offer simultaneously high performance, low costs, small form factors and low power consumption. Integration, or placing multiple functional blocks on a single die, is critical to achieving these results. Historically, RF transceiver functionality has been difficult to integrate into a CMOS manufacturing process given the potential interference between the high performance RF analog circuitry and the digital components. As a result, RF transceivers have not been routinely integrated with CMOS digital circuitry. Instead, they are often manufactured using other, more expensive processes. Given this historical bifurcation between the CMOS modem and RF transceiver, the ability to manufacture solutions with integrated RF using an advanced CMOS process is beneficial in reducing die size and minimizing power consumption. We believe this capability will become increasingly important over time, as consumers’ demand for better RF and digital functionality makes the integration process more challenging.
Accelerated time-to-market and risk mitigation.
Interoperability testing is a time-consuming and critical stage in bringing a new cellular product to market. These field trials and reliability and quality assurance procedures are conducted to ensure that mobile devices can interface seamlessly to mobile infrastructure. The ability to offer solutions that have already passed base station interoperability tests is attractive to both operators and to OEM/ODM customers, because it reduces both time-to-market and the risk of technical incompatibility.
Well-established relationships with industry participants.
Operators, OEM/ODM customers and base station suppliers prefer to work with solutions providers that have established relationships throughout the 4G ecosystem. Establishing relationships with these key players is essential to understanding both current and future product-specific and system requirements and is important to developing a credible roadmap for successive generations of products.
Multi-mode capabilities and backward compatibility with 3G networks.
To leverage existing wireless network infrastructure, particularly in the handset market, many operators seek to offer products combining multiple connectivity standards and/or enable backward compatibility with 3G networks. These multi-mode requirements may be met by using separate semiconductors, semiconductors combined into a single package or solutions fully integrated at the die level. We expect that the ability to provide solutions with backward compatibility will be important for many operators and their suppliers until 4G deployments and coverage reach sufficient scale.
81
Table of Contents
Our Competitive Strengths
Our core strengths are the technological differentiation of our solutions, the relationships we have developed in our ecosystem, our track record of execution and our strong Asia presence. We believe that these strengths position us well to address the challenges of delivering 4G semiconductor solutions.
RF CMOS and integration capabilities.
Our foundational strength in RF CMOS design enables us to offer solutions that deliver outstanding RF performance as well as the benefits of CMOS, including integration capability and cost effectiveness. We have developed and patented proprietary technology to implement RF in CMOS and to overcome the traditional drawbacks of RF CMOS integration, including noise, interference and performance degradation. This expertise has enabled us to commercialize single-chip LTE and WiMAX solutions.
Our solutions integrate RF, wireless modem and DSP functionality onto a single die. Die-level integration is important because it is an efficient method to minimize form factor, power consumption and cost. We are also able to address multiple frequency bands within one chip, enabling a single solution that can be used in multiple regions and by multiple operators. This helps both improve our time-to-market and streamline our inventories. In addition, RF CMOS and die-level integration will allow us to continue to incorporate more advanced features over time, such as WLAN and dual-core processors enabling VoIP.
OFDMA, MIMO and dual modem implementation expertise.
Our core competency in OFDMA, a modulation technique enabling more efficient use of bandwidth than 3G technologies, has helped us to develop and commercialize WiMAX, LTE and high-speed WLAN solutions. OFDMA is also designed to work with MIMO, a leading mobile antenna technology. Together, OFDMA and MIMO facilitate the higher data rates and wider signal range of 4G mobile devices.
In addition to our core OFDMA and MIMO expertise, we have experience in the integration of multiple modems such as combining WiMAX with WLAN, and we are leveraging this experience with LTE. A key application driving the use of both cellular and WLAN is the ability for a mobile device to function as a wireless access point or “hotspot,” effectively allowing other WLAN devices (e.g. a notebook computer or tablet) to access the Internet through the mobile device’s 4G connection. In addition, the combination of cellular technologies and WLAN enables mobile devices to access data when a 4G network is either unavailable or slower than an available WLAN connection. We believe that the majority of smartphones and tablets today are being sold with WLAN capabilities. Currently, we are sampling a single-chip WiMAX/WLAN solution, and we are developing a similar single-chip LTE/WLAN solution.
Software and system-level expertise.
Our software and system-level knowledge and expertise enable us to provide our customers with platform solutions, including SoCs, protocol software, high-performance device drivers and full reference designs. For example, we believe we were the first to introduce a reference design platform for a plug-and-play 4G USB modem. Our platforms undergo stringent testing to ensure they deliver optimal functionality and compatibility with base station equipment. We provide full reference designs, enabling our customers to reduce their time-to-market with complete and proven solutions. This effort also assists our customers in identifying suppliers of other components typically required in mobile devices, such as power management, audio or graphics semiconductors.
Track record of execution and 4G market leadership.
We have a history of successfully delivering multiple generations of semiconductor solutions. Our legacy of innovation in WiMAX and CDMA RF demonstrates that we can deliver high quality solutions in high volume. This is important for two reasons: first, our customers value our innovations and experience in scaling with new
82
Table of Contents
market opportunities, and second, we have gained valuable insight into constructing ecosystems that accelerate the adoption of our products. For example, we believe we have achieved a number of industry “firsts,” notably:
| • | World’s first single-chip WiMAX and WiMAX 2 devices; |
| • | World’s first single-chip FDD-LTE solution; and |
| • | World’s first single-chip, dual-mode WiMAX/WLAN device. |
Key relationships with wireless operators, OEM/ODM customers and base station suppliers.
We employ a dual-pronged approach to the market that focuses on operators and OEM/ODM customers. Our relationships with wireless operators help cultivate strong endorsement of our products among OEM/ODM customers. We provide operators with complete reference designs incorporating our products and access to leading OEMs and ODMs that can deliver our solutions in volume, which allows us to develop a long-term roadmap that is intended to align with their strategic objectives. We market our single-chip solutions to OEM/ODM customers and provide them with reference designs that showcase the differentiated features of our solutions. In addition, to reduce both time-to-market and the risk of technical incompatibility for our customers, we work with base station suppliers to ensure that our products interoperate seamlessly with their equipment. Our solutions undergo extensive field testing to verify that they meet the performance and reliability requirements of both operators and customers.
Our strong relationships with operators are critical to driving the adoption of our solutions. The standards set by operators are often difficult to meet. Through our collaboration with participants setting industry standards and the alignment of our roadmaps with operators, we can offer our OEM/ODM customers products that are operator-approved and ready for commercial deployment.
Strong Asia presence.
Given Asia’s importance to our market opportunity, we have invested significantly to build a strong presence in the region. We believe having a strong presence in close proximity to local customers helps us win business in Asia. While we are headquartered in the Silicon Valley, we base the majority of our research and development resources, as well as a significant portion of our sales and marketing team, in Asia, which provides significant cost advantages.
Our Growth Strategy
Our strategy is to enable the 4G revolution and successive generations of technology by delivering first-to-market, differentiated and cost-effective solutions. We believe that our history of market leadership, including our first-to-market commercialization of single-chip solutions for both LTE and WiMAX, has created a valuable competitive advantage. Core elements of our growth strategy include:
Continue to develop and deploy leading integrated LTE solutions.
We intend to leverage our technological expertise and track record of execution by continuing to develop and commercialize successive generations of leading single-chip LTE solutions at smaller process nodes, with higher performance levels, higher degrees of integration and lower power consumption. For example, we are currently developing our next generation dual-mode FDD-TDD LTE chip (GDM7243) that integrates a dual-core processor and advanced WLAN functionality, as well as VoIP, using 40 nanometer process technology. This product is expected to launch in calendar year 2012. Our development efforts in multi-mode solutions underscore our commitment to continuing to deliver more advanced products that integrate circuitry from multiple standards.
83
Table of Contents
Expand our addressable market opportunity within LTE technologies.
Our current products address the stand-alone LTE market, which we believe will represent an increasingly significant portion of the 4G market opportunity over time, particularly with the introduction of VoIP LTE services. We also intend to address additional segments of the LTE opportunity by commercializing products that offer backward-compatibility with 3G technologies. For example, we are currently working with VIA Telecom Co., Ltd. to offer a solution with 3G EVDO and LTE chips in a single package.
Grow our market position in WiMAX.
We intend to increase our market share in WiMAX by leveraging our existing partnerships and design wins from leading WiMAX operators such as Clearwire, KT Corp., SK Telecom Co. Ltd., Sprint, UQ Communications, Inc., Yota and YTL and by allocating resources to pursue fixed wireless broadband opportunities in emerging markets. We remain committed to WiMAX as reflected in our recent product releases, including a single-chip dual-mode WiMAX/WLAN SoC. We are also currently sampling a single-chip SoC for the emerging 802.16m, or “WiMAX 2,” standard. There are a number of current WiMAX operators who have shown interest in the WiMAX 2 standard in order to benefit from the throughput advantage enabled by the use of 4x4 MIMO, or four-input and four-output antennas, technology that will also be required for LTE Advanced.
Continue to build and strengthen our network of industry relationships.
We believe that developing and marketing the world’s first single-chip FDD-LTE and WiMAX solutions has provided us with a strong reputation for innovation and execution with many operators, OEMs and ODMs. We intend to continue to leverage this reputation to both broaden and deepen our relationships and ultimately drive our market opportunity. We often initiate relationships by collaborating on technology development and then work to build these relationships into strategic partnerships. Examples of this approach include our relationships with LG, which began through collaboration on LTE solutions, and VIA Technologies, Inc., which started with a 3G CDMA partnership.
Seek and invest in opportunities to expand our wireless capabilities into new markets.
To continue to grow beyond the traditional 4G market opportunity, we intend to seek and invest in opportunities where our core technological capabilities can drive differentiation and value for our customers. For example, we are currently working with Motorola Solutions, Inc. to enable a portfolio of LTE-based public safety devices using the 700MHz wireless spectrum, which has been set aside specifically for government use. We are also working with our other customers to enable a 4G-based smart grid. We believe these opportunities can enhance our financial performance by expanding our addressable market opportunity and broadening our customer base.
84
Table of Contents
Products and Technology
Products
We currently design, develop and market single-chip LTE and WiMAX products for 4G broadband wireless applications. In addition, we offer 3G CDMA RF components, software and reference designs. The following table lists our key products that we are currently shipping:
| End Market |
Key Product |
Description |
Applications | |||
| LTE |
GDM7240 | • 65nm FDD-LTE • 13x13mm package |
Smartphone, USB dongle, Mobile Router, CPE, Embedded Module | |||
| WiMAX |
GDM72251 | • 65nm WiMAX 2 (802.16m) • 4x4 MIMO • 100Mbps download, 50Mbps upload |
Smartphone, USB dongle, Mobile Router, CPE, Embedded Module | |||
| GDM7205 | • 0.13um WiMAX 2G band |
Smartphone, USB dongle, Mobile Router, CPE, Embedded Module | ||||
| GDM7213 | • 0.13um WiMAX 3G band |
Smartphone, USB dongle, Mobile Router, CPE, Embedded Module | ||||
| GDM72212 | • 65nm WiMAX 2G/3G band • Worldwide WiMAX frequency support |
Smartphone, USB dongle, Mobile Router, Embedded Module | ||||
| GDM72241 | • 65nm WiMAX/WLAN (802.11b/g/n) |
Smartphone, USB dongle, Mobile Router, CPE, Embedded Module | ||||
| CDMA RF |
GRF6411 | • 0.11um CDMA (EVDO) RF • 800MHz for China • Companion RF chip for VIA Telecom EVDO baseband chip |
Feature phone, Smartphone, Data Card | |||
| GRF6407 | • 0.22um CDMA (EVDO) RF • 800MHz RX diversity for China • Companion RF chip for VIA Telecom EVDO baseband chip |
Feature phone, Smartphone, Data Card | ||||
| GRF6414 | • 0.22um CDMA (EVDO) RF • 800MHz/1900MHz/AWS for U.S. • Companion RF chip for VIA Telecom EVDO baseband chip |
Feature phone, Smartphone, Data Card | ||||
| WLAN |
GDM5215 | • 0.13um WLAN (802.11b/g/n) |
Feature phone, Smartphone, Data Card |
| 1. | Sampling |
| 2. | Pre-production |
85
Table of Contents
Technology
We differentiate our products not only by addressing the standards for which they are designed, but also through our core technologies which allow us to offer highly integrated, low power and cost-effective solutions. Our core technologies include:
RF CMOS
Our techniques to design and manufacture analog RF circuitry in CMOS are core to our ability to offer highly integrated wireless solutions. The CMOS process is cost effective and is used to manufacture most digital circuits. However, manufacturing analog RF with the CMOS process has historically been challenged by noise and interference issues, which have resulted in the use of more expensive silicon germanium or bipolar process technologies for RF circuitry. We have developed and patented proprietary technologies for designing RF in CMOS that mitigates these noise and interference issues.
Our proprietary and patented technology has overcome many of the challenges associated with commercializing RF CMOS by accomplishing the following:
| • | Optimization of the signal, specifically between the analog amplifier and analog-to-digital converter, in order to facilitate signal processing with minimum degradation and maximum interference rejection; |
| • | Delivery of a digital baseband that makes real-time adjustments to the parameters of the RF transceiver to maintain signal integrity when a strong interfering signal is present; |
| • | Real-time monitoring and adjusting of the RF transceiver to mitigate the impact of changes in supply voltage and temperature; |
| • | Improvement in manufacturing yield by embedding on-chip calibration circuitry that mitigates the impact of process and chip-to-chip production variation; and |
| • | Reduction in noise cross-talk between analog and digital circuitry as a result of our sophisticated single-die integration techniques. |
Single-chip integration technology
The integration of RF in CMOS is one of the core challenges to offering single-chip wireless solutions. Single-chip integration of LTE is particularly challenging due to the more stringent performance requirements and the larger number of functional blocks requiring integration versus 3G solutions. We believe that we have developed proprietary technologies that enable us to be the leader in integrating RF, baseband modem and DSP functions onto a single die for LTE and WiMAX networks without performance degradation. This distinction is important because die-level integration of these functions is an efficient way to minimize form factor, power consumption and bill-of-material cost. RF CMOS and die-level integration will allow us to continue to incorporate more advanced features, such as multiple frequency bands, WLAN and VoIP enabled by a dual-core processor.
Broadband wireless OFDMA modem and MIMO technology and expertise
We have extensive knowledge of OFDMA modem and MIMO antenna technologies, both of which are critical for the higher data rates and improved signal ranges required for mobile broadband. Our first product commercializing our OFDMA and MIMO antenna expertise was an 802.11 b/g WLAN semiconductor released in 2006. Since that time, we have continued to introduce modem technology for WiMAX, FDD-LTE and, most recently, 802.11b/g/n WLAN. Our modem expertise is central to our ability to offer higher throughput and low power solutions. For future products, we are also developing technology to enable 4x4 MIMO for WiMAX 2 and LTE Advanced. The four-channel streams enabled by 4x4 MIMO are expected to offer improved data rates, signal range and reliability without requiring additional bandwidth or transmit power.
86
Table of Contents
Multi-mode modem technology
Many 4G mobile devices support WLAN in addition to cellular connectivity, and therefore we believe that dual-mode 4G/WLAN solutions have the potential to be well-received in the market. Over the past few years, we have invested in technology to enable us to integrate multiple modems onto a single die, which allows us to offer 4G/WLAN solutions with smaller form factors, lower power consumption and lower cost when compared to alternative multi-chip solutions.
In addition, our multi-mode solutions do not require the use of an external application processor (AP) for the “hotspot” or tethering function which enables other WLAN devices (e.g., notebook computer or tablet device) to connect to the Internet through the 4G connection of the mobile device. Handling this process on-chip can reduce both power consumption and system form factor size, as depicted in the illustration below:
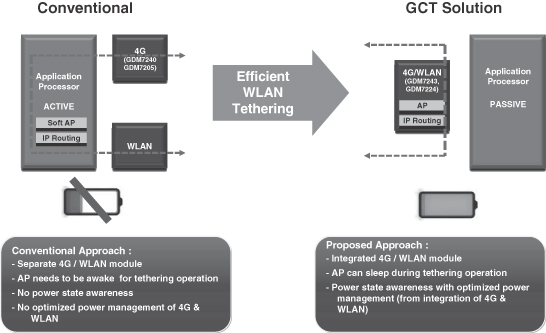
Software and system-level design expertise
In addition to our investments in semiconductor technologies, we have partnered with operators, OEM/ODM customers, as well as base station suppliers to gain insights into the broader 4G ecosystem. For example, we have many years of experience in understanding how 4G base stations are developed and how they interface with and affect the performance of our products. We believe this insight provides us with a stronger perspective on overall system requirements and enables us to deliver solutions that are calibrated to the current and future needs of the various constituents in the 4G ecosystem.
For example, in response to the evolving 4G ecosystem, we have developed a dual-CPU architecture implemented on a single die. This architecture designates one CPU to manage the external operating software and our protocol stack while the other CPU handles such functions as WLAN and VoIP. We also offer full reference designs and platforms, such as an Android smartphone platform, for both LTE and WiMAX, as well as complete mobile router, USB dongles, CPE and embedded module designs.
87
Table of Contents
Research and Development
We dedicate substantial resources to the research and development of new products that offer innovative features, higher performance, additional functionality, smaller form factors, lower costs and lower power consumption and otherwise improve the design of our products. Our engineering efforts have been focused on the following:
| • | RF CMOS circuit design and single-chip integration; |
| • | OFDMA and MIMO-based baseband modem technology, including signal processing algorithms; |
| • | SoC design; |
| • | software development, including protocol stacks and application specific software; and |
| • | printed circuit board design and system-level integration. |
Our investments in innovation have allowed us to develop proprietary solutions which form the foundation of our differentiation. We also seek to capitalize on our innovations by bringing our solutions to market quickly.
Our main research and development organization is located in Seoul, Korea. As of June 30, 2011, we employed 134 engineers (128 in Korea, 4 in the United States and 2 in other countries). As of June 30, 2011, we had 29 engineers who held Ph.D. degrees and 59 engineers who held masters degrees in either Electrical Engineering or Computer Science. Our research and development expense was $11.6 million, $17.8 million and $12.7 million for the years ended June 30, 2009, 2010 and 2011, respectively.
In connection with product development agreements with certain customers and government projects, we periodically receive non-recurring engineering (NRE) fees and government grants, respectively, which offset costs incurred in the research, development and design of our products. These arrangements are motivated primarily by the opportunity to engage customers and at the same time, jointly progress our own research and development activities with the associated development compensation. We use these NRE amounts to defray a portion of our research and development expenses, and it has the effect of reducing our operating expenses. During the years ended June 30, 2009, 2010 and 2011, we recognized $5.3 million, $1.1 million, and $7.7 million, respectively, related to these NRE contracts and government grants as a reduction to research and development expenses.
Competition
Competition in the wireless semiconductor business continues to increase at a rapid pace as consumers, businesses and governments realize the market potential of wireless products and services. To remain competitive, companies must employ highly trained engineering talent and make significant investment over long development cycles.
In the LTE market, we compete or expect to compete with semiconductor companies such as Broadcom Marvell Technology Group Ltd. Corporation, Intel Corporation, Qualcomm Inc., Samsung Electronics Co., Ltd., ST-Ericsson N.V. and potentially other companies focused on developing LTE SoCs. In the WiMAX market, we compete, or expect to compete with semiconductor companies such as Broadcom Corporation, which acquired Beceem Communications Inc., Intel Corporation, MediaTek Inc., Samsung Electronics Co., Ltd, Sequans, Inc. and potentially other competitors that offer WiMAX SoCs.
Many of our competitors have longer operating histories and customer relationships, significant legacy products and technology, greater resources and brand recognition, more industry influence and a larger
88
Table of Contents
customer base. They may be able to dedicate larger resources to promote their products, provide backward compatibility with integrated solutions and adopt aggressive pricing policies that threaten our performance and cost advantages.
While size and scale can be an advantage, we believe we can compete effectively on the following dimensions:
| • | Smaller form factor, lower bill-of-material cost and lower power consumption, resulting from the high-level integration incorporated in our single-chip products that include RF, baseband modem and DSP; |
| • | Superior wireless SoC performance, as measured by higher network throughput, enhanced signal reach and lower power consumption; |
| • | Advanced product features such as LTE/WLAN or WiMAX/WLAN dual-mode with additional processing power to support VoIP; |
| • | Interoperability with most major base stations and extensive field trials with top-tier operators; |
| • | Comprehensive customer support from designer-friendly reference designs and experienced field application engineering resources; and |
| • | Track record of commercializing our solutions. |
Sales and Marketing
The sales cycle in the cellular semiconductor market can be lengthy. Once our product has been provided to our end customers for evaluation, it generally takes 12 or more months to achieve successful commercialization. To drive early market adoption of our solutions in the market, we use a dual-pronged approach, focusing on both operators and OEM/ODM customers.
| • | Focus on Wireless Operators: We actively engage with operators to demonstrate the differentiated features of our solutions as well as to share with them our longer-term development roadmap. Sharing our roadmap with operators allows them to provide input on or validate the planned features of our upcoming product generations and also allows operators to align their roadmaps for service rollouts. This collaboration helps make us a more integral part of the operators’ plans for future deployments and embeds our solutions into the development of the broader 4G ecosystem. Our relationships with wireless operators help create strong endorsement of our products to OEM/ODM customers. Generally, we do not have formal agreements with operators except for a limited service agreement with one operator. We have established key relationships with wireless operators, including AT&T, MetroPCS Wireless, Inc., Verizon, Vodafone, and Yota for LTE and Clearwire, KT Corp., SK Telecom Co. Ltd., Sprint, UQ Communications, Inc., Yota and YTL for WiMAX. |
| • | Focus on OEM/ODM Customers: We also work closely with selected OEM/ODM customers to help them design our products into their devices. These efforts include providing these customers with access to up-to-date product information, future product roadmaps and reference designs, enabling them to develop and market competitive devices for wireless operators. See “—Customers”. |
In addition to our sales and marketing efforts focused on operators and OEM/ODM customers, we also collaborate closely with base station suppliers by continuously conducting interoperability tests between their latest base stations and mobile devices based on our products. We frequently invite our OEM/ODM customers to participate in these tests. In so doing, we ensure the delivery of reliable end-to-end solutions that incorporate a base station, OEM/ODM device and our products. Eliminating interoperability risk provides value to both operators and customers. In addition, in selected instances, we will partner with a base station supplier and an OEM/ODM partner to jointly pursue a 4G wireless operator.
89
Table of Contents
We have structured our marketing teams to align with our product lines, including LTE SoCs, WiMAX SoCs and CDMA RF. Each marketing team is responsible for a product line and has dedicated personnel performing various marketing tasks, including collecting market information and product requirements, defining the product roadmap and required feature sets for product and reference designs, as well as business development.
Our sales team is organized to provide account management and local customer support, and they are deployed near our major customers in China, Japan, Korea and Taiwan. We have a direct sales force that serves our OEM/ODM customers in China, Japan, Korea, Taiwan and the United States. Each salesperson has specific, local-market expertise and experience in selling semiconductor solutions. We supplement our direct sales team with qualified distributors in China, Japan, Korea and Taiwan. We have chosen our distributors based upon our careful evaluation of their ability to provide effective field sales, marketing communication and customer support.
Customers
We sell our products to both OEM/ODM customers either directly or indirectly through distributors. Direct sales to our OEM/ODM customers are conducted on a purchase order basis. OEMs typically incorporate our products into their mobile devices and then sell these devices to operators. Some of our OEM customers use ODMs either as an intermediary for filling a gap in their product lines or for adding complementary product offerings to their portfolio. In addition, base station suppliers sometimes will use ODMs to manufacture mobile devices which are then sold bundled with their base stations. Given the significant role that device OEMs play in 4G chipset selection in conjunction with the operators, we focus most of our efforts on establishing and maintaining relationships with major device OEMs and operators.
We sell directly to LG, which accounted for approximately 48% of our total revenue for the year ended June 30, 2011. These sales were made in support of launches of 4G networks from several major wireless operators, including AT&T, Verizon and Vodafone. We sell our products to LG on a purchase order basis, and LG does not have any long-term commitment or agreement with us to purchase our products. Our other primary customers, to which we sell directly or indirectly through distributors, include Infomark Co. Ltd., Inkel Corporation Ltd., Interbro Inc., Kyocera Corporation, LG Innotek Co. Ltd., Modacom Co. Ltd., Quanta Computer, Inc., Seowon Intech Co. Ltd. and YTL.
Indirect sales through distributors are generally made under non-exclusive agreements. The main purpose for sales through distributors is to take advantage of their expertise in end-customer fulfillment logistics. Sales through our largest distributor, Daejin Semiconductor Co., Ltd., accounted for approximately 19% of our total revenue for the year ended June 30, 2011. We entered into a standard distributor agreement with Daejin in March 2007. Under this agreement, Daejin agrees to serve as our non-exclusive distributor of our products for customers located in Korea. This agreement is currently effective and will remain effective unless terminated early by either party by providing advance written notice to the other party. In addition, we may terminate the agreement unilaterally if there is a material change in the ownership or control of Daejin. We also maintain relationships with wireless operators although we only sell directly to them in limited circumstances.
Manufacturing
We are a fabless semiconductor design company and rely on third-party foundries, assembly contractors and test contractors to manufacture our products. This outsourcing approach allows us to focus our resources on the design, development, sales and marketing of our products.
Our foundry vendors are UMC Group (USA) (UMC) and Samsung Semiconductor System LSI Division. We currently use standard 130-nanometer, 110-nanometer and 65-nanometer standard RF, mixed-signal and digital CMOS production processes. We are also developing our next generation of products using 40-nanometer process technology. The use of these commercially available standard processes enables us to produce cost effective products. We also use third-party vendors to assemble, package and test our products. We primarily use the services of ASE Test Limited (ASE) and STATS ChipPAC Ltd. for assembly, and ASE, Giga Solution Tech Co., Ltd. (Giga Solution), Hana Micron Co., Ltd., and United Test and Assembly Center Ltd. (UTAC) for testing.
90
Table of Contents
Although we rely on third-party contractors for manufacturing our products, we work closely with these manufacturers to optimize manufacturing costs and product quality and to ensure access to necessary capacity. In some cases, we use multiple assembly and test suppliers for our products to secure appropriate level of capacity and reduce risks related to loading plans, downtime and development uncertainties. We carefully track the entire process of the production cycle by monitoring key performance parameters, manufacturing processes and yield data. We also own automatic testing equipment at our third-party test contractor, UTAC, in Singapore, which enables us to conduct certain test procedures on demand and reduce development time. These process tracking and testing procedures ensure the long-term reliability and quality of our products.
We are ISO 9001 certified, and we have worked to ensure that all of our major suppliers and subcontractors are required to have quality manufacturing systems certified to ISO 9000 or ISO 14000 levels.
In general, we do not have supply agreements with our foundry, test, assembly and other vendors other than the minimum capacity agreements with UTAC and Giga Solution. The agreement with UTAC has an initial term of 12 months commencing on February 1, 2011, and the agreement with Giga Solution has an initial term of 6 months commencing on May 1, 2011. Each agreement requires the parties to negotiate in good faith to extend the agreement at the end of the initial term. See “Risk Factors—Risks Related to Our Business—We do not have long-term capacity agreements with our foundries and they may not allocate sufficient capacity to allow us to meet future demands for our products”.
Backlog
Our sales are made primarily pursuant to standard purchase orders from direct customers and distributors. The amount of backlog to be shipped during any period is dependent upon various factors, and all orders are subject to cancellation or modification, usually with no penalty to the customer. The quantities actually purchased by the customer, as well as shipment schedules, are frequently revised to reflect changes in both the customers’ requirements and in manufacturing availability. Therefore, our backlog at any point in time is not a reliable indicator of future revenue.
Intellectual Property
We rely on a collection of intellectual property rights, including patents, trade secrets, copyrights and trademarks and contractual protections, to protect our core technology and intellectual property. We filed patents primarily focused in the United States first, thereafter, in other countries as strategically and economically appropriate. As of June 30, 2011, we had 41 issued patents and 5 pending patent applications in the United States, 43 issued patents and 8 pending patent applications in Korea, 9 patents issued in China, 9 patents issued in Japan, 8 patents issued in Taiwan and 4 patents issued in India. The issued patents in the United States expire in the years beginning in 2018 through 2029. We cannot be certain that pending and future patent applications will result in issued patents.
Our 41 issued patents in the United States relate primarily to methods for designing and implementing our core technologies, including RF CMOS, single-chip integration, OFDMA, MIMO and dual modem implementation, which help us to address the LTE and WiMAX standards and offer highly integrated, low power and cost-effective solutions.
In the course of our product development, we rely on third-party intellectual property and the associated rights. For the use of third-party intellectual property rights, we obtain proper licenses from the proprietors. All licenses are non-exclusive and nearly all are perpetual. For those licenses that are non-perpetual, we insist on initial terms of three years or more with the option to extend. The licensed intellectual property is typically not singular or unique, and we anticipate that we will have the ability to find replacements should the associated license terminate against our wishes.
91
Table of Contents
In February 2009, we entered into a license agreement with LG, under which we were granted royalty-bearing, perpetual worldwide licenses to certain LTE IP to develop, implement and use these technologies in our products. The agreement continues to remain effective until both parties mutually agree in writing to terminate. Either party may terminate the agreement by written notice if the other party is in material breach of the agreement and fails to cure the breach within 30 days, or if the breach cannot be reasonably cured within 30 days, fails to diligently endeavor to cure within a reasonable time. Each party may also terminate the agreement if the other party is subject to a bankruptcy or similar proceeding. In June 2006, we entered into a technology license agreement with ARM Limited (ARM), under which we were granted a non-exclusive and royalty-bearing license to use certain intellectual property of ARM relating to the application processors in our semiconductor solutions. The license allows us to integrate various digital functions and software programs into our products. This agreement will remain effective until terminated by either party. Either party may terminate the agreement if the other party has committed a material breach of the agreement and fails to cure the breach within 60 days, or if the other party is the subject of a winding-up proceeding or receivership of assets.
Our employees, contractors, suppliers and customers are required to keep our confidential information in confidence via contractual obligations. In addition, we require all employees, consultants and contractors to sign assignment agreements or consulting agreements, whereby they are required disclose and assign to us all inventions conceived in the course of fulfilling their services.
The semiconductor industry is characterized by frequent litigation and other vigorous offensive and protective enforcement actions over rights to intellectual property. Moreover, there are numerous patents in the semiconductor industry, and new patents are being granted rapidly worldwide. Except for the LGE Agreement, we have not entered into license agreements with other third parties who may hold patents that may be infringed by our products. There can be no assurance that in the future we would be able to obtain licenses from such third parties or that if such licenses are available they would be on reasonable terms.
Our competitors may obtain patents that block or limit our ability to develop new technology and/or improve our existing products. If our products, including our LTE and WiMAX solutions, were found to infringe any patents or other intellectual property rights held by third parties, we could be prevented from selling our products or be subject to litigation fees, statutory fines and/or other significant expenses. We may be required to initiate litigation in order to enforce any patents issued to us, or to determine the scope or validity of a third-party’s patent or other proprietary rights. We may in the future be contacted by third parties suggesting that we seek a license to intellectual property rights that they may believe we are infringing. In addition, in the future, we may be subject to lawsuits by third parties seeking to enforce their own intellectual property rights, as described in “Risk Factors—Risks Related to Our Business—We may face claims of intellectual property infringement, which could be time-consuming, costly to defend or settle and result in the loss of significant rights.”
Employees
As of June 30, 2011, we had 195 full-time employees including 143 in Research and Development and Production, 27 in Sales and Marketing, 25 in General and Administration. Geographically, 21 employees were located in the United States, 163 in Korea, and 11 in Japan, China, Taiwan and Singapore as of June 30, 2011. None of our employees is represented by a labor organization or is under any collective bargaining arrangement. We consider current employee relations to be good. We also work with independent contractors and consultants.
Facilities
Our principal executive offices are located in San Jose, California, consisting of approximately 10,000 square feet under a lease that expires in December 2013. This facility accommodates our principal sales, marketing finance and administrative activities. We lease a facility in Seoul, Korea, which accommodates our main research development and production functions and consists of approximately 64,000 square feet under a lease that is renewable annually at the end of each calendar year. We also lease small offices to accommodate sales and application personnel for customer support in Shanghai and Shenzhen, China; Taipei, Taiwan; Tokyo, Japan; and Singapore. We do not own any real property. We believe that our leased facilities are adequate to meet our current needs and that additional facilities will be available on suitable, commercially reasonable terms to accommodate future requirements.
92
Table of Contents
Legal Proceedings
From time to time, we may be involved in legal proceedings arising in the ordinary course of our business. We are not currently a party to any material legal proceedings, the outcome of which, if determined adversely to us, would individually or in the aggregate have a material adverse effect on our business, operating results, financial condition or cash flows.
93
Table of Contents
Executive Officers, Directors
The following table sets forth information regarding our executive officers, directors and key employees as of September 30, 2011:
| Name |
Age | Position | ||||
| Executive Officers and Directors:: |
||||||
| Kyeongho Lee, Ph.D. |
42 | President, Chief Executive Officer and Director | ||||
| John Schlaefer |
48 | Chief Operating Officer | ||||
| Gene Kulzer |
61 | Chief Financial and Administrative Officer | ||||
| Alex Sum |
64 | Vice President of Marketing and Business Development | ||||
| Jeongmin Kim, Ph.D. |
41 | Vice President of Engineering | ||||
| Paul H.J. Kim, Ph.D.(2)(3) |
55 | Director, Chairman of the Board | ||||
| Robert J. Barker(1)(2)(3) |
65 | Director | ||||
| George de Urioste(1)(2)(3) |
56 | Director | ||||
| Kary Eldred(1) |
37 | Director | ||||
| (1) | Member of the Audit Committee. |
| (2) | Member of the Compensation Committee. |
| (3) | Member of the Nominating and Corporate Governance Committee. |
Kyeongho Lee, Ph.D. is a co-founder of our company and has served as our President, Chief Executive Officer and a member of the board of directors since 2000. Since 2002, Dr. Lee served as a member of the board of directors of AnaPass, Inc., a semiconductor company that supplies advanced panel controller solutions. From 1999 to 2001, Dr. Lee served as our Chief Technology Officer. From 1995 to 1998, Dr. Lee served as a member of the technical staff at Silicon Image Inc., a provider of advanced, interoperable connectivity solutions for high-definition displays. As a member of Silicon Image’s engineering division, Dr. Lee created and patented the technology for the PanelLink flat panel display, which was adopted as the worldwide standards known as DVI and HDMI. Dr. Lee holds 17 U.S. patents on RF direct conversion and other RF design techniques, which laid the foundation for the development of our proprietary CMOS RF and single-chip technology. Dr. Lee holds a B.S., M.S. and Ph.D. in Electrical Engineering from Seoul National University, where he was granted the Distinguished Dissertation award for his Ph.D. thesis on CMOS RF technology. Dr. Lee’s extensive technological expertise and business experiences in the mobile communications industry and his knowledge of our day-to-day operations provide our board of directors with valuable insights and in-depth understanding of our company.
John Schlaefer has served as our Chief Operating Officer since February 2006. From 2003 to 2006, Mr. Schlaefer served as a member of our board of directors. From 2001 to 2005, Mr. Schlaefer was the Product Line Director for the RF Products Business Unit at National Semiconductor Corporation (National), a leading semiconductor company focused on analog and mixed-signal integrated circuits, where he was responsible for National’s industry leading phase-locked loop (PLL) and voltage-controlled oscillator (VCO) product lines. During this time, Mr Schlaefer also architected a successful partnership between National and GCT, resulting in the launch of PLL/VCO and PHS radio families by National. From 1994 to 2000, Mr. Schlaefer held various regional and worldwide marketing and operational positions at National, including Marketing Director, RF Products Business Unit from 1999-2001, Product Line Marketing Manager, Wireless Product Business Unit from 1996 to 1999 and Marketing Manager, New Business Development, Americas Regional Business Unit, from 1994 to 1996. From 1987 to 1993, Mr. Schlaefer was a project engineer and program manager at Watkins-Johnson Company, a microwave component and systems company serving the military marketplace. Mr. Schlaefer holds a B.S. and M.S. in Electrical Engineering from Stanford University, and an MBA from the University of California at Berkeley.
94
Table of Contents
Gene Kulzer has served as our Chief Financial and Administrative Officer since June 2011. From 2003 to his current position with the company, Mr. Kulzer has served as Interim Corporate Controller for three publicly traded companies. These were Marvell Technology Group Ltd., a semiconductor company providing high-performance application-specific standard products, from February 2008 to October 2008; ABM Industries Incorporated, a publicly traded company specializing in facilities services, from March 2007 to January 2008; and Dreyer’s Grand Ice Cream, Inc., subsequently a subsidiary of Nestle S.A., a food and nutrition company, from May 2004 to December 2005. Also since 2003, he was a strategic business and financial advisor for several start-up companies, including AWeber Systems, Inc., a private company providing email marketing services, where he has served as Chief Financial Officer from 2003. From 1997 to 2003, Mr. Kulzer was a partner for the enterprise risk services practice of Deloitte LLP, an accounting firm. From 1993 to 1996, Mr. Kulzer was Director of Finance/Information Systems and Controller for Solectron Corporation, a publicly traded company providing electronics manufacturing and supply chain management services. From 1991 to 1992, Mr. Kulzer was Group Controller/CFO for the North American Operations of Dentsply International, Inc., a publicly traded company that develops, manufactures and distributes professional dental products. From 1982 to 1990, Mr. Kulzer was Director of Internal Auditing for Hershey Foods Corporation. Previously, Mr. Kulzer was a Senior Management Consultant for Peat, Marwick, Mitchell & Co. Mr. Kulzer holds a BSBA in Accounting from the University of Rhode Island and did post graduate studies in the MBA program at the University of Rochester.
Alex Sum has served as our Vice President of Marketing and Business Development since May 2002. From March 1992 to May 2002, Mr. Sum was Product Marketing Manager at Philips Semiconductor, the predecessor company of NXP Semiconductors, N.V., a semiconductor manufacturing company. From March 1983 to January 1992, Mr. Sum was Product/Test Engineering Supervisor at Supertex Inc., a technology company producing high voltage analog and mixed signal semiconductor components. From September 1977 to March 1983, Mr. Sum was Product / Test Engineering Supervisor at Fairchild Semiconductor International, Inc., a mixed signal, memory and discrete semiconductor company. From April 1995 to September 1997, Mr. Sum was Test/Wafer fab processing Engineering at Siliconix, the predecessor company of Vishay Intertechnology, Inc., a mixed signal, analog semiconductor company. Mr. Sum holds a B.S. in Electrical Engineering from San Jose State University.
Jeongmin Kim, Ph.D. has served as our Vice President of Engineering since July 2003 and as our Director of Engineering from February 2001 to June 2003. Prior to joining us, Dr. Kim was involved in many industrial research projects relating to telecommunications technologies, including working as an independent design engineer in the development of an MPEG2 video decoder for HDTV with Daewoo Electronics, a home electronics company, from 1997 to 1998; a high performance H.263 video codec application-specific integrated circuit (ASIC) with Korea Telecom, an integrated wired/wireless telecommunication service provider, from 1995 to 1997; and a high performance microcontroller for Samsung Electronics from 1993 to 1995. Dr. Kim holds a B.S. and M.S. in Electrical Engineering from Seoul National University and a Ph.D. in the high performance CPU architecture, also from Seoul National University.
Paul H.J. Kim, Ph.D. has served as our Chairman of the board of directors since November of 2007 and as a member of our board of directors since November of 2002. Since March 2000, Dr. Kim has been the managing director of Parakletos Ventures, a global investment fund focused on innovative technology companies in China, Korea, India and the U.S., which included investments in Silicon Image, Inc., a provider of advanced, interoperable connectivity solutions for high-definition (HD) content, WuMart Store, Inc., one of the leading retail chains in China and Techwell Inc, a semiconductor company that was acquired by Intersil Corporation, a designer and manufacturer of high-performance analog and mixed-signal integrated circuits. From 1995 to 1999, Dr. Kim was Executive Vice President at Korea Technology Investment Corporation (KTIC), a Korea-based venture capital firm. In 1984, Dr. Kim founded the Kim Law Firm in the Silicon Valley, a firm practicing law for U.S. and Asian based companies. Dr. Kim holds a B.A. in Philosophy from the University of California at Berkeley and a J.D. from the University of California, Hastings College of Law. Dr. Kim also holds an honorary doctorate degree from Bethesda Christian University. Dr. Kim’s extensive experience in venture capital
95
Table of Contents
financing of semiconductor companies, his background in counseling leading suppliers of consumer electronics and his experiences in the business law, bring significant financial and legal expertise to our board of directors.
Robert J. Barker has served as a member of our board of directors since April 2011. From October 1999 to January 2010, Mr. Barker was Vice President of Corporate Business Development at Micrel Incorporated (Micrel), a semiconductor company focused on developing analog power integrated circuits. Mr. Barker was Vice President of Human Resources at Micrel from February 2008 to January 2010. From October 2008 to January 2009, Mr. Barker served as Interim Vice President of Finance and Chief Financial Officer of Micrel. Mr. Barker also served as Micrel’s Secretary from May 2000 to May 2001 and was reappointed as Secretary in February of 2009. From April 1994 to September 1999, Mr. Barker was Vice President of Finance and Chief Financial Officer of Micrel. Prior to that, Mr. Barker was Vice President of Finance and Secretary of Waferscale Integration, Inc., a fabless semiconductor manufacturer focused on non-volatile memory products. Mr. Barker also held various accounting and financial positions at Monolithic Memories and Lockheed Missiles and Space Co. Mr. Barker holds a B.S. in Electric Engineering and an M.B.A. from the University of California at Los Angeles. Mr. Barker’s extensive experience in managing a semiconductor company and his understanding of the business operations and financial reporting of publicly traded technology companies bring significant financial expertise and in-depth knowledge of the semiconductor industry to our board of directors.
George A. de Urioste has served as a member of our board of directors since April 2011. Since February 2011, Mr. de Urioste has been a member of the board of directors of Bridgelux, Inc., a provider of semiconductor solutions for light emitting diode technology. From January 2008 to November 2010, Mr. de Urioste was a director of Saba Software, Inc., a publicly traded software company focused on people collaboration solutions. From January 2008 to October 2008, Mr. de Urioste served as Acting Chief Operating Officer and Interim Chief Financial Officer of Marvell Technology Group Ltd., a semiconductor provider. From November 2004 to March 2006, Mr. de Urioste served as the Chief Operating Officer and Chief Financial Officer of Chordiant Software, a provider of enterprise software for customer service and marketing processes. From June 2000 to July 2003, Mr. de Urioste was the Chief Executive Officer of Aeroprise, Inc., and Chairman of the Board of Directors from June 2000 through January 2006, a mobile workflow management software company that he co-founded in 2000, which was acquired by BMC Software, Inc. From March 1993 to July 1998, Mr. de Urioste was the Chief Financial Officer and Vice President of Finance and Operations for Remedy Corporation, a provider of enterprise software. Mr. de Urioste holds a B.S. from the University of Southern California and an M.B.A. from the University of California at Berkeley. Mr. de Urioste is a Certified Public Accountant (inactive). Mr. de Urioste’s extensive experience in senior management positions in technology companies and knowledge of complex financial and operational issues and corporate governance matters facing publicly-traded companies, and a deep understanding of accounting principles and financial reporting rules and regulations, bring significant financial and auditing expertise to our board of directors.
Kary Eldred has served as a member of our board of directors since 2009. Since 2000, Mr. Eldred has served as a Principal of Parakletos Ventures, a global investment fund focused on innovative technology companies in China, Korea, India and the U.S. Since 2000, Mr. Eldred has also served as a board member of the Living Stones Foundation Charitable Trust, a public support organization with excess of $20 million in assets to fund charity works around the world. Since September 2010, Mr. Eldred has been Chairman of the Board of Directors of Altadona, S.A., which commercializes and integrates advanced software solutions in the physical security space, and he has been Chief Executive Officer of Altadona, S.A. since January 2011. Mr. Eldred holds a B.A. in Foreign Service from Baylor University and an Executive MBA from Instituto Empresa in Spain. Mr. Eldred’s extensive experiences in venture capital financing of technology companies bring significant industry expertise and appropriate perspective to our board of directors.
96
Table of Contents
Board Composition
Upon the completion of this offering, our common stock is expected to be listed on The NASDAQ Global Market. Under the rules of The NASDAQ Stock Market, LLC (NASDAQ), a majority of a listed company’s board of directors must be consisted of “independent” directors. In addition, applicable NASDAQ rules require that, subject to specified exceptions, each member of a listed company’s audit, compensation and nominating committees be independent within the meaning of applicable NASDAQ rules. Audit committee members must also satisfy the independence criteria set forth in Rule 10A-3 under the Securities Exchange Act of 1934, as amended (Exchange Act).
Our board of directors currently consists of five members. In June 2011, our board of directors undertook a review of the independence of each director and considered whether any director has a material relationship with us that could compromise his ability to exercise independent judgment in carrying out his responsibilities. As a result of this review, our board of directors determined that all of our directors, other than Dr. Kyeongho Lee, qualify as “independent” directors within the meaning of the NASDAQ rules. Accordingly, a majority of our directors are independent, as required under applicable NASDAQ rules. In making this determination, our board considered Dr. Paul H. Kim and Mr. Kary Eldred’s affiliations with Parakletos Ventures, one of our stockholders. As required under applicable NASDAQ rules, we anticipate that our independent directors will meet in regularly scheduled executive sessions at which only independent directors are present.
Voting Agreement
We have entered into a voting agreement with the purchasers of our outstanding preferred stock, including Parakletos Ventures and FirstMark Capital, certain of our directors and persons and entities with which certain of our directors are affiliated, and certain other stockholders, obligating each party to vote or consent at each stockholder meeting or with respect to each written stockholder consent to elect the nominees of certain parties to the board. The holders of a majority our Series A Preferred Stock and Series B Preferred Stock have designated Dr. Kim, an affiliate of Parakletos Ventures, for election to our board of directors. The holders of a majority of our Series F Preferred Stock have designated Mr. Eldred, an affiliate of Parakletos Ventures, for election to our board of directors. The holders of a majority of our common stock have designated Dr. Lee for election to our board of directors. Upon the completion of this offering, the voting agreement will terminate in its entirety and none of our stockholders will have any special rights regarding the election or designation of members of our board of directors.
Board Leadership Structure and Role in Risk Management
Our board has a Chairman, Dr. Kim, who has authority, among other things, to establish the agenda for and preside over board meetings, including meetings of the independent directors, and coordinate with committee chairs regarding meetings agendas. Accordingly, the Chairman has substantial ability to shape the work of our board. Our Chief Executive Officer, Dr. Lee, also serves as a director. We believe that separation of the roles of Chairman and Chief Executive Officer reinforces the independence of our board in its oversight of the business and affairs of our company. However, no single leadership model is right for all companies and at all times. The board recognizes that depending on the circumstances, other leadership models, such as combining the role of Chairman with the role of Chief Executive Officer, might be appropriate. Accordingly, the board may periodically review its leadership structure.
One of the key functions of our board of directors is informed oversight of our risk management process. The board of directors does not have a standing risk management committee, but rather administers this oversight function directly through the board of directors as a whole, as well as through various board of directors standing committees that address risks inherent in their respective areas of oversight. In particular, our board of directors is responsible for monitoring and assessing strategic risk exposure, our audit committee has the responsibility to
97
Table of Contents
consider and discuss our major financial risk exposures and the steps our management has taken to monitor and control these exposures, including guidelines and policies to govern the process by which risk assessment and management is undertaken. The audit committee also monitors compliance with legal and regulatory requirements, in addition to oversight of the performance of our internal audit function. Our nominating and corporate governance committee monitors the effectiveness of our corporate governance guidelines, including whether they are successful in preventing illegal or improper liability-creating conduct. Our compensation committee assesses and monitors whether any of our compensation policies and programs has the potential to encourage excessive risk-taking.
Board Committees
Our board of directors has established an audit committee, a compensation committee and a nominating and corporate governance committee. Our board of directors may establish other committees to facilitate the management of our business. The composition and functions of each committee are described below.
Audit Committee
Our audit committee currently consists of George de Urioste, Robert Barker and Kary Eldred, each of whom our board of directors has determined to be independent under the applicable SEC rules and NASDAQ listing standards. The chair of our audit committee is George de Urioste. Each member of our audit committee can read and understand fundamental financial statements in accordance with audit committee requirements. In arriving at this determination, the board has examined each audit committee member’s scope of experience and the nature of their employment in the corporate finance sector. In addition, our board of director has determined that Mr. de Urioste is an audit committee financial expert as defined under the applicable rules and regulations of the SEC and has the requisite financial sophistication as defined under the applicable rules and regulations of NASDAQ. Upon completion of this offering, the audit committee will be comprised of three directors, each of will satisfy the independence and other requirements for audit committee membership under the SEC rules and NASDAQ listing standards. The audit committee operates under a written charter that satisfies the applicable standards of the SEC and NASDAQ and which will be available on our website immediately prior to the completion of this offering at www.gctsemi.com.
The functions of our audit committee include:
| • | assisting our board of directors in its oversight of the integrity of our financial statements, the financial reporting process, risk management, internal control over financial reporting, systems of internal accounting and financial controls, the annual independent audit of the financial statements, legal compliance and ethics programs; |
| • | reviewing policies and procedures adopted by the Company to fulfill its responsibilities regarding the fair and accurate presentation of financial statements in accordance with generally accepted accounting principles and applicable rules and regulations of the Securities and Exchange Commission, and the securities exchange on which shares of the Company’s common stock are listed; |
| • | overseeing the Company’s financial reporting process on behalf of the board of directors and reporting the results to the board of directors; |
| • | reviewing on a continuing basis the adequacy of the Company’s systems of internal controls and procedures; |
| • | retaining and setting compensation of our independent auditor, evaluating and monitoring its performance, and if appropriate, discharging our independent auditor; |
| • | reviewing and approving all audit and non-audit services of our independent auditor; |
| • | reviewing and discussing with management and our independent auditor our financial statements and reporting; |
98
Table of Contents
| • | discussing with our independent auditor significant financial reporting issues in connection with the preparation of our financial statements; |
| • | resolving any disagreements between management and our independent auditor regarding financial reporting; |
| • | reviewing and approving related party transactions; |
| • | reviewing and reassessing the adequacy of the audit committee charter annually, and reporting to the board of directors its recommendations; and |
Compensation Committee
Our compensation committee consists of Dr. Kim, Mr. Barker and Mr.de Urioste, each of whom our board of directors has determined to be independent under the NASDAQ listing standards, to be a “non-employee director” as defined in Rule 16b-3 promulgated under the Exchange Act and to be an “outside director” as that term is defined in Section 162(m) of the Internal Revenue Code of 1986, as amended (Section 162(m)). The chair of our compensation committee is Dr. Kim. Upon completion of the offering, our compensation committee will operate under a written charter that will satisfy the applicable standards of NASDAQ and which will be available on our website at www.gctsemi.com.
The functions of our compensation committee include:
| • | establishing compensation arrangements and incentive goals for our executive officers and administering compensation plans; |
| • | evaluating the performance of executive officers and awarding incentive compensation and adjusting compensation arrangements as appropriate based upon performance; |
| • | reviewing and monitoring management development and succession plans and activities; |
| • | reviewing compensation programs applicable to non-employee directors of our board, including all forms of cash compensation and equity compensation provided to non-employee directors; and |
| • | preparing an annual report on executive officer compensation for inclusion in our annual proxy statement. |
Nominating and Corporate Governance Committee
Our nominating and corporate governance committee consists of Dr. Kim, Mr. Barker and Mr. de Urioste, each of whom our board of directors has determined is independent under the NASDAQ listing standards. The chair of our nominating and corporate governance committee is Dr. Kim. Our nominating and corporate governance committee operates under a written charter that will satisfy the applicable standards of NASDAQ and which will be available on our website at www.gctsemi.com. The functions of our nominating and corporate governance committee include:
| • | recommending to the board of directors the composition and operations of the board of directors; |
| • | identifying individuals qualified to serve as members of the board of directors, and identifying and recommending director nominees for the our annual meeting of stockholders and to fill the vacancies; and |
| • | recommending to the board of directors the responsibilities of each board committee, the composition and operation of each board of directors committee, and the director nominees for assignment to each committee of the board of directors; |
| • | overseeing the establishment of policies and procedures for stockholder nominations of directors and compliance with applicable rules under the Exchange Act with respect to stockholder nomination of directors; and |
99
Table of Contents
| • | reviewing and recommending to our board of directors changes with respect to corporate governance practices and policies. |
Code of Business Conduct and Ethics
We will adopt a Code of Business Conduct and Ethics that will apply to all of our employees, officers, including our principal executive officer, principal financial officer, principal accounting officer or controller, or persons performing similar functions, agents and representatives, including directors and consultants. Upon the effectiveness of the registration statement of which this prospectus forms a part, the full text of our Code of Business Conduct and Ethics will be posted on our website at www.gctsemi.com. We intend to disclose future amendments to certain provisions of our Code of Business Conduct and Ethics, or waivers of such provisions, applicable to any principal executive officer, principal financial officer, principal accounting officer or controller, or persons performing similar functions or our directors on our website identified above. The inclusion of our website address in this prospectus does not include or incorporate by reference the information on our website into this prospectus.
Compensation Committee Interlocks and Insider Participation
None of the members of the compensation committee is currently or has been at any time one of our officers or employees. None of our executive officers currently serves, or has served during the last completed fiscal year, as a member of the board of directors or compensation committee of any entity that has one or more executive officers serving as a member of our board of directors or compensation committee.
Summary of Director Compensation
The following table sets forth certain information regarding the compensation of each individual who served as a non-employee member of our board of directors during fiscal year 2011.
| Name(1) |
Fees Earned or Paid in Cash ($) |
Option Awards ($)(10) |
All Other Compensation ($) |
Total ($) |
||||||||||||
| Robert Barker(2) |
$ | 6,250 | (3) | $ | 167,102 | — | $ | 173,352 | ||||||||
| Bill Byun(4) |
— | — | — | $ | — | |||||||||||
| George de Urioste(5) |
$ | 11,500 | (6) | $ | 224,945 | — | $ | 236,445 | ||||||||
| Kary Eldred |
— | — | — | $ | — | |||||||||||
| Dong-Su Kim(7) |
— | — | — | $ | — | |||||||||||
| Paul Kim, Ph.D. |
— | — | — | $ | — | |||||||||||
| Jerry Poch(8) |
— | — | — | $ | — | |||||||||||
| Greg Rossmann(9) |
— | — | — | $ | — | |||||||||||
| (1) | Dr. Lee, our President and Chief Executive Officer, is not included in this table because he is our employee and does not earn any additional compensation for his services as a director. The compensation earned by Dr. Lee as our employee is shown in the Summary Compensation Table. |
| (2) | Mr. Barker began his service on our board of directors on April 22, 2011. |
| (3) | Consists of the portion of the annual retainer fee payable, pursuant to the terms of his offer letter, for service as a member of our board of directors and audit committee for the period April 22, 2011 to June 30, 2011. |
| (4) | Mr. Byun ended his service on our board of directors on August 1, 2010. |
| (5) | Mr. de Urioste began his service on our board of directors on April 22, 2011. |
| (6) | Consists of the portion of the annual retainer fee payable, pursuant to the terms of his offer letters, for service as a member of our board of directors and Chair of our the audit committee for the period from April 22, 2011 to June 30, 2011. |
| (7) | Dong-Su Kim served as a member of our board of directors from August 1, 2010 to May 25, 2011. |
| (8) | Mr. Poch ended his service on our board of directors on February 2, 2011. |
100
Table of Contents
| (9) | Mr. Rossmann ended his service on our board of directors on February 2, 2011. |
| (10) | Represents the aggregate grant-date fair value of the stock option granted to the named member of our board of directors during fiscal year 2011, as calculated in accordance with FASB ASC Topic 718. This grant-date fair value does not take into account any estimated forfeitures related to service-vesting conditions. See Note 9 of Notes to Consolidated Financial Statements for the year ended June 30, 2011 for a discussion of assumptions made in determining the grant-date fair value of our stock option awards. As of June 30, 2011, individuals who served as our non-employee members of our board of directors during fiscal year 2011 held the following outstanding options to purchase our common stock: |
| Name |
Number of Shares Subject to Outstanding Options |
Exercise Price Per Share |
||||||
| Robert Barker |
260,000 | $ | 0.93 | |||||
| Bill Byun |
— | — | ||||||
| George de Urioste |
350,000 | $ | 0.93 | |||||
| Kary Eldred |
— | — | ||||||
| Dong-Su Kim |
— | — | ||||||
| Paul Kim, Ph.D. |
— | — | ||||||
| Jerry Poch |
— | — | ||||||
| Greg Rossmann |
— | — | ||||||
No reportable stock awards were made to the non-employee members of our board of directors during fiscal year 2011, and none of those board members held any stock awards as of June 30, 2011.
Contractual Arrangements
We have entered into offer letters with two of the non-employee members of our board of directors, Messrs. de Urioste and Barker. The principal provisions of these offer letters are summarized as follows:
Mr. de Urioste
Pursuant to the terms of April 21, 2011 offer letter, Mr. de Urioste is paid an annual retainer fee of $60,000 in the aggregate for his service as a member of our board of directors, the Chairman of our audit committee and a member of our compensation committee and nominating and corporate governance committee. In addition, on June 24, 2011, he was granted a stock option to purchase 350,000 shares of our common stock with an exercise price of $0.93 per share. The option has a maximum term of ten years and will vest in a series of 36 successive equal monthly installments upon his continuation of each month of service on our board of directors over the 36-month period measured from April 22, 2011. The option will vest as to all shares on an accelerated basis immediately prior to the effective date of a change in control transaction.
Mr. Barker
Pursuant to the terms of April 7, 2011 offer letter, Mr. Barker is paid an annual retainer fee of $30,000 in the aggregate for his service as a member of the our board of directors and as a member of our audit committee, compensation committee and nominating and corporate governance committee. In addition, on June 24, 2011, he was granted a stock option to purchase 260,000 shares of our common stock with an exercise price of $0.93 per share. The option has a maximum term of ten years and will vest in a series of 36 successive equal monthly installments upon his continuation of each month of service on our board of directors over the 36-month period measured from April 22, 2011, the date on which he joined the board.
101
Table of Contents
Compensation Discussion and Analysis
The following is a discussion and analysis of the compensation arrangements that were in effect for the fiscal year ended June 30, 2011 for the named executive officers identified in the Summary Compensation Table that follows. This discussion should be read together with that table and the other compensation tables and related disclosures that follow.
Compensation Philosophy and Objectives
Our philosophy is to provide our named executive officers with compensation that will motivate and retain such individuals, provide them with meaningful incentives to achieve short-term and long-term corporate objectives set by our board of directors, and align their long-term interests with those of our stockholders.
Based on this philosophy, the compensation programs for our named executive officers are designed to achieve the following primary objectives:
| • | establish a compensation structure that is competitive enough to attract, retain and motivate outstanding executive talent; |
| • | ensure that any cash incentive compensation programs for our named executive officers are aligned with our corporate strategies and business objectives by tying the potential payouts under such programs to the achievement of key strategic, financial and operational goals; and |
| • | utilize long-term equity awards to establish a mutuality of interests between our named executive officers and stockholders. |
Compensation Decision-Making Process
Annual Review Process. Except as otherwise noted in one or more sections below, the compensation of our named executive officers is typically reviewed on an annual basis by our compensation committee, usually in July each year. As part of that review process, the compensation committee takes into account a number of factors, including the nature and scope of the named executive officer’s responsibilities, his or her individual performance level and contribution to the achievement of our corporate objectives, the recommendations of our Chief Executive Officer as to each such individual’s compensation package (other than his own), his or her existing equity ownership, whether in actual shares of our common stock or outstanding stock options to acquire such shares, and the compensation trends in the industry.
As part of the annual review process, the compensation committee may adjust the annual base salary of one or more of our named executive officers. However, we have offer letters with three of our current named executive officers (Messrs. Kulzer, Schlaefer and Sum) in which we set their individual rates of annual base salary at the negotiated level necessary to secure their employment with us. Mr. Schlaefer also participates, pursuant to the terms of his offer letter, in an annual cash bonus plan that is based in part on the attainment of specified financial goals and in part on the achievement of pre-established personal management objectives formulated by our Chief Executive Officer. Mr. Sum participates in the annual cash bonus plan generally available to our marketing, sales and program management employees which is also based in part on the attainment of specified financial goals and in part on the achievement of pre-established personal management objectives. Commencing with fiscal year 2012, Mr. Kulzer, our recently hired Chief Financial Officer, will also be eligible to participate, pursuant to the terms of his offer letter, in an annual cash bonus program tied to the attainment of corporate performance objectives and his overall job performance. Our compensation committee may also provide discretionary cash bonuses to one or more of our other named executive officers based on its assessment of our overall financial performance for the fiscal year and the named executive officer’s individual
102
Table of Contents
performance and achievements for the year. The compensation committee also determines the appropriate equity awards to be made periodically to the named executive officers to ensure that they continue to have a meaningful proprietary interest in the company and a substantial incentive to remain in our employ.
No External Advisors. In any annual review process that occurs, our compensation committee typically makes its decisions regarding the cash and equity compensation of our named executive officers based on its analysis of relevant market data furnished by our Human Resources Department, its understanding of the competitive environment for executive talent and the factors identified above. Although our compensation committee has the authority to engage an independent compensation consultant to advise it in the review process, it has not historically done so because of the limited size of our officer base, our private company status and the relatively straight-forward nature of our compensation structure. Instead, the compensation committee has relied on its own judgment and experience (including knowledge of industry trends) in making compensation decisions. However, following the completion of this offering, our compensation committee intends to retain its own independent consultant to assist in the identification of an appropriate peer group for benchmarking our named executive officer compensation and to provide advice and recommendations with respect to the compensation level for each of our named executive officers and the mix of that compensation in relation to the established peer group. For a discussion of the specific responsibilities of our compensation committee, see “Management— Committees of the Board of Directors—Compensation Committee.”
Role of Management. Our Chief Executive Officer, with input from our Human Resources Department, provides our compensation committee with his recommendations as to the base salary, cash bonus potential and long-term equity incentive awards for each of our named executive officers other than himself based on that officer’s level of responsibility, individual performance and contribution to the attainment of our strategic corporate objectives. Our compensation committee takes the Chief Executive Officer’s recommendations into consideration in setting named executive officer compensation but retains complete discretionary authority to make all compensation-related decisions for our named executive officers. Our compensation committee makes its compensation decisions with respect to the Chief Executive Officer on the basis of relevant market data furnished by the Human Resources Department and its subjective assessment of his individual performance and contributions to our overall corporate performance.
Benchmarking. Solely for purposes of setting the annual base salary component of named executive officer compensation, our compensation committee typically relies on the Radford survey of named executive officer compensation at companies in our space in the semiconductor industry. In years prior to fiscal year 2011, the Radford survey of semiconductor companies with annual revenues of between $10 million and $39.9 million and with an employee base of 100 to 200 individuals was used. Except for those named executive officers whose rate of base salary is set pursuant to their offer letters from us, it is the compensation committee’s practice to set the annual base salary of each of our named executive officers at approximately the median level of base salary for the comparable position at the companies included in the applicable Radford survey.
Compensation Structure
Elements of Compensation
We utilize three main components in structuring compensation programs for our named executive officers:
| • | Base salary, which is primarily used to recruit and retain executive talent and provide an element of financial certainty and economic security from year to year; |
| • | Performance-based cash bonuses that do not provide any economic guarantees and are primarily designed to reward achievement of financial and operational goals as well as personal management objectives; and |
| • | Equity incentive awards, primarily in the form of stock options designed to ensure long-term retention of our executive talent and align their interests with those of our stockholders. |
103
Table of Contents
We view each component of compensation as related but distinct. There is no pre-established policy for the allocation of compensation between cash and non-cash components or between short-term and long-term components, and there are no pre-established ratios between the compensation of our Chief Executive Officer and that of the other named executive officers. Instead, our compensation committee determines the compensation of each named executive officer based on its review of the market data provided by the Human Resources Department, its subjective analysis of that individual’s performance and contribution to our financial performance and the other factors identified in the Compensation Decision-Making Process section above. However, it is the practice of our compensation committee to make a substantial portion of each named executive officer’s compensation performance-based in order to align his or her interests with those of our stockholders.
Base Salaries
Base salaries are set at levels that are intended to recognize the experience, skills, knowledge and responsibilities required of all our named executive officers. We negotiated offer letters with certain of our named executive officers in connection with their commencement of employment. As part of the negotiation process to secure their employment, those letters established the level of annual base salary to which those named executive officers will be entitled during their period of employment with us, subject to periodic review and adjustment by our compensation committee. The named executive officers who have offer letters with a stated level of base salary are as follows:
| Named Executive Officer |
Stated Rate of Annual Base Salary |
|||
| Gene Kulzer (1) |
$ | 225,000 | ||
| John Schlaefer |
$ | 190,000 | ||
| Alex Sum |
$ | 150,000 | ||
| Ron Wilderink (2) |
$ | 185,000 | ||
| (1) | Pursuant to his June 2, 2011 offer letter. Mr. Kulzer commenced employment with us on June 3, 2011. |
| (2) | Mr. Wilderink ceased employment with us on June 3, 2011. |
Except as noted below, each named executive officer’s base salary level is typically reviewed on an annual basis, and subject to the terms of the applicable offer letter, adjustments may be made to the individual’s base salary on the basis of his level of performance, the overall performance of the company and the various compensation trends in our industry. However, our compensation committee believes that this particular element of named executive officer compensation should provide a level of economic security and continuity from year to year without substantial adjustment to reflect company performance. As mentioned earlier, our compensation committee typically sets the annual base salary of each named executive officer at approximately the median level for his position at peer companies in the applicable Radford survey of the semiconductor industry. The actual percentile levels used to calculate the base salary for each named executive officer for fiscal year 2011 are set forth below.
Fiscal Year 2010 Base Salaries
On February 16, 2009, our compensation committee reduced the rate of base salary for each of our named executive officers as a result of the negative impact that the global economic downturn had upon our customer base and business operations. The base salary reduction remained in effect for the entire fiscal year 2010. Accordingly, no increases or other adjustments were made to the base salary levels of our named executive officers during that year, and no salary review process was undertaken for that year.
104
Table of Contents
The following chart indicates the percentage by which each named executive officer’s rate of base salary was reduced during fiscal year 2009 and continued in effect for the entire fiscal year 2010:
| Named Executive Officer |
Rate of FY 2009 Base Salary Prior to Reduction |
Percentage Reduction in FY2009 Base Salary |
Reduced Level of FY 2009 Base Salary Continued for FY 2010 |
|||||||||
| Kyeongho Lee, Ph.D. |
$ | 180,000 | (1) | 50 | % | $ | 90,000 | (1) | ||||
| John Schlaefer |
$ | 216,817 | 25 | % | $ | 162,613 | ||||||
| Alex Sum |
$ | 200,673 | 25 | % | $ | 150,505 | ||||||
| Ron Wilderink |
$ | 253,943 | 25 | % | $ | 190,458 | ||||||
| Jeongmin Kim, Ph.D. |
$ | 108,567 | (1) | 25 | % | $ | 81,000 | (1) | ||||
| (1) | Converted into U.S. dollars based on a conversion rate of 1,000 Won per U.S. dollar. |
Fiscal Year 2011 Base Salaries
For most of fiscal year 2011, the base salaries of our named executive officers remained unchanged from fiscal year 2010 levels. In April 2011, our compensation committee decided, in light of the improving economic conditions in the semiconductor industry, to restore the base salary of each named executive officer to its level immediately prior to the fiscal year 2009 reduction. Accordingly, for the last three months of fiscal year 2011, base salary was paid at the annualized rate in effect before the fiscal year 2009 reduction. Because of the limited nature of the change, the compensation committee did not undertake any salary review process for fiscal year 2011.
The last time the compensation committee undertook a detailed salary review process for our named executive officers was in July 2008 in connection with the setting of their base salary levels for fiscal year 2009 prior to the reduction mentioned above. The compensation committee’s objective in the review process was to position those salary levels at approximately the 50th percentile of the comparable position based on its review of the Radford survey of peer companies in the semiconductor industry and the individual performance of those individuals. The actual percentages at or above the 50th percentile levels at which the base salaries of the named executive officers were set were as follows:
| Named Executive Officer |
Rate of FY 2009
Base Salary Prior to Reduction |
Percentage Above or Below 50% Percentile Level |
||||||
| Kyeongho Lee, Ph.D. |
$ | 180,000 | (1) | -35 | % | |||
| John Schlaefer |
$ | 216,817 | -9 | % | ||||
| Alex Sum |
$ | 200,673 | +8 | % | ||||
| Ron Wilderink |
$ | 253,943 | +24 | % | ||||
| Jeongmin Kim, Ph.D. |
$ | 108,567 | (1) | N/A | ||||
| (1) | Converted into U.S. dollars based on a conversion rate of 1,000 Won per U.S. dollar. |
Performance-Based Cash Bonuses
Fiscal Year 2011
As part of their total compensation package, two of our named executive officers (Messrs. Schlaefer and Sum) had the opportunity to earn a cash bonus for fiscal year 2011 that was based in part on the attainment of a specified revenue objective and in part on the achievement of certain pre-established personal management objectives. For Mr. Schlaefer, the revenue objective was set on a fiscal year basis, and his annual target bonus tied in part to the attainment of that objective and in part to the achievement of his personal management goals
105
Table of Contents
was set at $33,750 (reflecting the annual target bonus opportunity provided in his offer letter as reduced by 25% to reflect the reduction to Mr. Schlaefer’s compensation made in 2009). Following the adjustment to named executive officer base salaries in April 2011, Mr. Schlaefer’s target bonus for fiscal year 2011 was adjusted to $36,563. For Mr. Sum, a separate revenue objective was set for each of the six-month segments included within fiscal year 2011, and his target bonus for that year was set at 15% of his annual base salary. Accordingly, his target bonus for fiscal year 2011 was set at $22,576 (or $11,288 per six-month segment). Following the adjustment to named executive officer base salaries in April 2011, Mr. Sum’s target bonus for the second six (6)-month segment was adjusted to $13,169.
Thirty five percent (35%) of the bonus potential for Mr. Schlaefer for fiscal year 2011 and fifty percent (50%) of the bonus potential for Mr. Sum for such fiscal year was tied to our attainment of the applicable revenue objective, measured on a consolidated basis with our subsidiaries and calculated pursuant to our internally recorded but unaudited financial results. In the event that the revenue target is not fully obtained, the amount of actual cash bonus payout with respect to such revenue target will be proportionally adjusted. For Mr. Sum, at least 60% of the revenue target for a six (6)-month segment must be met in order to achieve any cash bonus payout with respect to the revenue target for that six (6)-month segment. There is no minimum payout for Mr. Schlaefer. The relevant revenue targets were initially set as follows:
| • | For Mr. Schlaefer, fiscal year revenue of at least $80 million. |
| • | For Mr. Sum, semi-annual revenue at not less than the following amounts: |
| Fiscal Period |
Revenue Objective at Target Level |
|||
| July 1, 2010 to December 31, 2010 |
$ | 30 million | ||
| January 1, 2011 to June 30, 2011 |
$ | 50 million | ||
Due to business conditions outside of his control, the semi-annual revenue objectives to which Mr. Sum’s target bonus is tied were adjusted to $27 million for the first half of fiscal year 2011 and approximately $47 million for the second half of fiscal year 2011.
The remainder of the bonus potential for each of those two individuals was tied to the achievement of individually-specified personal management goals that were, as to Mr. Schlaefer, set for the entire fiscal year and were, as to Mr. Sum, set for each of the six (6)-month segments within that fiscal year.
The key personal management goals for Messrs. Schlaefer and Sum may be summarized as follows:
Mr. Schlaefer’s 2011 Personal Management Goals (as set by our Chief Executive Officer):
| • | monitor sales gaps and develop action plans to meet quarterly revenue targets; |
| • | maintain key operator design wins; |
| • | expand major 4G handset OEM design wins; |
| • | secure adequate supply level from foundry, assembly and package vendors; |
| • | inventory management; |
| • | cost controls; |
| • | manage key product development project in accordance with the FY2011 Key Product Launch Plan; and |
| • | manage marketing team to ensure available resources are assigned in accordance with business priorities. |
106
Table of Contents
Mr. Sum’s 2011 Personal Management Goals (as set by Mr. Schlaefer):
| • | prepare short-term (12 months) and long-term (3 years) forecasts for our business; |
| • | maintain key operator design wins; |
| • | secure strategic business engagement and design win with target operators and terminal makers; |
| • | expand major 4G handset OEM design wins; |
| • | track and prioritize new business opportunities; |
| • | develop and maintain relationships with strategic ecosystem partners; |
| • | product marketing, including management of product roadmaps and pricing policies; and |
| • | identification and selection of key alpha customers and opportunities for new products. |
Our Chief Executive Officer (with respect to Mr. Schlaefer and Mr. Sum) and Chief Operating Officer (with respect to Mr. Sum only) evaluate the named executive officer’s level of achievement of the pre-established personal management goals, and our compensation committee takes such evaluations into consideration when determining the amount of bonus payable to such named executive officers. Our compensation committee reserves the discretion to award a below-target bonus amount in the event at least a threshold level of revenue was attained for the applicable measurement period or in the event most but not all the personal management goals for that period were achieved. No payment will be made in excess of the target amount.
Our fiscal year 2011 revenue was approximately $69 million, or approximately 86% of Mr. Schlaefer’s revenue target for the year. As such, Mr. Schlaefer received approximately 86% of the portion of his target bonus associated with the annual revenue target. Our Chief Executive Officer determined that Mr. Schlaefer achieved approximately 79% of his assigned personal management goals during the fiscal year, and thus Mr. Schlaefer received approximately 79% of the portion of his target bonus associated with his personal management goals. Accordingly, Mr. Schlaefer was awarded an aggregate performance-based bonus for fiscal year 2011 in the amount of $29,798.
Our consolidated revenue for the July 1, 2010 to December 31, 2010 segment was approximately $26 million, or approximately 97% of the revenue target for such six (6)-month segment; therefore, Mr. Sum received approximately 97% of the portion of his target bonus for the such six (6)-month segment associated with the revenue target. Further, our Chief Executive Officer and Chief Operating Officer determined that Mr. Sum achieved 90% of the personal management goals assigned to him in the first segment, and Mr. Sum therefore received 90% of the portion of his target bonus tied to his personal management goals. As such, Mr. Sum was awarded an aggregate performance-based bonus for that segment in the amount of $10,554.
Our consolidated revenue for the January 1, 2011 to June 30, 2011 segment was approximately $42 million, or approximately 90% of the adjusted revenue target. Accordingly, Mr. Sum received approximately 90% of the portion of his target bonus for the second six (6)-month segment associated with the revenue target. Our Chief Executive Officer and Chief Operating Officer determined that Mr. Sum achieved approximately 86% of his assigned personal management goals during the second segment, and he therefore received 86% of the portion of his target bonus tied to his personal management goals. Mr. Sum was thus awarded an aggregate performance-based bonus for the second six (6)-month segment in the amount of $11,602. Mr. Sum’s aggregate cash bonus for fiscal year 2011 was $22,156.
Pursuant to his June 2, 2011 offer letter with us, Mr. Kulzer will be eligible to participate in an annual cash bonus program at a target level equal to 25% of his annual base salary, commencing with fiscal year 2012. The actual bonus he may earn each fiscal year will be dependent upon our attainment of the corporate performance goals to be established for that year and his individual performance during that year.
107
Table of Contents
Discretionary Cash Bonuses
The bonus program for our other named executive officers is completely discretionary in that our compensation committee determines the amount of their annual bonuses (if any) based on its assessment of the company’s success in achieving its short-term and long-term strategic operating goals and their contribution to the attainment of those goals. There are no specific performance goals set under the discretionary bonus program, and accordingly, there are no target bonuses set by the compensation committee and tied to the attainment of specific objectives. Instead, the individual bonus amounts for each fiscal year are determined solely in the discretion of our compensation committee and based on its subjective assessment of both individual and company performance for the year.
For fiscal year 2011 and fiscal year 2010, no discretionary bonuses were paid.
Post-Offering Bonus Plan
We expect that the bonus programs for fiscal year 2012 will be substantially similar in structure to the bonus programs in effect for fiscal year 2011. For subsequent fiscal years, our compensation committee intends to establish an annual or semi-annual bonus plan based on more objective criteria for all our named executive officers, pursuant to which a target annual bonus will be set for each of them at a specified dollar amount or percentage of his or her base salary. The actual bonus earned for each year will be tied to our attainment of the performance objectives that our compensation committee establishes for that year or for each semi-annual period within that year. In addition, our compensation committee may determine the relative weighting of each of these goals, establish one or more designated levels of attainment for each such goal and set the bonus potential for each participating named executive officer at each corresponding level of attainment. The individual bonus amounts determined on the basis of performance goal attainment may be adjusted upward or downward based on the compensation committee’s subjective assessment of individual and/or overall corporate performance.
Equity Incentive Awards
Our equity award program is the primary vehicle for offering long-term incentives to our named executive officers and providing an inducement for long-term retention. Equity compensation represents the largest component of the total compensation package we provide to each of our named executive officers. We believe this weighting is appropriate because it aligns the interests of our named executive officers with those of our stockholders and focuses their attention on the creation of stockholder value in the form of stock price appreciation. Historically, the equity awards to our named executive officers have been in the form of stock options, and those awards will have no value unless the price of our common stock appreciates over the option term. Accordingly, we believe that this equity-based compensation provides our named executive officers with a direct interest in our long-term performance and creates an ownership culture that establishes a mutuality of interests between our named executive officers and our stockholders.
Stock options, including those to our named executive officers, are approved by our compensation committee and are granted at an exercise price not less than the fair market value of our common stock on the date of grant. The shares subject to our stock options typically vest over a four-year period, with 25% of the shares to vest upon completion of one year of service measured from the vesting commencement date, and the balance to vest in 36 successive equal monthly installments upon completion of each additional month of service thereafter. We believe that the four-year vesting period of our stock option grants furthers our objective of executive retention as it provides an incentive to our executives to remain in our employ during the vesting period.
We typically make an initial stock option grant to a new named executive officer in connection with his or her commencement of employment. Additionally, our compensation committee reviews our equity compensation program periodically and may, at its discretion, grant additional stock options to existing named executive
108
Table of Contents
officers consistent with our named executive officer compensation objectives. In determining the size of those additional grants, our compensation committee typically takes into account the recommendations of our Chief Named executive officer and its own subjective assessment of the named executive’s officer performance and the retention value that his or her existing equity awards have.
Fiscal Year 2011 Grants
On March 4, 2011, our compensation committee authorized a stock option grant to four of our named executive officers for the number of shares of our common stock indicated below. Each option has an exercise price of $0.53 per share, the fair market value per share of our common stock on the grant date, and a maximum term of 10 years measured from the grant date, subject to earlier termination following the individual’s cessation of employment with us. Each option will vest in accordance with the four-year installment vesting schedule noted above.
| Named Executive Officer |
Number of
Option Shares |
|||
| Ron Wilderink |
150,000 | |||
| John Schlaefer |
220,000 | |||
| Alex Sum |
200,000 | |||
| Jeongmin Kim, Ph.D. |
20,801 | |||
On June 24, 2011, our board of directors authorized stock option grants to five of our named executive officers for the aggregate number of shares of our common stock indicated below. Each option has an exercise price of $0.93 per share, which the Board determined was the fair market value of our common stock on the date of grant based on a preliminary report from the independent appraiser, which stated that the fair market value per share of our common stock was $0.93. The independent appraiser’s final report stated that the fair market value of the common stock on the date of grant was $0.91 per share. Each option has a maximum term of 10 years measured from the grant date, subject to earlier termination following the individual’s cessation of employment with us. Each option will vest in accordance with the four-year installment vesting schedule noted above.
| Named Executive Officer |
Number of Option Shares |
|||
| Kyeongho Lee, Ph.D. |
3,137,290 | |||
| Gene Kulzer |
1,800,000 | |||
| John Schlaefer |
571,587 | |||
| Alex Sum |
532,318 | |||
| Jeongmin Kim, Ph.D. |
721,379 | |||
The primary objective of the compensation committee in making the March and June option grants was to provide an element of anti-dilution protection to each named executive officer’s pre-existing option grants in light of the significant increase in the number of shares of our outstanding common stock that occurred in Spring 2011 taking into account the expected payment of cumulative dividends on our outstanding preferred stock and the issuance of a significant round of convertible notes. The new option grants did not provide full anti-dilution protection for those transactions, but the grants to our named executive officers were proportional to their existing holdings of common stock, whether in the form of actual shares of our common or options to acquire shares of such common stock, so as to provide a limited degree of protection against those dilutive issuances.
The option grant to Mr. Kulzer on June 24, 2011 was made pursuant to the terms of our June 2, 2011 offer letter with him. The size of the grant was established as part of the negotiation process and set at the level necessary to secure Mr. Kulzer’s employment. The option will vest in accordance with the same four-year installment vesting schedule noted above, subject to partial vesting acceleration should his employment terminate under certain prescribed circumstances.
109
Table of Contents
For more information concerning the stock options we granted to our named executive officers in 2011, please see “Executive Compensation—Grants of Plan-Based Awards.”
At the discretion of our compensation committee, we expect to continue to grant stock options to our named executive officers on a periodic basis that is consistent with our overall executive compensation objectives. In determining the size of such stock option grants in future years, we expect that our compensation committee will take into account the following considerations: (i) the grant-date value of equity awards made to named executive officers at comparable public companies and their total direct compensation levels (salary, target cash bonus and grant-date value of equity awards), (ii) our financial performance, (iii) the named executive officer’s contribution to that performance, (iv) the retention value of his or her existing equity awards and (v) the recommendations of our Chief Named executive officer with respect to equity awards for named executive officers other than himself.
Severance and Change in Control Benefits
The existing offer letters we have with three of our current named executive officers (Messrs. Kulzer, Schlaefer and Sum) set forth certain terms and conditions governing their period of continued employment with us. Those offer letters are summarized below in the section of this prospectus entitled “Executive Compensation—Agreements regarding Employment, Change in Control and Termination of Employment”. Pursuant to his offer letter, Mr. Schlaefer would also become entitled to receive certain severance benefits were his employment to be involuntarily terminated by the company other than for cause (as defined in his offer letter). However, the level of those benefits will depend upon whether the involuntary termination occurs in connection with a change in ownership of the company or change in management. In a change in ownership or management situation, Mr. Schlaefer will be entitled to a lump sum severance payment equal to one year of base salary and partial vesting acceleration of his outstanding equity awards (60% accelerated vesting of his outstanding unvested awards). Should the involuntary termination not occur in connection with a change in ownership or management, then his severance benefit would be reduced to a lump sum payment equal to 6 months of base salary, and the vesting acceleration would be reduced to 25% of his outstanding unvested equity awards.
The offer letter we had with Mr. Wilderink, who left our employ on June 3, 2011, also contained severance benefit provisions that would be triggered in the event his employment were terminated under certain prescribed circumstances. As with Mr. Schlaefer, the level of those benefits would have depended upon whether the termination event occurred in connection with a change in ownership of the company or change in management. In a change in ownership or management situation, Mr. Wilderink would have become entitled to a lump sum severance payment equal to one year of base salary and partial vesting acceleration of his outstanding equity awards (50% accelerated vesting of his outstanding unvested awards). If the termination did not occur in connection with a change in ownership or management, then Mr. Wilderink’s severance benefit would be reduced to a lump sum payment equal to 6 months of base salary and vesting acceleration of 25% of his outstanding unvested equity awards. Since Mr. Wilderink’s employment terminated under circumstances entitling him to severance benefits under his offer letter, he received the benefits described above for a non-change-in-control termination event.
Pursuant to his offer letter, as amended, Mr. Kulzer will become entitled to the following severance benefits should his employment terminate under the circumstances indicated:
(i) If his employment is involuntarily terminated, or should he resign for good reason, within 12 months after a change in control, then 50% of the unvested portion of the 1,800,000-share option grant made to him pursuant to his offer letter will vest.
(ii) Should his employment be terminated without cause, whether or not in connection with a change in ownership or management, he will be entitled to six months of salary continuation and company-paid COBRA premiums, provided he delivers a general release of all claims against us and our affiliates.
110
Table of Contents
The severance benefits that we have provided in connection with a change in ownership situation are designed to serve two primary purposes: (i) encourage our named executive officers to remain in our employ in the event of an actual or potential change in control transaction and (ii) align the interests of the named executive officers with those of the stockholders by enabling the named executive officers to consider acquisition transactions that are in the best interests of the stockholders and provide opportunities for the creation of substantial stockholder value without undue concern over whether those transactions may jeopardize their employment or their existing compensation arrangements. Our compensation committee also believes that the severance benefits payable on an involuntary termination in the absence of a change in ownership serve as an important recruitment and retention tool that allows us to remain competitive in attracting and retaining executive talent.
In addition to the severance benefits described above, the company is required under Korean law to make severance payments to its employees based in Korea upon separation from the company. Pursuant to Korean law, the company’s severance pay liability is calculated based on the salary of each employee multiplied by the years of such employee’s employment. The mandatory severance requirements apply to two of our named executive officers, Drs. Lee and Kim.
Pursuant to the terms of our equity plans, outstanding options held by our named executive officers and our other employees will accelerate upon a change in control unless those options are assumed or otherwise replaced by the acquiring entity. The compensation committee believes that accelerated vesting under such a limited circumstance is appropriate because it protects a significant component of the named executive officer’s total compensation in the event those options would otherwise terminate in the acquisition and allows our named executive officers to remain focused on the company’s business without undue concern over this significant component of their compensation package should the company become an acquisition target in a transaction in which the outstanding options would not be assumed or replaced.
Our severance and change of control provisions for the named executive officers are discussed in more detail in the section entitled “Executive Compensation—Potential Payments upon Termination of Employment.”
Benefits and Other Compensation
We maintain broad-based employee benefit plans, which are provided to all eligible employees, including our named executive officers. These plans provide group medical, dental and vision coverage, life insurance, disability insurance, flexible spending accounts and a 401(k) savings program for our employees based in the United States.
We believe these benefits are consistent with the benefits offered by companies with which we compete for employees and are necessary to attract and retain qualified employees.
Perquisites
We believe that cash and equity compensation are the key components needed to attract and retain our executive management. As a result, we do not provide any substantial perquisites to our named executive officers.
Risk Assessment
Our compensation committee, with the assistance of our Human Resources Department, reviewed the various compensation programs we maintain for our named executive officers to determine whether any of those programs encouraged excess risk taking that would create a material risk to our economic viability. In conducting that review, the compensation committee noted the following risk mitigation elements:
| • | A significant component of named executive officer compensation is in the form of equity awards tied to the value of our common stock. As our stock price appreciates and stockholder value is created, the |
111
Table of Contents
| amount of compensation earned through those awards increases. Accordingly, our overall named executive officer compensation program is structured to encourage long-term growth and appreciation in the value of our business and stock price. |
| • | Although stock options have the potential to encourage risk-taking, we structure those grants so that they vest over a period of years. This vesting period encourages our named executive officers to focus on sustaining our long-term performance. Because we make use of periodic option grants as a retention vehicle, our named executive officers will typically have a block of unvested options outstanding that could decrease significantly in value if our business is not managed for the long-term. |
| • | Our overall compensation structure is not overly weighted toward short-term incentives. Payouts under our formulaic bonus plan for Messrs. Schlaefer and Sum are tied to the attainment of strategic objectives important to our long-term financial success and are capped at a specified dollar amount ($45,000) or percentage (15%) of base salary. Accordingly, they are not structured to provide any meaningful incentive for short-term risk-taking. Bonuses for our other named executive officers are completely discretionary and are based on our compensation committee’s subjective assessment of our overall company performance and the named executive officer’s contribution to that performance. Accordingly, our compensation committee has broad discretion in determining the size of any annual bonus award made to a named executive officer who does not otherwise participate in a formulaic bonus program. In exercising that discretion, our compensation committee will take into account whether any of those individuals has caused us to incur unnecessary or excessive risk. |
| • | The wealth creation opportunities for our named executive officers are primarily in the form of their equity awards. We do not have retirement plans, SERPs or other meaningful sources of wealth creation provided under our cash compensation programs. Excessive risk-taking would not only jeopardize the financial viability of our company but would also subject our named executive officers to substantial economic loss if our common stock were to become worthless or drop substantially in price. For that reason, there is a substantial alignment between the structure of our named executive officer compensation programs and the creation of stockholder value. |
Based primarily on the foregoing considerations and the fact that our existing named executive officer compensation programs are relatively straight forward and heavily-weighted toward equity compensation, our compensation committee concluded it was not reasonably likely that any of those programs would have a material adverse effect upon us.
For further information concerning this risk assessment process, please see “Executive Compensation and Related Information—Risk Assessment of Compensation Policies and Practices” that appears below.
Tax and Accounting Considerations
Section 162(m) of the Internal Revenue Code generally disallows a tax deduction for certain compensation in excess of $1 million per year paid by a publicly held company to certain named executive officers. Compensation that qualifies as performance-based for purposes of Section 162(m) is not subject to such deduction limitation, provided certain specified requirements are met. In addition, “grandfather” provisions may apply to certain compensation arrangements that were entered into by a company before it was publicly held and certain compensation arrangements and awards that are made during a specified period following the date the company becomes publicly held.
We intend to structure the performance-based portion of our executive compensation, when feasible, to comply as performance-based compensation under Section 162(m) so that such compensation will remain tax deductible to us. However, to remain competitive with other employers, our compensation committee may, in its judgment, authorize compensation programs that do not comply as performance-based for purposes of Section 162(m) when it believes that such programs are appropriate to attract and retain executive talent.
112
Table of Contents
Accordingly, our compensation committee may provide one or more named executive officers with the opportunity to earn incentive compensation, whether through cash incentive programs or equity incentive programs, which may be in excess of the amount deductible by reason of Section 162(m) or other provisions of the Internal Revenue Code.
Summary Compensation Table
The following table provides information regarding the compensation earned during our fiscal year ended June 30, 2011 by our principal executive officer, our principal financial officer through June 3, 2011, our principal financial officer for the remainder of fiscal year 2011 and our three other named executive officers with aggregate compensation in excess of $100,000. We refer to these individuals as our named executive officers.
| Name and Principal Position |
Year | Salary ($) | Option Awards ($)(1) |
Non-Equity Incentive Plan Compensation ($)(2) |
All Other Compensation ($) |
Total ($) | ||||||||||||||||||
| Kyeongho Lee, Ph.D. |
2011 | $ | 112,500 | $ | 1,605,390 | — | — | $ | 1,717,890 | |||||||||||||||
| Chief Executive Officer |
||||||||||||||||||||||||
| Ron Wilderink |
2011 | $ | 185,167 | $ | 45,320 | — | $ | 157,990 | (3) | $ | 388,477 | |||||||||||||
| Vice President of Finance and Administration and Chief Financial Officer* |
||||||||||||||||||||||||
| Gene Kulzer |
2011 | $ | 17,163 | $ | 921,082 | — | — | $ | 938,245 | |||||||||||||||
| Chief Financial and Administrative Officer** |
||||||||||||||||||||||||
| John Schlaefer |
2011 | $ | 176,164 | $ | 358,957 | $ | 29,798 | $ | 542 | (4) | $ | 565,461 | ||||||||||||
| Chief Operating Officer |
||||||||||||||||||||||||
| Alex Sum |
2011 | $ | 163,047 | $ | 332,820 | $ | 22,156 | $ | 21,145 | (5) | $ | 539,168 | ||||||||||||
| Vice President of Marketing and Business Development |
||||||||||||||||||||||||
| Jeongmin Kim, Ph.D. |
2011 | $ | 88,211 | $ | 375,423 | — | — | $ | 463,634 | |||||||||||||||
| Vice President of Engineering |
||||||||||||||||||||||||
| * | Served as Principal Financial Officer through June 3, 2011. |
| ** | Began service as Principal Financial Officer on June 4, 2011. |
| (1) | Represents the aggregate grant-date fair value of the stock options awarded to the named executive officer in fiscal year 2011, calculated in accordance with Financial Accounting Standards Board Accounting Standards Codification, Topic 718, “Stock-Based Compensation” (“FASB ASC Topic 718”). Such grant-date fair value does not take into account any estimated forfeitures related to service-vesting conditions. See Note 9 of Notes to Consolidated Financial Statements for the year ended June 30, 2011 for a discussion of the various assumptions made in determining the grant-date fair value of our stock option awards. |
| (2) | Represents the award paid under our corporate bonus program. The award was based in part on the attainment of annual or semi-annual revenue goals and in part on the achievement of annual or semi-annual individual management goals. The material terms of the incentive award are described in the section of this prospectus entitled “Compensation Discussion and Analysis—Compensation Components—Performance-Based Cash Bonuses.” |
| (3) | The reported amount represents (i) $126,972 of cash severance to which Mr. Wilderink became entitled in connection with his termination of employment on June 3, 2011, (ii) $24,418 of accrued but unpaid vacation pay, (iii) a matching contribution of $5,585 made by us to Mr. Wilderink’s account under our 401(k) employee savings plan, and (iv) $1,015 paid by us to Mr. Wilderink in lieu of actual group health insurance coverage under our plan due to his coverage under his spouse’s healthcare plan. |
113
Table of Contents
| (4) | The reported amount represents the amount of the matching contribution made by us to the named executive officer’s account under our 401(k) employee savings plan. |
| (5) | The reported amount represents (i) a matching contribution of $5,670 made by us to Mr. Sum’s account under our 401(k) employee savings plan, and (ii) $15,475 paid by us to Mr. Sum in lieu of actual group health insurance coverage under our plan due to his coverage under his spouse’s healthcare plan. |
Grants of Plan-Based Awards 2011
The following table sets forth information regarding grants of compensation in the form of plan-based awards made during the fiscal year ended June 30, 2011 to our named executive officers:
| Name |
Grant Date | Estimated Future Payouts Under Non-Equity Incentive Plan Awards ($)(1) |
All
Other Option Awards: Number of Securities Underlying Options (#)(2) |
Exercise or Base Price of Option Awards ($/Sh)(3) |
Grant Date Fair Value of Option Awards ($)(4) |
|||||||||||||||||||
| Threshold | Target | |||||||||||||||||||||||
| Kyeongho Lee, Ph.D. |
6/24/2011 | 3,137,290 | (5) | $ | 0.93 | $ | 1,605,390 | |||||||||||||||||
| Ron Wilderink |
3/4/2011 | 150,000 | (6) | $ | 0.53 | $ | 45,320 | |||||||||||||||||
| Gene Kulzer |
6/24/2011 | 1,262,375 | (7) | $ | 0.93 | $ | 645,973 | |||||||||||||||||
| 6/24/2011 | 537,625 | (8) | $ | 0.93 | $ | 275,109 | ||||||||||||||||||
| John Schlaefer |
7/1/2010 | (9) | $ | 36,563 | ||||||||||||||||||||
| 3/4/2011 | 220,000 | $ | 0.53 | $ | 66,469 | |||||||||||||||||||
| 6/24/2011 | 249,012 | (10) | $ | 0.93 | $ | 127,423 | ||||||||||||||||||
| 6/24/2011 | 322,575 | (11) | $ | 0.93 | $ | 165,066 | ||||||||||||||||||
| Alex Sum |
7/1/2010 | (9) | $ | 1,835 | $ | 24,457 | ||||||||||||||||||
| 3/4/2011 | 200,000 | $ | 0.53 | $ | 60,426 | |||||||||||||||||||
| 6/24/2011 | 209,743 | (12) | $ | 0.93 | $ | 107,328 | ||||||||||||||||||
| 6/24/2011 | 322,575 | (11) | $ | 0.93 | $ | 165,066 | ||||||||||||||||||
| Jeongmin Kim, Ph.D. |
3/4/2011 | 20,801 | $ | 0.53 | $ | 6,285 | ||||||||||||||||||
| 6/24/2011 | 721,379 | (5) | $ | 0.93 | $ | 369,139 | ||||||||||||||||||
| (1) | Represents the performance-based awards paid under our corporate bonus program for fiscal year 2011. A portion of the potential payment (35% for Mr. Schlaefer and 50% for Mr. Sum) is tied to the attainment of a specified revenue goal for each applicable measurement period and the remainder to the achievement of individual management goals over that period. The material terms of the awards are discussed in the section of this prospectus entitled “Compensation Discussion and Analysis—Compensation Components—Performance-Based Cash Bonuses.” |
| (2) | Unless otherwise described in the footnotes below, the stock options are immediately exercisable for any or all of the option shares. However, any unvested shares purchased under such options will be subject to repurchase by us, at the lower of the original price paid per share or the current fair market value per share, should the named executive officer leave our employ prior to vesting in those shares. Unless otherwise described in the footnotes below, the option shares will vest over a four-year period, with 25% of the shares to vest upon completion of one year of service measured from January 1, 2011, and the balance will vest in 36 successive equal monthly installments upon the completion of each additional month of service thereafter. |
| (3) | The exercise price is set at the fair market value per share of our common stock on the grant date. For a discussion of our methodology for determining the fair value of our common stock, see the section of this prospectus entitled “Management’s Discussion and Analysis of Financial Condition and Results of Operations—Critical Accounting Policies and Significant Judgments and Estimates—Valuation of Common Stock.” |
| (4) | Reflects the aggregate grant-date fair value of the stock option awards as calculated in accordance with FASB ASC Topic 718. See Note 9 of Notes to Consolidated Financial Statements for the year ended |
114
Table of Contents
| June 30, 2011 for a discussion of the various assumptions made in determining such grant-date fair value. The grant-date fair value was not reduced for any estimated forfeitures related to service-vesting conditions. |
| (5) | The option will become exercisable in installments as shares vest. |
| (6) | Mr. Wilderink forfeited 112,500 of the shares in connection with his termination of employment on June 3, 2011. |
| (7) | The option shares will vest over a four-year period measured from July 1, 2011, with (i) 117,475 of the shares to vest upon Mr. Kulzer’s completion of service through December 31, 2011, (ii) 1,027,425 of the shares to vest in a series of 36 successive equal monthly installments upon his completion of each additional month of service over the 36-month period measured from January 1, 2012 and (iii) the remaining 117,475 shares to vest in a series of 6 successive equal monthly installments upon his completion of each additional month of service over the 6-month period measured from January 1, 2015. |
| (8) | The option will vest and become exercisable for the option shares in a series of installments as follows: (i) the option will become exercisable for 107,525 of the shares upon Mr. Kulzer’s continuation in our employ through December 31, 2011, (ii) the option will become exercisable for another 322,575 of the shares in a series of 36 successive equal monthly installments upon his completion of each additional month of employment with us over the 36-month period measured from January 1, 2012 and (iii) the option will become exercisable for the remaining 107,525 shares in a series of 6 successive equal monthly installments upon his completion of each additional month of employment with us over the 6-month period measured from January 1, 2015. |
| (9) | The target bonus amount for the named executive officer was adjusted in April 2011. |
| (10) | The option shares will vest over a four-year period measured from January 1, 2011, with (i) 142,896 of the shares to vest upon Mr. Schlaefer’s completion of service through December 31, 2011 and (ii) the remaining 106,116 shares to vest in a series of 36 successive equal monthly installments upon his completion of each additional month of service thereafter. |
| (11) | The option will vest and become exercisable for the option shares in a series of 36 successive equal monthly installments upon the named executive officer’s completion of each month of employment with us over the 36-month period measured from January 1, 2012. |
| (12) | The option shares will vest over a four-year period measured from January 1, 2011, with (i) 133,079 of the shares to vest upon Mr. Sum’s completion of service through December 31, 2011 and (ii) the remaining 76,664 shares to vest in a series of 36 successive equal monthly installments upon his completion of each additional month of service thereafter. |
115
Table of Contents
Outstanding Equity Awards at June 30, 2011
The following table sets forth information regarding equity awards held by our named executive officers as of June 30, 2011, the close of our fiscal year 2011:
| Option Awards | ||||||||||||||||
| Name |
Number of Securities Underlying Unexercised Options(#) Exercisable(1) |
Number
of Securities Underlying Unexercised Options Unexercisable(#)(2) |
Option Exercise Price ($) |
Option Expiration Date |
||||||||||||
| Kyeongho Lee, Ph.D. |
400,000 | — | $ | 0.25 | 3/21/2012 | |||||||||||
| 235,813 | — | $ | 0.25 | 3/21/2012 | ||||||||||||
| 664,187 | (3) | — | $ | 0.25 | 5/14/2012 | |||||||||||
| 2,195,000 | (3) | — | $ | 0.25 | 5/14/2012 | |||||||||||
| — | 3,137,290 | (4) | $ | 0.93 | 6/23/2021 | |||||||||||
| Ron Wilderink |
650,000 | — | $ | 0.25 | 4/29/2013 | (5) | ||||||||||
| 50,000 | — | $ | 0.25 | 9/16/2013 | (5) | |||||||||||
| 200,000 | — | $ | 0.25 | 5/31/2014 | (5) | |||||||||||
| 20,000 | — | $ | 0.25 | 7/5/2015 | (5) | |||||||||||
| 75,000 | — | $ | 0.25 | 3/1/2016 | (5) | |||||||||||
| 61,875 | 0 | (6) | $ | 0.25 | 5/25/2019 | (5) | ||||||||||
| 37,500 | 0 | (7) | $ | 0.53 | 3/3/2021 | (5) | ||||||||||
| Gene Kulzer |
— | 1,262,375 | (8) | $ | 0.93 | 6/23/2021 | ||||||||||
| — | 537,625 | (9) | $ | 0.93 | 6/23/2021 | |||||||||||
| John Schlaefer |
900,000 | — | $ | 0.25 | 6/28/2016 | |||||||||||
| 100,000 | — | $ | 0.25 | 7/19/2017 | ||||||||||||
| 52,500 | 37,500 | (10) | $ | 0.25 | 5/25/2019 | |||||||||||
| — | 220,000 | (11) | $ | 0.53 | 3/3/2021 | |||||||||||
| — | 249,012 | (12) | $ | 0.93 | 6/23/2021 | |||||||||||
| — | 322,575 | (13) | $ | 0.93 | 6/23/2021 | |||||||||||
| Alex Sum |
200,000 | — | $ | 0.25 | 5/14/2012 | |||||||||||
| 110,000 | (3) | — | $ | 0.25 | 5/14/2012 | |||||||||||
| 200,000 | — | $ | 0.25 | 9/16/2013 | ||||||||||||
| 225,000 | — | $ | 0.25 | 5/31/2014 | ||||||||||||
| 65,000 | — | $ | 0.25 | 7/5/2015 | ||||||||||||
| 130,000 | — | $ | 0.25 | 3/1/2016 | ||||||||||||
| 52,500 | 37,500 | (10) | $ | 0.25 | 5/25/2019 | |||||||||||
| — | 200,000 | (11) | $ | 0.53 | 3/3/2021 | |||||||||||
| — | 209,743 | (14) | $ | 0.93 | 6/23/2021 | |||||||||||
| — | 322,575 | (13) | $ | 0.93 | 6/23/2021 | |||||||||||
| Jeongmin Kim, Ph.D. |
2,500 | — | $ | 0.25 | 1/30/2012 | |||||||||||
| 330,000 | (3) | — | $ | 0.25 | 5/14/2012 | |||||||||||
| 100,000 | — | $ | 0.25 | 5/31/2014 | ||||||||||||
| — | 20,801 | (11) | $ | 0.53 | 3/3/2021 | |||||||||||
| — | 721,379 | (4) | $ | 0.93 | 6/23/2021 | |||||||||||
| (1) | Each stock option was granted pursuant to one of our stock option/stock issuance plans for employees and other service providers. Unless otherwise described in the footnotes below, each option is immediately exercisable for any or all of the option shares. Any unvested shares purchased under an immediately exercisable option will be subject to repurchase by us, at the lower of the original price paid per share or the current fair market value per share, should the named executive officer leave our employ prior to vesting in |
116
Table of Contents
| those shares. Unless described otherwise in the footnotes below, the option shares vest over a four-year period, with 25% of the shares to vest upon completion of one year of service measured from the vesting commencement date and the balance to vest in 36 successive equal monthly installments upon the completion of additional month of service thereafter. The number of shares reported in this column represents only the vested shares subject to that option, notwithstanding the fact that the entire option is currently exercisable for all the shares |
| (2) | Unless otherwise described in the footnotes below, each stock option may be exercised for unvested shares pursuant to a restricted stock purchase agreement. Accordingly, this column reports only the number of unvested shares subject to that option. To the extent the option is exercised for unvested shares, we will have right to repurchase those shares, at the lower of the original price paid per share or the current fair market value per share, should the named executive officer leave our employ prior to vesting in those shares. |
| (3) | This option was granted on May 15, 2002 and was immediately vested as to 50% of the option shares. The remaining 50% vested in a series of 24 successive equal monthly installments upon the named executive officer’s completion of each month of service over the 24-month period measured from the grant date. |
| (4) | The option shares will become exercisable vest over a four-year period, with 25% of the shares to vest upon completion of one year of service measured from January 1, 2011, and the balance to vest in 36 successive equal monthly installments upon his completion of each additional month of service thereafter. |
| (5) | As a result of his termination from service on June 3, 2011, Mr. Wilderink’s outstanding options terminated on September 2, 2011. |
| (6) | 28,125 unvested option shares were cancelled upon Mr. Wilderink’s termination from service on June 3, 2011. |
| (7) | 112,500 unvested option shares were cancelled upon Mr. Wilderink’s termination from service on June 3, 2011. |
| (8) | The option shares will vest over a four-year period measured from July 1, 2011, with (i) 117,475 of the shares to vest upon Mr. Kulzer’s completion of service through December 31, 2011, (ii) 1,027,425 of the shares to vest in a series of 36 successive equal monthly installments upon his completion of each additional month of service over the 36-month period measured from January 1, 2012 and (iii) the remaining 117,475 shares to vest in a series of 6 successive equal monthly installments upon his completion of each additional month of service over the 6-month period measured from January 1, 2015. |
| (9) | The option will vest and become exercisable for the option shares in a series of installments as follows: (i) the option will become exercisable for 107,525 of the shares upon Mr. Kulzer’s continuation in our employ through December 31, 2011, (ii) the option will become exercisable for another 322,575 of the shares in a series of 36 successive equal monthly installments upon his completion of each additional month of employment with us over the 36-month period measured from January 1, 2012 and (iii) the option will become exercisable for the remaining 107,525 shares in a series of 6 successive equal monthly installments upon his completion of each additional month of employment with us over the 6-month period measured from January 1, 2015. |
| (10) | The option was granted for a total of 90,000 shares of our common stock. 25% of the option shares vested upon completion of one year of service measured from February 1, 2009. The balance of the option shares vest in 36 successive equal monthly installments upon completion of each additional month of service thereafter. |
| (11) | The option shares will vest over a four-year period, with 25% of the shares to vest upon completion of one year of service measured from January 1, 2011, and the balance to vest in 36 successive equal monthly installments upon his completion of each additional month of service thereafter. |
| (12) | The option shares will vest over a four-year period measured from January 1, 2011, with (i) 142,896 of the shares to vest upon Mr. Schlaefer’s completion of service through December 31, 2011 and (ii) the remaining 106,116 shares to vest in a series of 36 successive equal monthly installments upon his completion of each additional month of service thereafter. |
| (13) | The option will vest and become exercisable for the option shares in a series of 36 successive equal monthly installments upon the named executive officer’s completion of each month of employment with us over the 36-month period measured from January 1, 2012. |
| (14) | The option shares will vest over a four-year period measured from January 1, 2011, with (i) 133,079 of the shares to vest upon Mr. Sum’s completion of service through December 31, 2011 and (ii) the remaining 76,664 shares to vest in a series of 36 successive equal monthly installments upon his completion of each additional month of service thereafter. |
117
Table of Contents
Option Exercises and Stock Vested
None of our named executive officers exercised options during the fiscal year ended June 30, 2011.
Pension Benefits and Nonqualified Deferred Compensation
We do not provide a pension plan for our named executive officers, and none of our named executive officers participated in a nonqualified deferred compensation plan during the fiscal year ended June 30, 2011.
Agreements Regarding Employment, Change in Control and Termination of Employment
We have offer letters in place governing the continued employment of three of our current named executive officers, Messrs. Kulzer, Schlaefer and Sum. Each of those offer letters establishes the annual rate of base salary to be paid to the covered individual during his period of employment with us, subject to periodic review and adjustment. In the case of Messrs. Kulzer and Schlaefer, their offer letters also provide certain severance benefits should their employment be terminated under certain specified circumstances. We also have an offer letter in place for Mr. Wilderink that governed his period of employment with us through his June 3, 2011 termination date and that provided him with certain severance benefits upon his termination.
The terms and conditions of each such offer letter agreement may be summarized as follows:
Gene Kulzer
Pursuant to his June 2, 2011 offer letter, Mr. Kulzer is entitled to a base salary of $225,000 per year, subject to periodic review and adjustment by our compensation committee. In addition, Mr. Kulzer’s target bonus is set at 25% of his annual base salary, but his actual bonus each fiscal year will be tied to the attainment of the corporate performance goals established for that year and his overall job performance during such year.
In accordance with his offer letter, as amended, Mr. Kulzer received stock option grants for an aggregate of 1,800,000 shares of our common stock with an exercise price of $0.93 per share that will vest incrementally over a four-year period of continued service with us measured from July 1, 2011. In addition, Mr. Kulzer is entitled to participate in the benefit plans generally available to our employees, such as group health care coverage and 401(k) plan participation.
Mr. Kulzer will also be entitled to the following severance benefits in accordance with the provision of his offer letter:
(i) In the event his employment is terminated by us without cause, he will be entitled to six months of salary continuation and company-paid COBRA premiums, provided he delivers a general release of all claims against us and our affiliates.
(ii) If his employment is terminated involuntarily by us without cause, or should he resign for good reason, within 12 months after a change in control, then he will be entitled to an additional severance benefit in the form of accelerated vesting of 50% of the unvested portion of the 1,800,000-share option grant made to him pursuant to his offer letter.
For purposes of such severance benefits, Mr. Kulzer’s employment will be deemed to be terminated for “cause” if such termination occurs by reason of: (i) his commission of any act of fraud, embezzlement or dishonesty, (ii) his violation of his proprietary information and inventions agreement with us, (iii) any misconduct on his part that has a materially adverse effect upon our business or affairs, (iv) his continued failure to satisfactorily perform the duties and responsibilities of his position with us following a notice and cure period, or (v) a material breach of his fiduciary obligations to us.
118
Table of Contents
John B. Schlaefer
Pursuant to his December 16, 2005 offer letter, Mr. Schlaefer is entitled to a base salary of $190,000 per year, subject to periodic review and adjustment by our compensation committee. In addition, Mr. Schlaefer’s target annual bonus was initially set at $45,000 in his offer letter, and has been adjusted from time to time based on his base salary; however, his actual annual bonus is tied to the level at which the applicable company and individual performance goals are in fact attained.
In accordance with his offer letter, Mr. Schlaefer received two stock option grants as follows:
(i) option grant for 900,000 shares of our common stock with an exercise price of $0.25 per share that vested incrementally over the four-year period measured from March 1, 2006; and
(ii) option grant for an additional 100,000 shares of our common stock with an exercise price of $0.25 per share that vested incrementally over the four-year period measured from March 1, 2007.
In addition, Mr. Schlaefer is entitled to participate in the benefit plans generally available to our employees, such as group health care coverage and 401(k) plan participation.
Should Mr. Schlaefer’s employment be involuntarily terminated without cause in connection with a change in ownership of the company or a change in management, he will be entitled to receive the following severance benefits:
(i) a lump sum payment equal to one times his annual rate of base salary, and
(ii) accelerated vesting of 60% of his then unvested equity awards.
Should such involuntary termination occur in the absence of a change in ownership of the company or a change in management, then his severance benefits would be paid at a reduced level as follows:
(i) a lump sum payment equal to 6 months of his base salary, and
(ii) accelerated vesting of 25% of his then unvested equity awards.
For purposes of the severance benefits to which Mr. Schlaefer may become entitled upon an involuntary termination of his employment without cause, the following definitions will be effect pursuant to the terms of his offer letter:
A termination of employment will be deemed to be for “cause” if such termination occurs by reason of: (i) his conviction of, or a plea of “guilty” or “no contest” to a felony, (ii) his commission of an act of fraud against the company or the misappropriation of property belonging to the company; or (iii) his material breach of his confidentiality and proprietary information agreement with us.
A “change in ownership” will be deemed to occur if there is any transaction or series of transactions, including a merger, consolidation or other stock transfer or issuance, that results in the transfer of more than fifty percent (50%) of our voting stock to one or more persons or entities acting alone or in concert.
A “change in management” will be deemed to occur if we engage a new Chief Executive Officer to replace Dr. Lee.
Alex Sum
Pursuant to his April 8, 2002 offer letter, Mr. Sum is entitled to a base salary of $150,000 per year, subject to periodic review and adjustment by our compensation committee. In accordance with such offer letter, Mr. Sum also was granted a stock option to purchase 200,000 shares of our common stock with an exercise price of $0.25 per share that vested incrementally over the four-year period measured from June 1, 2002.
119
Table of Contents
In addition, Mr. Sum is entitled to participate in the benefit plans generally available to our employees, such as group health care coverage and 401(k) plan participation. However, Mr. Sum is not entitled to any severance benefits under the terms of his offer letter.
Ron Wilderink
Pursuant to his March 19, 2003 offer letter, Mr. Wilderink was entitled to a base salary of $185,000 per year, subject to periodic review and adjustment by our compensation committee, and received two stock option grants as follows:
(i) option grant for 650,000 shares of our common stock with an exercise price of $0.25 per share that vested incrementally over the four-year period measured from May 1, 2003; and
(ii) option grant for an additional 50,000 shares of our common stock with an exercise price of $0.25 per share that vested incrementally over the four-year period measured from October 1, 2003.
In connection with his termination of employment on June 3, 2011, Mr. Wilderink received the following severance benefits in accordance with the term of his offer letter:
(i) a lump sum payment equal to 6 months of his base salary, and
(ii) accelerated vesting of 25% of his then unvested equity awards.
Option Acceleration
The options granted to our named executive officers under our various stock option/stock issuance plans will each vest on an accelerated basis as to all the option shares in the event those options are not assumed or otherwise replaced in connection with certain changes in control or ownership of the company. See the section of this prospectus entitled “Executive Compensation—Employee Benefit Plans” for additional details. The table below sets forth the intrinsic value as of June 30, 2011 of the options held by each named executive officer that would accelerate upon a change in control or ownership in which those options were not assumed or replaced:
| Named Executive Officer |
Intrinsic Value
of Accelerated Options(1) |
|||
| Kyeongho Lee, Ph.D. |
$ | 0 | (2) | |
| Ron Wilderink(3) |
— | |||
| Gene Kulzer |
$ | 0 | (2) | |
| John Schlaefer |
$ | 108,350 | ||
| Alex Sum |
$ | 100,750 | ||
| Jeongmin Kim, Ph.D. |
$ | 7,904 | ||
| (1) | Such intrinsic value is determined by multiplying (A) the amount by which the fair market value per share of our common stock on June 30, 2011 ($0.91 per share) exceeded the exercise price per share in effect under each option by (B) the number of unvested shares that would vest on an accelerated basis under such option. Reported amounts do not include the value of unvested option shares whose exercise price per share exceeds the fair market value per share of common stock on June 30, 2011. |
| (2) | The fair market value per share of common stock on June 30, 2011 did not exceed the exercise price per share of either Mr. Lee’s or Mr. Kulzer’s unvested option shares. |
| (3) | Mr. Wilderink’s unvested options were cancelled on June 3, 2011 in connection with his termination of employment on that date. |
120
Table of Contents
Potential Payments upon Termination of Employment
Termination in Absence of Change in Ownership/Management. The following table provides the total dollar value of the compensation that each named executive officer would have been entitled to receive had his employment been terminated without cause on June 30, 2011 in the absence of a change in ownership or change in management of the company:
| Named Executive Officer |
Lump Sum Severance Payment |
Accelerated Vesting of Options(1) |
||||||
| Kyeongho Lee, Ph.D. |
$ | 168,148 | (2) | — | ||||
| Ron Wilderink |
$ | 126,972 | (3) | $ | 20,438 | (4) | ||
| Gene Kulzer |
$ | 112,500 | $ | 0 | (5) | |||
| John Schlaefer |
$ | 108,409 | $ | 27,088 | ||||
| Alex Sum |
— | — | ||||||
| Jeongmin Kim, Ph.D. |
$ | 94,761 | (2) | — | ||||
| (1) | Represents the intrinsic value of the stock options that would vest on an accelerated basis in connection with such termination. Such intrinsic value is determined by multiplying (A) the amount by which the fair market value per share of our common stock on June 30, 2011 ($0.91 per share) exceeded the exercise price per share in effect under each option by (B) the number of unvested shares that vest on an accelerated basis under such option. Reported amounts do not include the value of unvested option shares whose exercise price per share exceeds the fair market value per share of common stock on June 30, 2011. |
| (2) | Reflects the mandatory severance payable under Korean law. Amount of severance payable is based on salary and years of service by employee. |
| (3) | Reflects the severance payment actually received by Mr. Wilderink, pursuant to the terms of his pre-existing offer letter, in connection with his termination of employment on June 3, 2011. |
| (4) | Reflects the intrinsic value of the shares of our common stock subject to stock options that partially vested on an accelerated basis in connection with Mr. Wilderink’s termination of employment on June 3, 2011. Such intrinsic value is determined by multiplying (A) the amount by which the fair market value per share of our common stock on June 3, 2011 ($0.91 per share) exceeded the exercise price per share in effect under each option by (B) the number of unvested shares that vested on an accelerated basis under each such option. |
| (5) | The fair market value per share of common stock on June 30, 2011 did not exceed the exercise price per share of Mr. Kulzer’s unvested option shares. |
Termination in connection with Change in Ownership/Management. The following table provides the total dollar value of the compensation that each named executive officer would be entitled to receive if his employment was terminated without cause on June 30, 2011 in connection with a change in ownership or change in management of the company:
| Named Executive Officer |
Lump Sum Severance Payment |
Accelerated Vesting of Options(1) |
||||||
| Kyeongho Lee, Ph.D. |
$ | 168,148 | (2) | — | ||||
| Ron Wilderink |
$ | 126,972 | (3) | $ | 20,438 | (4) | ||
| Gene Kulzer |
$ | 112,500 | $ | 0 | (5) | |||
| John Schlaefer |
$ | 216,817 | $ | 65,010 | ||||
| Alex Sum |
— | — | ||||||
| Jeongmin Kim, Ph.D. |
$ | 94,761 | (2) | — | ||||
| (1) | Represent the intrinsic value of the stock options that would vest on an accelerated basis in connection with such termination. Such intrinsic value is determined by multiplying (A) the amount by which the fair market value per share of our common stock on June 30, 2011 ($0.91 per share) exceeded the exercise price per share in effect under each option by (B) the number of unvested shares that vest on an accelerated basis under such option. Reported amounts do not include the value of unvested option shares whose exercise price per share exceeds the fair market value per share of common stock on June 30, 2011. |
121
Table of Contents
| (2) | Reflects the mandatory severance payable under Korean law. Amount of severance payable is based on salary and years of service by employee. |
| (3) | Reflects the severance payment actually received by Mr. Wilderink, pursuant to the terms of his pre-existing offer letter, in connection with his termination of employment on June 3, 2011. |
| (4) | Reflects the intrinsic value of the shares of our common stock subject to stock options that partially vested on an accelerated basis in connection with Mr. Wilderink’s termination of employment on June 3, 2011. Such intrinsic value is determined by multiplying (A) the amount by which the fair market value per share of our common stock on June 3, 2011 ($0.91 per share) exceeded the exercise price per share in effect under each option by (B) the number of unvested shares that vested on an accelerated basis under each such option. |
| (5) | The fair market value per share of common stock on June 30, 2011 did not exceed the exercise price per share of Mr. Kulzer’s unvested option shares. |
Benefit Plans
2002 Special Stock Option/Stock Issuance Plan
Our 2002 Special Stock Option/Stock Issuance Plan was first adopted by our board of directors on May 15, 2002 and approved by our stockholders on October 25, 2002. The 2002 plan was subsequently amended on each of May 12, 2006 and November 20, 2007 in order to add shares of our common stock to the share reserve. The 2002 plan has a ten year term and provides for the grant of stock options or restricted stock awards to our employees who are officers or otherwise highly compensated, the non-employee members of our board of directors or the boards of any of our subsidiaries and consultants and other independent advisors in our service or the service of any of our subsidiaries. The granted options may either be incentive stock options under Section 422 of the Internal Revenue Code or non-qualified options, but all options granted under the 2002 plan have an exercise price not less than the fair market value per share of our common stock on the grant date. The granted options and restricted stock awards vest incrementally over a specified period of service with us. For most grants, the applicable service-vesting period is a four-year period measured from the date of an optionee’s hire, or the first day of the month immediately following the date of hire, with 25% of the shares to vest upon the completion of one year of continued service and the balance to vest in 36 successive equal monthly installments upon completion of each additional month of service thereafter.
We have reserved a total of 14,000,000 shares of our common stock for issuance pursuant to the 2002 plan. As of June 30, 2011, options to purchase 13,743,677 shares of common stock were outstanding, and 159,573 shares were available for future grant under the 2002 plan.
On the effective date of our new 2011 Incentive Compensation Plan, the outstanding awards under the 2002 plan and the remaining share reserve under that plan were transferred to the 2011 plan and became part of the share reserve and outstanding share awards under that plan. However, the terms and conditions in effect for those awards at the time of such transfer continue in full force and effect.
2010 Stock Option/Stock Issuance Plan
Our 2010 Stock Option/Stock Issuance Plan was adopted by our board of directors on May 6, 2010 and approved by our stockholders on May 5, 2011. The 2010 plan was subsequently amended on March 29, 2011 to increase the share reserve. All outstanding options under our 1999 Stock Incentive Plan, which expired in August 2009, were transferred to the 2010 plan following its adoption, but continue to be governed solely by the terms and conditions of their respective award agreements and the 1999 Stock Incentive Plan. The 2010 plan has a ten year term and provides for the grant of stock options or restricted stock awards to our employees, the non-employee members of our board of directors or the boards of any of our subsidiaries and consultants and other independent advisors in our service or in the service of any of our subsidiaries. The granted options may either be incentive stock options under Section 422 of the Internal Revenue Code or non-qualified options, but all
122
Table of Contents
options will have an exercise price not less than the fair market value per share of our common stock on the grant date. The granted options and restricted stock awards vest incrementally over a specified period of service with us. For most grants, the applicable service-vesting period is a four-year period measured from the date of an optionee’s hire, or the first day of the month immediately following the date of hire, with 25% of the shares to vest upon the completion of one year of continued service and the balance to vest in 36 successive equal monthly installments upon completion of each additional month of service thereafter.
We have reserved a total of 41,831,301 shares of our common stock for issuance pursuant to the 2010 plan. As of June 30, 2011, options to purchase 36,935,085 shares of common stock were outstanding and 3,271,301 shares were available for future grant under the 2010 plan.
On the effective date of our new 2011 Incentive Compensation Plan, the outstanding awards under the 2010 plan and the remaining share reserve under that plan were transferred to the 2011 plan and became part of the share reserve and outstanding share awards under that plan. However, the terms and conditions in effect for those awards at the time of such transfer continue in full force and effect.
2011 Incentive Compensation Plan
Introduction. Our 2011 Incentive Compensation Plan became effective upon adoption by the board of directors on September 12, 2011, subject to stockholder approval, which was obtained on . Our 2011 plan serves as the successor to our 2002 and 2010 plans. The 2011 Incentive Compensation Plan will terminate no later than June 30, 2021, unless extended with stockholder approval.
Share Reserve. We have initially reserved 56,500,000 shares of our common stock for issuance under the 2011 plan. Such share reserve is comprised of (i) the number of shares that were available for issuance in the aggregate under both the 2002 and 2010 plans on the effective date of the 2011 plan, including the shares subject to outstanding awards under those plans, that were transferred to the new 2011 plan on the effective date (provided that such outstanding awards continue to be governed solely by the terms and conditions of their respective award agreements and plans), plus (ii) approximately an additional 2,390,000 shares of our common stock so that the initial total reserve is at the 56,500,000 share level.
The share reserve will automatically increase on the first trading day of July each calendar year during the term of the 2011 plan, beginning with calendar year 2012, by an amount equal to 5% of the total number of shares of our common stock outstanding on the last trading day in the immediately preceding calendar month. In no event, however, will any such annual increase exceed 12,500,000 shares.
Incentive Programs. Our 2011 plan is divided into four separate incentive compensation components:
| • | the stock right award program under which eligible individuals in our employ or service may be granted options to purchase shares of our common stock or stock appreciation rights tied to the value of such common stock; |
| • | the full value award program under which eligible individuals may be issued shares of our common stock, without the payment of a cash issuance price, pursuant to restricted stock awards, restricted stock units, performance shares or other stock-based awards which vest upon the attainment of pre-established performance objectives and/or the completion of a designated service period; and |
| • | the incentive bonus program under which eligible individuals may earn cash bonus awards tied to the attainment of pre-established performance objectives. |
Limitations. The maximum number of shares for which a participant may receive awards denominated in shares of our common stock will be limited to 5,000,000 shares in the aggregate per fiscal year.
123
Table of Contents
In addition, the maximum number of shares of our common stock that may be issued under our 2011 plan pursuant to incentive stock options intended to qualify as incentive stock options under the federal tax laws may not exceed 56,500,000 shares. This share limitation, however, will automatically be increased on the first trading day in July each calendar year, beginning with calendar year 2012, by the number of shares of our common stock added to the share reserve on that day pursuant to automatic share increase feature described above.
Eligibility. Officers and employees, as well as independent consultants, in our employ or service or in the employ or service of our parent or subsidiary companies (whether now existing or subsequently established) are eligible to participate in the 2011 plan.
Administration. The compensation committee of our board of directors has the exclusive authority to administer the stock right and full value award programs and the incentive bonus program with respect to awards made to our executive officers and non-employee board members and also has the authority to make awards under those programs to all other eligible individuals. However, our board of directors may at any time appoint a secondary committee of one or more board members to have separate but concurrent authority with the compensation committee to make awards under those programs to individuals other than our executive officers and non-employee board members. The plan administrator will determine which eligible individuals are to receive awards under those programs, the time or times when those awards are to be made, the number of shares subject to each such award, the applicable vesting, exercise and settlement schedules for each such award, the maximum term for which such award is to remain outstanding and the cash consideration (if any) payable per share.
Plan Features. Our 2011 plan includes the following features:
| • | The exercise price for options and stock appreciation rights will not be less than the fair market value per share of our common stock on the grant date. No stock option or stock appreciation right will have a term in excess of ten years, and each grant will be subject to earlier termination following the recipient’s cessation of service with us. The grants will generally vest and become exercisable in installments over the recipient’s period of continued service. However, one or more awards may be structured so that those awards will vest and become exercisable only after the achievement of pre-established performance objectives. |
| • | Two types of stock appreciation rights may be granted: |
| • | Tandem rights which provide the holders with the election to surrender their outstanding options for an appreciation distribution from us equal to the excess of (i) the fair market value of the vested shares subject to the surrendered option over (ii) the aggregate exercise price payable for those shares; and |
| • | Stand-alone rights which allow the holders to exercise those rights as to a specific number of shares of our common stock and receive in exchange a distribution from us in an amount equal to the excess of (i) the fair market value of the shares as to which those rights are exercised over (ii) the aggregate exercise price in effect for those shares. |
| • | The appreciation distribution on any exercised tandem or stand-alone stock appreciation right may be paid in cash or shares of our common stock. |
| • | The plan administrator has the authority, exercisable on such terms and conditions that it may deem appropriate under the circumstances, to (i) implement cancellation/regrant programs pursuant to which outstanding options or stock appreciation rights under the 2011 plan are cancelled and new options or stock appreciation rights are granted in replacement with a lower exercise or base price per share, (ii) cancel outstanding options or stock appreciation rights under the 2011 plan with exercise or base prices per share in excess of the then current fair market value per share of our common stock for consideration payable in cash or in equity securities of the company or (iii) reduce the exercise or base price in effect for outstanding options or stock appreciation rights under the 2011 pan. |
124
Table of Contents
| • | Under the full value award program, shares may be issued, without any cash payment required of the recipient, either as a stock bonus or pursuant to performance share awards, restricted stock or restricted stock unit awards or other stock-based awards which entitle the recipients to receive the underlying shares upon the attainment of designated performance objectives and/or the completion of a prescribed service period or upon the expiration of a designated time period following the vesting event. |
| • | Cash bonuses and performance units may be awarded under the incentive bonus program. Cash bonuses may be structured to vest and become payable upon the attainment of pre-established performance objectives and/or the completion of a designated service period. A performance unit will represent either (i) a unit with a dollar value tied to the level at which one or more pre-established performance objectives are attained or (ii) a participating interest in a special bonus pool funded on the basis of the levels at which the pre-established performance objectives are attained. |
| • | Performance objectives under the full value award and incentive bonus programs may be based on one or more of the following metrics: (i) earnings or operating income before interest, taxes, depreciation, amortization and/or charges for stock-based compensation; (ii) earnings per share; (iii) growth in earnings or earnings per share; (iv) market price of our common stock; (v) return on equity or average stockholder equity; (vi) total stockholder return or growth in total stockholder return; (vii) return on capital or invested capital; (viii) return on assets or net assets; (ix) revenue, growth in revenue or return on sales; (x) income or net income; (xi) operating income or net operating income; (xii) operating profit or net operating profit; (xiii) operating margin; (xiv) return on operating revenue or return on operating profit; (xv) cash flow, operating cash flow or free cash flow; (xvi) market share; (xvii) collections and recoveries, (xviii) debt reduction, (xix) litigation and regulatory resolution goals, (xx) expense control goals, (xxi) budget comparisons, (xxii) development and implementation of strategic plans and/or organizational restructuring goals; (xxiii) productivity goals; (xxiv) workforce management; (xxv) economic value added, (xxvi) measures of customer satisfaction, (xxvii) formation of joint ventures or marketing or customer service collaborations or the completion of other corporate transactions intended to enhance our revenue or profitability or enhance its customer base; and (xxviii) mergers and acquisitions. Each performance objective tied to one of the listed metrics may be structured to provide for appropriate adjustments or exclusions for one or more of the following items: (A) asset impairments or write-downs; (B) litigation and governmental investigation expenses and judgments, verdicts and settlements in connection therewith; (C) the effect of changes in tax law, accounting principles or other such laws or provisions affecting reported results; (D) accruals for reorganization and restructuring programs; (E) costs and expenses incurred in connection with mergers and acquisitions; (F) extraordinary or nonrecurring items; (G) bonus or incentive compensation costs and expenses, (H) items of income, gain, loss or expense attributable to the operations of any acquired or divested business and (I) the impact of foreign currency fluctuations or changes in exchange rates |
| • | The plan administrator will have the discretion to waive the vesting requirements for any outstanding awards under the full value award or incentive bonus program as to which the applicable service-vesting requirements are not met or the applicable performance objectives are not attained. Such waiver will result in the immediate vesting of each affected award. |
| • | Dividend equivalent rights may also be issued made under the 2011 plan. Each dividend equivalent right award will represent the right to receive the economic equivalent of each dividend or distribution, whether in cash, securities or other property (other than shares of our common stock) which is made per issued and outstanding share of common stock during the term the dividend equivalent right remains outstanding. Payment of the amounts attributable to such dividend equivalent rights may be made either concurrently with the actual dividend or distribution or may be deferred to a later date. Payment may be made in cash or shares of our common stock. The actual terms and conditions governing such dividend equivalent rights will be established by the plan administrator at the time those rights are awarded. |
125
Table of Contents
| Ÿ | The 2011 plan includes the following change in control provisions which may result in the accelerated vesting of outstanding awards: |
| • | Immediately prior to a change in control, each outstanding stock option or stock appreciation right which is not to be assumed by the successor corporation or otherwise continued in effect will automatically vest in full on an accelerated basis. However, the plan administrator has the authority to grant stock options or stock appreciation rights which will immediately vest immediately prior to a change in control, even if those awards are to be assumed by the successor corporation or otherwise continued in effect. |
| • | The plan administrator also has complete discretion to structure one or more stock options or stock appreciation rights so those awards will vest as to all the underlying shares in the event those awards are assumed or otherwise continued in effect but the individual’s service with us or the acquiring entity is subsequently terminated within a designated period following the change in control event. |
| • | Outstanding awards under the full value award or incentive bonus program may be structured so that those awards will vest immediately prior to a change in control or upon a subsequent termination of the individual’s service with us or the acquiring entity. A change in control transaction will be deemed to occur should any of the following events occur: (i) we are acquired by merger or asset sale; (ii) any person or group of related persons becomes the beneficial owner of securities possessing more than fifty percent of the total combined voting power of all our outstanding securities or representing more than fifty percent of the aggregate market value of all our outstanding capital stock; or (iii) there occurs certain changes in the composition of our board of directors. |
| • | In the event any change is made to the outstanding shares of our common stock by reason of any stock split, stock dividend, recapitalization, combination of shares, exchange of shares, spin-off transaction or other change in corporate structure effected without our receipt of consideration or should the value of the outstanding shares of our common stock be substantially reduced by reason of a spin-off transaction or extraordinary dividend or distribution, equitable adjustments will be made to: (i) the maximum number and/or class of securities issuable under the 2011 plan; (ii) the maximum number and/or class of securities by which the share reserve under the 2011 plan may increase automatically each calendar year, (iii) the maximum number and/or class of securities which may be issued under the 2011 plan pursuant to incentive stock options and the maximum number and/or class of securities by which that limitation automatically increases each calendar year, (iv) the maximum number and/or class of securities for which any one person may be granted awards denominated in common stock per fiscal year; (v) the number and/or class of securities and the exercise price per share in effect for each outstanding stock option and stock appreciation right under the 2011 plan, (vi) the number and/or class of securities subject to each outstanding award under the full value award and automatic grant programs and the cash consideration (if any) payable per share and (vii) the number and/or class of securities subject to each outstanding award under the incentive bonus program denominated in shares of our common stock. These adjustments will be made in such manner as the plan administrator deems appropriate and will be binding on all persons with an interest in the 2011 plan or any outstanding award under the 2011 plan. |
| • | The plan administrator may provide for the automatic withholding of a portion of the shares otherwise issuable to participants in the 2011 plan to satisfy the withholding taxes to which they become subject in connection with the issuance, exercise or vesting of their awards under such plan. Alternatively, the plan administrator may allow such individuals to deliver previously acquired shares of our common stock in payment of such withholding tax liability. |
| • | Unless sooner terminated by our board of directors or in connection with a change in control, the 2011 plan will terminate on September 11, 2021. However, any awards outstanding at the time of such plan termination will continue in force and effect in accordance with their existing terms. |
| • | Plan amendments will be subject to stockholder approval to the extent required by applicable law or regulation or the listing standards of the stock exchange on which our common stock is at the time primarily traded. |
126
Table of Contents
2011 Employee Stock Purchase Plan
Introduction. Our Employee Stock Purchase Plan was adopted by the board on September 12, 2011 and approved by our stockholders on 2011. The plan will become effective on the date the underwriting agreement for this offering is signed. The plan is designed to allow our eligible employees and the eligible employees our participating subsidiaries to purchase shares of our common stock at periodic intervals with their accumulated payroll deductions or other form of plan contribution.
Share Reserve. Three million shares of our common stock will initially be reserved for issuance. The reserve will automatically increase on the first trading day in July each calendar year during the term of the plan, beginning in calendar year 2012, by an amount equal to 1% of the total number of outstanding shares of our common stock on the last trading day in the immediately preceding calendar month. In no event will any such annual increase exceed 2,500,000 shares.
Offering Periods. The plan will have a series of overlapping offering periods, each with a duration of twenty-four (24) months, unless a shorter duration is set by the plan administrator prior to the start date. Offering periods for our U.S. employees will begin at semi-annual intervals on the first business day of May and November each year. However, the initial offering period for all eligible U.S. employees will begin on the date the underwriting agreement for this offering is signed and continue through the last business day in October 2013. Separate offering periods for our non-U.S. employees will be established by the plan administrator, with such modified terms and provisions as may be necessary to comply with local law and may run concurrently with our U.S. employee offering periods or have their own individual start and end dates.
Eligible Employees. Individuals regularly expected to work more than 20 hours per week for more than 5 calendar months per year may join an offering period on the start date of that period. For non-U.S. employees, different eligibility standards may be established in order to comply with local law requirements. However, no employee may participate in more than one offering period at a time.
For the initial offering period commencing at the time the underwriting agreement for this offering is signed, each individual who is an eligible employee at that time will automatically be enrolled as a participant at a contribution level of 15% of his or her cash earnings.
Payroll Deduction/Plan Contribution. A participant may contribute any multiple of 1% of his or her cash earnings up to 15% (or such lesser percentage as may be specified by the plan administrator prior to the start date of any subsequent offering period) through payroll deductions, and the accumulated deductions will be applied to the purchase of shares of our common stock on each specified purchase date during the offering period. However, non-U.S. employees may also be allowed to make contributions to the plan in a form other than payroll deductions, such as periodic or lump sum contributions paid directly to their employer.
For the initial purchase interval of the first offering period under the plan, no payroll deductions or other form of permitted contribution will be required of any participant until such time as the participant affirmatively elects to commence such payroll deductions or other form of permitted contribution following his or her receipt of the requisite prospectus for the plan. For such purchase interval, the participant will be required to contribute up to 15% of his or her cash earnings to the plan either in a lump sum or one or more installments after receipt of such prospectus and prior to the close of that purchase interval should he or she elect to purchase shares of our common stock for that initial purchase interval and his or her limited payroll deductions (if any) for that interval not be sufficient to fund the entire purchase price for those shares.
Purchase Price and Purchase Limitations. The purchase price per share will not be less than 85% of the lower of (i) the fair market value per share on the start date of the offering period in which the participant is enrolled or (ii) the fair market value per share on the applicable purchase date. Unless otherwise designated by the plan administrator for one or more offering periods, the purchase dates will occur semi-annually on the last
127
Table of Contents
business day in April and October each year. However, a participant may not purchase more than 2,000 shares on any purchase date, and not more than 750,000 shares may be purchased in total by all participants in a particular offering on any one purchase date. The plan administrator will have the authority to change these limitations for one or more offering periods, provided the change is made prior to the start of the affected offering period or periods.
Reset Feature. If the fair market value per share of our common stock on any purchase date is less than the fair market value per share on the start date of the offering period in which that purchase date occurs, then the individuals participating in that offering period will, immediately after the purchase of shares of our common stock on their behalf on that purchase date, be transferred from that offering period and automatically enrolled in the next offering period commencing after such purchase date, provided the market price of our common stock at that time is lower than the market price at the start of the offering period in which they are then participating.
Change in Control. In the event of a change in control, all outstanding purchase rights will automatically be exercised immediately prior to the effective date of the acquisition. The purchase price will not be less than 85% of the lower of (i) the market value per share on the start date of the offering period in which the participant is enrolled at the time the acquisition occurs or (ii) the fair market value per share immediately prior to the acquisition.
A change in control will be deemed to occur upon the occurrence of any of the following events: (i) we are acquired by merger or asset sale; (ii) any person or group of related persons becomes the beneficial owner of securities possessing more than fifty percent of the total combined voting power of all of our outstanding securities or representing more than fifty percent of the aggregate market value of all of our outstanding capital stock; or (iii) there occurs certain changes in the composition of our board of directors.
Changes in Capitalization. In the event any change is made to the outstanding shares of our common stock by reason of any stock split, stock dividend, recapitalization, combination of shares, exchange of shares, spin-off transaction or other change in corporate structure effected without our receipt of consideration or should the value of the outstanding shares of our common stock be substantially reduced by reason of a spin-off transaction or extraordinary dividend or distribution, equitable adjustments will be made to: (i) the maximum number and class of securities issuable under the plan, (ii) the maximum number and/or class of securities by which the share reserve is to increase automatically each calendar year, (iii) the maximum number and class of securities purchasable per participant on any one purchase date, (iv) the maximum number and class of securities purchasable in total by all participants in a particular offering on any one purchase date and (v) the number and class of securities and the price per share in effect under each outstanding purchase right. Such adjustments will be made in such manner as the plan administrator deems appropriate, and its determination will be binding on all persons with an interest in the plan or any purchase right under the plan.
Miscellaneous Provisions. The following provisions will also be in effect under the plan:
| • | Our board of directors may amend the terms of an offering period prior to the start of that offering period and may terminate an existing offering period at any time, effective immediately following any purchase date within that offering period. |
| • | The plan will terminate no later than the last business day of April 2021. |
| • | Stockholder approval will be required for any amendments which increase the number of shares of our common stock issuable under the plan, except for permissible adjustments in the event of certain changes in our capital structure or modify the eligibility requirements for participation in the plan. |
128
Table of Contents
Risk Assessment of Compensation Programs
Our Human Resources Department undertook a comprehensive review of the various compensation programs maintained throughout our organization to determine whether any of those programs encouraged excess risk taking that might create a material risk to our economic viability. As part of that review process, our compensation committee, in conjunction with our Human Resources Department, conducted a risk assessment of our executive officer compensation programs. The findings reached by our compensation committee with respect to our executive officer compensation programs are discussed in more detail in the Compensation Discussion and Analysis section that appears earlier in this prospectus.
In conducting this risk assessment with respect to our other employee compensation plans and programs, we noted the following:
| • | Our compensation structure is applied uniformly throughout the organization, except that we do not make option grants to our lower entry level employees. The cash component of our compensation structure is comprised primarily of base salary that is fixed in amount and does not involve any element of risk taking. |
| • | Our sales, program management and marketing employees also participate in annual or semi-annual cash incentive plans tied to specified financial objectives and individual personal goals. While programs tied to short-term goal achievement may encourage a focus on short-term performance results, the bonuses under those programs generally do not represent the predominant component of the individual’s total compensation opportunity and for that reason such programs are not likely to encourage excessive risk taking. The annual or semi-annual performance-based bonus opportunity for such individuals is capped at a specified percentage of base salary that may range from 15% to 50% on an annual basis. Accordingly, no participant in our annual bonus programs may earn more than a fixed percentage of his or her base salary under those programs. |
| • | A significant portion of the compensation provided to our named executive officers and other senior-level employees is in the form of long-term equity incentive awards that is intended to align the interests of those individuals with the interests of our stockholders. Those awards are in the form of stock option grants. Although stock options have a greater potential to encourage risk taking, they are structured so that they vest over a period of years and thereby encourage the recipients to focus on sustaining our long-term performance. In addition, the equity awards are made periodically, and as a result, our senior-level employees, including our named executive officers, typically have a block of unvested awards outstanding that could decrease significantly in value if our business is not managed for its long term performance. |
As a result, our overall compensation structure is not overly weighted toward short-term incentives, and there is a significant long-term equity award component tied to the value of our common stock and subject to multi-year vesting schedules that encourages the recipients to focus on long-term performance. We believe that our compensation programs do not encourage unnecessary or excessive risk taking. For that reason, we e has concluded that it is not reasonably likely that our employee compensation programs, when analyzed in terms of their organization-wide application or their specific application to various major business units, would have a material adverse effect upon us.
129
Table of Contents
CERTAIN RELATIONSHIPS AND RELATED PARTY TRANSACTIONS
The following is a summary of transactions since July 1, 2008 to which we have been a party in which the amount involved exceeded $120,000 and in which any of our executive officers, directors or beneficial holders of more than 5% of our capital stock had or will have a direct or indirect material interest, other than compensation arrangements which are described under the section of this prospectus entitled “Compensation Discussion and Analysis.”
Series F Preferred Stock Financing
On July 8, 2008, we sold an aggregate of 1,666,666 shares of our Series F Preferred Stock to Parakletos@Ventures 1999 Fund, L.P. (Parakletos) at a price of $1.20 per share in a private financing, and issued a warrant to Parakletos to purchase an additional 833,333 shares of Series F Preferred Stock, for an aggregate purchase price of $1,999,999.
On November 26, 2008, we sold an aggregate of 833,333 shares of our Series F Preferred Stock to Parakletos at a price of $1.20 per share in a private financing, and issued a warrant to Parakletos to purchase an additional 833,333 shares of Series F Preferred Stock, for an aggregate purchase price of $1,000,000.
On April 24, 2009, we sold an aggregate of 833,333 shares of our Series F Preferred Stock to Parakletos at a price of $1.20 per share in a private financing, and issued a warrant to Parakletos to purchase an additional 833,333 shares of Series F Preferred Stock, for an aggregate purchase price of $1,000,000.
On November 10, 2010, we sold convertible notes to Parakletos for an aggregate purchase price of $1,000,000. The convertible notes are convertible into shares of our Series F Preferred Stock at an initial conversion price of $1.20. These notes accrue interest at a rate of 6.0% per annum and have a maturity date of May 20, 2012. As of June 30, 2011, no payment of principal or interest has been paid on these notes since their issuance. On September 15, 2011, all outstanding principal and accrued and unpaid interest of these notes were automatically converted into 875,662 shares of Series F Preferred Stock at the initial conversion price upon the initial filing of this registration statement, which will automatically convert into 875,662 shares of our common stock upon completion of the offering.
All warrants issued to Parakletos had an exercise price of $1.20 per share. Each warrant may be exercised in cash or on a net issuance basis, under which Parakletos may pay the exercise price of the warrant by forfeiting a portion of the exercised warrant shares with a value equal to the aggregate exercise price. The warrants were amended to extend their expiration date to April 15, 2011. On April 15, 2011, Parakletos exercised, on a cash basis, all of its outstanding warrants to purchase an aggregate of 9,708,332 shares of Series F Preferred Stock and paid us a total purchase price of $11,649,998.
Parakletos Ventures beneficially owned more than 5% of our capital stock as of June 30, 2011. Dr. Paul H. J. Kim, our Chairman of the Board of Directors, is a managing director of Parakletos Ventures. See “Principal and Selling Stockholders.”
Investor Rights Agreement
We have entered into an investors’ rights agreement with certain purchasers of our preferred stock and warrants to purchase our preferred stock, including our Chief Executive Officer, and principal stockholders with which certain of our directors are affiliated, including Parakletos. Pursuant to the investor’s rights agreement, these holders are entitled to rights with respect to the registration of their shares under the Securities Act. For a description of these registration rights, please see the section entitled “Description of Capital Stock—Registration Rights.”
130
Table of Contents
Voting Agreement
We have entered into a voting agreement with the purchasers of our outstanding preferred stock and warrants, including Parakletos Ventures and FirstMark, certain of our directors and persons and entities with which certain of our directors are affiliated, and certain other stockholders, obligating each party to vote or consent at each stockholder meeting or with respect to each written stockholder consent to elect the nominees of certain parties to the board. The holders of a majority our Series A Preferred Stock and Series B Preferred Stock have designated Dr. Kim for election to our board of directors. The holders of a majority of our Series F Preferred Stock have designated Mr. Eldred for election to our board of directors. The holders of a majority of our common stock have designated Dr. Lee for election to our board of directors. Upon the completion of this offering, the voting agreement will terminate in its entirety and none of our stockholders will have any special rights regarding the election or designation of members of our board of directors.
GCT Promissory Notes
On December 15, 2003, we issued a promissory note to Dr. Kyeongho Lee, our Chief Executive Officer, in the principal amount of $1,000,000 with an interest rate of 7.5% per annum. The principal amount of the note, together with all accrued and unpaid interest, are due on the maturity date, or December 15, 2005, which may be extended automatically until such date that the following two conditions are met:
| • | we achieve a positive cash flow on a monthly basis; and |
| • | we have a minimum of $10,000,000 in cash in our bank account. |
On September 28, 2011, we amended this note to remove these two conditions for automatic extension and revised the maturity date to March 31, 2013.
As of June 30 and September 30, 2011, the principal amount outstanding on this note was $1,000,000 on each date.
GCT Research Promissory Notes
On September 19, 2008, our wholly-owned subsidiary GCT Research, Inc. (GCT Research) issued a promissory note to Dr. Lee in the principal amount of KRW 750,000,000 (equivalent to $631,000), with an interest rate of 9% per annum. The principal amount of the note, together with all accrued and unpaid interest, are due and payable on the maturity date, or March 19, 2009, which was subsequently extended to May 19, 2011. All amounts due under this note were paid off in full on May 20, 2011.
On November 28, 2008, GCT Research, issued a promissory note to Dr. Lee in the principal amount of KRW 200,000,000 (equivalent to $135,000), with an interest rate of 9.00% per annum. The principal amount of the note, together with all accrued and unpaid interest, are due and payable on the maturity date, or May 28, 2009. All amounts due under this note were paid off in full on June 30, 2009.
On December 15, 2009, GCT Research issued a promissory note to Dr. Lee in the principal amount of KRW 813,000,000 (equivalent to $696,000), with an interest rate of 9.80% per annum. The principal amount of the note, together with all accrued and unpaid interest, are due and payable on the maturity date, or March 15, 2011. All amounts due under this note were paid off in full on March 18, 2011.
GCT Asia Pacific Promissory Notes
On April 11, 2005, our wholly-owned subsidiary GCT Asia Pacific, Inc. (GCT Asia Pacific) issued a promissory note to Dr. Lee in the principal amount of KRW 987,200,000 (equivalent to $985,000), with an interest rate of 5.45% per annum. The principal amount of the note, together with all accrued and unpaid interest, shall be due and payable on the maturity date, or April 11, 2007, which was subsequently extended to April 15, 2011. All amounts due under this note were paid off in full on April 22, 2011.
131
Table of Contents
On September 19, 2008, GCT Asia Pacific issued a promissory note to Dr. Lee in the principal amount of KRW 150,000,000 (equivalent to $126,000), with an interest rate of 9.00% per annum. The principal amount of the note, together with all accrued and unpaid interest, shall be due and payable on the maturity date, or March 19, 2009. All amounts due under this note were paid off in full on March 19, 2009.
On December 15, 2009, GCT Asia Pacific, Inc. issued a promissory note to Dr. Lee in the principal amount of KRW 80,000,000 (equivalent to $69,000), with an interest rate of 9.80% per annum. The principal amount of the note, together with accrued and unpaid interest, are due and payable on the maturity date, or January 15, 2010, which was subsequently extended to December 15, 2010. All amounts due under this note were paid off in full on December 15, 2010.
Guarantees by Chief Executive Officer
On April 30, 2009, Dr. Lee guaranteed a loan made by Korea Development Bank to us in the principal amount of KRW 4,000,000,000 (equivalent to $3,710,231 based on the currency exchange rate on June 30, 2011), with an interest rate of 6.4% per annum and maturity date in April 2012. The outstanding balance on this loan was $3,710,931 and $3,391,267 as of June 30 and September 30, 2011, respectively.
On June 17, 2009, Dr. Lee guaranteed a loan made by Kookmin Bank to us in the principal amount of KRW 5,000,000,000 (equivalent to $4,637,789 based on the currency exchange rate on June 30, 2011), with an interest rate of 9.9% per annum and a maturity date of November 16, 2011. Outstanding balance on this loan was $4,174,010 and $3,815,176 as of June 30 and September 30, 2011, respectively.
From July to October 2010, we sold an aggregate of $8,600,000 in principal amount of convertible notes to certain investors of our Series F Preferred Stock, and Dr. Lee has agreed to guarantee our payment obligations under these notes. The convertible notes are convertible into shares of our Series F Preferred Stock at an initial conversion price of $1.20. The notes accrue interest at a rate of 6.0% per annum and have various maturity dates between January 2012 and May 2012. As the guarantor, Dr. Lee agrees to guarantee all payments to be paid by us under the notes that were not paid following the maturity dates. As of June 30, 2011, the total principal amount outstanding under these notes was $8,600,000. On September 15, 2011, all of these convertible notes, including all outstanding principal and accrued interests, were converted upon the initial filing of this registration statement on Form S-1. Accordingly, Dr. Lee’s obligations to guarantee these notes were terminated as of September 15, 2011.
Advances by Chief Executive Officer
During the year ended June 30, 2010, Dr. Lee made temporary advances to us in the amount of KRW 213,700,000. These advances did not bear any interest or have a set maturity date upon issuance. However, these advances were repaid by us with a payment of KRW 30,000,000 in January 2010 while the remainder was repaid in July and August 2010.
Product Sales to Samsung Electronics Co., Ltd.
During the years ended June 30, 2009, 2010 and 2011, we sold our products to Samsung Electronics Co., Ltd. in the aggregate amount of $526,000, $999,000 and $404,000, respectively. From February 2007 to August 2010, Mr. Bill Byun, a managing director of an affiliate of Samsung Electronics Co., Ltd., served as a member of our board of directors. From August 2010 to May 2011, Mr. Dong-Su Kim, also a managing director of this affiliate, served as a member of our board of directors.
132
Table of Contents
Director and Officer Indemnification
Our amended and restated certificate of incorporation and bylaws contain provisions limiting the liability of directors. In addition, we have entered, and we intend to continue to enter, into separate indemnification agreements with each of our directors and executive officers to the fullest extent permitted under Delaware law. See “Description of Capital Stock—Limitation of Liability and Indemnification Matters.”
Other Transactions
We have entered into various employment related agreements and compensatory arrangements with our directors and executive officers that, among other things, provide for compensatory and certain severance and change in control benefits. For a description of these agreements and arrangements, see the sections entitled “Executive Compensation—Agreements Regarding Employment, Change in Control and Termination of Employment” and “Management—Summary of Director Compensation.”
Policies and Procedures for Review and Approval of Conflicting Activities
Our board of directors has adopted an audit committee charter that provides that the audit committee will review and approve all related party transactions. Accordingly, following this offering, all related party transactions will be reviewed and approved by our audit committee. This review will cover any material transaction, arrangement or relationship, or any series of similar transactions, arrangements or relationships, in which we were or are to be a participant, and a related party had or will have a direct or indirect material interest, including, purchases of goods or services by or from the related party or entities in which the related party has a material interest, indebtedness, guarantees of indebtedness and employment by us of a related party. All of the transactions described above were entered into prior to the adoption of this audit committee charter were approved by our board of directors.
133
Table of Contents
The following table sets forth the beneficial ownership information of our common stock at June 30, 2011 for:
| • | each of our named executive officers; |
| • | each of our directors; |
| • | all of our executive officers and directors as a group; and |
| • | each person, or group of affiliated persons, known by us to beneficially own more than 5% of our common stock. |
Unless otherwise noted below, the address of each beneficial owner listed on the table is c/o 2121 Ringwood Avenue, San Jose, California 95131. We have determined beneficial ownership in accordance with the rules of the SEC. Except as indicated by the footnotes below, we believe, based on the information furnished to us, that the persons and entities named in the tables below have sole voting and investment power with respect to all shares of common stock that they beneficially own, subject to applicable community property laws.
We have based our calculation of beneficial ownership prior to the offering on 180,780,362 shares of common stock outstanding on June 30, 2011, which assumes the automatic conversion of all outstanding shares of our preferred stock as of June 30, 2011 into an aggregate of 157,090,863 shares of common stock (excluding any additional shares of common stock to be issued as payment for all unpaid and accrued dividends underlying these preferred stock).
We have based our calculation of beneficial ownership after the offering on shares of our common stock outstanding immediately after the completion of this offering, which gives effect to the issuance of shares of common stock in this offering and assumes:
| • | the automatic conversion of all outstanding shares of our preferred stock, into an aggregate of 182,115,586 shares of common stock upon completion of this offering: |
| • | the issuance of shares of common stock as payment of all unpaid and accrued dividends to holders of our preferred stock pursuant to our existing certificate of incorporation, assuming an initial public offering price of $ per share, the mid-point of the price range set forth on the cover page of this prospectus and assuming the payment occurs on ; |
| • | the exercise of outstanding warrants to purchase 9,303,029 shares of our preferred stock as of June 30, 2011, such exercise includes the assumed exercise, on a net exercise basis where allowed, of the outstanding warrants to purchase 7,636,363 shares of our preferred stock, immediately prior to this offering, and the concomitant conversion of the shares of preferred stock acquired upon exercise into shares of common stock upon completion of this offering, assuming an initial public offering price of $ per share, the mid-point of the price range set forth on the cover page of this prospectus; |
| • | no exercise by the underwriters of their option to purchase up to an additional shares of common stock from us; and |
| • | the filing of our amended and restated certificate of incorporation prior to completion of this offering. |
134
Table of Contents
In computing the number of shares of common stock beneficially owned by a person and the percentage ownership of that person, we deemed outstanding shares of common stock subject to options held by that person that are currently exercisable or exercisable within 60 days of June 30, 2011. We did not deem these shares outstanding, however, for the purpose of computing the percentage ownership of any other person.
| Percentage of Shares Beneficially Owned | ||||||||||
| Name and Address of Beneficial Owner |
Number of Shares Beneficially Owned |
Prior to the Offering |
After the Offering | |||||||
| 5% Stockholders: |
||||||||||
| Funds Affiliated with Parakletos Ventures(1) |
56,295,204 | 31.14 | % | |||||||
| Funds Affiliated with FirstMark Capital(2) |
24,592,246 | 13.60 | % | |||||||
| Named Executive Officers and Directors: |
||||||||||
| Kyeongho Lee, Ph.D.(3) |
8,333,854 | 4.52 | % | |||||||
| John Schlaefer(4) |
1,559,012 | * | ||||||||
| Gene Kulzer(5) |
1,262,375 | * | ||||||||
| Alex Sum(6) |
1,429,743 | * | ||||||||
| Jeongmin Kim, Ph.D.(7) |
1,653,301 | * | ||||||||
| Dr. Paul H.J. Kim(8) |
56,295,204 | 31.15 | % | |||||||
| Robert J. Barker(9) |
260,000 | * | ||||||||
| George de Urioste(10) |
350,000 | * | ||||||||
| Kary Eldred |
0 | * | ||||||||
| All executive officers and directors as a group (9 persons) |
71,122,688 | 37.52 | % | |||||||
| * | Represents beneficial ownership of less than 1% of our outstanding common stock. |
| (1) | Includes 4,534,197 shares held by Parakletos@Ventures LLC, 21,451,090 shares held by Parakletos@Ventures Millennium Fund L.P., 29,509,917 shares held by Parakletos@Ventures 1999 Fund L.P. and 800,000 shares held by Parakletos@Ventures 2000 Fund L.P. The general partner of Parakletos@Ventures Millennium Fund L.P. and Parakletos@Ventures 2000 Fund L.P. is Parakletos@Ventures LLC, which may be deemed to have voting and dispositive power over the shares held by Parakletos@Ventures Millennium Fund L.P. and Parakletos@Ventures 2000 Fund L.P. The managing member of Parakletos@Ventures LLC is Dr. Paul H.J. Kim, who may be deemed to have voting and dispositive power over the shares held by Parakletos@Ventures LLC. Dr. Kim is the general partner of Parakletos@Ventures 1999 Fund L.P. and may be deemed to have voting and dispositive power over the shares held by Parakletos@Ventures 1999 Fund L.P. Dr. Kim disclaims beneficial ownership of these shares held by the above entities. In addition, the number of shares beneficially owned after the offering includes shares of common stock issuable upon conversion of a convertible note held by Parakletos@Ventures 1999 Fund L.P. in the principal amount of $1,000,000. The address for the funds affiliated with Parakletos Ventures is 175 Nortech Parkway, Suite 200, San Jose, California 95134. |
| (2) | Includes 21,553,852 shares held by FirstMark III, L.P. and 3,038,394 shares held by FirstMark III Offshore Partners, L.P. The general partner of FirstMark III, L.P. and FirstMark III Offshore Partners, L.P. is FirstMark Capital, LLC, which may be deemed to have voting and dispositive power over the shares held by FirstMark III, L.P. and FirstMark III Offshore Partners, L.P. The managing members of FirstMark Capital, LLC are Lawrence D. Lenihan and Gerald A. Poch, each of whom disclaims beneficial ownership of the shares held by the above entities. The address for the funds affiliated with FirstMark is 120 West 45th St., 19th Fl., New York, New York 10036. |
| (3) | Includes 4,838,854 shares and 3,495,000 shares issuable pursuant to stock options exercisable within 60 days of June 30, 2011. |
| (4) | Includes 1,559,012 shares issuable upon the exercise of stock options, of which 1,056,250 shares are fully vested within 60 days of June 30, 2011. The remaining 502,762 shares do not vest within 60 days of June 30, 2011 and would be subject to repurchase upon termination of employment if exercised prior to vesting. |
135
Table of Contents
| (5) | Includes 1,262,375 shares issuable upon the exercise of stock options, of which no shares are fully vested within 60 days of June 30, 2011. The 1,262,375 shares which do not vest within 60 days of June 30, 2011 would be subject to repurchase upon termination of employment if exercised prior to vesting. |
| (6) | Includes 1,429,743 shares issuable upon the exercise of stock options, of which 986,250 shares are fully vested within 60 days of June 30, 2011. The remaining 443,493 shares do not vest within 60 days of June 30, 2011 and would be subject to repurchase upon termination of employment if exercised prior to vesting. |
| (7) | Includes 1,200,000 shares and 453,301 shares issuable upon the exercise of stock options. Of the shares issuable upon the exercise of stock options, 432,500 shares are fully vested within 60 days of June 30, 2011, and the remaining 20,801 shares do not vest within 60 days of June 30, 2011 and would be subject to repurchase upon termination of employment if exercised prior to vesting. |
| (8) | Includes the 56,295,204 shares beneficially held by the funds affiliated with Parakletos Ventures. Paul H.J. Kim, one of our directors, is the managing member of Parakletos@Ventures LLC and the general partner of Parakletos@Ventures 1999 Fund L.P., and in these capacities he may be deemed to beneficially own the shares owned by the funds affiliated with Parakletos Ventures. Dr. Kim disclaims beneficial ownership of such shares. The address for Dr. Kim is c/o Parakletos Ventures, 175 Nortech Parkway, Suite 200, San Jose, California 95134. |
| (9) | Includes 260,000 shares issuable upon the exercise of stock options, of which 28,889 shares are fully vested within 60 days of June 30, 2011. The remaining 231,111 shares do not vest within 60 days of June 30, 2011 and would be subject to repurchase upon cessation of service to the Board if exercised prior to vesting. |
| (10) | Includes 350,000 shares issuable upon the exercise of stock options, of which 38,889 shares are fully vested within 60 days of June 30, 2011. The remaining 311,111 shares do not vest within 60 days of June 30, 2011 and would be subject to repurchase upon cessation of service to the Board if exercised prior to vesting. |
136
Table of Contents
General
The following description summarizes some of the terms of our capital stock. Because it is only a summary, it does not contain all the information that may be important to you. For a complete description you should refer to our amended and restated certificate of incorporation and amended and restated bylaws as they will be in effect upon the completion of this offering, copies of which will be filed as exhibits to the registration statement of which the prospectus is a part.
Upon the completion of this offering and the filing of our amended and restated certificate of incorporation, our authorized capital stock will consist of 400,000,000 shares of common stock, $0.001 par value per share and 10,000,000 shares of preferred stock, $0.001 par value per share.
As of June 30, 2011, after giving adjustments described below, there were outstanding approximately:
| • | 180,780,362 shares of our common stock held by approximately 399 record holders; and |
| • | 50,678,762 shares of our common stock issuable upon exercise of outstanding stock options. |
The number of shares of our common stock outstanding as of June 30, 2011 as shown above assumes the automatic conversion of all outstanding shares of our convertible preferred stock into an aggregate of 157,090,863 shares of common stock upon completion of this offering.
Common Stock
Dividend Rights
Subject to preferences that may be applicable to any then outstanding preferred stock, holders of our common stock are entitled to receive dividends, if any, as may be declared from time to time by our board of directors out of legally available funds.
Voting Rights
Each holder of our common stock is entitled to one vote for each share on all matters submitted to a vote of the stockholders, including the election of directors. Our stockholders do not have cumulative voting rights in the election of directors.
Liquidation
In the event of our liquidation, dissolution or winding up, holders of our common stock will be entitled to share ratably in the net assets legally available for distribution to stockholders after the payment of all of our debts and other liabilities and the satisfaction of any liquidation preference granted to the holders of any then outstanding shares of preferred stock.
Rights and Preferences
Holders of our common stock have no preemptive, conversion, subscription or other rights and there are no redemption or sinking fund provisions applicable to our common stock. The rights, preferences and privileges of the holders of our common stock are subject to and may be adversely affected by, the rights of the holders of shares of any series of our preferred stock that we may designate in the future.
137
Table of Contents
Preferred Stock
Upon completion of this offering, all currently outstanding shares of our preferred stock will be converted into shares of common stock, and we will issue an aggregate of shares of common stock to holders of our preferred stock as payment for unpaid and accrued dividends, assuming an initial public offering price of $ per share, the mid-point of the price range set forth on the cover page of this prospectus and assuming the payment occurs on . See Note 6 to our consolidated financial statements for a description of the currently outstanding preferred stock. Under the amended and restated certificate of incorporation to be effective upon completion of this offering, our board of directors will have the authority, without further action by the stockholders, to issue up to 10,000,000 shares of preferred stock in one or more series, to establish from time to time the number of shares to be included in each such series, to fix the rights, preferences and privileges of the shares of each wholly unissued series and any qualifications, limitations or restrictions thereon and to increase or decrease the number of shares of any such series, but not below the number of shares of such series then outstanding. Our board of directors may authorize the issuance of preferred stock with voting or conversion rights that could adversely affect the voting power or other rights of the holders of the common stock. We have no current plans to issue any shares of preferred stock.
Convertible Notes
In connection with our Series F Preferred Stock financing, from July 2010 to May 2011, we sold convertible notes to nine investors for an aggregate purchase price of $21,600,000. The convertible notes and convertible notes to a related party are convertible into shares of our Series F Preferred Stock at an initial conversion price of $1.20. These convertible notes accrue interest at a rate of 6% per annum, except for one convertible note which accrues at an interest rate of 15% per annum, and have maturity dates between January 2012 and July 2012. Upon the initial filing of this Registration Statement on September 15, 2011, all outstanding principal and accrued interest on these convertible notes were automatically converted into 18,887,782 shares of Series F Preferred Stock at the initial conversion price, and these shares of Series F Preferred Stock will automatically convert into 18,887,782 shares of our common stock upon completion of this offering.
Also, in connection with our Series F Preferred Stock financing, from December 2008 to February 2009, we sold convertible notes to two investors for an aggregate purchase price of KRW 8,933,500,000 (equivalent to $6,500,000). These convertible notes are convertible into shares of our Series F Preferred Stock at an initial conversion price of $1.20. The conversion price, as well as the number of shares to be issued upon conversion of the notes, are subject to certain adjustments based on changes in foreign currency exchange rate (KRW versus U.S. dollars) between the purchase date and the conversion date, including cash payments in KRW to holders if the exchange rate on the conversion date is lower than the exchange rate on the purchase date. These convertible notes accrue interest at a rate of 6% and have maturity dates between December 2011 and February 2012. On or about September 30, 2011, all outstanding principal and accrued and unpaid interests on these convertible notes were converted by the holders into 6,136,941 shares of Series F Preferred Stock at the initial conversion price, and these shares of Series F Preferred Stock will automatically convert into 6,136,941 shares of our common stock upon completion of this offering.
Warrants
As of June 30, 2011, three warrants to purchase an aggregate of 9,303,029 shares of our Series F Preferred Stock are outstanding. All of these warrants are immediately exercisable. One warrant to purchase 1,666,666 shares has an exercise price of $1.20 per share, and two warrants to purchase an aggregate of 7,636,363 shares have an exercise price of $1.10 per share.
The exercise period of the warrant having an exercise price of $1.20 will terminate at the earlier of (i) May 26, 2014; (ii) a change of control of our company and (ii) the completion of this offering. This warrant
138
Table of Contents
has a net exercise provision under which the holder may, in lieu of payment of the exercise price in cash, surrender the warrant and receive a net amount of shares based on the fair market value of our common stock at the time of exercise of the warrant after deduction of the aggregate exercise price.
The exercise period of the two warrants having an exercise price of $1.10 will terminate at the earlier of (i) June 18, 2012 and April 27, 2013, respectively and (ii) the completion of this offering. These warrants have a net exercise provision under which the holder may, in lieu of payment of the exercise price in cash, surrender the warrant and receive a net amount of shares based on the fair market value of our common stock at the time of exercise of the warrant after deduction of the aggregate exercise price. For the two warrants with an exercise price of $1.10 per share, no more than 80% of the aggregate number of shares available under these warrants are permitted to be net exercised.
All three warrants contain provisions for the adjustment of exercise price and the aggregate number of shares issuable upon the exercise of the warrants in the event of stock dividends, stock splits or stock combinations, reclassifications, combinations or exchanges. We expect that all of these warrants will be net exercised immediately prior to the completion of this offering.
Registration Rights
Under our amended and restated investors’ rights agreement, following the completion of this offering, the holders of shares of our common stock (including an aggregate of shares of commons stock issued as payment of all unpaid and accrued dividend to holders of our preferred stock and the exercise of warrants outstanding as of June 30, 2011 which will be exercisable for shares of our preferred stock immediately prior to this offering, and the concomitant conversion of the shares of preferred stock acquired upon exercise into shares of common stock upon completion of this offering, all assuming an initial public offering price of $ per share, the mid-point of the price range set forth on the cover page of this prospectus and assuming the dividend payment occurs on , have the right to require us to register their shares with the Securities and Exchange Commission so that those shares may be publicly resold, or to include their shares in any registration statement we file. We referred to these shares as “registrable securities”. The registration rights are described in more detail below.
Demand Registration Rights
At any time after six months following the effective date of this offering, the holders of at least 25% of the shares having registration rights have the right to demand that we file up to three registration statements, each for an offering with an anticipated aggregate public offering price of at least $15,000,000. These registration rights are subject to specified exceptions, conditions and limitations, including the right of the underwriters of such registration, if any, to limit the number of shares included in any such registration under certain circumstances.
Form S-3 Registration Rights
At any time after we are qualified to file a registration statement on Form S-3, holders of at least 10% of the shares having registration rights have the right to demand that we file a registration statement for such stockholders on Form S-3 so long as the aggregate offering price of securities to be sold under the registration statement on Form S-3 is at least $2,500,000. These registration rights are subject to specified exceptions, conditions and limitations.
139
Table of Contents
“Piggyback” Registration Rights
At any time after the completion of this offering, if we propose to register any securities for public sale, a stockholder with registration rights will have the right to include their shares in the registration statement. The underwriters of any underwritten offering will have the right to limit the number of shares having registration rights to be included in the registration statement, but not below 30% of the total number of shares included in the registration statement. The holders of registrable securities have waived their rights to include any of their shares in this offering prior to the completion of this offering.
Expenses of Registration
We will pay all expenses, up to $25,000, other than underwriting discounts and commissions, relating to all demand registrations and piggyback registrations. We will pay all expenses, other than underwriting discounts and commissions, relating to all S-3 registration expenses.
Expiration of Registration Rights
The registration rights described above will terminate upon the earlier of either five years following the completion of this offering or, as to a given holder of registrable securities, when such holder of registrable securities can sell all of such holder’s registrable securities in any three-month period pursuant to Rule 144 of the Securities Act.
Anti-Takeover Effects of Provisions of Our Amended and Restated Certificate of Incorporation, Our Bylaws and Delaware Law
Certificate of Incorporation and Bylaws to be in Effect Upon the Completion of this Offering
Our amended and restated certificate of incorporation and amended and restated bylaws, each to become effective immediately prior to the completion of this offering, will include a number of provisions that may deter or impede hostile takeovers or changes of control or management. These provisions include:
| • | Issuance of undesignated preferred stock. After the filing of our amended and restated certificate of incorporation, our board of directors will have the authority, without further action by the stockholders, to issue up to 10,000,000 shares of undesignated preferred stock with rights and preferences, including voting rights, designated from time to time by the board of directors. The existence of authorized but unissued shares of preferred stock enables our board of directors to make it more difficult or to discourage an attempt to obtain control of us by means of a merger, tender offer, proxy contest or otherwise. |
| • | Vacancy of Board of Directors. Our amended and restated certificate of incorporation and amended and restated bylaws authorize only our board of directors to fill vacant directorships. The number of directors constituting our board of directors may be set only by resolution adopted by a majority vote of our entire board of directors. These provisions prevent a stockholder from increasing the size of our board of directors and gaining control of our board of directors by filling the resulting vacancies with its own nominees. |
| • | Stockholder action; special meetings of stockholders. Our amended and restated certificate of incorporation and amended and restated bylaws provide that our stockholders may not take action by written consent, but may only take action at annual or special meetings of our stockholders. Stockholders will not be permitted to cumulate their votes for the election of directors. In addition, special meetings of our stockholders may be called only by a majority of our board of directors, the chairman of our board of directors, or our Chief Executive Officer. |
140
Table of Contents
| • | Advance Notice Provisions. Our amended and restated bylaws provide advance notice procedures for stockholders seeking to bring business before our annual meeting of stockholders, or to nominate candidates for election as directors at our annual meeting of stockholders. Our amended or restated bylaws also specify certain requirements as to the form and content of a stockholder’s notice. These provisions may make it more difficult for our stockholders to bring matters before our annual meeting of stockholders or to nominate directors at our annual meetings. |
| • | Amendment of Certificate of Incorporation and Bylaws. Our amended and restated certificate of incorporation and amended and restated bylaws provide that approval of at least a majority of the shares entitled to vote at an election of directors will be required to adopt, amend or repeal our amended and restated bylaws, or repeal the provisions of our amended and restated certificate of incorporation regarding the election and removal of directors and the inability of stockholders to take action by written consent in lieu of a meeting. |
The foregoing provisions will make it more difficult for our existing stockholders to replace our board of directors, as well as for another party to obtain control of us by replacing our board of directors. Because our board of directors has the power to retain and discharge our officers, these provisions could also make it more difficult for existing stockholders or another party to effect a change in our management.
These provisions are intended to enhance the likelihood of continued stability in the composition of our board of directors and its policies and to discourage certain types of transactions that may involve an actual or threatened acquisition of us. These provisions are also designed to reduce our vulnerability to an unsolicited acquisition proposal and to discourage certain tactics that may be used in proxy fights. However, these provisions could have the effect of discouraging others from making tender offers for our shares and may have the effect of deterring hostile takeovers or delaying changes in our control or management. As a consequence, these provisions also may inhibit fluctuations in the market price of our stock that could result from actual or rumored takeover attempts.
Section 203 of the Delaware General Corporation Law
Upon the completion of this offering, we will be subject to Section 203 of the Delaware General Corporation Law, which prohibits a Delaware corporation from engaging in any business combination with any interested stockholder for a period of three years after the date that such stockholder became an interested stockholder, with the following exceptions:
| • | before such date, the board of directors of the corporation approved either the business combination or the transaction that resulted in the stockholder becoming an interested stockholder; |
| • | upon completion of the transaction that resulted in the stockholder becoming an interested stockholder, the interested stockholder owned at least 85% of the voting stock of the corporation outstanding at the time the transaction began, excluding for purposes of determining the voting stock outstanding (but not the outstanding voting stock owned by the interested stockholder) those shares owned (i) by persons who are directors and also officers and (ii) employee stock plans in which employee participants do not have the right to determine confidentially whether shares held subject to the plan will be tendered in a tender or exchange offer; or |
| • | on or after such date, the business combination is approved by the board of directors and authorized at an annual or special meeting of the stockholders, and not by written consent, by the affirmative vote of at least 66 2/3% of the outstanding voting stock that is not owned by the interested stockholder. |
In general, Section 203 defines business combination to include the following:
| • | any merger or consolidation involving the corporation and the interested stockholder; |
| • | any sale, transfer, pledge or other disposition of 10% or more of the assets of the corporation involving the interested stockholder; |
141
Table of Contents
| • | subject to certain exceptions, any transaction that results in the issuance or transfer by the corporation of any stock of the corporation to the interested stockholder; |
| • | any transaction involving the corporation that has the effect of increasing the proportionate share of the stock or any class or series of the corporation beneficially owned by the interested stockholder; or |
| • | the receipt by the interested stockholder of the benefit of any loss, advances, guarantees, pledges or other financial benefits by or through the corporation. |
In general, Section 203 defines an “interested stockholder” as an entity or person who, together with the person’s affiliates and associates, beneficially owns, or within three years prior to the time of determination of interested stockholder status did own, 15% or more of the outstanding voting stock of the corporation.
Transfer Agent and Registrar
The transfer agent and registrar for our common stock will be after completion of this offering.
NASDAQ Global Market Listing
We have applied to have our common stock listed on The NASDAQ Global Market under the symbol “GCTS.”
SHARES ELIGIBLE FOR FUTURE SALE
Immediately prior to this offering, there has been no public market for our common stock. Future sales of substantial amounts of shares of our common stock in the public market could adversely affect prevailing market prices. Furthermore, since only a limited number of shares will be available for sale shortly after this offering because of contractual and legal restrictions on resale described below, sales of substantial amounts of common stock in the public market after the restrictions lapse could adversely affect the prevailing market price for our common stock, as well as our ability to raise equity capital in the future.
Based on the number of shares of common stock outstanding as of June 30, 2011, upon the completion of this offering, there will be shares of our common stock outstanding, assuming the following:
| • | the automatic conversion of all outstanding shares of our preferred stock as of June 30, 2011 into an aggregate of 182,115,586 shares of common stock upon completion of this offering; |
| • | the issuance of shares of common stock as payment of all unpaid and accrued dividends to holders of our preferred stock, assuming an initial public offering price of $ per share pursuant to our existing certificate of incorporation, the mid-point of the price range set forth on the cover page of this prospectus and assuming the payment occurs on ; |
| • | the exercise of outstanding warrants to purchase 9,303,029 shares of our preferred stock as of June 30, 2011, such exercise includes the assumed exercise, on a net exercise basis where allowed, of the outstanding warrants to purchase 7,636,363 shares of our preferred stock, immediately prior to this offering, and the concomitant conversion of the shares of preferred stock acquired upon exercise into shares of common stock upon completion of this offering, assuming an initial public offering price of $ per share, the mid-point of the price range set forth on the cover page of this prospectus; and |
| • | no exercise by the underwriters of their option to purchase up to an additional shares of common stock from us |
142
Table of Contents
All of the shares sold in this offering will be freely tradable unless purchased by our affiliates. The remaining shares of our common stock outstanding after this offering are restricted securities as such term is defined in Rule 144 under the Securities Act or are subject to lock-up agreements as described below. Following the expiration of the lock-up period, restricted securities may be sold in the public market only if registered or if they qualify for an exemption from registration under Rule 144 or 701 promulgated under the Securities Act, described in greater detail below. The shares will generally become available for sale in the public market as follows:
| • | no restricted shares will be eligible for immediate sale upon the completion of this offering; |
| • | up to restricted shares will be eligible for sale under Rule 144 or Rule 701 upon expiration of lock-up agreements at least 180 days after the date of this offering; and |
| • | the remainder of the restricted shares will be eligible for sale from time to time thereafter upon expiration of their respective holding periods under Rule 144, but could be sold earlier if the holders exercise any available registration rights. |
Rule 144
In general, a person who has beneficially owned restricted shares of our common stock for at least six months would be entitled to sell their securities provided that (i) such person is not deemed to have been one of our affiliates at the time of, or at any time during the three months preceding, a sale and (ii) we are subject to and compliant with the Exchange Act periodic reporting requirements for at least 90 days before the sale. In addition, under Rule 144, any person who is not an affiliate of ours, has not been an affiliate of ours during the preceding three months and has held their shares for at least one year, including the holding period of any prior owner other than one of our affiliates, would be entitled to sell an unlimited number of shares immediately upon the completion of this offering without regard to whether current public information about us is available. Persons who have beneficially owned restricted shares of our common stock for at least six months but who are our affiliates at the time of, or any time during the 90 days preceding, a sale, would be subject to additional restrictions, by which such person would be entitled to sell within any three-month period only a number of securities that does not exceed the greater of either of the following:
| • | 1% of the total number of shares of our common stock then outstanding, which will equal approximately shares immediately after this offering assuming no exercise of the underwriters’ overallotment option to purchase additional shares, based on the number of shares of common stock outstanding as of June 30, 2011 and the adjustments described above; or |
| • | the average weekly trading volume of our common stock on The NASDAQ Global Market during the four calendar weeks preceding the filing of a notice on Form 144 with respect to the sale; |
provided, in each case, that we are subject to the Exchange Act periodic reporting requirements for at least 90 days before the sale. Such sales both by affiliates and by non-affiliates must also comply with the manner of sale, current public information and notice provisions of Rule 144.
143
Table of Contents
Rule 701
Rule 701 under the Securities Act, as in effect on the date of this prospectus, permits resales of shares in reliance upon Rule 144 but without compliance with certain restrictions of Rule 144, including the holding period requirement. Most of our employees, executive officers, directors or consultants who purchased shares under a written compensatory plan or contract may be entitled to rely on the resale provisions of Rule 701, but all holders of Rule 701 shares are required to wait until 90 days after the date of this prospectus before selling their shares. However, substantially all Rule 701 shares are subject to lock-up agreements as described below and under “Underwriting” and will become eligible for sale at the expiration of those agreements.
Lock-Up Agreements
We, along with our officers and directors and substantially all of our other stockholders and option holders, have agreed that, subject to certain exceptions, we will not offer, pledge, sell, contract to sell or otherwise dispose of, directly or indirectly, any shares of our common stock or securities convertible into or exercisable for any shares of our common stock, enter into a transaction that would have the same effect, or enter into any swap or other arrangement that transfers, in whole or in part, any of the economic consequences of ownership of our common stock, whether any of these transactions are to be settled by delivery of our common stock or other securities, in cash or otherwise, or publicly disclose the intention to make any offer, sale, pledge or disposition, or to enter into any transaction, swap or other arrangement, without, in each case, the prior written consent of each of Goldman, Sachs & Co. and Merrill Lynch, Pierce, Fenner & Smith Incorporated, for a period of 180 days after the date of this prospectus. However, in the event that either (1) during the last 17 days of the “lock-up” period, we release earnings results or announce material news or a material event relating to us or (2) prior to the expiration of the “lock-up” period, we announce that we will release earnings results during the 16-day period beginning on the last day of the “lock-up” period, then, in either case, the expiration of the “lock-up” will be extended until the expiration of the 18-day period beginning on the date of the release of the earnings results or the announcement of the material news or event, as applicable, unless each of Goldman, Sachs & Co. and Merrill Lynch, Pierce, Fenner & Smith Incorporated waives, in writing, such an extension. In addition, Goldman, Sachs & Co. and Merrill Lynch, Pierce, Fenner & Smith Incorporated, as representatives of the underwriters, may also release shares subject to the lock-up prior to the expiration of the lock-up period at their discretion.
Registration Rights
We are party to an investors’ rights agreement which provides that certain holders of our common stock (including current holders of our preferred stock, warrants and convertible notes who will receive shares of our common stock following the completion of this offering) have the right to demand that we file a registration statement or request that their shares be covered by a registration statement that we are otherwise filing. See “Description of Capital Stock—Registration Rights.” Except for shares purchased by affiliates, registration of their shares under the Securities Act would result in these shares becoming freely tradable without restriction under the Securities Act immediately upon effectiveness of the registration statement, subject to the expiration of the lock-up period and to the extent these shares have been released from any repurchase option that we may hold.
Equity Incentive Plans
We intend to file with the SEC a registration statement under the Securities Act covering the shares of our common stock reserved for issuance under our 2011 Plan and ESPP. The registration statement is expected to be filed and become effective as soon as practicable after the completion of this offering. Accordingly, shares registered under the registration statement will be available for sale in the open market following its effective date, subject to the 180-day lock-up arrangement described above and any applicable extension period as applicable.
144
Table of Contents
MATERIAL U.S. FEDERAL TAX CONSIDERATIONS FOR NON-U.S. HOLDERS
The following is a summary of the material U.S. federal income tax consequences of the ownership and disposition of our common stock to a non-U.S. holder that acquires our common stock pursuant to this offering. This discussion is not a complete analysis of all potential U.S. federal income tax consequences relating thereto, nor does it address any tax consequences arising under the laws of any state, local or non-U.S. taxing jurisdiction. Furthermore, the following discussion is based on current provisions of the Internal Revenue Code of 1986, as amended, or the Code, Treasury Regulations promulgated thereunder, judicial decisions, and published rulings and administrative pronouncements of the Internal Revenue Service, or IRS, all as in effect on the date hereof. These authorities may change, possibly with retroactive effect, resulting in U.S. federal income tax consequences different from those discussed below. No ruling has been or will be sought from the IRS with respect to the matters discussed below, and there can be no assurance that the IRS will not take a contrary position regarding the tax consequences of the acquisition, ownership or disposition of our common stock, or that any such contrary position would not be sustained by a court.
This discussion is limited to non-U.S. holders who hold our common stock issued pursuant to this offering as a “capital asset” for U.S. federal income tax purposes within the meaning of Section 1221 of the Code (generally, property held for investment). This discussion does not address all aspects of U.S. federal income taxation that may be relevant to a particular holder in light of such holder’s particular circumstances. This discussion also does not consider any specific facts or circumstances that may be relevant to holders subject to special rules under the U.S. federal income tax laws, including, without limitation, certain former citizens or long-term residents of the U.S., partnerships or pass-through entities, real estate investment trusts, regulated investment companies, “controlled foreign corporations,” “passive foreign investment companies,” companies that accumulate earnings to avoid U.S. federal income tax, banks, financial institutions, investment funds, insurance companies, brokers, dealers or traders in securities, commodities or currency, tax-exempt organizations, tax-qualified retirement plans, persons subject to the alternative minimum tax, persons that own, or have owned, actually or constructively, more than 5% of our common stock and persons holding our common stock as part of a hedge, straddle or conversion transaction, or a constructive sale, or other risk reduction strategy.
If a partnership (or an entity or arrangement treated as a partnership for U.S. federal income tax purposes) holds our common stock, the tax treatment of a partner will generally depend on the status of the partner and upon the activities of the partnership. Accordingly, we urge partnerships that hold our common stock and partners in such partnerships to consult their tax advisors.
PROSPECTIVE INVESTORS SHOULD CONSULT THEIR TAX ADVISORS REGARDING THE PARTICULAR U.S. FEDERAL INCOME TAX, STATE, LOCAL AND NON-U.S. INCOME AND OTHER TAX CONSEQUENCES OF ACQUIRING, HOLDING AND DISPOSING OF SHARES OF OUR COMMON STOCK.
Definition of Non-U.S. Holder
For the purpose of this discussion, a non-U.S. holder is any beneficial owner of our common stock that, for U.S. federal income tax purposes, is not a “U.S. person” or a partnership (or entity treated as such for U.S. federal income tax purposes). A U.S. person is any of the following:
| • | an individual citizen or resident of the United States; |
| • | a corporation (or other entity treated as a corporation for U.S. federal income tax purposes) created or organized under the laws of the U.S., or any state thereof or the District of Columbia; |
| • | an estate whose income is subject to U.S. federal income tax regardless of its source; or |
| • | a trust (x) whose administration is subject to the primary supervision of a U.S. court and which has one or more U.S. persons who have the authority to control all substantial decisions of the trust or (y) which has in effect a valid election to be treated as a U.S. person. |
145
Table of Contents
Distributions on our Common Stock
We have not made any cash or property distributions on our common stock and we do not plan to make any such distributions in the foreseeable future. However, if we do make distributions of cash or property on our common stock, such distributions will constitute dividends for U.S. tax purposes to the extent paid from our current or accumulated earnings and profits, as determined under U.S. federal income tax principles. Amounts not treated as dividends for U.S. federal income tax purposes will constitute a return of capital and will first be applied against and reduce a holder’s adjusted tax basis in the common stock, but not below zero. Any excess will be treated as gain realized on the sale or other disposition of the common stock and will be treated as described under “Gain on Disposition of Common Stock” below.
Dividends paid to a non-U.S. holder of common stock generally will be subject to U.S. federal withholding tax at a rate of 30% of the gross amount of the dividend, or such lower rate as may be specified by an applicable income tax treaty. To receive a reduced rate of withholding under a tax treaty, a non-U.S. holder must provide us with an IRS Form W-8BEN (or applicable successor form) including a U.S. taxpayer identification number and certifying such holder’s qualification for the reduced rate. This certification must be provided to us or our paying agent prior to the payment of dividends and must be updated periodically. If the non-U.S. holder holds the stock through a financial institution or other agent acting on the non-U.S. holder’s behalf, the non-U.S. holder will be required to provide appropriate documentation to the agent, which then will be required to provide certification to us or our paying agent, either directly or through other intermediaries. Non-U.S. holders that do not timely provide us or our paying agent with the required certification, but that qualify for a reduced treaty rate, may obtain a refund of any excess amounts withheld by timely filing an appropriate claim for refund with the IRS.
If a non-U.S. holder holds our common stock in connection with the conduct of a trade or business in the U.S., and dividends paid on the common stock are effectively connected with such holder’s U.S. trade or business, the non-U.S. holder will be exempt from U.S. federal withholding tax. To claim the exemption, the non-U.S. holder must generally provide to us or our paying agent a properly executed IRS Form W-8ECI (or applicable successor form).
Any dividends paid on our common stock that are effectively connected with a non-U.S. holder’s U.S. trade or business (and if an income tax treaty applies, are attributable to a permanent establishment maintained by the non-U.S. holder in the U.S.) generally will be subject to U.S. federal income tax on a net income basis at the regular graduated U.S. federal income tax rates in much the same manner as if such holder were a resident of the U.S. A non-U.S. holder that is a foreign corporation also may be subject to an additional branch profits tax at a rate of 30% (or such lower rate as may be specified by an applicable income tax treaty) of its effectively connected earnings and profits for the taxable year, as adjusted for certain items. Non-U.S. holders should consult any applicable income tax treaties that may provide for different rules.
Gain on Disposition of our Common Stock
Subject to the discussion below under “Backup Withholding and Information Reporting” and certain recently enacted legislation, a non-U.S. holder generally will not be subject to U.S. federal income tax or withholding tax on any gain realized upon the sale or other disposition of our common stock, unless:
| • | the gain is effectively connected with the non-U.S. holder’s conduct of a trade or business in the U.S., and if an income tax treaty applies, is attributable to a permanent establishment maintained by the non-U.S. holder in the U.S.; |
| • | the non-U.S. holder is a nonresident alien individual present in the U.S. for 183 days or more during the taxable year of the sale or disposition, and certain other conditions are met; or |
| • | our common stock constitutes a “United States real property interest” in the event we are a United States real property holding corporation, or USRPHC, for U.S. federal income tax purposes at any time |
146
Table of Contents
| within the shorter of the five-year period preceding the disposition or the non U.S.-holder’s holding period for our common stock and our common stock has ceased to be regularly traded on an established securities market prior to the beginning of the calendar year in which the sale or disposition occurs. The determination of whether we are a USRPHC depends on the fair market value of our United States real property interests relative to the fair market value of our other trade or business assets and our foreign real property interests. We believe that we are not currently, and do not anticipate becoming a USRPHC for U.S. federal income tax purposes. |
Gain described in the first bullet point above will be subject to U.S. federal income tax on a net income basis at the graduated U.S. federal income tax rate in the same manner as if such holder were a resident of the U.S. A non-U.S. holder that is a foreign corporation also may be subject to an additional branch profits tax equal to 30% (or such lower rate specified by an applicable income tax treaty) of its effectively connected earnings and profits for the taxable year, as adjusted for certain items. Non-U.S. holders should consult any applicable income tax treaties that may provide for different rules.
Gain described in the second bullet point above will be subject to U.S. federal income tax at a flat 30% rate (or such lower rate specified by an applicable income tax treaty), but may be offset by U.S. source capital losses (even though the individual is not considered a resident of the U.S.), provided that the non-U.S. holder has timely filed U.S. federal income tax returns with respect to such losses.
A non-U.S. holder described in the third bullet point above will be subject to U.S. federal income tax under regular graduated U.S. federal income tax rates with respect to the gain recognized.
U.S. Federal Estate Tax
Our common stock beneficially owned by an individual who is not a citizen or resident of the U.S. (as defined for U.S. federal estate tax purposes) at the time of death will generally be includable in the decedent’s gross estate for U.S. federal estate tax purposes, unless an applicable estate tax treaty provides otherwise.
Backup Withholding and Information Reporting
We must report annually to the IRS and each non-U.S. holder the amount of dividends on our common stock paid to such holder and the amount of any tax withheld with respect to those dividends. These information reporting requirements apply even if no withholding was required because the dividends were effectively connected with the holder’s conduct of a U.S. trade or business, or withholding was reduced or eliminated by an applicable income tax treaty. This information also may be made available under a specific treaty or agreement with the tax authorities in the country in which the non-U.S. holder resides or is established. Backup withholding (currently at a rate of 28%), however, generally will apply to payments to a non-U.S. holder of dividends or on the gross proceeds of a disposition of our common stock unless the non-U.S. holder furnishes to us or our paying agent the required certification as to its non-U.S. status, such as by providing a valid IRS Form W-8BEN or another appropriate version of IRS Form W-8, or certain other requirements are met. Notwithstanding the foregoing, backup withholding may apply if either we or our paying agent has actual knowledge, or reason to know, that the holder is a U.S. person that is not an exempt recipient.
Backup withholding is not an additional tax. Any amounts withheld under the backup withholding rules may be allowed as a refund or credit against a non-U.S. holder’s U.S. federal income tax liability provided the required information is timely furnished to the IRS.
147
Table of Contents
Recently Enacted Tax Legislation Relating Affecting Taxation of Our Common Stock Held By or Through Foreign Entities
Recently enacted legislation generally will impose a U.S. federal withholding tax of 30% on dividends and the gross proceeds of a disposition of our common stock paid after December 31, 2012 to a “foreign financial institution” (as specially defined under these rules) unless such institution enters into an agreement with the U.S. government to withhold on certain payments and to collect and provide to the U.S. tax authorities substantial information regarding U.S. account holders of such institution (which includes certain equity and debt holders of such institution, as well as certain account holders that are foreign entities with U.S. owners). The legislation also generally will impose a U.S. federal withholding tax of 30% on dividends and the gross proceeds from the sale or other disposition of our common stock paid after December 31, 2012 to a non-financial foreign entity unless such entity provides the withholding agent with a certification identifying the direct and indirect U.S. owners of the entity. Under certain circumstances, a non-U.S. holder might be eligible for refunds or credits of such taxes. Prospective investors are encouraged to consult their own tax advisors regarding the possible implications of this legislation on their investment in our common stock.
148
Table of Contents
We and the underwriters named below have entered into an underwriting agreement with respect to the shares being offered. Subject to certain conditions, each underwriter has severally agreed to purchase the number of shares indicated in the following table. Goldman, Sachs & Co. and Merrill Lynch, Pierce, Fenner & Smith Incorporated are the representatives of the underwriters.
| Underwriters | Number of Shares | |||
| Goldman, Sachs & Co. |
||||
| Merrill Lynch, Pierce, Fenner & Smith Incorporated |
||||
| Cowen and Company, LLC |
||||
| Oppenheimer & Co., Inc |
||||
| Total |
The underwriters are committed to take and pay for all of the shares being offered, if any are taken, other than the shares covered by the option described below unless and until this option is exercised.
If the underwriters sell more shares than the total number set forth in the table above, the underwriters have an option to buy up to an additional shares from us. They may exercise that option for 30 days. If any shares are purchased pursuant to this option, the underwriters will severally purchase shares in approximately the same proportion as set forth in the table above.
The following tables show the per share and total underwriting discounts and commissions to be paid to the underwriters by us. Such amounts are shown assuming both no exercise and full exercise of the underwriters’ option to purchase additional shares.
| No Exercise | Full Exercise | |||||||
| Per Share |
$ | $ | ||||||
| Total |
$ | $ | ||||||
Shares sold by the underwriters to the public will initially be offered at the initial public offering price set forth on the cover of this prospectus. Any shares sold by the underwriters to securities dealers may be sold at a discount of up to $ per share from the initial public offering price. If all the shares are not sold at the initial public offering price, the representatives may change the offering price and the other selling terms. The offering of the shares by the underwriters is subject to receipt and acceptance and subject to the underwriters’ right to reject any order in whole or in part.
We and our officers, directors, and holders of substantially all of our common stock and securities convertible into our common stock, have agreed with the underwriters, subject to certain exceptions, not to dispose of or hedge any of their common stock or securities convertible into or exchangeable for shares of common stock during the period from the date of this prospectus continuing through the date 180 days after the date of this prospectus, except with the prior written consent of the representatives. There are no agreements between representatives and any of our security holders or affiliates releasing them from these lock-up agreements prior to the expiration of the 180-day period. See “Shares Eligible for Future Sale” for a discussion of certain transfer restrictions.
The 180-day restricted period described in the preceding paragraph will be automatically extended if: (1) during the last 17 days of the 180-day restricted period we issue an earnings release or announces material news or a material event; or (2) prior to the expiration of the 180-day restricted period, we announce that we will release earnings results during the 15-day period following the last day of the 180-day period, in which case the restrictions described in the preceding paragraph will continue to apply until the expiration of the 18-day period beginning on the issuance of the earnings release of the announcement of the material news or material event.
149
Table of Contents
Prior to the offering, there has been no public market for the shares. The initial public offering price will be negotiated between us and the representatives. Among the factors to be considered in determining the initial public offering price of the shares, in addition to prevailing market conditions, will be our historical performance, estimates of our business potential and earnings prospects, an assessment of our management and the consideration of the above factors in relation to market valuation of companies in related businesses.
An application has been made to list the common stock on The NASDAQ Global Market under the symbol “GCTS.”
In connection with the offering, the underwriters may purchase and sell shares of common stock in the open market. These transactions may include short sales, stabilizing transactions and purchases to cover positions created by short sales. Shorts sales involve the sale by the underwriters of a greater number of shares than they are required to purchase in the offering. “Covered” short sales are sales made in an amount not greater than the underwriters’ option to purchase additional shares from us in the offering. The underwriters may close out any covered short position by either exercising their option to purchase additional shares or purchasing shares in the open market. In determining the source of shares to close out the covered short position, the underwriters will consider, among other things, the price of shares available for purchase in the open market as compared to the price at which they may purchase additional shares pursuant to the option granted to them. “Naked” short sales are any sales in excess of such option. The underwriters must close out any naked short position by purchasing shares in the open market. A naked short position is more likely to be created if the underwriters are concerned that there may be downward pressure on the price of the common stock in the open market after pricing that could adversely affect investors who purchase in the offering. Stabilizing transactions consist of various bids for or purchases of common stock made by the underwriters in the open market prior to the completion of the offering.
The underwriters may also impose a penalty bid. This occurs when a particular underwriter repays to the underwriters a portion of the underwriting discount received by it because the representatives have repurchased shares sold by or for the account of such underwriter in stabilizing or short covering transactions.
Purchases to cover a short position and stabilizing transactions, as well as other purchases by the underwriters for their own accounts, may have the effect of preventing or retarding a decline in the market price of our stock, and together with the imposition of the penalty bid, may stabilize, maintain or otherwise affect the market price of the common stock. As a result, the price of the common stock may be higher than the price that otherwise might exist in the open market. If these activities are commenced, they may be discontinued at any time. These transactions may be effected on The NASDAQ Global Market, in the over-the-counter market or otherwise.
In relation to each Member State of the European Economic Area which has implemented the Prospectus Directive (each, a Relevant Member State), each underwriter has represented and agreed that with effect from and including the date on which the Prospectus Directive is implemented in that Relevant Member State (the Relevant Implementation Date) it has not made and will not make an offer of shares to the public in that Relevant Member State prior to the publication of a prospectus in relation to the shares which has been approved by the competent authority in that Relevant Member State or, where appropriate, approved in another Relevant Member State and notified to the competent authority in that Relevant Member State, all in accordance with the Prospectus Directive, except that it may, with effect from and including the Relevant Implementation Date, make an offer of shares to the public in that Relevant Member State at any time:
(a) to legal entities which are authorized or regulated to operate in the financial markets or, if not so authorized or regulated, whose corporate purpose is solely to invest in securities;
(b) to any legal entity which has two or more of (1) an average of at least 250 employees during the last financial year; (2) a total balance sheet of more than €43,000,000 and (3) an annual net turnover of more than €50,000,000, as shown in its last annual or consolidated accounts;
150
Table of Contents
(c) to fewer than 100 natural or legal persons (other than qualified investors as defined in the Prospectus Directive) subject to obtaining the prior consent of the representatives for any such offer; or
(d) in any other circumstances which do not require the publication by us of a prospectus pursuant to Article 3 of the Prospectus Directive.
For the purposes of this provision, the expression an “offer of shares to the public” in relation to any shares in any Relevant Member State means the communication in any form and by any means of sufficient information on the terms of the offer and the shares to be offered so as to enable an investor to decide to purchase or subscribe the shares, as the same may be varied in that Relevant Member State by any measure implementing the Prospectus Directive in that Relevant Member State and the expression Prospectus Directive means Directive 2003/71/EC and includes any relevant implementing measure in each Relevant Member State.
Each underwriter has represented and agreed that:
it has only communicated or caused to be communicated and will only communicate or cause to be communicated an invitation or inducement to engage in investment activity (within the meaning of Section 21 of the FSMA) received by it in connection with the issue or sale of the shares in circumstances in which Section 21(1) of the FSMA does not apply to us; and
it has complied and will comply with all applicable provisions of the FSMA with respect to anything done by it in relation to the shares in, from or otherwise involving the United Kingdom.
The shares may not be offered or sold by means of any document other than (i) in circumstances which do not constitute an offer to the public within the meaning of the Companies Ordinance (Cap.32, Laws of Hong Kong), or (ii) to “professional investors” within the meaning of the Securities and Futures Ordinance (Cap.571, Laws of Hong Kong) and any rules made thereunder, or (iii) in other circumstances which do not result in the document being a “prospectus” within the meaning of the Companies Ordinance (Cap.32, Laws of Hong Kong), and no advertisement, invitation or document relating to the shares may be issued or may be in the possession of any person for the purpose of issue (in each case whether in Hong Kong or elsewhere), which is directed at, or the contents of which are likely to be accessed or read by, the public in Hong Kong (except if permitted to do so under the laws of Hong Kong) other than with respect to shares which are or are intended to be disposed of only to persons outside Hong Kong or only to “professional investors” within the meaning of the Securities and Futures Ordinance (Cap. 571, Laws of Hong Kong) and any rules made thereunder.
This prospectus has not been registered as a prospectus with the Monetary Authority of Singapore. Accordingly, this prospectus and any other document or material in connection with the offer or sale, or invitation for subscription or purchase, of the shares may not be circulated or distributed, nor may the shares be offered or sold, or be made the subject of an invitation for subscription or purchase, whether directly or indirectly, to persons in Singapore other than (i) to an institutional investor under Section 274 of the Securities and Futures Act, Chapter 289 of Singapore (the “SFA”), (ii) to a relevant person, or any person pursuant to Section 275(1A), and in accordance with the conditions, specified in Section 275 of the SFA or (iii) otherwise pursuant to, and in accordance with the conditions of, any other applicable provision of the SFA.
Where the shares are subscribed or purchased under Section 275 by a relevant person which is: (a) a corporation (which is not an accredited investor) the sole business of which is to hold investments and the entire share capital of which is owned by one or more individuals, each of whom is an accredited investor; or (b) a trust (where the trustee is not an accredited investor) whose sole purpose is to hold investments and each beneficiary is an accredited investor, shares, debentures and units of shares and debentures of that corporation or the beneficiaries’ rights and interest in that trust shall not be transferable for 6 months after that corporation or that trust has acquired the shares under Section 275 except: (1) to an institutional investor under Section 274 of the SFA or to a relevant person, or any person pursuant to Section 275(1A), and in accordance with the conditions, specified in Section 275 of the SFA; (2) where no consideration is given for the transfer; or (3) by operation of law.
151
Table of Contents
The securities have not been and will not be registered under the Financial Instruments and Exchange Law of Japan (the Financial Instruments and Exchange Law) and each underwriter has agreed that it will not offer or sell any securities, directly or indirectly, in Japan or to, or for the benefit of, any resident of Japan (which term as used herein means any person resident in Japan, including any corporation or other entity organized under the laws of Japan), or to others for re-offering or resale, directly or indirectly, in Japan or to a resident of Japan, except pursuant to an exemption from the registration requirements of, and otherwise in compliance with, the Financial Instruments and Exchange Law and any other applicable laws, regulations and ministerial guidelines of Japan.
The shares may not be publicly offered in Switzerland and will not be listed on the SIX Swiss Exchange (SIX) or on any other stock exchange or regulated trading facility in Switzerland. This document has been prepared without regard to the disclosure standards for issuance prospectuses under art. 652a or art. 1156 of the Swiss Code of Obligations or the disclosure standards for listing prospectuses under art. 27 ff. of the SIX Listing Rules or the listing rules of any other stock exchange or regulated trading facility in Switzerland. Neither this document nor any other offering or marketing material relating to the shares or the offering may be publicly distributed or otherwise made publicly available in Switzerland.
Neither this document nor any other offering or marketing material relating to the offering, the Company, the shares have been or will be filed with or approved by any Swiss regulatory authority. In particular, this document will not be filed with, and the offer of shares will not be supervised by, the Swiss Financial Market Supervisory Authority FINMA (FINMA), and the offer of shares has not been and will not be authorized under the Swiss Federal Act on Collective Investment Schemes (CISA). The investor protection afforded to acquirers of interests in collective investment schemes under the CISA does not extend to acquirers of shares.
This prospectus supplement relates to an Exempt Offer in accordance with the Offered Securities Rules of the Dubai Financial Services Authority (DFSA). This prospectus supplement is intended for distribution only to persons of a type specified in the Offered Securities Rules of the DFSA. It must not be delivered to, or relied on by, any other person. The DFSA has no responsibility for reviewing or verifying any documents in connection with Exempt Offers. The DFSA has not approved this prospectus supplement nor taken steps to verify the information set forth herein and has no responsibility for the prospectus supplement. The shares to which this prospectus supplement relates may be illiquid and/or subject to restrictions on their resale. Prospective purchasers of the shares offered should conduct their own due diligence on the shares. If you do not understand the contents of this prospectus supplement you should consult an authorized financial advisor.
A prospectus in electronic format is being made available on Internet web sites maintained by one or more of the lead underwriters of this offering and may be made available on web sites maintained by other underwriters. Other than the prospectus in electronic format, the information on any underwriter’s web site and any information contained in any other web site maintained by an underwriter is not part of the prospectus or the registration statement of which the prospectus forms a part.
The underwriters do not expect sales to discretionary accounts to exceed five percent of the total number of shares offered.
We estimate that our share of the total expenses of the offering, excluding underwriting discounts and commissions, will be approximately $ .
We have agreed to indemnify the several underwriters against certain liabilities, including liabilities under the Securities Act of 1933.
The underwriters have agreed to reimburse us for $ of expenses in connection with the offering.
152
Table of Contents
The underwriters and their respective affiliates are full service financial institutions engaged in various activities, which may include securities trading, commercial and investment banking, financial advisory, investment management, investment research, principal investment, hedging, financing and brokerage activities. Certain of the underwriters and their respective affiliates have, from time to time, performed, and may in the future perform, various financial advisory and investment banking services for us, for which they received or will receive customary fees and expenses.
In the ordinary course of their various business activities, the underwriters and their respective affiliates may make or hold a broad array of investments and actively trade debt and equity securities (or related derivative securities) and financial instruments (including bank loans) for their own account and for the accounts of their customers, and such investment and securities activities may involve our securities and/or instruments. The underwriters and their respective affiliates may also make investment recommendations and/or publish or express independent research views in respect of such securities or instruments and may at any time hold, or recommend to clients that they acquire, long and/or short positions in such securities and instruments.
We have retained Moelis & Company LLC (Moelis) to act as our financial advisor in connection with the offering. We have agreed to pay Moelis a fee of $ for their services and to reimburse Moelis for its out-of-pocket expenses in an amount not to exceed $20,000. Moelis’s services include customary business and financial analysis, an initial analysis of the market for new security issuances and assistance in preparing presentation materials. Moelis is not acting as an underwriter and will not sell or offer to sell any securities and will not identify, solicit or engage directly with potential investors. In addition, Moelis will not underwrite or purchase any of the offered securities or otherwise participate in any such undertaking.
The validity of our common stock offered by this prospectus will be passed upon for us by Morgan, Lewis & Bockius LLP, Palo Alto, California. Wilson Sonsini Goodrich & Rosati, P.C. of Palo Alto, California, is acting as counsel to the underwriters in connection with certain legal matters relating to the common stock being offered by this prospectus.
The consolidated financial statements as of June 30, 2009, 2010 and 2011 and for each of the three years in the period ended June 30, 2011 included in this prospectus have been so included in reliance on the report (which contains an explanatory paragraph relating to the Company’s ability to continue as a going concern as described in Note 1 to the financial statements) of PricewaterhouseCoopers LLP, an independent registered public accounting firm, given on the authority of said firm as experts in auditing and accounting.
153
Table of Contents
WHERE YOU CAN FIND ADDITIONAL INFORMATION
We have filed with the SEC a registration statement on Form S-1 under the Securities Act of 1933, as amended, with respect to this offering of our common stock. This prospectus, which constitutes a part of the registration statement, does not contain all of the information set forth in the registration statement, some items of which are contained in exhibits to the registration statement as permitted by the rules and regulations of the SEC. For further information with respect to us and our common stock offered by this prospectus, we refer you to the registration statement, including the exhibits and the consolidated financial statements and notes filed as a part of the registration statement. Statements contained in this prospectus as to the contents of any contract or any other document referred to are not necessarily complete, and in each instance, we refer you to the copy of the contract or other document filed as an exhibit to the registration statement. Each of these statements is qualified in all respects by this reference.
The exhibits to the registration statement should be referenced for the complete contents of these contracts and documents. You may obtain copies of this information by mail from the Public Reference Section of the SEC, 100 F Street, N.E., Room 1580, Washington, D.C. 20549, at prescribed rates. You may obtain information on the operation of the public reference rooms by calling the SEC at 1-800-SEC-0330. The SEC also maintains an internet website that contains reports, proxy statements and other information about issuers, like us, that file electronically with the SEC. The address of that website is www.sec.gov.
Upon the completion of this offering, we will be subject to the information reporting requirements of the Securities Act and we will file reports, proxy statements and other information with the SEC. These reports, proxy statements and other information will be available for inspection and copying at the public reference room and website of the SEC referred to above. We also maintain a website at www.gctsemi.com, at which you may access these materials free of charge as soon as reasonably practicable after they are electronically filed with, or furnished to, the SEC. The information contained in, or that can be accessed through, our website is not part of this prospectus.
154
Table of Contents
GCT SEMICONDUCTOR, INC.
INDEX TO CONSOLIDATED FINANCIAL STATEMENTS
F-1
Table of Contents
Report of Independent Registered Public Accounting Firm
To the Board of Directors and Stockholders of GCT Semiconductor, Inc.:
In our opinion, the accompanying consolidated balance sheets and the related consolidated statements of operations, of mandatorily redeemable convertible preferred stock and of stockholders’ deficit and of cash flows present fairly, in all material respects, the financial position of GCT Semiconductor, Inc. and its subsidiaries at June 30, 2011 and June 30, 2010, and the results of their operations and their cash flows for each of the three years in the period ended June 30, 2011 in conformity with accounting principles generally accepted in the United States of America. These financial statements are the responsibility of the Company’s management. Our responsibility is to express an opinion on these financial statements based on our audits. We conducted our audits of these statements in accordance with the standards of the Public Company Accounting Oversight Board (United States). Those standards require that we plan and perform the audit to obtain reasonable assurance about whether the financial statements are free of material misstatement. An audit includes examining, on a test basis, evidence supporting the amounts and disclosures in the financial statements, assessing the accounting principles used and significant estimates made by management, and evaluating the overall financial statement presentation. We believe that our audits provide a reasonable basis for our opinion.
The accompanying financial statements have been prepared assuming that the Company will continue as a going concern. As discussed in Note 1 to the financial statements, for the year ended June 30, 2011, the Company incurred a net loss of $11.5 million and had an accumulated deficit of $192.7 million. As of June 30, 2011, the Company had outstanding debt aggregating $44.9 million. These factors raise substantial doubt about the Company’s ability to continue as a going concern. Management’s plans in regard to these matters are also described in Note 1. The financial statements do not include any adjustments that might result from the outcome of this uncertainty.
| /s/ Pricewaterhouse Coopers LLP |
| San Jose, California |
| September 14, 2011 |
F-2
Table of Contents
Consolidated Balance Sheets
(In thousands, except share and per share data)
| June 30, 2010 |
June 30, 2011 |
Pro Forma Stockholders’ Deficit as of June 30, 2011 |
||||||||||
| (Unaudited) | ||||||||||||
| Assets |
||||||||||||
| Current Assets: |
||||||||||||
| Cash and cash equivalents |
$ | 3,928 | $ | 18,227 | ||||||||
| Restricted cash |
24 | — | ||||||||||
| Accounts receivable, net of allowance for doubtful accounts of zero as of June 30, 2010 and 2011 |
7,790 | 20,581 | ||||||||||
| Inventory |
2,003 | 15,238 | ||||||||||
| Prepaid expenses and other current assets |
2,004 | 3,287 | ||||||||||
|
|
|
|
|
|||||||||
| Total current assets |
15,749 | 57,333 | ||||||||||
| Property and equipment, net |
413 | 1,037 | ||||||||||
| Other assets |
294 | 378 | ||||||||||
|
|
|
|
|
|
|
|||||||
| Total assets |
$ | 16,456 | $ | 58,748 | ||||||||
|
|
|
|
|
|
|
|||||||
| Liabilities, mandatorily redeemable convertible preferred stock and stockholders’ deficit |
||||||||||||
| Current Liabilities: |
||||||||||||
| Accounts payable |
$ | 10,374 | $ | 13,029 | ||||||||
| Accrued and other current liabilities |
4,780 | 6,255 | ||||||||||
| Bank borrowings, current portion |
3,491 | 12,072 | ||||||||||
| Notes payable—related party, current portion |
2,604 | — | ||||||||||
| Convertible notes payable—related party |
— | 1,038 | $ | — | ||||||||
| Convertible notes payable, current portion |
— | 29,329 | — | |||||||||
| Customer deposits |
— | 7,087 | ||||||||||
| Deferred nonrecurring engineering and grants |
4,174 | 2,316 | ||||||||||
| Deferred margin |
1,801 | 513 | ||||||||||
| Redeemable convertible preferred stock warrant liability |
800 | 4,063 | — | |||||||||
|
|
|
|
|
|
|
|||||||
| Total current liabilities |
28,024 | 75,702 | ||||||||||
|
|
|
|
|
|
|
|||||||
| Bank borrowings, net of current portion |
8,626 | — | ||||||||||
| Notes payable—related party, net of current portion |
1,400 | 1,475 | ||||||||||
| Convertible notes payable, net of current portion |
7,671 | 1,028 | — | |||||||||
| Income tax payable |
2,598 | 2,682 | ||||||||||
| Other liabilities |
3,558 | 4,412 | ||||||||||
|
|
|
|
|
|
|
|||||||
| Total liabilities |
51,877 | 85,299 | ||||||||||
|
|
|
|
|
|
|
|||||||
| Commitments and Contingencies (Note 6) |
||||||||||||
| Mandatorily redeemable convertible preferred stock, par value of $0.001 per share: |
||||||||||||
| Series A—5,600,000 shares authorized, issued and outstanding as of June 30, 2010 and 2011 (liquidation preference of $1,400), actual; no shares issued and outstanding, pro forma (unaudited) |
1,397 | 1,397 | — | |||||||||
| Series B—5,200,000 shares authorized, issued and outstanding as of June 30, 2010 and 2011 (liquidation preference of $13,000), actual; no shares issued and outstanding, pro forma (unaudited) |
11,900 | 11,900 | — | |||||||||
| Series C—70,285,003 shares authorized, issued and outstanding as of June 30, 2010 and 2011 (liquidation preference of $157,381), actual; no shares issued and outstanding, pro forma (unaudited) |
71,000 | 74,514 | — | |||||||||
| Series D—31,366,116 shares authorized, issued and outstanding as of June 30, 2010 and 2011 (liquidation preference of $62,024), actual; no shares issued and outstanding, pro forma (unaudited) |
25,903 | 25,903 | — | |||||||||
| Series E—5,681,820 shares authorized, issued and outstanding as of June 30, 2010 and 2011(liquidation preference of $11,760), actual; no shares issued and outstanding, pro forma (unaudited) |
5,825 | 5,825 | — | |||||||||
| Series F—54,387,639 and 75,047,867 shares authorized, 25,082,926 and 38,957,924 shares issued and outstanding as of June 30, 2010 and 2011 (liquidation preference of $78,515), actual; no shares issued and outstanding, pro forma (unaudited) |
26,602 | 45,889 | — | |||||||||
|
|
|
|
|
|
|
|||||||
| Total mandatorily redeemable convertible preferred stock |
142,627 | 165,428 | — | |||||||||
|
|
|
|
|
|
|
|||||||
| Stockholders’ deficit: |
||||||||||||
| Common stock, par value $0.001 per share, 230,313,304 and 305,374,718 shares authorized as of June 30, 2010 and 2011; 22,115,462 and 23,689,499 shares issued and outstanding as of June 30, 2010 and 2011, actual; shares issued and outstanding, pro forma (unaudited) |
22 | 24 | ||||||||||
| Additional paid-in capital |
— | — | ||||||||||
| Accumulated other comprehensive income |
1,325 | 709 | ||||||||||
| Accumulated deficit |
(179,395 | ) | (192,712 | ) | ||||||||
|
|
|
|
|
|
|
|||||||
| Total stockholders’ deficit |
(178,048 | ) | (191,979 | ) | $ | |||||||
|
|
|
|
|
|
|
|||||||
| Total liabilities, mandatorily redeemable convertible preferred stock and stockholders’ deficit |
$ | 16,456 | $ | 58,748 | ||||||||
|
|
|
|
|
|
|
|||||||
The accompanying notes are an integral part of these consolidated financial statements.
F-3
Table of Contents
Consolidated Statements of Operations
(In thousands, except share and per share data)
| Years Ended June 30, | ||||||||||||
| 2009 | 2010 | 2011 | ||||||||||
| Revenues |
$ | 22,428 | $ | 33,079 | $ | 68,644 | ||||||
| Cost of revenues |
19,455 | 24,288 | 45,398 | |||||||||
|
|
|
|
|
|
|
|||||||
| Gross profit |
2,973 | 8,791 | 23,246 | |||||||||
| Operating expenses: |
||||||||||||
| Research and development (net of NRE and government grants of $5.3 million, $1.1 million and $7.7 million during 2009, 2010 and 2011) |
11,589 | 17,821 | 12,675 | |||||||||
| Sales and marketing |
4,508 | 4,780 | 5,279 | |||||||||
| General and administrative |
3,730 | 3,257 | 5,853 | |||||||||
|
|
|
|
|
|
|
|||||||
| Total operating expenses |
19,827 | 25,858 | 23,807 | |||||||||
|
|
|
|
|
|
|
|||||||
| Income (loss) from operations |
(16,854 | ) | (17,067 | ) | (561 | ) | ||||||
| Interest income |
76 | 49 | 43 | |||||||||
| Interest expense |
(782 | ) | (1,540 | ) | (2,315 | ) | ||||||
| Other income (expense), net |
3,588 | (1,171 | ) | (8,918 | ) | |||||||
|
|
|
|
|
|
|
|||||||
| Loss before income taxes |
(13,972 | ) | (19,729 | ) | (11,751 | ) | ||||||
| Provision for (benefit from) income taxes |
569 | 196 | (222 | ) | ||||||||
|
|
|
|
|
|
|
|||||||
| Net loss |
$ | (14,541 | ) | $ | (19,925 | ) | $ | (11,529 | ) | |||
|
|
|
|
|
|
|
|||||||
| Net loss attributable to common stockholders |
$ | (23,431 | ) | $ | (28,856 | ) | $ | (20,741 | ) | |||
|
|
|
|
|
|
|
|||||||
| Net loss per share attributable to common stockholders, basic and diluted |
$ | (1.17 | ) | $ | (1.39 | ) | $ | (0.98 | ) | |||
|
|
|
|
|
|
|
|||||||
| Weighted average shares used in computing net loss per share attributable to common stockholders, basic and diluted |
19,989,386 | 20,769,991 | 21,066,802 | |||||||||
|
|
|
|
|
|
|
|||||||
| Pro forma net loss per share attributable to common stockholders, basic and diluted |
$ | |||||||||||
|
|
|
|||||||||||
| Weighted average shares used in computing pro forma net loss per share attributable to common stockholders, basic and diluted |
||||||||||||
|
|
|
|||||||||||
The accompanying notes are an integral part of these consolidated financial statements.
F-4
Table of Contents
Consolidated Statements of Mandatorily Redeemable Convertible Preferred Stock and of Stockholders’ Deficit
(In thousands, except share data)
| Mandatorily Redeemable Convertible Preferred Stock |
Common Stock | Additional Paid-in Capital |
Accumulated Other Comprehensive Income (Loss) |
Accumulated Deficit |
Total Stockholders’ Deficit |
|||||||||||||||||||||||||||||
| Shares | Amount | Shares | Amount | |||||||||||||||||||||||||||||||
| Balance as of July 1, 2008 |
138,586,205 | $ | 129,734 | 20,673,637 | $ | 21 | $ | — | $ | (261 | ) | $ | (138,217 | ) | $ | (138,457 | ) | |||||||||||||||||
| Issuance of Series F redeemable convertible preferred stock (net of issuance cost of $70) |
4,166,665 | 4,410 | — | — | — | — | — | — | ||||||||||||||||||||||||||
| Conversion of notes payable to Series F redeemable convertible preferred stock |
462,995 | 555 | — | — | — | — | — | — | ||||||||||||||||||||||||||
| Prior period adjustment on warrants issued with Series E and F redeemable convertible preferred stock |
— | 832 | — | — | — | — | — | — | ||||||||||||||||||||||||||
| Accretion of Series C mandatorily redeemable convertible preferred stock to redemption amount |
— | 3,582 | — | — | (143 | ) | — | (3,439 | ) | (3,582 | ) | |||||||||||||||||||||||
| Issuance of common stock from option exercises |
— | — | 285,119 | — | 71 | — | — | 71 | ||||||||||||||||||||||||||
| Stock-based compensation |
— | — | — | — | 72 | — | — | 72 | ||||||||||||||||||||||||||
| Components of comprehensive loss |
||||||||||||||||||||||||||||||||||
| Foreign currency translation adjustment |
— | — | — | — | — | 1,487 | — | 1,487 | ||||||||||||||||||||||||||
| Net loss |
— | — | — | — | — | — | (14,541 | ) | (14,541 | ) | ||||||||||||||||||||||||
|
|
|
|||||||||||||||||||||||||||||||||
| Total comprehensive loss |
(13,054 | ) | ||||||||||||||||||||||||||||||||
|
|
|
|
|
|
|
|
|
|
|
|
|
|
|
|
|
|||||||||||||||||||
| Balance as of June 30, 2009 |
143,215,865 | 139,113 | 20,958,756 | 21 | — | 1,226 | (156,197 | ) | (154,950 | ) | ||||||||||||||||||||||||
| Accretion of Series C mandatorily redeemable convertible preferred stock to redemption amount |
— | 3,514 | — | — | (241 | ) | — | (3,273 | ) | (3,514 | ) | |||||||||||||||||||||||
| Issuance of common stock from option exercises |
— | — | 1,156,706 | 1 | 162 | — | — | 163 | ||||||||||||||||||||||||||
| Stock-based compensation |
— | — | — | — | 79 | — | — | 79 | ||||||||||||||||||||||||||
| Components of comprehensive loss |
||||||||||||||||||||||||||||||||||
| Foreign currency translation adjustment |
— | — | — | — | — | 99 | — | 99 | ||||||||||||||||||||||||||
| Net loss |
— | — | — | — | — | — | (19,925 | ) | (19,925 | ) | ||||||||||||||||||||||||
|
|
|
|||||||||||||||||||||||||||||||||
| Total comprehensive loss |
(19,826 | ) | ||||||||||||||||||||||||||||||||
|
|
|
|
|
|
|
|
|
|
|
|
|
|
|
|
|
|||||||||||||||||||
| Balance as of June 30, 2010 |
143,215,865 | 142,627 | 22,115,462 | 22 | — | 1,325 | (179,395 | ) | (178,048 | ) | ||||||||||||||||||||||||
| Accretion of Series C mandatorily redeemable convertible preferred stock to redemption amount |
— | 3,514 | — | — | (1,726 | ) | — | (1,788 | ) | (3,514 | ) | |||||||||||||||||||||||
| Exercise of Series F redeemable convertible preferred stock warrants |
13,874,998 | 19,287 | — | — | — | — | — | — | ||||||||||||||||||||||||||
| Issuance of common stock from option exercises |
— | — | 1,574,037 | 2 | 391 | — | — | 393 | ||||||||||||||||||||||||||
| Stock-based compensation |
— | — | — | — | 1,335 | — | — | 1,335 | ||||||||||||||||||||||||||
| Components of comprehensive loss |
||||||||||||||||||||||||||||||||||
| Foreign currency translation adjustment |
— | — | — | — | — | (616 | ) | — | (616 | ) | ||||||||||||||||||||||||
| Net loss |
— | — | — | — | — | — | (11,529 | ) | (11,529 | ) | ||||||||||||||||||||||||
|
|
|
|||||||||||||||||||||||||||||||||
| Total comprehensive loss |
(12,145 | ) | ||||||||||||||||||||||||||||||||
|
|
|
|
|
|
|
|
|
|
|
|
|
|
|
|
|
|||||||||||||||||||
| Balance as of June 30, 2011 |
157,090,863 | $ | 165,428 | 23,689,499 | $ | 24 | $ | — | $ | 709 | $ | (192,712 | ) | $ | (191,979 | ) | ||||||||||||||||||
|
|
|
|
|
|
|
|
|
|
|
|
|
|
|
|
|
|||||||||||||||||||
The accompanying notes are an integral part of these consolidated financial statements.
F-5
Table of Contents
Consolidated Statements of Cash Flows
(In thousands)
| Years Ended June 30, | ||||||||||||
| 2009 | 2010 | 2011 | ||||||||||
| Cash flows from operating activities: |
||||||||||||
| Net loss |
$ | (14,541 | ) | $ | (19,925 | ) | $ | (11,529 | ) | |||
| Adjustments to reconcile net loss to net cash used in operating activities: |
||||||||||||
| Depreciation and amortization |
961 | 574 | 434 | |||||||||
| Stock-based compensation |
72 | 79 | 1,335 | |||||||||
| Inventory write downs |
5,117 | 3,057 | 1,405 | |||||||||
| Loss on fixed asset disposal |
— | — | 69 | |||||||||
| Fair value remeasurement of warrant liability and foreign currency derivatives |
(4,634 | ) | (206 | ) | 5,326 | |||||||
| Fair value remeasurement of liability upon modification of warrants |
— | — | 1,066 | |||||||||
| Issuance of warrants |
229 | — | 591 | |||||||||
| Recovery of doubtful accounts |
(980 | ) | — | — | ||||||||
| Premium on interest upon issuance of convertible notes |
— | — | 125 | |||||||||
| Amortization of premium on interest |
— | — | (17 | ) | ||||||||
| Amortization of debt discount |
68 | 138 | 79 | |||||||||
| Changes in deferred tax liability |
178 | (178 | ) | — | ||||||||
| Changes in operating assets and liabilities: |
||||||||||||
| Accounts receivable |
(312 | ) | 3,591 | (12,791 | ) | |||||||
| Inventory |
(4,146 | ) | (913 | ) | (14,640 | ) | ||||||
| Prepaid expenses and other current assets |
177 | (589 | ) | (1,491 | ) | |||||||
| Other assets |
15 | 78 | (104 | ) | ||||||||
| Accounts payable |
(2,841 | ) | 6,472 | 2,652 | ||||||||
| Accrued and other current liabilities |
1,751 | 1,789 | 2,754 | |||||||||
| Customer deposits |
— | — | 7,087 | |||||||||
| Deferred nonrecurring engineering and grants |
(2,103 | ) | 3,601 | (1,858 | ) | |||||||
| Deferred margin |
5,196 | (3,736 | ) | (1,288 | ) | |||||||
| Income tax payable |
79 | 459 | 84 | |||||||||
| Other liabilities |
571 | 1,063 | 1,556 | |||||||||
|
|
|
|
|
|
|
|||||||
| Net cash used in operating activities |
(15,143 | ) | (4,646 | ) | (19,155 | ) | ||||||
|
|
|
|
|
|
|
|||||||
| Cash flows from investing activities: |
||||||||||||
| Restricted cash |
83 | 27 | 26 | |||||||||
| Purchase of property and equipment |
(94 | ) | (173 | ) | (1,104 | ) | ||||||
| Proceeds from asset disposal |
— | — | 35 | |||||||||
|
|
|
|
|
|
|
|||||||
| Net cash used in investing activities |
(11 | ) | (146 | ) | (1,043 | ) | ||||||
|
|
|
|
|
|
|
|||||||
| Cash flows from financing activities: |
||||||||||||
| Proceeds from: |
||||||||||||
| Issuance of convertible notes payable |
6,500 | — | 20,600 | |||||||||
| Issuance of convertible notes payable to a related party |
— | — | 1,000 | |||||||||
| Bank borrowings |
6,859 | — | — | |||||||||
| Issuance of notes to a related party |
882 | 952 | — | |||||||||
| Repayment of: |
||||||||||||
| Bank borrowings |
(1,687 | ) | (565 | ) | (1,143 | ) | ||||||
| Notes to a related party |
(278 | ) | (26 | ) | (2,986 | ) | ||||||
| Proceeds from exercise of stock options |
71 | 163 | 393 | |||||||||
| Payments of costs related to initial public offering |
— | — | (23 | ) | ||||||||
| Proceeds from exercise of warrants |
— | — | 16,651 | |||||||||
| Proceeds from issuance of Series F redeemable convertible preferred stock, net of issuance costs |
4,930 | — | — | |||||||||
|
|
|
|
|
|
|
|||||||
| Net cash provided by financing activities |
17,277 | 524 | 34,492 | |||||||||
|
|
|
|
|
|
|
|||||||
| Effect of exchange rate changes in cash and cash equivalents |
(130 | ) | 25 | 5 | ||||||||
| Net increase (decrease) in cash and cash equivalents |
1,993 | (4,243 | ) | 14,299 | ||||||||
| Cash and cash equivalents—beginning of period |
6,178 | 8,171 | 3,928 | |||||||||
|
|
|
|
|
|
|
|||||||
| Cash and cash equivalents—end of period |
$ | 8,171 | $ | 3,928 | $ | 18,227 | ||||||
|
|
|
|
|
|
|
|||||||
| Supplemental disclosures of cash flow information: |
||||||||||||
| Cash paid for interest |
$ | 413 | $ | 790 | $ | 1,446 | ||||||
|
|
|
|
|
|
|
|||||||
| Cash paid for income taxes |
$ | 302 | $ | 114 | $ | 10 | ||||||
|
|
|
|
|
|
|
|||||||
| Noncash investing and financing activities: |
||||||||||||
| Accretion of Series C mandatorily redeemable convertible preferred stock to redemption amount |
$ | 3,582 | $ | 3,514 | $ | 3,514 | ||||||
|
|
|
|
|
|
|
|||||||
| Conversion of notes payable to Series F redeemable convertible preferred stock |
$ | 555 | $ | — | $ | — | ||||||
|
|
|
|
|
|
|
|||||||
| Purchase of equipment in accounts payable |
$ | 124 | $ | — | $ | 3 | ||||||
|
|
|
|
|
|
|
|||||||
The accompanying notes are an integral part of these consolidated financial statements.
F-6
Table of Contents
Notes to Consolidated Financial Statements
1. The Company and Summary of Significant Accounting Policies
Business
GCT Semiconductor, Inc. (the “Company” or “GCT”) is a fabless semiconductor company serving the global wireless semiconductor industry. The Company designs, develops and markets integrated circuits for the wireless semiconductor industry. GCT was originally incorporated in California on June 15, 1998 and was reincorporated in Delaware on February 21, 2001.
In June 2000, the Company incorporated a wholly-owned subsidiary, GCT Asia Pacific, Inc. (“GCT AP”) in Seoul, Korea. GCT AP was created to develop markets in the Asia Pacific region. In June 2000, the Company also acquired Advanced CoreTech, Inc. (“ACT”), a Korean corporation, mainly to enhance its research and development capacity for all product lines. Subsequently, the name of ACT was changed to GCT Research, Inc. (“GCT R&D”).
The Company’s operations to date have been funded primarily through the issuance of mandatorily redeemable convertible preferred stock, promissory notes and through a line of credit.
The Company’s consolidated financial statements have been prepared on a going-concern basis, which contemplates the realization of assets and the settlement of liabilities and commitments in the normal course of business. The Company has incurred substantial losses and negative cash flows since inception. For the year ended June 30, 2011, the Company incurred a net loss of $11.5 million and had an accumulated deficit of $192.7 million. As of June 30, 2011, the Company had outstanding debt aggregating $44.9 million. The Company’s ability to continue to meet its obligations and to achieve its intended business objectives is dependent upon, among other things, refinancing the debt obligations or raising additional capital in order to satisfy those obligations which are due during the twelve months ending June 30, 2012. There can be no assurance that sufficient debt or equity financing will be available at all or, if available, that such financing will be at terms and conditions acceptable to the Company. Should the Company fail to refinance the debt or raise additional capital, it may not be able to achieve its longer term business objectives and may face other serious adverse consequences. These circumstances raise substantial doubt about the Company’s ability to continue as a going concern beyond June 30, 2012. These financial statements do not include any adjustments that might result from the outcome of this uncertainty.
Basis of Presentation
The Company’s consolidated financial statements have been prepared in conformity with accounting principles generally accepted in the United States of America (“U.S. GAAP”) and include the accounts of GCT and its wholly-owned subsidiaries, GCT AP and GCT R&D. All significant intercompany transactions and balances have been eliminated during consolidation.
Use of Estimates
The preparation of the accompanying consolidated financial statements in conformity with U.S. GAAP requires management to make estimates and assumptions about future events. These estimates and the underlying assumptions affect the amounts of assets and liabilities reported, disclosures about contingent assets and liabilities and reported amounts of revenues and expenses. These judgments, estimates and assumptions are used for but not limited to: revenue recognition; allowance for doubtful accounts; warranty obligations; inventory obsolescence; the recoverability of long-lived assets; the determination of fair value of the Company’s common stock, stock options, redeemable convertible preferred stock warrants and foreign currency derivative financial instruments; and deferred income taxes including required valuation allowances. The Company bases its
F-7
Table of Contents
GCT Semiconductor, Inc.
Notes to Consolidated Financial Statements
estimates and judgments on historical experience and on various other assumptions that it believes are reasonable under the circumstances. However, actual results could differ from these estimates, and these differences may be material.
Unaudited Pro Forma Stockholders’ Deficit
The unaudited pro forma consolidated balance sheet as of June 30, 2011 has been prepared assuming (i) the automatic conversion of all outstanding shares of the Company’s preferred stock as of June 30, 2011 into an aggregate of 157,090,863 shares of common stock upon completion of a qualifying initial public offering; (ii) the issuance of shares of common stock to be issued as payment of all unpaid and accrued dividends to holders of the Company’s preferred stock based on an initial public offering price of $ per share and assuming the payment occurs on , 2011; (iii) the exercise of outstanding warrants to purchase 9,303,029 shares of Series F redeemable convertible preferred stock as of June 30, 2011, such exercise includes the assumed exercise, on a net exercise basis where allowed, of the outstanding warrants to purchase 7,636,363 shares of our preferred stock, immediately prior to this offering, and the concomitant conversion of the shares of preferred stock acquired upon exercise into shares of common stock upon completion of a qualifying initial public offering based on an initial public offering price of $ per share; and (iv) the resulting reclassification of the liabilities related to the redeemable convertible preferred stock warrants, foreign currency derivative instruments and convertible notes to additional paid-in capital and the settlement of the liabilities related to our foreign currency derivative instruments.
Cash and Cash Equivalents
The Company considers all highly liquid investments purchased with a maturity of three months or less to be cash equivalents. The Company deposits its cash primarily in checking and money market accounts with high quality financial institutions.
Fair Value of Financial Instruments
Carrying amounts of certain of the Company’s financial instruments, including cash and cash equivalents, accounts receivable, accounts payable and accrued liabilities, approximate fair values due to their short maturities. The carrying amount of the liabilities for the redeemable convertible preferred stock warrants and foreign currency derivative instruments represent their fair value.
Fair value is defined as the exchange price that would be received for an asset or an exit price paid to transfer a liability in the principal or most advantageous market for the asset or liability in an orderly transaction between market participants on the measurement date. Valuation techniques used to measure fair value must maximize the use of observable inputs and minimize the use of unobservable inputs. The fair value hierarchy defines a three-level valuation hierarchy for disclosure of fair value measurements as follows:
Level I—Unadjusted quoted prices in active markets for identical assets or liabilities;
Level II—Inputs other than quoted prices included within Level I that are observable, unadjusted quoted prices in markets that are not active, or other inputs that are observable or can be corroborated by observable market data for substantially the full term of the related assets or liabilities; and
Level III—Unobservable inputs that are supported by little or no market activity for the related assets or liabilities.
F-8
Table of Contents
GCT Semiconductor, Inc.
Notes to Consolidated Financial Statements
The categorization of a financial instrument within the valuation hierarchy is based upon the lowest level of input that is significant to the fair value measurement.
The Company’s financial instruments consist of Level I assets and Level III liabilities. Level I instruments include highly liquid money market funds. Level III instruments consist of the redeemable convertible preferred stock warrant liabilities and foreign currency derivative instruments embedded within certain of the Company’s convertible notes held by Korean investors. The fair values of the outstanding redeemable convertible preferred stock warrants and foreign currency derivative instruments are measured using the Black-Scholes option-pricing model. Inputs used to determine estimated fair value of the warrant liabilities include the estimated fair value of the underlying stock at the valuation date, the estimated term of the warrants, risk-free interest rates, expected dividends and the expected volatility of the underlying stock. Inputs used to determine estimated fair value of the foreign currency derivative instruments include the estimated fair value of the underlying preferred stock and the related exchange rates at the valuation date, risk-free interest rates and the expected volatility of the underlying stock.
Risk and Uncertainties
The Company is subject to certain risks and uncertainties and believes changes in any of the following areas could have a material adverse effect on the Company’s future financial position or results of operations or cash flows: new product development, including market receptivity, litigation or claims against the Company based on intellectual property, patent, product regulatory or other factors, competition from other products, general economic conditions, the ability to attract and retain qualified employees and ultimately to sustain profitable operations.
The semiconductor industry is characterized by rapid technological change, competition, competitive pricing pressures and cyclical market patterns. The Company’s financial results are affected by a wide variety of factors, such as general economic conditions specific to the semiconductor industry and the Company’s particular market, the timely implementation of new products, new manufacturing process technologies and the ability to safeguard patents and intellectual property in a rapidly evolving market. In addition, the semiconductor market has historically been cyclical and subject to significant economic downturns. As a result, the Company may experience significant period-to-period fluctuations in operating results due to the factors mentioned above or other factors.
The Company’s revenue may be impacted by its ability to obtain adequate wafer supplies from foundries and backend production capacity from the Company’s test and assembly subcontractors. The foundries with which the Company currently has arrangements may not be willing or able to satisfy all of the Company’s manufacturing requirements on a timely basis and/or at favorable prices. The Company is also subject to the risks of service disruptions, raw material shortages and price increases by its foundries. Such disruptions, shortages and price increases could harm the Company’s operating results.
Concentration of Credit Risk
Financial instruments that potentially subject the Company to concentration of credit risk consist of cash and cash equivalents and accounts receivable. The Company maintains its cash and cash equivalents primarily with one financial institution located in the United States and another financial institution located in Korea where amounts deposited may exceed FDIC limits. The Company performs regular evaluations of the deposits as well as the relative credit standing of these financial institutions.
F-9
Table of Contents
GCT Semiconductor, Inc.
Notes to Consolidated Financial Statements
The Company’s accounts receivable are primarily derived from revenue earned from customers located in the United States, Korea, China, Japan and Taiwan. The Company performs ongoing credit evaluations of its customers’ financial condition and generally does not require collateral from its customers.
Some of the components used in the Company’s products are purchased from a limited number of sources. The loss of any of these suppliers may cause the Company to incur additional costs to transition these relationships, result in delays in the delivery of its products or cause the Company to carry excess or obsolete inventory.
GCT is a fabless company and relies on third parties for all of its manufacturing operations, including wafer fabrication, assembly, testing, warehousing, and shipping and logistics. The Company relies on UMC Group (USA) (UMC), to manufacture substantially all of the wafers for the WiMAX products, and Samsung Semiconductor System LSI Division (Samsung LSI) for substantially all of the wafers for the LTE products. The Company used third-party vendors to assemble, package and test the products. The Company primarily uses the services of ASE Test Limited (ASE) and STATS ChipPAC Ltd. for assembly, and ASE, Giga Solution Tech Co., Ltd. (Giga Solution), Hana Micron Co., Ltd., and United Test and Assembly Center Ltd. (UTAC) for testing. The Company depends on these third-party vendors to supply services and material of a requested quantity in a timely manner that meets the Company’s standards for yield, cost and manufacturing quality. The Company does not have long-term supply agreements with its third-party vendors other than a framework agreement with UMC and minimum capacity agreements with UTAC and Giga Solution. If one or more of these vendors terminates its relationship with the Company, or if the Company encounters any problems with its manufacturing supply chain, it could adversely impact the Company’s ability to ship products to its customers on time and in the quantity required, which in turn could cause an unanticipated decline in sales and possibly damage customer relationships.
Restricted Cash
Restricted cash consists of funds deposited in money markets and held for government sponsored projects in Korea and will be released as the Company utilizes this cash for these projects. As the Company pays for expenditures related to these agreements, the Company will continue to reduce the balance of the restricted cash accordingly. As of June 30, 2011, the Company had fully utilized its restricted cash.
Accounts Receivable and Allowance for Doubtful Accounts
Trade accounts receivable are recorded at invoiced amounts, net of allowances for doubtful accounts if applicable, and do not bear interest.
The allowance for doubtful accounts is based on the Company’s assessment of the collectability of its customer accounts. The Company reviews the allowance by considering certain factors such as historical experience, industry data, credit quality, age of balances and current economic conditions that may affect a customers’ ability to pay. The Company determined that an allowance for doubtful accounts was not necessary as of June 30, 2010 or 2011.
Inventory
Inventories are stated at the lower of cost or market value. Cost is determined by actual cost on a first-in, first-out basis. The Company’s inventories are concentrated in high technology parts and components that may be specialized in nature or subject to rapid technological obsolescence. These factors, including age of inventory on hand and that the inventory may be returned from distributors, historical sales levels, estimated future demand
F-10
Table of Contents
GCT Semiconductor, Inc.
Notes to Consolidated Financial Statements
within the next six months, inventory commitments or potential product revisions, are considered in estimating reserves required to report inventories at the lower of cost or market. During the years ended June 30, 2009, 2010 and 2011, the Company recorded write-downs for excess and obsolete inventories of $5.1 million, $3.1 million and $1.4 million in cost of revenues.
Property and Equipment
Property and equipment are recorded at cost less accumulated depreciation and amortization. Depreciation is recognized on a straight-line basis over the estimated useful lives of the assets, generally three to seven years. Leasehold improvements are amortized over the shorter of the remaining lease term or the estimated useful life of the assets. Maintenance and repairs that do not extend the life or improve an asset are expensed in the period incurred.
Amortization expense of assets acquired through capital leases is included in depreciation and amortization expense in the consolidated statement of operations.
Impairment of Long-Lived Assets
The Company evaluates long-lived assets, such as property and equipment, for impairment whenever events or changes in circumstances indicate that the carrying value of an asset may not be recoverable. The Company recognizes an impairment loss when estimated undiscounted future cash flows expected to result from the use of the assets plus net proceeds expected to result from the disposition of the assets, if any, are less than the carrying value of the assets. When an impairment is identified, the Company reduces the carrying amount of the asset to its estimated fair value based on a discounted cash flow basis or, when available and appropriate, to comparable market values. As of June 30, 2010 and 2011, the Company had not written down any of its long-lived assets as a result of impairment.
Revenue Recognition
The Company’s revenue is generated by sales of semiconductor products. The Company recognizes revenue when persuasive evidence of an arrangement with a customer exists, delivery has occurred, the fee is considered to be fixed or determinable and collectability of the fee is reasonably assured.
The Company’s revenue is generated through two channels, a direct sales force and distributors.
Sales to direct customers and some distributors are made primarily pursuant to standard purchase orders for delivery of products and are recognized upon shipment of the product.
For sales to distributors with agreements allowing for or having a history of returns or credits under certain circumstances, or where collectability is not reasonably assured, the Company defers recognition of revenue and the related costs until the distributor has resold the products to their end customer. The Company’s agreements with its significant distributors generally transfer title to inventory upon shipment to the distributors. The Company evaluates each distributor relationship to determine whether the price to the distributor is substantially fixed or determinable at the date of sale or whether it has a history of providing credits to reduce the distributors price prior to the distributor resale of the product, whether the distributor is obligated to pay or whether there is an implicit expectation that the distributor is not obligated to pay until it resells the product, whether the distributor has economic substance sufficient to carry the inventory risk prior to resale of product, whether there are significant obligations for future performance to bring about the resale of the product and
F-11
Table of Contents
GCT Semiconductor, Inc.
Notes to Consolidated Financial Statements
whether the returns can be reasonably estimated. Where revenue is deferred upon shipment to a distributor the Company relies upon point of sale reports from its distributors to record revenue. Point of sale reports provide the date of delivery by distributors to the end customers. At the time of shipment to distributors, the Company records a trade receivable for the selling price as there is a legally enforceable obligation of the distributor to pay for the product delivered, reduces inventory for the carrying value of goods shipped, and records the net of these amounts as deferred margin on the consolidated balance sheet. This deferred margin represents the gross margin on the initial sales to the distributor; however, the amount of gross margin recognized in future consolidated statements of operations may be less than the originally recorded deferred margin as a result of credits which are not estimable at the time of shipment due to the variability of negotiated prices. The Company does not reduce deferred margin by estimated credits, instead such amounts are recorded when incurred. The recognition of revenue from deferred margin on shipments to distributors is ultimately contingent upon delivery of product to the distributor’s customer, at which point persuasive evidence of an arrangement exists, delivery has occurred, the price is fixed or determinable, and collectability is reasonably assured.
In 2009, the Financial Accounting Standards Board (“FASB”) issued guidance related to the recognition of revenue related to multiple-element arrangements. This guidance provides amendments to the accounting standards for revenue recognition to:
| • | provide updated guidance on whether multiple deliverables exist, how the deliverables in an arrangement should be separated, and how the consideration should be allocated; |
| • | require an entity to allocate revenue in an arrangement using the best estimate of selling prices (ESP) of deliverables if the Company does not have vendor-specific objective evidence of selling price (VSOE) or third-party evidence of selling price (TPE); and |
| • | eliminate the use of the residual method and require an entity to allocate revenue using the relative selling price method. |
For the limited multi-element arrangements entered into after June 30, 2010, the Company allocated revenue to all deliverables based on their relative selling prices. The adoption of this guidance did not have significant impact on the Company’s consolidated financial condition, operating revenue, results of operations or cash flows for the year ended June 30, 2011.
Concentration of Revenues and Accounts Receivable
Significant customers are those which represent more than 10% of the Company’s total revenues or accounts receivable. For each significant customer, revenues as a percentage of total revenue and accounts receivable as a percentage of total accounts receivable are as follows:
| Revenues | Accounts Receivable | |||||||||||||||||||
| Years Ended June 30, | As of June 30, | |||||||||||||||||||
| Customers |
2009 | 2010 | 2011 | 2010 | 2011 | |||||||||||||||
| Customer A |
11 | % | 42 | % | 19 | % | 46 | % | 10 | % | ||||||||||
| Customer B |
14 | % | 19 | % | * | * | * | |||||||||||||
| Customer C |
29 | % | * | * | * | * | ||||||||||||||
| Customer D |
* | * | 48 | % | 12 | % | 53 | % | ||||||||||||
| Customer E |
* | * | * | 13 | % | * | ||||||||||||||
| Customer F |
* | * | * | 13 | % | * | ||||||||||||||
| Customer G |
* | * | * | * | 20 | % | ||||||||||||||
| * | less than 10% |
F-12
Table of Contents
GCT Semiconductor, Inc.
Notes to Consolidated Financial Statements
Cost of Revenues
Cost of revenues consists of direct and indirect costs related to the manufacture of the Company’s products. Direct costs include cost of wafers and costs relating to assembly and testing performed by third-party contract manufacturers. Indirect costs consist of allocated overhead for employee benefits and facility costs and the amortization of the Company’s production mask sets.
Shipping and Handling Costs
Shipping and handling costs incurred for inventory purchases and product shipments are recorded in cost of revenues in the consolidated statements of operations.
Research and Development
Research and development expenses, including direct and allocated expenses, are expensed as incurred. Research and development costs include salaries of technical staff, consultant costs, stock-based compensation, prototype expenses, mask set costs that are not expected to be used in production manufacturing, allocated facilities costs and depreciation of equipment used in research and development.
Amounts received by the Company in connection with government grants and work performed under development contracts (nonrecurring engineering or “NRE”) prior to completion of certain milestones, such as the completion of engineering samples built to prescribed specification or performance capabilities, interoperability testing or product acceptance by the customer, are deferred and recognized as an offset to the research and development expense upon achievement and acceptance of the specified milestones. The Company determined that the milestones were substantive because they were determined to be reasonable, solely related to past performance and commensurate with either the Company’s effort required to achieve the milestone or the enhanced value of the delivered item(s) that resulted from achievement of the milestones.
Amounts received from development contracts were recorded as an offset to research and development expenses. These amounts are not recorded as revenue because they are not part of the Company’s ongoing central business activities. These arrangements are motivated primarily by the opportunity to engage customers and at the same time, jointly progress the Company’s own research and development activities with the associated development compensation. All amounts received under the development contracts were recognized as an offset to research and development expenses, as the Company was performing development activities on behalf of other parties, were being compensated for these activities and could not practically separate the efforts or costs related to these activities from its own research and development. During the years ended June 30, 2009, 2010 and 2011, the Company recognized $5.3 million, $1.1 million and $7.7 million related to these NRE contracts and government grants as a reduction to research and development expenses.
F-13
Table of Contents
GCT Semiconductor, Inc.
Notes to Consolidated Financial Statements
Warranty
The Company generally provides warranties on its products for 12 months and provides for the estimated cost of product warranties at the time the revenue is recognized. The Company regularly monitors product returns and maintains a reserve for warranty expenses based upon its historical experience and any specifically identified failures. As of June 30, 2010 and 2011, the Company’s warranty accruals consisted of the following (in thousands):
| As of June 30, | ||||||||
| 2010 | 2011 | |||||||
| Warranty—beginning of period |
$ | 124 | $ | 173 | ||||
| Warranties issued |
165 | 343 | ||||||
| Warranty settlements and adjustments |
(116 | ) | (168 | ) | ||||
|
|
|
|
|
|||||
| Warranty—end of period |
$ | 173 | $ | 348 | ||||
|
|
|
|
|
|||||
Stock-Based Compensation
Compensation costs related to employee stock options granted during the years ended June 30, 2009, 2010 and 2011 were based on the fair value of the options on the date of grant, net of estimated forfeitures. The Company determines the grant date fair value of the options using the Black-Scholes option-pricing model and the related stock-based compensation expense is generally recognized on a straight-line basis over the period in which an employee is required to provide service in exchange for the options, which generally equals the vesting period.
The Company accounts for stock options issued to nonemployees based on the fair value of the options determined using the Black-Scholes option-pricing model. The fair value of stock options granted to nonemployees is remeasured each reporting period as the stock options vest and the resulting change in value, if any, is recognized in the Company’s consolidated statement of operations during the period the related services are rendered.
Income Taxes
The Company uses the asset and liability method of accounting for income taxes. Deferred tax assets and liabilities are recognized for the estimated future tax consequences attributable to differences between the consolidated financial statement carrying amounts of existing assets and liabilities and their respective tax bases. Deferred tax assets and liabilities are measured using enacted tax rates expected to apply to taxable income in the years in which those temporary differences are expected to be recovered or settled. Deferred tax expense or benefit is the result of changes in the deferred tax assets and liabilities. Valuation allowances are established when necessary to reduce deferred tax assets where, based upon the available evidence, management concludes that it is more likely than not that the deferred tax assets will not be realized.
The Company records a liability for the uncertain tax positions taken or expected to be taken on the Company’s tax return when it is more likely than not that the tax position might be challenged despite the Company’s belief that the tax return positions are fully supportable, and additional taxes will be due as a result. To the extent that the assessment of such tax positions changes, for example, based on the outcome of a tax audit, the change in estimate is recorded in the period in which the determination is made. The provision for income taxes includes the impact of provisions for uncertain tax positions. Interest and penalties related to unrecognized tax benefits are included within the provision for income taxes.
F-14
Table of Contents
GCT Semiconductor, Inc.
Notes to Consolidated Financial Statements
Foreign Currency Translation
The Company’s foreign subsidiaries located in Korea use the local currency, or Korean won (“KRW”), as their functional currencies. Financial statements of the foreign subsidiaries are translated into U.S. dollars at the end-of-period exchange rates except for capital stock issued, capital accounts and accumulated deficit which are translated at historical exchange rates for purposes of consolidation. Revenues and expenses are translated using average exchange rates prevailing during the period. Translation adjustments are accumulated as other comprehensive income (loss) within stockholders’ deficit. Gains and losses resulting from transactions denominated in a currency other than the functional currency are included in other income (expense), net in the consolidated statements of operations. The Company recognized foreign currency exchange gains of $105,000 during the year ended June 30, 2009 and foreign currency exchange losses of $1.2 million and $2.6 million during the years ended June 30, 2010 and 2011.
Redeemable Convertible Preferred Stock Warrant Liability
The Company’s freestanding warrants to purchase contingently redeemable stock, such as the Company’s redeemable convertible preferred stock, are classified as liabilities on the consolidated balance sheets at fair value upon issuance because these warrants may obligate the Company to transfer assets to the holders at a future date under certain circumstances, such as a change in control. The warrants are subject to remeasurement to fair value at each balance sheet date, and any change in fair value is recognized in the consolidated statements of operations as other income (expense), net. The Company will continue to adjust the liability for changes in fair value until the earlier of the exercise or expiration of the warrants, the conversion of the underlying shares of preferred stock, or the completion of a liquidation event, including the completion of an IPO, at which time all unexercised warrants will expire. Upon exercise, the related warrant liability will be reclassified to additional paid-in capital.
Customer Deposits
During the year ended June 30, 2011, the Company entered into an agreement with a customer in which the customer paid $7.1 million on outstanding purchase orders for Company products in advance of the related product shipments. As of June 30, 2011, the entire customer deposit was still outstanding as none of the related products had been shipped by the balance sheet date. The advance is therefore a refundable customer deposit which is included within current liabilities on the consolidated balance sheet as of June 30, 2011. As the products purchased under these purchase orders are shipped, the customer deposit will be reduced accordingly. The Company did not receive any other significant customer deposits during the years ended June 30, 2009, 2010 or 2011.
Segment Information
The Company has one business activity, which is designing, developing and marketing integrated circuits for the wireless semiconductor industry, and operates in one operating segment. The Company’s chief operating decisionmaker, its chief executive officer, reviews its operating results on an aggregate basis for purposes of allocating resources and evaluating financial performance. Also, the Company does not have segment managers as the Company manages its operations as a single operating segment.
Deferred Offering Costs
Deferred offering costs, consisting of legal, accounting and filing fees relating to the IPO, are capitalized. The deferred offering costs will be offset against IPO proceeds upon the effectiveness of the offering. In the event the offering is terminated, deferred offering costs will be expensed. As of June 30, 2011, the Company
F-15
Table of Contents
GCT Semiconductor, Inc.
Notes to Consolidated Financial Statements
capitalized $865,000 of deferred offering costs in other current assets on the consolidated balance sheet. No amounts were deferred as of June 30, 2010.
Comprehensive Income (Loss)
Comprehensive income (loss) includes all changes within equity that are not the result of transactions with stockholders. Accumulated other comprehensive income (loss) includes foreign currency translation adjustments arising from the consolidation of the Company’s foreign subsidiaries. This information is provided in the Company’s consolidated statements of mandatorily redeemable convertible preferred stock and stockholders’ deficit.
Net Loss per Share
The Company’s basic net loss per share attributable to common stockholders is calculated by dividing the net loss attributable to common stockholders by the weighted average number of shares of common stock outstanding for the period. The net loss attributable to common stockholders was not allocated to the redeemable convertible preferred stock under the two-class method as the redeemable convertible preferred stock do not have a contractual obligation to share in the net loss attributable to common stockholders. The diluted net loss per share attributable to common stockholders is computed by giving effect to all potential common stock equivalents outstanding for the period determined using the treasury stock method. For purposes of this calculation, mandatorily redeemable convertible preferred stock, stock options, warrants to purchase redeemable convertible preferred stock and warrants to purchase common stock are considered to be common stock equivalents but have been excluded from the calculation of diluted net loss per share attributable to common stockholders as their effect is antidilutive.
Unaudited Pro Forma Net Loss per Share
Pro forma basic and diluted net loss per share attributable to common stockholders have been computed to give effect to the assumed conversion of the mandatorily redeemable convertible preferred stock, including dividends accrued for Series C, D, E and F through June 30, 2010 assuming $ , the mid-point of the price range as set forth in the cover page of this prospectus. Also, the numerator in the pro forma basic and diluted net loss per share calculation has been adjusted to reverse gains and losses resulting from remeasurements of the liabilities for the redeemable convertible preferred stock warrants and the foreign currency derivative instruments as these amounts will be reclassified to additional paid-in capital upon a qualified initial public offering; to reverse the accretion of Series C mandatorily redeemable convertible preferred stock carrying value to its redemption value; and to reverse the accrued cumulative dividends on the Series D, E and F redeemable convertible preferred stock in order to incorporate the assumed conversion of all series of outstanding mandatorily redeemable convertible preferred stock. The pro forma net loss per share does not include proceeds to be received from the assumed initial public offering nor does it include shares expected to be sold in the IPO or shares from the exercise of the warrants or conversion of convertible notes.
Derivative Financial Instruments
The Company carries Korean won based convertible notes which were issued in U.S. dollars with fixed exchange rate features that are considered to be embedded derivatives. The Company accounts for these derivative financial instruments initially at fair value on the date entered into and subsequently remeasures the instruments to fair value each period end. Changes in the fair value of derivative financial instruments are recognized in other income (expense), net in the consolidated statements of operations.
F-16
Table of Contents
GCT Semiconductor, Inc.
Notes to Consolidated Financial Statements
Out-of-Period Adjustments
In the year ended June 30, 2009, the Company recorded out-of-period adjustments which reduced research and development expenses by $1.1 million, reduced other income by $420,000, increased tax expense by $135,000, decreased amortization of debt discount by $33,000, increased the carrying value of convertible notes by $7,000 and increased mandatorily redeemable convertible preferred stock by $834,000 to correct for immaterial errors in the redeemable convertible preferred stock warrant fair value calculations due to the changes in dividend assumptions on the redeemable convertible preferred stock and deferred tax liability that were incorrectly recorded in previous periods. The correction of these adjustments resulted in a decrease to the Company’s net loss by $566,000 for the year ended June 30, 2009. The resulting adjustments were an accumulation of amounts that would have increased the net loss in the year ended June 30, 2006 and 2007 by $94,000 and $24,000, and would have reduced net loss in the year ended June 30, 2008 by $684,000. Management has assessed the impact of these adjustments and does not believe that these amounts were material, either individually or in the aggregate, to any prior period financial statements and the impact of correcting these errors in the year ended June 30, 2009 was not material to the financial statements for that year.
2. Fair Value of Financial Instruments
The Company measures and reports its cash equivalents, redeemable convertible preferred stock warrant liability and foreign currency derivative instruments at fair value on a recurring basis. The following table sets forth the fair value of the Company’s financial assets and liabilities by level within the fair value hierarchy (in thousands):
| As of June 30, 2010 | ||||||||||||||||
| Fair Value | Level I | Level II | Level III | |||||||||||||
| Assets |
||||||||||||||||
| Money market funds |
$ | 3,700 | $ | 3,700 | $ | — | $ | — | ||||||||
|
|
|
|
|
|
|
|
|
|||||||||
| Liabilities |
||||||||||||||||
| Redeemable convertible preferred stock warrant liability |
$ | 800 | $ | — | $ | — | $ | 800 | ||||||||
| Foreign currency derivative instruments |
82 | — | — | 82 | ||||||||||||
|
|
|
|
|
|
|
|
|
|||||||||
| Total |
$ | 882 | $ | — | $ | — | $ | 882 | ||||||||
|
|
|
|
|
|
|
|
|
|||||||||
| As of June 30, 2011 | ||||||||||||||||
| Fair Value | Level I | Level II | Level III | |||||||||||||
| Assets |
||||||||||||||||
| Money market funds |
$ | 16,715 | $ | 16,715 | $ | — | $ | — | ||||||||
|
|
|
|
|
|
|
|
|
|||||||||
| Liabilities |
||||||||||||||||
| Redeemable convertible preferred stock warrant liability |
$ | 4,063 | $ | — | $ | — | $ | 4,063 | ||||||||
| Foreign currency derivative instruments |
1,165 | — | — | 1,165 | ||||||||||||
|
|
|
|
|
|
|
|
|
|||||||||
| Total |
$ | 5,228 | $ | — | $ | — | $ | 5,228 | ||||||||
|
|
|
|
|
|
|
|
|
|||||||||
F-17
Table of Contents
GCT Semiconductor, Inc.
Notes to Consolidated Financial Statements
The following table sets forth a summary of the changes in the fair value of the Company’s Level III financial liabilities (in thousands):
| Years Ended June 30, | ||||||||||||
| 2009 | 2010 | 2011 | ||||||||||
| Fair value—beginning of period |
$ | 5,549 | $ | 1,088 | $ | 882 | ||||||
| Issuance of warrants |
927 | — | 591 | |||||||||
| Foreign currency derivatives embedded upon issuance of convertible notes |
80 | — | — | |||||||||
| Exercise of warrants |
— | — | (2,637 | ) | ||||||||
| Change in fair value of liability upon modification of warrants |
— | — | 1,066 | |||||||||
| Change in fair value of Level III financial liabilities |
(3,926 | ) | (206 | ) | 5,326 | |||||||
| Prior period adjustment on warrants |
(1,542 | ) | — | — | ||||||||
|
|
|
|
|
|
|
|||||||
| Fair value—end of period |
$ | 1,088 | $ | 882 | $ | 5,228 | ||||||
|
|
|
|
|
|
|
|||||||
The gains and losses from remeasurement of Level III financial liabilities are recorded through other income (expense), net in the consolidated statements of operations.
3. Balance Sheet Components
Inventory consists of the following (in thousands):
| As of June 30, | ||||||||
| 2010 | 2011 | |||||||
| Work-in-process |
$ | 1,460 | $ | 7,776 | ||||
| Finished goods |
543 | 7,462 | ||||||
|
|
|
|
|
|||||
| Inventory |
$ | 2,003 | $ | 15,238 | ||||
|
|
|
|
|
|||||
Prepaid expenses and other current assets consist of the following (in thousands):
| As of June 30, | ||||||||
| 2010 | 2011 | |||||||
| Prepaid licenses |
$ | 432 | $ | 1,021 | ||||
| Mask sets, net |
671 | 487 | ||||||
| Lease deposit |
367 | 417 | ||||||
| Deferred offering costs |
— | 865 | ||||||
| Other |
534 | 497 | ||||||
|
|
|
|
|
|||||
| Prepaid expenses and other current assets |
$ | 2,004 | $ | 3,287 | ||||
|
|
|
|
|
|||||
Property and equipment consist of the following (in thousands):
| As of June 30, | ||||||||
| 2010 | 2011 | |||||||
| Computer and other equipment |
$ | 9,444 | $ | 11,050 | ||||
| Furniture and fixtures |
598 | 647 | ||||||
| Leasehold improvements |
304 | 346 | ||||||
| Fixed assets in process |
— | 189 | ||||||
|
|
|
|
|
|||||
| Total property and equipment |
10,346 | 12,232 | ||||||
| Less accumulated depreciation and amortization |
9,933 | 11,195 | ||||||
|
|
|
|
|
|||||
| Property and equipment, net |
$ | 413 | $ | 1,037 | ||||
|
|
|
|
|
|||||
F-18
Table of Contents
GCT Semiconductor, Inc.
Notes to Consolidated Financial Statements
Depreciation and amortization expense was $961,000, $574,000 and $434,000 during the years ended June 30, 2009, 2010 and 2011. As of June 30, 2010 and 2011, the Company entered into an agreement with a supplier, the obligation of which is collateralized by all of the Company’s assets, excluding intellectual property and subordinated to the $7.5 million line of credit, and this security interest expires on May 6, 2014.
Accrued and other current liabilities consist of the following (in thousands):
| As of June 30, | ||||||||
| 2010 | 2011 | |||||||
| Accrued payables |
$ | 2,297 | $ | 1,720 | ||||
| Payroll and related expenses |
817 | 977 | ||||||
| Legal and accounting |
502 | 1,262 | ||||||
| Royalty and license fee |
208 | 434 | ||||||
| Foreign income tax payable |
3 | — | ||||||
| Product warranties |
173 | 348 | ||||||
| Foreign currency derivatives |
82 | 1,165 | ||||||
| Other |
698 | 349 | ||||||
|
|
|
|
|
|||||
| Accrued and other current liabilities |
$ | 4,780 | $ | 6,255 | ||||
|
|
|
|
|
|||||
Deferred nonrecurring engineering and government grants consists of the following (in thousands):
| As of June 30, | ||||||||
| 2010 | 2011 | |||||||
| NRE |
$ | 2,000 | $ | 2,300 | ||||
| Government grants |
2,174 | 16 | ||||||
|
|
|
|
|
|||||
| Deferred nonrecurring engineering and government grants |
$ | 4,174 | $ | 2,316 | ||||
|
|
|
|
|
|||||
During the years ended June 30, 2009, 2010 and 2011, the Company recognized $5.3 million, $1.1 million and $7.7 million related to these NRE contracts and government grants as a reduction to research and development expenses.
Deferred margin consists of the following (in thousands):
| As of June 30, | ||||||||
| 2010 | 2011 | |||||||
| Gross deferred revenue |
$ | 3,043 | $ | 1,557 | ||||
| Gross deferred cost of sales |
$ | 1,241 | $ | 1,044 | ||||
|
|
|
|
|
|||||
| Deferred Margin |
$ | 1,801 | $ | 513 | ||||
|
|
|
|
|
|||||
Other liabilities consist of the following (in thousands):
| As of June 30, | ||||||||
| 2010 | 2011 | |||||||
| Retirement benefits |
$ | 3,426 | $ | 4,304 | ||||
| Government grant payables |
132 | 95 | ||||||
| Capital lease liability, net of current portion |
— | 13 | ||||||
|
|
|
|
|
|||||
| Other liabilities |
$ | 3,558 | $ | 4,412 | ||||
|
|
|
|
|
|||||
F-19
Table of Contents
GCT Semiconductor, Inc.
Notes to Consolidated Financial Statements
4. Loans Receivable from Employees
Loans receivable from employees are full recourse scholarship loans issued to certain employees in Korea. As of June 30, 2010 and 2011, total loans receivable from employees were $89,000 (equivalent to KRW 107,870,000) and $48,000 (equivalent to KRW 52,119,000). The interest rate on these loans is adjusted according to the Korean tax service announced tax rate, which was 9.0% for the years ended June 30, 2009, 2010 and 2011. These loans will expire on various dates from July 2018 through May 2020. Annual installments, which include payments on the principal and accrued interest, are payable to the Company beginning three years after the date of issuance. As of June 30, 2010 and 2011, the Company recorded accrued interest of $14,000 (equivalent to KRW 16,662,000) and $2,000 (equivalent to KRW 2,367,000). Loans receivable from employees and the related accrued interest are recorded as other assets on the consolidated balance sheets.
5. Debt
The Company’s debt consists of the following (in thousands):
| As of June 30, | ||||||||
| 2010 | 2011 | |||||||
| Bank borrowings |
$ | 12,117 | $ | 12,072 | ||||
| Notes payable to a related party |
4,004 | 1,475 | ||||||
| Convertible notes payable—related party |
— | 1,038 | ||||||
| Convertible notes payable |
7,671 | 30,357 | ||||||
|
|
|
|
|
|||||
| 23,792 | 44,942 | |||||||
| Less current portion |
6,095 | 42,439 | ||||||
|
|
|
|
|
|||||
| Debt, net of current portion |
$ | 17,697 | $ | 2,503 | ||||
|
|
|
|
|
|||||
Bank Borrowings
Summarized in the table below are the Company’s outstanding bank borrowings (in thousands):
| As of June 30, | ||||||||
| 2010 | 2011 | |||||||
| Line of credit |
$ | 2,940 | $ | 2,940 | ||||
| Korean Bank Loan 1 |
777 | 784 | ||||||
| Korean Bank Loan 2 |
964 | 464 | ||||||
| Korean Bank Loan 3 |
3,305 | 3,710 | ||||||
| Korean Bank Loan 4 |
4,131 | 4,174 | ||||||
|
|
|
|
|
|||||
| 12,117 | 12,072 | |||||||
| Less current portion |
3,491 | 12,072 | ||||||
|
|
|
|
|
|||||
| Bank borrowings, net of current portion |
$ | 8,626 | $ | — | ||||
|
|
|
|
|
|||||
During 2003, the Company entered into an agreement with a financial institution that provides for a revolving line of credit for up to $7.5 million of borrowings, which agreement was amended and restated as of April 4, 2011. Borrowings under the line of credit are collateralized by all of the Company’s assets, excluding intellectual property. The availability of borrowings under the loan agreement is subject to certain borrowing base limitations around the Company’s outstanding accounts receivable. As of June 30, 2010, borrowings under the line of credit carried an interest rate of 1.75% per annum plus a daily adjusted LIBOR rate. The interest rate
F-20
Table of Contents
GCT Semiconductor, Inc.
Notes to Consolidated Financial Statements
in effect as of June 30, 2010 was 2.1%. In April 2011, the interest rate was amended to 1.0% per annum over the lender’s prime rate; provided that such prime rate shall not be less than the daily adjusted LIBOR rate, plus 2.5% per annum. The interest rate in effect as of June 30, 2011 was 4.3%. Revolving loans under the loan agreement may be borrowed, repaid and reborrowed until July 3, 2012, at which time all amounts borrowed under the loan agreement must be repaid. The line of credit is subject to an annual nonrefundable fee of $15,000 due in July of each year until the facility is terminated. As of June 30, 2010 and 2011, the Company entered into an agreement with a supplier, the obligation of which is collateralized by all of the Company’s assets, excluding intellectual property and subordinated to the $7.5 million line of credit, and this security interest expires on May 6, 2014.
Outstanding borrowings under the line of credit were $2.9 million as of June 30, 2010 and June 30, 2011. Also, the Company had $4.5 million available for future borrowings as of June 30, 2011 based on the borrowing base in effect at that time.
The loan agreement includes certain financial covenants, among others, relating to profitability and minimum liquidity coverage, and certain affirmative covenants, among others, including the delivery of audited financial statements to the lender. The Company failed to comply with the profitability covenant for the quarters ending March 2011 and June 2011 and to deliver its fiscal year 2009 audited financial statements within the time period set forth in the loan agreement. The lender granted a waiver for each of these events of default arising from the Company’s failure to comply with such covenants. Therefore, the Company is not in breach of any covenants in connection with its line of credit.
In February 2007, the Company entered into a term loan agreement with a Korean Bank in the amount of KRW 1,000,000,000 (“Korean Bank Loan 1”). The loan agreement, which was originally due in December 2009 but was subsequently extended to November 2011, is subject to monthly interest-only payments and carries a fixed interest rate of 16.8% per annum. The loan is guaranteed by the Company’s chief executive officer.
In March 2007, the Company entered into a loan facility with a Korean Bank in the amount of KRW 2,000,000,000 (“Korean Bank Loan 2”). The loan agreement, which is due in March 2012, is subject to quarterly payments of KRW 166.6 million and carries monthly variable interest rates based on Public Capital Management Fund lending rate in Korea less 0.5%. The interest rate in effect as of June 30, 2011 was 2.75%. The loan is guaranteed by the Korean Government Technology Credit Guarantee Fund.
In April 2009, the Company entered into a term loan agreement with a Korean Bank in the amount of KRW 4,000,000,000 (“Korean Bank Loan 3”). The loan agreement, which is due in April 2012, is subject to monthly interest-only payments and carries a fixed interest rate of 6.4% per annum. The loan is guaranteed by the Korea Credit Guarantee Fund.
In June 2009, the Company entered into a term loan agreement with a Korean Bank in the amount of KRW 5,000,000,000 (“Korean Bank Loan 4”). The loan agreement, which is due in October 2011, is subject to monthly interest-only payments and carries a fixed interest rate of 9.9% per annum. The loan is guaranteed by the Company’s chief executive officer.
F-21
Table of Contents
GCT Semiconductor, Inc.
Notes to Consolidated Financial Statements
Notes Payable—Related Party
Summarized in the table below are the Company’s outstanding notes payable to the Company’s chief executive officer (in thousands):
| As of June 30, | ||||||||
| 2010 | 2011 | |||||||
| Promissory Note 1 to CEO |
$ | 992 | $ | — | ||||
| Promissory Note 2 to CEO |
1,400 | 1,475 | ||||||
| Promissory Note 3 to CEO |
719 | — | ||||||
| Promissory Note 4 to CEO |
675 | — | ||||||
| Promissory Note 5 to CEO |
66 | — | ||||||
| Advance from CEO |
152 | — | ||||||
|
|
|
|
|
|||||
| 4,004 | 1,475 | |||||||
| Less current portion |
2,604 | — | ||||||
|
|
|
|
|
|||||
| Notes payable—related party, net of current portion |
$ | 1,400 | $ | 1,475 | ||||
|
|
|
|
|
|||||
In April 2005, the Company entered into a promissory note with the Company’s chief executive officer in which the Company borrowed KRW 987,200,000 (“Promissory Note 1”). The promissory note was originally due in October 2009 but was subsequently extended to April 2011. The loan carries a fixed interest rate of 5.5% per annum and principal and interest are due in full upon maturity. The Company paid this note in April 2011.
In December 2003, the Company entered into a promissory note with the Company’s chief executive officer in which the Company borrowed $1.0 million (“Promissory Note 2”). The promissory note will mature when the Company begins to generate positive monthly cash flows and has at least $10.0 million in available cash. Positive cash flows for purposes of this promissory note are defined as the cash flows from operating activities less any cash flows from investing activities. The promissory note carries a fixed interest rate of 7.5% per annum.
In September 2008, the Company entered into a promissory note with the Company’s chief executive officer in which the Company borrowed KRW 750,000,000 (“Promissory Note 3”). The promissory note was originally due in March 2009 but was subsequently extended to May 2011. The loan carries a fixed interest rate of 9.0% per annum and principal and interest are due in full upon maturity. The Company paid this note in May 2011.
In December 2009, the Company entered into a promissory note with the Company’s chief executive officer in which the Company borrowed KRW 813,000,000 (“Promissory Note 4”). The promissory note was originally due in January 2010 but was subsequently extended to March 2011 and carried a fixed interest rate of 9.8% per annum. The Company paid the note in March 2011.
In December 2009, the Company entered into a promissory note with the Company’s chief executive officer in which the Company borrowed KRW 80,000,000 (“Promissory Note 5”). The promissory note was originally due in January 2010 but was subsequently extended to December 2010 and carried a fixed interest rate of 9.8% per annum. The Company paid the note in December 2010.
During the year ended June 30, 2010, the Company’s chief executive officer made temporary advances to the Company in the amount of KRW 213,700,000 (“Advance from CEO”). These advances did not bear any interest or have a set maturity date upon issuance; however, these advances were repaid by the Company with a payment of KRW 30,000,000 in January 2010 while the remainder was paid in July and August 2010.
F-22
Table of Contents
GCT Semiconductor, Inc.
Notes to Consolidated Financial Statements
Schedule of Debt Payments on Bank Borrowings and Notes Payable to a Related Party
As of June 30, 2011, the future principal payments on the bank borrowings and notes payable to a related party were as follows (in thousands):
| Years Ending June 30: |
Amounts | |||
| 2012 |
$ | 12,072 | ||
| 2013 |
— | |||
| 2014 |
— | |||
| 2015 |
— | |||
| 2016 |
— | |||
| No fixed maturity |
1,000 | |||
|
|
|
|||
| 13,072 | ||||
| Less current portion |
12,072 | |||
|
|
|
|||
| Noncurrent portion |
$ | 1,000 | ||
|
|
|
|||
Convertible Notes Payable
As of June 30, 2010 and 2011, the Company’s outstanding convertible promissory notes amounted to $7.7 million and $31.4 million.
In December 2007, the Company issued convertible promissory notes in the amount of $533,000 to five Korean investors. The notes carried an interest of 8.0% per annum on the principal and unpaid interest and had an original maturity date of June 30, 2008. In conjunction with issuance of these promissory notes, the Company issued warrants to purchase an aggregate of 111,050 shares of Series F redeemable convertible preferred stock with an exercise price of $1.20 per share and an expiration date of May 31, 2009. The fair value of the warrants on the date of issuance was $43,000, as determined using the Black-Scholes option-pricing model and was recorded as a discount to the related note payable that was to be amortized to interest expense over the term of the debt. In July 2008, these notes and accrued interest in the amount of $555,000 were converted into 462,995 shares of Series F redeemable convertible preferred stock. The Company recognized interest expense related to amortization of the discount of $15,000 during the year ended June 30, 2008.
In December 2008, the Company issued convertible promissory notes in the amount of $1.5 million (equivalent to KRW 2,035,500,000) to an investor. The notes carry an interest rate of 6.0% per annum on the principal and unpaid interest and have a maturity date of December 12, 2011. The notes and unpaid interest may be converted by the holder at any time into the number of shares of Series F redeemable convertible preferred stock determined by dividing the outstanding principal and accrued interest by $1.20 per share. Upon the completion of an IPO, the notes and unpaid interest will automatically convert into Series F redeemable convertible preferred stock at $1.20 per share. Upon maturity, the holder can elect to receive payment in cash on the principal and unpaid interest. As of June 30, 2010 and 2011, the outstanding principal and accrued interest under these notes was $1.6 million and $1.5 million.
In February 2009, the Company issued convertible promissory notes and warrants in the amount of $5.0 million (equivalent to KRW 6,898,000,000) to an investor. The notes carry an interest rate of 6.0% per annum on the principal and unpaid interest. The notes have an original maturity date of February 6, 2011 and were subsequently extended to February 6, 2012. The notes and unpaid interest may be converted by the holder at any time into the number of shares of Series F redeemable convertible preferred stock determined by dividing the outstanding principal and accrued interest by $1.20 per share. Upon the completion of an IPO, the notes and unpaid
F-23
Table of Contents
GCT Semiconductor, Inc.
Notes to Consolidated Financial Statements
interest will automatically convert into Series F redeemable convertible preferred stock at $1.20 per share. Upon maturity, the holder can elect to receive payment in cash on the principal and unpaid interest. As of June 30, 2010 and 2011, the outstanding principal and accrued interest under these notes was $6.1 million and $7.4 million. In conjunction with the issuance of these convertible promissory notes, the Company issued warrants to purchase 4,166,666 shares of Series F redeemable convertible preferred stock with an exercise price of $1.20 per share. The fair value of the warrants on the date of issuance was $198,000, as determined using the Black-Scholes option-pricing model and was recorded as a discount to the related note payable that is being amortized to interest expense over the term of the debt. The Company recognized interest expense related to amortization of the discount of $39,000, $99,000 and $59,000 during the years ended June 30, 2009, 2010 and 2011. As of June 30, 2010 and 2011, the unamortized debt discount was $59,000 and zero.
During the year ended June 30, 2011, the Company issued convertible promissory notes to various investors and convertible notes to a related party in the amount of $21.6 million. The notes carry interest rates of 6.0 to 15.0% per annum on the principal and unpaid interest and have maturity dates ranging from January 2012 through July 2012. The notes and unpaid interest may be converted by the holder at any time into the number of shares of Series F redeemable convertible preferred stock determined by dividing the outstanding principal and accrued interest by $1.20 per share. Upon the filing of the Company’s initial SEC registration statement on Form S-1 for its assumed IPO, the notes and unpaid interest will automatically convert into Series F redeemable convertible preferred stock at $1.20 per share. Upon maturity, the holder can elect to receive payment in cash on the principal and unpaid interest. As of June 30, 2011, the outstanding principal and accrued interest under these notes was $22.5 million. Of the $21.6 million convertible promissory notes, convertible notes in the amount of $2.0 million was issued to a customer with an interest rate of 15.0%. The Company recorded the present value of the higher interest rate of $125,000 as a reduction of revenue.
Derivatives Embedded within Convertible Notes
Certain foreign currency features related to the Korean won based convertible notes in the amount of $6.5 million issued in U.S. dollars with fixed exchange rate features are considered embedded derivatives. Such features are separated from the debt host contract and accounted for at fair value with the changes in fair value recognized as other income (expense), net. For the years ended June 30, 2009 and 2011, the Company recognized losses of $22,000 and $1.1 million in relation to changes in the fair value of these embedded derivatives in the consolidated statements of operations. For the year ended June 30, 2010, the Company recognized a gain of $19,000 in relation to changes in the fair value of these embedded derivatives in the consolidated statement of operations. As of June 30, 2010 and 2011, the carrying value of these embedded derivatives was $82,000 and $1.2 million.
The Company determined the fair value of the foreign currency derivatives at the end of each reporting period by estimating the probability that the Korean won based convertible notes will convert into Series F redeemable convertible preferred shares and the probability that the Korean won will appreciate relative to the U.S. dollar. These probabilities were derived by using the Black-Scholes option-pricing model with the following assumptions:
| Years Ended June 30, | ||||||
| 2009 | 2010 | 2011 | ||||
| Remaining contractual term (in years) |
0.5 – 1.6 | 0.5 – 0.6 | 0.5 – 0.6 | |||
| Expected volatility (U.S.) |
65 – 70% | 60% | 60% | |||
| U.S. risk-free interest rate |
1% | 0.3% | 0.1 – 0.2% | |||
| Expected volatility (Korea) |
18.3 – 18.8% | 17.7 – 17.9% | 8.7 – 12.2% | |||
| Korean risk-free interest rate |
2.9 – 3.5% | 2.3 – 2.5% | 3.4 – 3.5% | |||
F-24
Table of Contents
GCT Semiconductor, Inc.
Notes to Consolidated Financial Statements
6. Commitments and Contingencies
Capital Leases
The Company entered into a capital lease obligation of $20,000 during the year ended June 30, 2011 for certain computer equipment.
The following is a schedule of future minimum lease payments due under the capital lease obligation as of June 30, 2011 (in thousands):
| Years Ending June 30: |
Amounts | |||
| 2012 |
$ | 9 | ||
| 2013 |
9 | |||
| 2014 |
6 | |||
|
|
|
|||
| Total minimum lease payments |
24 | |||
| Less: amount representing interest |
5 | |||
|
|
|
|||
| Present value of minimum lease payments |
19 | |||
| Less: current portion |
6 | |||
|
|
|
|||
| Capital lease liability, net of current portion |
$ | 13 | ||
|
|
|
|||
Operating Leases
The Company leases office space under noncancellable operating leases with various expiration dates through December 2013. Rent expense, which is being recognized on a straight-line basis over the lease term, was $674,000, $714,000 and $737,000 during the years ended June 30, 2009, 2010 and 2011.
Aggregate noncancellable future minimum lease payments under operating leases, including future lease payments of overseas’ subsidiaries converted to U.S. dollars at the exchange rate as of June 30, 2011 consisted of the following (in thousands):
| Years Ending June 30: |
Amounts | |||
| 2012 |
$ | 677 | ||
| 2013 |
141 | |||
| 2014 |
41 | |||
| 2015 |
— | |||
|
|
|
|||
| Total |
$ | 859 | ||
|
|
|
|||
Litigation
The Company is subject to various claims arising in the ordinary course of business. Although no assurance can be given, the Company believes that it is not presently a party to any litigation of which the outcome, if determined adversely, would individually or in the aggregate be reasonably expected to have a material adverse effect on the business, operating results, cash flows or financial position of the Company.
Third parties have from time to time claimed, and others may claim in the future, that the Company has infringed their past, current or future intellectual property rights. These claims, whether meritorious or not, could be time consuming, result in costly litigation, require expensive changes in the Company’s methods of doing
F-25
Table of Contents
GCT Semiconductor, Inc.
Notes to Consolidated Financial Statements
business or could require the Company to enter into costly royalty or licensing agreements, if available. As a result, these claims could harm the Company’s business, operating results, cash flows and financial position.
Indemnification
The Company is a party to a variety of agreements pursuant to which it may be obligated to indemnify a customer with respect to certain matters. Typically, these obligations arise in the context of contracts entered into by the Company, under which the Company customarily agrees to hold the customer harmless against losses arising from a breach of representations and covenants related to such matters as certain intellectual property rights. Generally, payment by the Company is conditioned on the customer making a claim pursuant to the procedures specified in the particular contract, which procedures typically allow the Company to challenge the other customer’s claims. It is not possible to predict the maximum potential amount of future payments under these or similar agreements due to the limited history of prior indemnification claims, the conditional nature of the Company’s obligations and the unique facts and circumstances involved in each particular agreement. To date, the Company has not accrued any amounts or made any payments with respect to indemnity obligations. The Company will, however, accrue for losses for any known contingent liabilities, including those that may arise from indemnification provisions, when future payment is probable and the amount can be reasonably estimated.
Purchase Commitment
The Company has certain commitments from outstanding purchase orders related to the manufacture of certain wafers utilized by the Company and other services, which are noncancellable once production has started. These production agreements are cancellable at any time with the Company required to pay all costs incurred through the cancellation date. However, the Company has rarely cancelled these agreements once production has started. As of June 30, 2010 and 2011, the Company had outstanding noncancellable purchase commitments for these production agreements of $887,000 and $541,000.
7. Mandatorily Redeemable Convertible Preferred Stock and Stockholders’ Deficit
Common Stock
In May 2011, the Company authorized an additional 75,061,414 shares of common stock. As of June 30, 2010 and 2011, the Company had reserved shares of common stock, on an as-if converted basis, for issuance as follows:
| As of June 30, | ||||||||
| 2010 | 2011 | |||||||
| Issuances under stock option plan |
35,659,873 | 54,109,636 | ||||||
| Conversion of convertible notes and related accrued interest |
6,458,558 | 26,162,556 | ||||||
| Conversion of mandatorily redeemable convertible preferred stock |
143,215,865 | 157,090,863 | ||||||
| Issuances upon exercise of redeemable convertible preferred stock warrants |
21,511,361 | 9,303,029 | ||||||
|
|
|
|
|
|||||
| 206,845,657 | 246,666,084 | |||||||
|
|
|
|
|
|||||
The above table does not include potential issuances of common stock related to the cumulative dividends on the Series C, D, E and F redeemable convertible preferred stock in the amount of $46.8 million and $56.1 million as of June 30, 2010 and 2011 which are expected to be paid in shares of common stock upon a qualifying initial public offering.
F-26
Table of Contents
GCT Semiconductor, Inc.
Notes to Consolidated Financial Statements
Mandatorily Redeemable Convertible Preferred Stock
During the year ended June 30, 2009, the Company issued 4,166,665 shares of Series F redeemable convertible preferred stock for $1.20 per share and received proceeds of $5.0 million, net of issuance costs of $70,000. Also during the year ended June 30, 2009, the Company issued 462,995 shares of Series F redeemable convertible preferred stock upon the conversion of the principal and accrued interest of $555,000 of outstanding convertible notes payable.
In April 2011, warrants to purchase 13,874,998 shares of Series F redeemable convertible preferred stock were exercised with cash proceeds to the Company in the amount of $16.6 million.
In May 2011, the Company authorized an additional 20,660,228 shares of Series F redeemable convertible preferred stock.
Mandatorily redeemable convertible preferred stock as of June 30, 2010 and 2011 consisted of the following (in thousands, except share data):
| As of June 30, 2010 | Net Proceeds |
|||||||||||||||
| Shares Authorized | Shares Issued and Outstanding |
Liquidation Preference and Cumulative Dividends |
||||||||||||||
| Series A(1) |
5,600,000 | 5,600,000 | $ | 1,400 | $ | 1,397 | ||||||||||
| Series B(1) |
5,200,000 | 5,200,000 | 13,000 | 11,900 | ||||||||||||
| Series C |
70,285,003 | 70,285,003 | 153,867 | 40,469 | ||||||||||||
| Series D |
31,366,116 | 31,366,116 | 59,603 | 25,903 | ||||||||||||
| Series E |
5,681,820 | 5,681,820 | 11,260 | 5,825 | ||||||||||||
| Series F |
54,387,639 | 25,082,926 | 50,855 | 26,602 | ||||||||||||
|
|
|
|
|
|
|
|
|
|||||||||
| 172,520,578 | 143,215,865 | $ | 289,985 | $ | 112,096 | |||||||||||
|
|
|
|
|
|
|
|||||||||||
| Accretion of Series C mandatorily redeemable convertible preferred stock |
30,531 | |||||||||||||||
|
|
|
|||||||||||||||
| Total |
$ | 142,627 | ||||||||||||||
|
|
|
|||||||||||||||
| As of June 30, 2011 | Net Proceeds |
|||||||||||||||
| Shares Authorized | Shares Issued and Outstanding |
Liquidation Preference and Cumulative Dividends |
||||||||||||||
| Series A(1) |
5,600,000 | 5,600,000 | $ | 1,400 | $ | 1,397 | ||||||||||
| Series B(1) |
5,200,000 | 5,200,000 | 13,000 | 11,900 | ||||||||||||
| Series C |
70,285,003 | 70,285,003 | 157,381 | 40,469 | ||||||||||||
| Series D |
31,366,116 | 31,366,116 | 62,024 | 25,903 | ||||||||||||
| Series E |
5,681,820 | 5,681,820 | 11,760 | 5,825 | ||||||||||||
| Series F |
75,047,867 | 38,957,924 | 78,515 | 45,889 | ||||||||||||
|
|
|
|
|
|
|
|
|
|||||||||
| 193,180,806 | 157,090,863 | $ | 324,080 | $ | 131,383 | |||||||||||
|
|
|
|
|
|
|
|||||||||||
| Accretion of Series C mandatorily redeemable convertible preferred stock |
34,045 | |||||||||||||||
|
|
|
|||||||||||||||
| Total |
$ | 165,428 | ||||||||||||||
|
|
|
|||||||||||||||
| (1) | Holders of Series A and B redeemable convertible preferred stock are only entitled to liquidation preference. |
F-27
Table of Contents
GCT Semiconductor, Inc.
Notes to Consolidated Financial Statements
The Company recorded the mandatorily redeemable convertible preferred stock at fair value on the dates of issuance, net of issuance costs. The Company classifies the mandatorily redeemable convertible preferred stock outside of stockholders’ equity because the shares contain redemption features that are not solely within the Company’s control.
Significant terms of Series A, B, C, D, E and F mandatorily redeemable convertible preferred stock, collectively referred to as Series A, B, C, D, E and F or mandatorily redeemable convertible preferred stock and individually referred to separately as Series A, Series B, Series C, Series D, Series E and Series F, are as follows:
Conversion Features
Each share of Series A, B, C, D, E and F is convertible, at the option of the holder, according to a conversion ratio, subject to adjustment for dilution. Each share of Series A and B automatically converts into the number of shares of common stock into which these shares are convertible at the then-effective conversion ratio upon: (i) the closing of a public offering of common stock at a price of at least $1.91 per share with gross proceeds of at least $25.0 million, or (ii) the consent of a majority of the holders of Series A, B, D, E and F and 75% of the holders of Series C.
The Series C, D, E and F will not be automatically converted unless all accrued but unpaid dividends on these shares have been paid. As of June 30, 2010 and 2011, cumulative dividends on these shares amounted to $46.8 million and $56.1 million.
Voting Rights
Each share of Series A, B, C, D, E and F has voting rights equal to the number of shares of common stock into which it is convertible and votes together as one class with the common stock.
In regards to the selection of the Company’s eight directors that make up its board, the Series A and B holders, voting together as a single class, will elect one director; the Series C holders will elect at least two directors assuming at least 500,000 shares of Series C remain outstanding; the Series D holders will elect one director; the Series F holders will elect one director; the common stock holders will elect one director; and the common stock and mandatorily redeemable convertible preferred stock holders, voting together on an as-converted basis, will elect the remaining two directors.
So long as any shares of Series D, E and F remain outstanding, the Company must obtain approval from a majority of holders of these shares in order to amend the certificate of incorporation or bylaws in any manner, to create any other securities senior or on par with Series D, E and F, to issue any options, warrants or other stock right to purchase the capital stock of the Company, transfer the Company’s assets to the stockholders or increase or decrease the authorized number of the Company’s directors.
So long as any shares of Series C remain outstanding, the Company must obtain approval of at least 75% of the holders of these shares in order to alter the certificate of incorporation or bylaws, to change the rights, preferences or privileges of the Series C, create any other equity security senior or on par with Series C, pay any dividends on common stock, sell or dispose of all or substantially all of the assets of the Company, or effect a merger, consolidation or any other transaction where the existing stockholders retain less than a majority of the voting stock of the surviving entity or change the authorized number of the Company’s directors.
So long as any shares of Series B remain outstanding, the Company must obtain approval from at least 67% of the holders of these shares in order to amend the certificate of incorporation or bylaws to adversely change any
F-28
Table of Contents
GCT Semiconductor, Inc.
Notes to Consolidated Financial Statements
of the rights, preferences, privileges or restrictions of the Series B in a manner different than the other shares of preferred stock or change the authorized number of shares of Series B.
So long as any shares of Series A remain outstanding, the Company must obtain approval from a majority of holders of these shares in order to alter the certificate of incorporation or bylaws to adversely change any of the rights, preferences, privileges or restrictions of the Series A in a manner different than the other shares of preferred stock or change the number of authorized shares of Series A.
Dividend Rights
The holders of Series C, D, E and F are entitled to receive, prior and in preference to the holders of Series A and B, cumulative dividends at the rate of $0.05, $0.08, $0.09 and $0.10 per share, when and if declared by the Board of Directors.
The holders of Series A are entitled to receive, prior and in preference to the holders of the Series B, dividends, when and if declared by the Board of Directors, and those dividends shall be paid pro rata on the common stock and Series A on an as-if converted basis as one class. The holders of Series B are entitled to receive annual noncumulative dividends at a rate of $0.15 per share, when and if declared by the board of directors. No dividends may be paid on the common stock until dividends are paid on all outstanding shares of Series A, B, C, D, E and F. No dividends on mandatorily redeemable convertible preferred stock or common stock have been declared by the board from inception through June 30, 2011. In May 2011, the Company amended its certificate of incorporation to clarify that the Company may pay the cumulative dividends for the Company’s Series C, D, E and F in shares of common stock upon the automatic conversion of these shares in connection with a qualified initial public offering. The number of shares of common stock to be issued as a result of such payments will be determined based on the per share initial public offering price.
The Series D, E and F are not redeemable and, therefore, cumulative unpaid dividends in arrears are not recorded on the consolidated balance sheets. However, while the preferred stock was outstanding, such cumulative unpaid dividends were included in the net loss attributable to common stockholders for all periods that Series D, E and F were outstanding.
Liquidation Preferences and Redemption Payments
In the event of any liquidation, dissolution or winding up of the Company, whether voluntary or involuntary, including a merger, acquisition or sale of assets where the beneficial owners of the Company’s common stock and mandatorily redeemable convertible preferred stock own less than a majority of the resulting voting power of the surviving entity, the holders of the Series D, E and F are entitled to receive, prior and in preference to the holders of the Series A, B and C or common stock, an amount of $0.88, $1.10 and $1.20 per share.
After payments to the holders of the Series D, E and F as set forth above, the holders of the Series C, D, E and F are entitled to receive, prior and in preference to holders of the Series A and B or common stock, an amount of $1.81, $0.61, $0.55 and $0.60 per share, plus all accrued but unpaid dividends.
After payments to the holders of the Series C, D, E and F, the holders of the Series A and B are entitled to receive, prior to and in preference to any distribution to the holders of common stock, an amount of $0.25 and $2.50 per share, plus any declared but unpaid dividends. The remaining assets, if any, are distributed ratably among the holders of common stock. Should the Company’s legally available assets be insufficient to satisfy the liquidation preferences, the funds will be distributed ratably among the holders of mandatorily redeemable
F-29
Table of Contents
GCT Semiconductor, Inc.
Notes to Consolidated Financial Statements
convertible preferred stock in proportion to the preferential amount each such holder is otherwise entitled to receive.
Additional Redemption Rights to Series C
Upon the written election of holders of the outstanding shares of the Series C, these outstanding shares can be redeemed at any time after July 15, 2008 if the Company has the funds legally available to redeem them. The redemption price is $0.64 per share, as adjusted for any stock dividends, combinations or splits, plus all accrued and unpaid dividends on such shares.
Accretion of Redemption Amounts
The Company is accreting the carrying value of the Series C to the redemption values. The accretion amounts were determined using the effective interest rate method and dividend rights and amounted to $3.6 million, $3.5 million and $3.5 million during the years ended June 30, 2009, 2010 and 2011.
8. Warrants
Redeemable Convertible Preferred Stock Warrants
As of June 30, 2010, outstanding warrants to purchase redeemable convertible preferred stock consisted of (in thousands, except share and per share data and the years):
| Original Issue Date |
Original or Amended Term (Years) |
Convertible Preferred Stock |
Exercise Price |
Number of Shares Underlying the Warrant |
Estimated Fair Value as of June 30, 2010 |
|||||||||||||||
| November 2007 |
2.9 | Series F | $ | 1.20 | 5,125,000 | $ | 45 | |||||||||||||
| April 2008 |
2.5 | Series F | 1.20 | 2,083,333 | 13 | |||||||||||||||
| June 2008 |
4.0 | Series F | 1.10 | 4,363,636 | 342 | |||||||||||||||
| July 2008 |
2.3 | Series F | 1.20 | 833,333 | 5 | |||||||||||||||
| November 2008 |
1.9 | Series F | 1.20 | 833,333 | 5 | |||||||||||||||
| February 2009 |
2.2 | Series F | 1.20 | 4,166,666 | 88 | |||||||||||||||
| April 2009 |
1.5 | Series F | 1.20 | 833,333 | 5 | |||||||||||||||
| June 2009 |
4.0 | Series F | 1.10 | 3,272,727 | 297 | |||||||||||||||
|
|
|
|
|
|||||||||||||||||
| Total |
21,511,361 | $ | 800 | |||||||||||||||||
|
|
|
|
|
|||||||||||||||||
As of June 30, 2011, outstanding warrants to purchase redeemable convertible preferred stock consisted of (in thousands, except share and per share data and the years):
| Original Issue Date |
Original or Amended Term (Years) |
Convertible Preferred Stock |
Exercise Price |
Number of Shares Underlying the Warrant |
Estimated Fair Value as of June 30, 2011 |
|||||||||||||||
| June 2008 |
4.0 | Series F | $ | 1.10 | 4,363,636 | $ | 1,912 | |||||||||||||
| June 2009 |
4.0 | Series F | 1.10 | 3,272,727 | 1,530 | |||||||||||||||
| May 2011 |
3.0 | Series F | 1.20 | 1,666,666 | 621 | |||||||||||||||
|
|
|
|
|
|||||||||||||||||
| Total |
9,303,029 | $ | 4,063 | |||||||||||||||||
|
|
|
|
|
|||||||||||||||||
F-30
Table of Contents
GCT Semiconductor, Inc.
Notes to Consolidated Financial Statements
The Company determined the fair value of the outstanding redeemable convertible preferred stock warrants at the end of each reporting period using the Black-Scholes option-pricing model with the following assumptions:
| Years Ended June 30, | ||||||
| 2009 | 2010 | 2011 | ||||
| Estimated term (in years) |
0.9 – 3.8 | 0.3 – 2.7 | 0.6 – 1.1 | |||
| Risk-free interest rate |
0.5 – 2.0% | 0.2 – 0.9% | 0.1 – 0.2% | |||
| Expected volatility |
65% | 60% | 60% | |||
| Expected dividend yield |
15.9% | 13.1% | 6.5% | |||
The above assumptions were determined as follows:
Term—The term represents either the lesser of (i) the remaining contractual term of the warrants or (ii) a weighted average of the remaining term under probable scenarios used to determine the fair value of the underlying stock;
Risk-free interest rate—The risk-free interest rate is based on the U.S. Treasury yield in effect at the time of grant for zero coupon U.S. Treasury notes with maturities approximately equal the term of the warrants; and
Expected volatility—The expected volatility is derived from historical volatilities of several unrelated publicly listed peer companies over a period approximately equal to the term of the warrants because the Company has limited information on the volatility of the preferred stock since there is currently no trading history. When making the selections of our industry peer companies to be used in the volatility calculation, the Company considered the size, operational and economic similarities to the Company’s principle business operations;
Expected dividend yield—The expected dividend yield is based on the $0.096 per share cumulative dividends for the underlying shares of Series F preferred stock.
During the year ended June 30, 2007, in conjunction with issuance of promissory notes, the Company issued warrants to purchase 463,993 shares in the next round of preferred stock financing with an exercise price equal to the lower of $1.40 per share or the per share price of shares sold in the next round of preferred stock financing. The subsequent financing occurred during the year ended June 30, 2009 and the exercise price was then fixed at $1.20 per share with the expiration date of March 19, 2009. The Company determined that the fair value of the warrants was $113,000 on the date of issuance. These warrants were recorded as a warrant liability and a discount on the related note payable account. During the year ended June 30, 2008, the number of shares to be issued under this warrant was changed to equal 50% of the related note principal, and the expiration date was extended to May 31, 2009. As a result of this modification, the Company recognized an additional $106,000 for the fair value of warrants and added the incremental charge to the warrant liability. During the year ended June 30, 2009, the expiration date was extended to May 31, 2010. These warrants expired unexercised in May 2010. The Company recognized gains of $121,000 and $9,000 as a result of the fair value remeasurement for these warrants during the years ended June 30, 2009 and 2010.
During the year ended June 30, 2008, in conjunction with the issuance of Series F redeemable convertible preferred stock and conversion of convertible notes, the Company issued warrants to the holders of these shares and convertible notes to purchase an aggregate of 8,666,666 shares of Series F redeemable convertible preferred stock with an exercise price of $1.20 per share. The Company determined that the fair value of the warrants was $3.4 million on the date of issuance. These warrants were recorded as a warrant liability and netted against the
F-31
Table of Contents
GCT Semiconductor, Inc.
Notes to Consolidated Financial Statements
carrying value of the Series F redeemable convertible preferred stock. During the year ended June 30, 2009, the expiration dates of these warrants were extended to May and October 2010. During the year ended June 30, 2010, the warrants to purchase 1,458,333 shares expired unexercised in May 2010. During the year ended June 30, 2011, the expiration date for warrants to purchase 7,208,333 shares was extended to April 15, 2011. In April 2011, the outstanding warrants to purchase 7,208,333 shares were exercised with cash proceeds of $8.6 million. The Company recognized gains of $2.3 million and $200,000 as a result of the fair value remeasurement for these warrants during the years ended June 30, 2009 and 2010. The Company recognized a charge of $1.3 million as a result of the fair value remeasurement and modification for these warrants during the year ended June 30, 2011.
During the year ended June 30, 2008, in conjunction with the issuance of promissory notes, the Company issued warrants to purchase an aggregate of 111,050 shares of Series F redeemable convertible preferred stock with an exercise price of $1.20 per share and an expiration date of May 31, 2009. The Company determined that the fair value of the warrants was $43,000 on the date of issuance. These warrants were recorded as a warrant liability and a discount on the related note payable. During the year ended June 30, 2009, the expiration dates of these warrants were extended to May 2010. These warrants expired unexercised in May 2010. The Company recognized gains of $30,000 and $2,000 as a result of the fair value remeasurement for these warrants during the years ended June 30, 2009 and 2010.
During the year ended June 30, 2008, in conjunction with a reference design agreement with a third party, the Company issued warrants to purchase 4,363,636 shares of Series F redeemable convertible preferred stock with an exercise price of $1.10 per share and an expiration date of June 18, 2012. The Company determined that the fair value of the warrants was $2.8 million on the date of issuance. These warrants were recorded as a warrant liability and research and development expense upon issuance. These outstanding warrants, which will expire upon an initial public offering, are exercisable with cash or through a cashless exercise provision. The warrants have a net exercise provision under which the holder may, in lieu of payment of the exercise price in cash, surrender the warrant and receive a net amount of shares based on the fair market value of our common stock at the time of exercise of the warrant after deduction of the aggregate exercise price. For the two warrants with an exercise price of $1.10 per share, no more than 80% of the aggregate number of shares available under these warrants are permitted to be net exercised. These warrants also contain provisions for the adjustment of exercise price and the aggregate number of shares issuable upon the exercise of the warrants in the event of stock dividends, stock splits or stock combinations, reclassifications, combinations or exchanges. The Company recognized gains of $2.6 million as a result of the fair value remeasurement for these warrants during the year ended June 30, 2009. The Company also recognized charges of $68,000 and $1.6 million as a result of the fair value remeasurement for these warrants during the years ended June 30, 2010 and 2011.
During the year ended June 30, 2009, in conjunction with the issuance of Series F redeemable convertible preferred stock, the Company issued warrants to the holders of these shares to purchase 2,499,999 shares of Series F redeemable convertible preferred stock with an exercise price of $1.20 per share and an expiration date of October 15, 2010. The Company determined that the fair value of the warrants was $500,000 on the date of issuance. These warrants were recorded as a warrant liability and netted against the carrying value of the Series F redeemable convertible preferred stock. During the year ended June 30, 2011, the expiration date for these warrants was extended to April 15, 2011. In April 2011, the outstanding warrants to purchase 2,499,999 shares were exercised with cash proceeds of $3.0 million. The Company recognized gains of $423,000 and $60,000 as a result of the fair value remeasurement for these warrants during the years ended June 30, 2009 and 2010. The Company also recognized a charge of $459,000 as a result of the fair value remeasurement and modification for these warrants during the year ended June 30, 2011.
F-32
Table of Contents
GCT Semiconductor, Inc.
Notes to Consolidated Financial Statements
During the year ended June 30, 2009, in conjunction with the issuance of convertible promissory notes, the Company issued warrants to purchase 4,166,666 shares of Series F redeemable convertible preferred stock with an exercise price of $1.20 per share and an expiration date of February 5, 2011. The Company determined that the fair value of the warrants was $198,000 on the date of issuance. These warrants were recorded as a warrant liability and a discount on the related note payable. During the year ended June 30, 2011, the expiration dates of these warrants were extended to April 15, 2011. In April 2011, the outstanding warrants to purchase 4,166,666 shares were exercised with cash proceeds of $5.0 million. The Company recognized gains of $47,000 and $62,000 as a result of the fair value remeasurement for these warrants during the years ended June 30, 2009 and 2010. The Company also recognized a charge of $703,000 as a result of the fair value remeasurement and modification for these warrants during the year ended June 30, 2011.
During the year ended June 30, 2009, in conjunction with a marketing agreement with a third party, the Company issued warrants to purchase 3,272,727 shares of Series F redeemable convertible preferred stock with an exercise price of $1.10 per share and an expiration date of April 15, 2013. The Company determined that the fair value of the warrants was $230,000 at the date of issuance. These warrants were recorded as a warrant liability and sales and marketing expense upon issuance. These outstanding warrants, which will expire upon an initial public offering, are exercisable with cash or through a cashless exercise provision. The warrants have a net exercise provision under which the holder may, in lieu of payment of the exercise price in cash, surrender the warrant and receive a net amount of shares based on the fair market value of our common stock at the time of exercise of the warrant after deduction of the aggregate exercise price. For the two warrants with an exercise price of $1.10 per share, no more than 80% of the aggregate number of shares available under these warrants are permitted to be net exercised. These warrants also contain provisions for the adjustment of exercise price and the aggregate number of shares issuable upon the exercise of the warrants in the event of stock dividends, stock splits or stock combinations, reclassifications, combinations or exchanges. The Company recognized a gain of $12,000 as a result of the fair value remeasurement for these warrants during the year ended June 30, 2009. The Company also recognized charges of $78,000 and $1.2 million as a result of the fair value remeasurement for these warrants during the years ended June 30, 2010 and 2011.
During the year ended June 30, 2011, in conjunction with the issuance of convertible promissory notes in the amount of $2.0 million to a customer, the Company granted warrants to purchase 1,666,666 shares of Series F redeemable convertible preferred stock with an exercise price equal to $1.20 per share and an expiration date of May 26, 2014. The Company determined that the fair value of the warrants was $591,000 on the date of issuance. These warrants were recorded as a warrant liability and a discount on sales upon issuance. The Company recognized $30,000 as a result of the fair value remeasurement for these warrants during the year ended June 30, 2011.
Common Stock Warrants
In June 2000, the Company issued warrants to purchase 17,391 shares of common stock at $2.50 per share in connection with legal services. The Company determined that the fair value of the warrants were not material at the date of issuance. The warrants remained outstanding as of June 30, 2009 and expired during the year ended June 30, 2010.
9. Stock-Based Compensation
In September 1999, the Company adopted the 1999 Stock Plan (the “1999 Plan”) which provides for the granting of stock options to employees and consultants of the Company. Options granted under the 1999 Plan include both incentive and nonqualified stock options. Incentive stock options (“ISO”) were granted only to Company employees including officers and directors who were also employees. Nonqualified stock options
F-33
Table of Contents
GCT Semiconductor, Inc.
Notes to Consolidated Financial Statements
(“NSO”) were granted to Company employees and consultants. Under the 1999 Plan, the Company reserved 33,575,335 shares of common stock for issuance.
Options under the 1999 Plan were granted with terms of up to ten years and at prices no less than 85% of the estimated fair market value of the shares on the date of grant as determined by the Board of Directors, provided, however, that (i) the exercise price of an ISO and NSO was not less than 100% and 85% respectively of the estimated fair market value of the shares on the date of grant, (ii) the exercise price of an ISO and NSO granted to a 10% stockholder was not less than 110% of the estimated fair market value of the shares on the date of grant and (iii) the option term of an ISO granted to a 10% stockholder did not exceed five years from the option grant date.
In May 2002, the Company adopted the 2002 Special Stock Option/Stock Issuance Plan (the “2002 Plan”). The 2002 Plan provides for the granting of common stock or options to purchase common stock to employees and consultants of the Company. Options granted under the 2002 Plan also include both ISOs and NSOs. The Company reserved 14,000,000 shares of common stock for issuance under the 2002 Plan.
Options under the 2002 Plan may be granted with terms of up to ten years and at prices no less than 85% of the estimated fair market value of the shares on the date of grant as determined by the Board of Directors, provided, however, that (i) the exercise price of an ISO shall not be less than 100% of the estimated fair market value of the shares on the date of grant and (ii) the option term of an ISO granted to a 10% stockholder shall not exceed five years from the option grant date.
In May 2010, the Company adopted the 2010 Stock Option/Stock Issuance Plan (the “2010 Plan”). The 2010 Plan provides for the granting of common stock or options to purchase common stock to employees and consultants of the Company. Options granted under the 2010 Plan also include both ISOs and NSOs. The Company initially reserved 22,831,301 shares of common stock for issuance under the 2010 Plan which included the remaining shares of common stock available for issuance under the 1999 Plan.
Options under the 2010 Plan may be granted with terms of up to ten years and at prices no less than 85% of the estimated fair market value of the shares on the date of grant as determined by the Board of Directors, provided, however, that (i) the exercise price of an ISO shall not be less than 100% of the estimated fair market value of the shares on the date of grant and (ii) the option term of an ISO granted to a 10% stockholder shall not exceed five years from the option grant date. The Company’s outstanding options are generally exercisable immediately, vest over four years and expire in ten years from the option grant date.
F-34
Table of Contents
GCT Semiconductor, Inc.
Notes to Consolidated Financial Statements
Option activities for the periods presented are as follows (in thousands, except share and per share data and the years):
| Options Outstanding | ||||||||||||||||||||
| Shares Available for Grant |
Number of Stock Options Outstanding |
Weighted- Average Exercise Price |
Weighted-Average Remaining Contractual Life (Years) |
Aggregate Intrinsic Value |
||||||||||||||||
| Balance as of June 30, 2008 |
12,464,584 | 24,637,114 | $ | 0.24 | 5.7 | — | ||||||||||||||
| Granted |
(7,077,000 | ) | 7,077,000 | 0.25 | ||||||||||||||||
| Exercised |
— | (285,119 | ) | 0.25 | ||||||||||||||||
| Cancelled |
1,588,037 | (1,588,037 | ) | 0.23 | ||||||||||||||||
|
|
|
|
|
|||||||||||||||||
| Balance as of June 30, 2009 |
6,975,621 | 29,840,958 | 0.24 | 5.8 | — | |||||||||||||||
| Granted |
(177,500 | ) | 177,500 | 0.25 | ||||||||||||||||
| Exercised |
— | (1,156,706 | ) | 0.14 | ||||||||||||||||
| Cancelled |
686,504 | (686,504 | ) | 0.25 | ||||||||||||||||
|
|
|
|
|
|||||||||||||||||
| Balance as of June 30, 2010 |
7,484,625 | 28,175,248 | 0.25 | 4.9 | — | |||||||||||||||
| Additional shares authorized |
20,023,800 | — | — | |||||||||||||||||
| Granted |
(25,253,680 | ) | 25,253,680 | 0.80 | ||||||||||||||||
| Exercised |
— | (1,574,037 | ) | 0.25 | ||||||||||||||||
| Cancelled |
1,176,129 | (1,176,129 | ) | 0.28 | ||||||||||||||||
|
|
|
|
|
|||||||||||||||||
| Balance as of June 30, 2011 |
3,430,874 | 50,678,762 | $ | 0.53 | 6.9 | $ | 19,493 | |||||||||||||
|
|
|
|
|
|||||||||||||||||
| Vested as of June 30, 2011 |
23,264,218 | $ | 0.25 | 3.6 | $ | 15,310 | ||||||||||||||
| Vested and expected to vest as of June 30, 2011 |
49,976,950 | $ | 0.52 | 6.8 | $ | 19,386 | ||||||||||||||
The weighted average grant date fair value of options granted during the years ended June 30, 2009, 2010 and 2011 was $0.02, $0.01 and $0.45.
As of June 30, 2011, there was $8.4 million of unrecognized compensation cost related to employee stock option compensation arrangements which is expected to be recognized on a straight-line basis over a weighted average period of 3.5 years. There were no capitalized stock-based compensation costs or recognized stock-based compensation tax benefits during the years ended June 30, 2009, 2010 and 2011.
The aggregate intrinsic value of options exercised was zero during the years ended June 30, 2009 and 2010. The aggregate intrinsic value of options exercised was $412,000 during the year ended June 30, 2011.
Additional information regarding options outstanding as of June 30, 2011 is as follows:
| Options Outstanding | Options Vested and Outstanding | |||||||||||||||||||
| Exercise Price |
Options Outstanding |
Weighted-Average Remaining Contractual Life (Years) |
Weighted-Average Exercise Price per Share |
Vested | Weighted- Average Exercise Price per Share |
|||||||||||||||
| $0.25 |
26,004,719 | 4.0 | $ | 0.25 | 23,130,282 | $ | 0.25 | |||||||||||||
| $0.53 |
7,058,043 | 9.7 | $ | 0.53 | 116,250 | $ | 0.53 | |||||||||||||
| $0.93 |
17,616,000 | 10.0 | $ | 0.93 | 17,686 | $ | 0.93 | |||||||||||||
|
|
|
|
|
|||||||||||||||||
| 50,678,762 | 23,264,218 | |||||||||||||||||||
|
|
|
|
|
|||||||||||||||||
F-35
Table of Contents
GCT Semiconductor, Inc.
Notes to Consolidated Financial Statements
Determining Fair Value of Stock Options
The fair value of each grant of stock options was determined by the Company and its Board of Directors using the methods and assumptions discussed below. Each of these inputs is subjective and generally requires significant judgment to determine.
Valuation Method—The Company estimates the fair value of its stock options using the Black-Scholes option-pricing model.
Expected Term—The expected term represents the period that the stock-based awards are expected to be outstanding. The option grants qualify to be “plain vanilla,” and the Company used the simplified method to determine the expected term as provided by the Securities and Exchange Commission. The simplified method calculates the expected term as the average of the time-to-vesting and the contractual life of the options.
Fair Value of Common Stock—The fair value of the common stock underlying the stock options has historically been determined by the Company’s Board of Directors. Because there has been no public market for the Company’s common stock, the Board of Directors has determined the fair market value of the common stock at the time of the option grant by considering a number of objective and subjective factors including valuations of comparable companies, sales of mandatorily redeemable convertible preferred stock to unrelated third parties, operating and financial performance, lack of liquidity of capital stock and general and industry-specific economic outlook, amongst other factors. The fair value of the underlying common stock shall be determined by the Board of Directors until such time that the Company’s common stock is listed on an established stock exchange or national market system.
Risk-Free Interest Rate—The risk-free interest rate is based on the U.S. Treasury yield curve in effect at the time of grant for zero coupon U.S. Treasury notes with maturities approximately equal to the expected term of the options.
Expected Volatility—The expected volatility was based on the historical stock volatilities of several of the Company’s publicly listed peers over a period approximately equal to the expected term of the options as the Company did not have a sufficient trading history to use the volatility of its own common stock.
Expected Dividend Yield—The expected dividend yield has been zero as the Company has never paid dividends on common stock and does not expect to pay dividends on common stock.
Forfeiture Rate—The Company estimates its forfeiture rate based on an analysis of its actual forfeitures and will continue to evaluate the adequacy of the forfeiture rate based on actual forfeiture experience, analysis of employee turnover behavior and other factors. The impact from a forfeiture rate adjustment will be recognized in full in the period of adjustment, and if the actual number of future forfeitures differs from that estimated, the Company may be required to record adjustments to stock-based compensation expense in future periods.
Summary of Assumptions—The fair value of the employee stock options were estimated on the grant dates using a Black-Scholes option-pricing model with the following weighted average assumptions:
| Years Ended June 30, | ||||||||||||
| 2009 | 2010 | 2011 | ||||||||||
| Expected term (in years) |
5.7 | 5.9 | 5.7-5.9 | |||||||||
| Risk-free interest rate |
2.3-3.3 | % | 2.5 | % | 1.6-2.5 | % | ||||||
| Expected volatility |
65 | % | 65 | % | 60 | % | ||||||
| Expected dividend yield |
0 | % | 0 | % | 0 | % | ||||||
F-36
Table of Contents
GCT Semiconductor, Inc.
Notes to Consolidated Financial Statements
In addition to the estimates and assumptions noted above, the Company is also required to estimate the fair value of the common stock underlying the stock-based awards when performing the fair value calculations with the Black-Scholes option-pricing model. The fair market value of the common stock underlying the stock-based awards was estimated on each grant date by the Company’s Board of Directors, with input from management. The Board of Directors is comprised of a majority of non-employee directors with significant experience investing and operating companies in the semiconductor industry. As such, the Company believes that the Board of Directors has the relevant experience and expertise to determine a fair market value of the common stock on each respective grant date. Given the absence of a public trading market of the Company’s common stock, and in accordance with the American Institute of Certified Public Accountants Practice Guide, Valuation of Privately-Held-Company Equity Securities Issued as Compensation, the Board of Directors exercised reasonable judgment and considered numerous objective and subjective factors to determine the best estimate of the fair market value of the common stock.
Non-Employee Stock-Based Compensation
For the years ended June 30, 2009, 2010 and 2011, the Company granted 118,000, 60,000 and 1.5 million options to consultants in exchange for services to be performed. Stock-based compensation expense related to these options is recognized as incurred. At each reporting date, the Company revalues any unvested options using the Black-Scholes option-pricing model. As a result, the stock-based compensation expense will fluctuate as the fair market value of the Company’s common stock fluctuates. Changes in the estimated fair value of these options will be recognized as stock-based compensation in the period of the change. For the years ended June 30, 2009, 2010 and 2011, the Company recorded stock-based compensation expense of $15,000, $6,000 and $143,000 related to these options. As of June 30, 2009, 2010 and 2011, outstanding unvested stock options issued to consultants were 330,876, 237,354 and 1.6 million.
The fair value was determined using the Black-Scholes option-pricing model with the following assumptions:
| Years Ended June 30, | ||||||||||||
| 2009 | 2010 | 2011 | ||||||||||
| Contractual term (in years) |
8.3 | 6.6 | 8.3 | |||||||||
| Risk-free interest rate |
2.3 | % | 2.5 | % | 1.7 | % | ||||||
| Expected volatility |
65 | % | 65 | % | 60 | % | ||||||
| Expected dividend yield |
0 | % | 0 | % | 0 | % | ||||||
10. Net Loss per Share
The following table sets for the computation of the Company’s basic and diluted net loss per share during the years ended June 30, 2009, 2010 and 2011 (in thousands, except share and per share data):
| Years Ended June 30, | ||||||||||||
| 2009 | 2010 | 2011 | ||||||||||
| Net loss |
$ | (14,541 | ) | $ | (19,925 | ) | $ | (11,529 | ) | |||
| Accretion of Series C mandatorily redeemable convertible preferred stock |
(3,582 | ) | (3,514 | ) | (3,514 | ) | ||||||
| Cumulative dividends on Series D, E and F redeemable convertible preferred stock |
(5,308 | ) | (5,417 | ) | (5,698 | ) | ||||||
|
|
|
|
|
|
|
|||||||
| Net loss attributable to common stockholders |
$ | (23,431 | ) | $ | (28,856 | ) | $ | (20,741 | ) | |||
|
|
|
|
|
|
|
|||||||
| Shares used in computing net loss per share attributable to common stockholders, basic and diluted |
19,989,386 | 20,769,991 | 21,066,802 | |||||||||
|
|
|
|
|
|
|
|||||||
| Net loss per share attributable to common stockholders, basic and diluted |
$ | (1.17 | ) | $ | (1.39 | ) | $ | (0.98 | ) | |||
|
|
|
|
|
|
|
|||||||
F-37
Table of Contents
GCT Semiconductor, Inc.
Notes to Consolidated Financial Statements
The following outstanding shares of common stock equivalents were excluded from the computation of diluted net loss per share for the periods presented because including them would have been antidilutive:
| Years Ended June 30, | ||||||||||||
| 2009 | 2010 | 2011 | ||||||||||
| Mandatorily redeemable convertible preferred stock |
143,215,865 | 143,215,865 | 157,090,863 | |||||||||
| Stock options to purchase common stock |
29,840,958 | 28,175,248 | 50,678,762 | |||||||||
| Common and preferred stock warrants |
23,562,128 | 21,511,361 | 9,303,029 | |||||||||
The following table sets forth the computation of the Company’s unaudited pro forma basic and diluted net loss per share during the year ended June 30, 2011 (in thousands, except share and per share data):
| Year Ended June 30, 2011 | ||||
| (unaudited) | ||||
| Net loss attributable to common stockholders |
$ | |||
| Accretion of Series C mandatorily redeemable convertible preferred stock |
||||
| Cumulative dividends on Series D, E and F redeemable convertible preferred stock |
||||
| Change in fair value of liabilities for the redeemable convertible preferred stock warrants and the foreign currency derivative instruments |
||||
|
| ||||
| Net loss used in computing pro forma net loss per share attributable to common stockholders, basic and diluted |
$ | |||
|
| ||||
| Shares used in computing net loss per share attributable to common stockholders, basic and diluted |
||||
| Pro forma adjustments to reflect assumed conversion of mandatorily redeemable convertible preferred stock |
||||
|
| ||||
| Shares used in computing pro forma net loss per share attributable to common stockholders, basic and diluted |
||||
|
| ||||
| Pro forma net loss per share attributable to common stockholders, basic and diluted |
$ | |||
|
| ||||
11. Income Taxes
The Company’s loss before provision for income taxes for the years ended June 30, 2009, 2010 and 2011 was as follows (in thousands):
| Years Ended June 30, | ||||||||||||
| 2009 | 2010 | 2011 | ||||||||||
| Domestic |
$ | (13,622 | ) | $ | (16,127 | ) | $ | (11,666 | ) | |||
| International |
(350 | ) | (3,602 | ) | (85 | ) | ||||||
|
|
|
|
|
|
|
|||||||
| Loss before provision for income taxes |
$ | (13,972 | ) | $ | (19,729 | ) | $ | (11,751 | ) | |||
|
|
|
|
|
|
|
|||||||
F-38
Table of Contents
GCT Semiconductor, Inc.
Notes to Consolidated Financial Statements
The provision for income taxes consisted of the following (in thousands):
| Years Ended June 30, | ||||||||||||
| 2009 | 2010 | 2011 | ||||||||||
| Current: |
||||||||||||
| U.S. Federal |
$ | (433 | ) | $ | 12 | $ | 6 | |||||
| State |
(20 | ) | 1 | 1 | ||||||||
| Foreign |
844 | 361 | (229 | ) | ||||||||
|
|
|
|
|
|
|
|||||||
| Total current |
$ | 391 | $ | 374 | $ | (222 | ) | |||||
| Deferred: |
||||||||||||
| U.S. Federal |
$ | — | $ | — | $ | — | ||||||
| State |
— | — | — | |||||||||
| Foreign |
178 | (178 | ) | — | ||||||||
|
|
|
|
|
|
|
|||||||
| Total deferred |
178 | (178 | ) | — | ||||||||
|
|
|
|
|
|
|
|||||||
| Total provision for (benefit from) income taxes |
$ | 569 | $ | 196 | $ | (222 | ) | |||||
|
|
|
|
|
|
|
|||||||
The reconciliation of federal statutory income tax to the Company’s provision for income taxes is as follows (in thousands):
| Years Ended June 30, | ||||||||||||
| 2009 | 2010 | 2011 | ||||||||||
| Expected provision at statutory federal rate |
$ | (4,750 | ) | $ | (6,708 | ) | $ | (3,995 | ) | |||
| Research and development credits |
420 | 1,244 | 1,316 | |||||||||
| Foreign income (losses) taxed at different rates |
1,872 | 1,348 | (241 | ) | ||||||||
| Revaluation of warrants |
(755 | ) | 162 | 2,048 | ||||||||
| Stock-based compensation |
— | — | 358 | |||||||||
| Allocation of tax expense to continuing operations |
(466 | ) | — | — | ||||||||
| Change in valuation allowance |
4,188 | 4,071 | 233 | |||||||||
| Other |
60 | 79 | 59 | |||||||||
|
|
|
|
|
|
|
|||||||
| Provision for (benefit from) income taxes |
$ | 569 | $ | 196 | $ | (222 | ) | |||||
|
|
|
|
|
|
|
|||||||
Deferred income taxes reflect the net tax effects of temporary differences between the carrying amounts of assets and liabilities for financial reporting purposes and the amounts used for income tax purposes. Significant components of the Company’s deferred tax assets and liabilities as of June 30, 2010 and 2011 were as follows (in thousands):
| June 30, 2010 |
June 30, 2011 |
|||||||
| Deferred tax assets: |
||||||||
| Net operating loss federal and state |
$ | 47,000 | $ | 46,903 | ||||
| Capitalized start-up costs |
226 | 194 | ||||||
| Research and development credits |
1,079 | 1,868 | ||||||
| Accruals and reserves |
6,820 | 8,038 | ||||||
|
|
|
|
|
|||||
| Gross deferred tax assets |
55,125 | 57,003 | ||||||
| Valuation allowance |
(55,125 | ) | (57,003 | ) | ||||
|
|
|
|
|
|||||
| Net deferred tax liabilities |
$ | — | $ | — | ||||
|
|
|
|
|
|||||
F-39
Table of Contents
GCT Semiconductor, Inc.
Notes to Consolidated Financial Statements
The Company provided a full valuation allowance for net operating losses, credits and other deferred tax assets for the state of California and the United States. A valuation allowance is provided when based upon the available evidence, management concludes that it is more likely than not that some portion of the deferred tax assets will not be realized. The Company maintained a full valuation allowance as of June 30, 2009, 2010 and 2011 due to the uncertainty of realizing future tax benefits from its net operating loss carryforwards and other deferred tax assets. There were increases in the valuation allowance during the years ended June 30, 2009, 2010 and 2011 of $2.0 million, $7.1 million and $1.9 million.
As of June 30, 2010 and 2011, the Company had federal net operating loss carryforwards of $126.3 million and $126.9 million and California net operating loss carryforwards of $69.1 million and $62.2 million. The Company’s federal and state net operating loss carryforwards begin to expire in 2019 and 2011.
As of June 30, 2010 and 2011, the Company had federal research credit carryovers of $1.1 million and $1.9 million. As of June 30, 2010 and 2011, the Company had state research credit carryforwards of $1.1 million and $1.9 million. The federal research credits will begin to expire in 2025. The state research credits carryforward indefinitely.
A reconciliation of the beginning and ending amount of unrecognized tax benefits is as follows (in thousands):
| Balances as of June 30, 2008 |
$ | 1,850 | ||
| Additions based on tax positions related to the current year |
423 | |||
| Adjustments for foreign currency translation |
(308 | ) | ||
|
|
|
|||
| Balances as of June 30, 2009 |
1,965 | |||
| Additions based on tax positions related to the current year |
938 | |||
| Adjustments for foreign currency translation |
85 | |||
| Reductions for tax positions taken in the prior year due to status lapsing |
(98 | ) | ||
|
|
|
|||
| Balances as of June 30, 2010 |
2,890 | |||
| Additions based on tax positions related to the current year |
915 | |||
| Adjustments for foreign currency translation |
218 | |||
| Reductions for tax positions taken in the prior year due to status lapsing |
(257 | ) | ||
|
|
|
|||
| Balances as of June 30, 2011 |
$ | 3,766 | ||
|
|
|
The amount of unrecognized tax benefits that, if recognized, would affect the Company’s effective tax rate was $2.0 million as of June 30, 2011. The remaining amounts in unrecognized tax benefits would not impact the Company’s tax rate as they are offset by valuation allowances. As of June 30, 2010 and 2011, accrued interest and penalties was $752,000 and $863,000. For the years ended June 30, 2009, 2010 and 2011, interest and penalties expense was $179,000, $146,000 and $42,000. The Company recognizes interest and penalties related to unrecognized tax benefits within the provision for income tax expense line in the accompanying consolidated statement of operations. Accrued interest and penalties are included within the related tax liability line in the consolidated balance sheet. The Company has classified the unrecognized tax benefits as long term, as it does not expect them to be realized over the next 12 months. The Company also does not expect its unrecognized tax benefits to change significantly over the next 12 months.
F-40
Table of Contents
GCT Semiconductor, Inc.
Notes to Consolidated Financial Statements
The Company remains open for audit by the United States Internal Revenue Service and state tax authorities since inception. Most foreign jurisdictions have statute of limitations that range from three to six years. The Company is not currently under examination by income tax authorities in federal, state or other foreign jurisdictions.
12. Related Party Transactions
During the years ended June 30, 2009, 2010 and 2011, the Company recorded $526,000, $999,000 and $404,000 in revenues from sales of products to an entity that is affiliated with a stockholder of the Company. This stockholder holds 7,402,595 shares of Series D redeemable convertible preferred stock and had representatives on the Company’s Board of Directors. As of June 30, 2010 and 2011, the Company had accounts receivables due from the affiliate of the stockholder of $154,000 and $12,000. During the year ended June 30, 2011, the Company recorded $1.5 million as an offset of Research and development expenses related to an NRE arrangement with the affiliate of the Stockholder.
As of June 30, 2010 and 2011, the Company had outstanding borrowings due to the Company’s chief executive officer and convertible notes due to a director related entity as discussed further in Note 5. The carrying values of the notes payable to the chief executive officer were $4.0 million and $1.5 million as of June 30, 2010 and 2011. The carrying value of the convertible notes to a stockholder was zero as of June 30, 2010. The carrying value of the convertible notes to a stockholder was $1.0 million as of June 30, 2011. In conjunction with the issuance of convertible notes to a director related entity, the Company issued warrants to purchase an aggregate of 9,708,332 shares of Series F redeemable convertible preferred stock as discussed further in Note 8. These warrants have an original expiration date of October 15, 2010. During the year ended June 30, 2011, the expiration date for warrants to purchase the shares was extended to April 15, 2011. This modification resulted in a charge of $680,000 to other income (expense), net.
As of June 30, 2010 and 2011, the Company’s chief executive officer guaranteed certain of the Company’s outstanding Korean bank borrowings.
13. Employee Benefit Plans
The Company sponsors a 401(k) defined contribution plan covering all U.S. employees. Contributions made by the Company are determined annually by the Board of Directors. Employer contributions under this plan amounted to $52,000, $37,000 and $43,000 for the years ended June 30, 2009, 2010 and 2011.
Under Korean law, the Company is required to make severance payments to Korean employees leaving its employment. The Company’s severance pay liability to its Korean employees, which is calculated based on the salary of each employee multiplied by the years of such employee’s employment, is reflected in the Company’s consolidated balance sheets in other liabilities on an accrual basis. As of June 30, 2010 and 2011, net liability for severance payments consisted of (in thousands):
| As of June 30, | ||||||||
| 2010 | 2011 | |||||||
| Liability on severance payments |
$ | 3,851 | $ | 4,796 | ||||
| Severance assets |
(425 | ) | (492 | ) | ||||
|
|
|
|
|
|||||
| Net liability for severance payments |
$ | 3,426 | $ | 4,304 | ||||
|
|
|
|
|
|||||
F-41
Table of Contents
GCT Semiconductor, Inc.
Notes to Consolidated Financial Statements
14. Information about Geographic Areas and Product Revenues
Revenues
Revenues by geography are based on the billing address of the customer. The following table sets forth revenues by geographic area (in thousands):
| Years Ended June 30, | ||||||||||||
| 2009 | 2010 | 2011 | ||||||||||
| United States |
$ | 284 | $ | 536 | $ | 537 | ||||||
| Korea |
12,699 | 23,100 | 59,833 | |||||||||
| China |
5,720 | 6,550 | 2,443 | |||||||||
| Japan |
1,298 | 225 | 468 | |||||||||
| Taiwan |
2,186 | 2,167 | 5,115 | |||||||||
| Other |
241 | 501 | 248 | |||||||||
|
|
|
|
|
|
|
|||||||
| Total |
$ | 22,428 | $ | 33,079 | $ | 68,644 | ||||||
|
|
|
|
|
|
|
|||||||
Long-lived Assets
The following table sets forth long-lived assets by geographic area (in thousands):
| As of June 30, | ||||||||
| 2010 | 2011 | |||||||
| United States |
$ | 138 | $ | 242 | ||||
| Korea |
275 | 795 | ||||||
|
|
|
|
|
|||||
| Total |
$ | 413 | $ | 1,037 | ||||
|
|
|
|
|
|||||
Revenues attributable to our LTE, WiMAX and RF and other products are as follows (in thousands):
| Years Ended June 30, | ||||||||||||
| 2009 | 2010 | 2011 | ||||||||||
| LTE |
$ | — | $ | 929 | $ | 35,183 | ||||||
| WiMAX |
16,719 | 25,468 | 30,210 | |||||||||
| RF and other products |
5,709 | 6,682 | 3,251 | |||||||||
|
|
|
|
|
|
|
|||||||
| Total |
$ | 22,428 | $ | 33,079 | $ | 68,644 | ||||||
|
|
|
|
|
|
|
|||||||
15. Subsequent Events
In September 2011, the Board of Directors of the Company approved, subject to the approval of the shareholders of the Company, an increase in authorized share capital to 400,000,000 shares of common stock and 10,000,000 undesignated shares of preferred stock to be effective immediately upon the successful completion of a proposed IPO. In September 2011, the Board of Directors adopted, subject to the approval of shareholders, the 2011 Incentive Compensation Plan (the “2011 Plan”) and Employee Stock Purchase Plan (the “2011 ESPP”). The Company reserved 56,500,000 shares of common stock for issuance under the 2011 Plan. Such share reserve is comprised of (i) the number of shares that were available for issuance in the aggregate under both the 2002 and 2010 Plans on the effective date of the 2011 plan, including the shares subject to outstanding awards under those plans, that were transferred to the new 2011 Plan on the effective date, plus (ii) approximately an additional
F-42
Table of Contents
GCT Semiconductor, Inc.
Notes to Consolidated Financial Statements
2,390,000 shares of the Company’s common stock so that the initial total reserve is at the 56,500,000 share level. The share reserve will automatically increase on the first trading day of July each calendar year during the term of the 2011 Plan, beginning with calendar year 2012, by an amount equal to 5% of the total number of shares of common stock outstanding on the last trading day in the immediately preceding calendar month. In no event, however, will any such annual increase exceed 12,500,000 shares.
The Company reserved 3,000,000 shares of common stock for issuance under the 2011 ESPP. The reserve will automatically increase on the first trading day in July each calendar year during the term of the plan, beginning in calendar year 2012, by an amount equal to 1% of the total number of outstanding shares of our common stock on the last trading day in the immediately preceding calendar month. In no event will any such annual increase exceed 2,500,000 shares.
Significant Events Subsequent to the Date of Independent Registered Accountant’s Report (Unaudited)
Upon the initial filing of a Registration Statement on Form S-1 on September 15, 2011, $22.7 million of outstanding principal and accrued interest of the Company’s convertible notes were automatically converted into 18,887,782 shares of Series F Preferred Stock at the initial conversion price, and these shares of Series F Preferred Stock will automatically convert into 18,887,782 shares of our common stock upon completion of this offering after settlement of accrued dividends.
On or about September 30, 2011 all remaining outstanding principal and accrued interest on the Company’s convertible notes in an amount equal to approximately $8.4 million were converted by the holders into 6,136,941 shares of Series F Preferred Stock at the initial conversion price, and these shares of Series F Preferred Stock will automatically convert into 6,136,941 shares of our common stock upon completion of this offering after settlement of accrued dividends.
On September 28, 2011, the Company extended the maturity date of a promissory note with the Company’s chief executive officer, Promissory Note 3, to March 31, 2013. Prior to this extension, the maturity date of Promissory Note 3 was the later of (i) December 15, 2005 or (ii) when the Company begins to generate positive monthly cash flows and has at least $10.0 million in available cash.
In October 2011, the Company extended the maturity date of a term loan agreement with a Korean Bank, Korean Bank Loan 4, by one month from October 17, 2011 to November 16, 2011. In connection with this extension, the Company was required to make a one-time payment of KRW 500,000,000 (equivalent to $ 431,000 as at October 17, 2011).
F-43
Table of Contents

Table of Contents
Shares
GCT SEMICONDUCTOR, INC.
Common Stock
| Goldman, Sachs & Co. | BofA Merrill Lynch | |
| Cowen and Company | Oppenheimer & Co. | |
Through and including , 2011 (the 25th day after the date of this prospectus), all dealers effecting transactions in these securities, whether or not participating in this offering, may be required to deliver a prospectus. This is in addition to a dealer’s obligation to deliver a prospectus when acting as an underwriter and with respect to an unsold allotment or subscription.
Table of Contents
PART II
INFORMATION NOT REQUIRED IN PROSPECTUS
Item 13. Other Expenses of Issuance and Distribution
The following table sets forth the fees and expenses, other than underwriting discounts and commissions, payable in connection with the registration of the common stock hereunder. All amounts are estimates except the SEC registration fee, the FINRA filing fee and the NASDAQ Global Market listing fee.
| SEC registration fee |
$ | 11,610 | ||
| FINRA filing fee |
$ | 10,500 | ||
| NASDAQ Global Market listing fee |
$ | 125,000 | ||
| Blue sky fees and expenses |
* | |||
| Printing and engraving expenses |
* | |||
| Legal fees and expenses |
* | |||
| Accounting fees and expenses |
* | |||
| Transfer agent and registrar fees |
* | |||
| Miscellaneous expenses |
* | |||
|
|
|
|||
| Total |
$ | * | ||
|
|
|
| * | To be provided by amendment. |
Item 14. Indemnification of Directors and Officers
Section 145 of the Delaware General Corporation Law authorizes a court to award, or a corporation’s board of directors to grant, indemnity to directors and officers in terms sufficiently broad to permit such indemnification under certain circumstances for liabilities, including reimbursement for expenses incurred, arising under the Securities Act of 1933, as amended. Our amended and restated certificate of incorporation to be in effect upon the completion of this offering eliminates the liability of our directors for monetary damages to the fullest extent permitted under the Delaware General Corporation Law. Our amended and restated bylaws to be in effect upon completion of this offering require us to indemnify our directors and executive officers to the maximum extent not prohibited by the Delaware General Corporation Law or any other applicable law and allow us to indemnify other officers, employees and other agents as set forth in the Delaware General Corporation Law or any other applicable law.
We have entered, intend to continue to enter, into indemnification agreements with our directors and executive officers, whereby we have agreed to indemnify our directors and executive officers to the fullest extent permitted by law, including indemnification against expenses and liabilities incurred in legal proceedings to which the director or officer was, or is threatened to be made, a party by reason of the fact that such director or officer is or was a director, officer, employee or agent of us, provided that such director or officer acted in good faith and in a manner that the director or officer reasonably believed to be in, or not opposed to, our best interest.
We maintain insurance policies that indemnify our directors and officers against various liabilities arising under the Securities Act of 1933 and the Securities Exchange Act of 1934 that might be incurred by any director or officer in his or her capacity as such.
The underwriters are obligated, under certain circumstances, pursuant to the underwriting agreement to be filed as Exhibit 1.1 hereto, to indemnify us, our officers and directors against liabilities under the Securities Act of 1933, as amended.
II-1
Table of Contents
Item 15. Recent Sales of Unregistered Securities
The following sets forth information regarding all unregistered securities sold since October 25, 2008 through October 25, 2011:
| (a) | Between October 25, 2008 and June 24, 2011 we granted stock options and/or restricted stock awards to purchase 31,538,180 shares of common stock at an average exercise price of $0.56 per share to employees, consultants and directors pursuant to our 1999 Stock Option Stock Issuance Plan, 2002 Stock Option Stock Issuance Plan and 2010 Stock Option Stock Issuance Plan. Of these stock options, 1,068,918 shares have been cancelled and/or expired without being exercised, 229,850 have been exercised at an aggregate exercise price of $57,462.50 of which 10,417 shares have been repurchased and 30,239,412 remain outstanding. |
| (b) | Between October 25, 2008 and June 24, 2011, we granted stock options to purchase 1,034,148 shares of common stock at an average exercise price of $0.49 per share to certain consultants, none of which have been exercised. |
| (c) | In April 2009, we issued a warrant to purchase 3,272,727 shares of Series F Preferred Stock to 1 accredited investor with an exercise price of $1.10 per share. |
| (d) | In November 2008, we issued an aggregate of 833,333 shares of Series F Preferred Stock to 1 accredited investor, at $1.20 per share for an aggregate purchase price of $1,000,000. |
| (e) | Between December 2008 and February 2009, we issued convertible promissory notes in the aggregate amount of 8,933,500,000 Korean Won to 2 accredited investors. In conjunction with the issuance of these convertible promissory notes, we also issued a warrant to purchase 1,083,333 shares of Series F Preferred Stock with an exercise price of $1.20 per share which expired in April 2011. In September 2011, as a result of the conversion of these convertible promissory notes, we issued an aggregate of 6,136,941 shares of our preferred stock at a conversion price of $1.20 per share. |
| (f) | In April 2009, we issued an aggregate of 833,333 shares of Series F Preferred Stock to 1 accredited investor, at $1.20 per share for an aggregate purchase price of $1,000,000. |
| (g) | Between July 2010 and January 2011, we issued convertible promissory notes in the aggregate amount of $16,600,000 to 6 accredited investors. In September 2011, as a result of the conversion of these convertible promissory notes, we issued an aggregate of 14,598,375 shares of Series F Preferred Stock at a conversion price of $1.20 per share. |
| (h) | In April 2011, we issued an aggregate of 13,874,998 shares of Series F Preferred Stock to 3 accredited investors, at $1.20 per share for an aggregate purchase price of $16,649,997. |
| (i) | In May 2011, we issued convertible promissory notes in the aggregate amount of $5,000,000 to 3 accredited investors. In conjunction with the issuance of these convertible promissory notes, we also issued a warrant to purchase 1,666,666 shares of Series F Preferred Stock with an exercise price of $1.20 per share. |
The offers, sales and issuances of the securities described in Items 15(a) and (b) were deemed to be exempt from registration under the Securities Act under either (1) Rule 701 promulgated under the Securities Act as offers and sale of securities pursuant to certain compensatory benefit plans and contracts relating to compensation in compliance with Rule 701 or (2) Section 4(2) of the Securities Act as transactions by an issuer not involving any public offering. The recipients of securities in each of these transactions represented their intention to acquire the securities for investment only and not with view to or for sale in connection with any distribution thereof and appropriate legends were affixed to the share certificates and instruments issued in such transactions. All recipients had adequate access, through their relationships with us, to information about us.
The offers, sales, and issuances of the securities described in Items 15(c), (d), (e), (f), (g), (h) and (i) were deemed to be exempt from registration under the Securities Act in reliance on Section 4(2) of the Securities Act and Regulation D promulgated thereunder as transactions by an issuer not involving a public offering. The recipients of securities in each of these transactions acquired the securities for investment only and not with a view to or for sale in connection with any distribution thereof and appropriate legends were affixed to the
II-2
Table of Contents
securities issued in these transactions. Each of the recipients of securities in these transactions was an accredited or sophisticated person and had adequate access, through employment, business or other relationships, to information about us.
The offers, sales and issuances of the securities described in Items 15(e) and 15(g) that were issued upon conversion of the notes were deemed to be exempt from registration under the Securities Act in reliance on Section 3(a)(9) of the Securities Act. The issuer of the securities in each of the transactions was the same and the recipient of the securities was an existing security holder of the Company. No remuneration or commission was paid in connection with the conversion of the notes.
Item 16. Exhibits and Financial Statement Schedules
(a) Exhibits
| Exhibit |
Description of Document | |
| 1.1* | Form of Underwriting Agreement | |
| 3.1† | Amended and Restated Certificate of Incorporation of the Registrant, as currently in effect | |
| 3.2* | Form of Amended and Restated Certificate of Incorporation of the Registrant, to be in effect upon completion of this offering | |
| 3.3† | Bylaws of the Registrant, as currently in effect | |
| 3.4† | Amendment No. 1 to Bylaws of the Registrant, dated November 2, 2002 | |
| 3.5* | Form of Amended and Restated Bylaws of the Registrant, to be in effect upon completion of this offering | |
| 4.1 | Reference is made to exhibits 3.1, 3.2, 3.3 and 3.5 | |
| 4.2* | Specimen Common Stock Certificate of the Registrant | |
| 4.3† | Amended and Restated Investor Rights Agreement dated November 30, 2007, by and among the Registrant and certain of its security holders | |
| 4.4† | Form of Warrant to Purchase Preferred Stock of Registrant issued to Intel Capital Corporation | |
| 4.5† | Stock Purchase Warrant, issued to LG Innovation Venture Fund, Asia Pacific Venture Invest L.P., Asia Pacific Venture Invest II L.P. and KTB Network dated May 26, 2011 | |
| 4.6† | Form of Warrant to Purchase Shares of the Registrant, issued to Parakletos@Ventures 1999 Fund, L.P. | |
| 4.7† | Form of Stock Purchase Warrant, issued to M-China Investment, LP, M-Venture Investment, Inc. and AJU IB Investments Co. | |
| 4.8† | Form of Convertible Promissory Note for Series F Preferred Stock | |
| 4.9† | Convertible Promissory Note between the Registrant and Seowon Intech Co., Ltd., dated December 12, 2008 | |
| 4.10† | Convertible Promissory Note between the Registrant and M-China Investment Limited Partnership, dated February 6, 2009 | |
| 4.11† | Convertible Promissory Note between the Registrant and LG Innovation Venture Fund, Asia Pacific Venture Invest L.P., Asia Pacific Venture Invest II L.P. and KTB Network, dated May 26, 2011 | |
| 5.1* | Opinion of Morgan, Lewis & Bockius LLP | |
| 10.1+† | Form of Indemnity Agreement entered into between the Registrant and its directors and executive officers | |
| 10.2+† | 1999 Stock Option Plan | |
II-3
Table of Contents
| Exhibit |
Description of Document | |
| 10.3+† | Forms of Notice of Grant, Exercise Agreement and Stock Purchase Agreement under the 1999 Stock Option Plan | |
| 10.4+† | 2002 Special Stock Option/Stock Issuance Plan | |
| 10.5+† | Forms of Notice of Grant, Stock Option Agreement, and Stock Purchase Agreement for U.S. Optionees and forms of Notice of Grant, Stock Option Agreement, and Stock Purchase Agreements for Korea Optionees under the 2002 Special Stock Option/Stock Issuance Plan | |
| 10.6+† | 2010 Stock Option/Stock Issuance Plan | |
| 10.7+† | Forms of Notice of Grant of Stock Option, Stock Option Agreement, and Stock Purchase Agreement under the 2010 Stock Option/Stock Issuance Plan | |
| 10.8+† | 2011 Employee Stock Purchase Plan, to be in effect upon completion of this offering | |
| 10.9+† | 2011 Incentive Compensation Plan | |
| 10.10+† | Forms of Notice of Grant, Stock Option Agreement and Restricted Stock Unit Issuance Agreement under the 2011 Incentive Compensation Plan | |
| 10.11+† | Employment Offer Letter between the Registrant and Ron Wilderink, dated March 19, 2003 | |
| 10.12+† | Employment Offer Letter between the Registrant and John Schlaefer, dated December 16, 2005 | |
| 10.13+† | Amended and Restated Employment Offer Letter between the Registrant and Gene Kulzer, dated June 2, 2011 | |
| 10.14+† | Employment Offer Letter between the Registrant and Alex Sum, dated April 8, 2002 | |
| 10.15+† | Offer Letter between the Registrant and George de Urioste, dated April 21, 2011 | |
| 10.16+† | Offer Letter between the Registrant and Robert Barker, dated April 7, 2011 | |
| 10.17† | Standard Industrial Lease between the Registrant and The Realty Associates Fund III, L.P., dated February 15, 2001 | |
| 10.18† | First Amendment to Industrial Lease between the Registrant and FR/CAL Northwest Alpha, LLC, dated March 15, 2006 | |
| 10.19† | Second Amendment to Industrial Lease between the Registrant and Stephens & Stephens (Ringwood II), LLC, dated July 9, 2007 | |
| 10.20† | Third Amendment to Industrial Lease between the Registrant and Stephens & Stephens (Ringwood II), LLC, dated April 6, 2010 | |
| 10.21† | Translation of Lease Agreement between the Registrant and Korea Construction Financial Cooperative, dated September 2, 2005 | |
| 10.22† | Translation of Amendment to Lease Agreement between the Registrant and Korea Specialty Contractor Financial Cooperative, dated December 31, 2009 | |
| 10.23† | Translation of Amendment to Lease Agreement between the Registrant and Korea Specialty Contractor Financial Cooperative, dated December 31, 2010 | |
| 10.24† | Amended and Restated Loan and Security Agreement between the Registrant and Comerica Bank, dated April 4, 2011 | |
| 10.25* | First Amendment to Amended and Restated Loan and Security Agreement and Waiver, dated June 22, 2011 | |
| 10.26* | Second Amendment to Amended and Restated Loan and Security Agreement and Waiver, dated July 28, 2011 | |
| 10.27* | Third Amendment to Amended and Restated Loan and Security Agreement and Waiver, dated September 2, 2011 | |
| 10.28† | Translation of Corporate Bond between the Registrant and KB Kookmin Bank Co., Ltd., dated June 17, 2009 | |
II-4
Table of Contents
| Exhibit |
Description of Document | |
| 10.29† | Translation of Corporate Bond Agreement between the Registrant and Korea Development Bank Loan, dated April 30, 2009 | |
| 10.30+† | Promissory Note issued to Kyeong Ho Lee, dated December 15, 2003 | |
| 10.31+† | Promissory Note issued to Kyeong Ho Lee, dated April 11, 2005 | |
| 10.32+† | Promissory Note issued to Kyeong Ho Lee, dated September 19, 2008 | |
| 10.33+† | Promissory Note issued to Kyeong Ho Lee, dated December 15, 2009 | |
| 10.34#† | Daejin Distributor Agreement: International Distribution Agreement between the Registrant and Daejin Semiconductor, dated March 5, 2007. | |
| 10.35#† | LTE SOC Joint Development Agreement between the Registrant and LG Electronics Inc., dated February 24, 2009 | |
| 10.36#† | Technology License Agreement, between the Registrant and ARM Limited, dated June 27, 2006, including amendments thereto | |
| 10.37#† | Take or Pay Agreement between the Registrant and United Test and Assembly, Ltd., dated February 1, 2011 | |
| 10.38#† | Take or Pay Agreement between the Registrant and Giga Solution, dated May 1, 2011 | |
| 10.39* | Engagement Letter by and between the Registrant and Moelis & Company LLC, dated April 21, 2011 | |
| 10.40 | Amendment to Promissory Note issued to Kyeong Ho Lee, dated September 28, 2011 | |
| 21.1† | List of Subsidiaries of the Registrant | |
| 23.1 | Consent of PricewaterhouseCoopers LLP, independent registered public accounting firm | |
| 23.2* | Consent of Morgan, Lewis & Bockius LLP (included in Exhibit 5.1) | |
| 24.1† | Power of Attorney (See page II-6) | |
| * | To be filed by amendment. |
| + | Indicates management contract or compensatory plan. |
| # | Confidential treatment has been requested with respect to certain portions of this exhibit. Omitted portions have been filed separately with the Securities and Exchange Commission. |
| † | Previously filed. |
Item 17. Undertakings
Insofar as indemnification for liabilities arising under the Securities Act of 1933, as amended, may be permitted to directors, officers and controlling persons of the registrant pursuant to the foregoing provisions, or otherwise, the registrant has been advised that in the opinion of the Securities and Exchange Commission such indemnification is against public policy as expressed in the Securities Act of 1933, as amended, and is, therefore, unenforceable. In the event that a claim for indemnification against such liabilities (other than the payment by the registrant of expenses incurred or paid by a director, officer or controlling person of the registrant in the successful defense of any action, suit or proceeding) is asserted by such director, officer or controlling person in connection with the securities being registered, the registrant will, unless in the opinion of its counsel the matter has been settled by controlling precedent, submit to a court of appropriate jurisdiction the question whether such indemnification by it is against public policy as expressed in the Securities Act of 1933, as amended, and will be governed by the final adjudication of such issue.
The registrant hereby undertakes that:
(1) For purposes of determining any liability under the Securities Act of 1933, as amended, the information omitted from the form of prospectus filed as part of this registration statement in reliance upon Rule 430A and contained in a form of prospectus filed by the registrant pursuant to Rule 424(b)(1) or (4) or
II-5
Table of Contents
497(h) under the Securities Act of 1933, as amended, shall be deemed to be part of this registration statement as of the time it was declared effective; and
(2) For the purpose of determining any liability under the Securities Act of 1933, as amended, each post-effective amendment that contains a form of prospectus shall be deemed to be a new registration statement relating to the securities offered therein, and the offering of such securities at that time shall be deemed to be the initial bona fide offering thereof.
The registrant will provide to the underwriters at the closing as specified in the underwriting agreement, certificates in such denominations and registered in such names as required by the underwriters to permit prompt delivery to each purchaser.
(b) Financial Statement Schedules
No financial statement schedules are provided because the information called for is not required or is shown either in the financial statements or the notes thereto.
II-6
Table of Contents
SIGNATURES
Pursuant to the requirements of the Securities Act of 1933, as amended, the registrant has duly caused this Amendment No. 1 to the Registration Statement to be signed on its behalf by the undersigned, thereunto duly authorized, in the City of San Jose, State of California, on the 25th day of October 2011.
| GCT SEMICONDUCTOR, INC. | ||
| By: |
/s/ KYEONGHO LEE | |
| Kyeongho Lee President and Chief Executive Officer | ||
Pursuant to the requirements of the Securities Act of 1933, as amended, this Amendment No. 1 to the Registration Statement has been signed by the following persons in the capacities indicated.
| Signature |
Title |
Date | ||
| /s/ KYEONGHO LEE Kyeongho Lee |
President, Chief Executive Officer and Director (Principal Executive Officer) |
October 25, 2011 | ||
| /s/ GENE KULZER Gene Kulzer |
Chief Financial and Administrative Officer (Principal Accounting and Financial Officer) |
October 25, 2011 | ||
| * Paul H.J. Kim |
Chairman of the Board | October 25, 2011 | ||
| * Robert J. Barker |
Director | October 25, 2011 | ||
| * George de Urioste |
Director | October 25, 2011 | ||
| * Kary Eldred |
Director | October 25, 2011 | ||
| *By: |
/s/ KYEONGHO LEE | |
| Kyeongho Lee Attorney-in-Fact | ||
II-7
Table of Contents
EXHIBIT INDEX
| Exhibit |
Description of Document | |
| 1.1* | Form of Underwriting Agreement | |
| 3.1† | Amended and Restated Certificate of Incorporation of the Registrant, as currently in effect | |
| 3.2* | Form of Amended and Restated Certificate of Incorporation of the Registrant, to be in effect upon completion of this offering | |
| 3.3† | Bylaws of the Registrant, as currently in effect | |
| 3.4† | Amendment No. 1 to Bylaws of the Registrant, dated November 2, 2002 | |
| 3.5* | Form of Amended and Restated Bylaws of the Registrant, to be in effect upon completion of this offering | |
| 4.1 | Reference is made to exhibits 3.1, 3.2, 3.3 and 3.5 | |
| 4.2* | Specimen Common Stock Certificate of the Registrant | |
| 4.3† | Amended and Restated Investor Rights Agreement dated November 30, 2007, by and among the Registrant and certain of its security holders | |
| 4.4† | Form of Warrant to Purchase Preferred Stock of Registrant issued to Intel Capital Corporation | |
| 4.5† | Stock Purchase Warrant, issued to LG Innovation Venture Fund, Asia Pacific Venture Invest L.P., Asia Pacific Venture Invest II L.P. and KTB Network dated May 26, 2011 | |
| 4.6† | Form of Warrant to Purchase Shares of the Registrant, issued to Parakletos@Ventures 1999 Fund, L.P. | |
| 4.7† | Form of Stock Purchase Warrant, issued to M-China Investment, LP, M-Venture Investment, Inc. and AJU IB Investments Co. | |
| 4.8† | Form of Convertible Promissory Note for Series F Preferred Stock | |
| 4.9† | Convertible Promissory Note between the Registrant and Seowon Intech Co., Ltd., dated December 12, 2008 | |
| 4.10† | Convertible Promissory Note between the Registrant and M-China Investment Limited Partnership, dated February 6, 2009 | |
| 4.11† | Convertible Promissory Note between the Registrant and LG Innovation Venture Fund, Asia Pacific Venture Invest L.P., Asia Pacific Venture Invest II L.P. and KTB Network, dated May 26, 2011 | |
| 5.1* | Opinion of Morgan, Lewis & Bockius LLP | |
| 10.1+† | Form of Indemnity Agreement entered into between the Registrant and its directors and executive officers | |
| 10.2+† | 1999 Stock Option Plan | |
| 10.3+† | Forms of Notice of Grant, Exercise Agreement and Stock Purchase Agreement under the 1999 Stock Option Plan | |
| 10.4+† | 2002 Special Stock Option/Stock Issuance Plan | |
| 10.5+† | Forms of Notice of Grant, Stock Option Agreement, and Stock Purchase Agreement for U.S. Optionees and forms of Notice of Grant, Stock Option Agreement, and Stock Purchase Agreements for Korea Optionees under the 2002 Special Stock Option/Stock Issuance Plan | |
| 10.6+† | 2010 Stock Option/Stock Issuance Plan | |
| 10.7+† | Forms of Notice of Grant of Stock Option, Stock Option Agreement, and Stock Purchase Agreement under the 2010 Stock Option/Stock Issuance Plan | |
| 10.8+† | 2011 Employee Stock Purchase Plan, to be in effect upon completion of this offering | |
| 10.9+† | 2011 Incentive Compensation Plan | |
| 10.10+† | Forms of Notice of Grant, Stock Option Agreement and Restricted Stock Unit Issuance Agreement under the 2011 Incentive Compensation Plan | |
| 10.11+† | Employment Offer Letter between the Registrant and Ron Wilderink, dated March 19, 2003 | |
Table of Contents
| Exhibit |
Description of Document | |
| 10.12+† | Employment Offer Letter between the Registrant and John Schlaefer, dated December 16, 2005 | |
| 10.13+† | Amended and Restated Employment Offer Letter between the Registrant and Gene Kulzer, dated June 2, 2011 | |
| 10.14+† | Employment Offer Letter between the Registrant and Alex Sum, dated April 8, 2002 | |
| 10.15+† | Offer Letter between the Registrant and George de Urioste, dated April 21, 2011 | |
| 10.16+† | Offer Letter between the Registrant and Robert Barker, dated April 7, 2011 | |
| 10.17† | Standard Industrial Lease between the Registrant and The Realty Associates Fund III, L.P., dated February 15, 2001 | |
| 10.18† | First Amendment to Industrial Lease between the Registrant and FR/CAL Northwest Alpha, LLC, dated March 15, 2006 | |
| 10.19† | Second Amendment to Industrial Lease between the Registrant and Stephens & Stephens (Ringwood II), LLC, dated July 9, 2007 | |
| 10.20† | Third Amendment to Industrial Lease between the Registrant and Stephens & Stephens (Ringwood II), LLC, dated April 6, 2010 | |
| 10.21† | Translation of Lease Agreement between the Registrant and Korea Construction Financial Cooperative, dated September 2, 2005 | |
| 10.22† | Translation of Amendment to Lease Agreement between the Registrant and Korea Specialty Contractor Financial Cooperative, dated December 31, 2009 | |
| 10.23† | Translation of Amendment to Lease Agreement between the Registrant and Korea Specialty Contractor Financial Cooperative, dated December 31, 2010 | |
| 10.24† | Amended and Restated Loan and Security Agreement between the Registrant and Comerica Bank, dated April 4, 2011 | |
| 10.25* | First Amendment to Amended and Restated Loan and Security Agreement and Waiver, dated June 22, 2011 | |
| 10.26* | Second Amendment to Amended and Restated Loan and Security Agreement and Waiver, dated July 28, 2011 | |
| 10.27* | Third Amendment to Amended and Restated Loan and Security Agreement and Waiver, dated September 2, 2011 | |
| 10.28† | Translation of Corporate Bond between the Registrant and KB Kookmin Bank Co., Ltd., dated June 17, 2009 | |
| 10.29† | Translation of Corporate Bond Agreement between the Registrant and Korea Development Bank Loan, dated April 30, 2009 | |
| 10.30+† | Promissory Note issued to Kyeong Ho Lee, dated December 15, 2003 | |
| 10.31+† | Promissory Note issued to Kyeong Ho Lee, dated April 11, 2005 | |
| 10.32+† | Promissory Note issued to Kyeong Ho Lee, dated September 19, 2008 | |
| 10.33+† | Promissory Note issued to Kyeong Ho Lee, dated December 15, 2009 | |
| 10.34#† | Daejin Distributor Agreement: International Distribution Agreement between the Registrant and Daejin Semiconductor, dated March 5, 2007. | |
| 10.35#† | LTE SOC Joint Development Agreement between the Registrant and LG Electronics Inc., dated February 24, 2009 | |
| 10.36#† | Technology License Agreement, between the Registrant and ARM Limited, dated June 27, 2006, including amendments thereto | |
| 10.37#† | Take or Pay Agreement between the Registrant and United Test and Assembly, Ltd., dated February 1, 2011 | |
| 10.38#† | Take or Pay Agreement between the Registrant and Giga Solution, dated May 1, 2011 | |
| 10.39* | Engagement Letter by and between the Registrant and Moelis & Company LLC, dated April 21, 2011 | |
| 10.40 | Amendment to Promissory Note issued to Kyeong Ho Lee, dated September 28, 2011 | |
| 21.1† | List of Subsidiaries of the Registrant | |
| 23.1 | Consent of PricewaterhouseCoopers LLP, independent registered public accounting firm | |
| 23.2* | Consent of Morgan, Lewis & Bockius LLP (included in Exhibit 5.1) | |
Table of Contents
| Exhibit |
Description of Document | |
| 24.1† | Power of Attorney (See page II-6) | |
| * | To be filed by amendment. |
| + | Indicates management contract or compensatory plan. |
| # | Confidential treatment has been requested with respect to certain portions of this exhibit. Omitted portions have been filed separately with the Securities and Exchange Commission. |
| † | Previously filed. |