Attached files
| file | filename |
|---|---|
| 8-K - FORM 8-K - C. H. ROBINSON WORLDWIDE, INC. | d247472d8k.htm |
| EX-99.1 - PRESS RELEASE - C. H. ROBINSON WORLDWIDE, INC. | d247472dex991.htm |
 1
Earnings Conference Call –
Third Quarter 2011
October 25, 2011
John Wiehoff, Chairman & CEO
Chad Lindbloom, CFO
Angie Freeman, VP Investor Relations
Exhibit 99.2 |
 2
Safe Harbor Statement
Except for the historical information contained herein, the matters set forth in
this presentation and the accompanying earnings release are
forward-looking statements that represent our expectations, beliefs,
intentions or strategies concerning future events. These forward-looking
statements are subject to certain risks and uncertainties that could cause actual
results to differ materially from our historical experience or our present
expectations, including, but not limited to such factors as changes in
economic conditions, including uncertain consumer demand; changes in market
demand and pressures on the pricing for our services; competition and growth
rates within the third party logistics industry; freight levels and increasing costs and
availability of truck capacity or alternative means of transporting freight, and
changes in relationships with existing truck, rail, ocean and air
carriers; changes in our customer base due
to possible consolidation among our customers; our ability to integrate the
operations of acquired companies with our historic operations successfully;
risks associated with litigation and insurance coverage; risks associated
with operations outside of the U.S.; risks associated with the potential
impacts of changes in government regulations; risks associated with the produce
industry, including food safety and contamination issues; fuel prices and
availability; and the impact of war on the economy; and other risks and
uncertainties detailed in our Annual and Quarterly Reports.
|
 3
Financial Results
2011
2010
% Change
2011
2010
% Change
Total revenues
$2,694,928
$2,420,357
11.3%
$7,768,062
$6,948,956
11.8%
Total net revenues
$423,066
$382,580
10.6%
$1,231,273
$1,079,814
14.0%
Income from
operations
$183,965
$166,333
10.6%
$520,775
$458,795
13.5%
Net income
$114,347
$102,627
11.4%
$322,398
$283,865
13.6%
Earnings per share
(diluted)
$0.70
$0.62
12.9%
$1.95
$1.71
14.0%
Three months ended September 30
Nine months ended September 30
In thousands, except per share amounts |
 4
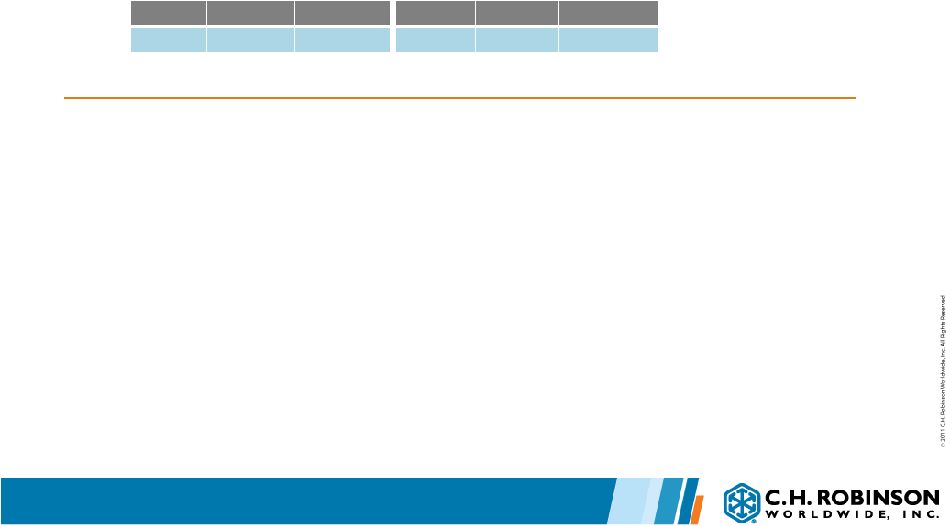
Transportation Results Q3 2011
•
Transportation net revenue growth was driven primarily by Truckload price
increases compared to Q3 2010
•
Transportation net revenue margin was slightly less than the 10-year average
for third quarters
2011
2010
% Change
2011
2010
% Change
Total revenues
$2,280,208
$2,026,154
12.5%
$6,540,266
$5,629,334
16.2%
Total net revenues
$374,477
$336,564
11.3%
$1,085,244
$931,356
16.5%
Net revenue margin
16.4%
16.6%
-1.1%
16.6%
16.5%
0.3%
Three months ended September 30
Nine months ended September 30
TRANSPORTATION in thousands
2001
2002
2003
2004
2005
2006
2007
2008
2009
2010
Q1
17.5%
17.7%
17.8%
16.8%
17.4%
18.3%
20.2%
18.2%
22.6%
17.4%
Q2
16.9%
16.1%
15.9%
15.4%
16.3%
17.1%
17.9%
15.4%
20.6%
15.8%
Q3
16.6%
15.6%
16.0%
15.9%
16.3%
17.5%
18.0%
15.9%
19.8%
16.6%
Q4
16.0%
16.2%
15.8%
16.0%
15.7%
18.3%
17.7%
19.0%
18.3%
17.6%
TRANSPORTATION MARGIN PERCENTAGE
2011
17.2%
16.2%
16.4% |
 5
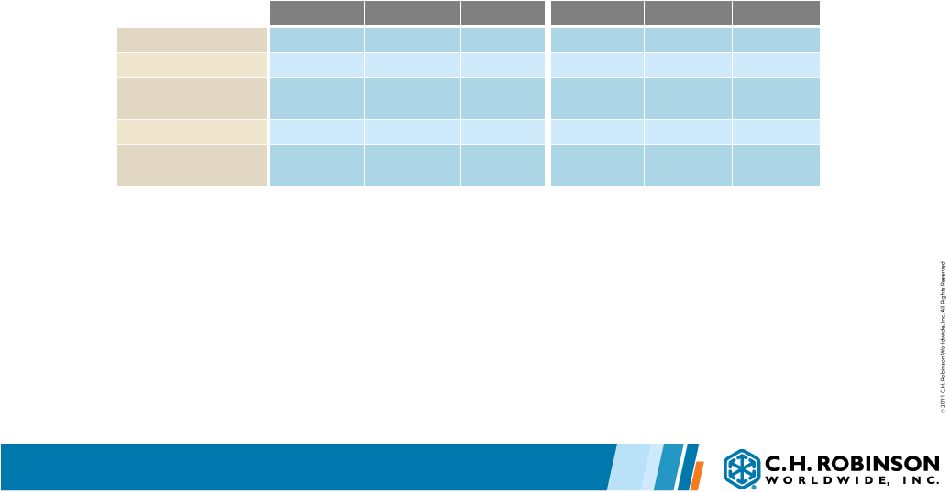
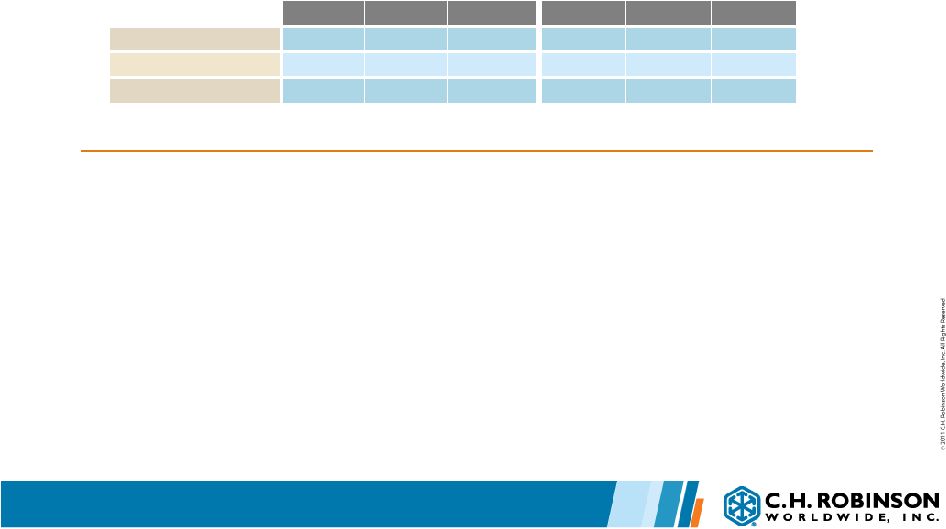
Truck Results Q3 2011
2011
2010
% Change
2011
2010
% Change
$321,366
$284,200
13.1%
$930,168
$785,782
18.4%
Three months ended September 30
Nine months ended September 30
TRUCK NET REVENUES in thousands
Quarter
Year to Date
Volume
4%
5%
Pricing *
4%
6%
Net revenue margin
TRUCKLOAD
Quarter
Year to Date
Volume
15%
15%
Pricing
Net revenue margin
LTL
Year over year change
Year over year change
*Excluding estimated impact of fuel
•
Truckload net revenue growth was driven primarily by increased pricing
•
Truckload net revenue margin was reduced by the higher cost of fuel
•
Within the quarter, Truckload volume growth was consistent; Truckload net revenue
margin declined as the quarter progressed
•
North American Truckload volume growth per business day through October 24 is
approximately 6.5%
•
Less-than-Truckload (LTL) net revenue growth was driven primarily by
increased volumes |
 6
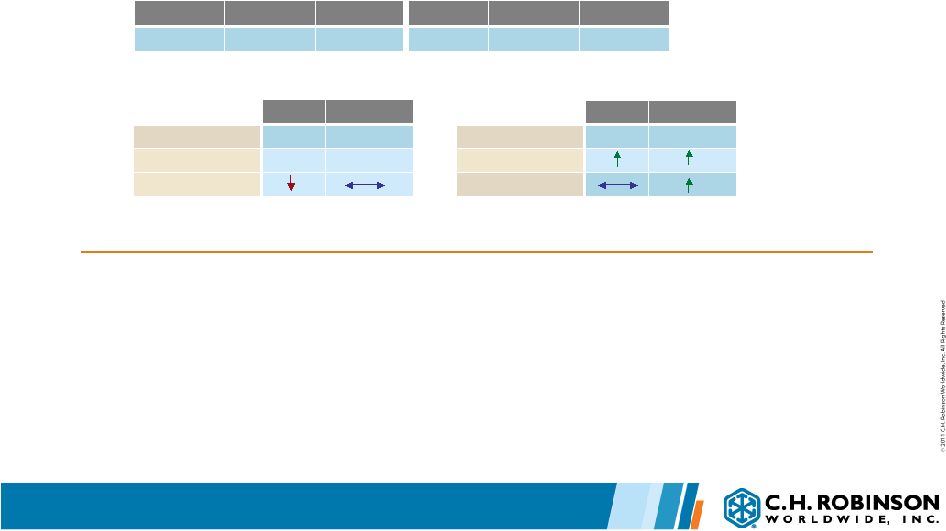
Intermodal Results Q3 2011
•
Net revenue growth was driven by volume growth and increased pricing compared to
Q3 2010
•
Continued success with committed equipment
2011
2010
% Change
2011
2010
% Change
$10,538
$9,188
14.7%
$31,000
$27,109
14.4%
Three months ended Sept. 30
Nine months ended Sept. 30
INTERMODAL NET REVENUES in thousands
Quarter
Year to Date
Volume
Pricing
Net revenue margin
Year over year change |
 7
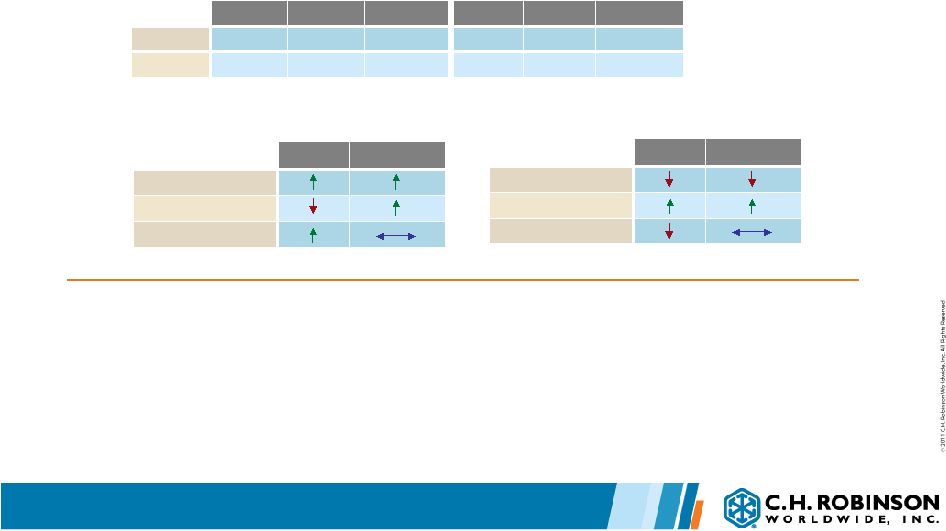
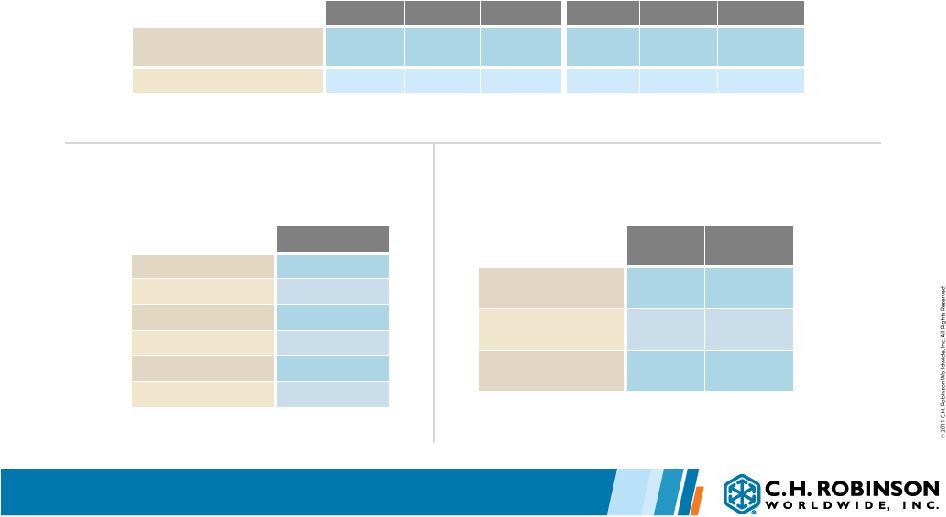
Ocean & Air Results Q3 2011
•
Ocean net revenue growth was driven primarily by increased volumes
•
Air net revenue decline was driven by decreased volumes and net revenue margin
compression
2011
2010
% Change
2011
2010
% Change
Ocean
$17,881
$17,057
4.8%
$49,851
$44,049
13.2%
Air
$9,940
$11,453
-13.2%
$30,560
$31,559
-3.2%
Three months ended Sept. 30
Nine months ended Sept. 30
NET REVENUES in thousands
Quarter
Year to Date
Volume
Pricing
Net revenue margin
OCEAN
Quarter
Year to Date
Volume
Pricing
Net revenue margin
AIR
Year over year change
Year over year change |
 8
Other Logistics Services Results Q3 2011
•
Other Logistics Services includes Transportation Management Fees, Customs,
Warehousing, and Small Parcel
•
Management Fee and Customs growth were offset by results of other services in this
category
2011
2010
% Change
2011
2010
% Change
$14,752
$14,666
0.6%
$43,665
$42,857
1.9%
Three months ended September 30
Nine months ended September 30
NET REVENUES in thousands
|
 9
Sourcing Results Q3 2011
•
Sourcing net revenue growth was driven by a change in our mix of
services
•
Acquisition of Timco, melon category provider, on September 26
2011
2010
% Change
2011
2010
% Change
Total revenues
$399,220
$380,108
5.0%
$1,182,784
$1,278,837
-7.5%
Total net revenues
$33,089
$31,921
3.7%
$101,017
$107,673
-6.2%
Net revenue margin
8.3%
8.4%
-1.3%
8.5%
8.4%
1.4%
Three months ended Sept. 30
Nine months ended Sept. 30
SOURCING in thousands |
 10
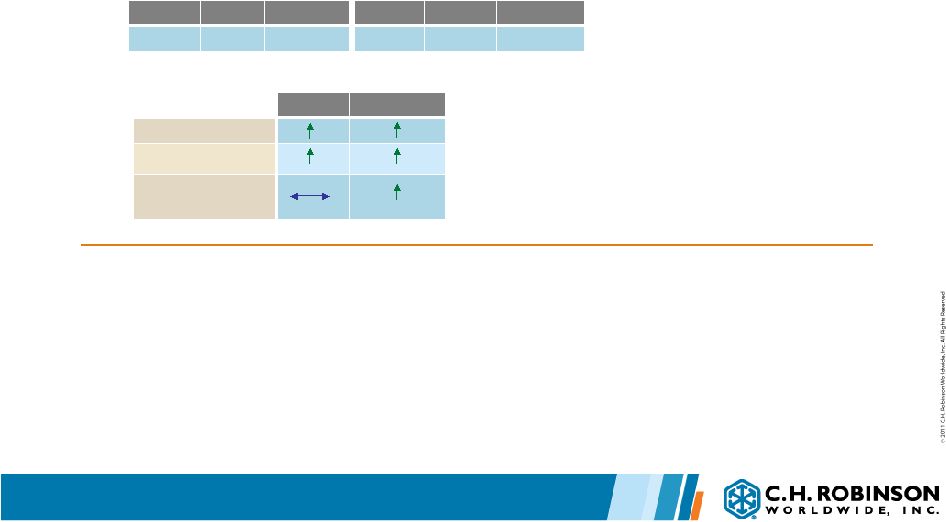
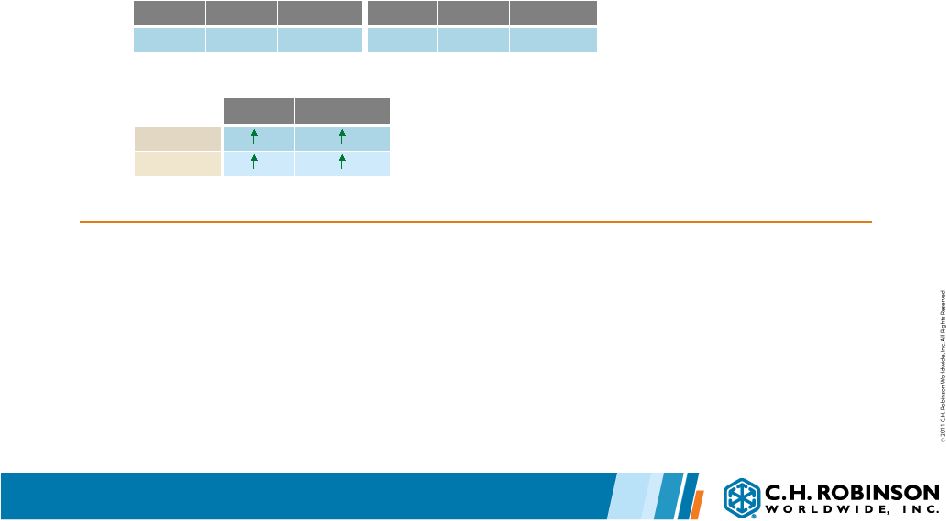
Payment Services Results Q3 2011
•
Volume growth was driven by increase in MasterCard
®
services
•
Increased fees were driven by higher fuel prices
2011
2010
% Change
2011
2010
% Change
$15,500
$14,095
10.0%
$45,012
$40,785
10.4%
Three months ended Sept. 30
Nine months ended Sept. 30
PAYMENT SERVICES in thousands
Quarter
Year to Date
Volume
Pricing
Year over year change |
 11
Summarized Income Statement
2011
2010
% Change
2011
2010
% Change
Total net revenues
$423,066
$382,580
10.6%
$1,231,273
$1,079,814
14.0%
Operating expenses:
Personnel expenses
$178,117
$161,947
10.0%
$532,171
$462,793
15.0%
Percent of net revenues
42.1%
42.3%
43.2%
42.9%
Other operating expenses
$60,984
$54,300
12.3%
$178,327
$158,226
12.7%
Percent of net revenues
14.4%
14.2%
14.5%
14.7%
Total Operating expenses
$239,101
$216,247
10.6%
$710,498
$621,019
14.4%
Income from Operations
$183,965
$166,333
10.6%
$520,775
$458,795
13.5%
Percent of net revenues
43.5%
43.5%
42.3%
42.5%
Three months ended September 30
Nine months ended September 30
In thousands, except per share amounts
•
Overall, operating expense growth was in line with growth of business
•
For the quarter, personnel expense as a percentage of net revenues decreased
slightly •
Total net revenue growth per business day through October 24 is approximately
6% |
 12
2011
2010
% Change
2011
2010
% Change
Net cash provided by
operating activities
$214,701
$127,263
68.7%
$293,555
$137,136
114.1%
Capital expenditures, net
$9,296
$8,970
3.6%
$29,081
$21,715
33.9%
Three months ended Sept. 30
Nine months ended Sept. 30
Quarter
Year to
Date
Shares repurchased
1,408,314
2,280,802
Average price per
share
$68.88
$70.81
Cash used for share
repurchases
$96,999
$161,498
Sept. 30, 2011
Cash & investments
$382,737
Current assets
$1,656,748
Total assets
$2,179,438
Current liabilities
$896,709
Stockholder’s equity
$1,268,224
Long term debt
$0
CASH FLOW DATA
2011
BALANCE SHEET DATA
REPURCHASES OF COMMON STOCK
Other Financial Information
In thousands, except per share amounts |
 13 |