Attached files
| file | filename |
|---|---|
| 8-K - FORM 8-K - NETFLIX INC | d246709d8k.htm |
Exhibit 99.1
October 24th, 2011
Dear Fellow Shareholders,
The Internet is transforming video entertainment, stream by stream, consumer by consumer, nation by nation. Our opportunity is to be one of the leaders of this transformation with the best streaming video subscription service on the planet. The last few months, however, have been difficult for shareholders, employees, and most unfortunately, many members of Netflix. While we dramatically improved our $7.99 unlimited streaming service by embracing new platforms, simplifying our user-interface, and more than doubling domestic spending on streaming content over 2010, we greatly upset many domestic Netflix members with our significant DVD-related pricing changes, and to a lesser degree, with the proposed-and-now-cancelled rebranding of our DVD service. In doing so, we’ve hurt our hard-earned reputation, and stalled our domestic growth. But our long-term streaming opportunity is as compelling as ever and we are moving forward as quickly as we can to repair our reputation and return to growth.
| (in millions except per share data) |
Q3 ‘09 | Q4 ‘09 | Q1 ‘10 | Q2 ‘10 | Q3 ‘10 | Q4 ‘10 | Q1 ‘11 | Q2 ‘11 | Q3 ‘11 | |||||||||||||||||||||||||||
| Domestic: |
||||||||||||||||||||||||||||||||||||
| Streaming Subscriptions |
21.45 | |||||||||||||||||||||||||||||||||||
| DVD Subscriptions |
13.93 | |||||||||||||||||||||||||||||||||||
| Total Unique US Subscribers |
11.11 | 12.27 | 13.97 | 15.00 | 16.80 | 19.50 | 22.80 | 24.59 | 23.79 | |||||||||||||||||||||||||||
| Y/Y Change |
28 | % | 31 | % | 35 | % | 42 | % | 51 | % | 59 | % | 63 | % | 64 | % | 42 | % | ||||||||||||||||||
| Net Subscriber Additions |
0.51 | 1.16 | 1.70 | 1.03 | 1.80 | 2.70 | 3.30 | 1.80 | -0.81 | |||||||||||||||||||||||||||
| Y/Y Change |
95 | % | 61 | % | 85 | % | 255 | % | 253 | % | 133 | % | 94 | % | 75 | % | -145 | % | ||||||||||||||||||
| Revenue |
$ | 423 | $ | 445 | $ | 494 | $ | 520 | $ | 553 | $ | 592 | $ | 706 | $ | 770 | $ | 799 | ||||||||||||||||||
| Y/Y Change |
24 | % | 24 | % | 25 | % | 27 | % | 31 | % | 33 | % | 43 | % | 48 | % | 44 | % | ||||||||||||||||||
| Contribution Profit |
$ | 89 | $ | 98 | $ | 111 | $ | 130 | $ | 130 | $ | 152 | $ | 187 | $ | 213 | $ | 219 | ||||||||||||||||||
| Y/Y Change |
32 | % | 38 | % | 53 | % | 40 | % | 46 | % | 55 | % | 68 | % | 64 | % | 68 | % | ||||||||||||||||||
| Operating Income |
$ | 49 | $ | 53 | $ | 58 | $ | 77 | $ | 72 | $ | 88 | $ | 113 | $ | 124 | $ | 120 | ||||||||||||||||||
| Y/Y Change |
45 | % | 39 | % | 61 | % | 45 | % | 47 | % | 66 | % | 95 | % | 61 | % | 67 | % | ||||||||||||||||||
| International: |
||||||||||||||||||||||||||||||||||||
| Subscriptions |
— | — | — | — | 0.13 | 0.51 | 0.80 | 0.97 | 1.48 | |||||||||||||||||||||||||||
| Net Subscription Additions |
— | — | — | — | 0.13 | 0.38 | 0.29 | 0.16 | 0.51 | |||||||||||||||||||||||||||
| Revenue |
— | — | — | — | $ | — | $ | 4 | $ | 12 | $ | 19 | $ | 23 | ||||||||||||||||||||||
| Contribution Profit (Loss) |
— | — | — | — | $ | (3 | ) | $ | (9 | ) | $ | (11 | ) | $ | (9 | ) | $ | (23 | ) | |||||||||||||||||
| Global: |
||||||||||||||||||||||||||||||||||||
| Revenue |
$ | 423 | $ | 445 | $ | 494 | $ | 520 | $ | 553 | $ | 596 | $ | 719 | $ | 789 | $ | 822 | ||||||||||||||||||
| Y/Y Change |
24 | % | 24 | % | 25 | % | 27 | % | 31 | % | 34 | % | 46 | % | 52 | % | 49 | % | ||||||||||||||||||
| Net Income |
$ | 30 | $ | 31 | $ | 32 | $ | 44 | $ | 38 | $ | 47 | $ | 60 | $ | 68 | $ | 62 | ||||||||||||||||||
| Y/Y Change |
48 | % | 35 | % | 45 | % | 38 | % | 27 | % | 52 | % | 88 | % | 55 | % | 63 | % | ||||||||||||||||||
| EPS |
$ | 0.52 | $ | 0.56 | $ | 0.59 | $ | 0.80 | $ | 0.70 | $ | 0.87 | $ | 1.11 | $ | 1.26 | $ | 1.16 | ||||||||||||||||||
| Y/Y Change |
58 | % | 47 | % | 59 | % | 48 | % | 35 | % | 55 | % | 88 | % | 58 | % | 66 | % | ||||||||||||||||||
| Free Cash Flow |
$ | 26 | $ | 30 | $ | 38 | $ | 34 | $ | 8 | $ | 51 | $ | 79 | $ | 60 | $ | 14 | ||||||||||||||||||
| Buyback |
$ | 130 | $ | 79 | $ | 108 | $ | 45 | $ | 57 | $ | — | $ | 109 | $ | 51 | $ | 40 | ||||||||||||||||||
| Shares (FD) |
57.9 | 55.5 | 54.8 | 54.3 | 53.9 | 54.2 | 54.2 | 53.9 | 53.9 | |||||||||||||||||||||||||||
|
|
1 |

DVD and Streaming
We think that $7.99 for unlimited streaming and $7.99 for unlimited DVD are both very aggressive low prices, relative to competition and to the value of the services, and they are the right place for Netflix to be in the long term. What we misjudged was how quickly to move there. We compounded the problem with our lack of explanation about the rising cost of the expansion of streaming content, and steady DVD costs, so that absent that explanation, many perceived us as greedy. Finally, we announced and then retracted a separate brand for DVD. While this branding incident further dented our reputation, and caused a temporary cancellation surge, compared to our price change, its impact was relatively minor. Our primary issue is many of our long-term members felt shocked by the pricing changes, and more of them have expressed that by cancelling Netflix than we expected.
Because of this, our revenue and profits in Q4 will be lower than we had anticipated, but we’ll remain profitable on a global basis. In Q1’12 we’ll be launching in the UK and Ireland, as we had planned. For a few quarters starting in Q1, we expect the costs of our entry into the UK and Ireland will push us to be unprofitable on a global basis; that is, domestic profits will not be large enough to both cover international investments and pay for global G&A and Technology & Development. After launching the UK and Ireland, we will pause on opening new international markets until we return to global profitability. We plan to do that by increasing our global streaming subscriber base faster than we increase our costs.
Investors and members will be relieved to know we are done with pricing changes, and that at $7.99 each for streaming and DVD we can move forward for a long time.
Some investors have asked us about the combination or “hybrid” offering in the U.S. In our current signup flow, we offer three choices: (a) streaming only at $7.99, (b) DVD only at $7.99, and (c) both, for $15.98. About 7% of new members choose the $15.98 hybrid offering. One could argue that this percentage would increase if we reduced the price for hybrid, but if we were going to lower prices, we would do it on streaming. Our future is in rapidly expanding streaming, but we will make sure that current hybrid subscribers continue to get a great and stable experience. As of today, less than half of our streaming subscribers also subscribe to our DVD service, and we expect that number to continue to fall, given that only 7% of new streaming subscribers also currently sign up for DVD.
We see a huge global opportunity for our $7.99 unlimited streaming service, as indicated by reaching 10% of Canadian household penetration in just one year since launching service there. In the U.S., we’ll build back our brand the same way we built it in the first place: no grand gestures, just amazing service day-after-day, for an incredibly low price.
Q3 Domestic Results
|
|
2 |
We ended the quarter with 21.4 million streaming subscriptions and 13.9 million DVD subscriptions. Unique domestic subscribers declined to 23.8 million subscribers, driven both by a higher than expected level of cancellations and a reduction in acquisitions driven by the PR storm that engulfed our brand and its impact on word-of-mouth. In spite of this, we continued to experience year-over-year growth in gross additions, acquiring 4.7 million new subscribers, or nearly 20% year-over-year growth. Not only was acquisition up compared to last year, but SAC of $15 was comparable to Q2’11 before the brand hit, and down 24% from a year ago. New subscribers are coming for our market-leading streaming service.
Domestic revenue grew 44% year-over-year to $799 million in Q3. Despite lower subscribers than expected, revenue was within expectations as subscriber cancellations were back-loaded in the quarter relative to our forecast. Domestic operating profit of $120 million, representing 15% operating margin, exceeded our previous margin target of 14% due to fewer DVD shipments than expected, in part due to fewer DVD subscribers as well as lower overall DVD usage.
Q4 Domestic Outlook
In Q4, we are providing guidance for both our domestic DVD and streaming segments, and will be reporting on that basis going forward so investors have greater transparency on the respective businesses. In the past, we have guided to a total domestic operating margin target. Going forward, we will be guiding to separate contribution profit ranges for each segment, as well as providing guidance on global net income and EPS. Similarly, we will be focused on, and therefore guiding to, streaming and DVD subscriptions, as they drive revenue for each of our domestic segments (rather than total unique domestic subscribers.) Nevertheless, we do anticipate that total unique U.S. subscribers will be slightly up in Q4.
We think DVD subscriptions will decline sharply this quarter, as reflected in our guidance, due to our price changes. Our weekly rate of DVD cancellation is steadily shrinking, as the price effect washes through, and in future quarters we expect DVD subscriptions to shrink more modestly. We don’t anticipate any additional material investment in equipment or other PP&E and a majority of our DVD library is fully depreciated; so at $7.99, the segment is profitable. We have yet to decide whether or not to offer video game discs. The decision will have little financial impact either way. We still expect DVDs to last a long time, as they serve some unique needs for completeness, for simplicity, and for those households without access to high speed broadband. Our $7.99 pricing is a full 20% lower than our nearest unlimited DVD-by-mail competitor, and our service is better because we have more distribution centers and, as such, faster delivery.
Looking at our domestic streaming segment, we started the current quarter with some subscribers who were mostly DVD users, but paying for both DVD and streaming and not using streaming enough to justify paying $7.99 for it. Those subscribers are cancelling streaming, which reduces revenue and streaming subscriptions. This cancellation wave was triggered by the debit and credit card bills arriving with our new prices. The wave peaked a few weeks ago and cancellations are now steadily declining.
At the same time, we continue to see year-over-year growth in weekly gross additions, demonstrating the continued strength of the streaming value proposition. We expect streaming net additions will be negative in October due to the cancellation wave referred to above, and as the wave subsides and gross additions remain strong, net additions will be about flat in November, and strongly positive in December. Overall for the quarter we expect slightly negative streaming net additions. Streaming hours are continuing to climb, as members who use streaming mostly stay with Netflix streaming. Our streaming hours year-to-date are up over 3 times from a year ago, and set new records most weeks.
The contribution margin for domestic streaming will be low in Q4, at around 8% assuming the mid-point of guidance, due to our increased streaming content spend. (Note: contribution profit is revenue less COGS and marketing; it doesn’t include our global G&A or Tech&Dev). We’ve been aggressively increasing our content spending, and in 2012 will nearly double what we’ve spent this year, putting us almost at par with what HBO, the biggest of the premium TV networks, spends in the U.S. and making the range and quality of content on Netflix the best it has ever been. As we grow the domestic streaming member base over coming quarters, we plan to take the streaming contribution margin up about 100 basis points every quarter.
|
|
3 |
New Domestic Content
We have continued to rapidly expand new content on the service both domestically and internationally. Specifically, we have recently closed output deals with DreamWorks Animation, Open Road, and The CW, as well as an ongoing deal with AMC, all of which will provide a unique differentiator from our competitors in the years to come. As more movies come from “mini-majors” like Open Road, Relativity and Lionsgate relative to the big Hollywood studios, Netflix members will enjoy a steady stream of great new films in addition to the hundreds of movies recently added from partners including Paramount, Sony, Miramax, MGM, Universal, and Warner Bros. In the next few weeks, the new Johnny Depp film “The Rum Diaries” and the epic action film “The Immortals” will open in theaters and be among the films available to Netflix subscribers exclusively in the pay TV window. Other recent films include “Drive” and “The Killer Elite.” Current box office hits like “Paranormal Activity 3” and “Footloose” will also be coming soon for Netflix subscribers.
Our recent agreements with AMC and the CW will assure the flow of exclusive – and addictive – prior season serialized television in the coming years. On top of shows that have proven extremely popular with Netflix members like “Mad Men” and “Breaking Bad,” licensed from Lionsgate and Sony Pictures Television, respectively, we’ve added “The Walking Dead” from AMC and series that appeal to teens and young adults like “Gossip Girl” and “Vampire Diaries” from The CW. Add this to just renewed or expanded deals with ABC, NBC Universal, FOX, CBS, Viacom Media Networks, Discovery Communications, PBS, and Sony Pictures Television, and we’ve added around 3,800 new TV episodes to the service in recent weeks. At this point, Netflix now offers prior season television content from all 5 U.S. broadcast networks and 95% of the U.S. cable networks.
Netflix Streaming Content Quality – 10x of Starz
There are various ways to evaluate the content of a video-streaming service. One way is to focus purely on quantity, but that leads to the licensing of thousands of rarely watched titles. At the other extreme is concentrating solely on quality, as measured by the number of Oscar-nominated or Emmy-nominated titles we have. Instead, we think about the value of our content as a function of how much a given movie or TV series gets watched relative to other titles, for how long and by how many members. From that perspective, an Oscar-nominated film may be of less value to Netflix subscribers than “Pawn Stars,” because subs are watching the reality show more than the Oscar-nominated movie.
We have the Starz offering within our service, and it is currently running about 6% of viewing hours because we have added so many other movies and TV shows (with no bias one way or the other in our merchandising). In other words, 94% of the time members stream from Netflix, they are watching a non-Starz title. Including the Sony films from Starz, which Starz removed from Netflix several months ago, the 6% figure would rise to about 10%. From this perspective, Netflix has about ten times the streaming content selection of full Starz, in terms of what consumers actually choose to watch.
Using a similar technique, we have analyzed all the video content offered through Amazon Prime, including the TV programs announced but not yet live. We have essentially all of this content on Netflix, and that content contributes a small fraction of Netflix viewing. Specifically, the duplicative Amazon content that is available on Netflix represents more than half of hours viewed for only 2% of our subscribers. Therefore, when evaluating Amazon Prime as a competitive stand-alone offering, this low content selection explains why we have not seen much usage of Amazon Prime in our research.
Hulu Plus is harder to analyze because we think most Hulu Plus subs are paying to get current season TV content, which Netflix does not carry, such as this week’s SNL clips, on their TV-connected devices, rather than paying for the Plus-specific content. In this sense, Hulu Plus current season TV is just a complementary content model to us, like sports or news subscriptions. Our prior season TV offering is far more complete than Hulu Plus, and our movie content is vastly larger than Hulu Plus, but, again, we think most people who pay for Hulu Plus are doing so for last-night’s TV episodes on their PS3, iPads, and other devices.
|
|
4 |
Netflix is the Content Leader – but Video is not Music
Radio stations and television networks developed with different content licensing models, and the online evolution of music and video streaming services to a large extent reflects that legacy.
With radio, automatic, non-negotiable, statutory music licensing meant that there would be no exclusivity over the music played by different radio stations. Clear Channel, for example, doesn’t get Sony Music exclusively. As music moved online from radio, the music labels and major music services – Pandora, Rhapsody, Spotify, iTunes, Amazon, and others – continued this non-exclusive practice, offering a nearly complete selection of songs.
In television, by contrast, the networks (ABC, FX, etc.) have long relied upon exclusive content to differentiate among themselves. As video moves online, so too has this practice of exclusive content. HBO has an exclusive license to recent Universal movies that includes its online HBO GO, for example. Netflix has signed exclusive licenses for DreamWorks Animation, for Relativity, and others. In episodic television, exclusives are also the norm. Netflix doesn’t license “Deadwood” from HBO because they see strategic value in keeping it exclusive. Netflix licenses “Mad Men” and “House of Cards” exclusively for much the same reason.
We have dramatically more content than any other subscription service or network, but given the existing licensing structure of the cable network industry, the total content available will likely remain carved up between Netflix, Showtime, HBO, Hulu and others. Two services can license jointly, or from one another, like Netflix and Epix, where it is in their mutual interest, but to date that has been the exception rather than the rule.
While we and our competitors face the constraints imposed by the traditional licensing structure of cable, we have many advantages over linear premium pay networks. We are unbundled, and charge a very low price of $7.99 a month. We are pure on-demand so we can create more compelling user experiences than a primarily linear channel. We are personalized, so each user interface is tailored specifically to the individual taste of a given consumer, helping them to easily find movies and TV shows they’ll enjoy. Finally, we can innovate at Internet pace rather than cable-set-top-firmware-update pace.
We don’t have to “beat” Starz or other networks to succeed. In fact, we offer significant value to the television licensing ecosystem by creating additional revenue in the prior season window for networks, which allows them to invest in additional first run content. We won’t have every movie or TV series; but we do provide enough value that consumers also want to subscribe to Netflix. Any given consumer will have only one of DirecTV or Comcast, say, for their video service. That is classic either-or competition. But with premium television networks like Netflix, the more good experiences there are, the more consumers are willing to spend to have multiple channels from which to get enjoyment.
|
|
5 |
International
We’re pleased to report that we have over 1 million Canadian members, and we made a small contribution profit in Q3 in Canada. We’re excited enough by the opportunity in Canada that, over the next year, we are doubling our quarterly content spending, starting by adding in Q4 hit feature films in their first pay window, such as “True Grit”, “Black Swan” and “The Chronicles of Narnia: Voyage of the Dawn Treader”, along with considerable high profile feature films just coming out of their first pay window, and premium catalog film titles, as well as many TV series. By the time we’ve added all this great entertainment, we will have comparable content quality to what we have in the U.S., and be spending the population-adjusted equivalent. This investment will push contribution margin back under in Canada for a few quarters, and our plan is to achieve consistent positive contribution profit starting in Q3 of next year, two years after our initial launch.
In early September, we launched Netflix in 43 countries in Latin America. Early results indicate that member count at the end of the year will be a little above Canada at the end of 2010, where we had far higher brand awareness from the start. Given that Latin America has about 4x more broadband households than Canada, there is lots of room for growth. We recently added support for Android in the region, with support for Xbox and iOS to follow in coming weeks, and are constantly adding new content. Now that we are serving hundreds of thousands of Latin Americans, we can measure what is getting enjoyed a lot, and what isn’t, and adjust our mix of content accordingly. We are just beginning in this market with a lot to learn, and a lot we can improve over time, so it’s too early to tell whether we will reach run-rate break-even within two years as we would like.
We announced this morning that we are launching in the UK and Ireland in Q1. The UK is a large media market with about 26 million households. About 20 million households have broadband Internet and video game console penetration is very high. About 60% of households subscribe to an MVPD offering from either Sky or Virgin, compared to the roughly 90% of U.S. and Canadian households that subscribe to an MVPD. The UK market is similar to Canada in that online piracy use is reasonably small and nearly everyone has a debit or credit card, unlike Latin America. In general, UK ISP’s do not have Canadian-style low broadband usage caps. Over-the-top video is more developed in the UK, with greater familiarity and usage for catch-up-TV than in Canada or the U.S., with such offerings as the BBC iPlayer and 4oD.
In terms of premium TV networks, Sky Movies has exclusives for first pay window feature films with all six major American studios, and offers service starting at £16 per month over Virgin and Sky, attracting about 4.5 million subscribers. In addition, consumers pay the mandatory BBC license fee of about £12 per month. Finally, Lovefilm has a little over 1 million subscribers in the UK paying about £10 per month for DVD-by-mail, as well as a small but growing streaming library with that offering. We believe our service, at an aggressive price, will be compelling. As in the U.S., it is not a winner takes all market; UK members will subscribe to Netflix and to other entertainment offerings. We have to attract and retain subscribers efficiently enough to be able to generate a profit. While we normally target two years to profitability, with the increased competition in the UK relative to Canada, we anticipate it may take longer. We’ll know more after our first few quarters.
|
|
6 |
TV Everywhere Dueling Models in the U.S.
We’ve written before that authentication models for Internet access of cable network content would be our eventual primary competitor. The first of the two models for authentication is that subscribers use their MVPD application, such as DishOnline, or Comcast Xfinity, to access content online from laptops, tablets, phones, game consoles, Smart TVs, and Internet set-tops. The second of the two models for authentication is subscribers use the cable TV network applications, such as HBO GO or WatchESPN on the iPad or Roku or Samsung TV. Whichever model wins viewing share over time will confer a lot of profit power on its owner, and the competition is stimulating a lot of investment by both MVPDs and networks in TV Everywhere. In the long term, Smart TVs and tablets will be similar, offering a wide range of video applications via the Internet, including Netflix. It’s slightly better for us if those other applications are also “channels” like ESPN and HBO, because they are on equal footing with us. It’s slightly worse for us if the other primary applications are EPGs like DishOnline, and Xfinity, because we wouldn’t be in those EPGs. We remain focused on making our service one of the best, in terms of consumer value and ease of use, as the market develops.
Facebook / VPPA Update
We were thrilled to announce at Facebook’s f8 conference in September our new Facebook integration that allows Netflix subscribers in Canada and Latin America to connect their Netflix subscriptions with their Facebook accounts. The Netflix/Facebook integration empowers Netflix subscribers to share what they watch on Netflix with their friends on Facebook and communicate about that content. We’ve seen strong connect rates in Latin American and Canada, but we are in the early phase of integration in these countries and we have yet to see just how powerful an impact this will have on the consumer experience and our industry.
|
|
7 |

We have decided not to launch Facebook integration in the U.S., due to the Video Privacy Protection Act (VPPA), a 1980’s law that creates some confusion over our ability to let U.S. members choose to automatically share their viewing history with friends on Facebook. A bipartisan group of lawmakers has introduced legislation, H.R. 2471, a bill to modernize the VPPA to allow subscribers to make this choice. We are pleased that this bipartisan group of lawmakers recognizes the need to modernize this law that has not kept pace with technology, and that consumers, the economy and innovative technologies will benefit if it passes.
Just for Kids
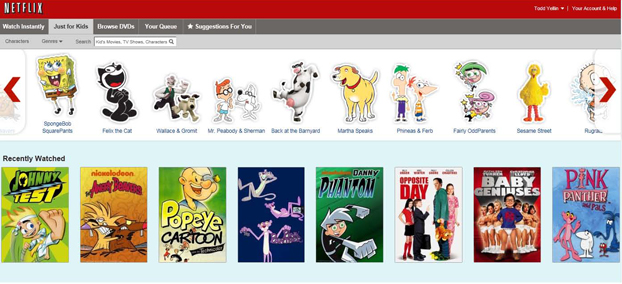
Kids and family content is a very important part of the Netflix streaming offering, driving significant hours viewed. We know that kids tend to have different viewing behavior from adults; namely, kids love to watch the same thing over and over again. More importantly, kids identify with shows more by the characters than by the title. With this in mind, we launched a new “Just for Kids” feature in July which provides a more intuitive and enjoyable way for children to watch all of the great age-appropriate TV shows and movies available to watch instantly from Netflix.
By clicking on the “Just For Kids” tab on the Netflix website, kids can find a world of movies and TV shows suitable for children 12 and under, with kid-friendly genres and sorting by characters such as “Dora the Explorer”, “Phineas & Ferb”, “iCarly”, “Caillou” and “Thomas the Tank Engine.” This new feature is just one more way we are improving our UI and consumer experience to better connect subscribers with movies and TV shows they’ll love. “Just for Kids” is available on the PC and Mac to Netflix members with similar functionality to come on the Wii, iPad and many other devices in coming months.
|
|
8 |
Free Cash Flow
Our streaming content offering and the associated expense has risen dramatically over the past few quarters. We’ve added $1.34 billion of streaming content assets to our balance sheet since the start of 2011. In general, we have been successful in matching payment terms with the expense so cash use for streaming content has been a bit ahead of expense but offset by other sources of cash such as stock comp. As a result, free cash flow has roughly followed net income.
In Q3, FCF of $13.8 million increased sharply year-over-year (77%), but significantly trailed net income of $62 million. Our September Latin America launch, with a full quarter of cash payments but only one month of amortization, was a material contributor to this gap. In addition, we had approximately $22 million in content payments go out at the end of the quarter for content starting on the site in early October, increasing the prepaid content on our balance sheet.
We expect our FCF to continue to lag net income for the next few quarters as our spending on content continues to increase both domestically and internationally.
As a reminder, when a content license meets the criteria for library asset recognition, we recognize the value of the license fees as an asset in our content library while unpaid portions are recognized as liabilities. Since many of our agreements are multi-year, the additions will be amortized and the liabilities paid, in most cases, over several years. In sum, A/P and other non-current liabilities (long-term A/P) will increase as titles from new deals become available on our service.
|
|
9 |
We used $39.6 million in Q3 to repurchase 182,000 shares at an average cost basis of $218. Since inception of our share repurchasing programs in 2007, the average cost per share repurchased is $45. After the repurchases, we finished the quarter with $366 million in cash and equivalents.
Historically, we have always run a very lean capital structure, returning all “excess” cash to shareholders in the form of buybacks. We expect to report a global consolidated net loss in Q1’12 as well as to consume cash as we launch the UK. By pausing on further international expansion and halting buybacks, our current cash on hand is adequate to support the growth of the business. As we have done in the past, we will continue to evaluate the appropriate cash level for the business.
|
|
10 |
Q4 Business Outlook
Q4 2011 Guidance
| Domestic Streaming: |
||||
| Subscriptions |
20.0 m to 21.5 m | |||
| Revenue |
$ | 462 m to $477 m | ||
| Contribution Profit |
$ | 30 m to $42 m | ||
| Domestic DVD: |
||||
| Subscriptions |
10.3 m to 11.3 m | |||
| Revenue |
$ | 354 m to $368 m | ||
| Contribution Profit |
$ | 177 m to $192 m | ||
| International: |
||||
| Subscriptions |
1.6 m to 2.0 m | |||
| Revenue |
$ | 25 m to $30 m | ||
| Contribution Profit / (Loss) |
($ | 70 m) to ($60m) | ||
| Consolidated Global: |
||||
| Net Income |
$ | 19 m to $37 m | ||
| EPS |
$ | 0.36 to $0.70 | ||
Summary
We continue to be well positioned to succeed in the large global market for streaming video. Consumer demand for unlimited, on-demand movies and TV shows streamed over the Internet keeps growing, driven by increased broadband penetration, the adoption of Smart TVs, and increased video consumption from laptops, tablets, and phones. Moving forward, we are focused on continually improving our service, by expanding our streaming content library and enhancing our user experience, to both build consumer trust and to stay ahead of the competition.
Sincerely,

|

|
|||||
| Reed Hastings, CEO |
David Wells, CFO |
|
|
11 |

|

|
Conference Call Q&A Session
Netflix management will host a webcast Q&A session at 3:00 p.m. Pacific Time today to answer questions about the Company’s financial results and business outlook. Please email your questions to ir@netflix.com. The company will read the questions aloud on the call and respond to as many questions as possible. For those without access to the Internet the dial-in for the live earnings Q&A session is: (760) 666-3613.
The live webcast, and the replay, of the earnings Q&A session can be accessed at ir.netflix.com.
| IR Contact: | PR Contact: | |
| Ellie Mertz | Steve Swasey | |
| VP, Finance & Investor Relations | VP, Corporate Communications | |
| 408 540-3977 | 408 540-3947 |
Use of Non-GAAP Measures
This shareholder letter and its attachments include reference to the non-GAAP financial measures of free cash flow and contribution profit. Management believes that free cash flow is an important liquidity metric because it measures, during a given period, the amount of cash generated that is available to repay debt obligations, make investments, repurchase stock and for certain other activities. Management believes that contribution profit is useful in assessing the relative contribution to operating income of each segment by eliminating any allocation of Technology & Development and G&A expenses that apply across these segments. However, this non-GAAP measure should be considered in addition to, not as a substitute for or superior to, net income, operating income and net cash provided by operating activities, or other financial measures prepared in accordance with GAAP. Reconciliation to the GAAP equivalent of this non-GAAP measure is contained in tabular form on the attached unaudited financial statements.
|
|
12 |
Forward-Looking Statements
This shareholder letter contains certain forward-looking statements within the meaning of the federal securities laws, including statements regarding our long-term opportunities and building back our brand, subscriber additions, international expansion, contribution profit and margin; international segment performance, including Canadian contribution profit; free cash flow and usage of cash; our subscriber growth, revenue, and contribution profit (loss) for both domestic and international operations as well as net income and earnings per share for the fourth quarter of 2011. The forward-looking statements in this letter are subject to risks and uncertainties that could cause actual results and events to differ, including, without limitation: our ability to attract new subscribers and retain existing subscribers; our ability to compete effectively; our ability to build back our brand; the continued availability of content on terms and conditions acceptable to us; maintenance and expansion of device platforms for instant streaming; fluctuations in consumer usage of our service; disruption in service on our website or with third-party computer systems that help us operate our service; competition and widespread consumer adoption of different modes of viewing in-home filmed entertainment. A detailed discussion of these and other risks and uncertainties that could cause actual results and events to differ materially from such forward-looking statements is included in our filings with the Securities and Exchange Commission, including our Annual Report on Form 10-K filed with the Securities and Exchange Commission on February 18, 2011. We undertake no obligation to update forward-looking statements to reflect events or circumstances occurring after the date of this press release.
|
|
13 |
Netflix, Inc.
Consolidated Statements of Operations
(unaudited)
(in thousands, except per share data)
| Three Months Ended | Nine Months Ended | |||||||||||||||||||
| September 30, 2011 |
June 30, 2011 |
September 30, 2010 |
September 30, 2011 |
September 30, 2010 |
||||||||||||||||
| Revenues |
$ | 821,839 | $ | 788,610 | $ | 553,219 | $ | 2,329,002 | $ | 1,566,703 | ||||||||||
| Cost of revenues: |
||||||||||||||||||||
| Subscription |
471,823 | 428,203 | 292,406 | 1,277,018 | 817,353 | |||||||||||||||
| Fulfillment expenses |
64,794 | 61,775 | 52,063 | 187,728 | 149,212 | |||||||||||||||
|
|
|
|
|
|
|
|
|
|
|
|||||||||||
| Total cost of revenues |
536,617 | 489,978 | 344,469 | 1,464,746 | 966,565 | |||||||||||||||
|
|
|
|
|
|
|
|
|
|
|
|||||||||||
| Gross profit |
285,222 | 298,632 | 208,750 | 864,256 | 600,138 | |||||||||||||||
| Operating expenses: |
||||||||||||||||||||
| Technology and development |
69,480 | 57,865 | 42,108 | 178,250 | 117,370 | |||||||||||||||
| Marketing |
89,108 | 94,983 | 81,238 | 288,350 | 230,990 | |||||||||||||||
| General and administrative * |
29,792 | 30,670 | 15,903 | 83,460 | 46,590 | |||||||||||||||
|
|
|
|
|
|
|
|
|
|
|
|||||||||||
| Total operating expenses |
188,380 | 183,518 | 139,249 | 550,060 | 394,950 | |||||||||||||||
|
|
|
|
|
|
|
|
|
|
|
|||||||||||
| Operating income |
96,842 | 115,114 | 69,501 | 314,196 | 205,188 | |||||||||||||||
| Other income (expense): |
||||||||||||||||||||
| Interest expense |
(4,915 | ) | (5,303 | ) | (4,945 | ) | (15,083 | ) | (14,797 | ) | ||||||||||
| Interest and other income |
1,696 | 1,013 | 853 | 3,574 | 2,746 | |||||||||||||||
|
|
|
|
|
|
|
|
|
|
|
|||||||||||
| Income before income taxes |
93,623 | 110,824 | 65,409 | 302,687 | 193,137 | |||||||||||||||
| Provision for income taxes |
31,163 | 42,610 | 27,442 | 111,780 | 79,379 | |||||||||||||||
|
|
|
|
|
|
|
|
|
|
|
|||||||||||
| Net income |
$ | 62,460 | $ | 68,214 | $ | 37,967 | $ | 190,907 | $ | 113,758 | ||||||||||
|
|
|
|
|
|
|
|
|
|
|
|||||||||||
| Net income per share: |
||||||||||||||||||||
| Basic |
$ | 1.19 | $ | 1.30 | $ | 0.73 | $ | 3.63 | $ | 2.17 | ||||||||||
| Diluted |
$ | 1.16 | $ | 1.26 | $ | 0.70 | $ | 3.53 | $ | 2.09 | ||||||||||
| Weighted average common shares outstanding: |
||||||||||||||||||||
| Basic |
52,569 | 52,470 | 52,142 | 52,599 | 52,510 | |||||||||||||||
| Diluted |
53,870 | 53,909 | 53,931 | 54,008 | 54,341 | |||||||||||||||
| * | Includes gain on disposal of DVDs. |
|
|
14 |
Netflix, Inc.
Consolidated Balance Sheets
(unaudited)
(in thousands, except share and par value data)
| As of | ||||||||
| September 30, 2011 |
December 31, 2010 |
|||||||
| Assets |
||||||||
| Current assets: |
||||||||
| Cash and cash equivalents |
$ | 159,199 | $ | 194,499 | ||||
| Short-term investments |
206,573 | 155,888 | ||||||
| Current content library, net |
705,398 | 181,006 | ||||||
| Prepaid content |
77,146 | 62,217 | ||||||
| Other current assets |
41,797 | 43,621 | ||||||
|
|
|
|
|
|||||
| Total current assets |
1,190,113 | 637,231 | ||||||
| Content library, net |
570,210 | 180,973 | ||||||
| Property and equipment, net |
143,993 | 128,570 | ||||||
| Deferred tax assets |
28,743 | 17,467 | ||||||
| Other non-current assets |
28,499 | 17,826 | ||||||
|
|
|
|
|
|||||
| Total assets |
$ | 1,961,558 | $ | 982,067 | ||||
|
|
|
|
|
|||||
| Liabilities and Stockholders’ Equity |
||||||||
| Current liabilities: |
||||||||
| Accounts payable |
$ | 750,107 | $ | 222,824 | ||||
| Accrued expenses |
54,671 | 36,489 | ||||||
| Current portion of lease financing obligations |
2,259 | 2,083 | ||||||
| Deferred revenue |
160,929 | 127,183 | ||||||
|
|
|
|
|
|||||
| Total current liabilities |
967,966 | 388,579 | ||||||
| Long-term debt |
200,000 | 200,000 | ||||||
| Lease financing obligations, excluding current portion |
32,400 | 34,123 | ||||||
| Other non-current liabilities |
372,840 | 69,201 | ||||||
|
|
|
|
|
|||||
| Total liabilities |
1,573,206 | 691,903 | ||||||
| Stockholders’ equity: |
||||||||
| Common stock, $0.001 par value; 160,000,000 shares authorized at September 30, 2011 and December 31, 2010; 52,504,091 and 52,781,949 issued and outstanding at September 30, 2011 and December 31, 2010, respectively |
53 | 53 | ||||||
| Additional paid-in capital |
— | 51,622 | ||||||
| Accumulated other comprehensive income, net |
588 | 750 | ||||||
| Retained earnings |
387,711 | 237,739 | ||||||
|
|
|
|
|
|||||
| Total stockholders’ equity |
388,352 | 290,164 | ||||||
|
|
|
|
|
|||||
| Total liabilities and stockholders’ equity |
$ | 1,961,558 | $ | 982,067 | ||||
|
|
|
|
|
|||||
|
|
15 |
Netflix, Inc.
Consolidated Statements of Cash Flows
(unaudited)
(in thousands)
| Three Months Ended | Nine Months Ended | |||||||||||||||||||
| September 30, 2011 |
June 30, 2011 |
September 30, 2010 |
September 30, 2011 |
September 30, 2010 |
||||||||||||||||
| Cash flows from operating activities: |
||||||||||||||||||||
| Net income |
$ | 62,460 | $ | 68,214 | $ | 37,967 | $ | 190,907 | $ | 113,758 | ||||||||||
| Adjustments to reconcile net income to net cash provided by operating activities: |
||||||||||||||||||||
| Additions to streaming content library |
(539,285 | ) | (612,595 | ) | (115,149 | ) | (1,344,187 | ) | (231,781 | ) | ||||||||||
| Change in streaming content liabilities |
314,720 | 419,832 | 58,638 | 816,620 | 88,197 | |||||||||||||||
| Amortization of streaming content library |
187,446 | 144,466 | 44,568 | 417,849 | 93,091 | |||||||||||||||
| Amortization of DVD content library |
23,000 | 24,000 | 32,578 | 73,990 | 111,490 | |||||||||||||||
| Depreciation and amortization of property, equipment and intangibles |
11,913 | 10,182 | 8,678 | 31,921 | 28,846 | |||||||||||||||
| Stock-based compensation expense |
15,705 | 15,536 | 7,296 | 43,505 | 19,726 | |||||||||||||||
| Excess tax benefits from stock-based compensation |
(11,761 | ) | (17,868 | ) | (16,093 | ) | (45,283 | ) | (34,699 | ) | ||||||||||
| Other non-cash items |
(1,745 | ) | (802 | ) | (1,754 | ) | (3,472 | ) | (7,814 | ) | ||||||||||
| Deferred taxes |
(5,281 | ) | (3,927 | ) | 3,194 | (14,190 | ) | (2,961 | ) | |||||||||||
| Changes in operating assets and liabilities: |
||||||||||||||||||||
| Prepaid content |
(17,335 | ) | 14,787 | (25,485 | ) | (14,928 | ) | (32,581 | ) | |||||||||||
| Other current assets |
(8,578 | ) | 4,015 | (3,374 | ) | 4,935 | (12,037 | ) | ||||||||||||
| Other accounts payable |
(5,422 | ) | (4,465 | ) | (10,914 | ) | 4,948 | 1,246 | ||||||||||||
| Accrued expenses |
20,920 | 17,941 | 18,003 | 61,531 | 39,666 | |||||||||||||||
| Deferred revenue |
13,992 | 3,892 | 1,567 | 33,746 | 2,889 | |||||||||||||||
| Other non-current assets and liabilities |
(11,218 | ) | 3,184 | 2,507 | (5,646 | ) | 2,648 | |||||||||||||
|
|
|
|
|
|
|
|
|
|
|
|||||||||||
| Net cash provided by operating activities |
49,531 | 86,392 | 42,227 | 252,246 | 179,684 | |||||||||||||||
|
|
|
|
|
|
|
|
|
|
|
|||||||||||
| Cash flows from investing activities: |
||||||||||||||||||||
| Acquisitions of DVD content library |
(20,826 | ) | (19,065 | ) | (29,900 | ) | (62,010 | ) | (90,993 | ) | ||||||||||
| Purchases of short-term investments |
(7,673 | ) | (40,597 | ) | (15,379 | ) | (100,536 | ) | (73,169 | ) | ||||||||||
| Proceeds from sale of short-term investments |
37 | 16,510 | 42,238 | 31,508 | 105,063 | |||||||||||||||
| Proceeds from maturities of short-term investments |
1,805 | 15,985 | 1,995 | 18,440 | 10,318 | |||||||||||||||
| Purchases of property and equipment |
(14,080 | ) | (8,626 | ) | (7,342 | ) | (39,026 | ) | (19,406 | ) | ||||||||||
| Other assets |
(844 | ) | 844 | 2,782 | 1,419 | 10,289 | ||||||||||||||
|
|
|
|
|
|
|
|
|
|
|
|||||||||||
| Net cash used in investing activities |
(41,581 | ) | (34,949 | ) | (5,606 | ) | (150,205 | ) | (57,898 | ) | ||||||||||
|
|
|
|
|
|
|
|
|
|
|
|||||||||||
| Cash flows from financing activities: |
||||||||||||||||||||
| Principal payments of lease financing obligations |
(526 | ) | (520 | ) | (470 | ) | (1,547 | ) | (1,296 | ) | ||||||||||
| Proceeds from issuance of common stock |
4,409 | 7,418 | 10,927 | 18,589 | 33,954 | |||||||||||||||
| Excess tax benefits from stock-based compensation |
11,761 | 17,868 | 16,093 | 45,283 | 34,699 | |||||||||||||||
| Repurchases of common stock |
(39,602 | ) | (51,421 | ) | (57,390 | ) | (199,666 | ) | (210,259 | ) | ||||||||||
|
|
|
|
|
|
|
|
|
|
|
|||||||||||
| Net cash used in financing activities |
(23,958 | ) | (26,655 | ) | (30,840 | ) | (137,341 | ) | (142,902 | ) | ||||||||||
|
|
|
|
|
|
|
|
|
|
|
|||||||||||
| Net increase (decrease) in cash and cash equivalents |
(16,008 | ) | 24,788 | 5,781 | (35,300 | ) | (21,116 | ) | ||||||||||||
| Cash and cash equivalents, beginning of period |
175,207 | 150,419 | 107,327 | 194,499 | 134,224 | |||||||||||||||
|
|
|
|
|
|
|
|
|
|
|
|||||||||||
| Cash and cash equivalents, end of period |
$ | 159,199 | $ | 175,207 | $ | 113,108 | $ | 159,199 | $ | 113,108 | ||||||||||
|
|
|
|
|
|
|
|
|
|
|
|||||||||||
| Three Months Ended | Nine Months Ended | |||||||||||||||||||
| September 30, 2011 |
June 30, 2011 |
September 30, 2010 |
September 30, 2011 |
September 30, 2010 |
||||||||||||||||
| Non-GAAP free cash flow reconciliation: |
||||||||||||||||||||
| Net cash provided by operating activities |
$ | 49,531 | $ | 86,392 | $ | 42,227 | $ | 252,246 | $ | 179,684 | ||||||||||
| Acquisitions of DVD content library |
(20,826 | ) | (19,065 | ) | (29,900 | ) | (62,010 | ) | (90,993 | ) | ||||||||||
| Purchases of property and equipment |
(14,080 | ) | (8,626 | ) | (7,342 | ) | (39,026 | ) | (19,406 | ) | ||||||||||
| Other assets |
(844 | ) | 844 | 2,782 | 1,419 | 10,289 | ||||||||||||||
|
|
|
|
|
|
|
|
|
|
|
|||||||||||
| Non-GAAP free cash flow |
$ | 13,781 | $ | 59,545 | $ | 7,767 | $ | 152,629 | $ | 79,574 | ||||||||||
|
|
|
|
|
|
|
|
|
|
|
|||||||||||
|
|
16 |
Netflix, Inc.
Other Data
(unaudited)
(in thousands, except percentages, average monthly revenue per paying subscriber and subscriber acquisition cost)
| As of / Three Months Ended | ||||||||||||
| September 30, 2011 |
June 30, 2011 |
September 30, 2010 |
||||||||||
| Domestic subscriber information: |
||||||||||||
| Subscribers: beginning of period |
24,594 | 22,797 | 15,001 | |||||||||
| Gross subscriber additions: during period |
4,714 | 5,315 | 3,965 | |||||||||
| Gross subscriber additions year-to-year change |
18.9 | % | 73.7 | % | 81.9 | % | ||||||
| Gross subscriber additions quarter-to-quarter sequential change |
(11.3 | %) | (15.6 | %) | 29.6 | % | ||||||
| Less subscriber cancellations: during period |
(5,519 | ) | (3,518 | ) | (2,166 | ) | ||||||
| Net subscriber additions: during period |
(805 | ) | 1,797 | 1,799 | ||||||||
| Subscribers: end of period |
23,789 | 24,594 | 16,800 | |||||||||
| Subscribers year-to-year change |
41.6 | % | 63.9 | % | 51.2 | % | ||||||
| Subscribers quarter-to-quarter sequential change |
(3.3 | %) | 7.9 | % | 12.0 | % | ||||||
| Free subscribers: end of period |
946 | 1,331 | 937 | |||||||||
| Free subscribers as percentage of ending subscribers |
4.0 | % | 5.4 | % | 5.6 | % | ||||||
| Paid subscribers: end of period |
22,843 | 23,263 | 15,863 | |||||||||
| Paid subscribers year-to-year change |
44.0 | % | 59.6 | % | 46.4 | % | ||||||
| Paid subscribers quarter-to-quarter sequential change |
(1.8 | %) | 8.7 | % | 8.8 | % | ||||||
| Average monthly revenue per paying subscriber |
$ | 11.56 | $ | 11.49 | $ | 12.12 | ||||||
| Domestic churn |
6.3 | % | 4.2 | % | 3.8 | % | ||||||
| Domestic subscriber acquisition cost |
$ | 15.25 | $ | 15.09 | $ | 20.03 | ||||||
| Three Months Ended | ||||||||||||
| September 30, 2011 |
June 30, 2011 |
September 30, 2010 |
||||||||||
| Consolidated margins: |
||||||||||||
| Gross margin |
34.7 | % | 37.9 | % | 37.7 | % | ||||||
| Operating margin |
11.8 | % | 14.6 | % | 12.6 | % | ||||||
| Net margin |
7.6 | % | 8.6 | % | 6.9 | % | ||||||
| Consolidated expenses as percentage of revenues: |
||||||||||||
| Technology and development |
8.5 | % | 7.3 | % | 7.6 | % | ||||||
| Marketing |
10.8 | % | 12.0 | % | 14.7 | % | ||||||
| General and administrative |
3.6 | % | 4.0 | % | 2.8 | % | ||||||
|
|
|
|
|
|
|
|||||||
| Total operating expenses |
22.9 | % | 23.3 | % | 25.1 | % | ||||||
| Consolidated year-to-year change: |
||||||||||||
| Total revenues |
48.6 | % | 51.7 | % | 30.7 | % | ||||||
| Cost of subscription |
61.4 | % | 61.4 | % | 25.4 | % | ||||||
| Fulfillment expenses |
24.5 | % | 24.7 | % | 23.4 | % | ||||||
| Technology and development |
65.0 | % | 52.8 | % | 40.3 | % | ||||||
| Marketing |
9.7 | % | 27.4 | % | 38.7 | % | ||||||
| General and administrative |
87.3 | % | 102.5 | % | 60.0 | % | ||||||
| Total operating expenses |
35.3 | % | 43.9 | % | 41.4 | % | ||||||
|
|
17 |
Netflix, Inc.
Segment Information
(unaudited)
(in thousands)
| As of / Three Months Ended | As of / Nine Months Ended | |||||||||||||||||||
| September 30, 2011 |
June 30, 2011 |
September 30, 2010 |
September 30, 2011 |
September 30, 2010 |
||||||||||||||||
| Domestic |
||||||||||||||||||||
| Free subscribers at end of period |
946 | 1,331 | 937 | 946 | 937 | |||||||||||||||
| Paid subscribers at end of period |
22,843 | 23,263 | 15,863 | 22,843 | 15,863 | |||||||||||||||
|
|
|
|
|
|
|
|
|
|
|
|||||||||||
| Total subscribers at end of period |
23,789 | 24,594 | 16,800 | 23,789 | 16,800 | |||||||||||||||
| Revenue |
$ | 799,152 | $ | 769,714 | $ | 553,219 | $ | 2,275,140 | $ | 1,566,703 | ||||||||||
| Cost of revenues and marketing expenses |
579,720 | 556,719 | 423,013 | 1,655,828 | 1,194,861 | |||||||||||||||
|
|
|
|
|
|
|
|
|
|
|
|||||||||||
| Contribution profit* |
219,432 | 212,995 | 130,206 | 619,312 | 371,842 | |||||||||||||||
| Other operating expenses |
99,272 | 88,535 | 58,011 | 261,710 | 163,960 | |||||||||||||||
|
|
|
|
|
|
|
|
|
|
|
|||||||||||
| Segment operating income |
$ | 120,160 | $ | 124,460 | $ | 72,195 | $ | 357,602 | $ | 207,882 | ||||||||||
| International** |
||||||||||||||||||||
| Free subscribers at end of period |
491 | 110 | 133 | 491 | 133 | |||||||||||||||
| Paid subscribers at end of period |
989 | 857 | — | 989 | — | |||||||||||||||
|
|
|
|
|
|
|
|
|
|
|
|||||||||||
| Total subscribers at end of period |
1,480 | 967 | 133 | 1,480 | 133 | |||||||||||||||
| Revenue |
$ | 22,687 | $ | 18,896 | $ | — | $ | 53,862 | $ | — | ||||||||||
| Cost of revenues and marketing expenses |
46,005 | 28,242 | 2,694 | 97,268 | 2,694 | |||||||||||||||
|
|
|
|
|
|
|
|
|
|
|
|||||||||||
| Contribution profit (loss)* |
(23,318 | ) | (9,346 | ) | (2,694 | ) | (43,406 | ) | (2,694 | ) | ||||||||||
| Consolidated |
||||||||||||||||||||
| Free subscribers at end of period |
1,437 | 1,441 | 1,070 | 1,437 | 1,070 | |||||||||||||||
| Paid subscribers at end of period |
23,832 | 24,120 | 15,863 | 23,832 | 15,863 | |||||||||||||||
|
|
|
|
|
|
|
|
|
|
|
|||||||||||
| Total subscribers at end of period |
25,269 | 25,561 | 16,933 | 25,269 | 16,933 | |||||||||||||||
| Revenue |
$ | 821,839 | $ | 788,610 | $ | 553,219 | $ | 2,329,002 | $ | 1,566,703 | ||||||||||
| Cost of revenues and marketing expenses |
625,725 | 584,961 | 425,707 | 1,753,096 | 1,197,555 | |||||||||||||||
|
|
|
|
|
|
|
|
|
|
|
|||||||||||
| Contribution profit* |
$ | 196,114 | 203,649 | 127,512 | 575,906 | 369,148 | ||||||||||||||
| Other operating expenses |
99,272 | 88,535 | 58,011 | 261,710 | 163,960 | |||||||||||||||
|
|
|
|
|
|
|
|
|
|
|
|||||||||||
| Operating income |
96,842 | $ | 115,114 | $ | 69,501 | $ | 314,196 | $ | 205,188 | |||||||||||
| Other income (expense) |
(3,219 | ) | (4,290 | ) | (4,092 | ) | (11,509 | ) | (12,051 | ) | ||||||||||
| Provision for income taxes |
31,163 | 42,610 | 27,442 | 111,780 | 79,379 | |||||||||||||||
|
|
|
|
|
|
|
|
|
|
|
|||||||||||
| Net Income |
$ | 62,460 | $ | 68,214 | $ | 37,967 | $ | 190,907 | $ | 113,758 | ||||||||||
|
|
|
|
|
|
|
|
|
|
|
|||||||||||
| * | Contribution profit (loss) is defined as revenues less cost of revenues and marketing expenses. |
| ** | “Technology and Development” and “General and Administrative” amounts reported in the International segment in prior periods have been reclassified to conform to the current period presentation. |
|
|
18 |