Attached files
Table of Contents
As filed with the Securities and Exchange Commission on October 21, 2011
Registration Statement No. 333-175579
UNITED STATES
SECURITIES AND EXCHANGE COMMISSION
Washington, D.C. 20549
AMENDMENT NO. 1
TO
FORM S-1
REGISTRATION STATEMENT
UNDER
THE SECURITIES ACT OF 1933
NORWEGIAN CRUISE LINE HOLDINGS LTD.
(Exact name of registrant as specified in its charter)
| Bermuda | 4400 | 98-0691007 | ||
| (State or other jurisdiction of incorporation or organization) |
(Primary Standard Industrial Classification Code Number) |
(I.R.S. Employer Identification Number) |
7665 Corporate Center Drive
Miami, Florida 33126
(305) 436-4000
(Address, including zip code, and telephone number, including area code, of registrant’s principal executive offices)
Daniel S. Farkas
Senior Vice President and General Counsel
Norwegian Cruise Line Holdings Ltd.
7665 Corporate Center Drive
Miami, Florida 33126
Telephone: (305) 436-4000
(Name, address, including zip code, and telephone number, including area code, of agent for service)
Copies to:
| Gregory A. Ezring, Esq. Tracey A. Zaccone, Esq. Paul, Weiss, Rifkind, Wharton & Garrison LLP 1285 Avenue of the Americas New York, New York 10019 Telephone: (212) 373-3000 Facsimile: (212) 757-3990 |
William B. Kuesel, Esq. O’Melveny & Myers LLP 7 Times Square New York, New York 10036 Telephone: (212) 326-2000 Facsimile: (212) 326-2061 |
Jonathan A. Schaffzin Luis R. Penalver Cahill Gordon & Reindel LLP 80 Pine Street New York, New York 10005 Telephone: (212) 701-3000 Facsimile: (212) 269-5420 |
Approximate date of commencement of proposed sale to the public: As soon as practicable after the effective date of this Registration Statement.
If any of the securities being registered on this Form are to be offered on a delayed or continuous basis pursuant to Rule 415 under the Securities Act of 1933 check the following box: ¨
If this Form is filed to register additional securities for an offering pursuant to Rule 462(b) under the Securities Act, please check the following box and list the Securities Act registration statement number of the earlier effective registration statement for the same offering. ¨
If this Form is a post-effective amendment filed pursuant to Rule 462(c) under the Securities Act, check the following box and list the Securities Act registration statement number of the earlier effective registration statement for the same offering. ¨
If this Form is a post-effective amendment filed pursuant to Rule 462(d) under the Securities Act, check the following box and list the Securities Act registration statement number of the earlier effective registration statement for the same offering. ¨
Indicate by check mark whether the registrant is a large accelerated filer, an accelerated filer, a non-accelerated filer, or a smaller reporting company. See the definitions of “large accelerated filer,” “accelerated filer” and “smaller reporting company” in Rule 12b-2 of the Exchange Act.
| Large accelerated filer ¨ |
Accelerated filer ¨ | |
|
Non-accelerated filer (Do not check if a smaller reporting company) x |
Smaller reporting company ¨ |
CALCULATION OF REGISTRATION FEE
|
| ||||
| Title of Each Class of Securities to be Registered |
Proposed Maximum Offering Price(1)(2) |
Amount of Fee(3) | ||
| Ordinary shares, par value $.001 per share |
$250,000,000 | $29,025 | ||
|
| ||||
|
| ||||
| (1) | Estimated solely for the purposes of calculating the amount of the registration fee pursuant to Rule 457(o). |
| (2) | Including ordinary shares which may be purchased by the underwriters. |
| (3) | The registration fee was paid in full in connection with the initial filing of this Form S-1 on July 15, 2011. |
The registrant hereby amends this registration statement on such date or dates as may be necessary to delay its effective date until the registrant shall file a further amendment which specifically states that this registration statement shall thereafter become effective in accordance with Section 8(a) of the Securities Act of 1933 or until this registration statement shall become effective on such date as the Securities and Exchange Commission, acting pursuant to said Section 8(a), may determine.
Table of Contents
EXPLANATORY NOTE
This Registration Statement on Form S-1 is being filed by Norwegian Cruise Line Holdings Ltd. (the “Issuer”). Following completion of a corporate reorganization to be commenced in connection with consummation of the offering of ordinary shares covered by this Registration Statement, the Issuer will become the direct parent company of NCL Corporation Ltd.
NCL Corporation Ltd. has previously filed a Registration Statement on Form S-1 (File No. 333-170141) that relates to a comparable offering to the offering contemplated by this Registration Statement. In connection with the filing of this Registration Statement, NCL Corporation Ltd. is withdrawing its Registration Statement.
Table of Contents
The information in this prospectus is not complete and may be changed. We may not sell these securities until the registration statement filed with the Securities and Exchange Commission is effective. This prospectus is not an offer to sell these securities, and we are not soliciting an offer to buy these securities in any state where the offer or sale is not permitted.
SUBJECT TO COMPLETION, DATED OCTOBER 21, 2011
PRELIMINARY PROSPECTUS
Ordinary Shares
NORWEGIAN CRUISE LINE HOLDINGS LTD.
This is the initial public offering of our ordinary shares, par value $.001 per share, which we refer to as our ordinary shares. We are a newly formed holding company which, upon the consummation of this offering, will own 100% of the ordinary shares of NCL Corporation Ltd. and will be the issuer of the ordinary shares being offered hereby. We are selling an aggregate of ordinary shares in this offering.
Prior to the offering, there has been no public market for our ordinary shares. We expect the initial public offering price to be between $ and $ per ordinary share. We expect to apply for listing of our ordinary shares on the NASDAQ Global Select Market under the symbol “NCLH”.
We have granted the underwriters an option for a period of 30 days to purchase from us an aggregate of up to additional ordinary shares.
Investing in our ordinary shares involves a high degree of risk. See “Risk Factors” beginning on page 18 to read about certain factors you should consider before buying our ordinary shares.
| Per Share | Total | |||
| Initial public offering price |
||||
| Underwriting discounts and commissions |
||||
| Proceeds to new holding company before expenses |
The underwriters expect to deliver the ordinary shares on or about , 2011.
Neither the Securities and Exchange Commission nor any state securities commission has approved or disapproved of these securities or passed on the adequacy or accuracy of this prospectus. Any representation to the contrary is a criminal offense.
Ordinary shares may be offered or sold in Bermuda only in compliance with the provisions of the Investment Business Act of 1998, which regulates the sale of securities in Bermuda. Further, the Bermuda Monetary Authority (the “BMA”) must approve all issues and transfers of shares of a Bermuda exempted company under the Exchange Control Act of 1972 and regulations thereunder (together, the “ECA”). The BMA has given a general permission which will permit the issue of the ordinary shares and the free transferability of such shares under the ECA so long as voting securities of the Company are admitted to trading on the NASDAQ Global Select Market or any other appointed stock exchange. In addition, we will deliver to and file a copy of this prospectus with the Registrar of Companies in Bermuda in accordance with Bermuda law. The BMA and the Registrar of Companies do not accept any responsibility for the financial soundness of any proposal or for the correctness of any of the statements made or opinions expressed herein.
| UBS Investment Bank | Barclays Capital |
Goldman, Sachs & Co.
The date of this prospectus is , 2011.
Table of Contents
Table of Contents
| Page | ||||
| ii | ||||
| v | ||||
| 1 | ||||
| 18 | ||||
| 32 | ||||
| 34 | ||||
| 35 | ||||
| 36 | ||||
| 37 | ||||
| 39 | ||||
| MANAGEMENT’S DISCUSSION AND ANALYSIS OF FINANCIAL CONDITION AND RESULTS OF OPERATIONS |
41 | |||
| 54 | ||||
| 79 | ||||
| 86 | ||||
| SECURITY OWNERSHIP OF CERTAIN BENEFICIAL OWNERS AND MANAGEMENT |
106 | |||
| 110 | ||||
| 116 | ||||
| 125 | ||||
| 137 | ||||
| 138 | ||||
| 141 | ||||
| 142 | ||||
| 149 | ||||
| 149 | ||||
| 149 | ||||
| F-1 | ||||
You should rely only on the information contained in this prospectus. We and the underwriters have not authorized anyone to provide you with information that is different from or additional to, that contained in this prospectus. This prospectus may only be used where it is legal to sell our ordinary shares. The information in this prospectus may only be accurate on the date of this prospectus.
i
Table of Contents
Unless otherwise indicated by the context, references in this prospectus to (i) the “Company,” “we,” “our,” “us” and “NCL” refer, prior to the consummation of this offering, to NCL Corporation Ltd. and its subsidiaries and, upon and after the consummation of this offering, to the Issuer (as defined below) and its subsidiaries, (ii) “Norwegian Cruise Line” or “Norwegian” refers to the Norwegian Cruise Line brand and “NCL America” or “NCLA” refers to our U.S.-flagged operations, (iii) “Apollo” refers to Apollo Global Management, LLC and the “Apollo Funds” refers to one or more of NCL Investment Limited, NCL Investment II Ltd., AIF VI NCL (AIV), L.P., AIF VI Euro Holdings, L.P., AAA-Guarantor Co-Invest VI, L.P., Apollo Overseas Partners (Delaware) VI, L.P., Apollo Overseas Partners (Delaware 892) VI, L.P., Apollo Overseas Partners VI, L.P. and Apollo Overseas Partners (Germany) VI, L.P., (iv) “TPG Capital” refers to TPG Capital, L.P. and the “TPG Viking Funds” refers to one or more of TPG Viking I, L.P., TPG Viking II, L.P., TPG Viking, L.P., TPG Viking AIV I, L.P., TPG Viking AIV II, L.P., and TPG Viking AIV III, L.P. and/or certain other affiliated investment funds, each an affiliate of TPG Capital, (v) “Genting HK” refers to Genting Hong Kong Limited and/or its affiliates (formerly Star Cruises Limited and/or its affiliates), and (vi) “Affiliate(s)” refers to Genting HK, the Apollo Funds and/or the TPG Viking Funds. References to the “U.S.” are to the United States of America, “dollars” or “$” are to U.S. dollars and “euros” or “€” are to the official currency of the Eurozone.
Unless otherwise indicated in this prospectus, the following terms have the meanings set forth below (all principal amounts refer to the original principal amount incurred or issued, as applicable):
| • | $334.1 million Norwegian Jewel loan. $334.1 million secured loan agreement, dated as of April 20, 2004, as amended and restated on April 2, 2009 and as further amended, by and among Norwegian Jewel Limited, as borrower, and a syndicate of international banks, and related guarantee by NCL Corporation Ltd. |
| • | $750.0 million senior secured revolving credit facility. $750.0 million credit agreement, dated October 28, 2009, by and among NCL Corporation Ltd., as borrower, various lenders and Nordea Bank Norge ASA, and related guarantee by Norwegian Dawn Limited, Norwegian Sun Limited, Norwegian Spirit, Ltd. and Norwegian Star Limited. |
| • | $450.0 million senior secured notes. $450.0 million aggregate amount of 11.75% senior secured notes due 2016 issued by NCL Corporation Ltd. on November 12, 2009, and guaranteed by Norwegian Dawn Limited, Norwegian Sun Limited, Norwegian Spirit, Ltd. and Norwegian Star Limited. |
| • | $250.0 million senior notes. $250.0 million aggregate amount of 9.50% senior notes due 2018 issued by NCL Corporation Ltd. on November 9, 2010. |
| • | Adjusted EBITDA. EBITDA subject to certain adjustments as set forth in note 6 to the “Prospectus Summary—Summary Consolidated Financial Data” included elsewhere in this prospectus. |
| • | Adjusted EBITDA Margin. Adjusted EBITDA as a percentage of total revenue. |
| • | Berths. Double occupancy capacity per cabin even though many cabins can accommodate three or more passengers. |
| • | Capacity Days. Berths multiplied by the number of cruise days for the period. |
| • | Charter. The hire of a ship for a specified period of time. The contract for a charter is called a charter party. A ship is “chartered-in” by an end user and “chartered-out” by the provider of the ship. |
| • | CLIA. Cruise Lines International Association, a non-profit marketing and training organization formed in 1975 to promote cruising. |
| • | Constant Currency. A calculation whereby foreign currency-denominated revenue and expenses in a period are converted at the U.S. dollar exchange rate of a comparable period in order to eliminate the effects of the foreign exchange fluctuations. |
| • | Dry-dock. A process whereby a ship is positioned in a large basin where all the fresh/sea water is pumped out in order to carry out cleaning and repairs of those parts of a ship which are below the water line. |
ii
Table of Contents
| • | €40.0 million Pride of America commercial loan. €40.0 million secured loan agreement, dated as of April 4, 2003, as amended and restated on April 2, 2009 and as further amended, by and among Pride of America Ship Holding, LLC, as borrower, and a syndicate of international banks, and related guarantee by NCL Corporation Ltd. |
| • | €258.0 million Pride of America loan. €258.0 million secured loan agreement, dated as of April 4, 2003, as amended and restated on April 2, 2009 and as further amended, by and among Pride of America Ship Holding, LLC, as borrower, and a syndicate of international banks, and related guarantee by NCL Corporation Ltd. |
| • | €308.1 million Pride of Hawai’i loan. €308.1 million Pride of Hawai’i Loan, dated as of April 20, 2004, as amended and restated on April 2, 2009 and as further amended, by and among Pride of Hawaii, LLC, as borrower, and a syndicate of international banks, and related guarantee by NCL Corporation Ltd. |
| • | €624.0 million Norwegian Pearl and Norwegian Gem revolving credit facility. €624.0 million revolving loan facility agreement, dated October 7, 2005, as amended and restated on April 2, 2009 and as further amended, by and among NCL Corporation Ltd., as borrower, and a syndicate of international banks, and related guarantees by Norwegian Pearl, Ltd. and Norwegian Gem, Ltd. |
| • | €662.9 million Norwegian Epic loan. €662.9 million syndicated loan facility, dated September 22, 2006, as amended and restated on April 2, 2009 and as further amended, by and among Norwegian Epic, Ltd. (f/k/a F3 Two, Ltd.), as borrower, and a syndicate of international banks, and related guarantee by NCL Corporation Ltd. |
| • | Existing senior secured credit facilities. Our Newbuild credit facilities, our $750.0 million senior secured revolving credit facility, €624.0 million Norwegian Pearl and Norwegian Gem revolving credit facility, €308.1 million Pride of Hawai’i loan, $334.1 million Norwegian Jewel loan, €258.0 million Pride of America loan, €40.0 million Pride of America commercial loan, and our €662.9 million Norwegian Epic loan. |
| • | GAAP. Generally Accepted Accounting Principles in the U.S. |
| • | Gross Cruise Cost. The sum of total cruise operating expense and marketing, general and administrative expense. |
| • | Gross Tons. A unit of enclosed passenger space on a cruise ship, such that one gross ton = 100 cubic feet or 2.831 cubic meters. |
| • | Gross Yield. Total revenue per Capacity Day. |
| • | IMO. International Maritime Organization, a United Nations agency that sets international standards for shipping. |
| • | Issuer. Norwegian Cruise Line Holdings Ltd., a newly formed holding company which, upon the consummation of this offering, will own 100% of the ordinary shares of NCL Corporation Ltd. and will be the issuer of the ordinary shares being offered hereby. For additional detail regarding the Issuer, we refer you to “Prospectus Summary—Corporate Reorganization.” |
| • | Major North American Cruise Brands. Norwegian Cruise Line, Carnival Cruise Lines, Royal Caribbean International, Holland America, Princess Cruises and Celebrity Cruises. |
| • | MARPOL. The International Convention for the Prevention of Pollution from Ships, an international environmental regulation. |
| • | Net Cruise Cost. Gross Cruise Cost less commissions, transportation and other expense and onboard and other expense. |
| • | Net Revenue. Total revenue less commissions, transportation and other expense and onboard and other expense. |
iii
Table of Contents
| • | Net Yield. Net Revenue per Capacity Day. |
| • | Newbuild credit facilities. Our export credit facilities and term loan facilities entered into in connection with our agreement to purchase the two new ships we have agreed to build with Meyer Werft GmbH (the “New Ships”) as described in “Description of Certain Indebtedness—Newbuild Export Credit Facilities” and “Description of Certain Indebtedness—Newbuild Term Loan Facilities.” |
| • | Norwegian Shipboard Retirement Plan or Shipboard Retirement Plan. An unfunded defined benefit pension plan for certain crew members which computes benefits based on years of service, subject to certain requirements. |
| • | Occupancy Percentage. The ratio of Passenger Cruise Days to Capacity Days. A percentage in excess of 100% indicates that three or more passengers occupied some cabins. |
| • | Passenger Cruise Days. The number of passengers carried for the period, multiplied by the number of days in their respective cruises. |
| • | Reimbursement and Distribution Agreement or RDA. The Reimbursement and Distribution Agreement, dated August 17, 2007, by and among NCL Investment Limited, Genting HK and NCL Corporation Ltd., as amended, supplemented or modified from time to time. |
| • | SEC. U.S. Securities and Exchange Commission. |
| • | Single-day cruises. Cruises which do not enter a foreign port and vary in length from one night to several nights. |
| • | SOLAS. The International Convention for the Safety of Life at Sea, an international safety regulation. |
| • | Terminal. A building in a port through which ship passengers arrive and depart. |
iv
Table of Contents
MARKET AND INDUSTRY DATA AND FORECASTS
This prospectus includes market share and industry data and forecasts that we obtained from industry publications, third-party surveys and internal company surveys. Industry publications, including those from CLIA, and surveys and forecasts generally state that the information contained therein has been obtained from sources believed to be reliable. All CLIA information, obtained from the CLIA website “cruising.org”, relates to CLIA member lines, which represent 26 of the major North American cruise lines including NCL Corporation Ltd., which together represented 97% of the North American cruise capacity as of June 30, 2011. All other references to third party information are publicly available at nominal or no cost. We use the most currently available industry and market data to support statements as to our market position.
Although we believe that the industry publications and third-party sources are reliable, we have not independently verified any of the data from industry publications or third-party sources. Similarly, while we believe our internal estimates with respect to our industry are reliable, our estimates have not been verified by any independent sources. While we are not aware of any misstatements regarding any industry data presented herein, our estimates, in particular as they relate to market share and our general expectations, involve risks and uncertainties and are subject to change based on various factors, including those discussed under “Risk Factors,” “Cautionary Statement Concerning Forward-Looking Statements” and “Management’s Discussion and Analysis of Financial Condition and Results of Operations” in this prospectus.
v
Table of Contents
The following summary includes highlights of the more detailed information and consolidated financial statements included elsewhere in this prospectus. This summary sets forth the material terms of the offering but does not contain all of the information that you should consider before investing in our ordinary shares. For a more complete understanding of us, our business and the offering, we urge you to read this prospectus carefully, including the sections entitled “Risk Factors,” “Cautionary Statement Concerning Forward-Looking Statements” and “Additional Information” and our consolidated financial statements and related notes included elsewhere in this prospectus, before making an investment.
Our Company
We are a leading global cruise line operator, offering cruise experiences for travelers with a wide variety of itineraries in North America (including Alaska and Hawaii), the Mediterranean, the Baltic, Central America, Bermuda and the Caribbean. We strive to offer an innovative and differentiated cruise vacation with the goal of providing our customers the highest levels of overall satisfaction on their cruise experience. In turn, we aim to generate the highest customer loyalty and greatest numbers of repeat customers. We created a distinctive style of cruising called “Freestyle Cruising” onboard all of our ships, which we believe provides our passengers with the freedom and flexibility associated with a resort style atmosphere and experience as well as more dining options than a traditional cruise. We established the very first private island developed by a cruise line in the Bahamas with a diverse offering of activities for passengers. We are also the only cruise line operator to offer an entirely inter-island itinerary in Hawaii. By providing such a distinctive experience and appealing combination of value and service, we straddle both the contemporary and premium segments. As a result, we have been recognized for our achievements as the recipient of multiple honorary awards mainly consisting of reviews tabulated from the readers of travel periodicals such as Travel Weekly, Condé Nast Traveler, and Travel & Leisure. Our newest ship, Norwegian Epic, was awarded “Gold” in the Contemporary Ship Category as “Best Cruise Ship Overall” by Travel Weekly for the 2010 Magellan Award.
We offer a wide variety of cruises ranging from one day to three weeks. During 2010, we docked at over 125 ports worldwide, with itineraries originating from 17 ports of which 10 are in North America. In line with our strategy of innovation, many of these North American ports are part of our “Homeland Cruising” program in which we have homeports which are close to major population centers, such as New York, Boston and South Florida. This reduces the need for vacationers to fly to distant ports to embark on a cruise and helps reduce our customers’ overall vacation cost. We offer a wide selection of exotic itineraries outside of the traditional cruising markets of the Caribbean and Mexico; these include cruises in Europe, including the Mediterranean and the Baltic, Bermuda, Alaska and the industry’s only entirely inter-island itinerary in Hawaii, with our U.S.-flagged ship, Pride of America. This itinerary is unparalleled in the cruise industry, as all other competing cruise lines are registered outside the U.S. and are required to dock at a distant foreign port when providing their customers with a Hawaiian-based cruise itinerary.
Our new management team has driven the Company to achieve substantial improvements in operating results and growth in revenue and cash flow generation in a challenging market environment. Since joining the Company in late 2007, our President and Chief Executive Officer, Kevin M. Sheehan, has led a successful turnaround of the Company, including overseeing major initiatives such as improving onboard service and amenities across the fleet, expanding the line’s European presence and repositioning two of the line’s Hawaii-based ships, which had a significant impact on the profitability of the business. In addition, we appointed Wendy A. Beck as our new Executive Vice President and Chief Financial Officer and augmented our senior management team with five new Senior Vice Presidents in the areas of Sales, Marketing, Hotel Operations and Finance.
1
Table of Contents
Our fleet of eleven modern ships has been purpose-built to deliver “Freestyle Cruising,” which we believe provides us with a competitive advantage given our consistent “Freestyle Cruising” product offering. By focusing on “Freestyle Cruising,” we have been able to achieve higher onboard spend levels, greater customer loyalty and the ability to attract a more diverse clientele. At the end of June 2010, we took delivery of our largest cruise ship, Norwegian Epic (4,100 Berths), which represents the next evolution of “Freestyle Cruising,” offering 21 dining options and what we believe to be the widest array of entertainment options at sea. As of June 30, 2011, we have the youngest fleet of cruise ships in the industry among the Major North American Cruise Brands, with a weighted-average age of 6.6 years.
As a result of our positive operating performance over the last three years, the successful launch of Norwegian Epic, the growing demand we see for our distinctive cruise offering, and the rational supply outlook for the industry, we believe that it is an optimal time for the Company to add two new ships to our fleet, in order to continue to grow the Norwegian brand and drive shareholder value. In September 2010, we reached an agreement with Meyer Werft GmbH of Germany to build two new cruise ships for delivery in the second quarter of 2013 and 2014, respectively. Building on the success of Norwegian Epic, we have designed these two new next-generation “Freestyle Cruising” ships to include some of the most popular elements of our recently delivered ships together with new and differentiated features. We have entered into financing arrangements for approximately 90% of the contract price of the two ships. Each ship will approximate 143,500 Gross Tons and 4,000 Berths with an aggregate contract price of the two ships of approximately €1.2 billion, or $1.7 billion based on the euro/U.S. dollar exchange rate as of June 30, 2011. This is approximately €155,000 per Berth, or $225,000 per Berth based on the euro/U.S. dollar exchange rate as of June 30, 2011.
For the twelve months ended June 30, 2011, we generated total revenue of $2,181.8 million, Net Revenue of $1,611.5 million, net income of $72.2 million and Adjusted EBITDA of $454.9 million and an Adjusted EBITDA margin of 20.8%. For the six months ended June 30, 2011, we generated total revenue of $1,064.1 million, Net Revenue of $786.0 million, net income of $18.6 million, Adjusted EBITDA of $205.4 million and an Adjusted EBITDA margin of 19.3%. For the six months ended June 30, 2010, we generated total revenue of $894.4 million, Net Revenue of $653.8 million, net loss of $31.1 million, Adjusted EBITDA of $155.3 million and an Adjusted EBITDA margin of 17.4%. This represents an increase of 190 basis points in period over period Adjusted EBITDA margin as a result of improved ticket pricing and onboard spending coupled with various business improvement, product enhancement and cost reduction initiatives. We refer you to note 6 to our “Summary Consolidated Financial Data” included elsewhere in this prospectus for a reconciliation of Adjusted EBITDA to net income (loss).
Our Industry
We believe that the cruise industry demonstrates the following positive fundamentals:
Strong Growth with Low Penetration and Significant Upside
Cruising is a vacation alternative with broad appeal, as it offers a wide range of products and services to suit the preferences of vacationing customers of all ages, backgrounds and interests. Since 1980, cruising has been one of the fastest growing segments of the North American vacation market. According to CLIA, in 2010 approximately 15 million passengers took cruises of two consecutive nights or more on CLIA member lines versus 7.2 million passengers in 2000, representing a compound annual growth rate of approximately 8%. Based on CLIA’s research, we believe that cruising is under-penetrated and represents approximately 10% of the North American vacation market. As measured in Berths or room count, the cruise industry is relatively nascent as compared to the wide variety of much more established vacation travel destinations across North America.
According to the Orlando/Orange County Convention & Visitors Bureau and the Las Vegas Convention and Visitors Authority, there are approximately 264,000 rooms in just Orlando and Las Vegas combined. By
2
Table of Contents
comparison, the estimated Major North American Cruise Brands’ capacity in terms of Berths is approximately 224,000. In addition, according to industry research, only 24% of the U.S. population has ever taken a cruise and we believe this percentage should increase. The European vacation market, the fastest growing market globally, remains under-penetrated by the cruise industry, with approximately 1% of Europeans having taken a cruise in a given year, compared with 3% of the population in the U.S. and Canada.
We believe that improving leisure travel trends along with a relatively low supply outlook in the near term from the Major North American Cruise Brands lead to an attractive business environment for our Company to operate in.
Attractive Demographic Trends to Drive Cruising Growth
The cruise market is comprised of a broad spectrum of customers and appeals to virtually all demographic categories. Based on CLIA’s 2011 study, the target North American cruise market, defined as households with income of $40,000 or more headed by a person who is at least 25 years old, is estimated to be 132.9 million people. Also according to the study, the average cruise customer is 50 years old with a household income of $109,000, with 69% of all cruise customers falling between the ages of 40 to 74. We believe this represents a very attractive segment of the population as the Brookings Institution recently reported that over the past decade the 55 to 64 age group was the fastest growing age group in the U.S. It is our belief that “Freestyle Cruising” will help us attract customers not only in the lucrative older population segment of North America, but also with younger generations, as well as Europeans, who we believe are more likely to enjoy greater levels of freedom during their cruise through the “Freestyle Cruising” product offering than was traditionally offered within the cruise industry.
Significant Value Proposition and High Level of Guest Satisfaction
We believe that the cost of a cruise vacation, relative to a comparable land-based resort or hotel vacation in Orlando or Las Vegas, offers an exceptional value proposition. When one considers that a typical cruise, for one all-inclusive price, offers its guests transportation to a variety of destinations, hotel-style accommodations, a generous diversity of food choices and a selection of daily entertainment options, this is compelling support for the cruise value proposition relative to other leisure alternatives. Cruises have become even more affordable for a greater number of North American customers over the past few years through the introduction of “Homeland Cruising”, which eliminates the cost of airfare commonly associated with a vacation.
According to CLIA’s 2011 study, approximately 70% of persons who have taken a cruise rate cruising as a high-value vacation alternative. In this same survey, CLIA reported that approximately 80% of cruise passengers agree that a cruise vacation is a good way to sample various destinations which they may visit again on a land-based vacation.
High Barriers to Entry
The cruise industry is characterized by high barriers to entry, including the existence of several established and recognizable brands, the large expense of building a new, sophisticated cruise ship, the long lead time necessary to construct new ships and limited newbuild shipyard capacity. Based on new ships announced over the past several years, the cost to build a cruise ship can range from approximately $500 million to $1.4 billion or approximately $200,000 to $425,000 per Berth, depending on the ship’s size and quality of product offering. The construction time of a newbuild ship is typically between 27 months to 36 months and requires significant upfront cash payments to fund construction costs before a dollar of revenue is generated. In addition, the shipbuilding industry is experiencing tightened capacity as the size of ships increases and the industry consolidates, with virtually all new capacity added in the last 20 years having been built by one of three major European shipbuilders.
3
Table of Contents
Segments and Brands
The different cruise lines that make up the global cruise vacation industry have historically been segmented by product offering and service quality into contemporary, premium and luxury brands. The contemporary segment generally includes cruises on larger ships that last seven days or less, provides a casual ambiance and is less expensive on average than the premium or luxury segments. The premium segment is generally characterized by cruises that last from seven to 14 nights with a higher quality product offering than the contemporary segment, appealing to a more affluent demographic. The luxury segment generally offers the highest level of service and quality, with longer cruises on the smallest ships. In classifying our competitors within the Major North American Cruise Brands, the contemporary segment has historically included Carnival Cruise Lines and Royal Caribbean International. The premium segment has historically included Celebrity Cruises, Holland America and Princess Cruises. By providing a diverse set of itineraries and a “Freestyle Cruising” experience, we believe that we straddle both the contemporary and premium segments as well as offer a unique combination of value and leisure services to cruise customers. Based on fleet counts as of December 31, 2010, the Major North American Cruise Brands together represent approximately 90% of the North American cruise market as measured by total Berths.
Our Competitive Strengths
We believe that the following business strengths will enable us to execute our strategy:
Leading Cruise Operator with High-Quality Product Offering
We believe that our modern fleet provides us with operational and strategic advantages as our entire fleet has been purpose-built for “Freestyle Cruising” with a wider range of passenger amenities relative to many of our competitors.
We believe that in recent years the distinction has been blurred between segments of the market historically known as “premium” and “contemporary,” with the Major North American Cruise Brands each offering a wide range of onboard experiences across their respective fleets. With the completion of our fleet renewal initiative, we believe that based on a number of different metrics that directly impact a passenger’s onboard experience, we compare favorably against the other Major North American Cruise Brands, with product attributes more in line with the premium segment.
| • | Youngest Fleet. With a weighted-average age of 6.6 years (as of June 30, 2011) and no ships built before 1998, we have the youngest fleet among the Major North American Cruise Brands, which we believe allows us to offer a high-quality passenger experience with a significant level of consistency across our entire fleet. As a result of our younger fleet, we have a substantially higher percentage of outside balcony cabins across our fleet than the other contemporary brands, which helps drive higher Net Yields. |
| • | Rich Cabin Mix. As of June 30, 2011, 48% of our cabins had private balconies representing a higher mix of outside balcony cabins than the other contemporary brands. In addition, five of our ships offer a complex of private courtyard villas of up to approximately 570 square feet each. Customers staying in these villas are provided with personal butler service and exclusive access to a private courtyard area with private pools, sundeck, hot tubs, and fitness center. Six of our ships also offer luxury garden villas of up to 6,694 square feet, making them the largest accommodations at sea. |
| • | High-Quality Service. We believe we offer a very high level of onboard service, as demonstrated by our guest-to-crew ratio of 2.2 to 1, which is among the best of all the Major North American Cruise Brands. |
4
Table of Contents
| • | Diverse Selection of Premium Itineraries. For the year ended December 31, 2010, approximately 54% of our itineraries, by Capacity Days, were in more exotic, under-penetrated and less traditional locations, including Alaska, Hawaii, Bermuda and Europe, compared to the other contemporary brands which are focused primarily on itineraries in the Caribbean and Mexico. This mix of destinations is more consistent with the brands in the premium segment, and these itineraries typically attract higher Net Yields than Caribbean and Mexico sailings. |
We believe that this high-quality product offering positions us well in comparison to the other Major North American Cruise Brands and provides an opportunity for continued Net Yield growth.
“Freestyle Cruising”
The most important differentiator for our brand is the “Freestyle Cruising” concept onboard all eleven of our ships. The essence of “Freestyle Cruising” is to provide a cruise experience that offers more freedom and flexibility than any other traditional cruise alternative. While many cruise lines have historically required guests to dine at assigned group tables and at specified times, “Freestyle Cruising” offers the flexibility and choice to our passengers who prefer to dine when they want, with whomever they want and without having to dress formally. Additionally, we have increased the number of activities and dining facilities available onboard, allowing passengers to tailor their onboard experience to their own schedules, desires and tastes. The key elements of “Freestyle Cruising” include:
| • | flexible dining policy; no fixed dining times or pre-assigned seating in our dining rooms; |
| • | up to 21 dining options; in addition to multiple main dining rooms, a casual action station buffet and quick service outdoor grill, our ships offer a wide variety of specialty restaurants, with most offering a classic steakhouse, fine French, Japanese teppanyaki, sushi, Italian, Mexican and Asian fusion restaurants, which we believe is the widest selection of full-service dining options among the fleets of the Major North American Cruise Brands; |
| • | resort-casual dress code acceptable throughout the ship at all times; |
| • | increased service staff for a more personalized vacation experience; |
| • | replacement of cash tipping with an automated service charge system; |
| • | diverse “lifestyle” activities, including cultural and educational onboard programs along with an increased adventure emphasis for shore excursions; and |
| • | passenger-friendly disembarkation policies. |
All of our ships have been custom designed and purpose-built for “Freestyle Cruising,” which we believe differentiates us significantly from our major competitors. We further believe that “Freestyle Cruising” attracts a passenger base that prefers the less structured, resort-style experience of our cruises. Building on the success of “Freestyle Cruising,” we implemented across our fleet “Freestyle 2.0” featuring significant enhancements to our onboard product offering. These enhancements include a major investment in the total dining experience; upgrading the stateroom experience across the ship; new wide-ranging onboard activities for all ages; and additional recognition, services and amenities for premium-priced balcony, suite and villa passengers. With Norwegian Epic we have enhanced “Freestyle Cruising” by offering what we believe to be unmatched flexibility in entertainment, offering guests a wide variety of activities and performances to choose from at any time of day or night.
5
Table of Contents
Established Brand Recognition
The Norwegian Cruise Line brand is well established in the cruise industry with a long track record of delivering a world class cruise product offering to its customers. We achieve high-quality feedback scores from our customers in the areas of overall service, physical ship attributes, onboard products and services, food and beverage offerings and overall entertainment and land-based excursion quality. Based on recent guest experience and loyalty reports, the quality of our guests’ experience generates high levels of customer loyalty, as demonstrated by the fact that approximately 30% of our customers are repeat customers and approximately 70% say they would recommend Norwegian Cruise Line to their friends and family. Brand recognition is also strong with over 93% of cruisers reporting familiarity with Norwegian. Additionally, our brand is known for freedom, flexibility and choice, all highly valued benefits within the cruise industry demographic.
Strong Cash Flow
Nearly all of our capital expenditures, other than those related to our newbuild projects (which are substantially financed) and the current renovation of our private island, relate to the maintenance of our young and modern fleet and shoreside operations, which includes investments in our IT infrastructure and business intelligence systems. Our newbuild projects include very attractive financing which will fund approximately 90% of the required pre-delivery and delivery date construction payments; as such, we expect the cost of our newbuild projects to have a minimal impact on our cash flow in the near term.
We are able to generate significant levels of cash flow due to our ability to pre-sell tickets and receive customer deposits with long lead times ahead of sailing. Our debt financing is relatively low cost, with a weighted-average interest rate cost of 6.05% as of June 30, 2011. In addition, we believe that the favorable U.S. federal income tax regime applicable to international shipping income will enhance our cash flow from operations that can be utilized to significantly de-lever our balance sheet over time.
Highly Experienced Management Team
Our senior management team is comprised of experienced executives with an average of 14.8 years in the cruise, travel, leisure and hospitality-related industries. Since the Apollo Funds’ and the TPG Viking Funds’ investment in January 2008, 28 of the top 37 members of our senior management team (including 12 of the top 14) have been newly recruited or promoted to their current position under the leadership of our President and Chief Executive Officer, Kevin M. Sheehan. Their combined experience in related hospitality industries coupled with their financial expertise is a significant contributor to improving the operating and financial performance of our Company.
Strong and Experienced Shareholders
Our shareholders or their affiliates have extensive experience investing in the cruise, leisure and travel-related industries. Affiliates of the Apollo Funds have invested significant equity and resources to the cruise and leisure industry with its investment in Prestige Cruise Holdings, Inc. which operates through two distinct upscale cruise brands, Oceania Cruises and Regent Seven Seas Cruises. In addition, affiliates of both Apollo and TPG Capital own Caesars Entertainment Corporation (“Caesars Entertainment”), with whom we have created a marketing alliance. Affiliates of TPG Capital are also significant investors in Sabre Holdings, a leading GDS (global distribution system) and parent of Travelocity.com. Genting HK, headquartered in Hong Kong, operates a leading Asian cruise line with destinations in Malaysia, Singapore, Hong Kong, Taiwan and Japan.
6
Table of Contents
Our Business Strategies
We seek to attract vacationers by offering new products and services and creating differentiated itineraries in new markets through new and existing modern ships with the aim of delivering a better, value-added, vacation experience to our customers relative to other broad-based or land-based leisure alternatives.
Attractive Product Offerings
We have a long history of product development within the cruise industry as one of the most established consumer brands. We became the first cruise operator to buy a private island in the Bahamas to offer a private beach experience to our passengers; and we were the first to introduce a 2,000-Berth megaship into the Caribbean market in 1980. More recently, we pioneered new concepts in cruising over the last decade with the development of “Homeland Cruising” and the launch of “Freestyle Cruising.”
We continue to enhance our product offerings with the delivery of Norwegian Epic in June 2010, which offers 21 dining options, a diverse range of accommodations and what we believe is the widest array of entertainment at sea. In addition to several differentiated full-service complimentary dining rooms, Norwegian Epic also features specialty restaurants including a classic steakhouse, sushi, Japanese teppanyaki, Brazilian churrascaria, Asian noodle bar, traditional Chinese, fine French and Italian restaurants. Guest accommodations on Norwegian Epic include the groundbreaking Studios, 128 cabins designed for solo travelers centered around the Studio Lounge, a private two-story lounge for studio guests. On its top decks, Norwegian Epic offers a “ship within a ship” in the largest suite complex at sea; the exclusive Villas compound includes two decks with 52 villas and penthouses, a private pool with multiple hot tubs and sundecks, a private fitness center and steam rooms, fine dining in the Epic Club restaurant, casual outdoor dining at the Courtyard Grill, and 24-hour concierge service, all exclusively for villa and penthouse guests. Entertainment onboard Norwegian Epic includes a wide variety of branded entertainment for guests to choose from, including exclusive engagements with Blue Man Group, Cirque Dreams & Dinner, Legends in Concert, Nickelodeon and the improvisational comedy troupe, The Second City.
Building on the success of Norwegian Epic, we are drawing on our legacy of new product development to create two new next-generation “Freestyle Cruising” ships, scheduled for delivery in the second quarter of 2013 and 2014, respectively. These 4,000 Berth ships will include many of the most popular elements of Norwegian Epic and the rest of our fleet together with new groundbreaking features, while keeping the consistent innovative spirit of “Freestyle Cruising” in the core of the design.
In 2009, we initiated a $25 million renovation to our private island, Great Stirrup Cay, which includes a new dining and bar facility to enhance the guest experience, as well as offering new activities such as wave runners, an aqua park and a stingray encounter experience. The enhancements are scheduled to be completed in phases through the end of 2011 and are expected to provide us with additional revenue generating opportunities on the island.
Maximize Net Yields
We are focused on growing our revenue through various initiatives aimed at increasing our ticket prices and occupancy as well as onboard spending to drive higher overall Net Yields. To maximize passenger ticket revenue, our revenue management strategy is focused on optimizing pricing and generating demand throughout the booking curve. We base-load our capacity by booking passengers as early before sailing as possible.
Base-loading is a strategy by which we focus on selling inventory further from the cruise departure date by targeting sales and marketing tactics, such as full ship Charters and corporate meetings which generate business with longer booking windows. Our base-loading strategy also includes strategic relationships with travel agencies and international tour operators, who commit to purchasing a certain level of inventory with long lead times.
7
Table of Contents
Through base-loading, we believe we will increase our Net Yields by filling our ships earlier, rather than discounting close to sailing dates in order to achieve our targeted Load Factors. Our specific initiatives to achieve this include:
| • | Casino Player Strategy. As part of this strategy, we have non-exclusive arrangements with approximately 90 casino partners worldwide including Caesars Entertainment, which is owned by affiliates of both Apollo and TPG Capital, whereby loyal gaming customers are offered cruise reward certificates redeemable for cruises on our ships. Through property sponsored events and joint marketing programs, we have the opportunity to market cruises to Caesars Entertainment’s customers. These arrangements with our casino partners have the dual benefit of filling open inventory and reaching customers expected to generate above average onboard revenue through the casino and other onboard spending. |
| • | Strategic Relationships. Our base-loading strategy also includes strategic relationships with travel agencies and international tour operators, who commit to purchasing a certain level of inventory with long lead times. |
| • | Charter, Meeting & Incentive (“CM&I”) Sales. We are increasing our focus on driving additional business through the CM&I channel, which typically books very far in advance and can represent a significant portion of the ship, or even an entire sailing, in one transaction. |
| • | PROS Yield Management System. In late 2009, we implemented the PROS yield management system which allows us to better analyze and maximize our overall pricing decisions. |
We continue to focus on various initiatives to drive increased onboard revenue across a variety of areas. From the year ended December 31, 2007 to the twelve months ended June 30, 2011, our net onboard and other revenue yield increased by approximately 25% from $42.86 to $53.49 primarily due to strong performance in casino, beverage sales, specialty dining and shore excursions. Our strategy for further driving increased onboard revenue includes, among other things, generating additional casino revenue through our arrangements with our casino partners, including Caesars Entertainment and Genting HK. These arrangements incorporate marketing resources to deliver cross-company advertising and marketing campaigns to promote our brand. We also focus on optimizing the utilization of our specialty restaurants that carry a cover charge, pre-booking and pre-selling additional onboard activities and encouraging our staff to offer our passengers additional revenue generating products and services. In addition, the delivery of Norwegian Epic has created additional onboard revenue opportunities through ticket sales and merchandising, based on our unique and premium entertainment offerings.
Brand Expansion Through Disciplined Newbuild Program
In September 2010, we reached an agreement with Meyer Werft GmbH of Papenburg, Germany to build two new cruise ships with financing commitments in place from a syndicate of banks for export credit financing. The new ships are scheduled for delivery in the second quarter of 2013 and 2014, respectively. Building on the success of Norwegian Epic, we have designed these two new next-generation “Freestyle Cruising” ships to include some of the most popular elements of our most recently delivered ships together with new and differentiated features, consistent with Norwegian Cruise Line’s legacy of new product development in the cruise industry. We believe that these ships will allow us to continue to expand the reach of our brand while driving shareholder value. Our financing arrangements provide for financing for approximately 90% of the contract price of the two ships. Each ship will approximate 143,500 Gross Tons and 4,000 Berths with an aggregate contract price of approximately €1.2 billion, or $1.7 billion based on the euro/U.S. dollar exchange rate as of June 30, 2011. This is approximately €155,000 per Berth, or $225,000 per Berth based on the euro/U.S. dollar exchange rate as of June 30, 2011, which we believe compares favorably against other recent newbuild ship orders in the industry.
8
Table of Contents
Improve Operating Efficiency and Lower Costs
We are continually focused on driving financial improvement through a variety of cost savings initiatives. These initiatives are focused on reducing costs while at the same time improving the overall product we deliver to our customers. Since the beginning of 2008, we have significantly reduced our operating cost base through various programs including contract renegotiations, overhead rationalization, and fuel consumption reduction initiatives. We also typically hedge a majority of our near term fuel consumption in order to provide greater visibility of our fuel expense; as of June 30, 2011, we had hedged approximately 61% of our remaining 2011 projected fuel consumption. We have also reduced our maintenance expense as a result of our fleet renewal program, as younger, more modern ships are typically less costly to maintain than older ships. Beginning in early 2008, we reduced our capacity in the Hawaii market, re-flagging and relocating two of three ships, which significantly reduced crew payroll expenses aboard those ships creating substantial margin expansion. In addition, we expect the economies of scale from our two newbuild ships to drive further operating efficiencies over the long term.
Expand and Strengthen Our Product Distribution Channels
As part of our growth strategy, we are continually looking for ways to deepen and expand our customer sales channels. We restructured our sales and marketing organization, which included the hiring of two Senior Vice Presidents and five Vice Presidents, to provide better focus on distribution through four primary channels: retail/travel agent, direct, international, and CM&I.
| • | Retail/Travel Agent. We have implemented close to 100 individual projects specifically designed to improve our efficiency with the travel agency channels and our guests, ranging from more timely commission payments to aggressive call center quality monitoring. We also restructured our travel agent sales force, allowing us to more effectively support the larger accounts, which represent approximately 50% of our customers, with specific expertise and also gain access to a significantly larger number of travel partners through an outbound call center based in our Miami headquarters. We believe that our travel agent partners have witnessed a material improvement in our business practices and overall communication since the arrival of our new management team. |
| • | Direct. We continue to grow our direct business through investments in our brand and our website as well as increasing our direct sales force. Passengers booking directly with us tend to book earlier and in premium category inventory which provides higher Net Yields. |
| • | International. We have an international sales presence, with over 145 people in Europe and representatives covering Latin America, Australia and Asia. We are primarily focused on increasing our business in the European market, which has grown significantly in recent years but remains under-penetrated. In Europe, we now offer local itineraries year-round and our “Freestyle Cruising” has been well received. We are in the process of expanding our direct sales force in Europe which will allow us to develop our direct distribution in Europe in a manner similar to our U.S. operation. In support of this European strategy, we deployed our newest and most sophisticated ship, Norwegian Epic, in Europe for an extended summer season which began in May 2011. We are forging a closer distribution partnership with Genting HK, to develop product distribution across the Asia Pacific region. |
| • | CM&I. Our CM&I business focuses on full ship Charters as well as corporate meeting and incentive travel. These sales often have very long lead times and generate a higher level of Net Yield than sales through our other channels. |
Across every distribution channel we are undertaking a major effort to grow demand with a targeted sales and marketing program for our premium stateroom categories, including our balcony and other premium stateroom categories, with a particular emphasis on our suites and villa complexes, which have increased as a percentage of our total inventory as a result of our fleet renewal.
9
Table of Contents
Our Fleet
Our ships are purpose-built ships that enable us to provide our customers with the ultimate “Freestyle Cruising” experience. Our ships have state-of-the-art passenger amenities, including up to 21 dining options together with hundreds of private balcony cabins on each ship. As of June 30, 2011, 48% of our cabins have private balconies representing a higher mix of outside cabins than the other contemporary brands. Private balcony cabins are very popular with passengers and offer the opportunity for increased revenue by allowing us to charge a premium. Five of our ships offer a complex of private courtyard villas, each with up to approximately 570 square feet, which provide personal butler service and exclusive access to a private courtyard area with private pools, sundeck, hot tubs, and fitness center. In addition, six of our ships have luxury garden villas with up to 6,694 square feet, making them the largest accommodations at sea. These luxury garden villas offer three separate bedroom areas, spacious living and dining room areas, as well as 24-hour, on-call butler and concierge service.
Continuing our tradition of new product development and the extension of the Norwegian Cruise Line brand, we took delivery of Norwegian Epic in June 2010. Norwegian Epic offers our passengers itineraries to the western and eastern Caribbean as well as Europe. The ship offers our customers a large aqua park, sports complex, two three-lane bowling alleys and our two-story Wii™ Wall. In addition, the ship features a spa facility and fitness center with more than 31,000 square feet. There are 21 dining options on Norwegian Epic offering one of the widest choices of dining experiences among the fleets of the Major North American Cruise Brands. Exclusive entertainment is offered aboard Norwegian Epic with the addition of brand new entertainment choices including Blue Man Group, Cirque Dreams & Dinner, Legends in Concert and Nickelodeon at Sea. We offer world-class entertainment in our jazz and blues club and our comedy club features the improvisational comedy troupe, The Second City. Norwegian Epic has been very well received by the market with the strongest bookings we have ever seen for a new ship, both in terms of price and volume. This positive reception has also benefited the rest of our fleet, which experienced significant bookings due to the uplift that Norwegian Epic has created for our brand overall. We believe the premium cabin mix of Norwegian Epic will drive further increases in Net Yield.
As further described in “—Our Business Strategies—Brand Expansion Through Disciplined Newbuild Program,” building on the successful launch of Norwegian Epic, we recently announced two new ships with approximately 4,000 Berths each, scheduled for delivery in the second quarter of 2013 and 2014, respectively.
Our Shareholders
Apollo
Apollo is a leading global alternative asset manager with offices in New York, Los Angeles, London, Frankfurt, Luxembourg, Singapore, Hong Kong and Mumbai. As of December 31, 2010, Apollo had assets under management of $67.6 billion invested in its private equity, capital markets and real estate businesses. Apollo owns a controlling interest in Prestige Cruises International, Inc. which operates through two distinct upscale cruise brands, Oceania Cruises and Regent Seven Seas Cruises. Apollo also has current investments in other travel and leisure companies, including Caesars Entertainment and AMC Entertainment and has in the past invested in Vail Resorts and Wyndham International and other hotel properties.
TPG Capital
TPG Capital is a leading private investment firm with $48 billion of assets under management as of June 30, 2011. TPG Capital has extensive experience with global public and private investments executed through leveraged buyouts, recapitalizations, spinouts, joint ventures and restructurings. TPG Capital seeks to invest in world-class franchises across a range of industries. Current investments include Caesars Entertainment,
10
Table of Contents
Neiman Marcus, Sabre, Energy Future Holdings (formerly TXU) and Univision. Past investments include Alltel, Burger King, Continental Airlines, Fairmont Raffles, Hotwire, Seagate and Texas Genco.
Genting HK
Genting HK was founded in 1993 and operates a leading cruise line in the Asia-Pacific region. Its headquarters are located in Hong Kong and it is represented in more than 20 locations worldwide, with offices and representatives in Asia, Australia, Europe, United Arab Emirates and the U.S. Genting HK currently has a fleet of seven ships, which offer various cruise itineraries in the Asia Pacific region.
Corporate Reorganization
In connection with the consummation of this offering, the Issuer will become the 100% owner and parent company of NCL Corporation Ltd. (the “Corporate Reorganization”). The Corporate Reorganization will be effected solely for the purpose of reorganizing our corporate structure as described herein. The Issuer will not, prior to the completion of the Corporate Reorganization, conduct any activities other than those incidental to its formation and to preparations for the Corporate Reorganization and this offering. The Issuer has only nominal assets and no liabilities prior to the consummation of the Corporate Reorganization and this offering. Upon closing, its only assets will be 100% of the ordinary shares of NCL Corporation Ltd. and cash proceeds of this offering not otherwise used or contributed to NCL Corporation Ltd. Also, as part of the Corporate Reorganization, (i) NCL Corporation Ltd.’s outstanding ordinary shares will be exchanged for our ordinary shares and (ii) we will issue an economically equivalent number of our ordinary shares, at an exchange formula based on the initial public offering price in this offering, in exchange for NCL Corporation Ltd.’s outstanding profits interests granted under the Profits Sharing Agreement, including the Ordinary Profits Units described below in “Compensation Discussion & Analysis.” Our executive officers and directors will be the same as the executive officers and directors of NCL Corporation Ltd. in effect immediately prior to the Corporate Reorganization, except that certain of our shareholders have a contractual right under the Shareholders’ Agreement to appoint two additional members, in the aggregate, to our board of directors (our “Board of Directors”) and we anticipate that they will do so prior to the consummation of this offering, thereby increasing the size of our Board of Directors to nine members. See “Certain Relationships and Related Party Transactions—The Shareholders’ Agreement.” Upon consummation of the Corporate Reorganization, our memorandum of association and bye-laws, and the rights, privileges and interests of our shareholders that will be in effect as of the consummation of this offering, will be as described in “Description of Share Capital.” See also “Management,” “Security Ownership of Certain Beneficial Owners and Management,” and “Certain Relationships and Related Party Transactions—The Shareholders’ Agreement.”
Additional Information
We are incorporated under the laws of Bermuda. Our registered offices are located at Cumberland House, 9th Floor, 1 Victoria Street, Hamilton HM 11, Bermuda. Our principal executive offices are located at 7665 Corporate Center Drive, Miami, Florida 33126. Our telephone number is (305) 436-4000. Our website is www.ncl.com. The information that appears on our website is not part of, and is not incorporated by reference into, this prospectus.
11
Table of Contents
The Offering
| Issuer |
Norwegian Cruise Line Holdings Ltd. which, upon the consummation of this offering, will own 100% of the ordinary shares of NCL Corporation Ltd. |
| Ordinary shares offered by us |
| Ordinary shares to be outstanding after this offering |
(assuming no exercise of the underwriters’ option to purchase additional ordinary shares) based upon an assumed initial public offering price of $ per ordinary share, which is the midpoint of the estimated price range set forth on the cover of this prospectus. In connection with the Corporate Reorganization and prior to the consummation of this offering, we will issue an economically equivalent number of our ordinary shares, based on the initial public offering price in this offering, in exchange for all outstanding NCL Corporation Ltd. profits interests granted under the Profits Sharing Agreement, including the Ordinary Profits Units (each as described in “Compensation Discussion & Analysis”). |
| There will be ordinary shares available for future awards under our new long-term incentive plan as of the consummation of this offering. |
| A $1.00 increase or decrease in the assumed offering price of $ per ordinary share, which is the midpoint of the initial public offering price range set forth on the cover of this prospectus, would increase or decrease the number of ordinary shares to be outstanding after this offering by approximately shares as a result of an increase or decrease in the ordinary shares we will issue in exchange for the profits interests, assuming the number of ordinary shares offered by us, as set forth above and on the cover page of the prospectus, remains the same. |
| Underwriters’ option to purchase additional shares |
We have granted the underwriters an option for a period of 30 days to purchase from us an aggregate of up to additional ordinary shares. |
| Use of proceeds |
We estimate that we will receive net proceeds from the sale of our ordinary shares in this offering, after deducting the underwriting discount and other estimated expenses, of approximately $ million, assuming the ordinary shares are offered at $ per ordinary share, which is the midpoint of the estimated offering price range set forth on the cover page of this prospectus. We intend to use the net proceeds that we receive to redeem or prepay outstanding debt and to pay expenses associated with this offering. A $1.00 increase or decrease in the assumed offering price of $ |
12
Table of Contents
| per ordinary share, which is the midpoint of the estimated price range set forth on the cover of this prospectus, would increase or decrease the net proceeds we receive from this offering by approximately $ million, assuming the number of ordinary shares offered by us, as set forth above and on the cover of this prospectus, remains the same and after deducting the underwriting discounts and other estimated expenses. |
| Listing |
We expect to apply for listing of our ordinary shares on the NASDAQ Global Select Market under the symbol “NCLH”. |
| Dividend policy |
We do not intend to pay dividends following this offering. Our debt agreements, among other things, restrict our ability to pay cash dividends to our shareholders. In addition, any determination to pay dividends in the future will be at the discretion of our Board of Directors and will depend upon our results of operations, financial condition, business opportunities, contractual restrictions, restrictions imposed by applicable law and other factors that our Board of Directors deems relevant. See “Dividend Policy.” |
| Voting rights |
Each of our ordinary shares will entitle its holder to one vote on all matters to be voted on by shareholders generally. Our public shareholders will have approximately % of the voting power of the Issuer (or approximately % if the underwriters exercise in full their option to purchase additional ordinary shares) and Genting HK, the Apollo Funds and the TPG Viking Funds, who will be contractually bound by the terms of the Shareholders’ Agreement (as defined elsewhere in this prospectus) with respect to the exercise of their voting rights in certain matters, will have approximately % of the voting power of the Issuer (or approximately % if the underwriters exercise in full their option to purchase additional ordinary shares). See “Description of Share Capital—Ordinary Shares—Transfer Restrictions.” |
| Risk factors |
You should carefully read and consider the information set forth under “Risk Factors” beginning on page 18 of this prospectus and all other information set forth in this prospectus before investing in our ordinary shares. |
| Tax considerations |
See “Material U.S. Federal Income Tax Considerations,” “Material Bermuda Tax Considerations” and “Business—Taxation of the Company” for more information regarding tax considerations. |
13
Table of Contents
Summary Consolidated Financial Data
The summary consolidated financial and operating data presented in the tables below should be read in conjunction with “Selected Consolidated Financial Data,” “Management’s Discussion and Analysis of Financial Condition and Results of Operations” and our consolidated financial statements and the related notes included elsewhere in this prospectus. In the table below, the consolidated balance sheets as of December 31, 2010, 2009 and 2008 and the related consolidated statements of operations and of cash flows for each of the three years in the period ended December 31, 2010 have been derived from our financial statements included elsewhere in this prospectus, with the exception of the consolidated balance sheet as of December 31, 2008 and pro forma earnings (loss) per share as adjusted which are not included. In addition, the consolidated balance sheets as of June 30, 2011 and June 30, 2010 and the related consolidated statements of operations and of cash flows for each of the six month periods ended June 30, 2011 and 2010 and the notes thereto have been derived from our unaudited financial statements also appearing herein, with the exception of the consolidated balance sheet as of June 30, 2010 and pro forma earnings (loss) per share as adjusted which are not included. The data as of and for the six months ended, in the opinion of management, contain all normal recurring adjustments, necessary for a fair statement of the results for the unaudited interim periods. Our financial data (unaudited) is also presented for the twelve months ended June 30, 2011. Historical results are not necessarily indicative of results that may be expected for any future period.
| Twelve Months Ended June 30, |
Six Months Ended June 30, |
Year Ended December 31, | ||||||||||||||||||||||
| (in thousands, except per share data) | 2011 | 2011 | 2010 | 2010 | 2009 | 2008 | ||||||||||||||||||
| Statement of operations data: |
||||||||||||||||||||||||
| Revenue |
||||||||||||||||||||||||
| Passenger ticket |
$ | 1,510,134 | $ | 725,343 | $ | 607,715 | $ | 1,392,506 | $ | 1,275,844 | $ | 1,501,646 | ||||||||||||
| Onboard and other |
671,673 | 338,753 | 286,702 | 619,622 | 579,360 | 604,755 | ||||||||||||||||||
|
|
|
|
|
|
|
|
|
|
|
|
|
|||||||||||||
| Total revenue |
2,181,807 | 1,064,096 | 894,417 | 2,012,128 | 1,855,204 | 2,106,401 | ||||||||||||||||||
|
|
|
|
|
|
|
|
|
|
|
|
|
|||||||||||||
| Cruise operating expense |
||||||||||||||||||||||||
| Commissions, transportation and other |
404,143 | 194,990 | 170,502 | 379,655 | 377,036 | 410,061 | ||||||||||||||||||
| Onboard and other |
166,144 | 83,087 | 70,080 | 153,137 | 158,330 | 182,817 | ||||||||||||||||||
| Payroll and related |
283,316 | 144,569 | 126,643 | 265,390 | 252,426 | 309,083 | ||||||||||||||||||
| Fuel |
230,913 | 120,610 | 96,907 | 207,210 | 162,683 | 258,262 | ||||||||||||||||||
| Food |
124,901 | 62,522 | 51,685 | 114,064 | 118,899 | 126,736 | ||||||||||||||||||
| Other |
249,469 | 121,368 | 99,741 | 227,842 | 220,080 | 291,522 | ||||||||||||||||||
|
|
|
|
|
|
|
|
|
|
|
|
|
|||||||||||||
| Total cruise operating expense |
1,458,886 | 727,146 | 615,558 | 1,347,298 | 1,289,454 | 1,578,481 | ||||||||||||||||||
|
|
|
|
|
|
|
|
|
|
|
|
|
|||||||||||||
| Other operating expense |
||||||||||||||||||||||||
| Marketing, general and administrative |
271,582 | 133,169 | 125,985 | 264,398 | 241,676 | 299,827 | ||||||||||||||||||
| Depreciation and amortization |
186,205 | 92,767 | 76,753 | 170,191 | 152,700 | 162,565 | ||||||||||||||||||
| Impairment loss(1) |
— | — | — | — | — | 128,775 | ||||||||||||||||||
|
|
|
|
|
|
|
|
|
|
|
|
|
|||||||||||||
| Total other operating expense |
457,787 | 225,936 | 202,738 | 434,589 | 394,376 | 591,167 | ||||||||||||||||||
|
|
|
|
|
|
|
|
|
|
|
|
|
|||||||||||||
| Operating income (loss) |
265,134 | 111,014 | 76,121 | 230,241 | 171,374 | (63,247 | ) | |||||||||||||||||
|
|
|
|
|
|
|
|
|
|
|
|
|
|||||||||||||
| Non-operating income (expense) |
||||||||||||||||||||||||
| Interest income |
59 | 24 | 65 | 100 | 836 | 2,796 | ||||||||||||||||||
| Interest expense, net of capitalized interest |
(195,461 | ) | (94,575 | ) | (72,886 | ) | (173,772 | ) | (115,350 | ) | (152,364 | ) | ||||||||||||
| Other income (expense)(2) |
2,508 | 2,088 | (34,372 | ) | (33,952 | ) | 10,373 | 1,012 | ||||||||||||||||
|
|
|
|
|
|
|
|
|
|
|
|
|
|||||||||||||
| Total non-operating income (expense) |
(192,894 | ) | (92,463 | ) | (107,193 | ) | (207,624 | ) | (104,141 | ) | (148,556 | ) | ||||||||||||
|
|
|
|
|
|
|
|
|
|
|
|
|
|||||||||||||
| Net income (loss) as reported |
$ | 72,240 | $ | 18,551 | $ | (31,072 | ) | $ | 22,617 | $ | 67,233 | $ | (211,803 | ) | ||||||||||
|
|
|
|
|
|
|
|
|
|
|
|
|
|||||||||||||
| Pro forma net income (loss) as adjusted(a) |
$ | $ | ||||||||||||||||||||||
|
|
|
|
|
|
|
|
|
|
|
|
|
|||||||||||||
14
Table of Contents
| Twelve Months Ended June 30, |
Six Months Ended June 30, |
Year Ended December 31, | ||||||||||||||||||||||
| (in thousands, except per share data) | 2011 | 2011 | 2010 | 2010 | 2009 | 2008 | ||||||||||||||||||
| Earnings (loss) per share as reported |
||||||||||||||||||||||||
| Basic |
$ | $ | $ | $ | 1.07 | $ | 3.24 | $ | (10.59 | ) | ||||||||||||||
|
|
|
|
|
|
|
|
|
|
|
|
|
|||||||||||||
| Diluted |
$ | $ | $ | $ | 1.06 | $ | 3.23 | $ | (10.59 | ) | ||||||||||||||
|
|
|
|
|
|
|
|
|
|
|
|
|
|||||||||||||
| Pro forma earnings per share as adjusted(b)(c) |
||||||||||||||||||||||||
| Basic |
$ | $ | ||||||||||||||||||||||
|
|
|
|
|
|||||||||||||||||||||
| Diluted |
$ | $ | ||||||||||||||||||||||
|
|
|
|
|
|||||||||||||||||||||
| (a) | Pro forma net income (loss) as adjusted reflects an interest expense adjustment of $ . This was derived by applying the applicable interest rates to the change in certain of our outstanding debt associated with the use of proceeds from this offering. See “Use of Proceeds.” |
The interest expense adjustment per facility is as follows:
| $450.0 million senior secured notes |
$ | |||
|
|
|
|||
| $250.0 million senior secured notes |
$ | |||
|
|
|
|||
| $750.0 million senior secured revolving credit facility |
$ | |||
|
|
|
There was no tax effect on the interest expense adjustment based on our current tax structure.
| (b) | Pro forma earnings per share as adjusted reflects the shares outstanding as a result of the Corporate Reorganization, additional shares issued as part of this offering, as well as the interest expense adjustment noted in footnote (a). The basis of the computation includes $ of debt to be repaid and shares outstanding (assuming no exercise of the underwriters’ option to purchase additional ordinary shares) based upon an assumed initial public offering price of $ per ordinary share, which is the midpoint of the estimated price range set forth on the cover of this prospectus. Also included are pro forma basic weighted-average shares outstanding of and for the six months ended June 30, 2011 and year ended December 31, 2010, respectively, and pro forma diluted weighted-average shares outstanding of and for the six months ended June 30, 2011 and year ended December 31, 2010, respectively. A $1.00 increase or decrease in the assumed offering price of $ per ordinary share, which is the midpoint of the initial public offering price range set forth on the cover of this prospectus, would increase or decrease the number of ordinary shares to be outstanding after this offering by approximately shares as a result of an increase or decrease in the ordinary shares we will issue in exchange for the profits interests, assuming the number of ordinary shares offered by us, as set forth above and on the cover page of the prospectus, remains the same. See Note 12 “Norwegian Cruise Line Holdings Ltd. and Reorganization—Pro Forma EPS (Unaudited) and Adjusted Pro Forma EPS (Unaudited)” to our consolidated financial statements for additional pro forma earnings per share calculations. |
| (c) | We do not anticipate a material change in our use of proceeds, therefore any change in pro forma earnings per share as adjusted would not be material. |
| As of or for the Twelve Months Ended June 30, |
As of or for the Six Months Ended June 30, |
As of or for the Year Ended December 31, |
||||||||||||||||||||||
| (in thousands, except Other data) | 2011 | 2011 | 2010 | 2010 | 2009 | 2008 | ||||||||||||||||||
| Balance sheet data: (at end of period) |
||||||||||||||||||||||||
| Cash and cash equivalents |
$ | 60,177 | $ | 60,177 | $ | 99,441 | $ | 55,047 | $ | 50,152 | $ | 185,717 | ||||||||||||
| Advance ticket sales |
414,557 | 414,557 | 385,688 | 294,180 | 255,432 | 250,638 | ||||||||||||||||||
| Total assets |
5,606,109 | 5,606,109 | 5,538,421 | 5,563,513 | 4,811,348 | 5,047,141 | ||||||||||||||||||
| Total debt |
3,072,659 | 3,072,659 | 3,168,531 | 3,204,085 | 2,557,691 | 2,656,501 | ||||||||||||||||||
| Total liabilities |
3,836,985 | 3,836,985 | 3,877,357 | 3,831,845 | 3,106,797 | 3,497,342 | ||||||||||||||||||
| Total shareholders’ equity |
1,769,124 | 1,769,124 | 1,661,064 | 1,731,668 | 1,704,551 | 1,549,799 | ||||||||||||||||||
| Cash flow data: |
||||||||||||||||||||||||
| Net cash provided by (used in) operating activities |
339,414 | 234,210 | 313,742 | 418,946 | 50,726 | (23,297 | ) | |||||||||||||||||
| Net cash used in investing activities |
(212,296 | ) | (97,350 | ) | (853,994 | ) | (968,940 | ) | (166,573 | ) | (166,236 | ) | ||||||||||||
| Net cash provided by (used in) financing activities |
(166,382 | ) | (131,730 | ) | 589,541 | 554,889 | (19,718 | ) | 334,959 | |||||||||||||||
| Other financial measures:(3) |
||||||||||||||||||||||||
| Ship Contribution(5) |
722,921 | 336,950 | 278,859 | 664,830 | 565,750 | 527,920 | ||||||||||||||||||
| Adjusted EBITDA(6) |
454,863 | 205,373 | 155,255 | 404,745 | 332,533 | 285,950 | ||||||||||||||||||
| Capital expenditures: |
||||||||||||||||||||||||
| Maintenance |
73,914 | 41,186 | 29,591 | 62,319 | 27,290 | 56,200 | ||||||||||||||||||
| Newbuild |
146,908 | 56,164 | 824,403 | 915,147 | 134,548 | 107,407 | ||||||||||||||||||
| Other data:(3) |
||||||||||||||||||||||||
| Passenger Cruise Days |
10,221,094 | 5,030,805 | 4,368,760 | 9,559,049 | 9,243,154 | 9,503,839 | ||||||||||||||||||
| Capacity Days |
9,450,180 | 4,683,408 | 4,024,208 | 8,790,980 | 8,450,980 | 8,900,816 | ||||||||||||||||||
| Occupancy Percentage |
108.2 | % | 107.4 | % | 108.6 | % | 108.7 | % | 109.4 | % | 106.8 | % | ||||||||||||
| Gross Yield(4) |
$ | 230.87 | $ | 227.21 | $ | 222.26 | $ | 228.89 | $ | 219.53 | $ | 236.65 | ||||||||||||
| Net Yield(4) |
$ | 170.53 | $ | 167.83 | $ | 162.48 | $ | 168.28 | $ | 156.18 | $ | 170.04 | ||||||||||||
| (1) | In 2008, an impairment loss of $128.8 million was recorded as a result of the cancellation of a contract to build a ship (we refer you to our consolidated financial statements, Note 3 “Property and Equipment”). |
15
Table of Contents
| (2) | For the six months ended June 30, 2011, the income was due to gains on fuel derivatives partially offset by losses on foreign exchange. In 2010, a loss of $33.1 million was recorded primarily due to losses on foreign exchange contracts associated with the financing of Norwegian Epic. In 2009 and 2008, foreign currency translation and interest rate swap gains (losses) of $(9.6) million and $101.8 million, respectively, were recorded primarily due to fluctuations in the euro/U.S. dollar exchange rate. In 2009 and 2008, these amounts were offset by the change in fair value of our fuel derivative contracts of $20.4 million and $(99.9) million, respectively. |
| (3) | We use certain non-GAAP financial measures, such as Ship Contribution, Adjusted EBITDA, Gross Yield, Net Yield and Net Revenue to enable us to analyze our performance. We utilize these financial measures to manage our business on a day-to-day basis and believe that they are the most relevant measures of our performance and some of these measures are commonly used in the cruise industry to measure performance. Our use of non-GAAP financial measures may not be comparable to other companies within our industry. We refer you to “Terms Used in This Prospectus.” |
| (4) | The following table is a reconciliation of total revenue to Net Revenue, Gross Yield and Net Yield: |
| Twelve Months Ended June 30, |
Six Months Ended June 30, |
Year Ended December 31, | ||||||||||||||||||||||
| (in thousands, except Capacity Days and Yield data) |
2011 | 2011 | 2010 | 2010 | 2009 | 2008 | ||||||||||||||||||
| Passenger ticket revenue |
$ | 1,510,134 | $ | 725,343 | $ | 607,715 | $ | 1,392,506 | $ | 1,275,844 | $ | 1,501,646 | ||||||||||||
| Onboard and other revenue |
671,673 | 338,753 | 286,702 | 619,622 | 579,360 | 604,755 | ||||||||||||||||||
|
|
|
|
|
|
|
|
|
|
|
|
|
|||||||||||||
| Total revenue |
2,181,807 | 1,064,096 | 894,417 | 2,012,128 | 1,855,204 | 2,106,401 | ||||||||||||||||||
| Less: |
||||||||||||||||||||||||
| Commissions, transportation and other expense |
404,143 | 194,990 | 170,502 | 379,655 | 377,036 | 410,061 | ||||||||||||||||||
| Onboard and other expense |
166,144 | 83,087 | 70,080 | 153,137 | 158,330 | 182,817 | ||||||||||||||||||
|
|
|
|
|
|
|
|
|
|
|
|
|
|||||||||||||
| Net Revenue(3) |
$ | 1,611,520 | $ | 786,019 | $ | 653,835 | $ | 1,479,336 | $ | 1,319,838 | $ | 1,513,523 | ||||||||||||
|
|
|
|
|
|
|
|
|
|
|
|
|
|||||||||||||
| Capacity Days |
9,450,180 | 4,683,408 | 4,024,208 | 8,790,980 | 8,450,980 | 8,900,816 | ||||||||||||||||||
| Gross Yield(3) |
$ | 230.87 | $ | 227.21 | $ | 222.26 | $ | 228.89 | $ | 219.53 | $ | 236.65 | ||||||||||||
| Net Yield(3) |
$ | 170.53 | $ | 167.83 | $ | 162.48 | $ | 168.28 | $ | 156.18 | $ | 170.04 | ||||||||||||
| (5) | The following table is a reconciliation of total revenue to Ship Contribution: |
| Twelve Months Ended June 30, |
Six Months Ended June 30, |
Year Ended December 31, | ||||||||||||||||||||||
| (in thousands) |
2011 | 2011 | 2010 | 2010 | 2009 | 2008 | ||||||||||||||||||
| Total revenue |
$ | 2,181,807 | $ | 1,064,096 | $ | 894,417 | $ | 2,012,128 | $ | 1,855,204 | $ | 2,106,401 | ||||||||||||
| Less: |
||||||||||||||||||||||||
| Total cruise operating expense |
1,458,886 | 727,146 | 615,558 | 1,347,298 | 1,289,454 | 1,578,481 | ||||||||||||||||||
|
|
|
|
|
|
|
|
|
|
|
|
|
|||||||||||||
| Ship Contribution |
$ | 722,921 | $ | 336,950 | $ | 278,859 | $ | 664,830 | $ | 565,750 | $ | 527,920 | ||||||||||||
|
|
|
|
|
|
|
|
|
|
|
|
|
|||||||||||||
| (6) | We believe that Adjusted EBITDA is appropriate as a supplemental financial measure as it is used by management to assess operating performance, is a factor in the evaluation of the performance of management and is the primary metric used in determining the Company’s performance incentive bonus paid to its employees. We believe that Adjusted EBITDA is a useful measure in determining the Company’s performance as it reflects certain operating drivers of the Company’s business, such as sales growth, operating costs, selling, general and administrative expenses and other operating income and expense. You are encouraged to evaluate each adjustment and the reasons we consider them appropriate for supplemental analysis. In evaluating Adjusted EBITDA, you should be aware that in the future we may incur expenses similar to the adjustments in this presentation. Our use of Adjusted EBITDA has limitations as an analytical tool, and you should not consider this measure in isolation or as a substitute for analysis of our results as reported under GAAP. Our presentation of Adjusted EBITDA should not be construed as an inference that our future results will be unaffected by unusual or non-recurring items. |
Adjusted EBITDA is not a defined term under GAAP. Adjusted EBITDA is not intended to be a measure of liquidity or cash flows from operations or measures comparable to net income as it does not take into account certain requirements such as capital expenditures and related depreciation, principal and interest payments and tax payments and it includes other supplemental adjustments. Our use of Adjusted EBITDA may not be comparable to other companies.
16
Table of Contents
The following table is a reconciliation of net income (loss) to Adjusted EBITDA:
| Twelve Months Ended June 30, |
Six Months Ended June 30, |
Year Ended December 31, | ||||||||||||||||||||||
| (in thousands) | 2011 | 2011 | 2010 | 2010 | 2009 | 2008 | ||||||||||||||||||
| Net income (loss) |
$ | 72,240 | $ | 18,551 | $ | (31,072 | ) | $ | 22,617 | $ | 67,233 | $ | (211,803 | ) | ||||||||||
| Interest, net |
195,402 | 94,551 | 72,821 | 173,672 | 114,514 | 149,568 | ||||||||||||||||||
| Depreciation and amortization |
186,205 | 92,767 | 76,753 | 170,191 | 152,700 | 162,565 | ||||||||||||||||||
| Impairment loss |
— | — | — | — | — | 128,775 | ||||||||||||||||||
| Other (income) expense(a) |
(2,508 | ) | (2,088 | ) | 34,372 | 33,952 | (10,373 | ) | (1,012 | ) | ||||||||||||||
| Legal fees and settlements(b) |
— | — | — | — | 1,500 | 12,723 | ||||||||||||||||||
| Severance costs(c) |
— | — | — | — | — | 10,840 | ||||||||||||||||||
| NCLA shutdown costs(d) |
— | — | — | — | — | 14,119 | ||||||||||||||||||
| Norwegian Sky start-up expenses(e) |
— | — | — | — | — | 8,504 | ||||||||||||||||||
| Consulting fees(f) |
— | — | — | — | — | 8,378 | ||||||||||||||||||
| Other(g) |
3,524 | 1,592 | 2,381 | 4,313 | 6,959 | 3,293 | ||||||||||||||||||
|
|
|
|
|
|
|
|
|
|
|
|
|
|||||||||||||
| Adjusted EBITDA |
$ | 454,863 | $ | 205,373 | $ | 155,255 | $ | 404,745 | $ | 332,533 | $ | 285,950 | ||||||||||||
|
|
|
|
|
|
|
|
|
|
|
|
|
|||||||||||||
| (a) | Includes taxes, (gains)/losses on foreign currency, debt translation and derivatives and other (income) expense. |
| (b) | Includes a claim related to the S.S. Norway incident in 2003 and legal fees for credit facility amendments and the cancellation of a newbuild ship order. |
| (c) | Costs related to a severance agreement with our former Chief Executive Officer. |
| (d) | Costs in connection with the Hawaii restructuring, which were reimbursed by Genting HK pursuant to the RDA, (we refer you to “Certain Relationships and Related Party Transactions—The Reimbursement and Distribution Agreement”). |
| (e) | Costs incurred from the reflagging of Pride of Aloha from the U.S.-flagged fleet to the international fleet as Norwegian Sky. |
| (f) | Fees associated with the acquisition of our ordinary shares by the Apollo Funds. |
| (g) | Includes non-cash compensation and costs related to our Shipboard Retirement Plan in 2011 and 2010. Includes insurance claim recoveries and supplemental P&I insurance call, non-cash costs related to our Shipboard Retirement Plan and, beginning in 2009, management equity grants. Also includes costs related to a mechanical failure on one of our ships in 2009. |
17
Table of Contents
An investment in our ordinary shares involves a high degree of risk. In addition to the other information contained in this prospectus, you should carefully consider the following risk factors in evaluating us and our business before purchasing our ordinary shares. If any of the risks discussed in this prospectus actually occur, our business, financial condition and results of operations could be materially adversely affected. If this were to occur, the value of our ordinary shares could decline and you may lose all or part of your original investment. In connection with the forward-looking cautionary statements that appear in this prospectus, you should also carefully review the cautionary statement referred to under “Cautionary Statement Concerning Forward-Looking Statements.”
Risk factors related to our business
The specific risk factors set forth below, as well as the other information contained in this prospectus, could cause our actual results to differ from our expected or historical results and individually or any combination thereof could adversely affect our financial position and results of operations.
The adverse impact of the worldwide economic downturn and related factors such as high levels of unemployment and underemployment, fuel price increases, declines in the securities and real estate markets, and perceptions of these conditions that decrease the level of disposable income of consumers or consumer confidence.
The demand for cruises is affected by international, national and local economic conditions. Adverse changes in the perceived or actual economic climate, such as higher fuel prices, higher interest rates, stock and real estate market declines and/or volatility, more restrictive credit markets, higher taxes, and changes in governmental policies could reduce the level of discretionary income or consumer confidence in the countries from which we source our guests. For example, the worldwide economic downturn has had an adverse effect on consumer confidence and discretionary income resulting in decreased demand and price discounting. We cannot predict the duration or magnitude of this downturn or the timing or strength of economic recovery. If the downturn continues for an extended period of time or worsens, we could experience a prolonged period of decreased demand and price discounting. In addition, the economic downturn has and may continue to adversely impact our suppliers, which can result in disruptions in service and financial losses.
An increase in cruise capacity.
Historically, cruise capacity has grown to meet the growth in demand. According to CLIA, North American cruise capacity, in terms of Berths, has increased from 2000 through 2010 at a compound annual growth rate of 6.7%. CLIA estimates that between 2011 and 2014, the North America based CLIA member line fleet will increase by approximately 14 ships, representing a compound annual capacity growth of 3.1%. In order to profitably utilize this new capacity, the cruise industry will likely need to improve its percentage share of the U.S. population who has cruised at least once, which is approximately 24%, according to CLIA. If there is an industry-wide increase in capacity without a corresponding increase in public demand, we, as well as the entire cruise industry, could experience reduced occupancy rates and/or be forced to discount our prices. In addition, increased cruise capacity could impact our ability to retain and attract qualified shipboard employees, including officers, at competitive levels and, therefore, increase our shipboard employee costs.
We face intense competition from other cruise companies as well as non-cruise vacation alternatives and we may not be able to compete effectively.
We face intense competition from other cruise companies, primarily with the other Major North American Cruise Brands, which together comprise approximately 90% of the North American cruise market as measured by total Berths. These brands include Carnival Cruise Lines and Royal Caribbean International which comprise the contemporary segment and Holland America, Princess Cruises and Celebrity Cruises which are part of the premium segment. As of December 31, 2010, Norwegian Cruise Line accounted for approximately 12% of the
18
Table of Contents
Major North American Cruise Brands’ capacity in terms of Berths. We compete against all of these operators principally on the quality of our ships, our differentiated product offering, selection of our itineraries and value proposition of our cruises. We also face competition for many itineraries from other cruise operators as well as competition from non-cruise vacation alternatives. In the event we do not compete effectively, our business could be adversely affected.
Our substantial indebtedness could adversely affect our ability to raise additional capital to fund our operations, limit our ability to react to changes in the economy or our industry and prevent us from making debt service payments.
We are highly leveraged with a high level of variable rate debt, and our level of indebtedness could limit cash flow available for our operations and could adversely affect our financial condition, operations, prospects and flexibility. As of June 30, 2011, we had approximately $3.1 billion of total debt. See “Capitalization.”
Our substantial indebtedness could:
| • | limit our ability to borrow money for our working capital, capital expenditures, development projects, debt service requirements, strategic initiatives or other purposes; |
| • | make it more difficult for us to satisfy our obligations with respect to our indebtedness, and any failure to comply with the obligations of any of our debt instruments, including restrictive covenants and borrowing conditions, could result in an event of default under the agreements governing our indebtedness; |
| • | require us to dedicate a substantial portion of our cash flow from operations to the repayment of our indebtedness thereby reducing funds available to us for other purposes; |
| • | limit our flexibility in planning for, or reacting to, changes in our operations or business; |
| • | make us more highly leveraged than some of our competitors, which may place us at a competitive disadvantage; |
| • | make us more vulnerable to downturns in our business or the economy; |
| • | restrict us from making strategic acquisitions, introducing new technologies or exploiting business opportunities; |
| • | restrict us from taking certain actions by means of restrictive covenants; |
| • | make our credit card processors seek more restrictive terms in respect of our credit card arrangements; and |
| • | expose us to the risk of increased interest rates as certain of our borrowings are at a variable rate of interest. |
Based on our June 30, 2011 outstanding variable rate debt balance, a one percentage point increase in annual LIBOR interest rates would increase our annual interest expense by approximately $20 million, excluding the effects of capitalization of interest. In addition, future financings we may undertake may also provide for rates that fluctuate with prevailing interest rates.
Increases in fuel prices or other cruise operating costs.
Fuel costs accounted for 15.4% of our total cruise operating expense in 2010, 12.6% in 2009 and 16.4% in 2008. Future increases in the cost of fuel globally would increase the cost of our cruise ship operations. In addition, we could experience increases in other cruise operating costs, due to market forces and economic or political instability beyond our control.
19
Table of Contents
Conducting business internationally may result in increased costs and risks.
We operate our business internationally and plan to continue to develop our international presence. Operating internationally exposes us to a number of risks, including political risks, risks of increase in duties and taxes, risks relating to anti-bribery laws, as well as changes in laws and policies affecting cruising, vacation or maritime businesses, or governing the operations of foreign-based companies. Because some of our expenses are incurred in foreign currencies, we are exposed to exchange rate risks. Additional risks include interest rate movements, imposition of trade barriers and restrictions on repatriation of earnings.
The agreements governing our indebtedness contain restrictions that limit our flexibility in operating our business.
The agreements governing our indebtedness contain, and any instruments governing future indebtedness of ours would likely contain, a number of covenants that impose significant operating and financial restrictions on us, including restrictions on our and our subsidiaries’ ability to, among other things:
| • | incur additional debt or issue certain preference shares; |
| • | pay dividends on or make distributions in respect of our share capital or make other restricted payments; |
| • | make certain investments; |
| • | sell certain assets; |
| • | create liens on certain assets; |
| • | consolidate, merge, sell or otherwise dispose of all or substantially all of our assets; |
| • | enter into certain transactions with our affiliates; and |
| • | designate our subsidiaries as unrestricted subsidiaries. |
As a result of these covenants, we are limited in the manner in which we conduct our business, and we may be unable to engage in favorable business activities or finance future operations or capital needs.
We have pledged a significant portion of our assets as collateral under our existing debt agreements. If any of the holders of our indebtedness accelerate the repayment of such indebtedness, there can be no assurance that we will have sufficient assets to repay our indebtedness.
Under our existing debt agreements we are required to satisfy and maintain specified financial ratios. Our ability to meet those financial ratios can be affected by events beyond our control, and there can be no assurance that we will meet those ratios. A failure to comply with the covenants contained in our existing debt agreements could result in an event of default under the agreements, which, if not cured or waived, could have a material adverse affect on our business, financial condition and results of operations. In the event of any default under our existing debt agreements, the holders of our indebtedness thereunder:
| • | will not be required to lend any additional amounts to us, if applicable; |
| • | could elect to declare all indebtedness outstanding, together with accrued and unpaid interest and fees, to be due and payable and terminate all commitments to extend further credit, if applicable; or |
| • | could require us to apply all of our available cash to repay such indebtedness. |
Such actions by the holders of our indebtedness could cause cross defaults under our other indebtedness. If we were unable to repay those amounts, the holders of our indebtedness under our existing senior secured credit facilities could proceed against the collateral granted to them to secure that indebtedness.
20
Table of Contents
If the indebtedness under our existing debt agreements were to be accelerated, there can be no assurance that our assets would be sufficient to repay such indebtedness in full.
Despite our substantial indebtedness, we may still be able to incur significantly more debt. This could intensify the risks described above.
We and our subsidiaries may be able to incur substantial indebtedness at any time from time to time in the future. Although the terms of the agreements governing our indebtedness contain restrictions on our ability to incur additional indebtedness, these restrictions are subject to a number of important qualifications and exceptions, and the indebtedness incurred in compliance with these restrictions could be substantial.
We may not be able to generate sufficient cash to service all of our indebtedness, and may be forced to take other actions to satisfy our obligations under our indebtedness that may not be successful.
Our ability to satisfy our debt obligations will depend upon, among other things:
| • | our future financial and operating performance, which will be affected by prevailing economic conditions and financial, business, regulatory and other factors, many of which are beyond our control; and |
| • | our future ability to borrow under certain of our existing senior secured credit facilities, the availability of which depends on, among other things, our complying with the covenants in such existing senior secured credit facilities. |
We cannot assure you that our business will generate sufficient cash flow from operations, or that we will be able to draw under certain of our existing senior secured credit facilities or otherwise, in an amount sufficient to fund our liquidity needs.
If our cash flows and capital resources are insufficient to service our indebtedness, we may be forced to reduce or delay capital expenditures, sell assets, seek additional capital or restructure or refinance our indebtedness. These alternative measures may not be successful and may not permit us to meet our scheduled debt service obligations. Our ability to restructure or refinance our debt will depend on the condition of the capital markets and our financial condition at such time. Any refinancing of our debt could be at higher interest rates and may require us to comply with more onerous covenants, which could further restrict our business operations. In addition, the terms of existing or future debt agreements may restrict us from adopting some of these alternatives. In the absence of such operating results and resources, we could face substantial liquidity problems and might be required to dispose of material assets or operations to meet our debt service and other obligations. We may not be able to consummate those dispositions for fair market value or at all. Furthermore, any proceeds that we could realize from any such dispositions may not be adequate to meet our debt service obligations then due. Neither our shareholders nor any of their respective affiliates has any continuing obligation to provide us with debt or equity financing.
The impact of volatility and disruptions in the global credit and financial markets may adversely affect our ability to borrow and could increase our counterparty credit risks, including those under our credit facilities, derivative instruments, contingent obligations, insurance contracts and new ship progress payment guarantees.
There can be no assurance that we will be able to borrow additional money on terms as favorable as our current debt, on commercially acceptable terms, or at all. As a result of the global credit crisis, certain financial institutions have filed for bankruptcy, have sold some or all of their assets, or may be looking to enter into a merger or other transaction with another financial institution. Consequently, some of the counterparties under our credit facilities, derivatives, contingent obligations, insurance contracts and new ship progress payment guarantees may be unable to perform their obligations or may breach their obligations to us under our contracts with them, which could include failures of financial institutions to fund required borrowings under our loan
21
Table of Contents
agreements and to pay us amounts that may become due under our derivative contracts and other agreements. Also, we may be limited in obtaining funds to pay amounts due to our counterparties under our derivative contracts and to pay amounts that may become due under other agreements. If we were to elect to replace any counterparty for their failure to perform their obligations under such instruments, we would likely incur significant costs to replace the counterparty. Any failure to replace any counterparties under these circumstances may result in additional costs to us or an ineffective instrument.
Terrorist acts, acts of piracy, armed conflict and threats thereof, and other international events impacting the security of travel could adversely affect the demand for cruises.
Past acts of terrorism have had an adverse effect on tourism, travel and the availability of air service and other forms of transportation. The threat or possibility of future terrorist acts, an outbreak of hostilities or armed conflict abroad or the possibility thereof, the issuance of travel advisories by national governments, and other geo-political uncertainties have had in the past and may again in the future have an adverse impact on the demand for cruises and consequently the pricing for cruises. Decreases in demand and reduced pricing in response to such decreased demand would adversely affect our business by reducing our profitability.
We rely on external distribution channels for passenger bookings, and major changes in the availability of external distribution channels could undermine our customer base.
In 2010, the majority of our passengers on our fleet booked their cruises through independent travel agents. In the event that the travel agent distribution channel is adversely impacted by the worldwide economic downturn, or other reason, this could reduce the distribution channels available for us to market and sell our cruises and we could be forced to increase the use of alternative distribution channels.
We rely on scheduled commercial airline services for passenger connections, and increases in the price of, or major changes or reduction in, commercial airline services could undermine our customer base.
A number of our passengers depend on scheduled commercial airline services to transport them to ports of embarkation for our cruises. Increases in the price of airfare, due to increases in fuel prices or other factors, would increase the overall vacation cost to our customers and may adversely affect demand for our cruises. Changes in commercial airline services as a result of strikes, weather or other events, or the lack of availability due to schedule changes or a high level of airline bookings could adversely affect our ability to deliver passengers to our cruises and/or increase our cruise operating expense.
Any delays in the construction and delivery of a cruise ship, including any termination or breach of contract or any repairs and refurbishments of one of our ships.
Delays in the construction, repair, refurbishment and delivery of a cruise ship can occur as a result of events such as insolvency, work stoppages, other labor actions or “force majeure” events experienced by our shipbuilders and other such companies that are beyond our control. Any termination or breach of contract following such an event may result in, among other things, the forfeiture of prior deposits or payments made by us, potential claims and impairment of losses. A significant delay in the delivery of a new ship, or a significant performance deficiency or mechanical failure of a new ship, particularly in light of decreasing availability of Dry-dock facilities, could have an adverse effect on our business.
Future epidemics and viral outbreaks.
Public perception about the safety of travel and adverse publicity related to passenger or crew illness, such as incidents of H1N1, stomach flu, or other contagious diseases, may impact demand for cruises. If any wide-ranging health scare should occur, our business would likely be adversely affected.
22
Table of Contents
The political environment in certain countries where we operate is uncertain and our ability to operate our business as we have in the past may be restricted.
We operate in waters and call at ports throughout the world, including geographic regions that, from time to time, have experienced political and civil unrest as well as insurrection and armed hostilities. Adverse international events could affect demand for cruise products generally and could have an adverse effect on us.
Adverse incidents involving cruise ships.
The operation of cruise ships carries an inherent risk of loss caused by adverse weather conditions, maritime disaster, including, but not limited to, oil spills and other environmental mishaps, fire, mechanical failure, collisions, human error, war, terrorism, piracy, political action, civil unrest and insurrection in various countries and other circumstances or events. Any such event may result in loss of life or property, loss of revenue or increased costs. The operation of cruise ships also involves the risk of other incidents at sea or while in port, including missing passengers, inappropriate crew or passenger behavior and onboard crimes, that may bring into question passenger safety, may adversely affect future industry performance and may lead to litigation against us. Although we place passenger safety as the highest priority in the design and operation of our fleet, we have experienced accidents and other incidents involving our cruise ships and there can be no assurance that similar events will not occur in the future. It is possible that we could be forced to cancel a cruise or a series of cruises due to these factors or incur increased port related and other costs resulting from such adverse events. Any such event involving our cruise ships or other passenger cruise ships may adversely affect passengers’ perceptions of safety or result in increased governmental or other regulatory oversight. An adverse judgment or settlement in respect of any of the ongoing claims against us may also lead to negative publicity about us. Anything that damages our reputation (whether or not justified), including adverse publicity about passenger safety, could have an adverse impact on demand, which could lead to price discounting and a reduction in our sales.
There can be no assurance that all risks are fully insured against or that any particular claim will be fully paid. Such losses, to the extent they are not adequately covered by contractual remedies or insurance, could affect our financial results. In addition, we have been and continue to be subject to calls, or premiums, in amounts based not only on our own claim records, but also the claim records of all other members of the protection and indemnity associations through which we receive indemnity coverage for tort liability. Our payment of these calls could result in significant expenses to us which could reduce our cash flows. If we were to sustain significant losses in the future, our ability to obtain insurance coverage or coverage at commercially reasonable rates could be materially adversely affected.
Amendments to the collective bargaining agreements for crew members of our fleet.
Currently, we are a party to six collective bargaining agreements. Three of these agreements were recently renegotiated and are in effect through 2014. The three remaining collective bargaining agreements are scheduled to expire in 2018. Any amendments to such collective bargaining agreements in favor of the union members may increase labor costs.
Unavailability of ports of call.
We believe that attractive port destinations are a major reason why passengers choose to go on a particular cruise or on a cruise vacation. The availability of ports is affected by a number of factors, including, but not limited to, existing capacity constraints, security concerns, adverse weather conditions and natural disasters, financial limitations on port development, local governmental regulations and local community concerns about port development and other adverse impacts on their communities from additional tourists. Any limitations on the availability of our ports of call could adversely affect our business.
23
Table of Contents
The loss of key personnel or our inability to recruit or retain qualified personnel.
We rely upon the ability, expertise, judgment, discretion, integrity and good faith of our senior management team. Our success is dependent upon our personnel and our ability to recruit and retain high quality employees. We must continue to recruit, retain and motivate management and other employees sufficient to maintain our current business and support our projected growth. The loss of services of any of the key members of our management team could have a material adverse effect on our business. See “Management” for additional information about our management personnel.
The leadership of our President and Chief Executive Officer, Mr. Sheehan, and other executive officers has been a critical element of our success. The death or disability of Mr. Sheehan or other extended or permanent loss of his services, or any negative market or industry perception with respect to him or arising from his loss, could have a material adverse effect on our business. Our other executive officers and other members of senior management have substantial experience and expertise in our business and have made significant contributions to our growth and success. The unexpected loss of services of one or more of these individuals could also adversely affect us. We are not protected by key man or similar life insurance covering members of our senior management. We have employment agreements with our executive officers, but these agreements do not guarantee that any given executive will remain with us.
We are, and after this offering will continue to be, controlled by a group of shareholders that hold a significant percentage of our ordinary shares and whose interests may not be aligned with ours or our public shareholders.
Prior to this offering, all of our voting ordinary shares were held by affiliates of Genting HK, the Apollo Funds and the TPG Viking Funds. The Shareholders’ Agreement governing the relationship among those parties gives the Apollo Funds effective control over our affairs and policies, subject to certain limitations. Genting HK and the Apollo Funds also control the election of our Board of Directors, the appointment of management, the entering into of mergers, sales of substantially all of our assets and other material transactions. Immediately after giving effect to this offering, we expect that these shareholders will continue to control a majority of our ordinary shares, specifically, we expect that Genting HK, the Apollo Funds and the TPG Viking Funds will together own approximately % of our outstanding ordinary shares (without giving effect to the exercise of the underwriters’ option to purchase additional shares). The directors appointed by Genting HK and the Apollo Funds will have the authority, on our behalf and subject to the terms of our debt agreements and the Shareholders’ Agreement, to issue additional ordinary shares, implement share repurchase programs, declare dividends, pay advisory fees and make other decisions, and they may have an interest in our doing so.
The interests of Genting HK, the Apollo Funds and the TPG Viking Funds could conflict with our public shareholders’ interests in material respects. Furthermore, Genting HK engages in the cruise line industry and leisure, entertainment and hospitality activities and Apollo and TPG Capital are in the business of making investments in companies and one or more of them has now and may from time to time acquire and hold interests in businesses that compete directly or indirectly with us, as well as businesses that represent major customers of our business. Genting HK, Apollo and/or TPG Capital may also pursue acquisition opportunities that may be complementary to our business, and as a result, those acquisition opportunities may not be available to us. So long as our current shareholders continue to control a significant amount of our outstanding voting ordinary shares, such shareholders will continue to be able to strongly influence or effectively control our decisions. Additionally, the concentration of ownership held by our current shareholders could delay, defer or prevent a change of control of us or impede a merger, takeover or other business combination that you as a shareholder may otherwise view favorably. Certain provisions of our Shareholders’ Agreement may also make it more difficult to reissue additional equity capital in the future, if needed. See “Certain Relationships and Related Party Transactions—The Shareholders’ Agreement.”
24
Table of Contents
Risks related to the regulatory environment in which we operate
Future changes in applicable tax laws, or our inability to take advantage of favorable tax regimes.
We believe and have taken the position that our income that is considered to be shipping income (as defined in “Business—Taxation of the Company—Taxation of Operating Income: In General”) is exempt from U.S. federal income taxes under Section 883 of the Code, based upon certain assumptions as to shareholdings and other information as more fully described in “Business—Taxation of the Company—Exemption of Operating Income from U.S. Federal Income Taxation.” The provisions of Section 883 of the Code are subject to change at any time possibly with retroactive effect.
We believe and have taken the position that substantially all of our income currently derived from the international operation of ships is properly categorized as shipping income and that we currently do not have a material amount of non-qualifying income. It is possible, however, that a much larger percentage of our income does not qualify (or will not qualify) as shipping income. Moreover, the exemption for shipping income is only available for years in which we will satisfy complex stock ownership tests under Section 883 of the Code as described in “Business—Taxation of the Company—Exemption of Operating Income from U.S. Federal Income Taxation.” There are factual circumstances beyond our control, including changes in the direct and indirect owners of our shares, that could cause us or our subsidiaries to lose the benefit of this tax exemption. Finally, any changes in our operations could significantly increase our exposure to either the net tax regime or the 4% regime (each as defined in Business—Taxation of the Company—Taxation of Operating Income: In General), and we can give no assurances on this matter.
If we or any of our subsidiaries were not to qualify for the exemption under Section 883 of the Code, our or such subsidiary’s U.S. source income would be subject either to the net tax regime or the 4% regime (each as defined in “Business—Taxation of the Company—Taxation of Operating Income: In General”). We believe that we and our subsidiaries will satisfy the stock ownership tests imposed under Section 883 and therefore believe that we will qualify for the exemption under Section 883. However, as discussed above there are factual circumstances beyond our control that could cause us to not meet the stock ownership tests. Therefore, we can give no assurances on this matter. See “Business—Taxation of the Company—Exemption of Operating Income from U.S. Federal Income Taxation.”
We may be subject to state, local and non-U.S. income or non-income taxes in various jurisdictions, including those in which we transact business, own property or reside. We may be required to file tax returns in some or all of those jurisdictions. Our state, local or non-U.S. tax treatment may not conform to the U.S. federal income tax treatment discussed above. We may be required to pay non-U.S. taxes on dispositions of foreign property or operations involving foreign property may give rise to non-U.S. income or other tax liabilities in amounts that could be substantial.
The various tax regimes to which we are currently subject result in a relatively low effective tax rate on our world-wide income. These tax regimes, however, are subject to change, possibly with retroactive effect. Moreover, we may become subject to new tax regimes and may be unable to take advantage of favorable tax provisions afforded by current or future law.
We are subject to complex laws and regulations, including environmental laws and regulations, which could adversely affect our operations and any changes in the current laws and regulations could lead to increased costs or decreased revenue.
Some environmental groups have lobbied for more extensive oversight of cruise ships and have generated negative publicity about the cruise industry and its environmental impact. Increasingly stringent federal, state, local and international laws and regulations on environmental protection and health and safety of workers could affect our operations. The U.S. Environmental Protection Agency, the IMO, the Council of the European Union and individual states are considering, as well as implementing, new laws and rules to manage cruise ship waste. In addition, many aspects of the cruise industry are subject to governmental regulation by the U.S. Coast Guard
25
Table of Contents
as well as international treaties such as the SOLAS, MARPOL, the Standard of Training Certification and Watchkeeping for Seafarers (“STCW”) and its recently adopted conventions in ship manning. International regulations regarding ballast water and security levels are currently pending. Additionally, the U.S. and various state and foreign government or regulatory agencies have enacted or are considering new environmental regulations or policies, such as requiring the use of low sulfur fuels, increasing fuel efficiency requirements or further restricting emissions. Compliance with such laws and regulations may entail significant expenses for ship modification and changes in operating procedures which could adversely impact our operations as well as our competitors’ operations. In addition, the state of Alaska approved stringent regulations in 2008 concerning waste water discharge. In 2010, Alaska issued a final permit that regulates discharges of treated wastewater from cruise ships for the summer tourist seasons running from 2010 to 2012. The permit provides for the cruise companies to gather data on performance of new shipboard environmental control systems that will allow a scientific review committee to advise state officials on improving the regulations. The Maritime Labor Convention 2006 will become international law when the prerequisite number of countries ratify. It will regulate many aspects of maritime crew labor and will impact the worldwide sourcing of new crewmembers.
These issues are, and we believe will continue to be, an area of focus by the relevant authorities throughout the world. This could result in the enactment of more stringent regulation of cruise ships that would subject us to increasing compliance costs in the future.
By virtue of our operations in the U.S., the U.S. Federal Maritime Commission (“FMC”) requires us to maintain a third-party performance guarantee on our behalf in respect of liabilities for non-performance of transportation and other obligations to passengers. The FMC has proposed rules that would significantly increase the amount of our required guarantees and accordingly our cost of compliance. There can be no assurance that such an increase in the amount of our guarantees, if required, would be available to us. For additional discussion of the FMC’s proposed requirements, we refer you to “Business—Regulatory Issues.”
In 2007, the state of Alaska implemented taxes which have impacted the cruise industry operating in Alaska. It is possible that other states, countries or ports of call that our ships regularly visit may also decide to assess new taxes or fees or change existing taxes or fees specifically applicable to the cruise industry and its employees and/or guests, which could increase our operating costs and/or could decrease the demand for cruises.
The Passenger Shipping Association (“PSA”) has issued a legal requirement for us to maintain a security guarantee based on cruise business originated from the United Kingdom.
Changes in health, safety, security and other regulatory issues.
We are subject to various international, national, state and local health, safety and security laws and regulations. For additional discussion of these requirements, we refer you to “Business—Regulatory Issues.” Changes in existing legislation or regulations and the imposition of new requirements could adversely affect our business.
Implementation of U.S. federal regulations, requiring U.S. citizens to obtain passports for seaborne travel to all foreign destinations, could adversely affect our business. Many cruise customers may not currently have passports or may not obtain a passport card (previously known as the People Access Security Service Card, or PASS Card) as an alternative to a passport. This card was created to meet the documentary requirements of the Western Hemisphere Travel Initiative. Applications for the card have been accepted since February 1, 2008 and the cards were made available to the public beginning in July 2008. As of June 1, 2009, all U.S. citizens returning to the U.S. via land or sea borders must provide a PASS Card or U.S. Passport.
26
Table of Contents
Risk factors related to the offering and to our ordinary shares
There has been no prior market for our ordinary shares, and an active trading market for our ordinary shares may not develop, which could impede your ability to sell your ordinary shares and depress the market price of your ordinary shares.
Prior to this offering, there has been no public market for our ordinary shares, and we cannot assure you that an active and liquid public market for our ordinary shares will develop or be sustained after this offering or that investors will be able to sell the ordinary shares should they desire to do so. The failure of an active trading market to develop could affect your ability to sell your ordinary shares and depress the market price of your ordinary shares. We will negotiate with the representatives of the underwriters to determine the initial public offering price, which will be based on numerous factors and may bear no relationship to the price at which the ordinary shares will trade upon completion of this offering. See “Underwriting.” The market price of the ordinary shares may fall below the initial public offering price.
The price of our shares may fluctuate substantially, and your investment may decline in value.
The trading price of our ordinary shares could be volatile and subject to wide fluctuations in response to factors, many of which are beyond our control, including those described in this “Risk Factors” section.
Further, the stock markets in general, and the stock exchange and the market for travel and leisure-related companies in particular, have experienced extreme price and volume fluctuations that have often been unrelated or disproportionate to the operating performance of these companies. We cannot assure you that trading prices and valuations will be sustained. These broad market and industry factors may materially and adversely affect the market price of our ordinary shares, regardless of our operating performance. Market fluctuations, as well as general political and economic conditions in the countries where we operate, such as recession or currency exchange rate fluctuations, may also adversely affect the market price of our ordinary shares. In the past, following periods of volatility in the market price of a company’s securities, that company is often subject to securities class-action litigation. This kind of litigation, regardless of the outcome, could result in substantial costs and a diversion of management’s attention and resources, which could have a material adverse effect on our business, results of operations and financial condition.
We are a “controlled company” within the meaning of the rules of NASDAQ and, as a result, will qualify for, and intend to rely on, exemptions from certain corporate governance requirements.
Upon the closing of this offering, Genting HK, the Apollo Funds and the TPG Viking Funds will together continue to control a majority of our ordinary shares. As a result, we are a “controlled company” within the meaning of the corporate governance standards of NASDAQ. Under the rules of NASDAQ, a company of which more than 50% of the voting power is held by an individual, group or another company is a “controlled company” and may elect not to comply with certain corporate governance requirements, including:
| • | the requirement that a majority of our Board of Directors consists of independent directors; |
| • | the requirement that we have a nominating and governance committee that is composed entirely of independent directors with a written charter addressing the committee’s purpose and responsibilities; |
| • | the requirement that we have a compensation committee that is composed entirely of independent directors with a written charter addressing the committee’s purpose and responsibilities; and |
| • | the requirement for an annual performance evaluation of the nominating and governance committee and compensation committee. |
Following this offering, we intend to utilize these exemptions. As a result, we will not have a majority of independent directors nor will be required to have any independent directors on our nominating and governance committee and compensation committee, and we will not be required to have an annual performance evaluation
27
Table of Contents
of the nominating and governance committee and compensation committee. See “Management.” Accordingly, you will not have the same protections afforded to shareholders of companies that are subject to the general corporate governance requirements (without giving effect to the “controlled company” exemptions) of NASDAQ.
Because the price you will pay for our ordinary shares is above our net tangible book value per ordinary share, you will experience an immediate and substantial dilution upon the completion of this offering.
The initial public offering price of our ordinary shares is substantially higher than what the net tangible book value per ordinary share will be immediately after this offering. If you purchase our ordinary shares in this offering, you will experience immediate dilution of approximately $ in the net tangible book value per ordinary share from the price you pay for our ordinary shares, representing the difference between (1) the assumed initial public offering price of $ per ordinary share, which is the mid-point of the range shown on the cover of this prospectus, and (2) the pro forma net tangible book value per ordinary share of $ at December 31, 2010 after giving effect to this offering. For additional information on discussion of the effect of a change in the price of this offering see “Dilution.”
There are regulatory limitations on the ownership and transfer of our ordinary shares.
The Bermuda Monetary Authority (the “BMA”) must approve all issuances and transfers of securities of a Bermuda exempted company like us. However, for as long as our ordinary shares are listed on an appointed stock exchange, the BMA has given general permission that permits the issue and free transferability of our ordinary shares to and among persons who are residents and non-residents of Bermuda for exchange control purposes. Any other transfers remain subject to approval by the BMA and such approval may be denied or delayed.
Additionally, our bye-laws will contain provisions that prevent third parties, other than the Apollo Funds, the TPG Viking Funds and Genting HK, from acquiring beneficial ownership of more than 4.9% of its outstanding shares without the consent of our Board of Directors and provide for the lapse of rights, and sale, of any shares acquired in excess of that limit.
As a shareholder of our Company, you may have greater difficulties in protecting your interests than as a shareholder of a U.S. corporation.
We are a Bermuda exempted company. The Companies Act 1981 of Bermuda (the “Companies Act”), which applies to our Company, differs in material respects from laws generally applicable to U.S. corporations and their shareholders. Taken together with the provisions of our bye-laws, some of these differences may result in you having greater difficulties in protecting your interests as a shareholder of our Company than you would have as a shareholder of a U.S. corporation. This affects, among other things, the circumstances under which transactions involving an interested director are voidable, whether an interested director can be held accountable for any benefit realized in a transaction with our Company, what approvals are required for business combinations by our Company with a large shareholder or a wholly-owned subsidiary, what rights you may have as a shareholder to enforce specified provisions of the Companies Act or our bye-laws, and the circumstances under which we may indemnify our directors and officers.
The market price for our ordinary shares could be subject to wide fluctuations and you could lose all or part of your investment.
The market price for our ordinary shares could be volatile and subject to wide fluctuations in response to factors including the following:
| • | actual or anticipated fluctuations in our quarterly results; |
| • | the public’s reaction to our press releases, other public announcements and filings with the SEC; |
28
Table of Contents
| • | sales of large blocks of our ordinary shares, or the expectation that such sales may occur, including sales by our directors, officers and controlling shareholder; |
| • | market and industry perception of our success, or lack thereof, in pursuing our growth strategy; |
| • | announcements of new itineraries or services or the introduction of new ships by us or our competitors; |
| • | changes in financial estimates by securities analysts; |
| • | conditions in the cruise industry; |
| • | price and volume fluctuations in the stock markets generally; |
| • | announcements by our competitors of significant acquisitions, strategic partnerships, joint ventures or capital commitments; |
| • | our involvement in significant acquisitions, strategic alliances or joint ventures; |
| • | changes in government and environmental regulation; |
| • | changes in accounting standards, policies, guidance, interpretations or principles; |
| • | additions or departures of key personnel; |
| • | changes in general market, economic and political conditions in the U.S. and global economies or financial markets, including those resulting from natural disasters, terrorist attacks, acts of war and responses to such events; or |
| • | potential litigation. |
In addition, the securities markets have from time to time experienced significant price and volume fluctuations that are not related to the operating performance of particular companies. These market fluctuations may also materially and adversely affect the market price of our shares.
The substantial number of ordinary shares that will be eligible for sale in the near future may cause the market price of our ordinary shares to decline.
Immediately after the completion of this offering, we will have an aggregate of ordinary shares issued and outstanding (without giving effect to the exercise of the underwriters’ option to purchase additional shares). Our ordinary shares sold in this offering will be eligible for immediate resale in the public market without restrictions, and those held by our controlling shareholders and key employees may also be sold in the public market in the future subject to applicable lock-up agreements as well as the restrictions contained in Rule 144 under the Securities Act of 1933, as amended, or the Securities Act. If our controlling shareholders sell a substantial amount of our ordinary shares after the expiration of the lock-up period, the prevailing market price for our ordinary shares could be adversely affected. See “Shares Eligible for Future Sale” for a more detailed description of the eligibility of our ordinary shares for future sale.
We may issue our ordinary shares or other securities from time to time as consideration for future acquisitions and investments. If any such acquisition or investment is significant, the number of ordinary shares, or the number or aggregate principal amount, as the case may be, of other securities that we may issue may in turn be substantial. We may also grant registration rights covering those ordinary shares or other securities in connection with any such acquisitions and investments.
As soon as practicable after the completion of this offering, we intend to file a registration statement on Form S-8 under the Securities Act covering the ordinary shares reserved for issuance under our new long-term incentive plan. Accordingly, ordinary shares registered under such registration statement will be available for sale in the open market upon exercise by the holders, subject to vesting restrictions, Rule 144 limitations applicable to our affiliates and the contractual lock-up provisions in “Shares Eligible for Future Sale”.
29
Table of Contents
We may use the proceeds of this offering in ways with which you may not agree.
Although we currently intend to use the proceeds of this offering to redeem or prepay outstanding debt and to pay expenses associated with this offering, our management will have considerable discretion in the application of the net proceeds received by us. You will not have the opportunity, as part of your investment decision, to assess whether the proceeds are being used appropriately. You must rely on the judgment of our management regarding the application of the net proceeds of this offering. The net proceeds may be used for corporate purposes that do not improve our efforts to achieve profitability or increase the price of our ordinary shares.
We may not pay dividends on our ordinary shares at any time in the foreseeable future.
We do not currently intend to pay dividends to our shareholders and our Board of Directors may never declare a dividend. You should not anticipate receiving dividends with respect to ordinary shares that you purchase in the offering. Our debt agreements restrict, and any of our future debt arrangements may restrict, among other things, the ability of our subsidiaries to pay distributions to the Issuer and our ability to pay cash dividends to our shareholders. In addition, any determination to pay dividends in the future will be entirely at the discretion of our Board of Directors and will depend upon our results of operations, cash requirements, financial condition, business opportunities, contractual restrictions, restrictions imposed by applicable law and other factors that our Board of Directors deems relevant. We are not legally or contractually required to pay dividends. Accordingly, if you purchase ordinary shares in this offering, it is likely that in order to realize a gain on your investment, the price of our ordinary shares will have to appreciate. This may not occur. In addition, we are a holding company and would depend upon our subsidiaries for their ability to pay distributions to us to finance any dividend or pay any other obligations of the Issuer. Investors seeking dividends should not purchase our ordinary shares. See “Dividend Policy.”
Enforcement of civil liabilities against us by our shareholders and others may be difficult.
We are a company incorporated under the laws of Bermuda. In addition, certain of our subsidiaries are organized outside the U.S. Certain of our directors named herein are resident outside the U.S. A substantial portion of our assets and the assets of such individuals are located outside the U.S. As a result, it may not be possible for investors to effect service of process upon us or upon such persons within the U.S. or to enforce against us or them in U.S. courts judgments obtained in U.S. courts predicated upon the civil liability provisions of the U.S. federal securities laws. Furthermore, we have been advised by counsel in Bermuda that the Bermuda courts will not enforce a U.S. federal securities law that is either penal or contrary to the public policy of Bermuda. An action brought pursuant to a public or penal law, the purpose of which is the enforcement of a sanction, power or right at the instance of the state in its sovereign capacity, may not be entertained by a Bermuda court. Certain remedies available under the laws of U.S. jurisdictions, including certain remedies under U.S. federal securities laws, may not be available under Bermuda law or enforceable in a Bermuda court, as they may be contrary to Bermuda public policy. Further, no claim may be brought in Bermuda against us or our directors and officers in the first instance for violations of U.S. federal securities laws because these laws have no extraterritorial jurisdiction under Bermuda law and do not have force of law in Bermuda. A Bermuda court may, however, impose civil liability on us or our directors and officers if the facts alleged in a complaint constitute or give rise to a cause of action under Bermuda law. However, section 281 of the Companies Act allows a Bermuda court, in certain circumstances, to relieve officers and directors of Bermuda companies of liability for acts of negligence, breach of duty or trust or other defaults.
30
Table of Contents
Provisions in our constitutional documents may prevent or discourage takeovers and business combinations that our shareholders might consider to be in their best interests.
Following the consummation of this offering, our bye-laws will contain provisions that may delay, defer, prevent or render more difficult a takeover attempt that our shareholders consider to be in their best interests. As a result, these provisions may prevent our shareholders from receiving a premium to the market price of our shares offered by a bidder in a takeover context. Even in the absence of a takeover attempt, the existence of these provisions may adversely affect the prevailing market price of our shares if they are viewed as discouraging takeover attempts in the future. These provisions include (subject to the Shareholders’ Agreement):
| • | the ability of our Board of Directors to designate one or more series of preference shares and issue preference shares without shareholder approval; |
| • | a classified board of directors; |
| • | the sole power of a majority of our Board of Directors to fix the number of directors; |
| • | the power of our Board of Directors to fill any vacancy on our Board of Directors in most circumstances, including when such vacancy occurs as a result of an increase in the number of directors or otherwise; and |
| • | advance notice requirements for nominating directors or introducing other business to be conducted at shareholder meetings. |
Additionally, our bye-laws will contain provisions that prevent third parties, other than the Apollo Funds, the TPG Viking Funds and Genting HK, from acquiring beneficial ownership of more than 4.9% of its outstanding shares without the consent of our Board of Directors and provide for the lapse of rights, and sale, of any shares acquired in excess of that limit. The effect of these provisions as well as the significant ownership of ordinary shares by our existing shareholders, the Apollo Funds, the TPG Viking Funds and Genting HK, may preclude third parties from seeking to acquire a controlling interest in us in transactions that shareholders might consider to be in their best interests and may prevent them from receiving a premium above market price for their shares. See “Related Party Transactions—The Shareholders’ Agreement” and “Description of Share Capital.”
Any issuance of preference shares could make it difficult for another company to acquire us or could otherwise adversely affect holders of our ordinary shares, which could depress the price of our ordinary shares.
Our Board of Directors has the authority to issue preference shares and to determine the preferences, limitations and relative rights of shares of preference shares and to fix the number of shares constituting any series and the designation of such series, without any further vote or action by our shareholders, subject to the Shareholders’ Agreement. Our preference shares could be issued with voting, liquidation, dividend and other rights superior to the rights of our ordinary shares. The potential issuance of preference shares may delay or prevent a change in control of us, discouraging bids for our ordinary shares at a premium over the market price, and adversely affect the market price and the voting and other rights of the holders of our ordinary shares. See “Description of Share Capital.”
31
Table of Contents
CAUTIONARY STATEMENT CONCERNING FORWARD-LOOKING STATEMENTS
This prospectus contains forward-looking statements within the meaning of the U.S. federal securities laws. All statements other than statements of historical facts in this prospectus, including, without limitation, those regarding our business strategy, financial position, results of operations, plans, prospects and objectives of management for future operations (including development plans and objectives relating to our activities), are forward-looking statements. Many, but not all of these statements can be found by looking for words like “expect,” “anticipate,” “goal,” “project,” “plan,” “believe,” “seek,” “will,” “may,” “forecast,” “estimate,” “intend” and “future” and for similar words. Forward-looking statements do not guarantee future performance and may involve risks, uncertainties and other factors which could cause our actual results, performance or achievements to differ materially from the future results, performance or achievements expressed or implied in those forward-looking statements. Examples of these risks, uncertainties and other factors include, but are not limited to:
| • | the adverse impact of the worldwide economic downturn and related factors such as high levels of unemployment and underemployment, declines in the securities and real estate markets, and perceptions of these conditions that decrease the level of disposable income of consumers or consumer confidence; |
| • | changes in cruise capacity, as well as capacity changes in the overall vacation industry; |
| • | intense competition from other cruise companies as well as non-cruise vacation alternatives which may affect our ability to compete effectively; |
| • | our substantial leverage, including the inability to generate the necessary amount of cash to service our existing debt, repay our credit facilities if payment is accelerated and incur substantial indebtedness in the future; |
| • | changes in fuel prices or other cruise operating costs; |
| • | the risks associated with operating internationally; |
| • | the continued borrowing availability under our credit facilities and compliance with our financial covenants; |
| • | our ability to incur significantly more debt despite our substantial existing indebtedness; |
| • | the impact of volatility and disruptions in the global credit and financial markets which may adversely affect our ability to borrow and could increase our counterparty credit risks, including those under our credit facilities, derivatives, contingent obligations, insurance contracts and new ship progress payment guarantees; |
| • | adverse events impacting the security of travel that may affect consumer demand for cruises such as terrorist acts, acts of piracy, armed conflict and other international events; |
| • | the impact of any future changes relating to how travel agents sell and market our cruises; |
| • | the impact of any future increases in the price of, or major changes or reduction in, commercial airline services; |
| • | the impact of the spread of contagious diseases; |
| • | accidents and other incidents affecting the health, safety, security and vacation satisfaction of passengers or causing damage to ships, which could cause the modification of itineraries or cancellation of a cruise or series of cruises; |
| • | our ability to attract and retain key personnel, qualified shipboard crew, maintain good relations with employee unions and maintain or renegotiate our collective bargaining agreements on favorable terms; |
| • | the continued availability of attractive port destinations; |
32
Table of Contents
| • | the control of our Company by certain of our shareholders whose interests may not be aligned with ours; |
| • | the impact of problems encountered at shipyards, as well as, any potential claim, impairment loss, cancellation or breach of contract in connection with our contracts with shipyards; |
| • | changes involving the tax, environmental, health, safety, security and other regulatory regimes in which we operate; |
| • | our ability to obtain insurance coverage on terms that are favorable or consistent with our expectations; |
| • | the lack of acceptance of new itineraries, products or services by our targeted customers; |
| • | our ability to implement brand strategies and our shipbuilding programs, and to continue to expand our brands and business worldwide; |
| • | the costs of new initiatives and our ability to achieve expected cost savings from our new initiatives; |
| • | changes in interest rates and/or foreign currency rates; |
| • | increases in our future fuel expenses related to implementing proposed IMO regulations, which require the use of higher priced low sulfur fuels in certain cruising areas; |
| • | the delivery schedules and estimated costs of new ships on terms that are favorable or consistent with our expectations; |
| • | the impact of pending or threatened litigation and investigations; |
| • | the impact of changes in our credit ratings; |
| • | the possibility of environmental liabilities and other damage that is not covered by insurance or that exceeds our insurance coverage; |
| • | our ability to attain and maintain any price increases for our products; |
| • | the impact of delays, costs and other factors resulting from emergency ship repairs as well as scheduled maintenance, repairs and refurbishment of our ships; |
| • | the implementation of regulations in the U.S. requiring U.S. citizens to obtain passports for travel to additional foreign destinations; |
| • | the impact of weather and natural disasters; and |
| • | other factors set forth under “Risk Factors.” |
The above examples are not exhaustive and new risks emerge from time to time. Except as required by law, we undertake no obligation to publicly update or revise any forward-looking statements, whether as a result of new information, future events or otherwise. Such forward-looking statements are based on our current beliefs, assumptions, expectations, estimates and projections regarding our present and future business strategies and the environment in which we will operate in the future. These forward-looking statements speak only as of the date of this prospectus. We expressly disclaim any obligation or undertaking to release publicly any updates or revisions to any forward-looking statement contained herein to reflect any change in our expectations with regard thereto or any change of events, conditions or circumstances on which any such statement was based.
33
Table of Contents
We estimate that we will receive net proceeds from the sale of our ordinary shares in this offering, after deducting the underwriting discount and other estimated expenses, of approximately $ million, assuming the ordinary shares are offered at $ per ordinary share, which is the midpoint of the estimated offering price range set forth on the cover page of this prospectus. A $1.00 increase or decrease in the assumed offering price of $ per ordinary share would increase or decrease the net proceeds we receive from this offering by approximately $ million, assuming the number of ordinary shares offered by us, as set forth on the cover of this prospectus, remains the same and after deducting the underwriting discounts and other estimated expenses. If the underwriters exercise their option to purchase additional ordinary shares in full, the net proceeds to us will be approximately $ million.
We intend to use the net proceeds that we receive to (i) redeem up to $157.5 million in aggregate principal amount of our $450.0 million senior secured notes, (ii) redeem up to $87.5 million in aggregate principal amount of our $250.0 million senior notes, (iii) pay redemption premiums of up to $26.8 million for the senior secured notes and the senior notes, (iv) prepay a portion of the amount outstanding under our $750.0 million senior secured revolving credit facility and (v) pay expenses associated with this offering.
The foregoing represents our current intentions with respect to the use of the net proceeds of this offering based upon our present plans and business conditions and no specific allocation of the net proceeds has yet been determined. Our determination of whether to use all or a portion of the net proceeds to redeem a portion of our $450.0 million senior secured notes and/or our $250.0 million senior notes or to repay a portion of the amount outstanding under our $750.0 million senior secured revolving credit facility will depend on interest rates and the prices at which our $450.0 million senior secured notes and $250.0 million senior notes are being purchased and sold in the market (including relative to the redemption price for such notes) at or following the consummation of this offering.
Any net proceeds used to redeem the $450.0 million senior secured notes and/or $250.0 million senior notes, or to repay the $750.0 million senior secured revolving credit facility, would be first contributed by the Company to NCL Corporation Ltd. so that NCL Corporation Ltd. may effect such redemption or repayment. Affiliates of certain of the underwriters in this offering currently hold or may in the future hold a portion of the notes to be redeemed and, accordingly, may receive a portion of the net proceeds from this offering as a result of the redemption of the notes. Pending the application of the net proceeds of this offering as described above, all or a portion of the net proceeds of this offering may be invested by us in short-term interest-bearing investments.
As of June 30, 2011, there was (i) $450.0 million (which does not include the original issue discount of $4.4 million) aggregate principal amount outstanding of our $450.0 million senior secured notes, which bear interest at a rate of 11.75% per annum and mature on November 15, 2016 and (ii) $250.0 million aggregate principal amount outstanding of our $250.0 million senior notes, which bear interest at a rate of 9.50% per annum and mature on November 15, 2018. We issued our $250.0 million senior notes in November 2010. The net proceeds from the offering of our $250.0 million senior notes were used to repay $147.0 million of certain of our secured term loans, $94.7 million of our $750.0 million senior secured revolving credit facility and $0.2 million of our capital lease obligations.
As of June 30, 2011, we had $167.0 million of indebtedness outstanding under our $750.0 million senior secured revolving credit facility which bears interest at a rate of LIBOR plus 4.00% per annum. The weighted-average interest rate on such borrowings as of June 30, 2011 was 4.24%. The commitments under our $750.0 million senior secured revolving credit facility are reduced by $46.9 million on a semi-annual basis (which commenced on October 28, 2010), and all borrowings under the facility mature on October 28, 2015.
34
Table of Contents
The Issuer does not intend to pay any dividends after completion of this offering. We intend to retain all available funds and any future earnings to fund the continued development and growth of our business. Our debt agreements restrict, among other things, our ability to pay cash dividends to our shareholders. See “Description of Certain Indebtedness.” Our future dividend policy will also depend on the requirements of any future financing agreements to which we may be a party and other factors considered relevant by our Board of Directors. Any determination to pay dividends in the future will be at the discretion of our Board of Directors and will depend on, among other things, our results of operations, cash requirements, financial condition, business opportunities, contractual restrictions, restrictions imposed by applicable law and other factors that our Board of Directors deems relevant. For a discussion of our cash resources and needs, see “Management’s Discussion and Analysis of Financial Condition and Results of Operations—Liquidity and capital resources.”
35
Table of Contents
The following table sets forth our capitalization as of June 30, 2011:
| • | on an actual basis for NCL Corporation Ltd.; |
| • | for the Issuer, on an as adjusted basis to give effect to the Corporate Reorganization, the exchange of NCL Corporation Ltd.’s outstanding profits interests granted under the Profits Sharing Agreement for outstanding ordinary shares of the Issuer; and |
| • | for the Issuer, as further adjusted for the consummation of this offering and the application of the net proceeds thereof, after deducting underwriting discounts and commissions and estimated offering expenses, as described in “Use of Proceeds” included elsewhere in this prospectus but assuming the underwriters’ option to purchase additional shares has not been exercised. |
A $1.00 increase or decrease in the assumed initial public offering price of $ per ordinary share, which is the midpoint of the estimated price range set forth on the cover of this prospectus, would increase or decrease the net proceeds we receive from this offering by approximately $ million and the number of ordinary shares to be outstanding after this offering by approximately shares, assuming the number of ordinary shares offered by us, as set forth on the cover of this prospectus, remains the same and after deducting the underwriting discounts and other estimated expenses.
You should read this table in conjunction with our consolidated financial statements and the related notes which are included elsewhere in this prospectus as well as the sections entitled “Selected Consolidated Financial Data,” “Use of Proceeds” and “Management’s Discussion and Analysis of Financial Condition and Results of Operations.”
| As of June 30, 2011 | ||||||||||||
| Actual | Corporate Reorganization As Adjusted |
As Adjusted |
||||||||||
| (in thousands, except share and per share data) |
||||||||||||
| Debt, long-term (including current portion): |
||||||||||||
| $450.0 million 11.75% senior secured notes(1) |
$ | 450,000 | $ | 450,000 | $ | |||||||
| $250.0 million 9.50% senior notes |
250,000 | 250,000 | ||||||||||
| $750.0 million senior secured revolving credit facility |
185,000 | 185,000 | ||||||||||
| Other debt |
2,201,359 | 2,201,359 | ||||||||||
|
|
|
|
|
|
|
|||||||
| Total debt |
3,086,359 | 3,086,359 | ||||||||||
|
|
|
|
|
|
|
|||||||
| Shareholders’ equity: |
||||||||||||
| Preference shares; $.001 par value, 10,000,000 shares authorized, none outstanding |
— | |||||||||||
| Ordinary shares; actual: $.0012 par value, 40,000,000 shares authorized; 21,000,000 shares issued and outstanding; as adjusted: $.001 par value, 490,000,000 ordinary shares authorized; ordinary shares issued and outstanding(2) |
25 | |||||||||||
| Additional paid-in capital |
2,331,064 | 2,331,064 | ||||||||||
| Accumulated other comprehensive income |
21,760 | 21,760 | ||||||||||
| Retained earnings (deficit) |
(614,083 | ) | (614,083 | ) | ||||||||
|
|
|
|
|
|
|
|||||||
| Total shareholders’ equity |
1,738,766 | |||||||||||
|
|
|
|
|
|
|
|||||||
| Total capitalization |
$ | 4,825,125 | $ | $ | ||||||||
|
|
|
|
|
|
|
|||||||
| (1) | Does not reflect original issue discount of $4.4 million. |
| (2) | Outstanding shares, as adjusted for the Corporate Reorganization, is based on the sum of (i) actual ordinary shares outstanding of NCL Corporation Ltd. multiplied by a share exchange ratio of 1.0 to , for the exchange of the ordinary shares of NCL Corporation Ltd. for our ordinary shares in the Corporate Reorganization plus (ii) ordinary shares issued in exchange for profits interests granted under the Profits Sharing Agreement, at an exchange formula based on the midpoint of the estimated offering price range set forth in the cover page of this prospectus. |
36
Table of Contents
If you invest in the Issuer’s ordinary shares, your interest will be diluted to the extent of the difference between the initial public offering price per ordinary share and the net tangible book value per ordinary share upon completion of this offering.
Our net tangible book value at June 30, 2011 was $ million, or approximately $ per ordinary share, based on the number of ordinary shares outstanding at most recent quarter for which financial statements are available. Net tangible book value per ordinary share is equal to our total tangible assets less total liabilities, divided by the number of outstanding ordinary shares at June 30, 2011. After giving effect to (a) our issuance of ordinary shares upon the exchange of outstanding profits units in connection with this offering, and (b) our sale of ordinary shares in this offering at an assumed initial public offering price of $ per ordinary share, which is the midpoint of the estimated price range set forth on the cover of this prospectus, and after deducting the underwriting discount and estimated offering expenses, our net tangible book value at June 30, 2011 would have been approximately $ million, or $ per ordinary share. This represents an immediate increase in net tangible book value of $ per ordinary share to existing shareholders, an immediate increase in net tangible book value of $ per ordinary share attributable to shareholders who will be issued ordinary shares in exchange for outstanding profits units and an immediate dilution of $ per ordinary share to new investors purchasing ordinary shares at the initial public offering price. The following table illustrates the per ordinary share dilution:
| Assumed initial public offering price per share |
$ | |||
| Net tangible book value per share at most recent quarter for which financial statements are available |
||||
| Increase in net tangible book value per share attributable to existing shareholders |
||||
| Increase in net tangible book value attributable to shareholders who will be issued ordinary shares in exchange for outstanding profits units |
||||
| Net tangible book value per share after the offering |
||||
| Dilution per share to new investors |
$ |
The following table summarizes at June 30, 2011, on an adjusted basis for this offering, the number of ordinary shares issued by the Issuer, the total consideration paid to the Issuer and the average price per ordinary share paid by existing shareholders and by investors purchasing ordinary shares in this offering (before deducting the estimated underwriting discount and estimated offering expenses) based upon an assumed initial public offering price of $ per ordinary share, which is the midpoint of the estimated price set forth on the cover of this prospectus, before deducting the underwriting discount and estimated offering expenses:
| Shares purchased | Total consideration | Average price per share |
||||||||||||
| Number | Percent | Amount | Percent | |||||||||||
| Existing shareholders |
$ | $ | ||||||||||||
| New investors |
||||||||||||||
| Total |
$ | $ | ||||||||||||
There will be ordinary shares issued and outstanding after the consummation of this offering (assuming no exercise of the underwriters’ option to purchase additional ordinary shares) based upon an assumed initial public offering price of $ per ordinary share, which is the midpoint of the estimated price range set forth on the cover of this prospectus. In connection with the Corporate Reorganization and prior to the consummation of this offering, we will issue an economically equivalent number of our ordinary shares, based on the initial public offering price in this offering, in exchange for all outstanding NCL Corporation Ltd. profits interests granted under the Profits Sharing Agreement, including the Ordinary Profits Units (each as described in “Compensation Discussion & Analysis”).
37
Table of Contents
There will be additional ordinary shares available for future awards under our new long-term incentive plan as of the consummation of this offering.
A $1.00 increase or decrease in the assumed offering price of $ per ordinary share, which is the midpoint of the initial public offering price range set forth on the cover of this prospectus, would increase or decrease the number of ordinary shares to be outstanding after this offering by approximately shares as a result of an increase or decrease in the ordinary shares we will issue in exchange for the profits interests, assuming the number of ordinary shares offered by us, as set forth above and on the cover page of the prospectus, remains the same.
38
Table of Contents
SELECTED CONSOLIDATED FINANCIAL DATA
You should read this data in conjunction with “Management’s Discussion and Analysis of Financial Condition and Results of Operations” and our consolidated financial statements and the related notes included elsewhere in this prospectus. The data for the six months ended June 30, 2011 and 2010 has been derived from our unaudited financial statements included elsewhere in this prospectus (with the exception of the consolidated balance sheet as of June 30, 2010 which is not included in this prospectus) and which, in the opinion of management, contain all normal recurring adjustments, necessary for a fair statement of the results for the unaudited interim periods. The data, as it relates to each of the years 2006 through 2010, has been derived from annual financial statements, including our audited consolidated balance sheets as of December 31, 2010 and 2009 and the related consolidated statements of operations and of cash flows for each of the three years in the period ended December 31, 2010 and the notes thereto appearing elsewhere in this prospectus. Our consolidated financial statements have been prepared in accordance with GAAP in the U.S.
| Six Months Ended June 30, |
Year Ended December 31, | |||||||||||||||||||||||||||
| (in thousands, except per share data) |
2011 | 2010 | 2010 | 2009 | 2008 | 2007 | 2006 | |||||||||||||||||||||
| Statement of operations data: |
||||||||||||||||||||||||||||
| Revenue |
||||||||||||||||||||||||||||
| Passenger ticket |
$ | 725,343 | $ | 607,715 | $ | 1,392,506 | $ | 1,275,844 | $ | 1,501,646 | $ | 1,575,851 | $ | 1,442,628 | ||||||||||||||
| Onboard and other |
338,753 | 286,702 | 619,622 | 579,360 | 604,755 | 601,043 | 537,313 | |||||||||||||||||||||
|
|
|
|
|
|
|
|
|
|
|
|
|
|
|
|||||||||||||||
| Total revenue |
1,064,096 | 894,417 | 2,012,128 | 1,855,204 | 2,106,401 | 2,176,894 | 1,979,941 | |||||||||||||||||||||
|
|
|
|
|
|
|
|
|
|
|
|
|
|
|
|||||||||||||||
| Cruise operating expense |
||||||||||||||||||||||||||||
| Commissions, transportation and other |
194,990 | 170,502 | 379,655 | 377,036 | 410,061 | 497,301 | 487,294 | |||||||||||||||||||||
| Onboard and other |
83,087 | 70,080 | 153,137 | 158,330 | 182,817 | 204,768 | 186,240 | |||||||||||||||||||||
| Payroll and related |
144,569 | 126,643 | 265,390 | 252,426 | 309,083 | 374,291 | 354,929 | |||||||||||||||||||||
| Fuel |
120,610 | 96,907 | 207,210 | 162,683 | 258,262 | 193,173 | 164,530 | |||||||||||||||||||||
| Food |
62,522 | 51,685 | 114,064 | 118,899 | 126,736 | 120,633 | 102,324 | |||||||||||||||||||||
| Other |
121,368 | 99,741 | 227,842 | 220,080 | 291,522 | 306,853 | 275,697 | |||||||||||||||||||||
|
|
|
|
|
|
|
|
|
|
|
|
|
|
|
|||||||||||||||
| Total cruise operating expense |
727,146 | 615,558 | 1,347,298 | 1,289,454 | 1,578,481 | 1,697,019 | 1,571,014 | |||||||||||||||||||||
|
|
|
|
|
|
|
|
|
|
|
|
|
|
|
|||||||||||||||
| Other operating expense |
||||||||||||||||||||||||||||
| Marketing, general and administrative |
133,169 | 125,985 | 264,398 | 241,676 | 299,827 | 287,093 | 249,250 | |||||||||||||||||||||
| Depreciation and amortization |
92,767 | 76,753 | 170,191 | 152,700 | 162,565 | 148,003 | 119,097 | |||||||||||||||||||||
| Impairment loss(1) |
— | — | — | — | 128,775 | 2,565 | 8,000 | |||||||||||||||||||||
|
|
|
|
|
|
|
|
|
|
|
|
|
|
|
|||||||||||||||
| Total other operating expense |
225,936 | 202,738 | 434,589 | 394,376 | 591,167 | 437,661 | 376,347 | |||||||||||||||||||||
|
|
|
|
|
|
|
|
|
|
|
|
|
|
|
|||||||||||||||
| Operating income (loss) |
111,014 | 76,121 | 230,241 | 171,374 | (63,247 | ) | 42,214 | 32,580 | ||||||||||||||||||||
|
|
|
|
|
|
|
|
|
|
|
|
|
|
|
|||||||||||||||
| Non-operating income (expense) |
||||||||||||||||||||||||||||
| Interest income |
24 | 65 | 100 | 836 | 2,796 | 1,384 | 3,392 | |||||||||||||||||||||
| Interest expense, net of capitalized interest |
(94,575 | ) | (72,886 | ) | (173,772 | ) | (115,350 | ) | (152,364 | ) | (175,409 | ) | (136,478 | ) | ||||||||||||||
| Other income (expense)(2) |
2,088 | (34,372 | ) | (33,952 | ) | 10,373 | 1,012 | (95,151 | ) | (30,393 | ) | |||||||||||||||||
|
|
|
|
|
|
|
|
|
|
|
|
|
|
|
|||||||||||||||
| Total non-operating income (expense) |
(92,463 | ) | (107,193 | ) | (207,624 | ) | (104,141 | ) | (148,556 | ) | (269,176 | ) | (163,479 | ) | ||||||||||||||
|
|
|
|
|
|
|
|
|
|
|
|
|
|
|
|||||||||||||||
| Net income (loss) |
$ | 18,551 | $ | (31,072 | ) | $ | 22,617 | $ | 67,233 | $ | (211,803 | ) | $ | (226,962 | ) | $ | (130,899 | ) | ||||||||||
|
|
|
|
|
|
|
|
|
|
|
|
|
|
|
|||||||||||||||
| Earnings (loss) per share |
||||||||||||||||||||||||||||
| Basic |
$ | $ | ( ) | $ | 1.07 | $ | 3.24 | $ | (10.59 | ) | $ | (11.35 | ) | $ | (6.55 | ) | ||||||||||||
|
|
|
|
|
|
|
|
|
|
|
|
|
|
|
|||||||||||||||
| Diluted |
$ | $ | ( ) | $ | 1.06 | $ | 3.23 | $ | (10.59 | ) | $ | (11.35 | ) | $ | (6.55 | ) | ||||||||||||
|
|
|
|
|
|
|
|
|
|
|
|
|
|
|
|||||||||||||||
39
Table of Contents
| As of or for the
Six Months Ended June 30, |
As of or for the Year Ended December 31, | |||||||||||||||||||||||||||
| (in thousands, except operating |
2011 | 2010 | 2010 | 2009 | 2008 | 2007 | 2006 | |||||||||||||||||||||
| Balance sheet data: |
||||||||||||||||||||||||||||
| Assets |
||||||||||||||||||||||||||||
| Cash and cash equivalents |
$ | 60,177 | $ | 99,441 | $ | 55,047 | $ | 50,152 | $ | 185,717 | $ | 40,291 | $ | 63,530 | ||||||||||||||
| Property and equipment, net |
4,643,864 | 4,613,368 | 4,639,281 | 3,836,127 | 4,119,222 | 4,243,872 | 3,816,292 | |||||||||||||||||||||
| Total assets |
5,606,109 | 5,538,421 | 5,563,513 | 4,811,348 | 5,047,141 | 5,033,698 | 4,629,624 | |||||||||||||||||||||
| Liabilities and shareholders’ equity |
||||||||||||||||||||||||||||
| Advance ticket sales |
414,557 | 385,688 | 294,180 | 255,432 | 250,638 | 332,802 | 314,050 | |||||||||||||||||||||
| Other current liabilities |
298,377 | 260,908 | 280,900 | 235,020 | 558,683 | 291,509 | 298,768 | |||||||||||||||||||||
| Current portion of long-term debt |
132,982 | 143,583 | 78,237 | 3,586 | 182,487 | 191,172 | 154,638 | |||||||||||||||||||||
| Long-term debt |
2,939,677 | 3,024,948 | 3,125,848 | 2,554,105 | 2,474,014 | 2,977,888 | 2,405,357 | |||||||||||||||||||||
| Other long-term liabilities |
51,392 | 62,230 | 52,680 | 58,654 | 31,520 | 4,801 | 1,744 | |||||||||||||||||||||
| Total shareholders’ equity(3) |
1,769,124 | 1,661,064 | 1,731,668 | 1,704,551 | 1,549,799 | 1,235,526 | 1,455,067 | |||||||||||||||||||||
| Operating data: |
||||||||||||||||||||||||||||
| Passengers Carried |
747,080 | 635,687 | 1,404,137 | 1,318,441 | 1,270,281 | 1,304,385 | 1,153,844 | |||||||||||||||||||||
| Passenger Cruise Days |
5,030,805 | 4,368,760 | 9,559,049 | 9,243,154 | 9,503,839 | 9,857,946 | 8,807,632 | |||||||||||||||||||||
| Capacity Days |
4,683,408 | 4,024,208 | 8,790,980 | 8,450,980 | 8,900,816 | 9,246,715 | 8,381,445 | |||||||||||||||||||||
| Occupancy Percentage |
107.4 | % | 108.6 | % | 108.7 | % | 109.4 | % | 106.8 | % | 106.6 | % | 105.1 | % | ||||||||||||||
| Other financial data: |
||||||||||||||||||||||||||||
| Net cash provided by (used in) operating activities |
234,210 | 313,742 | 418,946 | 50,726 | (23,297 | ) | 36,331 | 147,504 | ||||||||||||||||||||
| Net cash used in investing activities |
(97,350 | ) | (853,994 | ) | (968,940 | ) | (166,573 | ) | (166,236 | ) | (581,578 | ) | (756,245 | ) | ||||||||||||||
| Net cash provided by (used in) financing activities |
(131,730 | ) | 589,541 | 554,889 | (19,718 | ) | 334,959 | 522,008 | 611,855 | |||||||||||||||||||
| Additions to property and equipment |
(97,350 | ) | (853,994 | ) | (977,466 | ) | (161,838 | ) | (163,607 | ) | (582,837 | ) | (809,403 | ) | ||||||||||||||
| (1) | In 2008, an impairment loss of $128.8 million was recorded as a result of the cancellation of a contract to build a ship (we refer you to our consolidated financial statements Note 3 “Property and Equipment”), in 2007, an impairment loss of $2.6 million was recorded as a result of a write-down relating to the sale of Oceanic, formerly known as Independence; and in 2006, an impairment loss of $8.0 million was recorded as a result of a write-down relating to the Orient Lines tradename. |
| (2) | For the six months ended June 30, 2011 the income was due to gains on fuel derivatives partially offset by losses on foreign exchange. In 2010, a loss of $33.1 million was recorded primarily due to losses on foreign exchange contracts associated with the financing of Norwegian Epic. In 2009, 2008, 2007 and 2006, foreign currency translation and interest rate swap gains (losses) of $(9.6) million, $101.8 million, $(94.5) million, and $(38.9) million, respectively, were recorded primarily due to fluctuations in the euro/U.S. dollar exchange rate. In 2009 and 2008, these amounts were offset by the change in fair value of our fuel derivative contracts of $20.4 million and $(99.9) million, respectively. |
| (3) | In 2009, we received $100.0 million from our shareholders and issued 1,000,000 additional ordinary shares of $.0012 par value to our shareholders pro rata in accordance with their percentage ownership resulting in an aggregate 21,000,000 ordinary shares of $.0012 par value issued and outstanding as of December 31, 2009 (we refer you to “Consolidated Statements of Changes in Shareholders’ Equity” and Note 5 “Related Party Disclosures”) in our notes to our consolidated financial statements. |
40
Table of Contents
MANAGEMENT’S DISCUSSION AND ANALYSIS OF FINANCIAL
CONDITION AND RESULTS OF OPERATIONS
Non-GAAP financial measures
We use certain non-GAAP financial measures, such as Net Revenue, Net Yield, Net Cruise Cost and Adjusted EBITDA to enable us to analyze our performance. We utilize Net Revenue and Net Yield to manage our business on a day-to-day basis and believe that they are the most relevant measures of our revenue performance because they reflect the revenue earned by us net of significant variable costs and are commonly used in the cruise industry to measure revenue performance. In measuring our ability to control costs in a manner that positively impacts net income, we believe changes in Net Cruise Cost and Net Cruise Cost Excluding Fuel to be the most relevant indicators of our performance and are commonly used in the cruise industry as a measurement of costs.
As our business includes the sourcing of passengers and deployment of vessels outside of North America, a portion of our revenue and expenses are denominated in foreign currencies, particularly euro and British pound sterling, which are subject to fluctuations in currency exchange rates versus our reporting currency, the U.S. dollar. In order to monitor results excluding these fluctuations, we calculate certain non-GAAP measures on a Constant Currency basis whereby current period revenue and expenses denominated in foreign currencies are converted to U.S. dollars using currency exchange rates of the comparable period. We believe that presenting these non-GAAP measures on both a reported and Constant Currency basis is useful in providing a more comprehensive view of trends in our business.
We believe that Adjusted EBITDA is appropriate as a supplemental financial measure as it is used by management to assess operating performance, is a factor in the evaluation of the performance of management and is the primary metric used in determining the Company’s performance incentive bonus paid to its employees. We believe that Adjusted EBITDA is a useful measure in determining the Company’s performance as it reflects certain operating drivers of the Company’s business, such as sales growth, operating costs, selling, general and administrative expenses and other operating income and expense. You are encouraged to evaluate each adjustment and the reasons we consider them appropriate for supplemental analysis. In evaluating Adjusted EBITDA, you should be aware that in the future we may incur expenses similar to the adjustments in this presentation. Our use of Adjusted EBITDA has limitations as an analytical tool, and you should not consider this measure in isolation or as a substitute for analysis of our results as reported under GAAP. Our presentation of Adjusted EBITDA should not be construed as an inference that our future results will be unaffected by unusual or non-recurring items.
Adjusted EBITDA is not a defined term under GAAP. Adjusted EBITDA is not intended to be a measure of liquidity or cash flows from operations or measures comparable to net income as it does not take into account certain requirements such as capital expenditures and related depreciation, principal and interest payments and tax payments and it includes other supplemental adjustments.
Our non-GAAP financial measures may not be comparable to other companies. Please see a historical reconciliation of these measures to items in our consolidated financial statements below in the “Results of Operations” section.
Overview
Revenue from our cruise and cruise-related activities are categorized by us as “passenger ticket revenue” and “onboard and other revenue.” Passenger ticket revenue and onboard and other revenue vary according to the size of the ship in operation, the length of cruises operated and the markets in which the ship operates. Our revenue is seasonal based on demand for cruises, which has historically been strongest during the summer months.
Passenger ticket revenue primarily consists of revenue for accommodations, meals in certain restaurants on the ship, certain onboard entertainment, and includes revenue for service charges and air and land transportation to and from the ship to the extent passengers purchase these items from us.
41
Table of Contents
Onboard and other revenue primarily consists of revenue from gaming, beverage sales, specialty dining, shore excursions, retail sales and spa services. We record onboard revenue from onboard activities we perform directly or that are performed by independent concessionaires, from which we receive a share of their revenue.
Our cruise operating expense is classified as follows:
| • | Commissions, transportation and other primarily consists of direct costs associated with passenger ticket revenue. These costs include travel agent commissions, air and land transportation expenses, related credit card fees, costs associated with service charges and certain port expenses. |
| • | Onboard and other primarily consists of direct costs that are incurred in connection with onboard and other revenue. These include costs incurred in connection with shore excursions, beverage sales and gaming. |
| • | Payroll and related consists of the cost of wages and benefits for shipboard employees. |
| • | Fuel includes fuel costs, the impact of certain fuel hedges, and fuel delivery costs. |
| • | Food consists of food costs for passengers and crew. |
| • | Other consists of maintenance and repairs (including Dry-dock costs), ship insurance, ship Charter costs and other ship expenses. |
Critical accounting policies
Our consolidated financial statements have been prepared in accordance with GAAP in the U.S. The preparation of these consolidated financial statements requires us to make estimates, judgments and assumptions that affect the reported amounts of assets and liabilities and disclosure of contingent assets and liabilities at the date of our consolidated financial statements and the reported amounts of revenues and expenses during the periods presented. We rely on historical experience and on various other assumptions that we believe to be reasonable under the circumstances to make these estimates and judgments. Actual results could differ materially from these estimates. We believe that the following critical accounting policies affect the significant estimates used in the preparation of our consolidated financial statements. These critical accounting policies, which are presented in detail in the notes to our audited consolidated financial statements, relate to ship accounting, asset impairment and contingencies.
Ship accounting
Ships represent our most significant assets, and we record them at cost less accumulated depreciation. Depreciation of ships is computed on a straight-line basis over the estimated service lives of primarily 30 years after a 15% reduction for the estimated residual value of the ship. Improvement costs that we believe add value to our ships are capitalized to the ship and depreciated over the improvements’ estimated useful lives. Maintenance and repairs activities are charged to expense as incurred. We account for Dry-dock costs under the direct expense method which requires us to expense all Dry-dock costs as incurred.
We determine the useful life of our ships based primarily on our estimates of the average useful life of the ships’ major component systems, such as cabins, main diesels, main electric, superstructure and hull. In addition, we consider the impact of anticipated changes in the vacation market and technological conditions and historical useful lives of similarly-built ships. Given the large and complex nature of our ships, our accounting estimates related to ships and determinations of ship improvement costs to be capitalized require considerable judgment and are inherently uncertain. Should certain factors or circumstances cause us to revise our estimate of ship service lives or projected residual values, depreciation expense could be materially lower or higher. If circumstances cause us to change our assumptions in making determinations as to whether ship improvements should be capitalized, the amounts we expense each year as maintenance and repairs costs could increase, partially offset by a decrease in depreciation expense. If we reduced our estimated average 30-year ship service
42
Table of Contents
life by one year, depreciation expense for the year ended December 31, 2010 would have increased by $4.6 million. In addition, if our ships were estimated to have no residual value, depreciation expense for the same period would have increased by $23.2 million.
We believe our estimates for ship accounting are reasonable and our methods are consistently applied. We believe that depreciation expense is based on a rational and systematic method to allocate our ships’ costs to the periods that benefit from the ships’ usage.
Asset impairment
We review our long-lived assets, principally ships, for impairment whenever events or changes in circumstances indicate that the carrying amount of an asset may not be recoverable. Assets are grouped and evaluated at the lowest level for which there are identifiable cash flows that are largely independent of the cash flows of other groups of assets. We consider historical performance and future estimated results in our evaluation of potential impairment and then compare the carrying amount of the asset to the estimated future cash flows expected to result from the use of the asset. If the carrying amount of the asset exceeds the estimated expected undiscounted future cash flows, we measure the amount of the impairment by comparing the carrying amount of the asset to its fair value. We estimate fair value based on the best information available making whatever estimates, judgments and projections considered necessary. The estimation of fair value is generally measured by discounting expected future cash flows at discount rates commensurate with the risk involved.
Goodwill and other indefinite-lived assets, principally trade names, are reviewed for impairment on an annual basis or earlier if there is an event or change in circumstances that would indicate that the carrying value of these assets could not be fully recovered.
We believe our estimates and judgments with respect to our long-lived assets, principally ships, and goodwill and other indefinite-lived intangible assets are reasonable. Nonetheless, if there was a material change in assumptions used in the determination of such fair values or if there is a material change in the conditions or circumstances that influence such assets, we could be required to record an impairment charge.
Contingencies
Periodically, we assess potential liabilities related to any lawsuits or claims brought against us or any asserted claims, including tax, legal and/or environmental matters. Although it is typically very difficult to determine the timing and ultimate outcome of such actions, we use our best judgment to determine if it is probable that we will incur an expense related to the settlement or final adjudication of such matters and whether a reasonable estimation of such probable loss, if any, can be made. In assessing probable losses, we take into consideration estimates of the amount of insurance recoveries, if any. In accordance with the guidance on accounting for contingencies, we accrue a liability when we believe a loss is probable and the amount of loss can be reasonably estimated. Due to the inherent uncertainties related to the eventual outcome of litigation and potential insurance recoveries, although we believe that our estimates and judgments are reasonable, it is possible that certain matters may be resolved for amounts materially different from any estimated provisions or previous disclosures.
43
Table of Contents
Results of operations
We reported total revenue, total cruise operating expense, operating income (loss) and net income (loss) as shown in the following table (in thousands, except per share data):
| Six Months
Ended June 30, |
Year Ended December 31, | |||||||||||||||||||
| 2011 | 2010 | 2010 | 2009 | 2008 | ||||||||||||||||
| Total revenue |
$ | 1,064,096 | $ | 894,417 | $ | 2,012,128 | $ | 1,855,204 | $ | 2,106,401 | ||||||||||
|
|
|
|
|
|
|
|
|
|
|
|||||||||||
| Total cruise operating expense |
$ | 727,146 | $ | 615,558 | $ | 1,347,298 | $ | 1,289,454 | $ | 1,578,481 | ||||||||||
|
|
|
|
|
|
|
|
|
|
|
|||||||||||
| Operating income (loss) |
$ | 111,014 | $ | 76,121 | $ | 230,241 | $ | 171,374 | $ | (63,247 | )(1) | |||||||||
|
|
|
|
|
|
|
|
|
|
|
|||||||||||
| Net income (loss) |
$ | 18,551 | $ | (31,072 | ) | $ | 22,617 | $ | 67,233 | $ | (211,803 | )(1) | ||||||||
|
|
|
|
|
|
|
|
|
|
|
|||||||||||
| Earnings (loss) per share |
||||||||||||||||||||
| Basic |
$ | $ | ( ) | $ | 1.07 | $ | 3.24 | $ | (10.59 | ) | ||||||||||
|
|
|
|
|
|
|
|
|
|
|
|||||||||||
| Diluted |
$ | $ | ( ) | $ | 1.06 | $ | 3.23 | $ | (10.59 | ) | ||||||||||
|
|
|
|
|
|
|
|
|
|
|
|||||||||||
| (1) | Includes an impairment loss of $128.8 million as a result of the cancellation of a contract to build a ship. |
The following table sets forth operating data as a percentage of revenue:
| Six
Months Ended June 30, |
Year Ended December 31, | |||||||||||||||||||
| 2011 | 2010 | 2010 | 2009 | 2008 | ||||||||||||||||
| Revenue |
||||||||||||||||||||
| Passenger ticket |
68.2 | % | 67.9 | % | 69.2 | % | 68.8 | % | 71.3 | % | ||||||||||
| Onboard and other |
31.8 | % | 32.1 | % | 30.8 | % | 31.2 | % | 28.7 | % | ||||||||||
|
|
|
|
|
|
|
|
|
|
|
|||||||||||
| Total revenue |
100.0 | % | 100.0 | % | 100.0 | % | 100.0 | % | 100.0 | % | ||||||||||
|
|
|
|
|
|
|
|
|
|
|
|||||||||||
| Cruise operating expense |
||||||||||||||||||||
| Commissions, transportation and other |
18.3 | % | 19.1 | % | 18.9 | % | 20.3 | % | 19.5 | % | ||||||||||
| Onboard and other |
7.8 | % | 7.8 | % | 7.6 | % | 8.5 | % | 8.7 | % | ||||||||||
| Payroll and related |
13.6 | % | 14.1 | % | 13.2 | % | 13.6 | % | 14.7 | % | ||||||||||
| Fuel |
11.3 | % | 10.8 | % | 10.3 | % | 8.8 | % | 12.3 | % | ||||||||||
| Food |
5.9 | % | 5.8 | % | 5.7 | % | 6.4 | % | 6.0 | % | ||||||||||
| Other |
11.5 | % | 11.2 | % | 11.3 | % | 11.9 | % | 13.8 | % | ||||||||||
|
|
|
|
|
|
|
|
|
|
|
|||||||||||
| Total cruise operating expense |
68.4 | % | 68.8 | % | 67.0 | % | 69.5 | % | 75.0 | % | ||||||||||
|
|
|
|
|
|
|
|
|
|
|
|||||||||||
| Other operating expense |
||||||||||||||||||||
| Marketing, general and administrative |
12.5 | % | 14.1 | % | 13.1 | % | 13.0 | % | 14.2 | % | ||||||||||
| Depreciation and amortization |
8.7 | % | 8.6 | % | 8.5 | % | 8.2 | % | 7.7 | % | ||||||||||
| Impairment loss |
— | % | — | % | — | % | — | % | 6.1 | %(1) | ||||||||||
|
|
|
|
|
|
|
|
|
|
|
|||||||||||
| Total other operating expense |
21.2 | % | 22.7 | % | 21.6 | % | 21.2 | % | 28.0 | % | ||||||||||
|
|
|
|
|
|
|
|
|
|
|
|||||||||||
| Operating income (loss) |
10.4 | % | 8.5 | % | 11.4 | % | 9.3 | % | (3.0 | )%(1) | ||||||||||
|
|
|
|
|
|
|
|
|
|
|
|||||||||||
| Non-operating income (expense) |
||||||||||||||||||||
| Interest income |
— | % | — | % | — | % | — | % | 0.1 | % | ||||||||||
| Interest expense, net of capitalized interest |
(8.9 | )% | (8.1 | )% | (8.6 | )% | (6.2 | )% | (7.2 | )% | ||||||||||
| Other income (expense) |
0.2 | % | (3.8 | )% | (1.7 | )% | 0.5 | % | — | % | ||||||||||
|
|
|
|
|
|
|
|
|
|
|
|||||||||||
| Total non-operating income (expense) |
(8.7 | )% | (11.9 | )% | (10.3 | )% | (5.7 | )% | (7.1 | )% | ||||||||||
|
|
|
|
|
|
|
|
|
|
|
|||||||||||
| Net income (loss) |
1.7 | % | (3.4 | )% | 1.1 | % | 3.6 | % | (10.1 | )%(1) | ||||||||||
|
|
|
|
|
|
|
|
|
|
|
|||||||||||
| (1) | Includes an impairment loss of $128.8 million as a result of the cancellation of a contract to build a ship. |
44
Table of Contents
The following table sets forth selected statistical information:
| Six Months Ended June 30, |
Year Ended December 31, | |||||||||||||||||||
| 2011 | 2010 | 2010 | 2009 | 2008 | ||||||||||||||||
| Passengers Carried |
747,080 | 635,687 | 1,404,137 | 1,318,441 | (1) | 1,270,281 | ||||||||||||||
| Passenger Cruise Days |
5,030,805 | 4,368,760 | 9,559,049 | 9,243,154 | 9,503,839 | |||||||||||||||
| Capacity Days |
4,683,408 | 4,024,208 | 8,790,980 | 8,450,980 | 8,900,816 | |||||||||||||||
| Occupancy Percentage |
107.4 | % | 108.6 | % | 108.7 | % | 109.4 | % | 106.8 | % | ||||||||||
| (1) | Passengers Carried increased in 2009 primarily due to the three and four-night itinerary of Norwegian Sky compared to the seven-night itinerary with Pride of Aloha in 2008. |
Gross Yield and Net Yield were calculated as follows (in thousands, except Capacity Days and Yield data):
| Six Months Ended June 30, |
Year Ended December 31, | |||||||||||||||||||||||
| 2011 | 2011 Constant Currency |
2010 | 2010 | 2009 | 2008 | |||||||||||||||||||
| Passenger ticket revenue |
$ | 725,343 | $ | 721,220 | $ | 607,715 | $ | 1,392,506 | $ | 1,275,844 | $ | 1,501,646 | ||||||||||||
| Onboard and other revenue |
338,753 | 338,753 | 286,702 | 619,622 | 579,360 | 604,755 | ||||||||||||||||||
|
|
|
|
|
|
|
|
|
|
|
|
|
|||||||||||||
| Total revenue |
1,064,096 | 1,059,973 | 894,417 | 2,012,128 | 1,855,204 | 2,106,401 | ||||||||||||||||||
| Less: |
||||||||||||||||||||||||
| Commissions, transportation and other expense |
194,990 | 193,841 | 170,502 | 379,655 | 377,036 | 410,061 | ||||||||||||||||||
| Onboard and other expense |
83,087 | 83,087 | 70,080 | 153,137 | 158,330 | 182,817 | ||||||||||||||||||
|
|
|
|
|
|
|
|
|
|
|
|
|
|||||||||||||
| Net Revenue |
$ | 786,019 | $ | 783,045 | $ | 653,835 | $ | 1,479,336 | $ | 1,319,838 | $ | 1,513,523 | ||||||||||||
|
|
|
|
|
|
|
|
|
|
|
|
|
|||||||||||||
| Capacity Days |
4,683,408 | 4,683,408 | 4,024,208 | 8,790,980 | 8,450,980 | 8,900,816 | ||||||||||||||||||
| Gross Yield |
$ | 227.21 | $ | 226.33 | $ | 222.26 | $ | 228.89 | $ | 219.53 | $ | 236.65 | ||||||||||||
| Net Yield |
$ | 167.83 | $ | 167.20 | $ | 162.48 | $ | 168.28 | $ | 156.18 | $ | 170.04 | ||||||||||||
45
Table of Contents
Gross Cruise Cost, Net Cruise Cost and Net Cruise Cost Excluding Fuel were calculated as follows (in thousands, except Capacity Days and per Capacity Day data):
| Six Months Ended June 30, |
Year Ended December 31, | |||||||||||||||||||||||
| 2011 | 2011 Constant Currency |
2010 | 2010 | 2009 | 2008 | |||||||||||||||||||
| Total cruise operating expense |
$ | 727,146 | $ | 726,222 | $ | 615,558 | $ | 1,347,298 | $ | 1,289,454 | $ | 1,578,481 | ||||||||||||
| Marketing, general and administrative expense |
133,169 | 132,456 | 125,985 | 264,398 | 241,676 | 299,827 | ||||||||||||||||||
|
|
|
|
|
|
|
|
|
|
|
|
|
|||||||||||||
| Gross Cruise Cost |
860,315 | 858,678 | 741,543 | 1,611,696 | 1,531,130 | 1,878,308 | ||||||||||||||||||
| Less: |
||||||||||||||||||||||||
| Commissions, transportation and other expense |
194,990 | 193,841 | 170,502 | 379,655 | 377,036 | 410,061 | ||||||||||||||||||
| Onboard and other expense |
83,087 | 83,087 | 70,080 | 153,137 | 158,330 | 182,817 | ||||||||||||||||||
|
|
|
|
|
|
|
|
|
|
|
|
|
|||||||||||||
| Net Cruise Cost |
582,238 | 581,750 | 500,961 | $ | 1,078,904 | $ | 995,764 | $ | 1,285,430 | |||||||||||||||
|
|
|
|
|
|
|
|
|
|
|
|
|
|||||||||||||
| Less: |
||||||||||||||||||||||||
| Fuel |
120,610 | 120,610 | 96,907 | 207,210 | 162,683 | 258,262 | ||||||||||||||||||
|
|
|
|
|
|
|
|
|
|
|
|
|
|||||||||||||
| Net Cruise Cost Excluding Fuel |
$ | 461,628 | $ | 461,140 | $ | 404,054 | 871,694 | 833,081 | 1,027,168 | |||||||||||||||
|
|
|
|
|
|
|
|
|
|
|
|
|
|||||||||||||
| Capacity Days |
4,683,408 | 4,683,408 | 4,024,208 | 8,790,980 | 8,450,980 | 8,900,816 | ||||||||||||||||||
| Gross Cruise Cost per Capacity Day |
$ | 183.69 | $ | 183.34 | $ | 184.27 | $ | 183.34 | $ | 181.18 | $ | 211.03 | ||||||||||||
| Net Cruise Cost per Capacity Day |
$ | 124.32 | $ | 124.22 | $ | 124.49 | $ | 122.73 | $ | 117.83 | $ | 144.42 | ||||||||||||
| Net Cruise Cost Excluding Fuel per Capacity Day |
$ | 98.57 | $ | 98.46 | $ | 100.41 | $ | 99.16 | $ | 98.58 | $ | 115.40 | ||||||||||||
Adjusted EBITDA was calculated as follows (in thousands):
| Six Months Ended June 30, |
Year Ended December 31, | |||||||||||||||||||
| 2011 | 2010 | 2010 | 2009 | 2008 | ||||||||||||||||
| Net income (loss) |
$ | 18,551 | $ | (31,072 | ) | $ | 22,617 | $ | 67,233 | $ | (211,803 | ) | ||||||||
| Interest, net |
94,551 | 72,821 | 173,672 | 114,514 | 149,568 | |||||||||||||||
| Depreciation and amortization |
92,767 | 76,753 | 170,191 | 152,700 | 162,565 | |||||||||||||||
| Impairment loss |
— | — | — | — | 128,775 | |||||||||||||||
| Other (income) expense(a) |
(2,088 | ) | 34,372 | 33,952 | (10,373 | ) | (1,012 | ) | ||||||||||||
| Legal fees and settlements(b) |
— | — | — | 1,500 | 12,723 | |||||||||||||||
| Severance costs(c) |
— | — | — | — | 10,840 | |||||||||||||||
| NCLA shutdown costs(d) |
— | — | — | — | 14,119 | |||||||||||||||
| Norwegian Sky start-up expenses(e) |
— | — | — | — | 8,504 | |||||||||||||||
| Consulting fees(f) |
— | — | — | — | 8,378 | |||||||||||||||
| Other(g) |
1,592 | 2,381 | 4,313 | 6,959 | 3,293 | |||||||||||||||
|
|
|
|
|
|
|
|
|
|
|
|||||||||||
| Adjusted EBITDA |
$ | 205,373 | $ | 155,255 | $ | 404,745 | $ | 332,533 | $ | 285,950 | ||||||||||
|
|
|
|
|
|
|
|
|
|
|
|||||||||||
| (a) | Includes taxes, (gains)/losses on foreign currency, debt translation and derivatives and other (income) expense. |
| (b) | Includes a claim related to the S.S. Norway incident in 2003 and legal fees for credit facility amendments and the cancellation of a newbuild ship order. |
| (c) | Costs related to a severance agreement with our former Chief Executive Officer. |
46
Table of Contents
| (d) | Costs in connection with the Hawaii restructuring, which were reimbursed by Genting HK pursuant to the RDA (we refer you to “Certain Relationships and Related Party Transactions—The Reimbursement and Distribution Agreement”). |
| (e) | Costs incurred from the reflagging of Pride of Aloha from the U.S.-flagged fleet to the international fleet as Norwegian Sky. |
| (f) | Fees associated with the acquisition of our ordinary shares by the Apollo Funds. |
| (g) | Includes non-cash compensation and costs related to our Shipboard Retirement Plan in 2011 and 2010. Includes insurance claim recoveries and supplemental P&I insurance call, non-cash costs related to our Shipboard Retirement Plan and, beginning in 2009, management equity grants. Also includes costs related to a mechanical failure on one of our ships in 2009. |
Six months ended June 30, 2011 (“2011”) compared to six months ended June 30, 2010 (“2010”)
Revenue
Total revenue increased 19.0% in 2011 compared to 2010. Net Revenue increased 20.2% in 2011, primarily due to an increase in Capacity Days of 16.4% and an increase in Net Yield of 3.3%. The increase in Capacity Days was due to the addition of Norwegian Epic to the fleet in late June 2010. The increase in Net Yield was due to an increase in passenger ticket pricing and onboard revenue which was primarily due to an increase in net revenue from our gaming operations, spa services and specialty restaurants. On a Constant Currency basis, Net Yield increased 2.9% in 2011 compared to 2010.
Expense
Total cruise operating expense increased 18.1% in 2011 compared to 2010 primarily related to an increase in Capacity Days as described above and higher ship operating expenses. The increase in ship operating expenses was primarily due to an increase in fuel expense as a result of an 11.8% increase in average fuel price to $557 per metric ton in 2011 from $498 in 2010. Total other operating expense increased 11.4% compared to 2010 due to an increase in depreciation expense related to Norwegian Epic which entered service in late June 2010. Net Cruise Cost increased 16.2% in 2011 primarily due to an increase in Capacity Days. On a Capacity Day basis, Net Cruise Cost was unchanged due to increases in fuel expense and Dry-dock expense substantially offset by
lower general and administrative expenses. Excluding fuel expense, Net Cruise Cost per Capacity Day decreased 1.8%. On a Constant Currency basis, Net Cruise Cost per Capacity Day remained relatively unchanged and excluding fuel expense decreased 1.9%.
Interest expense, net of capitalized interest, increased to $94.6 million in 2011 from $72.9 million in 2010 primarily due to an increase in average outstanding borrowings related to the financing of Norwegian Epic. Other income (expense) was $2.1 million in 2011 compared to $(34.4) million in 2010. The income in 2011 was primarily due to gains on fuel derivatives partially offset by losses on foreign exchange. The expense in 2010 was primarily due to losses on foreign exchange contracts associated with the financing of Norwegian Epic.
Year ended December 31, 2010 compared to year ended December 31, 2009
Revenue
Total revenue increased 8.5% in 2010 compared to 2009. Net Revenue increased 12.1% in 2010, primarily due to an increase in Net Yield of 7.7% and an increase in Capacity Days of 4.0%. The increase in Net Yield was due to an increase in passenger ticket pricing and onboard revenue. The increase in onboard revenue was primarily due to an increase in net revenue from our gaming operations, beverage sales and specialty dining. The increase in Capacity Days was due to the addition of Norwegian Epic to the fleet in late June 2010, partially offset by the departure of Norwegian Majesty from our fleet in October 2009.
47
Table of Contents
Expense
Total cruise operating expense increased 4.5% in 2010 compared to 2009 primarily related to an increase in Capacity Days as described above and higher ship operating expenses. The increase in ship operating expenses is primarily due to an increase in fuel expense resulting from a 28.3% increase in the average cost of $490 per metric ton in 2010 from $382 per metric ton in 2009 as well as an increase in payroll and related expenses, partially offset by a savings in port charge expenses. Total other operating expense increased 10.2% compared to 2009 with an increase in marketing expenses, including inaugural expenses for Norwegian Epic, partially offset by lower expenses associated with cost control initiatives. Net Cruise Cost increased 8.3% in 2010 compared to 2009. Net Cruise Cost per Capacity Day increased 4.2% primarily due to higher fuel expense per Capacity Day. Depreciation and amortization expense increased 11.5% in 2010 compared to 2009 due to depreciation expense related to Norwegian Epic which entered service in late June 2010.
Interest expense, net of capitalized interest, increased to $173.8 million in 2010 from $115.4 million in 2009 primarily due to higher average interest rates and an increase in average outstanding borrowings related to the financing of Norwegian Epic. Other income (expense) was an expense of $(34.0) million in 2010 compared to income of $10.4 million in 2009. The expense in 2010 was primarily due to losses on foreign exchange contracts associated with the financing of Norwegian Epic. The income in 2009 was primarily due to fuel derivative gains of $20.4 million, partially offset by interest rate swap losses of $5.5 million and foreign currency losses of $4.0 million, primarily due to changes in the exchange rate regarding the revaluation of our euro-denominated debt to U.S. dollars.
Year ended December 31, 2009 compared to year ended December 31, 2008
Revenue
Total revenue decreased 11.9% in 2009 compared to 2008. Net Revenue decreased 12.8% in 2009 compared to 2008 due to a decrease in Net Yield of 8.2% and a decrease in Capacity Days of 5.1%. The decrease in Net Yield was the result of a decrease in passenger ticket pricing due to adverse global economic conditions. This decrease was partially offset by a slight increase in Net Yield pertaining to onboard and other revenue primarily due to increased Net Revenue from our shore excursions and gaming operations and an increase in Occupancy Percentage. The decrease in Capacity Days was the result of the departure of Marco Polo, Norwegian Dream and Norwegian Majesty from our fleet upon expiration of the relevant Charter agreements in March 2008, November 2008, and October 2009 respectively, partially offset with the re-flagging of Pride of Aloha which was withdrawn from the fleet in May 2008 and launched as Norwegian Sky in July 2008.
Expense
Total cruise operating expense decreased 18.3% in 2009 compared to 2008 primarily related to a decrease in fuel price as a result of a 30.3% decrease in the average cost of $382 per metric ton in 2009 from $548 per metric ton in 2008 and implementation of cost control initiatives which included savings in marketing, general and administrative expense. Total other operating expense decreased 33.3% in 2009 compared to 2008 primarily due to an impairment loss in 2008 of $128.8 million as a result of the cancellation of a contract to build a ship. Net Cruise Cost decreased 22.5% in 2009 compared to 2008 primarily due to a 18.4% decrease in Net Cruise Cost per Capacity Day. The decrease in Net Cruise Cost per Capacity Day was primarily due to lower fuel expense per Capacity Day; lower marketing, general and administrative expense and other cruise operating expense per Capacity Day; and lower payroll and related expense per Capacity Day from the impact of the re-flagging and redeployment of Pride of Hawai’i and Pride of Aloha from the Hawaii market to our international fleet in 2008. Depreciation and amortization expense decreased 6.1% in 2009 compared to 2008 primarily due to the transfer of Norwegian Sky to Genting HK in January 2009.
Interest expense, net of capitalized interest, decreased to $115.4 million in 2009 from $152.4 million in 2008, primarily due to lower average interest rates. Other income (expense) improved to income of $10.4 million in 2009 compared to $1.0 million in 2008. The income in 2009 was primarily due to fuel derivative gains of $20.4 million partially offset by interest rate swap losses of $5.5 million and foreign currency losses of
48
Table of Contents
$4.0 million, primarily due to changes in the exchange rate regarding the revaluation of our euro-denominated debt to U.S. dollars. The income in 2008 was primarily due to foreign currency gains of $101.8 million partially offset by fuel derivative losses of $99.9 million.
Liquidity and Capital Resources
General
As of June 30, 2011, our liquidity was $547.4 million consisting of $60.2 million in cash and cash equivalents and $487.2 million available under our $750.0 million senior secured revolving credit facility. Our main ongoing liquidity requirements are to finance working capital, capital expenditures, and debt service.
Sources and Uses of Cash
Net cash provided by operating activities was $234.2 million for the six months ended June 30, 2011 primarily due to net income in 2011 of $18.6 million and timing differences in cash payments relating to operating assets and liabilities. Net cash provided by operating activities was $418.9 million for the year ended December 31, 2010 primarily due to timing differences in cash payments relating to operating assets and liabilities, the release of cash collateral from our service providers and an increase in advance ticket sales. These amounts were partially offset by transaction losses related to foreign exchange contracts associated with the financing of Norwegian Epic. Net cash provided by operating activities was $50.7 million for the year ended December 31, 2009 primarily due to net income of $67.2 million partially offset by changes primarily due to timing differences in cash payments relating to operating assets and liabilities. Net cash used in operating activities was $23.3 million for the year ended December 31, 2008. The cash used in operating activities in 2008 was primarily due to a decrease in advance ticket sales.
Net cash used in investing activities for the six months ended June 30, 2011 was $97.4 million primarily consisting of additions to property and equipment in connection with construction of two ships, ship improvements and shoreside projects. Net cash used in investing activities, primarily consisting of additions to property and equipment related to payments for construction of Norwegian Epic, was $968.9 million, $166.6 million and $166.2 million for the years ended December 31, 2010, 2009 and 2008, respectively.
Net cash used in financing activities was $131.7 million for the six months ended June 30, 2011 primarily due to repayments of our revolving credit facility and repayments of borrowings related to Norwegian Epic partially offset by borrowings related to the construction of our new ships. Net cash provided by financing activities was $554.9 million for the year ended December 31, 2010. Cash provided by financing activities in 2010 was primarily due to borrowings related to the delivery of Norwegian Epic and the issuance of $250.0 million of 9.5% Senior Notes partially offset by repayments on our senior secured revolving credit facility and payments on other outstanding loans and loan arrangement fees. Net cash used in financing activities of $19.7 million for the year ended December 31, 2009 was primarily due to payments on outstanding loans and repayments of senior secured revolving credit facilities and loan arrangement fees, primarily offset by the issuance of $450.0 million of 11.75% Senior Secured Notes and draw downs on our $750.0 million Senior Secured Revolving Credit Facility and a contribution from, and other transactions with, Affiliates. Net cash provided by financing activities of $335.0 million for the year ended December 31, 2008 was primarily due to contributions from an Affiliate and draw downs on our then senior secured revolving credit facilities and other outstanding loans substantially offset by repayments on those facilities. In 2008, $240.2 million of our then outstanding $250.0 million 10 5/8% Senior Secured Notes were tendered to us and we expensed unamortized deferred financing fees in connection with these notes which was included in interest expense, net of capitalized interest, in our consolidated statement of operations. Also in 2008, we had transactions with an Affiliate primarily due to the RDA.
49
Table of Contents
Future Capital Commitments
Future capital commitments consist of contracted commitments, including ship purchase commitments, and future expected capital expenditures necessary for operations. As of June 30, 2011, anticipated capital expenditures are $191.0 million, $245.5 million and $899.4 million for the years ending December 31, 2011, 2012 and 2013, respectively, of which we have export credit financing in place for the expenditures related to ship purchase commitments in the amounts of $88.4 million, $133.8 million and $701.0 million, respectively, based on the euro/U.S. dollar exchange rate as of June 30, 2011.
The two ships, each at 143,500 Gross Tons and capacity of approximately 4,000 Berths, are scheduled for delivery in the second quarter of 2013 and 2014, respectively. The aggregate contract price of the two ships is approximately €1.2 billion, or $1.7 billion based on the euro/U.S. dollar exchange rate as of June 30, 2011. In connection with the contracts to build the two ships, we do not anticipate any contractual breaches or cancellation to occur. However, if any were to occur, it could result in, among other things, the forfeiture of prior deposits or payments made by us and potential claims and impairment losses which may materially impact our business, financial condition and results of operations.
Contractual obligations
As of December 31, 2010, our contractual obligations, with initial or remaining terms in excess of one year, including interest payments on long-term debt obligations, were as follows (in thousands):
| Total | Less than 1 year |
1-3 years | 3-5 years | More than 5 years |
||||||||||||||||
| Long-term debt(1) |
$ | 3,193,286 | $ | 72,405 | $ | 406,324 | $ | 777,255 | $ | 1,937,302 | ||||||||||
| Capital leases(2) |
10,799 | 5,832 | 4,780 | 187 | — | |||||||||||||||
| Operating leases(3) |
50,890 | 7,329 | 12,548 | 11,068 | 19,945 | |||||||||||||||
| Ship purchases(4) |
1,565,780 | 82,312 | 824,046 | 659,422 | — | |||||||||||||||
| Port facilities(5) |
154,758 | 22,330 | 37,917 | 41,274 | 53,237 | |||||||||||||||
| Interest(6) |
955,013 | 155,317 | 302,313 | 271,724 | 225,659 | |||||||||||||||
| Other(7) |
79,433 | 45,964 | 31,259 | 2,210 | — | |||||||||||||||
|
|
|
|
|
|
|
|
|
|
|
|||||||||||
| Total |
$ | 6,009,959 | $ | 391,489 | $ | 1,619,187 | $ | 1,763,140 | $ | 2,236,143 | ||||||||||
|
|
|
|
|
|
|
|
|
|
|
|||||||||||
| (1) | Net of unamortized original issue discount of $4.7 million. |
| (2) | Primarily for Hawaiian bus operations and equipment for Norwegian Epic. |
| (3) | Primarily for offices, motor vehicles and office equipment. |
| (4) | Contractual obligations for two ships, based on the euro/U.S. dollar exchange rate of 1.3384 as of December 31, 2010. Financing commitments are in place from a syndicate of banks for export credit financing. |
| (5) | Primarily for our usage of a New York City cruise Terminal and Islas de la Bahia, Bermuda and Miami port facilities. |
| (6) | Interest includes fixed and variable rates with LIBOR held constant as of December 31, 2010. |
| (7) | Future commitments for service and maintenance contracts and a Charter agreement with an Affiliate. |
50
Table of Contents
Contractual Obligations
As of June 30, 2011, our contractual obligations, with initial or remaining terms in excess of one year, including interest payments on long-term debt obligations, were as follows (in thousands):
| Total | Less than 1 year |
1-3 years | 3-5 years | More than 5 years |
||||||||||||||||
| Long-term debt(1) |
$ | 3,064,506 | $ | 127,536 | $ | 434,727 | $ | 695,154 | $ | 1,807,089 | ||||||||||
| Capital leases(2) |
8,153 | 5,446 | 2,707 | — | — | |||||||||||||||
| Operating leases(3) |
47,448 | 5,858 | 12,533 | 10,514 | 18,543 | |||||||||||||||
| Ship purchases(4) |
1,664,995 | 133,781 | 1,531,214 | — | — | |||||||||||||||
| Port facilities(5) |
146,927 | 23,397 | 38,687 | 42,376 | 42,467 | |||||||||||||||
| Interest(6) |
832,386 | 149,104 | 279,445 | 244,082 | 159,755 | |||||||||||||||
| Other(7) |
60,680 | 38,137 | 20,995 | 1,548 | — | |||||||||||||||
|
|
|
|
|
|
|
|
|
|
|
|||||||||||
| Total |
$ | 5,825,095 | $ | 483,259 | $ | 2,320,308 | $ | 993,674 | $ | 2,027,854 | ||||||||||
|
|
|
|
|
|
|
|
|
|
|
|||||||||||
| (1) | Net of unamortized original issue discount of $4.4 million. |
| (2) | Primarily for Hawaiian bus operations and equipment for Norwegian Epic. |
| (3) | Primarily for offices, motor vehicles and office equipment. |
| (4) | Contractual obligations for two ships, based on the euro/U.S. dollar exchange rate of 1.4502 as of June 30, 2011. Financing commitments are in place from a syndicate of banks for export credit financing. |
| (5) | Primarily for our usage of a New York City cruise terminal and lslas de la Bahia, Bermuda, New Orleans and Miami port facilities. |
| (6) | Interest includes fixed and variable rates with LIBOR held constant as of June 30, 2011. |
| (7) | Future commitments for service and maintenance contracts and a Charter agreement with an Affiliate. |
Other
Certain of our service providers have required collateral in the normal course of our business including liens on certain of our ships. The amount of collateral may change based on certain terms and conditions. During the year ended December 31, 2010, our service providers released in aggregate $89.3 million of collateral which was included in other long-term assets in our consolidated balance sheet as of December 31, 2009.
As a routine part of our business, depending on market conditions, exchange rates, pricing and our strategy for growth, we regularly consider opportunities to enter into contracts for the building of additional ships. We may also consider the sale of ships, potential acquisitions and strategic alliances. If any of these were to occur, they may be financed through the incurrence of additional permitted indebtedness, through cash flows from operations, or through the issuance of debt, equity or equity-related securities.
Funding sources
Certain of our debt agreements contain covenants that, among other things, require us to maintain minimum liquidity of at least $50 million, an EBITDA-to-debt service ratio of at least 1.25x or minimum liquidity of at least $100 million, and limit our net funded debt-to-capital ratio to no more than 0.70x, as well as maintain certain other ratios and restrict our ability to pay dividends. Our liquidity is calculated by adding our aggregate cash balances and amounts available for drawing for general purposes and which would not, if drawn, be repayable within six months. Our EBITDA-to-debt service ratio is calculated by dividing EBITDA (which is calculated pursuant to the loan agreements) for the past four quarters by the sum of dividends, rent payments on capital leases, interest expense and principal payable on our debt facilities (other than certain prepayments). We believe we were in compliance with these covenants as of June 30, 2011. The specific covenants and related definitions can be found in the applicable debt agreements, which have been previously filed with the Securities and Exchange Commission.
51
Table of Contents
The impact of changes in world economies and especially the global credit markets has created a challenging environment and may reduce future consumer demand for cruises and adversely affect our counterparty credit risks. In the event this environment deteriorates, our business, financial condition and results of operations could be adversely impacted.
We believe our cash on hand, expected future operating cash inflows, additional available borrowings under our existing credit facilities and our ability to issue debt securities or raise additional equity, including capital contributions, will be sufficient to fund operations, debt payment requirements, capital expenditures and maintain compliance with covenants under our debt agreements over the next twelve-month period. There is no assurance that cash flows from operations and additional financings will be available in the future to fund our future obligations.
Proposed Use of Proceeds
We intend to use the net proceeds that we receive to (i) redeem up to $157.5 million in aggregate principal amount of our $450.0 million senior secured notes, (ii) redeem up to $87.5 million in aggregate principal amount of our $250.0 million senior notes, (iii) pay redemption premiums of up to $26.8 million for the senior secured notes and the senior notes, (iv) prepay a portion of the amount outstanding under our $750.0 million senior secured revolving credit facility and (v) pay expenses associated with this offering.
The foregoing represents our current intentions with respect to the use of the net proceeds of this offering based upon our present plans and business conditions and no specific allocation of the net proceeds has yet been determined. Our determination of whether to use all or a portion of the net proceeds to redeem a portion of our $450.0 million senior secured notes and/or our $250.0 million senior notes or to repay a portion of the amount outstanding under our $750.0 million senior secured revolving credit facility will depend on interest rates and the prices at which our $450.0 million senior secured notes and $250.0 million senior notes are being purchased and sold in the market (including relative to the redemption price for such notes) at or following the consummation of this offering.
Qualitative and quantitative disclosures about market risk
General
We are exposed to market risk attributable to changes in interest rates, foreign currency exchange rates and fuel prices. We attempt to minimize these risks through a combination of our normal operating and financing activities and through the use of derivative financial instruments. The financial impacts of these hedging instruments are primarily offset by corresponding changes in the underlying exposures being hedged. We achieve this by closely matching the amount, term and conditions of the derivative instrument with the underlying risk being hedged. We do not hold or issue derivative financial instruments for trading or other speculative purposes. Derivative positions are monitored using techniques including market valuations and sensitivity analyses. We refer you to our consolidated financial statements, Note 6 “Financial Instruments.”
Interest rate risk
From time to time, we consider entering into interest rate swap agreements to modify our exposure to interest rate movements and to manage our interest expense. As of June 30, 2011, 34% of our debt was fixed and 66% was variable. Based on our June 30, 2011 outstanding variable rate debt balance, a one percentage point increase in annual LIBOR interest rates would increase our annual interest expense by approximately $20 million excluding the effects of capitalization of interest.
52
Table of Contents
Foreign currency exchange rate risk
We are exposed to foreign currency exchange rate fluctuations on the U.S. dollar value of our foreign currency denominated forecasted transactions. Our primary exposure to foreign currency exchange rate risk relates to our ship construction firm commitments denominated in euros. We enter into foreign currency forward contracts and/or option contracts to manage the risk related to our ship construction firm commitments.
As of June 30, 2011, we had call options with deferred premiums which resulted in a net asset of $6.8 million. These options hedge the foreign currency exchange rate risk on a portion of the final payments on our ship construction firm commitments. If the spot rate at the date the ships are delivered is less than the strike price under these option contracts we would pay the deferred premium and not exercise the options. As of June 30, 2011, the remaining payments not hedged aggregate €885.4 million, or $1,284.0 million based on the euro/U.S. dollar exchange rate as of June 30, 2011. We estimate that a 10% change in the euro as of June 30, 2010, would result in a $128.4 million change in the U.S. dollar value of the foreign currency denominated remaining payments.
Fuel price risk
Our exposure to market risk for changes in fuel prices relates to the forecasted consumption of fuel on our ships. Fuel expense, as a percentage of our total cruise operating expense, was 16.6% and 15.7% for the six months ended June 30, 2011 and 2010, respectively. From time to time, we use fuel hedging agreements to mitigate the financial impact of fluctuations in fuel prices. As of June 30, 2011, we had hedged approximately 61% of our remaining 2011 projected fuel consumption. We estimate that a 10% increase in our weighted-average fuel price would increase our anticipated 2011 fuel expense by $13.7 million. This increase would be partially offset by an increase in the fair value of our fuel swap agreements of $7.1 million.
Fair value for our derivative contracts is derived using valuation models that utilize the income valuation approach. These valuation models take into account the contract terms such as maturity, as well as other inputs such as fuel types, fuel curves, exchange rates, creditworthiness of the counterparty and the Company, as well as other data points (we refer you to our consolidated financial statements, Note 6 “Financial Instruments”).
Off-balance sheet transactions
None.
53
Table of Contents
Our Company
The Norwegian Cruise Line brand commenced operations out of Miami in 1966.
We are a leading global cruise line operator, offering cruise experiences for travelers with a wide variety of itineraries in North America (including Alaska and Hawaii), the Mediterranean, the Baltic, Central America, Bermuda and the Caribbean. We strive to offer an innovative and differentiated cruise vacation with the goal of providing our customers the highest levels of overall satisfaction on their cruise experience. In turn, we aim to generate the highest customer loyalty and greatest numbers of repeat customers. We created a distinctive style of cruising called “Freestyle Cruising” onboard all of our ships, which we believe provides our passengers with the freedom and flexibility associated with a resort style atmosphere and experience as well as more dining options than a traditional cruise. We established the very first private island developed by a cruise line in the Bahamas with a diverse offering of activities for passengers. After enactment of federal legislation we are the only cruise line operator to offer an entirely inter-island itinerary in Hawaii with our U.S.-flagged ship, Pride of America. This itinerary is unparalleled in the cruise industry, as all other competing cruise lines are registered outside the U.S. and are required to dock at a distant foreign port when providing their customers with a Hawaiian-based cruise itinerary. By providing such a distinctive experience and appealing combination of value and service, we straddle both the contemporary and premium segments. As a result, we have been recognized for our achievements as the recipient of multiple honorary awards mainly consisting of reviews tabulated from the readers of travel periodicals such as Travel Weekly, Condé Nast Traveler, and Travel & Leisure. Our newest ship, Norwegian Epic, was awarded “Gold” in the Contemporary Ship Category as “Best Cruise Ship Overall” by Travel Weekly for the 2010 Magellan Award.
We offer a wide variety of cruises ranging from one day to three weeks. During 2010, we docked at over 125 ports worldwide, with itineraries originating from 17 ports of which 10 are in North America. In line with our strategy of innovation, many of these North American ports are part of our “Homeland Cruising” program in which we have homeports which are close to major population centers, such as New York, Boston and South Florida. This reduces the need for vacationers to fly to distant ports to embark on a cruise and helps reduce our customers’ overall vacation cost. We offer a wide selection of exotic itineraries outside of the traditional cruising markets of the Caribbean and Mexico; these include cruises in Europe, including the Mediterranean and the Baltic, Bermuda, Alaska and the industry’s only entirely inter-island itinerary in Hawaii, with our U.S.-flagged ship, Pride of America.
Our new management team has driven the Company to achieve substantial improvements in operating results and growth in revenue and cash flow generation in a challenging market environment. Since joining the Company in late 2007, our President and Chief Executive Officer, Kevin M. Sheehan, has led a successful turnaround of the Company including overseeing major initiatives such as improving onboard service and amenities across the fleet, expanding the line’s European presence and repositioning two of the line’s Hawaii-based ships, which had a significant impact on the profitability of the business. In addition, we recently appointed Wendy A. Beck as our new Executive Vice President and Chief Financial Officer and augmented our senior management team with five new Senior Vice Presidents in the areas of Sales, Marketing, Hotel Operations and Finance.
We have also successfully restructured our sales organization to provide better coverage of the travel agent community and to capture a greater percentage of direct sales to customers. Through these changes and other initiatives, we have strengthened our brand and significantly enhanced our product offering, reduced operating costs and improved both our sales network and our relationships with our travel agent partners. These organization-wide improvements have enabled us to bolster our brand, attracting and retaining our most loyal and profitable customers and maximizing revenue and profit.
Our fleet of eleven modern ships has been purpose-built to deliver “Freestyle Cruising,” which we believe provides us with a competitive advantage given our consistent “Freestyle Cruising” product offering. By focusing
54
Table of Contents
on “Freestyle Cruising,” we have been able to achieve higher onboard spend levels, greater customer loyalty and the ability to attract a more diverse clientele. At the end of June 2010, we took delivery of our largest cruise ship, Norwegian Epic (4,100 Berths), which represents the next evolution of “Freestyle Cruising,” offering 21 dining options and what we believe to be the widest array of entertainment options at sea. As of June 30, 2011, we have the youngest fleet of cruise ships in the industry among the Major North American Cruise Brands, with a weighted-average age of 6.6 years.
As a result of our positive operating performance over the last three years, the successful launch of Norwegian Epic, the growing demand we see for our distinctive cruise offering, and the rational supply outlook for the industry, we believe that it is an optimal time for the Company to add two new ships to our fleet, in order to continue to grow the Norwegian brand and drive shareholder value. In September 2010, we reached an agreement with Meyer Werft GmbH of Germany to build two new cruise ships for delivery in the second quarter of 2013 and 2014, respectively. Building on the success of Norwegian Epic, we have designed these two new next-generation “Freestyle Cruising” ships to include some of the most popular elements of our recently delivered ships together with new and differentiated features. We have entered into financing arrangements for approximately 90% of the contract price of the two ships. Each ship will approximate 143,500 Gross Tons and 4,000 Berths with an aggregate contract price of the two ships of approximately €1.2 billion, or $1.7 billion, based on the euro/U.S. dollar exchange rate as of June 30, 2011. This is approximately €155,000 per Berth, or $225,000 per Berth based on the euro/U.S. dollar exchange rate as of June 30, 2011.
In January 2008, the Apollo Funds and the TPG Viking Funds acquired 50% of our Company. As part of this investment, the Apollo Funds obtained control of our Board of Directors. The remaining 50% of the Company is owned by Genting HK, a leading Asian cruise and gaming operator.
For the twelve months ended June 30, 2011, we generated total revenue of $2,181.8 million, Net Revenue of $1,611.5 million, net income of $72.2 million and Adjusted EBITDA of $454.9 million and an Adjusted EBITDA margin of 20.8%. For the six months ended June 30, 2011, we generated total revenue of $1,064.1 million, Net Revenue of $786.0 million, net income of $18.6 million, Adjusted EBITDA of $205.4 million and an Adjusted EBITDA margin of 19.3%. For the six months ended June 30, 2010, we generated total revenue of $894.4 million, Net Revenue of $653.8 million, net loss of $31.1 million, Adjusted EBITDA of $155.3 million and an Adjusted EBITDA margin of 17.4%. This represents an increase of 190 basis points in period over period Adjusted EBITDA margin as a result of improved ticket pricing and onboard spending coupled with various business improvement, product enhancement and cost reduction initiatives. We refer you to note 6 of our “Summary Consolidated Financial Data” included elsewhere in this prospectus for a reconciliation of Adjusted EBITDA to net income (loss).
Our operating entities have been aggregated as a single reportable segment based on the similarity of their economic characteristics, as well as products and services provided.
Although we sell cruises on an international basis, our passenger ticket revenue is primarily attributed to passengers who make reservations in North America. For each of the years ended December 31, 2010, 2009 and 2008, revenues attributable to North American passengers were 83%. Substantially all of our long-lived assets are located outside of the U.S. and consist primarily of our ships.
Our Industry
We believe that the cruise industry demonstrates the following positive fundamentals:
Strong Growth with Low Penetration and Significant Upside
Cruising is a vacation alternative with broad appeal, as it offers a wide range of products and services to suit the preferences of vacationing customers of all ages, backgrounds and interests. Since 1980, cruising has been one of the fastest growing segments of the North American vacation market. According to CLIA, in 2010
55
Table of Contents
approximately 15 million passengers took cruises of two consecutive nights or more on CLIA member lines versus 7.2 million passengers in 2000, representing a compound annual growth rate of approximately 8%. Based on CLIA’s research, we believe that cruising is under-penetrated and represents approximately 10% of the North American vacation market. As measured in Berths or room count, the cruise industry is relatively nascent as compared to the wide variety of much more established vacation travel destinations across North America.
According to the Orlando/Orange County Convention & Visitors Bureau and the Las Vegas Convention and Visitors Authority, there are approximately 264,000 rooms in just Orlando and Las Vegas combined. By comparison, the estimated Major North American Cruise Brands’ capacity in terms of Berths is only approximately 224,000. In addition, according to industry research, only 24% of the U.S. population has ever taken a cruise and we believe this percentage should increase. The European vacation market, the fastest growing market globally, remains under-penetrated by the cruise industry, with approximately 1% of Europeans having taken a cruise in a given year, compared with 3% of the population in the U.S. and Canada.
We believe that improving leisure travel trends along with a relatively low supply outlook in the near term from the Major North American Cruise Brands lead to an attractive business environment for our Company to operate in.
Attractive Demographic Trends to Drive Cruising Growth
The cruise market is comprised of a broad spectrum of customers and appeals to virtually all demographic categories. Based on CLIA’s 2008 study, the target North American cruise market, defined as households with income of $40,000 or more headed by a person who is at least 25 years old, is estimated to be 132.9 million people. Also according to the study, the average cruise customer is 50 years old with a household income of $109,000, with 69% of all cruise customers falling between the ages of 40 to 74. We believe this represents a very attractive segment of the population as the Brookings Institution recently reported that over the past decade the 55 to 64 age group was the fastest growing age group in the U.S. It is our belief that “Freestyle Cruising” will help us attract customers not only in the lucrative older population segment of North America, but also with younger generations, as well as Europeans, who we believe are more likely to enjoy greater levels of freedom during their cruise through the “Freestyle Cruising” product offering than was traditionally offered within the cruise industry.
Significant Value Proposition and High Level of Guest Satisfaction
We believe that the cost of a cruise vacation, relative to a comparable land-based resort or hotel vacation in Orlando or Las Vegas, offers an exceptional value proposition. When one considers that a typical cruise, for one all-inclusive price, offers its guests transportation to a variety of destinations, hotel-style accommodations, a generous diversity of food choices and a selection of daily entertainment options, this is compelling support for the cruise value proposition relative to other leisure alternatives. Cruises have become even more affordable for a greater number of North American customers over the past few years through the introduction of “Homeland Cruising”, which eliminates the cost of airfare commonly associated with a vacation.
According to CLIA’s 2011 study, approximately 70% of persons who have taken a cruise rate cruising as a high-value vacation alternative. In this same survey, CLIA reported that approximately 80% of cruise passengers agree that a cruise vacation is a good way to sample various destinations which they may visit again on a land-based vacation.
High Barriers to Entry
The cruise industry is characterized by high barriers to entry, including the existence of several established and recognizable brands, the large expense of building a new, sophisticated cruise ship, the long lead time necessary to construct new ships and limited newbuild shipyard capacity. Based on new ships announced over the past several years, the cost to build a cruise ship can range from approximately $500 million to $1.4 billion
56
Table of Contents
or approximately $200,000 to $425,000 per Berth, depending on the ship’s size and quality of product offering. The construction time of a newbuild ship is typically between 27 months to 36 months and requires significant upfront cash payments to fund construction costs before a dollar of revenue is generated. In addition, the shipbuilding industry is experiencing tightened capacity as the size of ships increases and the industry consolidates, with virtually all new capacity added in the last 20 years having been built by one of three major European shipbuilders.
Segments and Brands
The different cruise lines that make up the global cruise vacation industry have historically been segmented by product offering and service quality into contemporary, premium and luxury brands. The contemporary segment generally includes cruises on larger ships that last seven days or less, provides a casual ambiance and is less expensive on average than the premium or luxury segments. The premium segment is generally characterized by cruises that last from seven to 14 nights with a higher quality product offering than the contemporary segment, appealing to a more affluent demographic. The luxury segment generally offers the highest level of service and quality, with longer cruises on the smallest ships. In classifying our competitors within the Major North American Cruise Brands, the contemporary segment has historically included Carnival Cruise Lines and Royal Caribbean International. The premium segment has historically included Celebrity Cruises, Holland America and Princess Cruises. By providing a diverse set of itineraries and a “Freestyle Cruising” experience, we believe that we straddle both the contemporary and premium segments as well as offer a unique combination of value and leisure services to cruise customers. Based on fleet counts as of December 31, 2010, the Major North American Cruise Brands together represent approximately 90% of the North American cruise market as measured by total Berths.
Our Competitive Strengths
We believe that the following business strengths will enable us to execute our strategy:
Leading Cruise Operator with High-Quality Product Offering
We believe that our modern fleet provides us with operational and strategic advantages as our entire fleet has been purpose-built for “Freestyle Cruising” with a wider range of passenger amenities relative to many of our competitors.
We believe that in recent years the distinction has been blurred between segments of the market historically known as “premium” and “contemporary,” with the Major North American Cruise Brands each offering a wide range of onboard experiences across their respective fleets. With the completion of our fleet renewal initiative, we believe that based on a number of different metrics that directly impact a passenger’s onboard experience, we compare favorably against the other Major North American Cruise Brands, with product attributes more in line with the premium segment.
| • | Youngest Fleet. With a weighted-average age of 6.6 years (as of June 30, 2011) and no ships built before 1998, we have the youngest fleet among the Major North American Cruise Brands, which we believe allows us to offer a high-quality passenger experience with a significant level of consistency across our entire fleet. As a result of our younger fleet, we have a substantially higher percentage of outside balcony cabins across our fleet than the other contemporary brands, which helps drive higher Net Yields. |
| • | Rich Cabin Mix. As of June 30, 2011, 48% of our cabins had private balconies representing a higher mix of outside balcony cabins than the other contemporary brands. In addition, five of our ships offer a complex of private courtyard villas of up to approximately 570 square feet each. Customers staying in these villas are provided with personal butler service and exclusive access to a private courtyard area with private pools, sundeck, hot tubs, and fitness center. Six of our ships also offer luxury garden villas of up to 6,694 square feet, making them the largest accommodations at sea. |
57
Table of Contents
| • | High-Quality Service. We believe we offer a very high level of onboard service, as demonstrated by our guest-to-crew ratio of 2.2 to 1, which is among the best of all the Major North American Cruise Brands. |
| • | Diverse Selection of Premium Itineraries. For the year ended December 31, 2010, approximately 54% of our itineraries, by Capacity Days, were in more exotic, under-penetrated and less traditional locations, including Alaska, Hawaii, Bermuda and Europe, compared to the other contemporary brands which are focused primarily on itineraries in the Caribbean and Mexico. This mix of destinations is more consistent with the brands in the premium segment, and these itineraries typically attract higher Net Yields than Caribbean and Mexico sailings. |
We believe that this high-quality product offering positions us well in comparison to the other Major North American Cruise Brands and provides an opportunity for continued Net Yield growth.
“Freestyle Cruising”
The most important differentiator for our brand is the “Freestyle Cruising” concept onboard all eleven of our ships. The essence of “Freestyle Cruising” is to provide a cruise experience that offers more freedom and flexibility than any other traditional cruise alternative. While many cruise lines have historically required guests to dine at assigned group tables and at specified times, “Freestyle Cruising” offers the flexibility and choice to our passengers who prefer to dine when they want, with whomever they want and without having to dress formally. Additionally, we have increased the number of activities and dining facilities available onboard, allowing passengers to tailor their onboard experience to their own schedules, desires and tastes. The key elements of “Freestyle Cruising” include:
| • | flexible dining policy; no fixed dining times or pre-assigned seating in our dining rooms; |
| • | up to 21 dining options; in addition to multiple main dining rooms, a casual action station buffet and quick service outdoor grill, our ships offer a wide variety of specialty restaurants, with most offering a classic steakhouse, fine French, Japanese teppanyaki, sushi, Italian, Mexican and Asian fusion restaurants, which we believe is the widest selection of full-service dining options among the fleets of the Major North American Cruise Brands; |
| • | resort-casual dress code acceptable throughout the ship at all times; |
| • | increased service staff for a more personalized vacation experience; |
| • | replacement of cash tipping with an automated service charge system; |
| • | diverse “lifestyle” activities, including cultural and educational onboard programs along with an increased adventure emphasis for shore excursions; and |
| • | passenger-friendly disembarkation policies. |
All of our ships have been custom designed and purpose-built for “Freestyle Cruising,” which we believe differentiates us significantly from our major competitors. We further believe that “Freestyle Cruising” attracts a passenger base that prefers the less structured, resort-style experience of our cruises. Building on the success of “Freestyle Cruising,” we implemented across our fleet “Freestyle 2.0” featuring significant enhancements to our onboard product offering. These enhancements include a major investment in the total dining experience; upgrading the stateroom experience across the ship; new wide-ranging onboard activities for all ages; and additional recognition, services and amenities for premium-priced balcony, suite and villa passengers. With Norwegian Epic we have enhanced “Freestyle Cruising” by offering what we believe to be unmatched flexibility in entertainment, offering guests a wide variety of activities and performances to choose from at any time of day or night.
58
Table of Contents
Established Brand Recognition
The Norwegian Cruise Line brand is well established in the cruise industry with a long track record of delivering a world class cruise product offering to its customers. We achieve high-quality feedback scores from our customers in the areas of overall service, physical ship attributes, onboard products and services, food and beverage offerings and overall entertainment and land-based excursion quality. Based on recent guest experience and loyalty reports, the quality of our guests’ experience generates high levels of customer loyalty, as demonstrated by the fact that approximately 30% of our customers are repeat customers and approximately 70% say they would recommend Norwegian Cruise Line to their friends and family.
Brand recognition is also strong with over 92% of cruisers reporting familiarity with Norwegian. Additionally, our brand is known for freedom, flexibility and choice, all highly valued benefits within the cruise industry demographic. We continue to receive industry-wide recognition, winning more than 30 honorary awards during 2008 through 2010 which are reviews tabulated from the readers of Sherman’s Travel, Condé Nast Traveler, Travel & Leisure, AOL Travel and ForbesTraveler.com. Norwegian Epic was awarded Gold in the Contemporary Ship category as “Best Cruise Ship Overall” by Travel Weekly for the 2010 Magellan Award.
Strong Cash Flow
Nearly all of our capital expenditures, other than those related to our newbuild projects (which are substantially financed) and the current renovation of our private island, relate to the maintenance of our young and modern fleet and shoreside operations, which includes investments in our IT infrastructure and business intelligence systems. Our newbuild projects include very attractive financing which will fund approximately 90% of the required pre-delivery and delivery date construction payments; as such, we expect the cost of our newbuild projects to have a minimal impact on our cash flow in the near term.
We are able to generate significant levels of cash flow due to our ability to pre-sell tickets and receive customer deposits with long lead times ahead of sailing. Our debt financing is relatively low cost, with a weighted-average interest rate cost of 6.05% as of June 30, 2011. In addition, we believe that the favorable U.S. federal income tax regime applicable to international shipping income will enhance our cash flow from operations that can be utilized to significantly de-lever our balance sheet over time.
Highly Experienced Management Team
Our senior management team is comprised of experienced executives with an average of 14.8 years in the cruise, travel, leisure and hospitality-related industries. Since the Apollo Funds’ and the TPG Viking Funds’ investment in January 2008, 28 of the top 37 members of our senior management team (including 12 of the top 14) have been newly recruited or promoted to their current position under the leadership of our President and Chief Executive Officer, Kevin M. Sheehan. Their combined experience in related hospitality industries coupled with their financial expertise is a significant contributor to improving the operating and financial performance of our Company.
Strong and Experienced Shareholders
Our shareholders or their affiliates have extensive experience investing in the cruise, leisure and travel-related industries. Affiliates of the Apollo Funds have invested significant equity and resources to the cruise and leisure industry with its investment in Prestige Cruise Holdings, Inc. which operates through two distinct upscale cruise brands, Oceania Cruises and Regent Seven Seas Cruises. In addition, affiliates of both Apollo and TPG Capital own Caesars Entertainment, with whom we have created a marketing alliance. Affiliates of TPG Capital are also significant investors in Sabre Holdings, a leading GDS (global distribution system) and parent of Travelocity.com. Genting HK, headquartered in Hong Kong, operates a leading Asian cruise line with destinations in Malaysia, Singapore, Hong Kong, Taiwan and Japan.
59
Table of Contents
Our Business Strategies
We seek to attract vacationers by offering new products and services and creating differentiated itineraries in new markets through new and existing modern ships with the aim of delivering a better, value-added, vacation experience to our customers relative to other broad-based or land-based leisure alternatives.
Attractive Product Offerings
We have a long history of product development within the cruise industry as one of the most established consumer brands. We became the first cruise operator to buy a private island in the Bahamas to offer a private beach experience to our passengers; and we were the first to introduce a 2,000-Berth megaship into the Caribbean market in 1980. More recently, we pioneered new concepts in cruising over the last decade with the development of “Homeland Cruising” and the launch of “Freestyle Cruising.”
We continue to enhance our product offerings with the delivery of Norwegian Epic in June 2010, which offers 21 dining options, a diverse range of accommodations and what we believe is the widest array of entertainment at sea. In addition to several differentiated full-service complimentary dining rooms, Norwegian Epic also features specialty restaurants including a classic steakhouse, sushi, Japanese teppanyaki, Brazilian churrascaria, Asian noodle bar, traditional Chinese, fine French and Italian restaurants. Guest accommodations on Norwegian Epic include the groundbreaking Studios, 128 cabins designed for solo travelers centered around the Studio Lounge, a private two-story lounge for studio guests. On its top decks, Norwegian Epic offers a “ship within a ship” in the largest suite complex at sea; the exclusive Villas compound includes two decks with 52 villas and penthouses, a private pool with multiple hot tubs and sundecks, a private fitness center and steam rooms, fine dining in the Epic Club restaurant, casual outdoor dining at the Courtyard Grill, and 24-hour concierge service, all exclusively for villa and penthouse guests. Entertainment onboard Norwegian Epic includes a wide variety of branded entertainment for guests to choose from, including exclusive engagements with Blue Man Group, Cirque Dreams & Dinner, Legends in Concert, Nickelodeon and the improvisational comedy troupe, The Second City.
Building on the success of Norwegian Epic, we are drawing on our legacy of new product development to create two new next-generation “Freestyle Cruising” ships, scheduled for delivery in the second quarter of 2013 and 2014, respectively. These 4,000 Berth ships will include many of the most popular elements of Norwegian Epic and the rest of our fleet together with new groundbreaking features, while keeping the consistent innovative spirit of “Freestyle Cruising” in the core of the design.
Maximize Net Yields
We are focused on growing our revenue through various initiatives aimed at increasing our ticket prices and occupancy as well as onboard spending to drive higher overall Net Yields. To maximize passenger ticket revenue, our revenue management strategy is focused on optimizing pricing and generating demand throughout the booking curve. We base-load our capacity by booking passengers as early before sailing as possible and through methods outside of traditional sales channels, allowing our sales force to focus its efforts on more targeted business objectives.
60
Table of Contents
Base-loading is a strategy by which we focus on selling inventory further from the cruise departure date by targeting sales and marketing tactics, such as full ship Charters and corporate meetings which generate business with longer booking windows. Our base-loading strategy also includes strategic relationships with travel agencies and international tour operators, who commit to purchasing a certain level of inventory with long lead times. Through base-loading, we believe we will increase our Net Yields by filling our ships earlier, rather than discounting close to sailing dates in order to achieve our targeted Load Factors. Our specific initiatives to achieve this include:
| • | Casino Player Strategy. As part of this strategy, we have non-exclusive arrangements with approximately 90 casino partners worldwide including Caesars Entertainment, which is owned by affiliates of both Apollo and TPG Capital, whereby loyal gaming customers are offered cruise reward certificates redeemable for cruises on our ships. Through property sponsored events and joint marketing programs, we have the opportunity to market cruises to Caesars Entertainment’s customers. These arrangements with our casino partners have the dual benefit of filling open inventory and reaching customers expected to generate above average onboard revenue through the casino and other onboard spending. |
| • | Strategic Relationships. Our base-loading strategy also includes strategic relationships with travel agencies and international tour operators, who commit to purchasing a certain level of inventory with long lead times. |
| • | CM&I Sales. We are increasing our focus on driving additional business through the CM&I channel, which typically books very far in advance and can represent a significant portion of the ship, or even an entire sailing, in one transaction. |
| • | PROS Yield Management System. In late 2009, we implemented the PROS yield management system which allows us to better analyze and maximize our overall pricing decisions. |
We continue to focus on various initiatives to drive increased onboard revenue across a variety of areas. From the year ended December 31, 2007 to the twelve months ended June 30, 2011, our net onboard and other revenue yield increased by approximately 25% from $42.86 to $53.49 primarily due to strong performance in casino, beverage sales, specialty dining and shore excursions. Our strategy for further driving increased onboard revenue includes, among other things, generating additional casino revenue through our arrangements with our casino partners, including Caesars Entertainment and Genting HK. These arrangements incorporate marketing resources to deliver cross-company advertising and marketing campaigns to promote our brand. We also focus on optimizing the utilization of our specialty restaurants that carry a cover charge, pre-booking and pre-selling additional onboard activities and encouraging our staff to offer our passengers additional revenue generating products and services. In addition, the delivery of Norwegian Epic has created additional onboard revenue opportunities through ticket sales and merchandising, based on our unique and premium entertainment offerings.
Brand Expansion Through Disciplined Newbuild Program
In September 2010, we reached an agreement with Meyer Werft GmbH of Papenburg, Germany to build two new cruise ships with financing commitments in place from a syndicate of banks for export credit financing. The new ships are scheduled for delivery in the second quarter of 2013 and 2014, respectively. Building on the success of Norwegian Epic, we have designed these two new next-generation “Freestyle Cruising” ships to include some of the most popular elements of our most recently delivered ships together with new and differentiated features, consistent with Norwegian Cruise Line’s legacy of new product development in the cruise industry. We believe that these ships will allow us to continue to expand the reach of our brand while driving shareholder value. Our financing arrangements provide for financing for approximately 90% of the contract price of the two ships. Each ship will approximate 143,500 Gross Tons and 4,000 Berths with an aggregate contract price of approximately €1.2 billion, or $1.7 billion based on the euro/U.S. dollar exchange rate as of June 30, 2011. This is approximately €155,000 per Berth, or $225,000 per Berth based on the euro/U.S. dollar exchange rate as of June 30, 2011, which we believe compares favorably against other recent newbuild ship orders in the industry.
61
Table of Contents
Improve Operating Efficiency and Lower Costs
We are continually focused on driving financial improvement through a variety of cost savings initiatives. These initiatives are focused on reducing costs while at the same time improving the overall product we deliver to our customers. Since the beginning of 2008, we have significantly reduced our operating cost base through various programs including contract renegotiations, overhead rationalization, and fuel consumption reduction initiatives. We also typically hedge a majority of our near term fuel consumption in order to provide greater visibility of our fuel expense; as of June 30, 2011, we had hedged approximately 61% of our remaining 2011 projected fuel consumption. We have also reduced our maintenance expense as a result of our fleet renewal program, as younger, more modern ships are typically less costly to maintain than older ships. Beginning in early 2008, we reduced our capacity in the Hawaii market, re-flagging and relocating two of three ships, which significantly reduced crew payroll expenses aboard those ships creating substantial margin expansion. In addition, we expect the economies of scale from our two newbuild ships to drive further operating efficiencies over the long term.
Expand and Strengthen Our Product Distribution Channels
As part of our growth strategy, we are continually looking for ways to deepen and expand our customer sales channels. We restructured our sales and marketing organization, which included the hiring of two Senior Vice Presidents and five Vice Presidents, to provide better focus on distribution through four primary channels: retail/travel agent, direct, international, and CM&I.
| • | Retail/Travel Agent. We have implemented close to 100 individual projects specifically designed to improve our efficiency with the travel agency channels and our guests, ranging from more timely commission payments to aggressive call center quality monitoring. We also restructured our travel agent sales force, allowing us to more effectively support the larger accounts, which represent approximately 50% of our customers, with specific expertise and also gain access to a significantly larger number of travel partners through an outbound call center based in our Miami headquarters. We believe that our travel agent partners have witnessed a material improvement in our business practices and overall communication since the arrival of our new management team. |
| • | Direct. We continue to grow our direct business through investments in our brand and our website as well as increasing our direct sales force. Passengers booking directly with us tend to book earlier and in premium category inventory which provides higher Net Yields. |
| • | International. We have an international sales presence, with over 145 people in Europe and representatives covering Latin America, Australia and Asia. We are primarily focused on increasing our business in the European market, which has grown significantly in recent years but remains under-penetrated. In Europe, we now offer local itineraries year-round and our “Freestyle Cruising” has been well received. We are in the process of expanding our direct sales force in Europe which will allow us to develop our direct distribution in Europe in a manner similar to our U.S. operation. In support of this European strategy, we deployed our newest and most sophisticated ship, Norwegian Epic, in Europe for an extended summer season which began in May 2011. We are forging a closer distribution partnership with Genting HK, to develop product distribution across the Asia Pacific region. |
| • | CM&I. Our CM&I business focuses on full ship Charters as well as corporate meeting and incentive travel. These sales often have very long lead times and generate a higher level of Net Yield than sales through our other channels. |
Across every distribution channel we are undertaking a major effort to grow demand with a targeted sales and marketing program for our premium stateroom categories, including our balcony and other premium stateroom categories, with a particular emphasis on our suites and villa complexes, which have increased as a percentage of our total inventory as a result of our fleet renewal.
62
Table of Contents
Our Fleet
Our ships are purpose-built ships that enable us to provide our customers with the ultimate “Freestyle Cruising” experience. Our ships have state-of-the-art passenger amenities, including up to 21 dining options together with hundreds of private balcony cabins on each ship. As of June 30, 2011, 48% of our cabins have private balconies representing a higher mix of outside cabins than the other contemporary brands. Private balcony cabins are very popular with passengers and offer the opportunity for increased revenue by allowing us to charge a premium. Five of our ships offer a complex of private courtyard villas, each with up to approximately 570 square feet, which provide personal butler service and exclusive access to a private courtyard area with private pools, sundeck, hot tubs, and fitness center. In addition, six of our ships have luxury garden villas with up to 6,694 square feet, making them the largest accommodations at sea. These luxury garden villas offer three separate bedroom areas, spacious living and dining room areas, as well as 24-hour, on-call butler and concierge service.
Continuing our tradition of new product development and the extension of the Norwegian Cruise Line brand, we took delivery of Norwegian Epic in June 2010. Norwegian Epic offers our passengers itineraries to the western and eastern Caribbean as well as Europe. The ship offers our customers a large aqua park, sports complex, two three-lane bowling alleys and our two-story Wii™ Wall. In addition, the ship features a spa facility and fitness center with more than 31,000 square feet. There are 21 dining options on Norwegian Epic offering one of the widest choices of dining experiences among the fleets of the Major North American Cruise Brands. Exclusive entertainment is offered aboard Norwegian Epic with the addition of brand new entertainment choices including Blue Man Group, Cirque Dreams & Dinner, Legends in Concert and Nickelodeon. We offer world-class entertainment in our jazz and blues club and our comedy club features the improvisational comedy troupe, The Second City. Norwegian Epic has been very well received by the market with the strongest bookings we have ever seen for a new ship, both in terms of price and volume. This positive reception has also benefited the rest of our fleet, which experienced significant bookings due to the uplift that Norwegian Epic has created for our brand overall. We believe the premium cabin mix of Norwegian Epic will drive further increases in Net Yield.
As further described in “—Our Business Strategies—Brand Expansion Through Disciplined Newbuild Program,” building on the successful launch of Norwegian Epic, we recently announced two new ships with approximately 4,000 Berths each, scheduled for delivery in the second quarter of 2013 and 2014, respectively.
The table below provides a brief description of our ships and areas of operation based on 2011 itineraries:
| Ship(1) |
Year Built | Berths | Gross Tons | Primary Areas of Operation | ||||||||||
| Norwegian Epic |
2010 | 4,100 | 155,900 | Caribbean and Europe | ||||||||||
| Norwegian Gem |
2007 | 2,400 | 93,500 | Bahamas, Bermuda and Caribbean | ||||||||||
| Norwegian Jade |
2006 | 2,400 | 93,600 | Europe | ||||||||||
| Norwegian Pearl |
2006 | 2,400 | 93,500 | Alaska, Caribbean, Pacific Coastal and Panama Canal | ||||||||||
| Norwegian Jewel |
2005 | 2,380 | 93,500 | Bahamas and Caribbean | ||||||||||
| Pride of America |
2005 | 2,140 | 80,400 | Hawaii | ||||||||||
| Norwegian Dawn |
2002 | 2,220 | 92,300 | Bermuda, Caribbean, Canada and New England | ||||||||||
| Norwegian Star |
2001 | 2,340 | 91,700 | Alaska, Mexico, Pacific Coastal and Panama Canal | ||||||||||
| Norwegian Sun |
2001 | 1,940 | 78,300 | Bahamas, Caribbean and Europe | ||||||||||
| Norwegian Sky(2) |
1999 | 1,990 | 77,100 | Bahamas | ||||||||||
| Norwegian Spirit |
1998 | 2,000 | 75,300 | Caribbean and Bermuda | ||||||||||
| (1) | The table does not contain the two new ships which are to be constructed by the Meyer Werft GmbH shipyard for delivery in the second quarter of 2013 and 2014, respectively. Each ship will approximate 4,000 Berths and 143,500 Gross Tons. |
| (2) | Chartered from Genting HK. |
63
Table of Contents
Itineraries
We offer cruise itineraries ranging from one day to three weeks calling on over 125 worldwide locations, including destinations in the Caribbean, Bermuda, the Bahamas, Mexico, Alaska, Europe, Hawaii, New England, Central America, North Africa and Scandinavia. We have developed, and are continuing to develop, innovative itineraries to position our ships in new and niche markets as well as in the mainstream markets throughout the Americas and Europe. For the year ended December 31, 2010, approximately 54% of our itineraries, by Capacity Days, were in more exotic, under-penetrated and less traditional locations (areas outside of the Caribbean and Bahamas) which we believe allows us to generate higher Net Yield.
Ports and Facilities
We have an agreement with the Government of Bermuda whereby two of our ships are permitted weekly calls in Bermuda through 2018 from Boston, Baltimore, Charleston and New York. In addition, we own a private island in the Bahamas, Great Stirrup Cay, which we utilize as a port-of-call on some of our itineraries. We have a contract with the New York City Economic Development Corporation pursuant to which we receive preferential berthing rights on specific piers at the city’s passenger ship Terminals. These preferential berthing rights provide us with the ability to elect specific Terminals, piers, and operating days 15 months in advance of such scheduled future sailings. Furthermore, we have contracts with the Port of New Orleans and the Port of Miami pursuant to which we receive preferential berths to the exclusion of other vessels for certain specified days of the week at the cities’ cruise ship Terminals. The preferential berthing rights provide us with priority use of selected cruise ship Terminals and operating days 12 months in advance of such scheduled future sailings. We have a concession permit with the U.S. National Park Service whereby our ships are permitted to call on Glacier Bay 22 times through September 30, 2019 during each summer cruise season. At present, we do not intend to acquire any port facilities. We believe that our facilities are adequate for our current needs, and that we are capable of obtaining additional facilities as necessary. In 2009, we initiated a $25 million renovation to our private island, Great Stirrup Cay, which includes a new dining and bar facility to enhance the guest experience, as well as offering new activities such as wave runners, an aqua park and a stingray encounter experience. The enhancements are scheduled to be completed in phases through the end of 2011 and are expected to provide us with additional revenue generating opportunities on the island.
Revenue Management Practices
Our cruise ticket prices generally include cruise fare and a wide variety of onboard activities and amenities, including meals and entertainment. In some instances, cruise ticket prices include round-trip airfare to and from the port of embarkation. Prices vary depending on the particular cruise itinerary, cabin category selected and the time of year that the voyage takes place. We generate additional revenue from casino operations, certain beverage sales, specialty dining, shore excursions, gift shop purchases, spa services and other similar items.
Ticket Revenue
We base our ticket pricing and revenue management on a strategy that encourages travelers to book early and secure attractive savings. This is accomplished through a revenue management system designed to maximize Net Yield by matching projected availability to anticipated future passenger demand. We perform extensive analyses of our databases in order to determine booking history and trends by sailing, cabin category, travel partner, market segment, itinerary and distribution channel. In addition, we establish a set of cabin categories throughout each cruise ship and price our cruise fares on the basis of these cabin categories. Typically, the initial published fares are established 18 or more months in advance of the departure of a cruise at a level which, under normal circumstances, would provide a high occupancy. If the rate at which cabin inventory is sold differs from expectations, we will raise or lower the prices of each cabin category accordingly. This can be done through promotions, special rate codes, opening and closing categories, or price changes. Our revenue management tool, which is typical of what is used by our major competitors in North America, tracks and forecasts overall booking demand and provides optimal pricing and selling limit recommendations on a daily basis. The system allows us
64
Table of Contents
to better optimize our booking curve and shorten the time to implement pricing decisions, and is designed to optimize revenue for the full range of cabin categories, thereby reducing the need for last minute discounting to fill ships.
Onboard and Other Revenue
Ticket prices typically include cruise accommodation, meals in certain dining facilities and many onboard activities such as entertainment, pool-side activities and various sports programs. We earn additional revenue on our ships principally from casino operations, certain beverage sales, specialty dining, shore excursions, gift shop purchases, spa services and other similar items. Onboard and other revenue is an important component of our revenue base representing 30.8% of our 2010 total revenue. To maximize onboard revenue, we use various cross-marketing and promotional tools and are supported by point-of-sale systems permitting “cashless” transactions for the sale of these onboard products and services. Food and beverage, gaming and shore excursions are managed directly by the Company while retail shops, spa services, art auctions and internet services are managed through contracts with third-party concessionaires. These contracts generally entitle us to a fixed percentage of the gross sales derived from these concessions.
Seasonality
The seasonality of the North American cruise industry generally results in the greatest demand for cruises during the summer months. This predictable seasonality in demand has resulted in fluctuations in our revenue and results of operations. The seasonality of our results is increased due to ships being taken out of service for regularly scheduled Dry-docks, which we typically schedule during non-peak demand periods.
Sales and Marketing
Product Distribution Channels and Sales
We sell our product through four primary distribution channels: retail/travel agent, consumer direct, international and CM&I.
The retail/travel agent channel represents the majority of our ticket sales. Passengers utilizing this channel book their cruises through independent travel agents who sell our itineraries on a non-exclusive, commission-based basis. Given the importance of the retail/travel agent channel, a major focus of our marketing strategy is motivating and supporting our travel agent partners. Our travel partner base is comprised of an extensive network of approximately 20,000 independent travel agencies including brick and mortar, internet-based and home-based operators located in North America, South America, Europe, Asia and Australia.
We implemented dozens of projects specifically designed to improve efficiency with our travel partners and guests, ranging from more timely commission payments to aggressive call center quality monitoring. We also restructured our travel agent sales force, allowing us to more effectively support the larger accounts with specific expertise and also gain access to a significantly larger number of travel partners through an outbound call center.
In addition to our focus on retail sales, we continue to grow our consumer direct business through investments in our brand and our website as well as increases in our direct sales force. Passengers booking directly with us tend to book earlier and in higher category inventory.
Outside of the U.S., we have an international sales presence with over 145 people in Europe and representatives covering Latin America, Australia and Asia. We are primarily focused on increasing our business in the United Kingdom and Continental Europe markets, which have grown significantly in recent years and where we now offer local itineraries year-round. We have modified our 2010 itineraries to increase demand by appealing to guests in different markets including the UK, Italy, Germany and Spain. We have had success with our base-loading initiatives in Europe, where our “Freestyle Cruising” has been well received, and are in the process of building our direct sales force in Europe.
65
Table of Contents
Finally, our CM&I business focuses on full ship Charters as well as corporate meeting and incentive travel. These sales often have very long lead times and generate a higher level of Net Yield than sales through our other channels.
Across all channels, we are also undertaking a major effort to grow demand with a targeted sales and marketing program for our premium stateroom categories, including our suites and villa complexes, which have increased significantly as a percentage of our total inventory as a result of our fleet renewal.
Supporting our sales efforts across several distribution channels are our call centers located in Florida, Arizona, the UK and Germany with approximately 650 personnel oriented towards servicing travel agents and direct customer calls. Additionally, we have an outsourced relationship with a firm that manages an additional location for us in Guatemala. We believe that our diverse locations should minimize risks associated with natural disasters, labor markets and other factors which could impact the operation of our call centers.
Marketing, Brand Communications and Advertising
Our marketing department works to enhance our brand awareness and increase levels of engagement and understanding of our product and services among consumers, trade and travel partners. Core areas within the department include brand strategy, advertising and media, marketing communications, direct marketing, customer loyalty, website/interactive and market research. All marketing supports our comprehensive brand platform created expressly to leverage our unique “Freestyle Cruising” concept. Our brand campaign started in late 2006 and has been successful in differentiating us from our competitors. The media mix has included television, print, radio, digital, e-mail and direct mail. We also introduced a new component to our travel partner marketing, NCL University online, which is an informative travel partner education program.
We have made significant progress in expanding our marketing reach with our online products and services. Our website, www.ncl.com, serving both our passengers and travel agency partners, has been a major focus of this momentum. We are continually enhancing our website to ensure that it communicates our brand promise, promotes relevant product information and aligns with our “Freestyle Cruising” message. Our consumer and travel agency partner booking engine provides passengers and travel agency partners the ability to shop and purchase any of our worldwide cruise itineraries with a more intuitive and informative online experience. We continue to develop additional functionality and tools to serve our passengers and travel agency partners.
Sustainable customer loyalty of our past passengers is an important element of our marketing strategy. We believe that attending to our past passengers’ needs and motivations creates a cost-effective means of attracting business, particularly to our new itineraries, because past passengers are familiar with our brands, products and services and often return to our ships. The Norwegian Cruise Line loyalty program is known as Latitudes. Members of this program receive periodic mailings with informative destination information and cruise promotions that include special pricing, shipboard credits, cabin upgrades and onboard recognition. Avid cruisers can use our co-branded credit card to earn upgrades and discounts.
Customer feedback and research is also a critically important element in the development of our overall marketing and business strategies. In 2008, we instituted a process for measuring and understanding key drivers of customer loyalty and satisfaction from our passengers that provides valuable insights into the cruise experience. We regularly initiate custom research studies among both consumers and travel partners to assess the impact of various programs and/or to solicit feedback that inform future direction.
Ship Operations and Cruise Infrastructure
Ship Maintenance
In addition to routine maintenance and repairs performed on an ongoing basis and in accordance with applicable requirements, each of our ships is generally taken out of service, approximately every 24 to 60 months, for a period of one or more weeks for scheduled maintenance work, repairs and improvements
66
Table of Contents
performed in Dry-dock. Dry-dock duration is a statutory requirement controlled under the chapters of SOLAS and to some extent the International Load Lines Convention. Under these regulations, it is required that a passenger ship Dry-dock twice in 5 years and the maximum duration between each Dry-dock cannot exceed 3 years. However, most of our ships qualify under a special exemption provided by the Bahamas (flag state) after meeting certain criteria set forth by the Bahamas to Dry-dock once in every 5 years. To the extent practical, each ship’s crew, catering and hotel staff remain with the ship during the Dry-dock period and assist in performing maintenance and repair work. We do not earn revenue while ships are Dry-docked. Accordingly, Dry-dock work is typically performed during non-peak demand periods to minimize the adverse effect on revenue that results from ships being out of service. Dry-docks are typically scheduled in spring or autumn and depend on shipyard availability.
Suppliers
Our largest capital expenditures are for ship construction and acquisition. Our largest operating expenditures are for fuel, passenger food and beverage, travel agent services and advertising and marketing. Most of the supplies that we require are available from numerous sources at competitive prices. In addition, owing to the large quantities that we purchase, we can obtain favorable prices for many of our supplies. Our purchases are denominated primarily in U.S. dollars. Payment terms granted by the suppliers are generally customary terms for the cruise industry.
Crew and Passenger Safety
We place the utmost importance on the safety of our passengers and crew. We conduct an ongoing safety campaign, with the objective of training ship personnel to enhance their awareness of safety practices and policies onboard.
Our fleet is equipped with modern navigational control and fire prevention and control systems. In recent years, our ships have continuously been upgraded and include internal and external regulatory audits. We have installed HI-FOG sprinklers in the engine rooms of the ships in our fleet, as required by the IMO regulation. The navigation centers on our ships are also equipped with voyage data recorders (“VDRs”), which are similar in concept to the black boxes used in commercial aircraft. The VDRs permit us to analyze safety incidents. A majority of our ships utilize operational closed circuit television systems that enhance our training, assist in investigations and support the safety of passengers and crew.
We have developed the Safety and Environmental Management System (“SEMS”). This advanced, intranet-based system establishes the policies, procedures, training, qualification, quality, compliance, audit, and self-improvement standards for all employees, both shipboard and shoreside. It also provides real-time reports and information to support the fleet and risk management decisions. Through this system, our senior managers, as well as ship management, can focus on consistent, high quality operation of the fleet. The SEMS is approved and audited annually by our classification society Det Norske Veritas (DNV), and the system also undergoes regular internal audits as well as an annual audit by the U.S. Coast Guard. We screen and train our crew to ensure crew familiarity and proficiency with the safety equipment onboard. Various safety measures have been implemented on all of our ships and additional personnel have been appointed in our ship operations departments. We believe that we are in substantial compliance with current health and safety rules and regulations. However, such laws are constantly evolving and there can be no guarantee that changes in these laws and regulations or their enforcement will not require significant additional costs in the future.
Insurance
We maintain marine insurance on the hull and machinery of our ships, which are maintained in amounts related to the estimated market value of each ship. The coverage for each of the hull and machinery policies is maintained with syndicates of insurance underwriters from the European and U.S. insurance markets.
67
Table of Contents
In addition to the marine insurance coverage on the hull and machinery of our ships discussed above, we seek to maintain comprehensive insurance coverage at commercially reasonable rates and believe that our current coverage is adequate to protect against most of the accident-related risks involved in the conduct of our business. We carry:
| • | protection and indemnity insurance (that covers third-party liabilities) including insurance against risk of fuel spill; |
| • | hull and machinery insurance, war risk insurance, including terrorist risk insurance, on each ship in an amount equal to the total insured hull value, subject to certain coverage limits, deductibles and exclusions. The terms of our marine war risk policies include provisions where underwriters can give seven days notice to the insured that the policies will be cancelled, which is typical for policies in the marine industry; |
| • | tour operator insurance; |
| • | insurance for cash onboard; and |
| • | insurance for our shoreside property and general liability risks. |
We believe that all of our insurance coverage, including those noted above, is subject to market-standard limitations, exclusions and deductible levels.
The Athens Convention Relating to the Carriage of Passengers and Their Luggage by Sea (1974) (the “Athens Convention”) and the Protocol to the Athens Convention Relating to the Carriage of Passengers and Their Luggage by Sea (1976) (the “1976 Protocol”) are generally applicable to passenger ships. The U.S. has not ratified the Athens Convention; however, with limited exceptions, the 1976 Protocol to the Athens Convention may be contractually enforced with respect to cruises that do not call at a U.S. port. The International Maritime Organization Diplomatic Conference agreed to a new protocol to the Athens Convention on November 1, 2002 (the “2002 Protocol”). The 2002 Protocol, which has not yet entered into force, establishes for the first time a level of compulsory insurance which must be maintained by passenger ship operators with a right of direct action against the insurer. The timing of the entry into force of the 2002 Protocol, if achieved at all, is unknown. No assurance can be given that affordable and secure insurance markets will be available to provide the level and type of coverage required under the 2002 Protocol. If the 2002 Protocol enters into force, we expect insurance costs would increase.
Trademarks
We own a number of registered trademarks relating to, among other things, the names “NORWEGIAN CRUISE LINE,” “NCL” and the NCL logo, the names of our ships (except where trademark applications for these have been filed and are pending), incentive programs and specialty services rendered on our ships. In addition, we own registered trademarks relating to the “FREESTYLE” family of names, including, “FREESTYLE CRUISING,” “FREESTYLE DINING” and “FREESTYLE VACATION.” Other significant marks include our SCHOOL OF FISH DESIGN marks that display one fish swimming against a school of fish and “NCL” slogan marks, e.g., “NCL. WHERE YOU’RE FREE TO WHATEVER,” which underscore our “FREESTYLE” message. We believe our “NORWEGIAN CRUISE LINE,” “NCL,” “FREESTYLE CRUISING,” “FREESTYLE DINING,” “FREESTYLE VACATION” and “NCL” slogan trademarks and the names of our ships as well as the SCHOOL OF FISH DESIGN and NCL logos are widely recognized throughout North America and Europe and have considerable value.
Competition
We compete in the multi-night global cruise vacation industry. Although this sector has grown significantly over the past decade, it still remains a relatively small part of the broadly defined global vacation market that has historically been dominated by land-based vacation alternatives. The different cruise brands that make up the
68
Table of Contents
global cruise vacation industry historically have been segmented by product offering and service quality into contemporary, premium and luxury cruises. The contemporary segment generally includes cruises on larger ships that last seven days or less, provides a casual ambiance and is less expensive than the premium or luxury segments. The premium segment generally is characterized by cruises that last from seven to 14 nights with a higher quality product offering than the contemporary segment, appealing to a more affluent demographic. The luxury segment generally offers the highest level of services and quality with longer cruises on the smallest ships.
We compete primarily with the other Major North American Cruise Brands, which together comprise approximately 90% of the North American cruise market as measured by total Berths. These brands include Carnival Cruise Lines and Royal Caribbean International which comprise the contemporary segment and Holland America, Princess Cruises and Celebrity Cruises which are part of the premium segment. As of December 31, 2010, Norwegian Cruise Line accounted for approximately 12% of the Major North American Cruise Brands’ capacity in terms of Berths. We compete against all of these operators principally on the quality of our ships, our differentiated product offering, selection of our itineraries and value proposition of our cruises.
We also face competition from non-cruise vacation alternatives, including beach resorts, golf and tennis resorts, theme parks, land-based gaming operations, and other hotels and tourist destinations.
Regulatory Issues
Registration of Our Ships
Ten of the ships that we currently operate are registered in the Bahamas. One of our ships, Pride of America, is a U.S.-flagged ship. Our ships registered in the Bahamas are inspected at least annually pursuant to Bahamian requirements. Our U.S.-registered ship is subject to laws and regulations of the U.S. federal government and to various U.S. federal regulatory agencies, including, but not limited to, the U.S. Public Health Service and the U.S. Coast Guard. Our U.S.-flagged ship is also regulated by the Food and Drug Administration (“FDA”) and U.S. Department of Labor.
Our entire fleet is also subject to the health and safety laws and regulations of the various port locales where the ships dock. The U.S. and the Bahamas are members of the IMO and have adopted and implemented the IMO conventions relating to ocean-going passenger ships. U.S. law generally requires ships transporting passengers exclusively between and among ports in the U.S. to be built entirely in the U.S., documented under U.S. law, crewed by Americans and owned by entities that are at least 75% owned and controlled by U.S. citizens. We have been granted specific authority to operate in and among the islands of Hawaii under legislation, known as the “Hawaii Cruise Ship Provision,” which was part of the “Consolidated Appropriations Resolution, 2003” enacted in 2003 (Public Law 108-7, Division B, Title II, General Provisions—Department of Commerce, Section 211 (February 20, 2003) (117 Stat. 11,79)). The Hawaii Cruise Ship Provision permitted two partially completed ships (originally contracted for construction in a U.S. shipyard by an unrelated party), to be completed in a shipyard outside of the U.S. and documented under the U.S. flag even if the owner does not meet the 75% U.S. ownership requirement, provided that the direct owning entity is organized under the laws of the U.S. and meets certain U.S. citizen officer and director requirements. Presently, only one of the two ships completed in compliance with the Hawaii Cruise Ship Provision, Pride of America, operates as a U.S.-flagged ship. The other, Pride of Hawai’i, was transferred to the Bahamas registry and operates as Norwegian Jade. The Hawaii Cruise Ship Provision also authorized the re-documentation under the U.S. flag of one additional foreign-built cruise ship for operation between U.S. ports in the islands of Hawaii, Pride of Aloha. In May 2008, Pride of Aloha was transferred to the Bahamas registry and operates as Norwegian Sky. The Hawaii Cruise Ship Provision imposes certain requirements, including that any non-warranty work be performed in the U.S., except in case of emergency or lack of availability, and that the ship operates primarily between and among the islands of Hawaii. As a result of this exemption, our U.S.-flagged ship deployed in Hawaii is able to cruise between U.S. ports in Hawaii without the need to call at a foreign port.
69
Table of Contents
Health and Environment
Our various ports of call subject our ships to international and U.S. laws and regulations relating to environmental protection, including but not limited to MARPOL. Under such laws and regulations, we are prohibited from, among other things, discharging certain materials, such as petrochemicals and plastics, into the waterways. Specifically, in the U.S., we comply with the newly implemented U.S. Environmental Protection Agency’s Vessel General Discharge permit.
Also in the U.S., we must meet the U.S. Public Health Service’s requirements, including ratings by inspectors from the Centers for Disease Control and Prevention (“CDC”) and the FDA. We believe we rate at the top of the range of CDC and FDA scores achieved by the major cruise lines. In addition, the cruise industry and the U.S. Public Health Service have agreed on regulations for food, water and hygiene to assist cruise lines in achieving the highest health and sanitation standards on cruise ships.
Furthermore, Norwegian Cruise Line is certified under the International Organization for Standardization’s ISO 14001 Standard. This voluntary standard sets requirements for establishment and implementation of a comprehensive environmental management system which we have adopted for our operations. Currently we operate under an Environmental Management Plan that is incorporated into the SEMS program.
Pursuant to FMC and U.S. Coast Guard regulations, we have covered our financial responsibility with respect to death or injury to passengers and water pollution by providing required guarantees from our insurers with respect to such potential liabilities. This includes obtaining Certificates of Financial Responsibility required by the U.S. Coast Guard relating to our ability to satisfy liabilities in cases of water pollution.
Permits for Glacier Bay, Alaska
In connection with certain of our Alaska cruise operations, we rely on concession permits from the U.S. National Park Service to operate our ships in Glacier Bay National Park and Preserve. We currently hold a concession permit allowing for 22 calls per summer cruising season through September 30, 2019. However, there can be no assurance that such permit will be renewed when necessary or that regulations relating to the renewal of such permit will remain unchanged in the future.
Security and Safety
Commencing July 1, 1998, pursuant to provisions adopted by the IMO, all cruise ships were required to be certified as having safety procedures that comply with the requirements of the International Management Code for the Safe Operation of Ships and for Pollution Prevention (“ISM Code”). We have obtained certificates certifying that our ships are in compliance with the ISM Code. Each such certificate is granted for a five-year period and is subject to periodic verification.
We believe that our ships currently comply with all requirements of the IMO and the U.S. and Bahamian flags, including but not limited to SOLAS, MARPOL and STCW. The SOLAS requirements are amended and extended by the IMO from time to time. For example, the International Port and Ship Facility Code (“ISPS Code”), was adopted by the IMO in December 2002 and provides for measures strengthening maritime security and places new requirements on governments, port authorities and shipping companies in relation to security issues on ships and in ports. We comply with the ISPS Code.
In addition to the requirements of the ISPS Code, the U.S. Congress enacted the Maritime Transportation Security Act of 2002 (“MTSA”), which implements a number of security measures at ports in the U.S. including measures that apply to ships registered outside the U.S. docking at ports in the U.S. The U.S. Coast Guard has published MTSA regulations that require a security plan for every ship entering the territorial waters of the U.S., provide for identification requirements for ships entering such waters and establish various procedures for the
70
Table of Contents
identification of crew members on such ships. Our fleet is in compliance with the requirements imposed upon it by the MTSA and the U.S. Coast Guard regulations. The Transportation Workers Identification Credential (“TWIC”) is a new federal requirement for accessibility into and onto U.S. ports and U.S.-flagged ships. We are in compliance with this requirement.
Amendments to SOLAS required that ships constructed in accordance with pre-1974 SOLAS requirements install automatic sprinkler systems by December 31, 2005. Failure to comply with the SOLAS requirements with respect to any ship will, among other things, restrict the operations of such ship in the U.S. and many other jurisdictions. We are in compliance with these requirements.
IMO adopted an amendment to SOLAS which requires partial bulkheads on cabin balconies to be of non-combustible construction. Existing ships are required to comply with this SOLAS amendment by the first statutory survey after July 1, 2008. All of our ships are in compliance with the SOLAS amendment. The new SOLAS regulation on Long-Range Identification and Tracking (LRIT) entered into force on January 1, 2008. This allows SOLAS contracting governments a year to set up and test the LRIT system and ship operators a year to start fitting the necessary equipment or upgrading so that their ships can transmit LRIT information. Ships constructed on or after December 31, 2008 must be fitted with a system to automatically transmit the identity of the ship, the position of the ship (latitude and longitude) and the date and time of the position. Ships constructed before December 31, 2008 must be fitted with the equipment not later than the first survey of the radio installation after December 31, 2008. We are in compliance with these requirements.
Financial Requirements
The FMC requires evidence of financial responsibility for those offering transportation on passenger ships operating out of U.S. ports to indemnify passengers in the event of non-performance of the transportation. Accordingly, we are required to maintain a $15.0 million third-party performance guarantee on our behalf in respect of liabilities for non-performance of transportation and other obligations to passengers. Proposed regulations would revise the financial requirements with respect to both death/injury and non-performance coverages. Also, we have a legal requirement for us to maintain a security guarantee based on cruise business originated from the United Kingdom and have a bond with the Association of British Travel Agents currently valued at British Pound Sterling 2.1 million. We also are required to establish financial responsibility by other jurisdictions to meet liability in the event of non-performance of our obligations to passengers from those jurisdictions.
From time to time, various other regulatory and legislative changes have been or may in the future be proposed that may have an effect on our operations in the U.S. and the cruise industry in general.
Taxation of the Company
Taxation of Operating Income: In General
This discussion is based on the Internal Revenue Code of 1986, as amended (the “Code”), existing final and temporary regulations thereunder, and current administrative rulings and court decisions, all as in effect on the date of this registration statement and all of which are subject to change, possibly with retroactive effect. Changes in these authorities may cause the tax consequences to vary substantially from the consequences described below. The following discussion does not purport to be a comprehensive description of all of the U.S. federal income tax considerations applicable to us.
Unless exempt from U.S. federal income taxation, a foreign corporation is subject to U.S. federal income tax in respect of any income that is derived from the use of vessels, from the hiring or leasing of vessels for use on a time, voyage or bareboat charter basis or from the performance of services directly related to those uses, collectively referred to as “shipping income,” to the extent that the shipping income is derived from sources within the U.S.
71
Table of Contents
For these purposes, shipping income attributable to transportation that begins or ends, but that does not both begin and end, in the U.S., which we refer to as U.S. source international shipping income, will be considered to be 50% derived from sources within the U.S.
The legislative history of the transportation income source rules suggests that a cruise that begins and ends in a U.S. port, but that calls on one or more foreign ports, will derive U.S.-source income only from the first and last legs of such cruise. However, since there are no U.S. Treasury Regulations or other IRS guidance with respect to these rules, the applicability of the transportation income source rules described above is not free from doubt.
No portion of shipping income attributable to transportation exclusively between non-U.S. ports will be considered to be derived from sources within the U.S. Such shipping income will not be subject to any U.S. federal income tax. Shipping income attributable to transportation exclusively between U.S. ports will be considered to be 100% derived from U.S. sources.
Unless exempt from tax under Section 883 of the Code, (i) any U.S. sourced shipping income or any other income that is considered to be effectively connected with the conduct of a U.S. trade or business (“effectively connected income”) (as discussed below under “—Taxation in Absence of Section 883 Exemption”) would be subject to federal corporate income taxation on a net basis (generally at a 35% rate) and state and local taxes, and our effectively connected earnings and profits may also be subject to an additional branch profits tax of 30% (the “net tax regime”) and (ii) if not considered to be effectively connected income, any U.S. source income would be subject to a 4% tax on gross income provided under Section 887 of the Code (the “4% regime”).
The U.S.-source portion of our income that is not shipping income (including our U.S.-flagged operations) is generally subject to the net tax regime. U.S. Treasury Regulations list several items of income which are not considered to be incidental to the international operation of ships and, to the extent derived from U.S. sources, are subject to U.S. federal income taxes. Income items considered non-incidental to the international operation of ships include income from the sale of single-day cruises, shore excursions, air and other transportation, and pre- and post-cruise land packages. We believe that substantially all of our income currently derived from the international operation of ships is shipping income.
Exemption of Operating Income from U.S. Federal Income Taxation
Under Section 883 of the Code and the related regulations, a foreign corporation will be exempt from U.S. federal income taxation on its U.S. source international shipping income if: (a) it is organized in a qualified foreign country, which is one that grants an “equivalent exemption” from tax to corporations organized in the U.S. in respect of each category of shipping income for which exemption is being claimed under Section 883 of the Code, and to which we refer as the “Country of Organization Test”; and (b) either: (1) more than 50% of the value of its stock is beneficially owned, directly or indirectly, by qualified shareholders, which includes individuals who are “residents” of a qualified foreign country, to which we refer as the “50% Ownership Test”; (2) one or more classes of its stock representing, in the aggregate, more than 50% of the combined voting power and value of all classes of its stock are “primarily and regularly traded on one or more established securities markets” in a qualified foreign country or in the U.S. (and certain exceptions do not apply), to which we refer as the “Publicly Traded Test”; or (3) it is a “controlled foreign corporation” and it satisfies an ownership test, to which, collectively, we refer as the “CFC Test.” In addition, U.S. Treasury Regulations require a foreign corporation and certain of its direct and indirect shareholders to satisfy detailed substantiation and reporting requirements.
Bermuda, the jurisdiction where we are incorporated, has been officially recognized by the IRS as a qualified foreign country that currently grants the requisite equivalent exemption from tax in respect of each category of shipping income we expect to earn in the future. Therefore, we will satisfy the Country of Organization Test and will likely be exempt from U.S. federal income taxation with respect to our U.S. source international shipping income if we are able to satisfy any one of the 50% Ownership Test, the Publicly Traded Test or the CFC Test.
72
Table of Contents
The regulations under Section 883 of the Code provide, in pertinent part, that a corporation will meet the Publicly Traded Test if one or more classes of stock of a foreign corporation representing, in the aggregate, more than 50% of the combined voting power and value of all classes of stock are “primarily and regularly traded on one or more established securities markets” in a qualified foreign country or in the U.S. A class of stock will be considered to be “primarily traded” on an established securities market in a country if the number of shares of such class of stock that are traded during any taxable year on all established securities markets in that country exceeds the number of shares of such stock that are traded during that year on established securities markets in any other single country.
Under the regulations, a class of stock will be considered to be “regularly traded” on an established securities market if (a) such class of stock is listed on such market, (b) such class of stock is traded on such market, other than in minimal quantities, on at least 60 days during the taxable year or one sixth of the days in a short taxable year, and (c) the aggregate number of shares of such class of stock traded on such market during the taxable year is at least 10% of the average number of shares of such class of stock outstanding during such year, or as appropriately adjusted in the case of a short taxable year. The regulations provide that the trading frequency and trading volume tests will be deemed satisfied if a class of stock is traded on an established securities market in the U.S. and is regularly quoted by dealers making a market in such stock.
The regulations provide, in pertinent part, that a class of stock will not be considered to be “regularly traded” on an established securities market for any taxable year in which 50% or more of the outstanding shares of such class of stock are owned on more than half the days during the taxable year by persons who each own 5% or more of the outstanding shares of such class of stock, to which we refer as the “Five Percent Override Rule.” The “Five Percent Override Rule” will not apply if we can substantiate that the number of our ordinary shares owned for more than half of the number of days in the taxable year (1) directly or indirectly applying attribution rules, by our “qualified shareholders”, and (2) by our non-5% shareholders, is greater than 50% of our outstanding ordinary shares. Qualified shareholders include (1) individuals who are residents of countries that grant an equivalent exemption; (2) foreign corporations that meet the Publicly Traded Test and are organized in countries that grant an equivalent exemption; and (3) certain foreign governments, not-for-profit organizations, and certain beneficiaries of foreign pension funds. U.S individuals and U.S. domestic corporations are not qualified shareholders.
Since we expect that our ordinary shares will be traded on the NASDAQ Global Select Market, which is considered to be an established securities market, we expect that our ordinary shares will be deemed to be “primarily traded” on an established securities market. Furthermore, we believe we will meet the trading volume requirements described previously because the pertinent regulations provide that trading volume requirements will be deemed to be met with respect to a class of equity traded on an established securities market in the U.S., where, as we expect will be the case for our ordinary shares, the class of equity is regularly quoted by dealers who regularly and actively make offers, purchases and sales of such equity to unrelated persons in the ordinary course of business.
As of the consummation of this offering, our direct 5% shareholders will own more than 50% of our ordinary shares. Nevertheless, we believe, and have obtained the required substantiation supporting such belief, that the number of our ordinary shares owned by our non-5% shareholders and our qualified shareholders is greater than 50% of our total outstanding ordinary shares. Based on the foregoing, we believe that our ordinary shares will be considered to be “primarily and regularly traded on an established securities market” and that we and each of our corporate subsidiaries in which we own more than 50% of the value of the outstanding stock and that is organized in a qualifying foreign country will therefore qualify for the Section 883 tax exemption. However, there are factual circumstances beyond our control, including changes in the direct and indirect owners of our shares or the status of certain or our qualified shareholders, which could cause us or our subsidiaries to lose the benefit of this tax exemption. Therefore, we can give no assurance in this regard. Should any of the facts described above cease to be correct or the direct or indirect ownership of our shares changes, our and our subsidiaries’ ability to qualify for the Section 883 tax exemption will be compromised. Also, it should be noted that Section 883 of the Code has been the subject of legislative modifications in past years that have had the
73
Table of Contents
effect of limiting its availability to certain taxpayers, and there can be no assurance that future legislation will not preclude us from obtaining the benefits of Section 883 of the Code.
In addition, because we are relying on the substantial ownership by non-5% shareholders in order to satisfy the regularly traded test, there is the potential that if another shareholder becomes a 5% shareholder our qualification under the Publicly Traded Test could be jeopardized. If we were to fail to satisfy the Publicly Traded Test, we would be subject to U.S. income tax on income associated with our cruise operations in the U.S. Therefore, as a precautionary matter, we have provided protections in our bye-laws to reduce the risk of the Five Percent Override Rule applying. In this regard, our bye-laws will provide that no one person or group of related persons, other than the Apollo Funds, the TPG Viking Funds and Genting HK, may own, or be deemed to own by virtue of the attribution provisions of the Code, more than 4.9% of our ordinary shares, whether measured by vote, value or number, unless such ownership is approved by our Board of Directors. In addition, any person or group of related persons that own 3% or more (or a lower percentage if required by the U.S. Treasury Regulations under the Code) of our ordinary shares will be required to meet certain notice requirements as provided for in the company bye-laws. Our bye-laws generally will restrict the transfer of any of our ordinary shares if such transfer would cause us to be subject to U.S. shipping income tax. In general, detailed attribution rules, that treat a shareholder as owning shares that are owned by another person, are applied in determining whether a person is a 5% shareholder.
For purposes of the 4.9% limit, a “transfer” will include any sale, transfer, gift, assignment, devise or other disposition, whether voluntary or involuntary, whether of record, constructively or beneficially, and whether by operation of law or otherwise. The 4.9% limit does not apply to the Apollo Funds, the TPG Viking Funds or Genting HK. These shareholders will be permitted to transfer their shares without complying with the limit subject to certain restrictions. See “Certain Relationships and Related Party Transactions—The Shareholders’ Agreement.”
Our bye-laws will provide that our Board of Directors may waive the 4.9% limit or transfer restrictions, in any specific instance. Our Board of Directors may also terminate the limit and transfer restrictions generally at any time for any reason. If a purported transfer or other event results in the ownership of ordinary shares by any shareholder in violation of the 4.9% limit, or causes us to be subject to U.S. income tax on shipping operations, such ordinary shares in excess of the 4.9% limit, or which would cause us to be subject to U.S. shipping income tax will automatically be designated as “excess shares” to the extent necessary to ensure that the purported transfer or other event does not result in ownership of ordinary shares in violation of the 4.9% limit or cause us to become subject to U.S. income tax on shipping operations, and any proposed transfer that would result in such an event would be void. Any purported transferee or other purported holder of excess shares will be required to give us written notice of a purported transfer or other event that would result in excess shares. The purported transferee or holders of such excess shares shall have no rights in such excess shares, other than a right to the payments described below.
Excess shares will not be treasury shares but rather will continue to be issued and outstanding ordinary shares. While outstanding, excess shares will be transferred to a trust. The trustee of such trust will be appointed by us and will be independent of us and the purported holder of the excess shares. The beneficiary of such trust will be one or more charitable organizations selected by the trustee. The trustee will be entitled to vote the excess shares on behalf of the beneficiary. If, after a purported transfer or other event resulting in excess shares and prior to the discovery by us of such transfer or other event, dividends or distributions are paid with respect to such excess shares, such dividends or distributions will be immediately due and payable to the trustee for payment to the charitable beneficiary. All dividends received or other income declared by the trust will be paid to the charitable beneficiary. Upon our liquidation, dissolution or winding up, the purported transferee or other purported holder will receive a payment that reflects a price per share for such excess shares generally equal to the lesser of:
| • | the amount per share of any distribution made upon such liquidation, dissolution or winding up, and |
74
Table of Contents
| • | in the case of excess shares resulting from a purported transfer, the price per share paid in the transaction that created such excess shares, or, in the case of certain other events, the market price per share for the excess shares on the date of such event, or in the case of excess shares resulting from an event other than a purported transfer, the market price for the excess shares on the date of such event. |
At the direction of our Board of Directors, the trustee will transfer the excess shares held in trust to a person or persons, including us, whose ownership of such excess shares will not violate the 4.9% limit or otherwise cause us to become subject to U.S. shipping income tax within 180 days after the later of the transfer or other event that resulted in such excess shares or we become aware of such transfer or event. If such a transfer is made, the interest of the charitable beneficiary will terminate, the designation of such shares as excess shares will cease and the purported holder of the excess shares will receive the payment described below. The purported transferee or holder of the excess shares will receive a payment that reflects a price per share for such excess shares equal to the lesser of:
| • | the price per share received by the trustee, and |
| • | the price per share such purported transferee or holder paid in the purported transfer that resulted in the excess shares, or, if the purported transferee or holder did not give value for such excess shares, through a gift, devise or other event, a price per share equal to the market price on the date of the purported transfer or other event that resulted in the excess shares. |
A purported transferee or holder of the excess shares will not be permitted to receive an amount that reflects any appreciation in the excess shares during the period that such excess shares were outstanding. Any amount received in excess of the amount permitted to be received by the purported transferee or holder of the excess shares must be turned over to the charitable beneficiary of the trust. If the foregoing restrictions are determined to be void or invalid by virtue of any legal decision, statute, rule or regulation, then the intended transferee or holder of any excess shares may be deemed, at our option, to have acted as an agent on our behalf in acquiring or holding such excess shares and to hold such excess shares on our behalf.
We will have the right to purchase any excess shares held by the trust for a period of 90 days from the later of:
| • | the date the transfer or other event resulting in excess shares has occurred, and |
| • | the date our Board of Directors determines in good faith that a transfer or other event resulting in excess shares has occurred. |
The price per excess share to be paid by us will be equal to the lesser of:
| • | the price per share paid in the transaction that created such excess shares, or, in the case of certain other events, the market price per share for the excess shares on the date of such event, or |
| • | the lowest market price for the excess shares at any time after their designation as excess shares and prior to the date we accept such offer. |
These provisions in our bye-laws could have the effect of delaying, deferring or preventing a change in our control or other transaction in which our shareholders might receive a premium for their ordinary shares over the then-prevailing market price or which such holders might believe to be otherwise in their best interest. Our Board of Directors may determine, in its sole discretion, to terminate the 4.9% limit and the transfer restrictions of these provisions. While both the mandatory offer protection and 4.9% protection remain in place, no third party other than the Apollo Funds, the TPG Viking Funds or Genting HK will be able to acquire control of Norwegian Cruise Line Holdings Ltd.
75
Table of Contents
Taxation in Absence of Section 883 Exemption
If we do not qualify for exemption under Section 883 of the Code as described above, (i) any U.S. sourced shipping income or any other income that is effectively connected income (as described below) would be subject to the net tax regime and (ii) if not considered to be effectively connected income, any U.S. source income would be subject to the 4% regime.
Our U.S. source international shipping income would be considered effectively connected income only if we have, or are considered to have, a fixed place of business in the U.S. involved in the earning of U.S. source international shipping income, and substantially all of our U.S. source international shipping income is attributable to regularly scheduled transportation, such as the operation of a vessel that follows a published schedule with repeated sailings at regular intervals between the same points for voyages that begin or end in the U.S.
U.S. Taxation of Gain on Sale of Vessels
Provided we and our subsidiaries qualify for exemption from tax under Section 883 of the Code in respect of our shipping income, gain from the sale of a vessel likewise should generally be exempt from tax under Section 883 of the Code. If, however, our gain does not, for whatever reason, qualify for exemption under Section 883 of the Code, then such gain could be subject to either the net tax regime or 4% regime (determined under rules different from those discussed above).
Certain State, Local and Non-U.S. Tax Matters. We may be subject to state, local and non-U.S. income or non-income taxes in various jurisdictions, including those in which we transact business, own property or reside. We may be required to file tax returns in some or all of those jurisdictions. Our state, local or non-U.S. tax treatment may not conform to the U.S. federal income tax treatment discussed above. We may be required to pay non-U.S. taxes on dispositions of foreign property or operations involving foreign property may give rise to non-U.S. income or other tax liabilities in amounts that could be substantial.
The various tax regimes to which we are currently subject result in a relatively low effective tax rate on our world-wide income. These tax regimes, however, are subject to change possibly with retroactive effect. Moreover, we may become subject to new tax regimes and may be unable to take advantage of favorable tax provisions afforded by current or future law.
U.S. Federal Income Taxation—U.S.-flagged Operation.
Through December 15, 2009, when our U.S.-flagged operation was held in a corporation, income derived from our U.S.-flagged operation generally was subject to U.S. federal and state income taxation at combined graduated rates of up to 39%, after an allowance for deductions. U.S.-source dividends and interest paid by NCL America generally would have been subject to a 30% withholding tax, unless exempt under one of various exceptions. Since the conversion of the U.S. corporate entity to a partnership, 100% of such income has been subject to the net tax regime.
76
Table of Contents
Organizational Structure
Following the consummation of this offering, our corporate structure will be as follows(1):
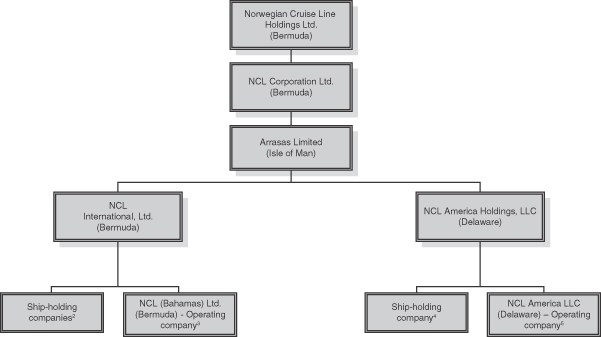
| (1) | All subsidiaries are 100% owned by their immediate parent company. |
| (2) | Ship-holding companies for our Bahamas-flagged ships. |
| (3) | Operates our Bahamas-flagged fleet, including a Charter agreement with Genting HK, and performs under contract with NCL America LLC certain marketing, ticket issuance and other services. |
| (4) | Ship-holding company for our U.S.-flagged ship. |
| (5) | Operates our U.S.-flagged ship. |
Employees
The following table shows the divisional allocation of our employees.
| As of December 31, | ||||||||||||
| 2010 | 2009 | 2008 | ||||||||||
| Shipboard(1) |
11,850 | 10,149 | 11,125 | |||||||||
| Shoreside |
1,919 | 1,758 | 1,842 | |||||||||
|
|
|
|
|
|
|
|||||||
| Total |
13,769 | 11,907 | 12,967 | |||||||||
|
|
|
|
|
|
|
|||||||
| (1) | Does not include crew members that were on leave as of the respective dates. |
Also, we refer you to “Risk Factors—Risks Related to Our Business—Amendments to the collective bargaining agreements for crew members of our fleet could have an adverse impact on our financial condition and results of operations” for more information regarding our relationships with union employees and our collective bargaining agreements that are currently in place.
77
Table of Contents
Property and Equipment
Information about our ships, including their size and primary areas of operation, estimated expenditures and financing may be found under “Business—Our Fleet” and “Management’s Discussion and Analysis of Financial Condition and Results of Operations—Liquidity and capital resources.” Information about environmental regulations and issues that may affect our utilization and operation of cruise ships may be found under “Business—Regulatory Issues—Health and Environment.” For information regarding encumbrances on our ships, see “Description of Certain Indebtedness.”
Our principal executive offices are located at 7665 Corporate Center Drive, Miami, Florida, where we lease approximately 230,300 square feet of facilities. We also lease approximately (i) 24,300 square feet of office space in Sunrise, Florida for sales; (ii) 25,600 square feet of office space in Hawaii for administrative operations of NCL America and Polynesian Adventure Tours; (iii) 9,600 square feet of office space in London, England for sales and marketing in the United Kingdom and Ireland; (iv) 11,000 square feet of office space in Germany for sales and marketing in Europe; and (v) 20,000 square feet of office space in Phoenix, Arizona for a call center. In addition, we own a private island in the Bahamas, Great Stirrup Cay, which we utilize as a port-of-call on some of our itineraries. We believe that our facilities are adequate for our current needs, and that we are capable of obtaining additional facilities as necessary.
Legal Proceedings
In May 2008, we were served with a complaint in the Circuit Court of Miami-Dade County, Florida, by a former shipboard concessionaire for fraudulent inducement, equitable or promissory estoppel and breach of contract in connection with the termination of a shipboard concessionaire agreement. We believe that we have meritorious defenses to these claims and, accordingly, are vigorously defending this action and are not able at this time to estimate the impact of these proceedings.
In July 2009, a class action complaint was filed against NCL (Bahamas) Ltd. in the United States District Court, Southern District of Florida on behalf of a purported class of crew members alleging inappropriate deductions of their wages pursuant to the Seaman’s Wage Act and wrongful termination resulting in a loss of retirement benefits. On December 30, 2010, the Court denied the plaintiffs’ Motion for Class Certification. On February 16, 2011, the plaintiffs filed a Motion for Reconsideration as to the Court’s Order on Class Certification which was denied. The individual plaintiffs’ claims remain and, accordingly, we are vigorously defending this action and are not able at this time to estimate the impact of these proceedings.
In May 2011, a class action complaint was filed against NCL (Bahamas) Ltd. in the United States District Court, Southern District of Florida on behalf of a purported class of crew members alleging inappropriate deductions of their wages pursuant to the Seaman’s Wage Act and Breach of Contract. We are vigorously defending this action and are not able at this time to estimate the impact of these proceedings.
In the normal course of our business, various other claims and lawsuits have been filed or are pending against us. Most of these claims and lawsuits are covered by insurance and, accordingly, the maximum amount of our liability is typically limited to our deductible amount. Nonetheless, the ultimate outcome of these claims and lawsuits that are not covered by insurance cannot be determined at this time. We have evaluated our overall exposure with respect to all of our threatened and pending litigation and, to the extent required, we have accrued amounts for all estimable probable losses associated with our deemed exposure. We are currently unable to estimate any other potential contingent losses beyond those accrued, as discovery is not complete nor is adequate information available to estimate such range of loss or potential recovery. We intend to vigorously defend our legal position on all claims and, to the extent necessary, seek recovery.
78
Table of Contents
Our business and affairs are managed by our Board of Directors which will consist as of the closing of this offering of nine members.
The following table sets forth certain information regarding our directors, executive officers and key employees as of October 21, 2011. Such persons presently serve in their capacities at NCL Corporation Ltd., but upon completion of this offering, they will serve in the same capacities at the Issuer.
| Name |
Age |
Position | ||
| Tan Sri Lim Kok Thay |
60 | Chairman of our Board of Directors | ||
| David Chua Ming Huat |
49 | Director | ||
| Marc J. Rowan |
49 | Director | ||
| Steve Martinez |
42 |
Director | ||
| Adam M. Aron |
57 | Director | ||
| Walter L. Revell |
76 |
Director, Chairman of the Audit Committee | ||
| Karl Peterson |
40 |
Director | ||
| Kevin M. Sheehan |
58 | President and Chief Executive Officer | ||
| Wendy A. Beck |
47 | Executive Vice President and Chief Financial Officer | ||
| Andrew Stuart |
48 | Executive Vice President, Global Sales and Passenger Services | ||
| Daniel S. Farkas |
42 |
Senior Vice President, General Counsel and Secretary | ||
| Maria Miller |
55 | Senior Vice President, Marketing | ||
| Robert Becker |
51 | Senior Vice President, Consumer Research |
All the executive officers and key employees listed above hold their offices at the pleasure of our Board of Directors, subject to rights under any applicable employment agreements. There are no family relationships between or among any directors and executive officers. Upon the consummation of this offering, the members and the operation of our Board of Directors will be controlled by certain of our shareholders as described in “Certain Relationships and Related Party Transactions—The Shareholders’ Agreement.” Currently, our Board of Directors consists of the seven members identified above. Certain of our shareholders have a contractual right under the Shareholders’ Agreement to appoint two additional members, in the aggregate, to our Board of Directors prior to the consummation of this offering, which will increase the size of our Board of Directors to nine members. See “Certain Relationships and Related Party Transactions—The Shareholders’ Agreement.”
Tan Sri Lim Kok Thay became the Chairman of our Board of Directors of the Company on December 16, 2003. Since 2007, Tan Sri Lim has been Chairman and Chief Executive of Genting Berhad, a company listed on Bursa Malaysia Securities Berhad. Genting Berhad is an investment holding company and is principally involved, through its subsidiaries and associated companies, in leisure and hospitality; gaming and entertainment businesses; plantations; property development and management; tours and travel-related services; investments; generation and supply of electric power and oil and gas exploration activities. Since 2006, 2008 and 2005, respectively, Tan Sri Lim has also been Chairman and Chief Executive of Genting Malaysia Berhad, the Chief Executive of Genting Plantations Berhad, both of which are publicly listed companies in Malaysia, and the Executive Chairman of Genting Singapore PLC, a public company listed on the Singapore Stock Exchange. Genting Malaysia, Genting Plantations, and Genting Singapore are subsidiaries of Genting Berhad. Since 1990, Tan Sri Lim has been a director of Golden Hope Limited (acting as trustee of the Golden Hope Unit Trust) which is the principal shareholder of Genting HK; he is also the Chairman and Chief Executive Officer of Genting HK, where he focuses on long-term policies and new shipbuildings. Tan Sri Lim has been with Genting HK since its formation in 1993. Tan Sri Lim was also involved in the development of Resorts World Genting in Malaysia, formerly known as Genting Highlands Resort, and the overall concept and development of the Burswood Resort in Perth, Australia and the Adelaide Casino in South Australia. Tan Sri Lim graduated with a Bachelor of Science (Civil Engineering) degree from the University of London in 1975 and attended the Program for Management
79
Table of Contents
Development at the Harvard Graduate School of Business in 1979. Tan Sri Lim has over 30 years of experience investing in, managing and/or serving on the boards of directors of companies operating in the travel and leisure industries and has served as chairman of board of directors of several entities. In light of our ownership structure and Tan Sri Lim’s position with Genting HK and his experience, we believe that it is appropriate for Tan Sri Lim to serve as Chairman of our Board of Directors of the Company.
David Chua Ming Huat became a director of the Company in 2008. He has served as President of Genting HK since May 2007. Prior to that time, he was the Chief Operating Officer of Genting Berhad from September 2006 to February 2007. Before that he held key management positions in various international securities companies in Malaysia, Singapore and Hong Kong with extensive knowledge in the management of securities/futures/derivatives trading, asset and unit trusts management, corporate finance and corporate advisory business. He was a director and member of the Listing Committee of the MESDAQ market of Bursa Malaysia Securities Berhad from April 1998 to May 2002. He possesses a Bachelor of Arts degree in Political Science and Economics from the Carleton University, Ottawa, Canada. Mr. Chua has over 15 years of management experience in a diverse range of industries with particular emphasis in securities trading and investments, corporate finance and corporate advisory work and has significant experience in serving on boards of directors. In light of our ownership structure and Mr. Chua’s position with Genting HK and his business experience, we believe that it is appropriate for Mr. Chua to serve as a director of the Company.
Marc J. Rowan became a director of the Company in January 2008. Mr. Rowan co-founded Apollo in 1990 and has been a Senior Managing Director of Apollo Global Management, LLC since 2007. In addition, Mr. Rowan currently serves on the boards of directors of the general partner of AP Alternative Assets, L.P., Apollo Global Management, LLC, Athene Re, Countrywide plc and Caesars Entertainment Corporation, as well as on the boards of certain other Apollo entities. He has previously served on the boards of directors of AMC Entertainment, Inc., Culligan Water Technologies, Inc., Furniture Brands International, Mobile Satellite Ventures, LLC, National Cinemedia, Inc., National Financial Partners, Inc., New World Communications, Inc., Quality Distribution, Inc., Samsonite Corporation, SkyTerra Communications Inc., Unity Media SCA, Vail Resorts, Inc. and Wyndham International, Inc. Mr. Rowan is also active in charitable activities. He is a founding member and serves on the executive committee of the Youth Renewal Fund and is a member of the boards of directors of the National Jewish Outreach Program and the Undergraduate Executive Board of the University of Pennsylvania’s Wharton School of Business. Mr. Rowan graduated summa cum laude from the University of Pennsylvania’s Wharton School of Business with a BS and an MBA in Finance. Mr. Rowan has over 20 years of experience in the private equity industry, has focused on the analysis, assessment and capitalization of new acquisitions and existing portfolio companies and has significant experience in serving on boards of directors. In light of our ownership structure and Mr. Rowan’s position with Apollo and his business experience, we believe that it is appropriate for Mr. Rowan to serve as a director of the Company.
Steve Martinez became a director of the Company in January 2008. Mr. Martinez has been a partner of Apollo since 2007. Mr. Martinez currently serves on the board of directors of Prestige Cruise Holdings, Inc., an upscale cruise line operating the Oceania and Regent Seven Seas brands; the parent company of Rexnord Industries, a diversified manufacturer of engineered products; Principal Maritime, an ocean transportation services company; Veritable Maritime, an owner of crude oil tankers; and Hughes Telematics, an information services company. He has previously served on the boards of directors of Allied Waste Industries, Goodman Global, Jacuzzi Brands and Hayes-Lemmerz International. Mr. Martinez is also active in charitable activities, and currently serves as Co-Chairman of the Northeast Advisory Board of the Hispanic Scholarship Fund. Prior to joining Apollo, Mr. Martinez was a member of the mergers and acquisitions department of Goldman, Sachs & Co. with responsibilities in merger structure negotiation and financing. Before that he worked at Bain & Company Tokyo advising U.S. corporations on corporate strategies in Japan. Mr. Martinez received a Master’s of Business Administration from the Harvard Business School and a Bachelor of Arts and Bachelor of Science from the University of Pennsylvania and the Wharton School of Business, respectively. Mr. Martinez has over 15 years of experience in analyzing and investing in public and private companies and has significant experience in serving on boards of directors. Mr. Martinez participated in the diligence of the Apollo Funds’ investment in the
80
Table of Contents
Company and provides our Board of Directors with insight into strategic and financial matters of interest to the Company’s management and shareholders. In light of our ownership structure and Mr. Martinez’ position with Apollo and his business experience, we believe that it is appropriate for Mr. Martinez to serve as a director of the Company.
Adam M. Aron became a director of the Company in January 2008. Since 2006, he has been Chairman and CEO of World Leisure Partners, Inc., a personal consultancy for matters related to travel and tourism and high-end real estate development and which acts in partnership with Apollo. Mr. Aron has previously served as President and CEO of Norwegian Cruise Line, from 1993 to 1996, Senior Vice President of Marketing for United Airlines, from 1990 to 1993, Senior Vice President-Marketing for Hyatt Hotels Corporation, from 1987 to 1990, and most recently as Chairman of the Board and Chief Executive Officer of Vail Resorts, Inc., from 1996 to 2006. Mr. Aron currently serves on the board of directors of Cap Juluca Properties Ltd., E-miles, Inc., Starwood Hotels and Resorts Worldwide and Prestige Cruise Holdings, Inc., the parent company of Oceania Cruises, Inc. and Regent Seven Seas Cruises. He is a member of the Council on Foreign Relations, and is a former member of the Young Presidents’ Organization, Business Executives for National Security; the former First Vice Chairman of the Travel Industry Association of America; and Vice Chairman of the National Finance Committee of the Democratic Senatorial Campaign Committee for the 2008 election cycle. Mr. Aron was selected by the U.S. Secretary of Defense to participate in the Joint Civilian Orientation Conference in 2004, was appointed by the U.S. Secretary of Agriculture to serve on the board of directors of the National Forest Foundation from 2000 through 2006, and was a delegate to President Clinton’s 1995 White House Conference on Travel and Tourism. Mr. Aron received a Master’s of Business Administration degree with distinction from the Harvard Business School and a Bachelor of Science Cum Laude from Harvard College. Mr. Aron has 32 years of experience managing companies operating in the travel and leisure industries and provides our Board of Directors with, among other skills, valuable insight and perspective on the travel and leisure operations of the Company. In light of Mr. Aron’s business experience, we believe that it is appropriate for Mr. Aron to serve as a director of the Company.
Walter L. Revell became a director of the Company and Chairman of the Audit Committee in June 2005, having served as a director of Kloster Cruise Line and other predecessor companies since 1993. Since 1984, Mr. Revell has been Chairman of the Board and Chief Executive Officer of Revell Investments International, Inc., a diversified investment, development and management company located in Coral Gables, Florida. Since 1994, 2002 and 1990, respectively, Mr. Revell has also served as a director of The St. Joe Company, a publicly traded company that is Florida’s largest private land owner and a major real estate developer, as a director of International Finance Bank in Miami, Florida and as a director of Edd Helms Group in Miami, Florida. Since 1990, he has also served as Chairman of the Board and Chief Executive Officer of Pinehurst Development, Inc., a family owned company, and serves on the Executive Committee, the Board of Trustees and as Chairman of the Construction Committee of the Miami Science Museum. He formerly was a director of Calpine Corporation, Dycom Industries, Rinker Materials and Sun Banks of Florida. Mr. Revell served as Secretary of Transportation for the State of Florida in the Askew Administration. He is a past Chairman of the Florida Chamber of Commerce and has been a member of The Florida Council of 100 since 1972. He served as Chairman and CEO of H.J. Ross Associates, Inc., consulting engineers, planners and scientists, and continues as Senior Advisor to T.Y. Lin International, the new parent company, in San Francisco. Mr. Revell has 40 years of business experience investing and operating in a diverse range of industries and has significant experience serving on boards of directors. In light of Mr. Revell’s business experience, we believe that it is appropriate for Mr. Revell to serve as a director of the Company.
Karl Peterson became a director of the Company in July 2008. He is a Partner of TPG Capital, a member of that firm’s Management Committee and co-head of the firm’s EMEA efforts. Since rejoining TPG Capital in 2004, Mr. Peterson has led TPG Capital’s investment activities in travel and leisure and media and entertainment sectors and starting in 2009 he assumed responsibility for leading the firm’s investments in financial services. Prior to 2004, he was President and Chief Executive Officer of Hotwire, Inc. Mr. Peterson led Hotwire, Inc. from inception through its highly successful sale to IAC/InterActiveCorp for $680 million in 2003. Before his work at
81
Table of Contents
Hotwire, Inc., Mr. Peterson was a principal of TPG Capital in San Francisco. Prior to joining TPG Capital in 1995, Mr. Peterson was an investment banker in the Mergers & Acquisitions Department and the Leveraged Buyout Group of Goldman, Sachs & Co. from 1992 to 1995. He graduated with high honors from the University of Notre Dame, where he earned a B.B.A. in finance and business administration and was elected to Beta Gamma Sigma. Mr. Peterson currently serves on the board of directors of Caesars Entertainment Corporation and Sabre Holdings Corporation. Mr. Peterson has 15 years of experience in analyzing and investing in public and private companies and has significant experience in serving on boards of directors. Mr. Peterson participated in the diligence of the TPG Viking Funds’ investment in the Company and provides our Board of Directors with insight into strategic and financial matters of interest to the Company’s management and shareholders. In light of our ownership structure and Mr. Peterson’s position with TPG Capital and his business experience, we believe that it is appropriate for Mr. Peterson to serve as a director of the Company.
Kevin M. Sheehan has served as the President and Chief Executive Officer of the Company since August 2010. He has served as the Chief Executive Officer of the Company since November 2008 and as President since August 2010 and previously from August 2008 through March 2009. Mr. Sheehan also served as Chief Financial Officer of the Company from November 2007 through September 2010. Prior to joining us, he spent two and a half years consulting to private equity firms including Cerberus, Fortress and Clayton Dubilier & Rice and lecturing full time at Adelphi University in New York as Distinguished Visiting Professor of Accounting, Finance and Economics. Prior to that, Mr. Sheehan served a nine-year career with Cendant as Chairman and Chief Executive Officer of their Vehicle Services Division including responsibility for Avis Rent A Car, Budget Rent A Car, Budget Truck, PHH Fleet Management and Wright Express. Prior to that he was Cendant’s Chief Financial Officer and initially served as President and Chief Financial Officer of Avis Group. He is a graduate of Hunter College and the New York University Graduate School of Business. Mr. Sheehan serves on the board of directors, as Chairman of the Audit Committee and as a member of the Compensation Committee of GateHouse Media (NYSE “GHS”) and serves on the board of directors of the Steamship Mutual Underwriting Limited. He also serves as Chairman of the Florida Caribbean Cruise Association’s Executive Committee and on the Executive Committee of the Cruise Line International Association.
Wendy A. Beck has served as the Executive Vice President and Chief Financial Officer since September 2010. Prior to joining us, Ms. Beck served as Executive Vice President and Chief Financial Officer of Domino’s Pizza, Inc. from May 2008 to August 2010. Prior to that she served as Senior Vice President, Chief Financial Officer and Treasurer of Whataburger Restaurants, LP from May 2004 through April 2008 and served as their Vice President and Chief Accounting Officer from August 2001 through April 2004. Ms. Beck was also employed at Checkers Drive-In Restaurants, Inc. from 1993 though July 2001, serving as their Vice President, Chief Financial Officer and Treasurer from 2000 through July 2001. Ms. Beck currently sits on the board of directors and audit committee for Spartan Stores, Inc. Ms. Beck holds a Bachelor of Science degree in Accounting from the University of South Florida and is a Certified Public Accountant.
Andrew Stuart has served as Executive Vice President, Global Sales and Passenger Services of the Company since November 2008. From April 2008 through September 2008, he held the position of Executive Vice President and Chief Product Officer. From September 2003 through March 2008, he served as Executive Vice President of Marketing, Sales and Passenger Services. Prior to that, he was our Senior Vice President of Passenger Services as well as Vice President of Sales Planning. He joined us in August 1988 in our London office holding various Sales and Marketing positions before relocating to our headquarters in Miami. Mr. Stuart earned a Bachelor of Science degree in Catering Administration from Bournemouth University, United Kingdom.
Daniel S. Farkas has served as Senior Vice President and General Counsel of the Company since February 2008 and as Secretary of the Company since 2010. Since Mr. Farkas joined us in January 2004, he has held the positions of Vice President and Assistant General Counsel from 2005 to 2008, and Assistant General Counsel, from 2004 to 2005. Mr. Farkas was formerly a partner in the Miami offices of the law firm Mase and Gassenheimer specializing in maritime litigation. Before that he was an Assistant State Attorney for the Eleventh Judicial Circuit in and for Miami-Dade County, Florida. Mr. Farkas currently serves on the board of directors of
82
Table of Contents
the Cruise Industry Charitable Foundation. Mr. Farkas earned a Bachelor of Arts degree Cum Laude with honors in English and American Literature from Brandeis University and a Juris Doctorate degree from the University of Miami.
Maria Miller has served as Senior Vice President, Marketing since June 2009. Prior to joining us, Ms. Miller served as Senior Vice President, Marketing for Dave & Buster’s Inc., from May 2003 through May 2009. Before that she was Principal and Co-Founder of the marketing consulting firm Sage Partners, LLC from February 2002 through April 2003 and served as Vice President of Marketing for Elance from July 2000 through September 2001. Ms. Miller also served as Senior Vice President, Marketing for Avis Group Holdings, Inc., from January 1998 through July 2000 and held several marketing positions at American Express Company including Vice President, Platinum Card Operations from April 1987 through October 1995. Ms. Miller holds a Bachelor of Science degree in Business Administration from New York University and an MBA from Stanford University.
Robert Becker has served as Senior Vice President, Consumer Research of the Company since March 2008. Prior to joining us, Mr. Becker held the same position at Carnival Cruise Lines from November 1999 through February 2008. Before that Mr. Becker served as Director of Consumer Research/National Accounts at Renaissance Cruise Lines from November 1996 through October 1999 and General Manager of R Travel from August 1994 through September 1996. Mr. Becker holds a Bachelor of Arts from St. Bonaventure University and an MBA from Florida Atlantic University.
Board of Directors
Upon consummation of this offering, our Board of Directors will consist of nine directors, one of which will be an independent director.
Upon consummation of this offering, our Board of Directors will be divided into three classes, each of whose members will serve for staggered three-year terms. Tan Sri Lim Kok Thay, Marc J. Rowan and one of the two additional directors that certain of our shareholders have a right to appoint prior to the consummation of this offering pursuant to the Shareholders’ Agreement will be Class I directors, whose initial terms will expire at the fiscal 2012 annual general meeting of shareholders; Walter L. Revell, Adam M. Aron and one of the two additional directors that certain of our shareholders have a right to appoint prior to the consummation of this offering pursuant to the Shareholders’ Agreement will be Class II directors, whose initial terms will expire at the fiscal 2013 annual general meeting of shareholders; and Steve Martinez, Karl Peterson and David Chua Ming Huat will be Class III directors, whose initial terms will expire at the fiscal 2014 annual general meeting of shareholders.
We intend to avail ourselves of the “controlled company” exception under the NASDAQ rules, which eliminates the requirement that we have a majority of independent directors on our Board of Directors and that we have compensation and nominating and governance committees composed entirely of independent directors. We are required, however, to have an audit committee with one independent director during the 90-day period beginning on the date of effectiveness of the registration statement filed with the SEC in connection with this offering and of which this prospectus is part. After such 90-day period and until one year from the date of effectiveness of the registration statement, we are required to have a majority of independent directors on our audit committee. Thereafter, we are required to have an audit committee comprised entirely of independent directors. Pursuant to the terms of the Shareholders’ Agreement, within 90 days following the consummation of this offering, our Board of Directors will consist of eleven directors, including six directors designated by the Apollo Funds, three directors designated by Genting HK and two independent directors (one designated by the Apollo Funds and one designated by Genting HK). Within one year following the consummation of this offering, our Board of Directors will consist of thirteen directors, including seven directors designated by the Apollo Funds, three directors designated by Genting HK and three independent directors (two designated by the Apollo Funds and one designated by Genting HK).
If at any time we cease to be a “controlled company” under the NASDAQ rules, our Board of Directors will take all action necessary to comply with such NASDAQ rules, including appointing a majority of independent
83
Table of Contents
directors to the board of directors and establishing certain committees composed entirely of independent directors, in each case subject to the terms of the Shareholders’ Agreement.
In accordance with our bye-laws, the number of directors comprising our Board of Directors will be as determined from time to time by resolution of our Board of Directors, provided, that there shall be at least nine but no more than thirteen directors. Each director is to hold office until his or her successor is duly elected and qualified or until his or her earlier death, resignation or removal. At any meeting of our Board of Directors, except as otherwise required by law, our bye-laws will provide that a majority of the total number of directors then in office, including a majority of the directors designated by the Apollo Funds and at least one director designated by Genting HK, will constitute a quorum for all purposes. The composition of our Board of Directors and committees of our Board of Directors are subject to requirements in the Shareholders’ Agreement.
We refer you to “Certain Relationships and Related Party Transactions—The Shareholders’ Agreement” for more information regarding the governance arrangements for the Company among our principal shareholders, Genting HK, the Apollo Funds and the TPG Viking Funds, and the process for selection of directors by our principal shareholders.
Committees of our Board of Directors
Audit Committee
Upon consummation of this offering, our audit committee will consist of Walter L. Revell, Steve Martinez and Adam M. Aron. Our Board of Directors has determined that Walter L. Revell qualifies as an audit committee financial expert as defined in Item 401(h) of Regulation S-K. Walter L. Revell is independent as independence is defined in Rule 10A-3(b)(i) under the Exchange Act and under the NASDAQ rules. We intend to take such actions as may be necessary to ensure that a majority of the members of our audit committee are independent directors no later than 90 days after the consummation of this offering and that all members of our audit committee are independent directors no later than one year after the consummation of this offering. At least one of these additional independent directors will satisfy the NASDAQ standard of possessing accounting or related financial management expertise and qualify as an independent audit committee financial expert under the Exchange Act.
The principal duties and responsibilities of our audit committee are as follows:
| • | to oversee and monitor the integrity of our financial statements; |
| • | to monitor our financial reporting process and internal control system; |
| • | to appoint our independent registered public accounting firm from time to time, determine their compensation and other terms of engagement and oversee their work; |
| • | to oversee the performance of our internal audit function; and |
| • | to oversee our compliance with legal, ethical and regulatory matters. |
The audit committee will have the power to investigate any matter brought to its attention within the scope of its duties. It will also have the authority to retain counsel and advisors to fulfill its responsibilities and duties.
Compensation Committee
Upon consummation of this offering, our compensation committee will consist of Steve Martinez, Marc J. Rowan and Tan Sri Lim Kok Thay.
The principal duties and responsibilities of our compensation committee are as follows:
| • | to provide oversight and make recommendations to our Board of Directors on the development and implementation of the compensation policies, strategies, plans and programs for our key employees, executive officers and outside directors and disclosure relating to these matters and to establish and administer incentive compensation, benefit and related plans; |
84
Table of Contents
| • | to review and make recommendations to our Board of Directors regarding corporate goals and objectives, performance and the compensation of our chief executive officer, chief financial officer and the other executive officers of us and our subsidiaries; and |
| • | to provide oversight and make recommendations to our Board of Directors concerning selection of officers, regarding performance of individual executives and related matters. |
We intend to avail ourselves of the “controlled company” exemption under the NASDAQ rules, which exempts us from the requirement that we have a compensation committee composed entirely of independent directors.
Nominating and Governance Committee
Upon consummation of this offering, our nominating and governance committee will consist of David Chua Ming Huat, Steve Martinez and Adam M. Aron.
The principal duties and responsibilities of our nominating and governance committee will be as follows:
| • | to establish criteria for the board of directors and committee membership and recommend to our Board of Directors proposed nominees for election to our Board of Directors and for membership on committees of our Board of Directors; |
| • | to make recommendations regarding proposals submitted by our shareholders; and |
| • | to make recommendations to our Board of Directors regarding our Board of Directors’ governance matters and practices. |
We intend to avail ourselves of the “controlled company” exemption under the NASDAQ rules, which exempts us from the requirement that we have a nominating and governance committee composed entirely of independent directors.
Board compensation
Our directors are entitled to reimbursement for their out-of-pocket expenses. Upon consummation of this offering, each of our directors will receive an annual retainer fee of $50,000. Upon consummation of this offering, the chairman of the audit committee will receive an annual retainer fee of $10,000. Upon consummation of this offering, directors will also receive a fee of $1,200 per committee meeting attended. Under our new long-term incentive plan, independent directors will receive a one-time grant of $200,000 of restricted ordinary shares (based on the offering price of our ordinary shares).
Code of ethical business conduct
In connection with this offering, we will adopt a Code of Ethical Business Conduct that applies to all of our employees officers and directors, including our principal executive officer, principal financial officer and principal accounting officer, or persons performing similar functions. These standards are designed to deter wrongdoing and to promote honest and ethical conduct. Upon adoption, the Code of Ethical Business Conduct, which addresses the subject areas covered by the SEC’s rules, will be posted on our website: www.ncl.com under “About NCL—Corporate Governance.” Any substantive amendment to, or waiver from, any provision of the Code of Ethical Business Conduct with respect to any senior executive or financial officer shall be posted on this website. The information that appears on our website is not part of, and is not incorporated by reference into, this prospectus.
Compensation committee interlocks and insider participation
None of our executive officers serves as a member of our Board of Directors or compensation committee (or other committee performing equivalent functions) of any entity that has one or more executive officers serving on our Board of Directors or compensation committee. No interlocking relationship exists between any member of our Board of Directors or any member of the compensation committee (or other committee performing equivalent functions) of any other company.
85
Table of Contents
COMPENSATION DISCUSSION AND ANALYSIS
This section describes each of the material elements of compensation awarded to, earned by or paid to our executive officers identified in the Summary Compensation Table, which we refer to in this section as our “Named Executive Officers” or “NEOs.” This section also describes the role and involvement of various parties in our executive compensation analysis and decisions, and provides a discussion of the process and rationale for the decisions of our Board of Directors to compensate our Named Executive Officers with specific types and amounts of compensation. The Named Executive Officers for 2010 were:
| Kevin M. Sheehan |
President and Chief Executive Officer | |
| Wendy A. Beck* |
Executive Vice President and Chief Financial Officer | |
| Andrew Stuart |
Executive Vice President, Global Sales and Passenger Services | |
| Maria Miller |
Senior Vice President, Marketing | |
| Robert Becker |
Senior Vice President, Consumer Research |
| * | Ms. Beck’s employment with the Company commenced effective on September 20, 2010. Prior to that time Mr. Sheehan also served as our Chief Financial Officer. |
Although we have a separate Compensation Committee, our executive compensation programs have been determined and approved by our entire Board of Directors prior to the offering. Our Board of Directors historically has had the authority to determine all aspects of our executive compensation program, and has made all compensation decisions affecting the Named Executive Officers. None of the Named Executive Officers are members of our Board of Directors or otherwise had any role in determining the compensation of other Named Executive Officers, although our Board of Directors does consider the recommendations of our President and Chief Executive Officer (the “CEO”) in setting compensation levels for our executive officers other than the CEO.
Executive Compensation Program Objectives and Philosophy
The Company’s executive compensation arrangements are guided by the following principles and business objectives:
| • | We believe that a capable, experienced and highly motivated executive management team is critical to our success and to the creation of long-term shareholder value. |
| • | We believe that the most effective executive compensation program is one that is designed to reward the achievement of annual, long-term and strategic goals and aligns the interests of our executives with those of our shareholders, with the ultimate objective of improving long-term shareholder value. |
The Company’s executive compensation program is designed according to these principles and is intended to achieve two principal objectives: (1) effectively attract and retain executives with the requisite skills and experience to help us achieve our business objectives and develop, expand and execute business opportunities that improve long-term shareholder value; and (2) encourage executives to achieve our short-term and long-term business objectives and increase long-term shareholder value by linking executive compensation to Company performance, increases in long-term shareholder value and individual performance.
The Company’s current compensation program has three key elements, which are designed to be consistent with the Company’s compensation philosophy and business objectives: (1) base salary; (2) annual incentive cash bonuses; and (3) long-term equity awards that are subject to both time and performance-based vesting requirements. The Company also provides nonqualified deferred compensation plan benefits, 401(k) retirement benefits, perquisites and severance benefits to the executive officers.
In structuring executive compensation arrangements, our Board of Directors considers how each component meets these objectives. Base salaries, severance, retirement and nonqualified deferred compensation benefits are
86
Table of Contents
primarily intended to attract and retain highly qualified executives. These are the elements of our executive compensation program where the value of the benefit in any given year is not dependent on performance (although base salary amounts and benefits determined by reference to base salary may change from year to year depending on performance, among other things). We believe that in order to attract and retain top executives, we need to provide our executives with compensation levels that reward their continued service and are competitive. Some of the elements, such as base salaries, are paid out on a short term or current basis. Other elements, such as benefits provided upon termination of employment and nonqualified deferred compensation are paid out on a longer term basis. We believe that this mix of short and long term elements allows us to achieve our goals of attracting and retaining top executives.
Annual incentive bonuses and long-term equity incentives are the elements of our executive compensation program that are designed to reward performance and thus the creation of shareholder value. Annual incentive bonuses are primarily intended to motivate the Named Executive Officers to achieve the Company’s annual financial objectives, although we also believe they help us attract and retain top executives. Our long-term equity incentives are primarily intended to align Named Executive Officers’ long-term interests with shareholders’ long-term interests, although we also believe that they play a role in helping us to attract and retain top executives.
Our Board of Directors believes that performance based compensation such as annual incentive bonuses and long-term equity incentives play a significant role in aligning management’s interests with those of our shareholders. For this reason, these forms of compensation constitute a significant portion of each of our Named Executive Officers’ compensation. In determining the appropriate mix for each of our Named Executive Officers, our Board of Directors considers and assesses, among other factors, each Named Executive Officer’s responsibilities, background and experience, and value to the Company, as well as each officer’s expected level of contribution toward achieving the Company’s long-term objectives.
Compensation Consultants; Review of Relevant Compensation Data
Consistent with past practice, in 2010 neither our Board of Directors nor management retained a compensation consultant to review or recommend the amount or form of compensation paid to our executive officers, including our Named Executive Officers, or our directors. We have not adopted a policy regarding compensation consultant independence. We will consider the implementation of such a policy if and when we decide to retain a compensation consultant to assist us with our executive compensation programs in the future.
Our Board of Directors believes that, in order to effectively attract and retain high level executive talent, each element of the compensation program should establish compensation levels that take into account current market practices. Our Board of Directors does not “benchmark” executive compensation at any particular level in comparison with other companies. Rather, our Board of Directors familiarizes itself with compensation trends and competitive conditions through the review of non-customized third-party market surveys and other publicly available data about relevant market compensation practices. In setting compensation levels for 2010, our Board of Directors considered publicly available compensation data to determine the relative strengths and weaknesses of our compensation packages on an aggregate basis solely as a validation after determining the types and amount of compensation based on its own evaluation. In addition to a review of the general market compensation levels and practices, in setting compensation levels for 2010, our Board of Directors also relied on its extensive experience managing private equity entities and considered each executive’s level of responsibility and performance for the overall operations of the Company, historical Company practices, long-term market trends, internal pay equity, expectations regarding the individual’s future contributions, our own performance, budget considerations, and succession planning and retention strategies.
87
Table of Contents
Executive Compensation Program Elements
Base Salaries
Each Named Executive Officer is party to an employment agreement that provides for a fixed base salary, subject to annual review by our Board of Directors. The initial base salary level for each Named Executive Officer was negotiated in connection with the executive joining the Company or upon a change of their responsibilities. Decisions regarding adjustments to base salaries are made at the discretion of our Board of Directors. In reviewing base salary levels for our Named Executive Officers, our Board of Directors considers and assesses, among other factors, each Named Executive Officer’s current base salary, their job responsibilities, leadership and experience, and value to our Company. In addition, as noted above, base salary levels are generally intended to be consistent with competitive market base salary levels, but are not specifically targeted or “bench-marked” against any particular company or group of companies.
After reviewing the Named Executive Officers’ base salaries in light of the current economic environment and considering the Company’s financial position, our Board of Directors determined to increase the base salaries of our Named Executive Officers by 2% from their 2009 levels effective April 1, 2010.
Annual Performance Incentives
Each of our Named Executive Officers, with the exception of Ms. Beck and Mr. Becker, are eligible for an annual performance incentive cash bonus opportunity pursuant to the terms of their employment agreements. The employment agreements for each of these Named Executive Officers provide that for each fiscal year of the Company, the executive is eligible to earn an incentive bonus determined by our Board of Directors in its discretion based on the attainment of performance objectives established for the fiscal year by our Board of Directors. For the 2010 fiscal year, our Board of Directors established the applicable performance objectives under the 2010 Management Incentive Plan. The 2010 performance objectives were based upon the achievement of certain performance goals of the Company and the individual. The annual performance incentive is used to ensure that a portion of our Named Executive Officers’ compensation is at risk, and that each Named Executive Officer has the opportunity to receive a variable amount of compensation based on our Board of Directors’ evaluation of our and the individual’s performance. In 2010, Ms. Beck received a guaranteed bonus of $250,000 instead of a performance-based incentive bonus due to her mid-year appointment with the Company. Mr. Becker’s employment agreement provides for an annual bonus of $350,000.
Each year, our Board of Directors establishes the potential value of the executives’ incentive bonus opportunity, as well as the performance targets required to achieve these opportunities, which may include one or any combination of the following: (i) net income, operating income or EBITDA; (ii) return on assets, return on capital, return on equity, return on economic capital, return on other measures of capital, return on sales or other financial criteria; (iii) revenue or net sales; (iv) budget and expense management; or (v) customer or product measures. In determining the extent to which the performance measures are met for a given period, our Board of Directors exercises its judgment whether to reflect or exclude the impact of extraordinary, unusual or infrequently occurring events.
Each year, our Board of Directors also establishes non-financial performance measures for our Chief Executive Officer, and our Chief Executive Officer establishes the non-financial performance measures for each of the other applicable executive officers, including the Named Executive Officers. These measures are used by our Board of Directors to evaluate performance beyond purely financial measures, and include one or any combination of the following: (i) exceptional performance of each individual’s area of responsibility; (ii) leadership; (iii) creativity and innovation; (iv) collaboration; (v) development and implementation of growth initiatives; (vi) guest experience and loyalty; (vii) employee satisfaction; and (viii) other activities that are critical to driving long-term value for shareholders.
Our Board of Directors sets the value of the annual performance incentive opportunity as a percentage of the executive’s base salary. However, the actual amount that becomes payable to an executive is determined by our
88
Table of Contents
Board of Directors, in its sole discretion, based on the level of achievement of the Company performance goal and our Board of Directors’ assessment of the executive’s individual performance. After the end of the year, our Board of Directors reviews the Company’s actual performance against the performance goal established at the beginning of the year. Our Board of Directors also makes an assessment of performance against the non-financial goals set at the outset of the year as well as each Named Executive Officer’s performance in relation to any extraordinary events or transactions.
For 2010, our Board of Directors established a Company performance target based on EBITDA, as defined below for purposes of the management incentive plan, with the amount of each Named Executive Officer’s annual performance opportunity to be determined based on the Company’s actual EBITDA for the year as compared with the target EBITDA established by our Board of Directors. If the actual EBITDA for 2010 was less than 90% of the target EBITDA, no bonuses would be paid. If the actual EBITDA for 2010 was at least 110% of the target EBITDA, each Named Executive Officer would be eligible to receive up to their maximum bonus opportunity. For purposes of our management incentive plan, we define EBITDA as earnings before interest, other income (expense) including taxes, and depreciation and amortization before or after nonrecurring, uncontrollable or unusual items. Our Board of Directors believes that EBITDA is a useful measure as it reflects certain operating drivers of the Company’s business, such as sales growth, operating costs, selling, general and administrative expenses and other operating income and expense. In setting the target EBITDA for 2010, our Board of Directors considered several factors, including a careful review of the annual budget and the desire to ensure continued improved performance on a year over year basis. Our Board of Directors reserved the right to adjust the goals during the course of the year to take into account changes in deployment of the fleet, major unforeseen and uncontrollable events and other non-recurring and extraordinary costs and revenues experienced by the Company during the year, and made appropriate adjustments for certain non-recurring items consistent with this authority.
The following chart sets forth the EBITDA levels at which various levels of incentive payout would become available to our Named Executive Officers for 2010, with the bonus percentage amounts expressed as a percentage of the Named Executive Officer’s base salary for 2010. Between these points the payout is calculated on a sliding straight line basis. The bonus for each of the Named Executive Officers was determined by our Board of Directors, in its judgment, to be appropriate based on the target bonus amount that was negotiated by each executive in their respective employment agreement, each executive’s experience and position, and general competitive practices.
| Name |
Percentage of EBITDA goal Achieved |
Financial Performance Bonus |
Non-Financial Performance Bonus |
Total Maximum Bonus |
||||||||||||
| Kevin M. Sheehan |
90 | % | 0 | % | 20 | % | 20 | % | ||||||||
| 95 | % | 40 | % | 20 | % | 60 | % | |||||||||
| 100 | % | 80 | % | 20 | % | 100 | % | |||||||||
| 105 | % | 120 | % | 30 | % | 150 | % | |||||||||
| 110 | % | 160 | % | 40 | % | 200 | % | |||||||||
| Wendy A. Beck |
— | — | — | — | ||||||||||||
| Andrew Stuart |
90 | % | 0 | % | 10 | % | 10 | % | ||||||||
| 95 | % | 20 | % | 10 | % | 30 | % | |||||||||
| 100 | % | 40 | % | 10 | % | 50 | % | |||||||||
| 105 | % | 60 | % | 15 | % | 75 | % | |||||||||
| 110 | % | 80 | % | 20 | % | 100 | % | |||||||||
| Maria Miller |
90 | % | 0 | % | 7 | % | 7 | % | ||||||||
| 95 | % | 14 | % | 7 | % | 21 | % | |||||||||
| 100 | % | 28 | % | 7 | % | 35 | % | |||||||||
| 105 | % | 42 | % | 10.5 | % | 52.5 | % | |||||||||
| 110 | % | 56 | % | 14 | % | 70 | % | |||||||||
| Robert Becker |
— | — | — | — | ||||||||||||
89
Table of Contents
Our Board of Directors determined that the Company’s EBITDA for 2010, adjusted primarily for the impact of foreign exchange versus budget, reached the 2010 EBITDA maximum bonus target of $411.2 million. Based on its subjective assessment of the individual performance for each Named Executive Officer and the level of achievement of the EBITDA target, our Board of Directors determined the bonus amount it considered appropriate to award to each Named Executive Officer for 2010, which is set forth below.
| Name |
Financial Performance Bonus |
Non-Financial Performance Bonus |
Total Bonus Percentage |
Final Bonus Amount |
||||||||||||
| Kevin M. Sheehan |
160 | % | 40 | % | 200 | % | $ | 2,036,072 | ||||||||
| Wendy A. Beck |
— | — | — | — | ||||||||||||
| Andrew Stuart |
80 | % | 20 | % | 100 | % | $ | 465,826 | ||||||||
| Maria Miller |
56 | % | 14 | % | 70 | % | $ | 248,525 | ||||||||
| Robert Becker |
— | — | — | — | ||||||||||||
Leadership Retention Awards
In 2008, our Board of Directors approved special one-time leadership retention awards in the form of cash bonuses to certain key executives of the Company, including Kevin M. Sheehan and Andrew Stuart. One-third of each award vested and became payable on December 31, 2009 and 2010, while the remaining one-third will vest on December 31, 2011, provided that the executive is still actively employed by the Company in an executive capacity through that respective payment date. Our Board of Directors approved these one-time awards to provide a special retention incentive to certain key employees during the Company’s critical restructuring.
Long-Term Equity Incentive Compensation
Our policy has been that the long-term compensation of our executives, including our Named Executive Officers, should be directly linked to the value provided to shareholders. Accordingly, our long-term equity incentive program is intended to directly align a significant portion of the compensation of our Named Executive Officers with the interests of our shareholders by motivating and rewarding creation and preservation of long-term shareholder value with measurement to a multi-year performance period.
In 2009, we adopted the Profits Sharing Agreement which authorizes us to grant profits interests in the form of Ordinary Profits Units in the Company to certain key employees, including the Named Executive Officers. Each award of Ordinary Profits Units represents a share in any future appreciation of the Company after the date of grant, subject to vesting conditions and once certain shareholder returns have been achieved.
On October 13, 2010, our Board of Directors granted Mr. Sheehan and Ms. Beck certain awards of Ordinary Profits Units in the amounts set forth in the “Grants of Plan Based Awards Table” below. In determining the level of awards granted to Mr. Sheehan and Ms. Beck, our Board of Directors took into account each of their responsibilities, background and experience as well as their expected level of contribution toward achieving the Company’s long-term objectives and our Board of Directors’ expectations as to the long-term Company performance. Each of the other Named Executive Officers was granted an award of Ordinary Profits Units in prior years, and these awards continue to serve as each executive’s long-term compensation opportunity.
The Ordinary Profits Units are generally subject to time-based vesting requirements (“TBUs”) and performance-based vesting requirements (“PBUs”). The TBUs vest ratably over five years, subject to the executive’s continued employment with the Company. In general, the PBUs will vest, if at all, upon a “realization event” (which is generally defined to mean any receipt of cash dividends, distributions or sale proceeds with respect to our ordinary shares) for the Apollo Funds if the following levels of invested capital are returned to the Apollo Funds in connection with the realization event: 50% of the PBUs will vest if the Apollo Funds receive a return equal to 100% of their invested capital in the Company and the remaining 50% will vest if
90
Table of Contents
the Apollo Funds receive a return equal to 200% or more of their invested capital in the Company. These vesting provisions were established to ensure that the value realized by the Named Executive Officers would increase as the final cash return ultimately realized by the Apollo Funds and our other current shareholders increases.
In addition, during 2010, Mr. Sheehan was granted 100,000 PBUs that will vest upon the occurrence of a “realization event” provided that the amount of realized cash received by the Apollo Funds is greater than two and one-quarter times (2.25x) the capital invested in the Company by the Apollo Funds. This award of PBUs was granted to Mr. Sheehan as a special performance incentive to motivate him to achieve a superior cash return for the Apollo Funds and our other current shareholders.
In connection with the Corporate Reorganization and prior to the consummation of this offering, we will issue an economically equivalent number of our ordinary shares, based on the initial public offering price in this offering in exchange, for all outstanding profits interests granted under the Profits Sharing Agreement, including the Ordinary Profits Units described above. The ordinary shares received upon the exchange of outstanding profits interests will continue to be subject to the same time-based vesting requirements and performance-based vesting requirements described above.
Following the consummation of this offering, we will not grant any additional profits interests under the Profits Sharing Agreement, and any new long-term incentive awards will be granted under our new long-term incentive plan described under “New Long-Term Incentive Plan” below.
Severance Arrangements and Change in Control Benefits
Each of our Named Executive Officers is employed pursuant to an employment agreement that provides for severance benefits upon an involuntary termination of the Named Executive Officer’s employment by us without cause or, for Mr. Sheehan, a termination by the executive as a result of a constructive termination. The severance benefit in each employment agreement was negotiated in connection with the commencement of each executive’s employment with the Company, or upon a change of their responsibilities. In each case, our Board of Directors determined that it was appropriate to provide the executive with severance benefits under the circumstances in light of each of their respective positions with the Company, general competitive practices and as part of each of their overall compensation package. The severance benefits payable to each of our Named Executive Officers upon a qualifying termination of employment generally includes a cash payment based on the executive’s base salary (and in some cases, including bonus), and continued medical benefits for the applicable severance period at the Company’s expense.
The Company does not believe that the Named Executive Officers should be entitled to any cash severance benefits merely because of a change in control of the Company. Accordingly, none of the Named Executive Officers are entitled to any such payments or benefits upon the occurrence of a change in control of the Company unless there is an actual or constructive termination of employment following the change in control.
The material terms of these benefits are described in the “Potential Payments Upon a Termination or Change in Control” section of this registration statement below.
Other Elements of Compensation
Share Option Scheme for Shares of Genting HK
Certain directors and employees of Genting HK and NCL Corporation Ltd., including Mr. Stuart, were granted options to purchase shares of Genting HK under the Share Option Scheme adopted by Genting HK on August 23, 2000 (as effected on November 30, 2000 and amended on May 22, 2002). None of the Named Executive Officers other than Mr. Stuart have been granted awards under this plan, and it is not anticipated that any further options will be granted. All options outstanding under this plan are vested and exercisable. These options do not relate to the Company’s ordinary shares, and are not considered a part of our current executive compensation program.
91
Table of Contents
Supplemental Executive Retirement Plan
We maintain a Supplemental Executive Retirement Plan (“SERP”), which is a legacy unfunded defined contribution plan for certain of our executives who were employed by the Company in an executive capacity prior to 2008. The SERP was frozen to future participation following that date. Messrs. Sheehan and Stuart are the only Named Executive Officers who are eligible to participate in the SERP. The SERP provides for Company contributions on behalf of the participants to compensate them for the benefits that are limited under our 401(k) Plan. We credit participants under the SERP for amounts that would have been contributed by us to the Company’s previous Defined Contribution Retirement Plan and our former 401(k) Plan without regard to any limitations imposed by the Code. Participants do not make any elective contributions under this plan.
In 2010, the Company made a contribution to the SERP for Messrs. Sheehan and Stuart, and certain amounts were paid to Messrs. Sheehan and Stuart on December 31, 2010, in lieu of being contributed to the SERP, in order to comply with and avoid adverse consequences under recently enacted applicable tax rules. The Company contribution amount for Messrs. Sheehan and Stuart for 2010 is included in the “Summary Compensation Table” below and the footnotes thereto. Additional information about the SERP is provided in the “Nonqualified Deferred Compensation Table” and the narrative to the table below.
Senior Management Retirement Savings Plan
We maintain a Senior Management Retirement Savings Plan (“SMRSP”), which is a legacy unfunded defined contribution plan for certain of our employees, including Mr. Stuart, who were employed by the Company prior to 2001. Mr. Stuart is the only Named Executive Officer who is eligible to participate in the SMRSP. The SMSRP provides for Company contributions on behalf of the participants to compensate them for difference between the qualified plan benefits that were previously available under the Company’s cash balance pension plan and the redesigned 401(k) Plan. We credit participants under the SMRSP Plan for the difference in the amount that would have been contributed by us to the Company’s previous Norwegian Cruise Line Pension Plan and the qualified plan maximums of the new 401(k) Plan.
The amount of the contribution for 2010 was paid to Mr. Stuart in 2010 in order to comply with and avoid adverse consequences under recently enacted applicable tax rules. The Company contribution amount for Mr. Stuart for 2010 is included in the “Summary Compensation Table” below and the footnotes thereto. Additional information about the SMSRP is provided in the “Nonqualified Deferred Compensation Table” and the narrative to the table below.
Benefits and Perquisites
We provide our Named Executive Officers with retirement benefits under our 401(k) Plan, participation in our medical, dental and insurance programs and vacation and other holiday pay, all in accordance with the terms of such plans and programs in effect from time to time and substantially on the same terms as those generally offered to our other employees.
In addition, the Named Executive Officers receive either a Company provided automobile and reimbursement of operating expenses for the vehicle, or a cash automobile allowance, as well as coverage under the Company’s Medical Executive Reimbursement Plan which provides them with reimbursement of out of pocket medical, dental and vision expenses up to an annual maximum of $5,000 for any one illness or condition. The Company believes that the level and mix of perquisites it provides to the Named Executive Officers is consistent with market compensation practices.
Share Ownership Program
We do not currently have a share ownership program in place for our Named Executive Officers.
92
Table of Contents
Compensation Risk Assessment
The Company conducted a risk assessment of the Company’s compensation policies and practices and concluded that such policies and practices do not create risks that are reasonably likely to have a material adverse effect on the Company. In particular, our Board of Directors believes that the design of the Company’s annual performance incentive program and long-term equity incentives provides an effective and appropriate mix of incentives to ensure our executive compensation program is focused on long-term shareholder value creation and does not encourage the taking of short-term risks at the expense of long-term results.
Compensation of Executive Officers
The Summary Compensation Table below quantifies the value of the different forms of compensation earned by or awarded to our Named Executive Officers for fiscal 2010. The primary elements of each Named Executive Officer’s total compensation reported in the table are base salary, an annual bonus, long-term equity incentives consisting of profits interest awards and nonqualified deferred compensation benefits.
The Summary Compensation Table should be read in conjunction with the tables and narrative descriptions that follow. The Grants of Plan-Based Awards table, and the accompanying description of the material terms of our profits interests grants, provides information regarding the long-term equity incentives awarded to our Named Executive Officers. The sections entitled “—Outstanding Equity Awards at December 31, 2010” and “—Option Exercises and Stock Vested in 2010” provide further information on the Named Executive Officers’ potential realizable value and actual value realized with respect to their equity awards.
2010 Summary Compensation Table
The following table presents information regarding compensation of each of our Named Executive Officers for services rendered during fiscal 2010.
| Name and Principal Position |
Year | Salary ($) | Bonus ($)(1) | Stock Awards ($)(2) |
Non-Equity Incentive Plan Compensation ($)(3) |
All Other Compensation ($)(4) |
Total ($) | |||||||||||||||||||||
| Kevin M. Sheehan |
2010 | 1,018,036 | 166,667 | 1,693,040 | 2,036,072 | 427,391 | 5,341,206 | |||||||||||||||||||||
| Wendy A. Beck |
2010 | 125,000 | 250,000 | 704,720 | — | 37,116 | 1,116,836 | |||||||||||||||||||||
| Andrew Stuart |
2010 | 465,826 | 133,333 | — | 465,826 | 151,097 | 1,216,082 | |||||||||||||||||||||
| Maria Miller |
2010 | 355,035 | — | — | 248,525 | 24,983 | 628,543 | |||||||||||||||||||||
| Robert Becker |
2010 | 256,132 | 350,000 | — | — | 9,981 | 616,113 | |||||||||||||||||||||
| (1) | As described in the Compensation Discussion and Analysis section above, the amounts reported in the “Bonus” column of the table above represent the portion of the leadership retention awards that were earned in connection with their services in 2010 for Mr. Sheehan and Mr. Stuart. The amount for Ms. Beck represents the bonus that was guaranteed for 2010. The amount for Mr. Becker represents his annual bonus. |
93
Table of Contents
| (2) | The amounts reported in the “Stock Awards” column of the table above for 2010 reflect the fair value on the grant date of the profits interests awards granted to our Named Executive Officers during 2010. These values have been determined under the principles used to calculate the value of equity awards for purposes of our financial statements. For a discussion of the assumptions and methodologies used to calculate the amounts referred to above, please see the discussion of the profits interests awards contained in Note 7, Employee Benefits and Share Option Plans, to our consolidated financial statements for the year ended December 31, 2010 included elsewhere in this registration statement. For information about the profits interest awards granted to our Named Executive Officers for fiscal 2010, please see the discussion under “–Grants of Plan-Based Awards in 2010” below. |
| (3) | Please see the Compensation Discussion and Analysis section above for a description of the incentive bonuses awarded to the Named Executive Officers for fiscal 2010. The threshold, target and maximum bonus amounts for each Named Executive Officer’s incentive bonus opportunity for 2010 are reported in the “Grants of Plan-Based Awards in 2010” table below. |
| (4) | The following table provides detail for the amounts reported in the “All Other Compensation” column of the table. |
| Name |
Auto (1) | Relocation Assistance (2) |
Contributions to SERP (3) |
Contributions to SMRSP (4) |
Other Perquisites (5) |
Total | ||||||||||||||||||
| Kevin M. Sheehan |
17,559 | — | 396,584 | — | 13,248 | 427,391 | ||||||||||||||||||
| Wendy A. Beck |
3,600 | 31,452 | — | — | 2,064 | 37,116 | ||||||||||||||||||
| Andrew Stuart |
13,902 | — | 116,807 | 10,915 | 9,473 | 151,097 | ||||||||||||||||||
| Maria Miller |
15,376 | 510 | — | — | 9,097 | 24,983 | ||||||||||||||||||
| Robert Becker |
1,156 | — | — | — | 8,825 | 9,981 | ||||||||||||||||||
| (1) | Represents lease payments for a Company provided automobile and reimbursement of operating expenses for the vehicle, or a cash automobile allowance. |
| (2) | Represents amounts paid directly to the Named Executive Officer as well as relocation expenses paid directly by the Company. |
| (3) | Represents the Company contribution to the Company’s Supplemental Executive Retirement Plan for 2010. |
| (4) | Represents the Company contribution to the Company’s Senior Management Retirement Savings Plan for 2010. |
| (5) | Represents medical executive reimbursement, flexible credits and life insurance premiums. |
Description of Employment Agreements—Salary and Bonus Amounts
Kevin M. Sheehan
Mr. Sheehan is employed as our President and Chief Executive Officer pursuant to an employment agreement with the Company. The initial term of Mr. Sheehan’s employment under the agreement is four years. The agreement will automatically renew for an additional year on November 5, 2012 and each anniversary thereafter, subject to the same terms and conditions, unless either we or Mr. Sheehan gives notice of non-renewal within ninety days prior to the end of the term. The agreement provides for a minimum annual base salary of $1,000,000, annual performance-based bonus with a target amount equal to 100% of base salary, long-term incentive compensation as determined by our Board of Directors and participation in employee benefit plans and perquisite programs generally available to our executive officers.
Wendy A. Beck
Ms. Beck is employed as our Executive Vice President and Chief Financial Officer pursuant to an employment agreement with the Company effective as of September 20, 2010. The initial term of Ms. Beck’s employment under the agreement is one year. The agreement will automatically renew for an additional year on September 19, 2011 and each anniversary thereafter, subject to the same terms and conditions, unless either we or Ms. Beck gives notice of non-renewal within ninety days prior to the end of the term. The agreement provides
94
Table of Contents
for a minimum annual base salary of $500,000, annual performance-based bonus with a target amount equal to 50% of base salary, long-term incentive compensation as determined by our Board of Directors, relocation assistance and participation in employee benefit plans and perquisite programs generally available to our executive officers. In 2010, Ms. Beck received a guaranteed bonus of $250,000 in connection with her appointment with the Company.
Andrew Stuart
Mr. Stuart is employed as our Executive Vice President, Global Sales and Passenger Services pursuant to an employment agreement with the Company. The initial term of Mr. Stuart’s employment agreement is one year. The agreement renewed for an additional year on July 8, 2010 and will renew each anniversary thereafter, subject to the same terms and conditions, for additional one-year terms unless either we or Mr. Stuart gives notice of non-renewal within ninety days prior to the end of the term. The agreement provides for a minimum annual base salary of $455,620, annual performance-based bonus with a target amount equal to 50% of base salary, long-term incentive compensation as determined by our Board of Directors, and participation in employee benefit plans and perquisite programs generally available to our executive officers.
Maria Miller
Ms. Miller is employed as our Senior Vice President, Marketing pursuant to an employment agreement with the Company. The initial term of Ms. Miller’s employment under the agreement is one year. The agreement automatically renewed for an additional year on May 31, 2010 and will renew each anniversary thereafter, subject to the same terms and conditions, for additional one-year terms unless either we or Ms. Miller gives notice of non-renewal within ninety days prior to the end of the term. The agreement provides for a minimum annual base salary of $350,000, annual performance-based bonus with a target amount equal to 35% of base salary, long-term incentive compensation as determined by our Board of Directors, relocation assistance and participation in employee benefit plans and perquisite programs generally available to our executive officers.
Robert Becker
Mr. Becker is employed as our Senior Vice President, Consumer Research pursuant to an employment agreement with the Company. The initial term of Mr. Becker’s employment agreement is two years. The agreement renewed for an additional year on March 16, 2010 and will renew each anniversary thereafter, subject to the same terms and conditions, for additional one-year terms unless either we or Mr. Becker gives notice of non-renewal within ninety days prior to the end of the term. The agreement provides for a minimum annual base salary of $250,000, annual bonus of $350,000, long-term incentive compensation as determined by our Board of Directors, and participation in employee benefit plans and perquisite programs generally available to our executive officers.
95
Table of Contents
Grants of Plan-Based Awards in 2010
The following table presents all plan-based awards granted to our Named Executive Officers during the fiscal year ending December 31, 2010.
| Name | Grant Date |
Estimated Potential Payouts Under Non-Equity Incentive Plan Awards(1) |
Estimated Future Payouts Under Equity Incentive Plan Awards(2) |
All Other Stock Awards: Number of Shares of Stock or Units(3) (#) |
Grant Date ($)(4) |
|||||||||||||||||||||||||||||||
| Thresh- ($) |
Target ($) |
Maxi- ($) |
Thresh- old (#) |
Target (#) |
Maxi- mum (#) |
|||||||||||||||||||||||||||||||
| (a) |
(b) | (c) | (d) | (e) | (f) | (g) | (h) | (i) | (l) | |||||||||||||||||||||||||||
| Kevin M. Sheehan |
10/13/2010 | — | 1,018,036 | 2,036,072 | — | |
25,000 |
|
— | 25,000 | |
587,280 |
| |||||||||||||||||||||||
| 100,000 | |
1,105,760 |
| |||||||||||||||||||||||||||||||||
| Wendy A. Beck |
10/13/2010 | — | — | — | — | 30,000 | — | 30,000 | 704,720 | |||||||||||||||||||||||||||
| Andrew Stuart |
— | 232,913 | 465,826 | — | — | — | — | — | ||||||||||||||||||||||||||||
| Maria Miller |
— | 124,263 | 248,525 | — | — | — | — | — | ||||||||||||||||||||||||||||
| Robert Becker |
— | — | — | — | — | — | — | — | ||||||||||||||||||||||||||||
| (1) | Amounts in these columns show the range of payouts that was possible under the Company’s annual performance incentive cash bonus program based on performance during fiscal 2010, as described in the Compensation Discussion and Analysis. The actual bonus amounts that were paid in 2010 based on 2010 performance are shown in the Summary Compensation Table in the column entitled “Non-Equity Incentive Plan Compensation.” |
| (2) | The amounts in these columns represent the number of Ordinary Profits Units subject to the profits interest award(s) granted to each of the Named Executive Officers in 2010 that are subject to performance-based vesting conditions. |
| (3) | The amounts in this column represent the number of Ordinary Profits Units subject to the profits interest award(s) granted to each of the Named Executive Officers in 2010 that are subject to time-based vesting conditions. |
| (4) | The amounts in this column represent the aggregate grant date fair value of the profits interest awards. These values have been determined under the principles used to calculate the value of equity awards for purposes of our financial statements. For a discussion of the assumptions and methodologies used to calculate the amounts referred to above, please see the discussion of the profits interest awards contained in Note 7 Employee Benefits and Share Option Plans, to our consolidated financial statements for the year ended December 31, 2010 included elsewhere in this registration statement. |
Description of Plan-Based Awards
Non-Equity Incentive Plan Awards
The material terms of the non-equity incentive plan awards reported in the above table are described in the Compensation Discussion and Analysis section above under the heading “—Executive Compensation Program Elements—Annual Performance Incentives.”
Equity Incentive Plan Awards
During 2010, Mr. Sheehan and Ms. Beck were granted an award of profits interests in the Company as described below. Each of these awards was granted under, and is subject to the terms and conditions of, the Profits Sharing Agreement, which was adopted by the Company in 2009.
Under the Profits Sharing Agreement, our Board of Directors is authorized to grant profits interests in the Company to certain key employees, including the Named Executive Officers, in the form of Ordinary Profits
96
Table of Contents
Units. Each award of Ordinary Profits Units represents a share in any future appreciation of the Company after the date of grant, subject to vesting conditions and once certain shareholder returns have been achieved.
Generally, 50% of the Ordinary Profits Units subject to each award are subject to time-based vesting requirements (“TBUs”) and 50% of the Ordinary Profits Units subject to each award are subject to performance-based vesting requirements (“PBUs”). In addition, in 2010 Mr. Sheehan was granted 100,000 PBUs that will vest upon the occurrence of a “realization event” (which is generally defined to mean any receipt of cash dividends, distributions or sale proceeds with respect to our ordinary shares) for the Apollo Funds provided that the amount of realized cash received by the Apollo Funds is greater than two and one-quarter times (2.25x) the capital invested in the Company by the Apollo Funds.
The TBUs generally vest ratably over five years, subject to the executive’s continued employment with the Company. The PBUs will vest, if at all, upon a “realization event” for the Apollo Funds if the following levels of invested capital are returned to the Apollo Funds in connection with the realization event: 50% of the PBUs will vest if the Apollo Funds receive a return equal to 100% of their invested capital in the Company and the remaining 50% will vest if the Apollo Funds receive a return equal to 200% or more of their invested capital in the Company.
If there is a “sale of the company” (as defined in the Profits Sharing Agreement), all of the then outstanding unvested TBUs (after giving effect to any TBUs that vest in connection with the transaction) will automatically be forfeited on the date of the sale and any outstanding and unvested PBUs will vest, if at all, based on the level of the Apollo Funds’ return on their invested capital as a result of the sale. Any unvested PBUs that do not vest will be forfeited. If the Named Executive Officer’s employment terminates, the award, to the extent it is then unvested, will generally be forfeited, except as described in the “Potential Payments Upon a Termination or Change in Control” section below.
In connection with the Corporate Reorganization and prior to the consummation of this offering, we will issue an economically equivalent number of our ordinary shares, based on the initial public offering price in this offering, in exchange for all outstanding profits interests granted under the Profits Sharing Agreement, including the Ordinary Profits Units described above. The ordinary shares received upon the conversion of outstanding profits interests will continue to be subject to the same time-based vesting requirements and performance-based vesting requirements described above.
Following the consummation of this offering, we will not grant any additional profits interests under the Profits Sharing Agreement, and any new long-term incentive awards will be granted under our new long-term incentive plan described under “New Long-Term Incentive Plan” below.
97
Table of Contents
OUTSTANDING EQUITY AWARDS AT DECEMBER 31, 2010
The following table presents information regarding the outstanding equity awards held by each of our Named Executive Officers as of December 31, 2010.
| Option Awards | Stock Awards | |||||||||||||||||||||||||||||||||||
| Name |
Award Grant Date |
Number of Securities Underlying Unexercised Options (#)(1) Exercisable |
Number of Securities Underlying Unexercised Options (#) Unexercisable |
Option Exercise Price ($)(2) |
Option Expiration Date |
Number of Shares or Units of Stock That Have Not Vested (#)(3) |
Market Value of Shares or Units of Stock That Have Not Vested($) (4) |
Equity Incentive Plan Awards: Number of Unearned Shares, Units or Other Rights That Have Not Vested (#)(5) |
Equity Incentive Plan Awards: Market or Payout Value of Unearned Shares, Units or Other Rights That Have Not Vested ($)(4) |
|||||||||||||||||||||||||||
| Kevin M. Sheehan |
|
7/23/09 10/13/10 10/13/10 |
|
|
— — — |
|
|
— — — |
|
|
— — — |
|
|
— — — |
|
|
45,000 25,000 — |
(6) (7)
|
|
1,189,320 220,000 — |
|
|
75,000 25,000 100,000 |
|
|
1,756,300 367,280 1,105,760 |
| |||||||||
| Wendy A. Beck |
10/13/10 | — | — | — | — | 30,000 | (8) | 264,000 | 30,000 | 440,720 | ||||||||||||||||||||||||||
| Andrew Stuart |
|
7/23/09 8/19/02 8/23/04 |
|
|
— 501,514 126,549 |
|
|
— — — |
|
|
— .3621 .2085 |
|
|
— 8/18/12 8/22/14 |
|
|
24,000 — — |
(6)
|
|
634,320 — — |
|
|
40,000 — — |
|
|
936,700 — — |
| |||||||||
| Maria Miller |
6/1/09 | — | — | — | — | 12,000 | (9) | 262,800 | 15,000 | 354,700 | ||||||||||||||||||||||||||
| Robert Becker |
|
7/23/09 12/18/09 |
|
|
— — |
|
|
— — |
|
|
— — |
|
|
— — |
|
|
7,500 2,100 |
(10) (10) |
|
164,280 45,998 |
|
|
12,500 3,500 |
|
|
295,500 104,552 |
| |||||||||
| (1) | Represents fully vested stock options to purchase common shares of Genting HK granted to Mr. Stuart under the Share Option Scheme adopted by Genting HK on August 23, 2000 (as effected on November 30, 2000 and amended on May 22, 2002). These options do not relate to the Company’s ordinary shares. |
| (2) | The amount in this column was converted to U.S. dollars using the exchange rate as of December 31, 2010 of 1 Hong Kong = U.S. $.1287. |
| (3) | Represents unvested Ordinary Profits Units subject to time-based vesting requirements (TBUs). |
| (4) | The value ascribed to the Ordinary Profits Units was calculated by an independent third party valuation firm. |
| (5) | Represents unvested Ordinary Profits Units subject to performance-based vesting requirements (PBUs). As described in the Description of Plan-Based Awards section above, these performance-based Ordinary Profits Units will vest upon a “realization event” for the Apollo Funds if, and to the extent that, the Apollo Funds receive specified levels of their invested capital in the Company in connection with the realization event. |
| (6) | 20% of the number of Time-Based Units will vest on each of January 7, 2011, 2012 and 2013. |
| (7) | 20% of the number of Time-Based Units will vest on each of September 15, 2011, 2012, 2013, 2014 and 2015. |
| (8) | 20% of the number of Time-Based Units will vest on each of September 20, 2011, 2012, 2013, 2014 and 2015. |
| (9) | 20% of the number of Time-Based Units will vest on each of June 1, 2011, 2012, 2013 and 2014. |
| (10) | 20% of the number of Time-Based Units will vest on each of March 17, 2011, 2012 and 2013. |
98
Table of Contents
OPTIONS EXERCISES AND STOCK VESTED IN 2010
The following table presents information regarding all stock options exercised and value received upon exercise, and all stock awards vested and the value realized upon vesting, by the Named Executive Officers during 2010.
| OPTION AWARDS | STOCK AWARDS | |||||||||||||||
| Name |
Number
of Shares Acquired on Exercise (#) |
Value Realized on Exercise ($) |
Number of Shares Acquired on Vesting (#) |
Value Realized on Vesting ($)(1) |
||||||||||||
| Kevin M. Sheehan |
— | — | 15,000 | 396,440 | ||||||||||||
| Wendy A. Beck |
— | — | — | — | ||||||||||||
| Andrew Stuart |
— | — | 8,000 | 211,440 | ||||||||||||
| Maria Miller |
— | — | 3,000 | 65,700 | ||||||||||||
| Robert Becker |
— | — | 3,200 | 70,093 | ||||||||||||
| (1) | During 2010, a portion of the Ordinary Profits Unit awards that are subject to time-based vesting (TBUs) became vested. The value ascribed to the vested units was calculated by an independent third party valuation firm, and this value may ultimately not be realized by the Named Executive Officers. |
NONQUALIFIED DEFERRED COMPENSATION
The following table presents information on contributions to, earnings accrued under and distributions to our Named Executive Officers from our nonqualified defined contribution plans during the fiscal year ended December 31, 2010.
| Name |
Plan Name | Executive Contributions in FY 2010 ($) |
Registrant Contributions in FY 2010 ($)(1) |
Aggregate Earnings in FY 2010 ($)(2) |
Aggregate Withdrawals/ Distributions ($)(3) |
Aggregate Balance at End FY 2010 ($) |
||||||||||||||||
| Kevin M. Sheehan |
SERP | — | 396,584 | 5,297 | 337,450 | 337,449 | ||||||||||||||||
| SMRSP | — | — | — | — | — | |||||||||||||||||
| Wendy A. Beck |
SERP | — | — | — | — | — | ||||||||||||||||
| SMRSP | — | — | — | — | — | |||||||||||||||||
| Andrew Stuart |
SERP | — | 116,807 | 7,922 | 116,807 | 416,271 | ||||||||||||||||
| SMRSP | — | 10,915 | 1,540 | 10,915 | 80,923 | |||||||||||||||||
| Maria Miller |
SERP | — | — | — | — | — | ||||||||||||||||
| SMRSP | — | — | — | — | — | |||||||||||||||||
| Robert Becker |
SERP | — | — | — | — | — | ||||||||||||||||
| SMRSP | — | — | — | — | — | |||||||||||||||||
| (1) | Company contributions in this column are reported in the All Other Compensation Column in the Summary Compensation Table above. |
| (2) | Aggregate earnings in the last fiscal year are not included in the Summary Compensation Table because they are not above market or preferential as determined by SEC rules. |
| (3) | Represents amounts credited to plan accounts that vested in 2010 and were distributed in 2010 in order to comply with and avoid adverse tax consequences under applicable tax rules. |
The Company maintains the Supplemental Executive Retirement Plan (“SERP”), which is an unfunded defined contribution plan for certain of our executives, including Messrs. Sheehan and Stuart, who were employed by the Company in an executive capacity prior to 2008. The Company made contributions on behalf of the participants to compensate them for the benefits that are limited under the 401(k) Plan. We credit participants under the SERP Plan for amounts that would have been contributed by us to the Company’s previous Defined Contribution Retirement Plan and the former 401(k) Plan without regard to any limitations imposed by the Code.
99
Table of Contents
Participants do not make contributions to this plan. Participant accounts are credited with earnings based upon the rate of return in the JPMorgan Chase Bank Stable Asset Income Fund, subject to a 5% maximum. For 2010, the rate of return used was 1.94%. In order to comply with and avoid adverse consequences under recently enacted applicable tax rules, plan accruals for services performed or payments which become vested after December 31, 2008 will be distributed in the year that services were performed. Vested, accrued balances for services performed prior to December 31, 2008 continue to accrue interest and will be distributed upon the first to occur of termination, death or disability or December 31, 2017. No withdrawals are permitted under the SERP.
The Company also maintains the Senior Management Retirement Savings Plan (“SMRSP”), which is an unfunded defined contribution plan for certain of our employees, including Mr. Stuart, who were employed by the Company prior to 2001. Mr. Stuart is the only Named Executive Officer who is eligible to participate in the SMRSP. The Company made contributions on behalf of the participants to compensate them for difference between the qualified plan benefits that were previously available under the Company’s cash balance pension plan and the redesigned 401(k) Plan. We credit participants under the SMRSP Plan for the difference in the amount that would have been contributed by us to the Company’s previous Norwegian Cruise Line Pension Plan and the qualified plan maximums of the new 401(k) Plan. Participants do not make contributions to this plan. Participant accounts are credited with earnings based upon the rate of return in the JPMorgan Chase Bank Stable Asset Income Fund, subject to a 5% maximum. For 2010, the rate of return used was 1.94%. In order to comply with and avoid adverse consequences under recently enacted applicable tax rules, plan accruals for services performed or payments which become vested after December 31, 2008 will be distributed in the year that services were performed. Vested, accrued balances for services performed prior to December 31, 2008 continue to accrue interest and will be distributed upon the first to occur of termination, death or disability or December 31, 2017. No withdrawals are permitted under the SMRSP.
Potential Payments Upon Termination or Change in Control
The following section describes the benefits that may become payable to the Named Executive Officers in connection with a termination of their employment and/or a change in control of the Company. All of the benefits described below would be provided by us. Please see “Compensation Discussion and Analysis” above for a discussion of how the level of these benefits was determined.
In addition to the benefits described below, as described in the section “Description of Plan-Based Awards—Equity Incentive Plan Awards” above, outstanding performance-based profits interest awards (PBUs) held by our Named Executive Officers may also become vested in connection with a change in control if the change in control constitutes a “realization event” under the Profit Sharing Agreement and the applicable vesting conditions are satisfied. Our Named Executive Officers will also be entitled to receive any accrued benefits disclosed above under “2010 Nonqualified Deferred Compensation” in connection with a termination of their employment.
Kevin M. Sheehan
Mr. Sheehan’s employment agreement with the Company, described above under the heading “Description of Employment Agreements—Salary and Bonus Amounts,” provides for certain benefits to be paid to Mr. Sheehan in connection with a termination of his employment with the Company under the circumstances described below. In each case, Mr. Sheehan is entitled to receive all amounts that he has earned but are unpaid regardless of the circumstances under which his employment terminates (his “accrued obligations”).
Severance Benefits—Termination of Employment. In the event that Mr. Sheehan’s employment is terminated during the employment term either by the Company without “cause” or by Mr. Sheehan as a result of a “constructive termination” (as those terms are defined in the employment agreement) or because the Company elects not to extend the term of his employment agreement, Mr. Sheehan will be entitled to receive:
| • | a lump sum payment equal to two times the sum of his current base salary, plus his target bonus for the year in which the termination occurs; and |
100
Table of Contents
| • | continuation of medical and dental coverage for Mr. Sheehan and his eligible dependents on substantially the same terms and conditions provided to active employees of the Company until the first to occur of: (i) the end of the month in which he turns 65; (ii) the date of his death; (iii) the date he becomes eligible for Medicare benefits under the Social Security Act, or; (iv) the date he becomes eligible for coverage under the health plan of a future employer. |
In addition, if Mr. Sheehan’s employment is terminated by the Company without cause or by Mr. Sheehan as a result of a constructive termination, Mr. Sheehan is entitled to accelerated vesting of one-third of the total number of Ordinary Profits Units originally granted to Mr. Sheehan in July 2009 that are outstanding and unvested on his severance date. In connection with a “sale of the company” (as defined in the Profits Sharing Agreement, but which generally would result in a change in control of the Company), Mr. Sheehan is entitled to accelerated vesting of any then unvested Ordinary Profits Units originally granted in July 2009 that are subject to time-based vesting requirements (TBUs).
Mr. Sheehan’s right to receive the severance benefits described above is subject to him executing a release of claims in favor of the Company.
Severance Benefits—Other Terminations. In the event that Mr. Sheehan’s employment is terminated for any other reason (death, disability, by the Company for cause or by Mr. Sheehan other than for constructive termination), he will only be entitled to receive his accrued obligations.
Restrictive Covenants. Pursuant to Mr. Sheehan’s employment agreement, he has agreed not to disclose any confidential information of the Company and its affiliates at any time during or after his employment with the Company. In addition, Mr. Sheehan has agreed that for a period of one year after his employment terminates he will not compete with the business of the Company or its affiliates, for a period of two years after his employment terminates, he will not solicit the employees of the Company or its affiliates and for a period of one year after his employment terminates, he will not solicit the customers of the Company or its affiliates.
Other Named Executive Officers.
The employment agreement of each of the Named Executive Officers (other than Mr. Sheehan) with the Company, described above under the heading “Description of Employment Agreements—Salary and Bonus Amounts,” provides for certain benefits to be paid to the Named Executive Officer in connection with a termination of his or her employment with the Company under the circumstances described below. In each case, the Named Executive Officer is entitled to receive all amounts that he or she has earned but are unpaid regardless of the circumstances under which his or her employment terminates (his or her “accrued obligations”).
Severance Benefits—Termination of Employment. In the event that the Named Executive Officer’s employment is terminated during the employment term by the Company without “cause”, the Named Executive Officer will be entitled to receive:
| • | an amount equal to one times the executive’s then current base salary at the annualized rate in effect on the severance date, payable over a twelve month period in accordance with the Company’s regular payroll cycle practices following termination, and; |
| • | continuation of medical and dental coverage for the executive and his or her eligible dependents on substantially the same terms and conditions in effect on his or her termination until the first to occur of: (i) twelve months following termination, (ii) the date of his or her death; (iii) the date he or she becomes eligible for coverage under the health plan of a future employer; or (iv) the date the Company is no longer obligated to offer COBRA continuation coverage to the executive. |
Each Named Executive Officer’s right to receive the severance benefits described above is subject to him or her executing a release of claims in favor of the Company.
101
Table of Contents
Severance Benefits—Other Terminations. In the event that the Named Executive Officer’s employment is terminated by the Company for any other reason (death, disability, by the Company for cause or by the Named Executive Officer other than for constructive termination), he or she will only be entitled to receive his or her accrued obligations.
Restrictive Covenants. Pursuant to each Named Executive Officer’s employment agreement, each Named Executive Officer has agreed not to disclose any confidential information of the Company and its affiliates at any time during or after his or her employment with the Company. In addition, each Named Executive Officer has agreed that for a period of one year after his or her employment terminates he or she will not compete with the business of the Company or its affiliates and for a period of two years after his or her employment terminates, the executive will not solicit the employees or customers of the Company or its affiliates.
Estimated Severance and Change in Control Benefits
The following table presents the Company’s estimate of the amount of the benefits to which each of the Named Executive Officers would have been entitled had his or her employment been terminated or a change in control occurred on December 31, 2010 under scenarios noted below.
| NAME |
Voluntary Termination or Cause |
Death, Disability or Retirement |
Without Cause or Good Reason |
Change in Control (No Termination) |
||||||||||||
| Kevin M. Sheehan |
||||||||||||||||
| Severance Payment |
— | — | $ | 3,071,016 | — | |||||||||||
| Insurance Continuation |
— | — | $ | 96,526 | — | |||||||||||
| Equity Acceleration |
— | — | $ | 981,873 | (1) | $ | 1,189,320 | (2) | ||||||||
| Wendy A. Beck |
||||||||||||||||
| Severance Payment |
— | — | $ | 500,000 | — | |||||||||||
| Insurance Continuation |
— | — | $ | 18,758 | — | |||||||||||
| Equity Acceleration |
— | — | — | — | ||||||||||||
| Andrew Stuart |
||||||||||||||||
| Severance Payment |
— | — | $ | 468,400 | — | |||||||||||
| Insurance Continuation |
— | — | $ | 18,718 | — | |||||||||||
| Equity Acceleration |
— | — | — | — | ||||||||||||
| Maria Miller |
||||||||||||||||
| Severance Payment |
— | — | $ | 357,000 | — | |||||||||||
| Insurance Continuation |
— | — | $ | 12,224 | — | |||||||||||
| Equity Acceleration |
— | — | — | — | ||||||||||||
| Robert Becker |
||||||||||||||||
| Severance Payment |
— | — | $ | 257,550 | — | |||||||||||
| Insurance Continuation |
— | — | $ | 18,466 | — | |||||||||||
| Equity Acceleration |
— | — | — | — | ||||||||||||
| (1) | Value was determined by taking the fair value associated with Mr. Sheehan’s July 2009 aggregate unvested Ordinary Profits Units subject to acceleration as of December 31, 2010. |
| (2) | Value was determined by taking the fair value associated with Mr. Sheehan’s July 2009 unvested Time-Based Units subject to acceleration as of December 31, 2010. |
New Long-Term Incentive Plan
Prior to the consummation of this offering, our Board adopted, and our shareholders approved, a new long-term incentive plan to provide an additional means through the grant of awards to attract, motivate, retain and reward selected employees and other eligible persons. Employees, officers, directors, and consultants that provide services to us or one of our subsidiaries may be selected to receive awards under the plan.
102
Table of Contents
The Compensation Committee will administer the plan. The administrator of the plan has broad authority to:
| • | select participants and determine the types of awards that they are to receive; |
| • | determine the number of shares that are to be subject to awards and the terms and conditions of awards, including the price (if any) to be paid for the shares or the awards and establish the vesting conditions (if applicable) of such shares or awards; |
| • | cancel, modify or waive our rights with respect to, or modify, discontinue, suspend or terminate any or all outstanding awards, subject to any required consents; |
| • | construe and interpret the terms of the plan and any agreements relating to the plan; |
| • | accelerate or extend the vesting or exercisability or extend the term of any or all outstanding awards subject to any required consent; |
| • | subject to the other provisions of the plan, make certain adjustments to an outstanding award and authorize the termination, conversion, substitution or succession of an award; and |
| • | allow the purchase price of an award or our ordinary shares to be paid in the form of cash, check or electronic funds transfer, by the delivery of previously-owned shares or by a reduction of the number of shares deliverable pursuant to the award, by services rendered by the recipient of the award, by notice and third party payment or cashless exercise on such terms as the administrator may authorize, or any other form permitted by law. |
A total of of our ordinary shares are authorized for issuance with respect to awards granted under the plan. Any shares subject to awards that are not paid, delivered or exercised before they expire or that are canceled or terminated, fail to vest, as well as shares used to pay the purchase or exercise price of awards or related tax withholding obligations, will become available for other award grants under the plan.
Awards under the plan may be in the form of incentive or nonqualified stock options, stock appreciation rights, stock bonuses, restricted stock, stock units, performance stock, phantom stock, dividend equivalents and other forms of awards including cash awards (such as annual bonuses or other types of cash incentives). Awards under the plan generally will not be transferable other than by will or the laws of descent and distribution, except that the plan administrator may authorize certain transfers.
Nonqualified and incentive stock options may not be granted at prices below the fair market value of the underlying ordinary shares on the date of grant. Incentive stock options must have an exercise price that is at least equal to the fair market value of the underlying ordinary shares, or 110% of fair market value for incentive stock option grants to any 10% owner of ordinary shares, on the date of grant. These and other awards may also be issued solely or in part for services. Awards are generally paid in cash or our ordinary shares. The plan administrator may provide for the deferred payment of awards and may determine the terms applicable to deferrals.
As is customary in incentive plans of this nature, the number and type of shares available under the plan and any outstanding awards, as well as the exercise or purchase prices of awards, will be subject to adjustment in the event of certain reorganizations, mergers, combinations, recapitalizations, stock splits, stock dividends, or other similar events that change the number or kind of shares outstanding, and extraordinary dividends or distributions of property to the shareholders. In no case (except due to an adjustment referred to above or any repricing that may be approved by our shareholders) will any adjustment be made to a stock option or stock appreciation right award under the plan (by amendment, cancellation and regrant, exchange or other means) that would constitute a repricing of the per-share exercise or base price of the award.
Generally, and subject to limited exceptions set forth in the plan, if we dissolve or undergo certain corporate transactions such as a merger, business combination, consolidation, or other reorganization; exchange of our ordinary shares; a sale of substantially all of our assets; or any other event in which we are not the surviving
103
Table of Contents
entity, all awards then-outstanding under the plan will become fully vested or payable, as applicable, and will terminate or be terminated in such circumstances, unless the plan administrator provides for the assumption, substitution or other continuation of the award. The plan administrator also has the discretion to establish other change in control provisions with respect to awards granted under the plan. For example, the administrator could provide for the acceleration of vesting or payment of an award in connection with a corporate event that is not described above and provide that any such acceleration shall be automatic upon the occurrence of any such event.
Our Board of Directors may amend or terminate the plan at any time, but no such action will affect any outstanding award in any manner materially adverse to a participant without the consent of the participant. Plan amendments will be submitted to shareholders for their approval as required by applicable law or any applicable listing agency. The plan is not exclusive—our Board of Directors and Compensation Committee may grant stock and performance incentives or other compensation, in stock or cash, under other plans or authority.
The plan will terminate ten years following the adoption of the plan. However, the plan administrator will retain its authority until all outstanding awards are exercised or terminated. The maximum term of options, stock appreciation rights and other rights to acquire ordinary shares under the plan is ten years after the initial date of the award.
104
Table of Contents
DIRECTOR COMPENSATION
The following table presents information on compensation to the following individuals for the services provided as a director during the fiscal year ended December 31, 2010.
| Name (a) |
Fees Earned or Paid in Cash ($) (b) |
Stock Awards ($) (c) |
Option Awards ($) (d) |
Non-Equity Incentive Plan Compensation ($) (e) |
Change in Pension Value and Nonqualified Deferred Compensation Earnings ($) (f) |
All Other Compensation ($) (g) |
Total ($) (h) |
|||||||||||||||||||||
| Walter L. Revell (1) |
97,000 | — | — | — | — | — | 97,000 | |||||||||||||||||||||
| Tan Sri Lim Kok Thay |
— | — | — | — | — | — | — | |||||||||||||||||||||
| David Chua Ming Huat |
— | — | — | — | — | — | — | |||||||||||||||||||||
| Marc J. Rowan |
— | — | — | — | — | — | — | |||||||||||||||||||||
| Steve Martinez |
— | — | — | — | — | — | — | |||||||||||||||||||||
| Adam M. Aron |
— | — | — | — | — | — | — | |||||||||||||||||||||
| Karl Peterson |
— | — | — | — | — | — | — | |||||||||||||||||||||
| (1) | Mr. Revell’s compensation relates to his role as director, as well as Chairman of the Audit Committee. No other directors receive any form of compensation for their services in the capacity as a director. |
105
Table of Contents
SECURITY OWNERSHIP OF CERTAIN BENEFICIAL OWNERS AND MANAGEMENT
The following table sets forth information regarding the beneficial ownership of the equity securities of the Issuer: (1) immediately prior to the consummation of this offering; and (2) as adjusted to reflect the sale of the ordinary shares in this offering based upon an assumed initial public offering price of $ per ordinary share, which is the midpoint of the estimated price set forth on the cover of this prospectus, owned by:
| • | each person that is a beneficial owner of more than 5% of the Issuer’s outstanding equity securities; |
| • | each of the Issuer’s named executive officers; |
| • | each of the Issuer’s directors; and |
| • | all directors and named executive officers as a group. |
On January 7, 2008, the Apollo Funds became the owner of 50% of the then outstanding ordinary shares of NCL Corporation Ltd. pursuant to the Subscription Agreement (as defined in “Certain Relationships and Related Party Transactions—The Subscription Agreement”) and an assignment agreement dated January 7, 2008 by and among NCL Corporation Ltd., NCL Investment Limited and NCL Investment II Ltd. (with respect to the assignment agreement only), each an affiliate of the Apollo Funds, and Genting HK. On January 8, 2008, the TPG Viking Funds acquired, in the aggregate, 12.5% of the then outstanding ordinary shares of NCL Corporation Ltd. from the Apollo Funds for $250.0 million. Prior to these transactions, Genting HK owned 100% of our ordinary shares. Additional information with respect to Genting HK, the Apollo Funds and the TPG Viking Funds and their relationship with us is provided under the caption “Certain Relationships and Related Party Transactions.” Pursuant to a shareholders’ agreement, dated August 17, 2007, among NCL Corporation Ltd., Genting HK and NCL Investment Limited (the “Shareholders’ Agreement”), Genting HK, subject to certain consent rights, granted to the Apollo Funds the right to vote its ordinary shares. The Shareholders’ Agreement became effective on January 7, 2008. Both NCL Investment II Ltd. and Star NCLC Holdings Ltd. (on January 7, 2008), along with the TPG Viking Funds (on January 8, 2008), became parties to the Shareholders’ Agreement through separate joinder agreements. Each of the TPG Viking Funds which purchased ordinary shares is considered a permitted transferee of the Apollo Funds and all ordinary shares purchased by the TPG Viking Funds are deemed owned by the Apollo Funds under the Shareholders’ Agreement. The Shareholders’ Agreement will be amended and restated in connection with the consummation of this offering, and will thereafter relate to the Issuer’s ordinary shares rather than the ordinary shares of NCL Corporation Ltd. The Apollo Funds, Genting HK and the TPG Viking Funds or their affiliates will become beneficial owners of the equity securities of the Issuer pursuant to the Corporate Reorganization. See “Certain Relationships and Related Party Transactions” and “Prospectus Summary—Recent Developments—Corporate Reorganization” for more details on the Shareholders’ Agreement and the Corporate Reorganization.
There will be ordinary shares issued and outstanding after the consummation of this offering (assuming no exercise of the underwriters’ option to purchase additional ordinary shares) based upon an assumed initial public offering price of $ per ordinary share, which is the midpoint of the estimated price range set forth on the cover of this prospectus. In connection with the Corporate Reorganization and prior to the consummation of this offering, we will issue an economically equivalent number of our ordinary shares, based on the initial public offering price in this offering, in exchange for all outstanding NCL Corporation Ltd. profits interests granted under the Profits Sharing Agreement, including the Ordinary Profits Units (each as described in “Compensation Discussion & Analysis”).
There will be additional ordinary shares available for future awards under our new long-term incentive plan as of the consummation of this offering.
A $1.00 increase or decrease in the assumed offering price of $ per ordinary share, which is the midpoint of the initial public offering price range set forth on the cover of this prospectus, would increase or
106
Table of Contents
decrease the number of ordinary shares to be outstanding after this offering by approximately shares as a result of an increase or decrease in the ordinary shares we will issue in exchange for the profits interests, assuming the number of ordinary shares offered by us, as set forth above and on the cover page of the prospectus, remains the same.
The amounts and percentages of ordinary shares beneficially owned are reported on the basis of regulations of the SEC governing the determination of beneficial ownership of securities (including as further described in the footnotes to the following table). Under the rules of the SEC, a person is deemed to be a “beneficial owner” of a security if that person has or shares “voting power,” which includes the power to vote or to direct the voting of such security, or “investment power,” which includes the power to dispose of or to direct the disposition of such security. A person is also deemed to be a beneficial owner of any securities of which that person has a right to acquire beneficial ownership within 60 days. Under these rules, more than one person may be deemed a beneficial owner of the same securities and a person may be deemed a beneficial owner of securities as to which he has no economic interest. Except as otherwise indicated in the footnotes below and except as provided in the Shareholders’ Agreement described below, each of the beneficial owners has, to our knowledge, sole voting and investment power with respect to the indicated ordinary shares. Unless indicated otherwise, the address of each individual listed in the table is c/o Norwegian Cruise Line Holdings Ltd., 7665 Corporate Center Drive, Miami, Florida 33126.
| Name and Address |
Number and Percent of Shares Beneficially Owned Immediately Prior to this Offering |
Percent of Shares Beneficially Owned After this Offering Assuming no Exercise of the Option to Purchase Additional Shares |
Percent of Shares Beneficially Owned After this Offering Assuming Full Exercise of the Option to Purchase Additional Shares | |||||||||
| Number | Percent | |||||||||||
| Genting HK(1) |
10,500,000 | 50.0 | % | |||||||||
| Apollo Funds(2) |
7,875,000 | 37.5 | % | |||||||||
| TPG Viking Funds(3) |
2,625,000 | 12.5 | % | |||||||||
| Tan Sri Lim Kok Thay(1)(4) |
— | |||||||||||
| David Chua Ming Huat(1)(4) |
— | |||||||||||
| Marc J. Rowan(2)(5) |
— | |||||||||||
| Steve Martinez(2)(5) |
— | |||||||||||
| Adam M. Aron(2)(5) |
— | |||||||||||
| Karl Peterson(6) |
— | |||||||||||
| Walter L. Revell |
— | |||||||||||
| Kevin M. Sheehan |
— | |||||||||||
| Wendy A. Beck |
— | |||||||||||
| Andrew Stuart |
— | |||||||||||
| Maria Miller |
— | |||||||||||
| Robert Becker |
— | |||||||||||
| All directors and named executive officers as a group (12 persons) |
— | |||||||||||
107
Table of Contents
| (1) | Genting HK owns our ordinary shares indirectly through Star NCLC Holdings Ltd., a Bermuda wholly-owned subsidiary. The address of each of Genting HK and Star NCLC Holdings Ltd. is c/o Suite 1501, Ocean Centre, 5 Canton Road, Tsimshatsui, Kowloon, Hong Kong SAR. As of June 30, 2011, the principal shareholders of Genting HK are: |
| Percentage Ownership in Genting HK |
||||
| Golden Hope Limited (“GHL”)(a) |
45.32 | % | ||
| Genting Malaysia Berhad (“GENM”)(b) |
18.44 | % | ||
| (a) | GHL is a company incorporated in the Isle of Man acting as trustee of the Golden Hope Unit Trust, a private unit trust which is held directly and indirectly by IFG International Trust Company Limited as trustee of a discretionary trust, the beneficiaries of which are Tan Sri Lim Kok Thay and certain members of his family (the “Lim Family”). |
| (b) | GENM is a Malaysian company listed on the Main Market of Bursa Malaysia Securities Berhad in which Parkview Management Sdn Bhd as trustee of a discretionary trust, the beneficiaries of which are the Lim Family, has a substantial indirect beneficial interest. |
As a result, an aggregate of 63.76% of Genting HK’s outstanding shares is owned by GENM and GHL as trustee of the Golden Hope Unit Trust, directly or indirectly, as of December 31, 2010.
| (2) | Includes 2,795,968 ordinary shares of the Company owned of record by NCL Investment Limited and 5,079,032 ordinary shares of the Company owned of record by NCL Investment II Ltd., each of which is an affiliate of the Apollo Funds. After giving effect to the Corporate Reorganization and immediately following the consummation of this offering, NCL Investment Limited will liquidate and distribute all of its ordinary shares of the Issuer to its shareholders, and NCL Investment II Ltd. will exchange all of its ordinary shares of the Issuer for limited partnership interests in certain of the Apollo Funds, as a result of which AAA Guarantor—Co-Invest VI, L.P., AIF VI Euro Holdings, L.P., Apollo Overseas Partners (Delaware) VI, L.P., Apollo Overseas Partners (Delaware 892) VI, L.P., Apollo Overseas Partners VI, L.P. and Apollo Overseas Partners (Germany) VI, L.P will own of record an aggregate of ordinary shares of the Issuer. NCL Investment Limited and NCL Investment II Ltd. (and following the consummation of this offering, the Apollo Funds will) have the right to vote the 10,500,000 ordinary shares of us or of the Issuer, as applicable, held by affiliates of Genting HK in connection with certain transactions that require the vote of our shareholders (or those of the Issuer, as applicable) and to consent to certain transfers of such shares and of the 2,625,000 ordinary shares held by the affiliates of the TPG Viking Funds. See “Certain Relationships and Related Party Transactions—The Shareholders’ Agreement.” Apollo Overseas Partners VI, L.P., Apollo Overseas Partners (Delaware) VI, L.P., Apollo Overseas Partners (Delaware 892) VI, L.P. and Apollo Overseas Partners (Germany) VI, L.P. are the current shareholders of NCL Investment Limited. The Apollo affiliate that serves as the general partner or managing general partner of each of these Apollo Funds is an affiliate of Apollo Principal Holdings I, L.P. Apollo Principal Holdings I GP, LLC is the general partner of Apollo Principal Holdings I, L.P. The Apollo affiliate that serves as the general partner of AIF VI Euro Holdings, L.P. is an affiliate of Apollo Principal Holdings III, L.P. Apollo Principal Holdings III GP, Ltd. is the general partner of Apollo Principal Holdings III, L.P. The Apollo affiliate that serves as the general partner of AAA Guarantor–Co-Invest VI, L.P. has entered into a management services agreement with an affiliate of Apollo Management Holdings, L.P. The Apollo affiliate that serves as the manager of each of the Apollo Funds that is a shareholder of NCL Investment Limited, and as the manager of the sole shareholder of NCL Investment II Ltd., and the Apollo affiliates that serve as the respective managers of AAA Guarantor–Co-Invest VI, L.P. and of AIF VI Euro Holdings, L.P., are also each affiliates of Apollo Management Holdings, L.P. Apollo Management Holdings GP, LLC is the general partner of Apollo Management Holdings, L.P. Apollo and its affiliates, including each of the Apollo Funds and the other Apollo entities described above, disclaims beneficial ownership of the ordinary shares of ours and of the Issuer, as applicable, held of record or beneficially owned by any of NCL Investment Limited, NCL Investment II Ltd., any of the Apollo Funds, or any of the other Apollo entities described above, except to |
108
Table of Contents
| the extent of any pecuniary interest therein. The address for NCL Investment Limited is Clarendon House, 2 Church Street, Hamilton HM 11, Bermuda. The address for each of Apollo Overseas Partners (Delaware) VI, L.P., Apollo Overseas Partners (Delaware 892) VI, L.P., Apollo Principal Holdings I, L.P. and Apollo Principal Holdings I GP, LLC is One Manhattanville Road, Suite 201, Purchase, New York 10577. The address for each of NCL Investment II Ltd., Apollo Overseas Partners VI, L.P., Apollo Overseas Partners (Germany) VI, L.P., AIF VI Euro Holdings, L.P., Apollo Principal Holdings III, L.P. and Apollo Principal Holdings III GP, Ltd. is c/o Walkers Corporate Services Limited, P.O. Box 908-GT, Walker House, 87 Mary Street, George Town, Grand Cayman KY1-9005, Cayman Islands. The address for AAA Guarantor–Co-Invest VI, L.P. is Trafalgar Court, Les Banques, GY1 3QL, St. Peter Port, Guernsey, Channel Islands. The address for Apollo Management Holdings, L.P. and Apollo Management Holdings GP, LLC is 9 W. 57th Street, 43rd Floor, New York, NY 10019. |
| (3) | Includes (i) 1,957,525 ordinary shares of the Company held by TPG Viking I, L.P., a Cayman Islands exempted limited partnership (“Viking I”), (ii) 576,118 ordinary shares of the Company held by TPG Viking II, L.P., a Cayman Islands exempted limited partnership (“Viking II”), and (iii) 91,357 ordinary shares of the Company held by TPG Viking AIV III, L.P., a Delaware limited partnership (“Viking AIV III”). Pursuant to the Corporate Reorganization and immediately following the consummation of this offering, Viking I will liquidate and distribute all of its ordinary shares of the Issuer to its direct or indirect partners, and Viking II will liquidate and distribute all of its ordinary shares of the Issuer to its direct or indirect partners, as a result of which, and certain other related transactions, TPG Viking, L.P., a Delaware limited partnership (“Viking L.P.”), TPG Viking AIV I, L.P., a Cayman Islands exempted limited partnership (“Viking AIV I”), TPG Viking AIV II, L.P., a Cayman Islands exempted limited partnership (“Viking AIV II”) and Viking AIV III will hold an aggregate of ordinary shares of the Issuer. The general partner of Viking L.P. is TPG GenPar V, L.P., a Delaware limited partnership, whose general partner is TPG GenPar V Advisors, LLC, a Delaware limited liability company, whose sole member is TPG Holdings I, L.P., a Delaware limited partnership, whose general partner is TPG Holdings I-A, LLC, a Delaware limited liability company, whose sole member is TPG Group Holdings (SBS), L.P., a Delaware limited partnership (“Group Holdings”), whose general partner is TPG Group Holdings (SBS) Advisors, Inc., a Delaware company (“Group Advisors”). The general partner of each of Viking AIV I, Viking AIV II and Viking AIV III is TPG Viking AIV GenPar, L.P., a Cayman Islands exempted limited partnership, whose general partner is TPG Viking AIV GenPar Advisors, Inc., a Cayman Islands exempted company whose sole shareholder is TPG Holdings III, L.P., a Delaware limited partnership, whose general partner is TPG Holdings III-A, L.P., a Delaware limited partnership, whose general partner is TPG Holdings III-A, Inc., a Cayman Islands exempted company, whose sole shareholder is Group Holdings. David Bonderman and James G. Coulter are directors, officers and sole shareholders of Group Advisors and may therefore be deemed to be the beneficial owners of the ordinary shares held by Viking L.P., Viking AIV I, Viking AIV II and Viking AIV III (the “TPG Shares”). The address of each of the TPG Viking Funds, Group Advisors and Messrs. Bonderman and Coulter is c/o TPG Capital, L.P., 301 Commerce Street, Suite 3300, Fort Worth, Texas 76102. |
| (4) | Although each of Tan Sri Lim Kok Thay and David Chua Ming Huat may be deemed a beneficial owner of shares of the Company beneficially owned by Genting HK due to his status as a director or officer (and, in the case of Tan Sri Lim Kok Thay, his status as a shareholder) of Genting HK, each such person disclaims beneficial ownership of any such shares, except in the case of Tan Sri Lim Kok Thay, to the extent of any indirect pecuniary interests therein. The address of Tan Sri Lim Kok Thay and David Chua Ming Huat is c/o Suite 1501, Ocean Centre, 5 Canton Road, Tsimshatsui, Kowloon, Hong Kong SAR. |
| (5) | Each of Messrs. Rowan, Martinez and Aron is affiliated with Apollo as a consultant, partner or senior partner of Apollo Management, L.P. or another affiliate of Apollo. Each such person disclaims beneficial ownership of any of our ordinary shares or of the ordinary shares of the Issuer that are beneficially owned by any of the Apollo Funds or Apollo’s other affiliates. The address of Messrs. Rowan, Martinez and Aron is c/o Apollo Management, L.P., 9 West 57th Street, 43rd floor, New York, New York 10019. |
| (6) | Mr. Peterson is one of our directors and also a partner of TPG Capital, which in turn is an affiliate of the TPG Viking Funds. Mr. Peterson does not have voting or investment power over, and disclaims beneficial ownership in, the TPG Shares. The address of Mr. Peterson is c/o TPG Capital, L.P., 301 Commerce Street, Suite 3300, Fort Worth, Texas 76102. |
109
Table of Contents
CERTAIN RELATIONSHIPS AND RELATED PARTY TRANSACTIONS
Review and Approval of Related Party Transactions
The audit committee of our Board of Directors is responsible for the review and approval of all related party transactions; however, the audit committee does not have a written policy regarding the approval of related party transactions. As part of its review and approval of a related party transaction, the audit committee considers:
| • | the nature of the related party’s interest in the transaction; |
| • | the material terms of the transaction, including the amount involved and type of transaction; |
| • | the importance of the transaction to the related party and to us; |
| • | whether the transaction would impair the judgment of a director or executive officer to act in our best interest; and |
| • | any other matters the audit committee deems appropriate. |
The Company believes that each of the following transactions was on terms at least as favorable to it as could have been obtained from an unaffiliated third party.
Transactions with Genting HK, Apollo and TPG Capital
In July 2010, we agreed to extend the Charter of Norwegian Sky from Genting HK to December 31, 2012. This agreement includes two one-year extension options which require the mutual consent of each party. The new agreement also provides us with an option to purchase the ship during the Charter period.
In November 2009, upon the expiration of the Charter, we returned Norwegian Majesty, which had been operated by us pursuant to a Charter arrangement, to Genting HK.
In July 2009, we entered into an agreement with Harrah’s Operating Company, Inc. (now known as Caesars Entertainment Operating Company, Inc.) establishing a marketing alliance which incorporates marketing resources and cross company marketing, purchasing and loyalty programs as well as customer and business intelligence capabilities for a term of three years.
In April 2009, our shareholders made an equity investment as stated above in “Security Ownership of Certain Beneficial Owners and Management.”
Prior to the consummation of this offering, the Issuer will be formed as a Bermuda exempted company with nominal issued capital. Our current shareholders will enter into Contribution and Exchange Agreements whereby immediately prior to the consummation of this offering, they will contribute all of their shares of the Company to the Issuer in exchange for a number of shares of the Issuer. After giving effect to the Contribution and Exchange Agreements and certain related internal share transfers among their respective affiliates, the Apollo Funds, the TPG Viking Funds and Genting HK will own shares of the new holding company in the amounts and manner described in “Security Ownership of Certain Beneficial Owners and Management.” See “Security Ownership of Certain Beneficial Owners and Management.”
The Reimbursement and Distribution Agreement
On August 17, 2007, we entered into the RDA with NCL Investment Limited and Genting HK which sets out arrangements in relation to the NCLA Business (as defined in the RDA), including the subsidizing by Genting HK of certain losses and expenses related to NCLA. The RDA became effective on January 7, 2008. Pursuant to the RDA, we withdrew Pride of Aloha from the Hawaii market effective May 11, 2008. Although we were required under the terms of the RDA to transfer Pride of Aloha to Genting HK, the parties subsequently agreed to re-flag Pride of Aloha into our international fleet and consequently we renamed and launched the ship
110
Table of Contents
as Norwegian Sky. Accordingly, as of December 31, 2008, in lieu of returning the ship, we recorded a liability to Genting HK in the amount of $280.7 million which was the net book value of Pride of Aloha as of December 31, 2008. As a result of the decision to withdraw Pride of Aloha from the Hawaii market, Genting HK was obligated to reimburse us for certain losses and expenses related to NCLA which totaled $56.0 million through December 31, 2008 that were paid to us in January 2009. Also, in January 2009, we transferred Norwegian Sky to Genting HK per the terms of the RDA, which settled the $280.7 million liability to Genting HK as of December 31, 2008.
Amounts due to Genting HK as of December 31, 2008 of $210.1 million, which were settled in January 2009, represent amounts primarily in connection with the RDA. For the year ended December 31, 2007, $3.7 million was reimbursed to us by Genting HK for ship-related costs.
In April 2009, we received $15.1 million from Genting HK for reimbursements in connection with improvements to Norwegian Dream which left our fleet upon expiration of the relevant Charter agreement.
In June 2009, in connection with the RDA, we agreed with Genting HK to assume and pay any and all costs and expenses related to the maintenance, lay up or docking of S.S. United States incurred on or prior to December 31, 2009. As part of this transaction, Genting HK agreed that we had satisfied in full our obligations under the RDA and they waived their rights, including title and ownership of, and any sale proceeds of, any assets (other than S.S. United States) of the NCLA Business including all assets related to our Polynesian Adventure Tours operations. This distribution of S.S. United States to Genting HK resulted in an equity transaction which reduced our property and equipment and additional paid-in capital by $15.0 million.
In December 2009, we reduced additional paid-in capital by $3.5 million pertaining to certain estimated tax positions relating to transactions amongst entities under common control.
The Shareholders’ Agreement
On August 17, 2007, NCL Corporation Ltd., NCL Investment Limited, a Bermuda company and an affiliate of the Apollo Funds, and Genting HK entered into the Shareholders’ Agreement to regulate the affairs relating to the Company’s management and the rights and obligations of NCL Investment Limited and Genting HK as shareholders. The Shareholders’ Agreement became effective on January 7, 2008. Both NCL Investment II Ltd., a Cayman Islands company and an affiliate of the Apollo Funds, and Star NCLC Holdings Ltd., a Bermuda company and a wholly-owned subsidiary of Genting HK, became parties to the Shareholders’ Agreement through separate joinder agreements on January 7, 2008; TPG Viking I, L.P., a Cayman Islands exempted limited partnership, TPG Viking II, L.P., a Cayman Islands limited partnership, and TPG Viking AIV III, L.P., a Delaware limited partnership, each an affiliate of TPG Capital, also became parties to the Shareholders’ Agreement through separate joinder agreements on January 8, 2008.
In connection with the consummation of this offering, the Issuer, the Apollo Funds, the TPG Viking Funds and Genting HK intend to enter into an amended and restated shareholders’ agreement on terms substantially similar to the existing Shareholders’ Agreement. The following description is of the amended and restated version of the Shareholders’ Agreement. References to the “Company” below refer to the “Issuer” and not its subsidiaries following the offering.
Subject to the terms and conditions described therein, including with regard to the nomination of independent directors, the Apollo Funds maintaining the Apollo Minimum Ratio (as defined below), and Genting HK maintaining the GHK Minimum Ratio (as defined below), the Shareholders’ Agreement entitles the Apollo Funds to nominate for election a majority of the directors on our Board of Directors and Genting HK to nominate for election the remainder of our non-independent directors to our Board of Directors.
For so long as the Apollo Minimum Ratio is maintained, the number of independent directors shall be maintained at an odd number and the majority of independent directors so required to be appointed shall be
111
Table of Contents
nominated for election to our Board of Directors or appointed to the applicable committee thereof by the Apollo Funds, and the remainder of independent directors so required to be appointed shall be nominated for election to our Board of Directors or appointed to the applicable committee thereof by Genting HK.
As of the consummation of this offering, pursuant to the Shareholders’ Agreement, the Company and the shareholders party thereto will take all actions as may be required to ensure that the number of directors will consist of nine members and that the members of our Board of Directors shall be comprised of Marc J. Rowan, Steve Martinez, Adam M. Aron and Karl Peterson, as nominees of the Apollo Funds, Tan Sri Lim Kok Thay and David Chua Ming Huat as nominees of Genting HK, Walter L. Revell as an independent director nominated by Genting HK. Additionally, the Apollo Funds and Genting HK each have a contractual right under the Shareholders’ Agreement to appoint one additional member to our Board of Directors prior to the consummation of this offering, which will increase the size of our Board of Directors from seven to nine members.
Pursuant to the Shareholders’ Agreement, the Company and the shareholders party thereto will take such actions as may be required to ensure that the directors of the Company shall be classified with respect to the time for which they severally hold office into three classes, as nearly equal in number as possible, with each director being elected to a three-year term and that such nominees to our Board of Directors will be classified as follows upon the consummation of this offering:
| Class I directors: | Tan Sri Lim Kok Thay, Marc J. Rowan and one of the two additional directors that certain of our shareholders have a right to appoint prior to the consummation of this offering pursuant to the Shareholders’ Agreement, whose terms will expire at the fiscal 2012 annual general meeting of shareholders; | |
| Class II directors: | Walter L. Revell, Adam M. Aron and one of the two additional directors that certain of our shareholders have a right to appoint prior to the consummation of this offering pursuant to the Shareholders’ Agreement, whose terms will expire at the fiscal 2013 annual general meeting of shareholders; and | |
| Class III directors: | Steve Martinez, Karl Peterson and David Chua Ming Huat, whose terms will expire at the fiscal 2014 annual general meeting of shareholders; | |
The term of each director shall continue until the election and qualification of a successor and be subject to such director’s earlier death, resignation or removal. Thereafter, at each annual general meeting of shareholders of the Issuer, the successors of the directors whose term expires at that meeting shall be elected to hold office for a term expiring at the annual general meeting of shareholders held in the third year following the year of their election.
The Shareholders’ Agreement will provide that the Company and the shareholders party thereto will take such actions as may be required to ensure that within 90 days of the consummation of this offering, the number of directors shall be a total of eleven members, a nominee of the Apollo Funds shall be appointed to serve on our Board of Directors as a Class II director and an individual designated by the Apollo Funds shall be appointed to serve as an independent director pursuant to the requirements of applicable law (including the rules of NASDAQ) and a Class I director to fill the vacancies resulting from such increase, and within one year of the consummation of this offering, the number of directors shall be a total of thirteen members, a nominee of the Apollo Funds shall be appointed to serve on our Board of Directors as a Class III director and an individual designated by the Apollo Funds shall be appointed to serve as an independent director pursuant to the requirements of applicable law (including the rules of NASDAQ) and a Class II director to fill such vacancies resulting from such increase.
Additionally, pursuant to the Shareholders’ Agreement, the chief executive officer of the Company is designated as a non-voting observer to be present at all meetings of our Board of Directors and all committees thereof (other than the audit committee and executive sessions of our Board of Directors and all committees thereof) and one individual designated by the TPG Viking Funds is designated as a non-voting observer to be present at all meetings of our Board of Directors and all committees thereof (other than the audit committee).
112
Table of Contents
As of the consummation of this offering, pursuant to the Shareholders’ Agreement, the Audit Committee will be composed of three members, who shall initially be Walter L. Revell, Steve Martinez and Adam M. Aron. Within 90 days of the consummation of this offering, the Issuer and the shareholders party to the Shareholders’ Agreement agree to take, or cause to be taken, such action as is necessary to ensure that a majority of the members of our audit committee are independent directors and within one year of the consummation of this offering, the Issuer and the shareholders party to the Shareholders’ Agreement agree to such action as is necessary to ensure that all of the members of the Audit Committee are independent directors.
As of the consummation of this offering, pursuant to the Shareholders’ Agreement, the Compensation Committee will be composed of three members who shall initially be Marc. J. Rowan, Steve Martinez and Tan Sri Lim Kok Thay.
As of the consummation of this offering, pursuant to the Shareholders’ Agreement, the Nominating and Governance Committee will be composed of three members who shall initially be David Chua Ming Hunt, Steve Martinez and Adam M. Aron.
Pursuant to the Shareholders’ Agreement, Genting HK, the Apollo Funds and the TPG Viking Funds will agree not to acquire any publicly traded equity securities of the Company without the prior written consent of (a) the Apollo Funds, with respect to any proposed acquisitions by Genting HK, (b) Genting HK, with respect to any proposed acquisitions by the Apollo Funds, (c) Genting HK and the Apollo Funds, with respect to any proposed acquisitions by the TPG Viking Funds; provided, however, that no consent shall be required with respect to the acquisition of any publicly traded equity securities of the Company by Genting HK, the Apollo Funds or the TPG Viking Funds if, at least ten business days prior to the proposed acquisition, such shareholder provides the Company with (i) written notice of the maximum number of shares it proposes to acquire, (ii) a written certification stating that the consummation of such acquisition will not result in the Company losing its exemption from taxation on gross income derived from the international operation of a ship or ships within the meaning of Section 883 of the Code and (iii) any additional forms or certificates reasonably requested by the Company, and the Audit Committee reasonably determines, taking into account the information provided by such shareholder and such additional information as the Audit Committee deems relevant, that such acquisition will not result in the Company losing its exemption from taxation on gross income derived from the international operation of a ship or ships within the meaning of Section 883 of the Code. No shareholder party to the Shareholders’ Agreement other than Genting HK, the Apollo Funds and the TPG Viking Funds will be permitted to acquire any publicly traded equity securities of the Company without the prior written consent of the Company.
Pursuant to the Shareholders’ Agreement, the shareholders party thereto will provide information or certifications as are reasonably requested by the Company or as are required under the terms of the Shareholders’ Agreement in order for the Company to comply with any regulatory filing or withholding requirements, including forms required by Section 883 of the Code; provided, however, except to the extent reasonably requested by the Company, a shareholder owing less than 5% of the vote and value of the Company shall not be required to provide such forms or to provide the identity of its direct or indirect owners.
Subject to Genting HK’s consent rights as described below, the Apollo Funds have the right to vote the shares of the Company held by Genting HK. In the event that the ratio of the aggregate number of equity securities of the Company held by the Apollo Funds (and certain of their permitted transferees, which includes the TPG Viking Funds) to the aggregate number of equity securities of the Company held by Genting HK (and certain of their permitted transferees) falls below 0.6 (the “Apollo Minimum Ratio”), these voting rights of the Apollo Funds will cease. Additionally, if the Apollo Minimum Ratio is no longer maintained, Apollo’s right to appoint a majority of the members of our Board of Directors will immediately terminate and from that time until the time, if any, that the NASDAQ listing rules require that a majority of the members of our Board of Directors be independent, Genting HK shall have the right to nominate for election a majority of the directors on our Board of Directors and Apollo shall have the right to nominate for election one or two directors based on the combined ownership percentage of Apollo and the TPG Viking Funds. The Apollo Funds also have the right to vote the
113
Table of Contents
TPG Viking Funds’ shares of the Company; such authority will terminate when the combined ownership of Company shares by the Apollo Funds and Genting HK (and certain of their respective permitted transferees, which includes, with respect to the Apollo Funds, the TPG Viking Funds) falls below 25% of the then total outstanding ordinary shares of the Company.
For as long as the ratio of the aggregate number of equity securities held by Genting HK (and certain of their permitted transferees) to the aggregate number of equity securities held by the Apollo Funds (and certain of their permitted transferees, including the TPG Viking Funds) is at least 0.6 (the “GHK Minimum Ratio”) and there has not been a change of control of Genting HK, certain matters may not be carried out by the Company without the prior written consent of Genting HK, which include, among others, the following:
| • | any acquisitions or divestitures with the aggregate consideration paid or received, together with the consideration paid or received in respect of all other acquisitions and divestitures after January 7, 2008, exceeding $200.0 million; |
| • | the primary issuance by the Company of equity securities in a public offering; |
| • | subject to limited exceptions, the issuance by the Company of equity securities in a private offering to third parties; |
| • | capital expenditures if the aggregate amount of such capital expenditures (or a series of separate but related capital expenditures), together with all other capital expenditures made after January 7, 2008, is in excess of $20.0 million; |
| • | the declaration or payment of any non-pro-rata dividends or distributions; |
| • | any amendments to the Company’s memorandum of association or bye-laws; and |
| • | the hiring of a new chief executive officer of the Company or any of its subsidiaries (provided that in this case only Genting HK’s consent shall not be unreasonably withheld). |
Provided the GHK Minimum Ratio is maintained and there has not been a change of control of Genting HK, our Board of Directors must also provide reasonable advance written notice to Genting HK of and consult with (but is not required to obtain the consent of) Genting HK regarding certain actions including, but not limited to, (i) the approval of the Company’s or any of its subsidiaries consolidated annual budget and any material action taken which deviates from such budget, (ii) the incurrence of any debt of the Company and its subsidiaries in excess of $100.0 million, (iii) the issuance of any equity securities of the Company or any of its subsidiaries, (iv) the declaration of any dividends or distributions on any equity securities and (v) the commencement or termination of employment of any executive or key employee of the Company or any of its subsidiaries.
Genting HK’s consent and consultation rights described above would also terminate when the combined ownership of the ordinary shares of the Company held by the Apollo Funds and Genting HK (and certain of their respective permitted transferees, which includes, in the case of the Apollo Funds, the TPG Viking Funds) falls below 25% of the then total outstanding ordinary shares of the Company.
Additionally, for so long as the TPG Viking Funds and their permitted transferees continue to hold 15% or more of the amount of ordinary shares of the Company that are collectively held by the TPG Viking Funds and their affiliates on the date of the consummation of this offering, neither the Company nor any of its subsidiaries shall be permitted to engage in any material transaction involving any affiliate of the Apollo Funds (other than the Company and its subsidiaries) without the prior written consent of the TPG Viking Funds, such consent not to be unreasonably withheld.
Each shareholder of the Company that is a party to the Shareholders’ Agreement has the right to participate on a pro-rata basis in any issuance of new shares of the Company, subject to limited exceptions, including, but not limited to equity securities issued by the Company in a public offering. The shareholders will not be entitled to
114
Table of Contents
participate in, or require the registration of other securities in connection with, this offering. In addition, each of the Apollo Funds and Genting HK has the right to make written requests in unlimited numbers to the Company to register and thereby transfer all or a portion of its equity securities in the Company through share offerings, provided each written request will specify an aggregate offering price of at least $20.0 million for the ordinary shares being registered and will specify the intended method of disposition. At any time following the date that is eighteen months from the consummation of this offering, the TPG Viking Funds also have the right to make one written request to the Company to register and thereby transfer all or a portion of its equity securities in the Company through a share offering. Additionally, if the Company at any time proposes for any reason to register ordinary shares, each of the Apollo Funds, Genting HK and the TPG Viking Funds shall have the right to cause the Company to include in such registration all or a portion of its equity securities in the Company.
Subject to the Apollo Funds’ right to sell after July 7, 2012 as described below, each of the Apollo Funds, the TPG Viking Funds and Genting HK (and certain of their respective permitted transferees) is prohibited from transferring their equity securities of the Company without the mutual consent of the Apollo Funds and Genting HK, as applicable, other than transfers to certain permitted transferees or transfers in certain registered offerings. These transfer restrictions will immediately terminate in the event that either the Apollo Minimum Ratio or the GHK Minimum Ratio are not maintained.
Unless the Apollo Funds (or certain of its permitted transferees, which includes the TPG Viking Funds) have previously sold any of their shares of the Company in a registered public offering effected pursuant to the terms of the registration rights provisions of the Shareholders’ Agreement, the Apollo Funds will be entitled to sell all, but not less than all, of the shares of the Company held by the Apollo Funds (and certain of their permitted transferees, which includes the TPG Viking Funds) to a third party in cash at any time after July 7, 2012, provided that the Apollo Funds first offer Genting HK the right to acquire such shares of the Company on terms and conditions as may be specified by the Apollo Funds. In the event that Genting HK declines such offer to purchase the Apollo Funds’ shares of the Company and the Apollo Funds receive a bona fide offer from a third party to purchase its shares of the Company, (i) Genting HK shall have the right to sell to such third party its pro rata portion of the shares of the Company to be sold in such transaction and (ii) the Apollo Funds shall have the right to cause Genting HK and the other shareholders of the Company party to the Shareholders’ Agreement to consent to such transaction, and to sell all of their shares of the Company in such transaction on the same terms and conditions on which the Apollo Funds are selling their shares of the Company.
The Subscription Agreement
On August 17, 2007, Genting HK, NCL Investment Limited and NCL Corporation Ltd. entered into a subscription agreement (the “Subscription Agreement”) which set out the terms for the equity investment by, and issuance of shares, to NCL Investment Limited. NCL Investment Limited assigned to NCL Investment II Ltd. a portion of its rights and obligations under the Subscription Agreement pursuant to an assignment agreement dated January 7, 2008.
Under the Subscription Agreement, we and Genting HK agreed to cooperate with each other in developing our respective cruise line businesses, provided that such obligations to cooperate do not extend to any such efforts that could reasonably be expected to have an adverse effect on the operation or prospects of such party’s respective cruise line business.
In addition, subject to the terms below, NCL Investment Limited and Genting HK indemnified each other for certain losses arising from breaches of representations, warranties and covenants made by us, Genting HK and NCL Investment Limited. Both NCL Investment Limited’s and Genting HK’s indemnity obligations relating to breaches of representations and warranties terminated on April 30, 2008, subject to certain exceptions for fraudulent or knowing and intentional misrepresentations. Genting HK may elect in its sole discretion to satisfy all or a portion of its indemnity obligations in cash or by causing the Company to issue additional ordinary shares of the Company to NCL Investment Limited.
115
Table of Contents
DESCRIPTION OF CERTAIN INDEBTEDNESS
We summarize below the principal terms of the agreements that govern our existing indebtedness. We refer you to the exhibits to the registration statement of which this prospectus forms a part for copies of agreements governing the indebtedness described below.
Newbuild Export Credit Facilities
The purchaser of each New Ship is the borrower under a credit agreement dated as of November 18, 2010 by and among the relevant borrower, Deutsche Schiffsbank AG, DnB NOR Bank ASA, HSBC Bank plc, KfW IPEX-Bank GmbH and Nordea Bank Norge ASA, as lead arrangers, certain other financial institutions from time to time party thereto as agents and lenders, and NCL Corporation Ltd. as guarantor (each such agreement is referred to as a “Newbuild Export Credit Facility”). These two facilities, the purpose of which is to provide partial financing for the purchase of our New Ships, provide delayed-draw term loan facilities for up to €1,060 million, or $1,537 million based on the euro/U.S. dollar exchange rate as of June 30, 2011. The maturity date for each Newbuild Export Credit Facility is the 12th anniversary of the delivery date of the relevant New Ship.
Availability
The loans under each Newbuild Export Credit Facility will be available for drawing to fund 80% of the installment and delivery payments on the construction contract for the relevant New Ship, and to fund 100% of the related Hermes insurance premiums.
Interest Rate and Fees
Loans under the Newbuild Export Credit Facility for the first New Ship bear interest at the LIBOR rate plus an applicable margin of 1.60% per annum. The relevant borrower may elect an interest period of three or six months with respect to these loans. Loans under the Newbuild Export Credit Facility for the second New Ship bear interest at a fixed rate of 4.50% per annum. Interest on these loans is payable semi-annually.
In addition to paying interest on outstanding loans under our Newbuild Export Credit Facilities, we are required to pay a commitment fee to the lenders in respect of the unutilized commitments thereunder at a rate equal to 0.60% per annum. We also pay customary arrangement and agency fees.
Payments and Prepayments
Beginning on the sixth month anniversary of the delivery date for the relevant New Ship, the loans under the relevant Newbuild Export Credit Facility shall be repaid in full in twenty-four equal semi-annual installments.
We may voluntarily and permanently reduce the loan commitments under the Newbuild Export Credit Facilities, at any time, without penalty, subject to certain restrictions regarding notice and mandatory minimum amounts. Loans under the Newbuild Export Credit Facilities may be prepaid at any time subject to certain restrictions regarding notice and mandatory minimum amounts, and to the payment of customary breakage costs and funding loss costs.
In addition, if the construction contract in respect of a New Ship is terminated prior to the delivery date of such New Ship, the outstanding loans under the relevant Newbuild Export Credit Facility related to such New Ship shall be repaid in full and the commitments thereunder shall be terminated.
The borrower under the relevant Newbuild Export Credit Facility is required to prepay outstanding amounts under such Newbuild Export Credit Facility upon the sale, total loss or other disposition of the relevant New Ship after the delivery date for such New Ship.
Guarantee and Security
All obligations of the borrowers under the Newbuild Export Credit Facilities will be guaranteed by NCL Corporation Ltd., and will be secured by a first-lien ship mortgage on the relevant New Ship and by first priority
116
Table of Contents
assignments of certain interests related to the relevant New Ship. In addition, 95% of the loans under the Newbuild Export Credit Facilities are guaranteed by Hermes, an agency of the Federal Republic of Germany.
Newbuild Term Loan Facilities
Each of Norwegian Jewel Limited and Pride of Hawaii, LLC is a borrower under a credit agreement dated as of November 18, 2010 by and among the relevant borrower, Deutsche Schiffsbank AG, DnB NOR Bank ASA, HSBC Bank plc, KfW IPEX-Bank GmbH and Nordea Bank Norge ASA, as lead arrangers, certain other financial institutions from time to time party thereto as agents and lenders, and NCL Corporation Ltd. as guarantor (each such agreement is referred to as a “Newbuild Term Loan Facility”). These two facilities, the purpose of which is to provide partial financing for the purchase of our New Ships, provide delayed-draw term loan facilities of up to €126.1 million, or $182.9 million based on the euro/U.S. dollar exchange rate as of June 30, 2011, and the U.S. Dollar equivalent availability of the Newbuild Term Loan Facilities is capped at $224.8 million. The maturity date for each Newbuild Term Loan Facility is the 3rd anniversary of the delivery date of the relevant New Ship.
Availability
The loans under each Newbuild Term Loan Facility will be available for drawing to fund 10% of the installment and delivery payments on the construction contract for the relevant New Ship, and to fund 100% of the related Hermes insurance premiums.
Interest Rate and Fees
Loans under the Newbuild Term Loan Facilities bear interest at the LIBOR rate plus an applicable margin of 1.60% per annum. The relevant borrower may elect an interest period of three or six months with respect to these loans.
In addition to paying interest on outstanding loans under our Newbuild Term Loan Facilities, we are required to pay a commitment fee to the lenders in respect of the unutilized commitments thereunder at a rate equal to 0.60% per annum. We also pay customary arrangement and agency fees.
Payments and Prepayments
Beginning on the sixth month anniversary of the delivery date for the relevant New Ship, the loans under the relevant Newbuild Term Loan Facility shall be repaid in full in six equal semi-annual installments.
We may voluntarily and permanently reduce the loan commitments under the Newbuild Term Loan Facilities, at any time, without penalty, subject to certain restrictions regarding notice and mandatory minimum amounts. Loans under the Newbuild Term Loan Facilities may be prepaid at any time subject to certain restrictions regarding notice and mandatory minimum amounts, and to the payment of customary breakage costs with respect to funding loss costs.
In addition, if the construction contract in respect of a New Ship is terminated prior to the delivery date of such New Ship, the outstanding loans under the relevant tranche of each Newbuild Term Loan Facility related to such New Ship shall be repaid in full and the commitments thereunder shall be terminated.
The borrower under the relevant Newbuild Term Loan Facility is required to prepay outstanding amounts under such Newbuild Term Loan Facility upon the sale or total loss or other disposition of Norwegian Jewel or Norwegian Jade, as applicable.
Guarantee and Security
All obligations of the borrowers under the Newbuild Term Loan Facilities will be guaranteed by NCL Corporation Ltd., and will be secured by a subordinated ship mortgage on Norwegian Jewel or Norwegian Jade, as applicable, and a second-priority assignment of certain interests related to the New Ships.
117
Table of Contents
$750.0 million Senior Secured Revolving Credit Facility
NCL Corporation Ltd. is the borrower under a credit agreement dated as of October 28, 2009, by and among the borrower, certain financial institutions from time to time party thereto, as lenders, and Nordea Bank Norge ASA, as administrative agent and collateral agent. This facility provides revolving financing of up to $750.0 million, which includes a $150.0 million letter of credit subfacility.
Availability
As of June 30, 2011, we had $167.0 million of indebtedness outstanding under our $750.0 million senior secured revolving credit facility, with $487.2 million still available to draw thereunder.
Interest Rate and Fees
Loans under our $750.0 million senior secured revolving credit facility are U.S. dollar-denominated and bear interest at a rate equal to (i) LIBOR, plus (ii) an applicable margin of 4.00% per annum (the “Applicable Margin”). The borrower may elect the interest period applicable to each loan; interest periods of 1, 2, 3 and 6 months are available.
In addition to paying interest on outstanding principal under our $750.0 million senior secured revolving credit facility, we are required to pay a commitment fee to the lenders in respect of the unutilized commitments thereunder at a rate of 1.6% per annum. We also pay customary letter of credit, arrangement and administrative agency fees.
Prepayments
Subject to certain limitations and exceptions, the borrower is required to prepay outstanding amounts of our $750.0 million senior secured revolving credit facility following the sale, total loss or other disposition of any of the ships securing the facility (as further described below). We may voluntarily repay outstanding loans under our $750.0 million senior secured revolving credit facility at any time, without premium or penalty, other than customary breakage costs with respect to funding loss costs.
Scheduled Commitment Reductions
The commitments under our $750.0 million senior secured revolving credit facility will reduce in 11 consecutive semi-annual installments of $46.9 million, which commenced on October 28, 2010. Any amounts remaining thereafter are due on the maturity date of the facility, October 28, 2015.
Guarantee and Security
All obligations under our $750.0 million senior secured revolving credit facility are unconditionally guaranteed by our subsidiaries, Norwegian Star Limited, Norwegian Spirit, Ltd., Norwegian Sun Limited and Norwegian Dawn Limited, which subsidiaries own our ships Norwegian Star, Norwegian Spirit, Norwegian Sun and Norwegian Dawn, respectively.
All obligations under our $750.0 million senior secured revolving credit facility and the guarantees thereof (as well as all obligations under any interest-hedging or other swap agreements), are secured by a first priority (and in the case of any interest-hedging or other swap agreements, second priority) perfected security interest in (i) all equity interests of each of the guarantors; and (ii) substantially all of the assets of each of the guarantors, including, but not limited to (A) first-priority liens on our ships Norwegian Star, Norwegian Spirit, Norwegian Sun and Norwegian Dawn and (B) all earnings, proceeds of insurance and certain other interests related to those ships. All of the above-described collateral (other than the security interest in the equity interests of the guarantors) also constitutes collateral for our $450.0 million senior secured notes described below.
118
Table of Contents
€624.0 million Norwegian Pearl and Norwegian Gem Revolving Credit Facility
NCL Corporation Ltd. is the borrower under a credit agreement dated as of October 7, 2005 (as subsequently amended from time to time), by and among the borrower, certain financial institutions from time to time party thereto, as lenders, and DnB NOR Bank ASA, as agent. This facility consists of two revolving credit tranches with an aggregate commitment of €624.0 million, the purpose of which was to provide financing for the construction of our ships, Norwegian Gem and Norwegian Pearl. Our €624.0 million Norwegian Pearl and Norwegian Gem revolving credit facility was converted into U.S. dollars in November 2008.
Availability
As of June 30, 2011, we had $297.7 million of principal amount outstanding under Tranche A, with no amounts still available to draw thereunder; and $326.0 million of principal amount outstanding under Tranche B, with no amounts still available to draw thereunder.
Interest Rate
A portion of the borrowings under our €624.0 million Norwegian Pearl and Norwegian Gem revolving credit facility bear interest at a rate equal to (i) LIBOR plus (ii) an applicable margin, the maximum of which was 1.49% as of December 31, 2009; has been and will be 1.99% from January 2010 until October 2013, and will be 2.20% thereafter. The maximum applicable margin to be applied to the other portion of the outstanding principal amount adds 6% to the figures for each of the aforementioned periods (i.e., 7.49%, 7.99% and 8.20%, respectively). The applicable margin will decrease by 0.1625% if total funded debt to EBITDA ratio, as calculated pursuant to the loan agreement, is between 4.0 and 5.0, and will further decrease by an additional 0.125% if total funded debt to EBITDA ratio, as calculated pursuant to the loan agreement, is less than 4.0.
Payments, Reductions and Prepayments
Subject to the commitment reductions made in connection with the use of the net proceeds received from our offering of our $250.0 million senior notes (as described below in “—$250.0 million Senior Notes”), beginning on May 31, 2011, the available commitment under Tranche A is scheduled to be reduced by approximately $13.4 million, on a semi-annual basis, until the maturity date of such tranche (November 28, 2018). Subject to the reductions made in connection with the use of the net proceeds received from our offering of our $250.0 million senior notes (as described below in “—$250.0 million Senior Notes”), beginning on April 1, 2011, the available commitment under Tranche B is scheduled to be reduced by approximately $13.4 million, on a semi-annual basis, until the maturity date of such tranche (October 1, 2019). The amount of the reductions of both of the Tranche A and Tranche B commitments will increase beginning in November 2013.
Our group excess liquidity and any incremental liquidity generated from new debt financings and net proceeds from the sale of assets will be applied to our €624.0 million Norwegian Pearl and Norwegian Gem revolving credit facility and certain other of our credit facilities under certain conditions. Reduction of our €624.0 million Norwegian Pearl and Norwegian Gem revolving credit facility is required following a total loss or the sale of any of the ships securing the facility (which ships are further described below).
We may voluntarily and permanently reduce the loan commitments under our €624.0 million Norwegian Pearl and Norwegian Gem revolving credit facility, in whole or in part, at any time during specified periods, without penalty, subject to pro rata reductions of certain other facilities and the payment of breakage fees and to certain restrictions regarding mandatory minimum amounts. Drawings under our €624.0 million Norwegian Pearl and Norwegian Gem revolving credit facility may be prepaid, in whole or in part, prior to their maturity date, subject to pro rata reductions of certain other facilities and the payment of customary breakage costs with respect to funding loss costs, notice requirements and minimum amount requirements.
Guarantee and Security
Subject to certain conditions, all obligations under our €624.0 million Norwegian Pearl and Norwegian Gem revolving credit facility are unconditionally guaranteed (i) by each of our subsidiaries, Norwegian Pearl, Ltd. and
119
Table of Contents
Norwegian Gem, Ltd., which subsidiaries own our ships, Norwegian Pearl and Norwegian Gem, respectively; and (ii) on a subordinated basis, by each of our subsidiaries, Norwegian Jewel Limited, Pride of America Ship Holding, LLC, and Pride of Hawaii, LLC, which subsidiaries own our ships, Norwegian Jewel, Pride of America and Norwegian Jade, respectively.
All of our obligations under our €624.0 million Norwegian Pearl and Norwegian Gem revolving credit facility are secured by (i) first lien ship mortgages on Norwegian Pearl and Norwegian Gem; and (ii) third lien ship mortgages on Norwegian Jewel, Pride of America and Norwegian Jade.
€308.1 million Pride of Hawai’i Loan
Pride of Hawaii, LLC, our indirect, wholly-owned subsidiary, is the borrower under a secured loan agreement dated as of April 20, 2004 (as subsequently amended from time to time), by and among the borrower, certain financial institutions from time to time party thereto, as lenders, and HSBC Bank PLC, as agent. This agreement provides for a term loan facility for up to €308.1 million, the purpose of which was to provide partial financing for the construction of our ship, Pride of Hawai’i (subsequently re-flagged and renamed Norwegian Jade). The maturity date for our €308.1 million Pride of Hawai’i loan is April 19, 2018; the facility was converted into U.S. dollars in October 2009.
Availability
As of June 30, 2011, we had $284.4 million of principal amount outstanding.
Interest Rate
A portion of the borrowings under our €308.1 million Pride of Hawai’i loan bear interest at a rate equal to (i) LIBOR plus (ii) an applicable margin, which applicable margin was 1.0% as of December 31, 2009, and increased to 1.5% thereafter. The applicable margin applied to the other portion of the principal amount was 2.25% as of December 31, 2009, and has been 2.75% thereafter.
Payments and Prepayments
Subject to the prepayments made in connection with the use of the net proceeds received from our offering of our $250.0 million senior notes (as described below in “—$250.0 million Senior Notes”), beginning on April 19, 2011, Pride of Hawaii, LLC will make amortization payments of $18.6 million on a semi-annual basis. Amortization payments will increase beginning in October 2015.
The borrower is required to prepay outstanding amounts of our €308.1 million Pride of Hawai’i loan following the total loss or sale of Norwegian Jade, which secures the facility (as further described below). Subject to certain conditions, our excess group liquidity and any incremental liquidity generated from new debt refinancings and net proceeds from the sale of assets will be applied to our €308.1 million Pride of Hawai’i loan and certain other of our credit facilities.
The borrower may voluntarily prepay the loans under our €308.1 million Pride of Hawai’i loan, in whole or in part, after giving notice as specified in the credit agreement, without penalty, subject to pro rata reductions of certain other facilities and the payment of customary breakage costs with respect to funding loss costs and to certain restrictions regarding mandatory minimum amounts.
Guarantee and Security
All obligations of the borrower under our €308.1 million Pride of Hawai’i loan are unconditionally guaranteed by us and by, on a subordinated basis, each of our indirect, wholly-owned subsidiaries, Norwegian Jewel Limited and Pride of America Ship Holding, LLC (which subsidiaries own our ships, Norwegian Jewel and Pride of America).
120
Table of Contents
All of the borrower’s obligations under our €308.1 million Pride of Hawai’i loan are secured by (i) a first lien ship mortgage on Norwegian Jade; and (ii) second lien ship mortgages on Norwegian Jewel and Pride of America.
$334.1 million Norwegian Jewel Loan
Norwegian Jewel Limited, our indirect, wholly-owned subsidiary, is the borrower under a secured loan agreement dated as of April 20, 2004 (as subsequently amended from time to time), by and among the borrower, certain financial institutions from time to time party thereto, as lenders, and HSBC Bank PLC, as agent. This agreement provides for a term loan facility for up to $334.1 million, the purpose of which was to provide partial financing for the construction of our ship, Norwegian Jewel. The maturity date of our $334.1 million Norwegian Jewel loan is August 4, 2017.
Availability
As of June 30, 2011, we had $190.2 million of principal amount outstanding.
Interest Rate
The borrowings under our $334.1 million Norwegian Jewel loan bear interest at a rate of 6.3575% for a portion of the principal amount as of December 31, 2009, and at a rate of 6.8575% thereafter. The interest rate applied to the other portion of the principal amount was (i) LIBOR plus (ii) 2.25% as of December 31, 2009; and has been (a) LIBOR plus (b) 2.75% thereafter.
Payments and Prepayments
Subject to the prepayments made in connection with the use of the net proceeds received from our offering of our $250.0 million senior notes (as described below in “—$250.0 million Senior Notes”), beginning on February 4, 2011, Norwegian Jewel Limited will make amortization payments of $13.5 million on a semi-annual basis. Amortization payments will increase beginning in February 2015.
The borrower is required to prepay outstanding amounts of our $334.1 million Norwegian Jewel loan following the total loss or sale of Norwegian Jewel, which secures the facility (as further described below). Subject to certain conditions, our excess group liquidity and any incremental liquidity generated from new debt refinancings and net proceeds from the sale of assets will be applied to our $334.1 million Norwegian Jewel loan and certain other of our credit facilities.
The borrower may voluntarily prepay the loans under our $334.1 million Norwegian Jewel loan, in whole or in part, after giving notice as specified in the credit agreement, without penalty, subject to pro rata reductions of certain other facilities and the payment of customary breakage costs with respect to funding loss costs and to certain restrictions regarding mandatory minimum amounts.
Guarantee and Security
All obligations of the borrower under our $334.1 million Norwegian Jewel loan are unconditionally guaranteed by us and by, on a subordinated basis, each of our wholly-owned subsidiaries, Pride of Hawaii, LLC and Pride of America Ship Holding, LLC (which subsidiaries own Norwegian Jade and Pride of America, respectively).
All of the borrower’s obligations under our $334.1 million Norwegian Jewel loan are secured by (i) a first lien ship mortgage on Norwegian Jewel; and (ii) second lien ship mortgages on Norwegian Jade and Pride of America.
121
Table of Contents
€258.0 million Pride of America Hermes Loan
Pride of America Ship Holding, LLC, our indirect, wholly-owned subsidiary, is the borrower under a secured loan agreement dated as of April 4, 2003 (as subsequently amended from time to time), by and among the borrower, certain financial institutions from time to time party thereto, as lenders, and HSBC Bank PLC, as agent. This agreement provides for a term loan facility for up to €258.0 million, the purpose of which was to finance the construction of our ship, Pride of America. The maturity date for our €258.0 million Pride of America loan is June 6, 2017; the facility was converted into U.S. dollars in December 2005.
Availability
As of June 30, 2011, we had $176.3 million of principal amount outstanding.
Interest Rate
The borrowings under our €258.0 million Pride of America loan bear interest at a rate of 5.965% for a portion of the principal amount as of December 31, 2009, and 6.465% thereafter. The interest rate applied to the other portion of the principal amount was (i) LIBOR plus (ii) 2.25% as of December 31, 2009; and has been (a) LIBOR plus (b) 2.75% thereafter.
Payments and Prepayments
Subject to the prepayments made in connection with the use of the net proceeds received from our offering of our $250.0 million senior notes (as described below in “—$250.0 million Senior Notes”), beginning on June 6, 2011, Pride of America Ship Holding, LLC will make amortization payments of $12.7 million on a semi-annual basis. Amortization payments will increase beginning in June 2015.
The borrower is required to pay outstanding amounts of our €258.0 million Pride of America loan following the total loss or sale of Pride of America, which secures the facility (as further described below). Subject to certain conditions, our group excess liquidity and any incremental liquidity generated from new debt refinancings and net proceeds from the sale of assets will be applied to our €258.0 million Pride of America loan and certain other of our credit facilities.
The borrower may voluntarily prepay the loans under our €258.0 million Pride of America loan, in whole or in part, after giving notice as specified in the credit agreement, without penalty, subject to pro rata reductions of certain other facilities and the payment of customary breakage costs with respect to funding loss costs and to certain restrictions regarding mandatory minimum amounts.
Guarantee and Security
All obligations of the borrower under our €258.0 million Pride of America loan are unconditionally guaranteed by us and by, on a subordinated basis, each of our indirect, wholly owned subsidiaries, Norwegian Jewel Limited and Pride of Hawaii, LLC (which subsidiaries own our ships, Norwegian Jewel and Norwegian Jade, respectively).
All of the borrower’s obligations under our €258.0 million Pride of America loan are secured by (i) a first lien ship mortgage on Pride of America; and (ii) second lien ship mortgages on Norwegian Jewel and Norwegian Jade.
€40.0 million Pride of America Commercial Loan
Pride of America Ship Holding, LLC, our indirect, wholly-owned subsidiary, is the borrower under a secured loan agreement dated as of April 4, 2003 (as subsequently amended from time to time), by and among
122
Table of Contents
the borrower, certain financial institutions party thereto, as lenders, and HSBC Bank PLC, as agent. This agreement provides for a term loan facility of up to €40.0 million, the purpose of which was to provide partial financing for the construction of our ship, Pride of America. The maturity date for our €40.0 million Pride of America commercial loan is June 6, 2017; the facility was converted into U.S. dollars in December 2005.
Availability
As of June 30, 2011, we had $26.8 million of principal amount outstanding.
Interest Rate
A portion of the borrowings under our €40.0 million Pride of America commercial loan bear interest at a rate of 6.845% as of December 31, 2009, and 7.345% thereafter. The interest rate applied to the other portion of the principal amount was (i) LIBOR plus (ii) 2.25% as of December 31, 2009; and has been (a) LIBOR plus (b) 2.75% thereafter.
Payments and Prepayments
Subject to the prepayments made in connection with the use of the net proceeds received from our offering of our $250.0 million senior notes (as described below in “—$250.0 million Senior Notes”), beginning on June 6, 2011, the borrower will make amortization payments of $1.9 million on a semi-annual basis. Amortization payments will increase beginning in June 2015.
The borrower is required to pay outstanding amounts of our €40.0 million Pride of America commercial loan following the total loss or sale of Pride of America, which secures the facility (as further described below). Subject to certain conditions, our excess group liquidity and any incremental liquidity generated from new debt refinancings and net proceeds from the sale of assets will be applied to our €40.0 million Pride of America commercial loan and certain other of our credit facilities.
The borrower may voluntarily prepay the loans under our €40.0 million Pride of America commercial loan, in whole or in part, after giving notice as specified in the credit agreement, subject to pro rata reductions of certain other facilities and the payment of customary breakage costs with respect to funding loss costs and further subject to certain restrictions regarding mandatory minimum amounts.
Guarantee and Security
All obligations of the borrower under our €40.0 million Pride of America commercial loan are unconditionally guaranteed by us and by, on a subordinated basis, each of our wholly owned subsidiaries, Norwegian Jewel Limited and Pride of Hawaii, LLC (which subsidiaries own our ships, Norwegian Jewel and Norwegian Jade, respectively).
All of the borrower’s obligations under our €40.0 million Pride of America commercial loan are secured by (i) a first lien ship mortgage on Pride of America; and (ii) second lien ship mortgages on Norwegian Jewel and Norwegian Jade.
€662.9 million Norwegian Epic Loan
Norwegian Epic, Ltd. (f/k/a F3 Two, Ltd.), our indirect, wholly-owned subsidiary, is the borrower under a secured loan agreement dated as of September 22, 2006 (as subsequently amended from time to time), by and among the borrower, certain financial institutions from time to time party thereto, as lenders, and BNP Paribas, as agent. This agreement provides for a term loan facility for up to €662.9 million, the purpose of which was to provide partial financing for the purchase of our ship, Norwegian Epic. The maturity date for our €662.9 million Norwegian Epic loan is June 17, 2022. The interest rate for the facility is LIBOR plus (a) 2.175% for the first 12 months, and LIBOR plus (b) 1.675% thereafter.
123
Table of Contents
Availability
As of June 30, 2011, we had $753.9 million principal amount outstanding.
Prepayments
The borrower may voluntarily prepay the loans under our €662.9 million Norwegian Epic loan, in whole or in part, after giving notice as specified in the credit agreement, subject to the payment of customary breakage costs with respect to funding loss costs.
Guarantee and Security
All obligations of the borrower under our €662.9 million Norwegian Epic loan are unconditionally guaranteed by us, and are secured by a first lien ship mortgage on Norwegian Epic.
Covenant Compliance
Our aforementioned debt facilities contain, among other provisions, restrictive covenants and incurrence tests regarding indebtedness, payments and distributions, mergers and acquisitions, asset sales, affiliate transactions and the maintenance of a minimum level of liquidity and certain financial ratios. Payment of borrowings under such debt facilities may be accelerated if there is an event of default. Events of default include the failure to pay principal and interest when due, a material breach of representation or warranty, covenant defaults, events of bankruptcy and a change of control. As described in more detail above, our ships and substantially all other property and equipment are pledged as collateral for our debt. We believe we were in compliance with these covenants as of June 30, 2011.
$450.0 million Senior Secured Notes
On November 12, 2009, we completed an offering of our $450.0 million senior secured notes. Our $450.0 million senior secured notes bear interest at an annual rate of 11.75%, paid semiannually. The maturity date for our $450.0 million senior secured notes is November 15, 2016.
All obligations under our $450.0 million senior secured notes are fully and unconditionally, jointly and severally, guaranteed by our subsidiaries, Norwegian Star Limited, Norwegian Spirit, Ltd., Norwegian Sun Limited and Norwegian Dawn Limited, which subsidiaries own our ships, Norwegian Star, Norwegian Spirit, Norwegian Sun and Norwegian Dawn, respectively.
All obligations under our $450.0 million senior secured notes, and the guarantees thereof, are secured by a shared first-priority perfected security interest in substantially all of the assets of each of the guarantors, including, but not limited to (i) first-priority liens on our ships Norwegian Star, Norwegian Spirit, Norwegian Sun and Norwegian Dawn, and (ii) all earnings, proceeds of insurance and certain other interests related to those ships. All of the above-described collateral also constitutes collateral for our $750.0 million senior secured revolving credit facility described above on a pari passu basis.
$250.0 million Senior Notes
On November 9, 2010, we completed an offering of our $250.0 million senior notes. Our $250.0 million senior notes are unsecured and bear interest at an annual rate of 9.50%, paid semiannually. The maturity date for our $250.0 million senior notes is November 15, 2018. The net proceeds of the offering of the $250.0 million senior notes were used to pay or reduce, as applicable, amounts that would have otherwise been required to be paid or reduced, as applicable, under certain of our existing senior secured credit facilities.
Other Security Arrangements
To secure the performance of certain obligations that may arise under certain credit card services agreements, each of Norwegian Pearl, Ltd. and Norwegian Gem Ltd. has granted a second priority mortgage and a third priority mortgage in our ships, Norwegian Pearl and Norwegian Gem, respectively, to certain credit card processors.
124
Table of Contents
Norwegian Cruise Line Holdings Ltd. was incorporated on February 21, 2011 as a Bermuda exempted company organized under the Companies Act. References to “we,” “our” and the “Company” in the following descriptions refer to the Issuer and references to the “Shareholders’ Agreement” refers to the Shareholders’ Agreement as it will be amended and restated in connection with the Corporate Reorganization and this offering. We are registered with the Registrar of Companies in Bermuda under registration number 45125. Our registered office is located at Cumberland House, 9th Floor, 1 Victoria Street, Hamilton HM 11, Bermuda. We intend to amend and restate our bye-laws prior to the consummation of this offering. The rights of our shareholders, including those persons who will become shareholders in connection with this offering, will be governed by Bermuda law, our memorandum of association and our amended and restated bye-laws, which we refer to as our “bye-laws”. The Companies Act differs in some material respects from laws generally applicable to U.S. corporations and their shareholders. The bye-laws will be subject to the terms of, and incorporate the provisions of, the Shareholders’ Agreement. For information regarding the governance arrangements for the Company among our principal shareholders, Genting HK, the Apollo Funds and the TPG Viking Funds, see “Certain Relationships and Related Party Transactions—The Shareholders’ Agreement.”
The following descriptions are qualified in their entirety by reference to our memorandum of association and bye-laws to be in effect as of the date of consummation of the offering and to the Shareholders’ Agreement, copies of which will be filed as exhibits to the registration statement of which this prospectus forms a part. The following summary is a description of the material terms of our share capital to be in effect as of the date of the consummation of this offering. The following summary also highlights material differences between Bermuda and Delaware corporate laws.
Share capital
Our authorized share capital is $500,000 divided into 490,000,000 ordinary shares of par value $.001 per share and 10,000,000 preference shares of par value $.001 per share.
Pursuant to our bye-laws, subject to the requirements of NASDAQ and to any resolution of the shareholders to the contrary, our Board of Directors is authorized to issue any of our authorized but unissued ordinary shares. There are no limitations on the right of non-Bermudians or non-residents of Bermuda to hold or vote our shares.
Ordinary shares
Immediately following the completion of this offering, there will be ordinary shares issued and outstanding. No preference shares will be issued or outstanding at that time. All of our issued and outstanding ordinary shares prior to completion of this offering are and will be fully paid, and all of our ordinary shares to be issued in this offering will be issued fully paid.
In the event of our liquidation, dissolution or winding up, the holders of ordinary shares are entitled to share equally and ratably in our assets, if any, remaining after the payment of all of our debts and liabilities and subject to any preferential rights to payments owing to preference shareholders.
If we issue any preference shares, the rights, preferences and privileges of holders of ordinary shares will be subject to, and may be adversely affected by, the rights of the holders of our preference shares. See “—Preference shares.”
Voting
Holders of ordinary shares have no pre-emptive, redemption, conversion or sinking fund rights. Holders of ordinary shares are entitled to one vote per share on all matters submitted to a vote of holders of ordinary shares. Unless a different majority is required by law or by our bye-laws, resolutions to be approved by holders of ordinary shares require approval by a simple majority of votes cast at a meeting at which a quorum is present.
125
Table of Contents
Our bye-laws provide that no bye-law shall be rescinded, altered or amended, and no new bye-law shall be made, unless it is in accordance with the Act and until it shall have been approved by a resolution of our Board of Directors and by a resolution of our shareholders holding a majority of the then-outstanding shares of the Company (or, where required, of a separate class or classes of shareholders), provided that in no event shall any such rescission, alteration, amendment or new bye-law affect the rights and obligations of Genting HK, any of the Apollo Funds or the TPG Viking Funds without the prior written consent of Genting HK, the Apollo Funds or the TPG Viking Funds, as the case may be.
Our bye-laws provide that no alteration to our memorandum of association shall be made, unless it is in accordance with the Act and until it shall have been approved by a resolution of our Board of Directors and by a resolution of our shareholders holding a majority of the then-outstanding shares of the Company (or, where required, of a separate class or classes of shareholders), provided that in no event shall any such alteration affect the rights and obligations of Genting HK, any of the Apollo Funds or the TPG Viking Funds without the prior written consent of Genting HK, the Apollo Funds or the TPG Viking Funds, as the case may be. Holders of ordinary shares will vote together as a single class on all matters presented to the shareholders for their vote or approval, including the election of directors.
Any individual who is a shareholder of the Company and who is present at a meeting may vote in person, as may any corporate shareholder that is represented by a duly authorized representative at a meeting of shareholders. Our bye-laws also permit attendance at general meetings by proxy, provided the instrument appointing the proxy is in the form specified in the bye-laws or such other form as our Board of Directors may determine.
The Companies Act also provides that shareholders may take action by written resolution. Subject to the following, anything (except for the removal of an auditor before the expiration of the term of his office or director before the expiration of the term of his office) which may be done by resolution of the Company in general meeting or by resolution of a meeting of any class of the shareholders may, without a meeting, be done by resolution in writing signed by, or in the case of a shareholder that is a corporation whether or not a company within the meaning of the Companies Act, on behalf of, such number of shareholders who, at the date that the notice of resolution is given, represent not less than the minimum number of votes as would be required if the resolution was voted on at a meeting of shareholders at which all shareholders entitled to attend and vote were present and voting.
Dividends
Under our bye-laws, each ordinary share is entitled to dividends if, as and when dividends are declared by our Board of Directors, subject to any preferential dividend right of the holders of any preference shares. For a discussion of certain restrictions related to our ability to pay dividends, see “Risk Factors— We may not pay dividends on our ordinary shares at any time in the foreseeable future” and “Dividend Policy.”
We are a holding company and have no direct operations. As a result, we will depend upon distributions from our subsidiaries to pay any dividends.
Additionally, we are subject to Bermuda legal constraints that may affect our ability to pay dividends on our ordinary shares and make other payments. Under the Companies Act, we may declare or pay a dividend only if we have reasonable grounds for believing that we are, or would after the payment be, able to pay our liabilities as they become due and if the realizable value of our assets would thereby not be less than the aggregate of our liabilities, issued share capital and share premium accounts. Issued share capital is the aggregate par value of the Company’s issued shares, and the share premium account is the aggregate amount paid for issued shares over and above their par value. Share premium accounts may be reduced in certain limited circumstances.
Transfer Restrictions
As described above in “Business—Taxation of the Company—Exemption of Operating Income from U.S. Federal Income Taxation,” we are relying on the substantial ownership by non-5% shareholders in order to
126
Table of Contents
satisfy the regularly traded test. As a result there is the potential that if another shareholder becomes a 5% shareholder our qualification under the Publicly Traded Test could be jeopardized. If we were to fail to satisfy the Publicly Traded Test, we would be subject to U.S. income tax on income associated with our cruise operations in the U.S. Therefore, as a precautionary matter, we have provided protections in our bye-laws to reduce the risk of the Five Percent Override Rule applying. In this regard, our bye-laws provide that no one person or group of related persons, other than the Apollo Funds, the TPG Viking Funds and Genting HK, may own, or be deemed to own by virtue of the attribution provisions of the Code, more than 4.9% of our ordinary shares, whether measured by vote, value or number, unless such ownership is approved by our Board of Directors. In addition, any person or group of related persons that own 3% or more (or a lower percentage if required by the U.S. Treasury Regulations under the Code) of our ordinary shares will be required to meet certain notice requirements as provided for in the Company bye-laws. Our bye-laws generally restrict the transfer of any of our ordinary shares if such transfer would cause us to be subject to U.S. shipping income tax. In general, detailed attribution rules, that treat a shareholder as owning shares that are owned by another person, are applied in determining whether a person is a 5% shareholder.
For purposes of the 4.9% limit, a “transfer” will include any sale, transfer, gift, assignment, devise or other disposition, whether voluntary or involuntary, whether of record, constructively or beneficially, and whether by operation of law or otherwise. The 4.9% limit does not apply to the Apollo Funds, the TPG Viking Funds or Genting HK. These shareholders will be permitted to transfer their shares without complying with the limit subject to certain restrictions. See “Certain Relationships and Related Party Transactions—The Shareholders’ Agreement.”
Our bye-laws provide that our Board of Directors may waive the 4.9% limit or transfer restrictions, in any specific instance. Our Board of Directors may also terminate the limit and transfer restrictions generally at any time for any reason. If a purported transfer or other event results in the ownership of ordinary shares by any shareholder in violation of the 4.9% limit, or causes us to be subject to U.S. income tax on shipping operations, such ordinary shares in excess of the 4.9% limit, or which would cause us to be subject to U.S. shipping income tax will automatically be designated as “excess shares” to the extent necessary to ensure that the purported transfer or other event does not result in ownership of ordinary shares in violation of the 4.9% limit or cause us to become subject to U.S. income tax on shipping operations, and any proposed transfer that would result in such an event would be void. Any purported transferee or other purported holder of excess shares will be required to give us written notice of a purported transfer or other event that would result in excess shares. The purported transferee or holders of such excess shares shall have no rights in such excess shares, other than a right to the payments described below.
Excess shares will not be treasury shares but rather will continue to be issued and outstanding ordinary shares. While outstanding, excess shares will be transferred to a trust. The trustee of such trust will be appointed by us and will be independent of us and the purported holder of the excess shares. The beneficiary of such trust will be one or more charitable organizations selected by the trustee. The trustee will be entitled to vote the excess shares on behalf of the beneficiary. If, after purported transfer or other event resulting in excess shares and prior to the discovery by us of such transfer or other event, dividends or distributions are paid with respect to such excess shares, such dividends or distributions will be immediately due and payable to the trustee for payment to the charitable beneficiary. All dividends received or other income declared by the trust will be paid to the charitable beneficiary. Upon our liquidation, dissolution or winding up, the purported transferee or other purported holder will receive a payment that reflects a price per share for such excess shares generally equal to the lesser of:
| • | the amount per share of any distribution made upon such liquidation, dissolution or winding up, and |
| • | in the case of excess shares resulting from a purported transfer, the price per share paid in the transaction that created such excess shares, or, in the case of certain other events, the market price per share for the excess shares on the date of such event, or in the case of excess shares resulting from an event other than a purported transfer, the market price for the excess shares on the date of such event. |
127
Table of Contents
At the direction of our Board of Directors, the trustee will transfer the excess shares held in trust to a person or persons, including us, whose ownership of such excess shares will not violate the 4.9% limit or otherwise cause us to become subject to U.S. shipping income tax within 180 days after the later of the transfer or other event that resulted in such excess shares or we become aware of such transfer or event. If such a transfer is made, the interest of the charitable beneficiary will terminate, the designation of such shares as excess shares will cease and the purported holder of the excess shares will receive the payment described below. The purported transferee or holder of the excess shares will receive a payment that reflects a price per share for such excess shares equal to the lesser of:
| • | the price per share received by the trustee, and |
| • | the price per share such purported transferee or holder paid in the purported transfer that resulted in the excess shares, or, if the purported transferee or holder did not give value for such excess shares, through a gift, devise or other event, a price per share equal to the market price on the date of the purported transfer or other event that resulted in the excess shares. |
A purported transferee or holder of the excess shares will not be permitted to receive an amount that reflects any appreciation in the excess shares during the period that such excess shares were outstanding. Any amount received in excess of the amount permitted to be received by the purported transferee or holder of the excess shares must be turned over to the charitable beneficiary of the trust. If the foregoing restrictions are determined to be void or invalid by virtue of any legal decision, statute, rule or regulation, then the intended transferee or holder of any excess shares may be deemed, at our option, to have acted as an agent on our behalf in acquiring or holding such excess shares and to hold such excess shares on our behalf.
We will have the right to purchase any excess shares held by the trust for a period of 90 days from the later of:
| • | the date the transfer or other event resulting in excess shares has occurred, and |
| • | the date our Board of Directors determines in good faith that a transfer or other event resulting in excess shares has occurred. |
The price per excess share to be paid by us will be equal to the lesser of:
| • | the price per share paid in the transaction that created such excess shares, or, in the case of certain other events, the market price per share for the excess shares on the date of such event, or |
| • | the lowest market price for the excess shares at any time after their designation as excess shares and prior to the date we accept such offer. |
These provisions in our bye-laws could have the effect of delaying, deferring or preventing a change in our control or other transaction in which our shareholders might receive a premium for their ordinary shares over the then-prevailing market price or which such holders might believe to be otherwise in their best interest. Our shipping income, our Board of Directors may determine, in its sole discretion, to terminate the 4.9% limit and the transfer restrictions of these provisions. While both the mandatory offer protection and 4.9% protection remain in place, no third party other than the Apollo Funds, the TPG Viking Funds or Genting HK will be able to acquire control of the Company.
Listing
We intend to apply to have our ordinary shares listed on the NASDAQ Global Select Market under the symbol “NCLH”. The listing is subject to approval of our application.
128
Table of Contents
Preference shares
Pursuant to our bye-laws, our Board of Directors by resolution may establish one or more series of preference shares having such number of shares, designations, dividend rates, relative voting rights, conversion or exchange rights, redemption rights, liquidation rights and other relative participation, optional or other special rights, qualifications, limitations or restrictions as may be fixed by our Board of Directors without any further shareholder approval but subject to the Shareholders’ Agreement. Such rights, preferences, powers and limitations as may be established could also have the effect of discouraging an attempt to obtain control of the Company. We currently have authorized 10,000,000 preference shares of par value $.001 per share. We have no present plans to issue any preference shares.
Composition of Board of Directors; Election; Quorum
In accordance with our bye-laws, the number of directors comprising our Board of Directors will be as determined from time to time by resolution of our Board of Directors, provided, that there shall be at least nine but no more than thirteen directors. Each director is to hold office until his or her successor is duly elected and qualified or until his or her earlier death, resignation or removal. At any meeting of our Board of Directors, our bye-laws will provide that a majority of the directors then in office will constitute a quorum for all purposes.
Upon consummation of this offering, our Board of Directors will consist of nine directors, one of which will be an independent director. We intend to avail ourselves of the “controlled company” exception under the NASDAQ rules, which eliminates the requirement that we have a majority of independent directors on our Board of Directors and that we have compensation and nominating and governance committees composed entirely of independent directors. We are required, however, to have an audit committee with one independent director during the 90-day period beginning on the date of effectiveness of the registration statement filed with the SEC in connection with this offering and of which this prospectus is part. After such 90-day period and until one year from the date of effectiveness of the registration statement, we are required to have a majority of independent directors on our audit committee. Thereafter, we are required to have an audit committee comprised entirely of independent directors. Pursuant to the terms of the Shareholders’ Agreement, within 90 days following the consummation of this offering, our Board of Directors will consist of eleven directors, including two independent directors. Within one year following the consummation of this offering, our Board of Directors will consist of thirteen directors, including three independent directors.
If at any time we cease to be a “controlled company” under the NASDAQ rules, our Board of Directors will take all action necessary to comply with such NASDAQ rules, including appointing a majority of independent directors to our Board of Directors and establishing certain committees composed entirely of independent directors.
Upon consummation of this offering, our Board of Directors will be divided into three classes, each of whose members will serve for staggered three-year terms. Tan Sri Lim Kok Thay, Marc J. Rowan and one of the two additional directors that certain of our shareholders have a right to appoint prior to the consummation of this offering pursuant to the Shareholders’ Agreement will be Class I directors, whose terms will expire at the fiscal 2012 annual general meeting of shareholders; Walter L. Revell, Adam M. Aron and one of the two additional directors that certain of our shareholders have a right to appoint prior to the consummation of this offering pursuant to the Shareholders’ Agreement will be Class II directors, whose terms will expire at the fiscal 2013 annual general meeting of shareholders; and Steve Martinez, Karl Peterson and David Chua Ming Huat will be Class III directors, whose terms will expire at the fiscal 2014 annual general meeting of shareholders.
The composition of our Board of Directors and committees of our Board of Directors are subject to requirements in the Shareholders’ Agreement. For information regarding the governance arrangements for the Company among our principal shareholders, Genting HK, the Apollo Funds and the TPG Viking Funds, see “Certain Relationships and Related Party Transactions—The Shareholders’ Agreement.”
129
Table of Contents
Registration rights
Genting HK, the Apollo Funds and the TPG Viking Funds have certain registration rights with respect to the ordinary shares that they will retain following this offering. See “Shares Eligible for Future Sale” for a discussion of the ordinary shares that may be sold into the public market in the future, and “Certain Relationships and Related Party Transactions—The Shareholders’ Agreement” for a discussion of registration rights.
Transfer agent and registrar
The register of members will be maintained at the registered office of the Company in Bermuda in accordance with Bermuda law, and a branch register will be maintained in the U.S. by American Stock Transfer & Trust Company, LLC, who will serve as branch registrar and transfer agent.
Certain Corporate Anti-Takeover Protections
Certain provisions in our bye-laws may be deemed to have an anti-takeover effect and may delay, deter or prevent a tender offer or takeover attempt that a shareholder might consider to be in its best interests, including attempts that might result in a premium being paid over the market price for the ordinary shares held by shareholders.
Preference Shares
Our Board of Directors has the authority to issue series of preference shares with such voting rights and other powers as our Board of Directors may determine, as described above.
Classified Board
Our Board of Directors will be classified into three classes. Each Director will serve a three-year term and will stand for re-election once every three years.
Removal of Directors, Vacancies
Our shareholders will be able to remove directors with or without cause at an annual or special general meeting by the affirmative vote of a majority of votes cast (and in the event of an equality of votes the resolution shall fail), except with respect to the removal of a director designated by Genting HK or the Apollo Funds pursuant to the terms of the Shareholders’ Agreement, in which case Genting HK or the Apollo Funds, as applicable, may elect to remove any such director, with or without cause, in accordance with the Shareholders’ Agreement. Vacancies on our Board of Directors may be filled only by a majority of our Board of Directors, except with respect to vacancies caused by the removal of a director designated by Genting HK or the Apollo Funds pursuant to the terms of the Shareholders’ Agreement, in which case Genting HK or the Apollo Funds, as applicable, may elect to fill such vacancy in accordance with the Shareholders’ Agreement and with respect to any vacancies filled by shareholders at a special general meeting at which a director is removed.
Advance Notice Requirements for Shareholder Proposals and Director Nominations
Our bye-laws provide that shareholders seeking to nominate candidates for election as directors or to bring business before an annual general meeting of shareholders must provide timely notice of their proposal in writing to the corporate secretary.
Generally, to be timely, a shareholder’s notice must be received at our principal executive offices not less than 90 days or more than 120 days prior to the first anniversary date of the previous year’s annual general meeting. Our bye-laws also specify requirements as to the form and content of a shareholder’s notice. These provisions may impede shareholders’ ability to bring matters before an annual general meeting of shareholders or make nominations for directors at an annual general meeting of shareholders. However, Genting HK and the
130
Table of Contents
Apollo Funds may, notwithstanding such requirements, nominate their designee for election or reelection in accordance with the terms of the Shareholders’ Agreement.
Further notwithstanding such requirements, Genting HK, Apollo and the TPG Viking Funds may make nominations for directors or bring matters before an annual or special meeting of shareholders upon notice to us at least 15 days prior to the date we propose to distribute a proxy statement to shareholders, provided that we have given Genting HK, Apollo and the TPG Viking Funds at least 30 days prior notice of such proposed date.
Corporate Opportunity
Our bye-laws provide that no officer or director of the Company who is also an officer, director, employee, managing director or other affiliate of the Apollo Funds, Genting HK or the TPG Viking Funds will be liable to us or our shareholders for breach of any fiduciary duty by reason of the fact that any such individual directs a corporate opportunity to the Apollo Funds, Genting HK or the TPG Viking Funds instead of us, or does not communicate information regarding a corporate opportunity to us that the officer, director, employee, managing director or other affiliate has directed to the Apollo Funds, Genting HK or the TPG Viking Funds.
Bermuda law
We are an exempted company organized under the laws of Bermuda. The rights of our shareholders, including those persons who will become shareholders in connection with this offering, are governed by Bermuda law, our memorandum of association and our bye-laws. The laws of Bermuda differ in some material respects from laws generally applicable to U.S. corporations and their shareholders. The following is a summary of material provisions of Bermuda law and our organizational documents not discussed above.
Variation of rights
If at any time we have more than one class of shares, the rights attaching to any class, unless otherwise provided for by the terms of issue of the relevant class, may be varied either: (i) with the consent in writing of the holders of 66 2/3% of the issued shares of that class; or (ii) with the sanction of a resolution passed by a majority of the votes cast at a general meeting of the relevant class of shareholders at which a quorum consisting of at least two persons holding or representing one-third of the issued shares of the relevant class is present. Our bye-laws specify that the creation or issue of shares ranking equally with existing shares will not, unless expressly provided by the terms of issue of existing shares, vary the rights attached to existing shares. In addition, the creation or issue of preference shares ranking prior to ordinary shares will not be deemed to vary the rights attached to ordinary shares or, subject to the terms of any other series of preference shares, to vary the rights attached to any other series of preference shares.
Rights in liquidation
Under Bermuda law, in the event of a liquidation or winding-up of a company, after satisfaction in full of all claims and amounts due to creditors and subject to the preferential rights accorded to any series of preference shares and subject to any specific provisions of the Company’s bye-laws, the proceeds of the liquidation or winding-up are distributed pro rata among the holders of ordinary shares.
Meetings of shareholders
Under Bermuda law, a company is required to convene at least one general meeting of shareholders each calendar year. Bermuda law provides that a special general meeting of shareholders may be called by the board of directors of a company and must be called upon the request of shareholders holding not less than 10% of the paid-up capital of the company carrying the right to vote at general meetings. Our bye-laws require that unless otherwise provided, shareholders be given not less than ten nor more than sixty days’ advance notice of a general meeting, but the accidental omission to give notice to any person does not invalidate the proceedings at a meeting. Our bye-laws provide that our Board of Directors may convene an annual general meeting or a special general meeting. This notice requirement is subject to the ability to hold such meetings on shorter notice if such
131
Table of Contents
notice is agreed: (i) in the case of an annual general meeting by all of the shareholders entitled to attend and vote at such meeting; or (ii) in the case of a special general meeting by a majority in number of the shareholders entitled to attend and vote at the meeting holding not less than 95% in nominal value of the shares entitled to vote at such meeting.
Our bye-laws provide that the presence in person or by proxy of two or more shareholders entitled to attend and vote and holding shares representing more than 50% of the combined voting power constitutes a quorum at any general meeting of shareholders.
Access to books and records and dissemination of information
Members of the general public have a right to inspect the public documents of a company available at the office of the Registrar of Companies in Bermuda. These documents include the company’s certificate of incorporation, its memorandum of association, including its objects and powers, and certain alterations to the memorandum of association. The shareholders have the additional right to inspect the bye-laws of the company, minutes of general meetings and the company’s audited financial statements, which must be presented at the annual general meeting. The register of members of a company is also open to inspection by shareholders and by members of the general public without charge. The register of members is required to be open for inspection for not less than two hours in any business day (subject to the ability of a company to close the register of members for not more than thirty days a year). A company is required to maintain its share register in Bermuda but may, subject to the provisions of the Companies Act, establish a branch register outside of Bermuda. We maintain a register of members at the registered office of the Company in Hamilton, Bermuda and a branch register will be maintained in the U.S. by American Stock Transfer & Trust Company, LLC, who will serve as branch registrar and transfer agent. A company is required to keep at its registered office a register of directors and officers that is open for inspection for not less than two hours in any business day by members of the public without charge. Bermuda law does not, however, provide a general right for shareholders to inspect or obtain copies of any other corporate records.
Board actions
The bye-laws of the Company provide that its business is to be managed and conducted by our Board of Directors. At common law, members of a board of directors owe a fiduciary duty to the company to act in good faith in their dealings with or on behalf of the company and exercise their powers and fulfill the duties of their office honestly. This duty includes the following elements: (i) a duty to act in good faith in the best interests of the company; (ii) a duty not to make a personal profit from opportunities that arise from the office of a director; (iii) a duty to avoid conflicts of interest; and (iv) a duty to exercise powers for the purpose for which such powers were intended.
The Companies Act also imposes a duty on directors and officers of a Bermuda company to: (i) act honestly and in good faith with a view to the best interests of the company; and (ii) exercise the care, diligence and skill that a reasonably prudent person would exercise in comparable circumstances.
Our bye-laws provide that to the fullest extent permitted by the Companies Act, a director shall not be liable to the Company or its shareholders for breach of fiduciary duty as a director and also limit fiduciary duties of certain of our directors for corporate opportunities as described in “—Corporate Opportunity.” Our bye-laws also provide for indemnification of directors as described in “—Indemnification of directors and officers.”
There is no requirement in our bye-laws or Bermuda law that directors hold any of our shares. There is also no requirement in our bye-laws or Bermuda law that our directors must retire at a certain age.
The remuneration of our directors is determined by our Board of Directors. Our directors may also be paid all travel, hotel and other expenses properly incurred by them in connection with our business or their duties as directors.
132
Table of Contents
Provided a director discloses a direct or indirect interest in any contract or arrangement with us as required by Bermuda law, such director is entitled to vote in respect of any such contract or arrangement in which he or she is interested unless he or she is disqualified from voting by the chairman of the relevant board meeting. A director (including the spouse or children of the director or any company of which such director, spouse or children own or control more than 20% of the capital or loan debt) can not borrow from us (except loans made to directors who are bona fide employees or former employees pursuant to an employees’ share scheme), unless shareholders holding 90% of the total voting rights have consented to the loan.
Transfer of shares
Our Board of Directors may in its absolute discretion and without assigning any reason refuse to register the transfer of a share if it is not fully paid. Our Board of Directors may also refuse to recognize an instrument of transfer of a share unless it is accompanied by the relevant share certificate and such other evidence of the transferor’s right to make the transfer as our Board of Directors shall reasonably require. Subject to these restrictions, and the 4.9% limit and related transfer restrictions described in “—Ordinary Shares—Transfer Restrictions”, a holder of ordinary shares may transfer the title to all or any of his ordinary shares by completing a form of transfer in the form set out in our bye-laws (or as near thereto as circumstances admit) or in such other ordinary form as our Board of Directors may accept. The instrument of transfer must be signed by the transferor and transferee, although in the case of a fully paid share our Board of Directors may accept the instrument signed only by the transferor. In this case, where the ordinary shares are listed, transfer of shares will be effected through the duly appointed transfer agent and the registrar of the Company.
Indemnification of directors and officers
Section 98 of the Companies Act provides generally that a Bermuda company may indemnify its directors, officers and auditors against any liability which by virtue of any rule of law would otherwise be imposed on them in respect of any negligence, default, breach of duty or breach of trust, except in cases where such liability arises from fraud or dishonesty of which such director, officer or auditor may be guilty in relation to the company. Section 98 further provides that a Bermuda company may indemnify its directors, officers and auditors against any liability incurred by them in defending any proceedings, whether civil or criminal, in which judgment is awarded in their favor or in which they are acquitted or granted relief by the Supreme Court of Bermuda pursuant to Section 281 of the Companies Act.
We have adopted provisions in our bye-laws that, subject to certain exemptions and conditions, require us to indemnify to the full extent permitted by the Companies Act in the event each person who is involved in legal proceedings by reason of the fact that person is or was a director, officer or resident representative of the Company, or is or was serving at the request of the Company as a director, officer, resident representative, employee or agent of another company or of a partnership, joint venture, trust or other enterprise, including service with respect to an employee benefit plan against all expense, liability and loss (including attorneys’ fees, judgments, fines, amounts paid or to be paid in settlement, and excise taxes or penalties arising under the Employee Retirement Income Security Act of 1974) incurred and suffered by the person in connection therewith. We are also required under our bye-laws to advance to such persons expenses incurred in defending a proceeding to which indemnification might apply, provided if the Companies Act requires, the recipient provides an undertaking agreeing to repay all such advanced amounts if it is ultimately determined that he is not entitled to be indemnified. In addition, the bye-laws specifically provide that the indemnification rights granted thereunder are non-exclusive.
In addition, we intend to enter into separate contractual indemnification arrangements with our directors. These arrangements provide for indemnification and the advancement of expenses to these directors in circumstances and subject to limitations substantially similar to those described above. Section 98A of the Companies Act and our bye-laws permit us to purchase and maintain insurance for the benefit of any officer or director in respect of any loss or liability attaching to him in respect of any negligence, default, breach of duty or breach of trust, whether or not we may otherwise indemnify such officer or director.
133
Table of Contents
Amendment of Memorandum of Association and Bye-Laws
Bermuda law provides that the memorandum of association of a company may be amended by a resolution passed at a general meeting of shareholders of which due notice has been given. Bermuda law requires that the bye-laws may be rescinded, altered or amended only if approved by a resolution of our shareholders and directors. Our bye-laws provide for amendment of our memorandum of association and bye-laws as described above in “Ordinary Shares—Voting.”
Under Bermuda law, the holders of an aggregate of not less than 20% in par value of a company’s issued share capital or any class thereof have the right to apply to the Supreme Court of Bermuda for an annulment of any amendment of the memorandum of association adopted by shareholders at any general meeting, other than an amendment which alters or reduces a company’s share capital as provided in the Companies Act. Where such an application is made, the amendment becomes effective only to the extent that it is confirmed by the Bermuda court. An application for an annulment of an amendment of the memorandum of association must be made within 21 days after the date on which the resolution altering the company’s memorandum of association is passed and may be made on behalf of the persons entitled to make the application by one or more of their number as they may appoint in writing for the purpose. No application may be made by shareholders voting in favor of the amendment.
Amalgamations and appraisal rights
A Bermuda exempted company may amalgamate with another Bermuda exempted company or a company incorporated outside Bermuda in accordance with the provisions of the Companies Act.
Under Bermuda law, in the event of an amalgamation of a Bermuda company with another company, a shareholder of the Bermuda company who did not vote in favor of the amalgamation and who is not satisfied that fair value has been offered for his or her shares in the Bermuda company may within one month of notice of the shareholders meeting, apply to the Supreme Court of Bermuda to appraise the fair value of his or her shares. Under Bermuda law, the amalgamation of the Company with another company or corporation (other than certain affiliated companies) requires an amalgamation agreement to first be approved and then recommended by our Board of Directors and by resolution of our shareholders.
Shareholder suits
Class actions and derivative actions are generally not available to shareholders under Bermuda law. The Bermuda courts, however, would ordinarily be expected to permit a shareholder to commence an action in the name of a company to remedy a wrong done to the company where the act complained of is alleged to be beyond the corporate power of the company or is illegal or would result in violation of the company’s memorandum of association or bye-laws. Furthermore, consideration would be given by a Bermuda court to acts that are alleged to constitute a fraud against the minority shareholders or, for instance, where an act requires the approval of a greater percentage of the company’s shareholders than that which actually approved it.
When the affairs of a company are being conducted in a manner which is oppressive or prejudicial to the interests of some part of the shareholders, one or more shareholders may apply to the Supreme Court of Bermuda which may make such order as it sees fit, including an order regulating the conduct of the company’s affairs in the future or ordering the purchase of the shares of any shareholder, by other shareholders or by the company.
Discontinuance
Under Bermuda law, an exempted company may be discontinued and be continued in a jurisdiction outside Bermuda as if it had been incorporated under the laws of that other jurisdiction. Our bye-laws provide that our Board of Directors may exercise all our power to discontinue to another jurisdiction without the need of any shareholder approval.
134
Table of Contents
Takeovers/compulsory acquisition of shares held by minority holders
An acquiring party is generally able to acquire compulsorily the ordinary shares of minority holders in the following ways:
| • | If the acquiring party is a company it may compulsorily acquire all the shares of the target company by acquiring, pursuant to a tender offer, 90% of the shares or class of shares not already owned by, or by a nominee for, the acquiring party (the offeror), or any of its subsidiaries. If an offeror has, within four months after the making of an offer for all the shares or class of shares not owned by, or by a nominee for, the offeror, or any of its subsidiaries, obtained the approval of the holders of 90% or more of all the shares to which the offer relates, the offeror may, at any time within two months beginning with the date on which the approval was obtained, require, by notice, any nontendering shareholder to transfer its shares on the same terms as the original offer. In those circumstances, nontendering shareholders will be compelled to sell their shares unless the Supreme Court of Bermuda (on application made within a one-month period from the date of the offeror’s notice of its intention to acquire such shares) orders otherwise; |
| • | By a procedure under the Companies Act known as a “scheme of arrangement”. A scheme of arrangement could be effected by obtaining the agreement of the Company and of holders of ordinary shares, representing in the aggregate a majority in number and at least 75% in value of the ordinary shareholders present and voting at a court ordered meeting held to consider the scheme of arrangement. The scheme of arrangement must then be sanctioned by the Bermuda Supreme Court. If a scheme of arrangement receives all necessary agreements and sanctions, upon the filing of the court order with the Registrar of Companies in Bermuda, all holders of ordinary shares could be compelled to sell their shares under the terms of the scheme of arrangement; |
| • | Where one or more parties holds not less than 95% of the shares or a class of shares of a company such holder(s) may, pursuant to a notice given to the remaining shareholders or class of shareholders, acquire the shares of such remaining shareholders or class of shareholders. When this notice is given, the acquiring party is entitled and bound to acquire the shares of the remaining shareholders on the terms set out in the notice, unless a remaining shareholder, within one month of receiving such notice, applies to the Supreme Court of Bermuda for an appraisal of the value of their shares. This provision only applies where the acquiring party offers the same terms to all holders of shares whose shares are being acquired. |
Delaware law
The terms of share capital of corporations incorporated in the U.S., including Delaware, differ from corporations incorporated in Bermuda. The following discussion highlights material differences of the rights of a shareholder of a Delaware corporation compared with the rights of our shareholders under Bermuda law, as outlined above.
Under Delaware law, a corporation may indemnify its director or officer (other than in action by or in the right of the companies) against expenses (including attorneys’ fees), judgments, fines and amounts paid in settlement actually and reasonably incurred in defense of an action, suit or proceeding by reason of such position if such director or officer (i) acted in good faith and in a manner he reasonably believed to be in, or not opposed to, the best interests of the corporation and (ii) with respect to any criminal action or proceeding, had no reasonable cause to believe his or her conduct was unlawful.
Delaware law provides that a majority of the shares entitled to vote, present in person or represented by proxy, constitutes a quorum at a meeting of shareholders. In matters other than the election of directors, with the exception of special voting requirements related to extraordinary transactions, the affirmative vote of a majority of shares present in person or represented by proxy at the meeting and entitled to vote is required for shareholder action, and the affirmative vote of a plurality of shares is required for the election of directors. With certain
135
Table of Contents
exceptions, a merger, consolidation or sale of all or substantially all the assets of a corporation must be approved by the board of directors and a majority of the outstanding shares entitled to vote thereon. Under Delaware law, a shareholder of a corporation participating in certain major corporate transactions may, under certain circumstances, be entitled to appraisal rights pursuant to which such shareholder may receive cash in the amount of the fair value of the shares held by such shareholder (as determined by a court) in lieu of the consideration such shareholder would otherwise receive in the transaction.
Under Delaware law, subject to any restrictions contained in the company’s certificate of incorporation, a company may pay dividends out of surplus or, if there is no surplus, out of net profits for the fiscal year in which the dividend is declared and for the preceding fiscal year. Delaware law also provides that dividends may not be paid out of net profits if, after the payment of the dividend, capital is less than the capital represented by the outstanding shares of all classes having a preference upon the distribution of assets.
Under Delaware law, the business and affairs of a corporation are managed by or under the direction of its board of directors. In exercising their powers, directors are charged with a fiduciary duty of care to protect the interests of the corporation and a fiduciary duty of loyalty to act in the best interests of its shareholders.
Delaware law permits any shareholder to inspect or obtain copies of a corporation’s shareholder list and its other books and records for any purpose reasonably related to such person’s interest as a shareholder.
Class actions and derivative actions generally are available to shareholders under Delaware law for, among other things, breach of fiduciary duty, corporate waste and actions not taken in accordance with applicable law, and the court generally has discretion in such actions to permit the winning party to recover attorneys’ fees.
136
Table of Contents
SHARES ELIGIBLE FOR FUTURE SALE
Prior to this offering, there has been no public market for our ordinary shares, and no predictions can be made about the effect, if any, that market sales of our ordinary shares or the availability of such ordinary shares for sale will have on the market price prevailing from time to time. Nevertheless, the actual sale of, or the perceived potential for the sale of, our ordinary shares in the public market may have an adverse effect on the market price for the ordinary shares and could impair our ability to raise capital through future sales of our securities. See “Risk Factors—Risks related to the offering and to our ordinary shares—The substantial number of ordinary shares that will be eligible for sale in the near future may cause the market price of our ordinary shares to decline.”
Sale of Restricted Shares
Upon completion of this offering, we expect to have an aggregate of ordinary shares issued and outstanding (based on the midpoint of the offering price range set forth on the cover page of this prospectus and assuming no exercise of the underwriters’ option to purchase additional ordinary shares). Of these shares, the ordinary shares to be sold in this offering will be freely tradable without restriction or further registration under the Securities Act, except for any shares which may be acquired by any of our “affiliates” as that term is defined in Rule 144 under the Securities Act, which will be subject to the resale limitations of Rule 144. The remaining ordinary shares outstanding will be restricted securities, as that term is defined in Rule 144, and may in the future be sold without restriction under the Securities Act to the extent permitted by Rule 144 or any applicable exemption under the Securities Act.
We have granted Genting HK, the Apollo Funds and the TPG Viking Funds demand and incidental registration rights with respect to the ordinary shares owned by them after this offering. See “Certain Relationships and Related Party Transactions—The Shareholders’ Agreement.”
Equity Incentive Plan
Following the completion of this offering, we intend to file a registration statement on Form S-8 under the Securities Act with the SEC to register ordinary shares reserved for issuance under our new long-term incentive plan that is being put in place immediately prior to this offering. Subject to the expiration of any lock-up restrictions as described below and following the completion of any vesting periods, our ordinary shares to be granted under our new long-term incentive plan will be freely tradable without restriction under the Securities Act, unless such shares are held by any of our affiliates.
Lock-up Agreements
Executive officers, directors, Genting HK, the Apollo Funds and the TPG Viking Funds have agreed not to sell any ordinary shares for a period of 180 days from the date of this prospectus, subject to certain exceptions. We refer you to “Underwriting—Lock-Up Agreements.”
137
Table of Contents
MATERIAL U.S. FEDERAL INCOME TAX CONSIDERATIONS
The following is a discussion of the material U.S. federal income tax considerations relevant to an investment decision by a U.S. Holder or a Non-U.S. Holder, as defined below, with respect to the ordinary shares of the Issuer. The following discussion, in so far as it expresses conclusions as to the application of United States federal income tax consequences of the ownership and disposition of ordinary shares of NCL, is the opinion of O’Melveny & Myers LLP. This discussion does not purport to address the tax consequences of owning our ordinary shares to all categories of investors, some of which (such as financial institutions, regulated investment companies, real estate investment trusts, tax-exempt organizations, insurance companies, U.S. expatriates, persons holding our ordinary shares as part of a hedging, integrated, conversion or constructive sale transaction or a straddle, traders in securities that have elected the mark-to-market method of accounting for their securities, persons liable for alternative minimum tax, pass-through entities and investors therein, persons who own, actually or under applicable constructive ownership rules, 10% or more of our ordinary shares, dealers in securities or currencies and U.S. Holders whose functional currency is not the U.S. dollar) may be subject to special rules. This discussion deals only with holders who purchase ordinary shares in connection with this offering and hold the ordinary shares as a capital asset. Moreover, this discussion is based on laws, regulations and other authorities in effect as of the date of this prospectus, all of which are subject to change, possibly with retroactive effect. You are encouraged to consult your own tax advisors concerning the overall tax consequences arising in your own particular situation under U.S. federal, state, local or foreign law of the ownership of our ordinary shares (including consequences arising under U.S. federal estate and gift tax and the recently enacted Medicare contribution tax on certain investment income).
For purposes of this discussion, the term “U.S. Holder” means a beneficial owner of our ordinary shares that is, for U.S. federal income tax purposes, (a) an individual who is a citizen or resident of the U.S., (b) a domestic corporation, (c) an estate the income of which is subject to U.S. federal income taxation regardless of its source, or (d) a trust if either (1) a court within the U.S. is able to exercise primary jurisdiction over the administration of the trust and one or more U.S. persons have the authority to control all substantial decisions of the trust, or (2) the trust has a valid election in effect under applicable Treasury Regulations to be treated as a U.S. person. A beneficial owner of our ordinary shares that, for U.S. federal income tax purposes, is an individual, corporation, estate or trust and is not a U.S. holder is referred to below as a “Non-U.S. Holder.”
If a partnership holds ordinary shares, the tax treatment of a partner in such partnership will generally depend on the status of the partner and upon the activities of the partnership. If you are a partner in such a partnership holding our ordinary shares, you are encouraged to consult your tax advisor.
U.S. Federal Income Taxation of U.S. Holders
Distributions
Any distributions made by us with respect to our ordinary shares to a U.S. Holder will generally constitute dividends taxable as ordinary income to the extent of our current or accumulated earnings and profits, as determined under U.S. federal income tax principles. Distributions in excess of those earnings and profits will be treated first as a nontaxable return of capital to the extent of the U.S. Holder’s tax basis in our ordinary shares (determined on a share-by-share basis), and thereafter as capital gain. Because we are not a U.S. corporation, U.S. Holders that are corporations will not be entitled to claim a dividends-received deduction with respect to any distributions they receive from us. So long as our stock is considered readily tradable on an established securities market in the United States, dividends received by a noncorporate U.S. Holder should, subject to applicable limitations, qualify as “qualified dividend income” eligible for preferential rates through 2012.
Amounts taxable as dividends generally will be treated as income from sources outside the U.S. and will, depending on your circumstances, be “passive” or “general” income which, in either case, is treated separately from other types of income for purposes of computing the foreign tax credit allowable to you. However, if (a) we are 50% or more owned, by vote or value, by U.S. persons and (b) at least 10% of our earnings and profits are attributable to sources within the U.S., then for foreign tax credit purposes, a portion of our dividends would be
138
Table of Contents
treated as derived from sources within the U.S. With respect to any dividend paid for any taxable year, the U.S. source ratio of our dividends for foreign tax credit purposes would be equal to the portion of our earnings and profits from sources within the U.S. for such taxable year, divided by the total amount of our earnings and profits for such taxable year.
Sale, Exchange or Other Disposition of Ordinary Shares
A U.S. Holder generally will recognize capital gain or loss upon a sale, exchange or other taxable disposition of our ordinary shares in an amount equal to the difference between the amount realized by the U.S. Holder from such disposition and the U.S. Holder’s tax basis in such stock. Capital gain of a noncorporate U.S. Holder is generally taxed at a lower rate than ordinary income where the holder has a holding period greater than one year. Such capital gain or loss will generally be treated as U.S. source income or loss, as applicable, for U.S. foreign tax credit purposes. A U.S. Holder’s ability to deduct capital losses is subject to certain limitations.
PFIC Status
The foregoing discussion assumes that we are not and will not become a “passive foreign investment company,” or “PFIC.”
A non-U.S. corporation generally will be a PFIC in any taxable year in which, after applying the relevant look-through rules with respect to the income and assets of its subsidiaries, either 75% or more of its gross income is “passive income” (generally including (without limitation) dividends, interest, annuities and certain royalties and rents not derived in the active conduct of a business) or the average value of its assets that produce passive income or are held for the production of passive income is at least 50% of the total value of its assets. In determining whether we meet the 50% test, cash is considered a passive asset and the total value of our assets generally will be treated as equal to the sum of the aggregate fair market value of our outstanding stock plus our liabilities. If we own at least 25% (by value) of the stock of another corporation, we will be treated, for purposes of the PFIC tests, as owning our proportionate share of the other corporation’s assets and receiving our proportionate share of the other corporation’s income.
Based on our current and currently anticipated method of operation, we believe that we should not be a PFIC for the 2011 taxable year or for the foreseeable future. However, because PFIC status is determined annually and depends on the composition of a company’s income and assets and the fair market value of its assets, there can be no certainty in this regard.
If we were found to be a PFIC for any taxable year in which a U.S. Holder held ordinary shares, certain adverse U.S. federal income tax consequences could apply to such U.S. Holder, including a recharacterization of any capital gain recognized on a sale or other disposition of ordinary shares as ordinary income, ineligibility for any preferential tax rate otherwise applicable to any “qualified dividend income,” a material increase in the amount of tax that such U.S. Holder would owe and the possible imposition of interest charges, an imposition of tax earlier than would otherwise be imposed and additional tax form filing requirements.
A U.S. Holder owning shares in a PFIC (or a corporation that might become a PFIC) might be able to avoid or mitigate the adverse tax consequences of PFIC status by making certain elections, including “qualified electing fund” (a “QEF”) or “mark-to-market” elections, if deemed appropriate based on guidance provided by its own tax advisor.
U.S. Federal Income Taxation of Non-U.S. Holders
Non-U.S. Holders generally will not be subject to U.S. federal income tax or withholding tax on dividends received from us on our ordinary shares unless the income is effectively connected income (and, if an applicable income tax treaty so provides, the dividends are attributable to a permanent establishment maintained by the
139
Table of Contents
Non-U.S. Holder in the U.S.; provided, however, that if we fail to qualify for the exemption from U.S. federal income taxation under Section 883 of the Code and 25% or more of our gross income during specified time periods is considered effectively connected income, a portion of any dividends paid by us will be considered U.S. source dividends that are subject to a U.S. federal withholding tax of 30% (unless reduced or eliminated by an applicable income tax treaty).
Non-U.S. Holders generally will not be subject to U.S. federal income tax or withholding tax on any gain realized upon the sale, exchange or other disposition of our ordinary shares, unless either:
| • | the gain is effectively connected income (and, if an applicable income tax treaty so provides, the gain is attributable to a permanent establishment maintained by the Non-U.S. Holder in the U.S.); or |
| • | the Non-U.S. Holder is an individual who is present in the U.S. for 183 days or more during the taxable year of disposition and certain other conditions are met, in which case such gain (net of certain U.S. source losses) generally will be taxed at a 30% rate (unless an applicable income tax treaty provides otherwise). |
Effectively connected income will generally be subject to regular U.S. federal income tax in the same manner as discussed in the section above relating to the taxation of U.S. Holders, under an applicable income tax treaty provides otherwise. In addition, earnings and profits of a corporate Non-U.S. Holder that are attributable to effectively connected income, as determined after allowance for certain adjustments, may be subject to an additional branch profits tax at a rate of 30%, or at a lower rate as may be specified by an applicable income tax treaty.
Backup Withholding and Information Reporting
In general, payments of distributions on our ordinary shares to a noncorporate U.S. Holder, and proceeds of a disposition of our ordinary shares by a noncorporate U.S. Holder, will be subject to U.S. federal income tax information reporting requirements. Such amounts may also be subject to U.S. federal backup withholding tax if you are a noncorporate U.S. Holder and you:
| • | fail to provide us with an accurate taxpayer identification number; |
| • | are notified by the IRS that you have become subject to backup withholding because you previously failed to report all interest or dividends required to be shown on your federal income tax returns; or |
| • | fail to comply with applicable certification requirements. |
A Non-U.S. Holder that receives distributions on our ordinary shares, or sells our ordinary shares through the U.S. office of a broker, or a non-U.S. office of a broker with specified connections to the United States, may be subject to backup withholding and related information reporting unless the Non-U.S. Holder certifies that it is a non-U.S. person, under penalties of perjury, or otherwise establishes an exemption.
Backup withholding tax is not an additional tax. You generally may obtain a refund of any amounts withheld under backup withholding rules that exceed your income tax liability by timely filing a refund claim with the IRS.
140
Table of Contents
MATERIAL BERMUDA TAX CONSIDERATIONS
At the present time, there is no Bermuda income or profits tax, withholding tax, capital gains tax, capital transfer tax, estate duty or inheritance tax payable by our shareholders in respect of our shares. We have obtained an assurance from the Minister of Finance of Bermuda under the Exempted Undertakings Tax Protection Act 1966 that, in the event that any legislation is enacted in Bermuda imposing any tax computed on profits or income, or computed on any capital asset, gain or appreciation or any tax in the nature of estate duty or inheritance tax, such tax shall not, until March 31, 2035, be applicable to us or to any of our operations or to our shares, debentures or other obligations except insofar as such tax applies to persons ordinarily resident in Bermuda or to any taxes payable by us in respect of real property owned or leased by us in Bermuda. We pay annual Bermuda government fees.
141
Table of Contents
Under the terms and subject to the conditions contained in an underwriting agreement dated , 2011, we have agreed to sell to the underwriters named below, for whom UBS Securities LLC and Barclays Capital Inc. are acting as the representatives, the following respective numbers of ordinary shares:
| Name |
Number of Shares | |
| UBS Securities LLC |
||
| Barclays Capital Inc. |
||
| Goldman, Sachs & Co. |
||
|
| ||
| Total |
The underwriting agreement provides that the underwriters’ obligation to purchase ordinary shares is subject to the satisfaction of customary conditions to be contained in the underwriting agreement.
Commissions and Expenses
The following table summarizes the underwriting discounts and commissions we will pay to the underwriters. These amounts are shown assuming both no exercise and full exercise of the underwriters’ option to purchase up to an additional shares. The underwriting fee is the difference between the initial price to the public and the amount the underwriters pay to us for the shares.
| Per Share | Total | |||||||
| Without Option to Purchase Additional Shares |
With Option to Purchase Additional Shares |
Without Option to Purchase Additional Shares |
With Option to Purchase Additional Shares | |||||
| Underwriting discounts and commissions paid by us |
||||||||
The expenses of the offering that are payable by us are estimated to be approximately $ (excluding underwriting discounts and commissions). We have agreed with the underwriters to pay reasonable legal fees and filing fees and other reasonable disbursements of counsel to the underwriters relating to the review and qualification of this offering by the Financial Industry Regulatory Authority, Inc. in an aggregate amount not to exceed $25,000.
The representatives of the underwriters have advised us that the underwriters propose to offer the ordinary shares directly to the public at the public offering price on the cover of this prospectus and to the selling group members at such offering price less a selling concession not in excess of $ per share. After the offering, the representatives of the underwriters may change the offering price and other selling terms. The offering of the notes by the underwriters is subject to receipt and acceptance and subject to the underwriters’ right to reject any order in whole or in part.
Option to Purchase Additional Shares
We have granted the underwriters an option exercisable for 30 days after the date of this prospectus, to purchase up to an aggregate of shares at the public offering price less underwriting discounts and commissions. To the extent the underwriters exercise this option, each underwriter will be committed, so long as the conditions of the underwriting agreement are satisfied, to purchase a number of additional shares proportionate to that underwriter’s initial commitment as indicated in the preceding table, and we will be obligated to sell the additional shares to the underwriters.
Lock-Up Agreements
We, all of our directors, executive officers, Genting HK, the Apollo Funds and the TPG Viking Funds, have agreed that, subject to certain exceptions without the prior written consent of , we and they will
142
Table of Contents
not directly or indirectly, (1) offer for sale, sell, pledge, or otherwise dispose of (or enter into any transaction or device that is designed to, or could be expected to, result in the disposition by any person at any time in the future of) any ordinary shares (including, without limitation, ordinary shares that may be deemed to be beneficially owned by us or them in accordance with the rules and regulations of the SEC and ordinary shares that may be issued upon exercise of any options or warrants) or securities convertible into or exercisable or exchangeable for ordinary shares, (2) enter into any swap or other derivatives transaction that transfers to another, in whole or in part, any of the economic consequences of ownership of the ordinary shares, or (3) make any demand for or exercise any right or file or cause to be filed a registration statement, including any amendments thereto, with respect to the registration of any ordinary shares or securities convertible, exercisable or exchangeable into ordinary shares or any of our other securities for a period of 180 days after the date of this prospectus.
The 180 -day restricted period described in the preceding paragraph will be extended if:
| • | during the last 17 days of the 180-day restricted period we issue an earnings release or material news or a material event relating to us occurs; or |
| • | prior to the expiration of the 180-day restricted period, we announce that we will release earnings results during the 16-day period beginning on the last day of the 180-day period, in which case the restrictions described in the preceding paragraph will continue to apply until the expiration of the 18-day period beginning on the issuance of the earnings release or the announcement of the material news or occurrence of a material event, unless such extension is waived in writing by the representative of the underwriters. |
, in its sole discretion, may release the ordinary shares and other securities subject to the lock-up agreements described above in whole or in part at any time with or without notice. When determining whether or not to release ordinary shares and other securities from lock-up agreements, will consider, among other factors, the holder’s reasons for requesting the release, the number of ordinary shares and other securities for which the release is being requested and market conditions at the time.
Offering Price Determination
Prior to this offering, there has been no public market for our ordinary shares. The initial public offering price will be negotiated between the representatives of the underwriters and us. In determining the initial public offering price of our ordinary shares, the representatives of the underwriters will consider:
| • | the history and prospects for the industry in which we compete; |
| • | our financial information; |
| • | the ability of our management and our business potential and earning prospects; |
| • | the prevailing securities markets at the time of this offering; and |
| • | the recent market prices of, and the demand for, publicly traded shares of generally comparable companies. |
Indemnification
We have agreed to indemnify the several underwriters against certain liabilities, including liabilities under the Securities Act, liabilities arising from breaches of the representations and warranties of the Company contained in the underwriting agreement and to contribute to payments that the underwriters may be required to make for these liabilities.
143
Table of Contents
Stabilization, Short Positions and Penalty Bids
The underwriters may engage in stabilizing transactions, short sales and purchases to cover positions created by short sales, and penalty bids or purchases for the purpose of pegging, fixing or maintaining the price of our ordinary shares, in accordance with Regulation M under the Exchange Act.
| • | Stabilizing transactions permit bids to purchase the underlying security so long as the stabilizing bids do not exceed a specified maximum. |
| • | A short position involves a sale by the underwriters of shares in excess of the number of shares the underwriters are obligated to purchase in the offering, which creates the syndicate short position. This short position may be either a covered short position or a naked short position. In a covered short position, the number of shares involved in the sales made by the underwriters in excess of the number of shares they are obligated to purchase is not greater than the number of shares that they may purchase by exercising their option to purchase additional shares. In a naked short position, the number of shares involved is greater than the number of shares in their option to purchase additional shares. The underwriters may close out any short position by either exercising their option to purchase additional shares, in whole or in part, and/or purchasing shares in the open market. In determining the source of shares to close out the short position, the underwriters will consider, among other things, the price of shares available for purchase in the open market as compared to the price at which they may purchase shares through their option to purchase additional shares. A naked short position is more likely to be created if the underwriters are concerned that there could be downward pressure on the price of the shares in the open market after pricing that could adversely affect investors who purchase in the offering. |
| • | Syndicate covering transactions involve purchases of the ordinary shares in the open market after the distribution has been completed in order to cover syndicate short positions. |
| • | Penalty bids permit the representative to reclaim a selling concession from a syndicate member when the ordinary shares originally sold by the syndicate member is purchased in a stabilizing or syndicate covering transaction to cover syndicate short positions. |
These stabilizing transactions, syndicate covering transactions and penalty bids may have the effect of raising or maintaining the market price of our ordinary shares or preventing or retarding a decline in the market price of our ordinary shares. As a result, the price of our ordinary shares may be higher than the price that might otherwise exist in the open market. These transactions may be effected on the applicable national securities exchange or otherwise and, if commenced, may be discontinued at any time.
Neither we, nor any of the underwriters make any representation or prediction as to the direction or magnitude of any effect that the transactions described above may have on the price of the ordinary shares. In addition, neither we, nor any of the underwriters make representation that the underwriters will engage in these stabilizing transactions or that any transaction, once commenced, will not be discontinued without notice.
Electronic Distribution
A prospectus in electronic format may be made available on the Internet sites or through other online services maintained by one or more of the underwriters and/or selling group members participating in this offering, or by their affiliates. In those cases, prospective investors may view offering terms online and, depending upon the particular underwriter or selling group member, prospective investors may be allowed to place orders online. The underwriters may agree with us to allocate a specific number of shares for sale to online brokerage account holders. Any such allocation for online distributions will be made by the underwriters on the same basis as other allocations.
Other than the prospectus in electronic format, the information on any underwriter’s or selling group member’s website and any information contained in any other website maintained by an underwriter or selling
144
Table of Contents
group member is not part of the prospectus or the registration statement of which this prospectus forms a part, has not been approved and/or endorsed by us or any underwriter or selling group member in its capacity as underwriter or selling group member and should not be relied upon by investors.
Listing
We intend to apply to list our ordinary shares on the NASDAQ Global Select Market under the symbol “NCLH”.
Discretionary Sales
The underwriters have informed us that they do not intend to confirm sales to discretionary accounts that exceed 5% of the total number of shares offered by them.
Stamp Taxes
Purchasers of the ordinary shares offered in this prospectus may be required to pay stamp taxes and other charges under the laws and practices of the country of purchase, in addition to the offering price listed on the cover page of this prospectus. Accordingly, we urge you to consult a tax advisor with respect to whether you may be required to pay those taxes or charges, as well as any other tax consequences that may arise under the laws of the country of purchase.
Relationships
The underwriters and their respective affiliates are full service financial institutions engaged in various activities, which may include securities trading, commercial and investment banking, financial advisory, investment management, investment research, principal investment, hedging, financing and brokerage activities. The underwriters may in the future perform investment banking and advisory services for us from time to time for which they may in the future receive customary fees and expenses. In the ordinary course of their various business activities, the underwriters and their respective affiliates may make or hold a broad array of investments and actively trade debt and equity securities (or related derivative securities) and financial instruments (including bank loans) for their own account and for the accounts of their customers, and such investment and securities activities may involve securities and/or instruments of the Issuer.
The underwriters and their respective affiliates may also make investment recommendations and/or publish or express independent research views in respect of such securities or instruments and may at any time hold, or recommend to clients that they acquire, long and/or short positions in such securities and instruments.
Other Relationships
UBS Securities LLC, Barclays Capital Inc. and Goldman, Sachs & Co. acted as joint book-running managers in connection with the Issuer’s offering of $250.0 million 9.50% Senior Notes due 2018 (the “$250.0 million Senior Notes”), issued on November 9, 2010. The proceeds of the issuance of the $250.0 million Senior Notes were used to repay indebtedness under the Issuer’s existing senior secured credit facilities. UBS Securities LLC, Barclays Capital Inc. and Goldman, Sachs & Co. received customary underwriting fees in connection with the offering of such $250.0 million Senior Notes. In addition, Barclays Capital Inc. acted as a joint book-running manager and UBS Securities LLC, acted as a co-manager in connection with the Issuer’s offering of $450.0 million 11.75% Senior Secured Notes due 2016 (the “$450.0 million Senior Secured notes”), issued on November 12, 2009. The proceeds of the issuance of the $450.0 million Senior Secured Notes were used to repay and refinance indebtedness under the Issuer’s existing senior secured credit facilities. In addition, Barclays Capital Inc. and UBS Securities LLC received customary underwriting fees in connection with the offering of such $450.0 million Senior Notes.
UBS Securities LLC, Barclays Capital Inc. and Goldman, Sachs & Co. are acting as joint book-running managers for this offering.
145
Table of Contents
European Economic Area
In relation to each Member State of the European Economic Area which has implemented the Prospectus Directive (each, a “Relevant Member State”), each underwriter has represented and agreed that with effect from and including the date on which the Prospectus Directive is implemented in that Relevant Member State (the “Relevant Implementation Date”) it has not made and will not make an offer of the notes which are the subject of the offering contemplated by this prospectus to the public in that Relevant Member State other than:
| (a) | to any legal entity which is a qualified investor as defined in the Prospectus Directive; |
| (b) | to fewer than 100 or, if the Relevant Member State has implemented the relevant provision of the 2010 PD Amending Directive, 150, natural or legal persons (other than qualified investors as defined in the Prospectus Directive), as permitted under the Prospectus Directive; or |
| (c) | in any other circumstances falling within Article 3(2) of the Prospectus Directive, |
provided that no such offer of the notes shall require the Issuer or any underwriter to publish a prospectus pursuant to Article 3 of the Prospectus Directive.
For the purposes of this provision, the expression an “offer of notes to the public” in relation to any notes in any Relevant Member State means the communication in any form and by any means of sufficient information on the terms of the offer and the notes to be offered so as to enable an investor to decide to purchase or subscribe the notes, as the same may be varied in that Member State by any measure implementing the Prospectus Directive in that Member State, the expression “Prospectus Directive” means Directive 2003/71/EC (and amendments thereto, including the 2010 PD Amending Directive, to the extent implemented in the Relevant Member State), and includes any relevant implementing measure in the Relevant Member State and the expression “2010 PD Amending Directive” means Directive 2010/73/EU.
United Kingdom
Each underwriter has represented and agreed that:
| (a) | (i) it is a person whose ordinary activities involve it in acquiring, holding, managing or disposing of investments (as principal or agent) for the purposes of its business and (ii) it has not offered or sold and will not offer or sell the notes other than to persons whose ordinary activities involve them in acquiring, holding, managing or disposing of investments (as principal or as agent) for the purposes of their businesses or who it is reasonable to expect will acquire, hold, manage or dispose of investments (as principal or agent) for the purposes of their businesses where the issue of the notes would otherwise constitute a contravention of Section 19 of the FSMA by the issuer; |
| (b) | it has only communicated or caused to be communicated and will only communicate or cause to be communicated an invitation or inducement to engage in investment activity (within the meaning of Section 21 of the FSMA) received by it in connection with the issue or sale of the notes in circumstances in which Section 21(1) of the FSMA does not apply to the Issuer; and |
| (c) | it has complied and will comply with all applicable provisions of the FSMA with respect to anything done by it in relation to the notes in, from or otherwise involving the United Kingdom. |
Australia
This prospectus is not a formal disclosure document and has not been, nor will be, lodged with the Australian Securities and Investments Commission. It does not purport to contain all information that an investor or their professional advisers would expect to find in a prospectus or other disclosure document (as defined in the Corporations Act 2001 (Australia)) for the purposes of Part 6D.2 of the Corporations Act 2001 (Australia) or in a product disclosure statement for the purposes of Part 7.9 of the Corporations Act 2001 (Australia), in either case, in relation to the securities.
146
Table of Contents
The securities are not being offered in Australia to “retail clients” as defined in sections 761G and 761GA of the Corporations Act 2001 (Australia). This offering is being made in Australia solely to “wholesale clients” for the purposes of section 761G of the Corporations Act 2001 (Australia) and, as such, no prospectus, product disclosure statement or other disclosure document in relation to the securities has been, or will be, prepared.
This prospectus does not constitute an offer in Australia other than to wholesale clients. By submitting an application for our securities, you represent and warrant to us that you are a wholesale client for the purposes of section 761G of the Corporations Act 2001 (Australia). If any recipient of this prospectus is not a wholesale client, no offer of, or invitation to apply for, our securities shall be deemed to be made to such recipient and no applications for our securities will be accepted from such recipient. Any offer to a recipient in Australia, and any agreement arising from acceptance of such offer, is personal and may only be accepted by the recipient. In addition, by applying for our securities you undertake to us that, for a period of 12 months from the date of issue of the securities, you will not transfer any interest in the securities to any person in Australia other than to a wholesale client.
Hong Kong
Our securities may not be offered or sold in Hong Kong, by means of this prospectus or any document other than (i) to “professional investors” within the meaning of the Securities and Futures Ordinance (Cap.571, Laws of Hong Kong) and any rules made thereunder, or (ii) in circumstances which do not constitute an offer to the public within the meaning of the Companies Ordinance (Cap.32, Laws of Hong Kong), or (iii) in other circumstances which do not result in the document being a “prospectus” within the meaning of the Companies Ordinance (Cap.32, Laws of Hong Kong). No advertisement, invitation or document relating to our securities may be issued or may be in the possession of any person for the purpose of issue (in each case whether in Hong Kong or elsewhere) which is directed at, or the contents of which are likely to be accessed or read by, the public in Hong Kong (except if permitted to do so under the securities laws of Hong Kong) other than with respect to the securities which are or are intended to be disposed of only to persons outside Hong Kong or only to “professional investors” within the meaning of the Securities and Futures Ordinance (Cap. 571, Laws of Hong Kong) and any rules made thereunder.
Japan
Our securities have not been and will not be registered under the Financial Instruments and Exchange Law of Japan (the Financial Instruments and Exchange Law) and our securities will not be offered or sold, directly or indirectly, in Japan, or to, or for the benefit of, any resident of Japan (which term as used herein means any person resident in Japan, including any corporation or other entity organized under the laws of Japan), or to others for re-offering or resale, directly or indirectly, in Japan, or to a resident of Japan, except pursuant to an exemption from the registration requirements of, and otherwise in compliance with, the Financial Instruments and Exchange Law and any other applicable laws, regulations and ministerial guidelines of Japan.
Singapore
This prospectus has not been registered as a prospectus with the Monetary Authority of Singapore and in Singapore, the offer and sale of our securities is made pursuant to exemptions provided in sections 274 and 275 of the Securities and Futures Act, Chapter 289 of Singapore (“SFA”). Accordingly, this prospectus and any other document or material in connection with the offer or sale, or invitation for subscription or purchase, of our securities may not be circulated or distributed, nor may our securities be offered or sold, or be made the subject of an invitation for subscription or purchase, whether directly or indirectly, to persons in Singapore other than (i) to an institutional investor as defined in Section 4A of the SFA pursuant to Section 274 of the SFA, (ii) to a relevant person as defined in section 275(2) of the SFA pursuant to Section 275(1) of the SFA, or any person pursuant to Section 275(1A) of the SFA, and in accordance with the conditions specified in Section 275 of the SFA or (iii) otherwise pursuant to, and in accordance with the conditions of, any other applicable provision of the SFA, in each case subject to compliance with the conditions (if any) set forth in the SFA. Moreover, this
147
Table of Contents
document is not a prospectus as defined in the SFA. Accordingly, statutory liability under the SFA in relation to the content of prospectuses would not apply. Prospective investors in Singapore should consider carefully whether an investment in our securities is suitable for them.
Where our securities are subscribed or purchased under Section 275 of the SFA by a relevant person which is:
| (a) | by a corporation (which is not an accredited investor as defined in Section 4A of the SFA) the sole business of which is to hold investments and the entire share capital of which is owned by one or more individuals, each of whom is an accredited investor; or |
| (b) | for a trust (where the trustee is not an accredited investor) whose sole purpose is to hold investments and each beneficiary of the trust is an individual who is an accredited investor, shares of that corporation or the beneficiaries’ rights and interest (howsoever described) in that trust shall not be transferable for six months after that corporation or that trust has acquired the shares under Section 275 of the SFA, except: |
| (1) | to an institutional investor (for corporations under Section 274 of the SFA) or to a relevant person defined in Section 275(2) of the SFA, or any person pursuant to an offer that is made on terms that such shares of that corporation or such rights and interest in that trust are acquired at a consideration of not less than S$200,000 (or its equivalent in a foreign currency) for each transaction, whether such amount is to be paid for in cash or by exchange of securities or other assets, and further for corporations, in accordance with the conditions, specified in Section 275 of the SFA; |
| (2) | where no consideration is given for the transfer; or |
| (3) | where the transfer is by operation of law. |
In addition, investors in Singapore should note that the securities acquired by them are subject to resale and transfer restrictions specified under Section 276 of the SFA, and they, therefore, should seek their own legal advice before effecting any resale or transfer of their securities.
Switzerland
This Prospectus does not constitute an issue prospectus pursuant to Article 652a or Article 1156 of the Swiss Code of Obligations (“CO”) and the shares will not be listed on the SIX Swiss Exchange. Therefore, the Prospectus may not comply with the disclosure standards of the CO and/or the listing rules (including any prospectus schemes) of the SIX Swiss Exchange. Accordingly, the shares may not be offered to the public in or from Switzerland, but only to a selected and limited circle of investors, which do not subscribe to the shares with a view to distribution.
Greece
The securities have not been approved by the Hellenic Capital Markets Commission for distribution and marketing in Greece. This document and the information contained therein do not and shall not be deemed to constitute an invitation to the public in Greece to purchase the securities. The securities may not be advertised, distributed, offered or in any way sold in Greece except as permitted by Greek law.
148
Table of Contents
Cox Hallett Wilkinson Limited will pass upon for us the validity of the issuance of the ordinary shares offered hereby. O’Melveny & Myers LLP will pass upon for us certain matters relating to U.S. federal income tax considerations. Cahill Gordon & Reindel LLP and Appleby will pass upon certain legal matters in connection with this offering for the underwriters.
The financial statements as of December 31, 2010 and 2009 and for each of the three years in the period ended December 31, 2010 included in this prospectus have been so included in reliance on the report of PricewaterhouseCoopers LLP, an independent registered certified public accounting firm, given on the authority of said firm as experts in auditing and accounting.
We have filed with the SEC a registration statement on Form S-1 under the Securities Act relating to our ordinary shares that includes important business and financial information about us that is not included in or delivered with this prospectus. If we have made references in this prospectus to any contracts, agreements or other documents and also filed any of those contracts, agreements or other documents as exhibits to the registration statement, you should read the relevant exhibit for a more complete understanding of the contract, agreement, or other document or the matter involved.
After our registration statement becomes effective, we will file annual reports on Form 10-K, quarterly reports on Form 10-Q and current reports on Form 8-K and other information with the SEC. You may read and copy any document we file with the SEC at the SEC’s public reference room at 100 F Street, N.E., Washington, D.C. 20549. Please call the SEC at 1-800-SEC-0330 for further information on the public reference room. Our SEC filings are also available to the public at the SEC’s website at http://www.sec.gov.
You may obtain copies of the information and documents incorporated by reference in this prospectus at no charge by writing or telephoning us at the following address or telephone number:
Norwegian Cruise Line Holdings Ltd.
7665 Corporate Center Drive
Miami, Florida 33126
Attention: Investor Relations
(305) 436-4000
We also maintain an Internet site at http://www.ncl.com. We will, as soon as reasonably practicable after the electronic filing of our annual report on Form 10-K, quarterly reports on Form 10-Q, current reports on Form 8-K and amendments to those reports if applicable, make available such reports free of charge on our website. Our website and the information contained therein or connected thereto shall not be deemed to be incorporated into this prospectus or registration statement of which this prospectus forms a part, and you should not rely on any such information in making your decision whether to purchase our securities.
149
Table of Contents
Index to Consolidated Financial Statements
| Page Number |
||||
| Audited Consolidated Financial Statements of NCL Corporation Ltd. |
||||
| Report of Independent Registered Certified Public Accounting Firm |
F-2 | |||
| Consolidated Statements of Operations for the Years Ended December 31, 2010, 2009 and 2008 |
F-3 | |||
| F-4 | ||||
| Consolidated Statements of Cash Flows for the Years Ended December 31, 2010, 2009 and 2008 |
F-5 | |||
| F-6 | ||||
| F-8 | ||||
| Unaudited Consolidated Financial Statements of NCL Corporation Ltd. |
||||
| F-40 | ||||
| Consolidated Balance Sheets at June 30, 2011 and December 31, 2010 (unaudited) |
F-41 | |||
| Consolidated Statements of Cash Flows for the Six Months Ended June 30, 2011 and 2010 (unaudited) |
F-42 | |||
| F-43 | ||||
F-1
Table of Contents
Report of Independent Registered Certified Public Accounting Firm
To the Board of Directors and Shareholders of NCL Corporation Ltd.
In our opinion, the accompanying consolidated balance sheets and the related consolidated statements of operations, cash flows and changes in shareholders’ equity present fairly, in all material respects, the financial position of NCL Corporation Ltd. and its subsidiaries at December 31, 2010 and 2009, and the results of their operations and their cash flows for each of the three years in the period ended December 31, 2010 in conformity with accounting principles generally accepted in the United States of America. These financial statements are the responsibility of the Company’s management. Our responsibility is to express an opinion on these financial statements based on our audits. We conducted our audits of these statements in accordance with the standards of the Public Company Accounting Oversight Board (United States). Those standards require that we plan and perform the audit to obtain reasonable assurance about whether the financial statements are free of material misstatement. An audit includes examining, on a test basis, evidence supporting the amounts and disclosures in the financial statements, assessing the accounting principles used and significant estimates made by management, and evaluating the overall financial statement presentation. We believe that our audits provide a reasonable basis for our opinion.
/s/ PricewaterhouseCoopers LLP
Miami, Florida
February 9, 2011
F-2
Table of Contents
Consolidated Statements of Operations
(in thousands, except per share data)
| Year Ended December 31, | ||||||||||||
| 2010 | 2009 | 2008 | ||||||||||
| Revenue |
||||||||||||
| Passenger ticket |
$ | 1,392,506 | $ | 1,275,844 | $ | 1,501,646 | ||||||
| Onboard and other |
619,622 | 579,360 | 604,755 | |||||||||
|
|
|
|
|
|
|
|||||||
| Total revenue |
2,012,128 | 1,855,204 | 2,106,401 | |||||||||
|
|
|
|
|
|
|
|||||||
| Cruise operating expense |
||||||||||||
| Commissions, transportation and other |
379,655 | 377,036 | 410,061 | |||||||||
| Onboard and other |
153,137 | 158,330 | 182,817 | |||||||||
| Payroll and related |
265,390 | 252,426 | 309,083 | |||||||||
| Fuel |
207,210 | 162,683 | 258,262 | |||||||||
| Food |
114,064 | 118,899 | 126,736 | |||||||||
| Other |
227,842 | 220,080 | 291,522 | |||||||||
|
|
|
|
|
|
|
|||||||
| Total cruise operating expense |
1,347,298 | 1,289,454 | 1,578,481 | |||||||||
|
|
|
|
|
|
|
|||||||
| Other operating expense |
||||||||||||
| Marketing, general and administrative |
264,398 | 241,676 | 299,827 | |||||||||
| Depreciation and amortization |
170,191 | 152,700 | 162,565 | |||||||||
| Impairment loss |
— | — | 128,775 | |||||||||
|
|
|
|
|
|
|
|||||||
| Total other operating expense |
434,589 | 394,376 | 591,167 | |||||||||
|
|
|
|
|
|
|
|||||||
| Operating income (loss) |
230,241 | 171,374 | (63,247 | ) | ||||||||
|
|
|
|
|
|
|
|||||||
| Non-operating income (expense) |
||||||||||||
| Interest income |
100 | 836 | 2,796 | |||||||||
| Interest expense, net of capitalized interest |
(173,772 | ) | (115,350 | ) | (152,364 | ) | ||||||
| Other income (expense) |
(33,952 | ) | 10,373 | 1,012 | ||||||||
|
|
|
|
|
|
|
|||||||
| Total non-operating income (expense) |
(207,624 | ) | (104,141 | ) | (148,556 | ) | ||||||
|
|
|
|
|
|
|
|||||||
| Net income (loss) |
$ | 22,617 | $ | 67,233 | $ | (211,803 | ) | |||||
|
|
|
|
|
|
|
|||||||
| Earnings (loss) per share |
||||||||||||
| Basic |
$ | 1.07 | $ | 3.24 | $ | (10.59 | ) | |||||
|
|
|
|
|
|
|
|||||||
| Diluted |
$ | 1.06 | $ | 3.23 | $ | (10.59 | ) | |||||
|
|
|
|
|
|
|
|||||||
| Unaudited adjusted pro forma earnings per share (Note 12) |
||||||||||||
| Basic |
$ | |||||||||||
|
|
|
|||||||||||
| Diluted |
$ | |||||||||||
|
|
|
|||||||||||
The accompanying notes are an integral part of these consolidated financial statements.
F-3
Table of Contents
Consolidated Balance Sheets
(in thousands, except share data)
| December 31, | ||||||||
| 2010 | 2009 | |||||||
| Assets |
||||||||
| Current assets: |
||||||||
| Cash and cash equivalents |
$ | 55,047 | $ | 50,152 | ||||
| Accounts receivable, net |
7,879 | 7,868 | ||||||
| Inventories |
32,763 | 28,865 | ||||||
| Prepaid expenses and other assets |
33,694 | 64,677 | ||||||
|
|
|
|
|
|||||
| Total current assets |
129,383 | 151,562 | ||||||
| Property and equipment, net |
4,639,281 | 3,836,127 | ||||||
| Goodwill and tradenames |
602,792 | 602,792 | ||||||
| Other long-term assets |
192,057 | 220,867 | ||||||
|
|
|
|
|
|||||
| Total assets |
$ | 5,563,513 | $ | 4,811,348 | ||||
|
|
|
|
|
|||||
| Liabilities and Shareholders’ Equity |
||||||||
| Current liabilities: |
||||||||
| Current portion of long-term debt |
$ | 78,237 | $ | 3,586 | ||||
| Accounts payable |
64,399 | 28,376 | ||||||
| Accrued expenses and other liabilities |
216,501 | 206,644 | ||||||
| Advance ticket sales |
294,180 | 255,432 | ||||||
|
|
|
|
|
|||||
| Total current liabilities |
653,317 | 494,038 | ||||||
| Long-term debt |
3,125,848 | 2,554,105 | ||||||
| Other long-term liabilities |
52,680 | 58,654 | ||||||
|
|
|
|
|
|||||
| Total liabilities |
3,831,845 | 3,106,797 | ||||||
|
|
|
|
|
|||||
| Commitments and contingencies (Note 9) |
||||||||
| Shareholders’ equity: |
||||||||
| Ordinary shares, $.0012 par value; 40,000,000 shares authorized; 21,000,000 shares issued and outstanding |
25 | 25 | ||||||
| Additional paid-in capital |
2,330,792 | 2,328,302 | ||||||
| Accumulated other comprehensive income |
4,309 | 2,299 | ||||||
| Retained earnings (deficit) |
(603,458 | ) | (626,075 | ) | ||||
|
|
|
|
|
|||||
| Total shareholders’ equity |
1,731,668 | 1,704,551 | ||||||
|
|
|
|
|
|||||
| Total liabilities and shareholders’ equity |
$ | 5,563,513 | $ | 4,811,348 | ||||
|
|
|
|
|
|||||
The accompanying notes are an integral part of these consolidated financial statements.
F-4
Table of Contents
Consolidated Statements of Cash Flows
(in thousands)
| Year Ended December 31, | ||||||||||||
| 2010 | 2009 | 2008 | ||||||||||
| Cash flows from operating activities |
||||||||||||
| Net income (loss) |
$ | 22,617 | $ | 67,233 | $ | (211,803 | ) | |||||
| Adjustments to reconcile net income (loss) to net cash provided by (used in) operating activities: |
||||||||||||
| Depreciation and amortization expense |
191,913 | 169,701 | 162,565 | |||||||||
| Impairment loss |
— | — | 128,775 | |||||||||
| Loss (gain) on translation of debt |
— | 22,677 | (111,464 | ) | ||||||||
| Loss (gain) on derivatives |
603 | (35,488 | ) | 101,511 | ||||||||
| Write-off of deferred financing fees |
6,410 | 6,744 | 6,788 | |||||||||
| Share-based compensation expense |
2,520 | 4,075 | 865 | |||||||||
| Changes in operating assets and liabilities: |
||||||||||||
| Accounts receivable, net |
(11 | ) | (532 | ) | 2,126 | |||||||
| Inventories |
(3,898 | ) | 629 | 12,503 | ||||||||
| Prepaid expenses and other assets |
120,836 | (90,605 | ) | (15,323 | ) | |||||||
| Accounts payable |
36,023 | (42,036 | ) | (18,303 | ) | |||||||
| Accrued expenses and other liabilities |
3,185 | (56,466 | ) | 627 | ||||||||
| Advance ticket sales |
38,748 | 4,794 | (82,164 | ) | ||||||||
|
|
|
|
|
|
|
|||||||
| Net cash provided by (used in) operating activities |
418,946 | 50,726 | (23,297 | ) | ||||||||
|
|
|
|
|
|
|
|||||||
| Cash flows from investing activities |
||||||||||||
| Additions to property and equipment |
(977,466 | ) | (161,838 | ) | (163,607 | ) | ||||||
| Changes in restricted cash |
8,526 | (4,735 | ) | (2,629 | ) | |||||||
|
|
|
|
|
|
|
|||||||
| Net cash used in investing activities |
(968,940 | ) | (166,573 | ) | (166,236 | ) | ||||||
|
|
|
|
|
|
|
|||||||
| Cash flows from financing activities |
||||||||||||
| Repayments of long-term debt |
(955,780 | ) | (1,249,064 | ) | (1,524,095 | ) | ||||||
| Proceeds from long-term debt |
1,601,659 | 1,121,021 | 1,123,000 | |||||||||
| Transactions with Affiliate, net |
2,951 | 71,541 | (211,267 | ) | ||||||||
| Contribution from Affiliates, net |
— | 100,000 | 948,111 | |||||||||
| Other, primarily deferred financing fees |
(93,941 | ) | (63,216 | ) | (790 | ) | ||||||
|
|
|
|
|
|
|
|||||||
| Net cash provided by (used in) financing activities |
554,889 | (19,718 | ) | 334,959 | ||||||||
|
|
|
|
|
|
|
|||||||
| Net increase (decrease) in cash and cash equivalents |
4,895 | (135,565 | ) | 145,426 | ||||||||
| Cash and cash equivalents at beginning of year |
50,152 | 185,717 | 40,291 | |||||||||
|
|
|
|
|
|
|
|||||||
| Cash and cash equivalents at end of year |
$ | 55,047 | $ | 50,152 | $ | 185,717 | ||||||
|
|
|
|
|
|
|
|||||||
Supplemental disclosures (Note 10)
The accompanying notes are an integral part of these consolidated financial statements.
F-5
Table of Contents
Consolidated Statements of Changes in Shareholders’ Equity
For the Years Ended December 31, 2010, 2009 and 2008
(in thousands)
| Ordinary Shares |
Additional Paid-in Capital |
Accumulated Other Comprehensive Income |
Retained Earnings (Deficit) |
Total Shareholders’ Equity |
||||||||||||||||
| Balance, December 31, 2007 |
$ | 12 | $ | 1,715,718 | $ | 1,301 | $ | (481,505 | ) | $ | 1,235,526 | |||||||||
| Ordinary share split |
12 | — | — | — | 12 | |||||||||||||||
| Share-based compensation |
— | 853 | — | — | 853 | |||||||||||||||
| Contribution from Affiliate, net (Note 5) |
— | 948,099 | — | — | 948,099 | |||||||||||||||
| Transactions with Affiliate, net (Note 5) |
— | (421,724 | ) | — | — | (421,724 | ) | |||||||||||||
| Changes related to cash flow hedges |
— | — | (1,164 | ) | — | (1,164 | ) | |||||||||||||
| Net loss |
— | — | — | (211,803 | ) | (211,803 | ) | |||||||||||||
|
|
|
|
|
|
|
|
|
|
|
|||||||||||
| Balance, December 31, 2008 |
24 | 2,242,946 | 137 | (693,308 | ) | 1,549,799 | ||||||||||||||
| Share-based compensation |
— | 4,075 | — | — | 4,075 | |||||||||||||||
| Contribution from Affiliates, (Note 5) |
1 | 99,999 | — | — | 100,000 | |||||||||||||||
| Transactions with Affiliate, net (Note 5) |
— | (18,718 | ) | — | — | (18,718 | ) | |||||||||||||
| Changes related to cash flow hedges |
— | — | 8,313 | — | 8,313 | |||||||||||||||
| Changes related to Shipboard Retirement Plan |
— | — | (6,151 | ) | — | (6,151 | ) | |||||||||||||
| Net income |
— | — | — | 67,233 | 67,233 | |||||||||||||||
|
|
|
|
|
|
|
|
|
|
|
|||||||||||
| Balance, December 31, 2009 |
25 | 2,328,302 | 2,299 | (626,075 | ) | 1,704,551 | ||||||||||||||
| Share-based compensation |
— | 2,520 | — | — | 2,520 | |||||||||||||||
| Transactions with Affiliates, net (Note 5) |
— | (30 | ) | — | — | (30 | ) | |||||||||||||
| Changes related to cash flow hedges |
— | — | 1,661 | — | 1,661 | |||||||||||||||
| Changes related to Shipboard Retirement Plan |
— | — | 349 | — | 349 | |||||||||||||||
| Net income |
— | — | — | 22,617 | 22,617 | |||||||||||||||
|
|
|
|
|
|
|
|
|
|
|
|||||||||||
| Balance, December 31, 2010 |
$ | 25 | $ | 2,330,792 | $ | 4,309 | $ | (603,458 | ) | $ | 1,731,668 | |||||||||
|
|
|
|
|
|
|
|
|
|
|
|||||||||||
F-6
Table of Contents
NCL Corporation Ltd.
Consolidated Statements of Changes in Shareholders’ Equity
For the Years Ended December 31, 2010, 2009 and 2008
(in thousands) (continued)
Comprehensive income (loss) was as follows:
| Year Ended December 31, | ||||||||||||
| 2010 | 2009 | 2008 | ||||||||||
| Net income (loss) |
$ | 22,617 | $ | 67,233 | $ | (211,803 | ) | |||||
| Changes related to Shipboard Retirement Plan: |
||||||||||||
| Initial recognition of projected benefit obligation |
— | (7,939 | ) | — | ||||||||
| Amortization of prior service cost |
378 | 378 | — | |||||||||
| Actuarial gain (loss) |
(29 | ) | 1,410 | — | ||||||||
| Changes related to cash flow hedges |
1,661 | 8,313 | (1,164 | ) | ||||||||
|
|
|
|
|
|
|
|||||||
| Total comprehensive income (loss) |
$ | 24,627 | $ | 69,395 | $ | (212,967 | ) | |||||
|
|
|
|
|
|
|
|||||||
Accumulated net gain on cash flow hedges was as follows:
| Year Ended December 31, | ||||||||||||
| 2010 | 2009 | 2008 | ||||||||||
| Accumulated net gain on cash flow hedges at beginning of year |
$ | 8,450 | $ | 137 | $ | 1,301 | ||||||
| Net loss reclassified into earnings |
(161 | ) | (1,795 | ) | — | |||||||
| Net gain (loss) related to cash flow hedges |
1,822 | 10,108 | (1,164 | ) | ||||||||
|
|
|
|
|
|
|
|||||||
| Accumulated net gain on cash flow hedges at end of year |
$ | 10,111 | $ | 8,450 | $ | 137 | ||||||
|
|
|
|
|
|
|
|||||||
Accumulated other comprehensive income related to cash flow hedges and changes related to our Shipboard Retirement Plan for the year ended December 31, 2010 was as follows:
| Accumulated Other Comprehensive Income |
Changes Related to Cash Flow Hedges |
Changes Related to Shipboard Retirement Plan |
||||||||||
| Accumulated other comprehensive income at beginning of year |
$ | 2,299 | $ | 8,450 | $ | (6,151 | ) | |||||
| Current-period change |
2,010 | 1,661 | 349 | |||||||||
|
|
|
|
|
|
|
|||||||
| Accumulated other comprehensive income at end of year |
$ | 4,309 | $ | 10,111 | $ | (5,802 | ) | |||||
|
|
|
|
|
|
|
|||||||
The accompanying notes are an integral part of these consolidated financial statements.
F-7
Table of Contents
Notes to the Consolidated Financial Statements
| 1. | Description of Business and Organization |
The Norwegian Cruise Line brand commenced operations out of Miami in 1966. On December 15, 2003, the Company was incorporated in Bermuda as a wholly-owned subsidiary of Genting Hong Kong Limited and its affiliates (“Genting HK”).
In January 2008, the Apollo Funds and the TPG Viking Funds acquired 37.5% and 12.5%, respectively, of our outstanding ordinary share capital through an equity investment of $1.0 billion and Apollo was afforded majority control of the Board of Directors. Our current shareholders and their relative ownership percentages of our outstanding ordinary shares are as follows: Genting HK (50.0%), the Apollo Funds (37.5%), and the TPG Viking Funds (12.5%).
We are a leading global cruise line operator, offering cruise experiences for travelers with a wide variety of itineraries in North America (including Alaska and Hawaii), Central and South America, Bermuda, the Caribbean, the Mediterranean and the Baltic. We strive to offer an innovative and differentiated cruise vacation with the goal of providing our customers the highest levels of overall satisfaction on their cruise experience. In turn, we aim to generate the highest customer loyalty and greatest numbers of repeat customers. We created a distinctive style of cruising called “Freestyle Cruising” on all of our ships, which we believe provides our passengers with the freedom and flexibility associated with a resort style atmosphere and experience as well as more dining options than a traditional cruise. As of December 31, 2010, we operated 11 ships offering cruises in Alaska, the Bahamas, Bermuda, the Caribbean, Europe, Hawaii, Mexico, New England, Central and South America, North Africa and Scandinavia.
| 2. | Summary of Significant Accounting Policies |
Basis of Presentation
Our consolidated financial statements have been prepared in accordance with accounting principles generally accepted in the United States of America. Estimates are required for the preparation of consolidated financial statements in accordance with generally accepted accounting principles and actual results could differ from these estimates. All significant intercompany accounts and transactions are eliminated in consolidation.
Reclassification
We reclassified $65.7 million and $68.1 million for the years ended December 31, 2009 and 2008, respectively, from the line item “Payroll and related” to “Commissions, transportation and other” in our consolidated statements of operations to conform to the current period presentation.
Cash and Cash Equivalents
Cash and cash equivalents are stated at cost, and include cash and investments with original maturities of three months or less at acquisition.
Restricted Cash
Restricted cash consists of cash collateral in respect of certain agreements and is included in prepaid expenses and other assets and other long-term assets in our consolidated balance sheets.
Accounts Receivable
Accounts receivable are shown net of an allowance for doubtful accounts of $0.8 million and $2.2 million as of December 31, 2010 and 2009, respectively.
F-8
Table of Contents
Inventories
Inventories mainly consist of provisions, supplies and fuel and are carried at the lower of cost or market using the first-in, first-out method of accounting.
Advertising Costs
Advertising costs incurred that result in tangible assets, including brochures, are treated as prepaid expenses and charged to expense as consumed. Advertising costs of $1.0 million and $1.3 million as of December 31, 2010 and 2009, respectively, are included in prepaid expenses and other assets. Advertising costs totaled $87.4 million, $65.6 million and $76.1 million for the years ended December 31, 2010, 2009 and 2008, respectively.
Property and Equipment
Property and equipment are recorded at cost. Major renewals and improvements that we believe add value to our ships are capitalized as a cost of the ship while costs of repairs and maintenance, including Dry-docking costs, are charged to expense as incurred. During ship construction, interest is capitalized as a cost of the ship. Gains or losses on the sale of property and equipment are recorded as a component of operating income (expense) in our consolidated statements of operations.
Depreciation is computed on the straight-line basis over the estimated useful lives of the assets and after a 15% reduction for the estimated residual values of ships as follows:
| Useful Life | ||||
| Ships |
30 years | |||
| Other property and equipment |
3-20 years | |||
Leasehold improvements are amortized on a straight-line basis over the shorter of the lease term or related asset life.
Long-lived assets are reviewed for impairments, based on estimated future cash flows, whenever events or changes in circumstances indicate that the carrying amount of an asset may not be recoverable. Assets are grouped and evaluated at the lowest level for which there are identifiable cash flows that are largely independent of the cash flows of other groups of assets. We consider historical performance and future estimated results in our evaluation of potential impairment and then compare the carrying amount of the asset to the estimated future cash flows expected to result from the use of the asset. If the carrying amount of the asset exceeds estimated expected undiscounted future cash flows, we measure the amount of the impairment by comparing the carrying amount of the asset to its fair value. We estimate fair value based on the best information available making whatever estimates, judgments and projections are considered necessary. The estimation of fair value is generally measured by discounting expected future cash flows at discount rates commensurate with the risk involved.
Goodwill and Tradenames
Goodwill represents the excess of cost over the fair value of net assets acquired. We review goodwill and our tradenames for impairment annually or whenever events or changes in circumstances indicate that the carrying amount of goodwill and our tradenames may not be fully recoverable.
We have concluded that our business has a single reportable segment, with each ship considered to be a component. Each component constitutes a business for which discrete financial information is available and management regularly reviews the operating results and, therefore, each component is considered a reporting unit. Our reporting units have similar economic characteristics, including similar margins and similar products and services, therefore, we aggregate all of the reporting units in assessing goodwill.
The impairment review of goodwill is based on the expected future cash flows of our ships to determine a fair value of our aggregate reporting unit. Our discounted cash flow valuation reflects our projection for growth and profitability, taking into account our assessment of future market conditions and demand, as well as a
F-9
Table of Contents
determination of a cost of capital that incorporates both business and financial risks. We believe that the discounted cash flow approach is the most representative method to assess fair value, as it utilizes expectations of long-term growth whereas a market-based approach is less dynamic, especially in light of recent negative market conditions, the uncertainty in credit and capital markets and the resulting weakened economic environment.
Revenue and Expense Recognition
Deposits received from customers for future voyages are recorded as advance ticket sales and are subsequently recognized as passenger ticket revenues along with onboard and other revenues, and all associated direct costs of a voyage are recognized as cruise operating expenses, on a pro rata basis over the period of the voyage.
Revenue and expenses include taxes assessed by a governmental authority that are directly imposed on a revenue-producing transaction between a seller and a customer. The amounts included on a gross basis are $110.0 million, $96.2 million and $88.5 million for the years ended December 31, 2010, 2009 and 2008, respectively.
Foreign Currency
The majority of our transactions are settled in U.S. dollars. We translate assets and liabilities of our foreign subsidiaries at exchange rates in effect at the balance sheet date. Gains or losses resulting from transactions denominated in other currencies are recognized in our consolidated statements of operations within other income (expense) and such amounts were immaterial as of December 31, 2010 and 2009.
Derivative Instruments and Hedging Activity
From time to time we enter into derivative instruments, primarily forward, swap, option and three-way collar contracts, to reduce our exposure to fluctuations in foreign currency exchange, interest rates and fuel rates. The criteria used to determine whether a transaction qualifies for hedge accounting treatment includes the correlation between fluctuations in the fair value of the hedged item and the fair value of the related derivative instrument and its effectiveness as a hedge.
A derivative instrument that hedges the variability of cash flows related to a recognized asset or liability may be designated as a cash flow hedge. Changes in fair value of derivative instruments that are designated as cash flow hedges are recorded as a component of accumulated other comprehensive income until the underlying hedged transactions are recognized in earnings. To the extent that an instrument is not effective as a hedge, gains and losses are recognized in other income (expense) in our consolidated statements of operations.
Concentrations of Credit Risk
We monitor concentrations of credit risk associated with financial and other institutions with which we conduct significant business. Credit risk, including but not limited to counterparty non-performance under derivative instruments, our revolving credit facility and new ship progress payment guarantees, is not considered significant, as we primarily conduct business with large, well-established financial institutions and insurance companies that we have well-established relationships with and that have credit risks acceptable to us or the credit risk is spread out among a large number of creditors. We do not anticipate non-performance by any of our significant counterparties.
Insurance
We use a combination of insurance and self-insurance for a number of risks including claims related to crew and passengers, hull and machinery, war risk, workers’ compensation, property damage and general liability. Liabilities associated with certain of these risks, including crew and passenger claims, are estimated actuarially based upon known facts, historical trends and a reasonable estimate of future expenses. While we believe these accruals are adequate, the ultimate losses incurred may differ from those recorded.
F-10
Table of Contents
Income Taxes
Deferred tax assets and liabilities are calculated in accordance with the liability method. Deferred taxes are recorded using the currently enacted tax rates that apply in the periods that the differences are expected to reverse. Deferred taxes are not discounted. In conjunction with business acquisitions, we record acquired deferred tax assets and liabilities.
We provide a valuation allowance on deferred tax assets when it is more likely than not that such assets will not be realized. With respect to acquired deferred tax assets, future reversals of the valuation allowance will first be applied against goodwill and other intangible assets before recognition of a benefit in our consolidated statements of operations.
Share-Based Compensation
We recognize compensation expense for our share-based compensation awards using the fair value method. Share-based compensation expense is recognized over the expected vesting period for awards that are based on service period and not contingent upon any future performance. We refer you to Note 7 “Employee Benefits and Share Option Plans.”
Ordinary Shares
In April 2009, we increased our authorized share capital from $30,000 to $48,000 by authorizing 15,000,000 additional ordinary shares of $.0012 par value, resulting in an aggregate authorized share capital of 40,000,000 ordinary shares of $.0012 par value. Following this increase, we received $100.0 million from our shareholders and issued 1,000,000 additional ordinary shares of $.0012 par value to our shareholders pro rata in accordance with their percentage ownership resulting in an aggregate 21,000,000 ordinary shares of $.0012 par value issued and outstanding as of December 31, 2010.
Segment Reporting
We have concluded that our business has a single reportable segment, with each ship considered to be a component. Each component constitutes a business for which discrete financial information is available and management regularly reviews the operating results and, therefore, each component is considered a reporting unit. Our reporting units have similar economic characteristics, including similar margins and similar products and services, therefore, we aggregate all of the reporting units.
Although we sell cruises on an international basis, our passenger ticket revenue is primarily attributed to passengers who make reservations in North America. For the years ended December 31, 2010, 2009 and 2008, revenues attributable to North American passengers were 83%. Substantially all of our long–lived assets are located outside of the U.S. and consist primarily of our ships.
Earnings Per Share
Basic earnings per share is computed by dividing net income by the weighted-average number of shares outstanding during each period. Diluted earnings per share incorporates the incremental shares issuable upon conversion of potentially dilutive time-based profits interests.
F-11
Table of Contents
A reconciliation between basic and diluted earnings per share was as follows (in thousands, except per share data):
| Year Ended December 31, | ||||||||||||
| 2010 | 2009 | 2008 | ||||||||||
| Net income (loss) |
$ | 22,617 | $ | 67,233 | $ | (211,803 | ) | |||||
|
|
|
|
|
|
|
|||||||
| Weighted-average shares outstanding |
21,100 | 20,756 | 20,000 | |||||||||
| Dilutive effect of time-based profits interests |
236 | 85 | — | |||||||||
|
|
|
|
|
|
|
|||||||
| Dilutive weighted-average shares outstanding |
21,336 | 20,841 | 20,000 | |||||||||
|
|
|
|
|
|
|
|||||||
| Basic earnings (loss) per share |
$ | 1.07 | $ | 3.24 | $ | (10.59 | ) | |||||
| Dilutive earnings (loss) per share |
$ | 1.06 | $ | 3.23 | $ | (10.59 | ) | |||||
For the year ended December 31, 2008 there were no potentially dilutive shares.
3. Property and Equipment
Property and equipment consisted of the following (in thousands):
| December 31, | ||||||||
| 2010 | 2009 | |||||||
| Ships |
$ | 5,269,084 | $ | 4,120,588 | ||||
| Ships under construction |
77,045 | 278,705 | ||||||
| Land |
1,009 | 1,009 | ||||||
| Other |
186,770 | 162,007 | ||||||
|
|
|
|
|
|||||
| 5,533,908 | 4,562,309 | |||||||
| Less: accumulated depreciation and amortization |
(894,627 | ) | (726,182 | ) | ||||
|
|
|
|
|
|||||
| Total |
$ | 4,639,281 | $ | 3,836,127 | ||||
|
|
|
|
|
|||||
Depreciation and amortization expense for the years ended December 31, 2010, 2009 and 2008 was $170.2 million, $152.7 million and $162.6 million, respectively. Repairs and maintenance expenses including Dry-docking expenses were $60.9 million, $50.5 million and $72.2 million for the years ended December 31, 2010, 2009 and 2008, respectively.
Ships under construction include progress payments to the shipyard, planning and design fees, loan interest and commitment fees and other associated costs. Interest costs associated with the construction of ships are capitalized during the construction period and amounted to $8.6 million, $12.1 million and $4.6 million for the years ended December 31, 2010, 2009 and 2008, respectively.
In 2009, we transferred Norwegian Sky to Genting HK which settled our $280.7 million liability. In 2008, one of our subsidiaries, F3 One, Ltd., cancelled the contract to build an F3 ship and we recorded an impairment loss of $128.8 million in connection with the cancellation of this contract in our 2008 consolidated statement of operations. This loss includes payments to the shipyard, write-offs of loan and deferred financing fees as well as capitalized interest of $9.9 million.
F-12
Table of Contents
4. Long-Term Debt
Long-term debt consisted of the following:
| Interest Rate (1) December 31, |
December 31, | |||||||||||||
| 2010 |
2009 |
Maturities |
2010 | 2009 | ||||||||||
| (in thousands) | ||||||||||||||
| €662.9 million Norwegian Epic Term Loan (2) |
2.63% | — | 2022 | $ | 783,624 | $ | — | |||||||
| €624.0 million Norwegian Pearl and Norwegian Gem Revolving Credit Facility (2) |
3.40% | 2.34% | 2018 - 2019 | 623,678 | 722,905 | |||||||||
| $450.0 million 11.75% Senior Secured Notes (3) |
11.75% | 11.75% | 2016 | 445,334 | 444,819 | |||||||||
| $750.0 million Senior Secured Revolving Credit Facility |
4.31% | 4.34% | 2015 | 307,000 | 543,300 | |||||||||
| €308.1 million Pride of Hawai’i Loan (2) |
2.08% | 1.72% | 2018 | 284,449 | 353,384 | |||||||||
| $250.0 million 9.50% Senior Unsecured Notes |
9.50% | — | 2018 |
250,000 | — | |||||||||
| $334.1 million Norwegian Jewel Term Loan |
3.04% - 6.86% | 3.18% - 6.36% | 2017 | 192,128 | 229,685 | |||||||||
| €258.0 million Pride of America Hermes Loan (2) |
3.05% - 6.47% | 2.51% - 5.97% | 2017 | 180,153 | 215,988 | |||||||||
| €529.8 million Breakaway One Loan (2) |
1.90% | — | 2025 | 49,768 | — | |||||||||
| €529.8 million Breakaway Two Loan (2) |
4.50% | — | 2026 | 49,768 | — | |||||||||
| €40.0 million Pride of America Commercial Loan (2) |
3.05% - 7.35% | 2.51% - 6.85% | 2017 | 27,384 | 32,831 | |||||||||
| Capital lease obligations |
3.75% - 4.74% | 3.81% - 4.74% | 2012 | 10,799 | 14,779 | |||||||||
|
|
|
|
|
|||||||||||
| Total debt |
3,204,085 | 2,557,691 | ||||||||||||
| Less: current portion of long-term debt, including capital lease obligations |
(78,237 | ) | (3,586 | ) | ||||||||||
|
|
|
|
|
|||||||||||
| Total long-term debt |
$ | 3,125,848 | $ | 2,554,105 | ||||||||||
|
|
|
|
|
|||||||||||
| (1) | In connection with a 2009 amendment to certain of our term loans and revolving credit facilities, variable margins and fixed rates increased in 2010 by 50 basis points through maturity of such loans. |
| (2) | Currently U.S. dollar-denominated. |
| (3) | Net of unamortized original issue discount of $4.7 million and $5.2 million at December 31, 2010 and 2009, respectively. |
In November 2010, we entered into agreements with a syndicate of banks to provide for financing (the “Newbuild Financing Arrangements”) for approximately 90% of the contract price of two new ships. The Newbuild Financing Arrangements are composed of two export credit facilities and two related term loan facilities. The export credit facilities represent aggregate commitments of up to approximately €1,060 million, or $1,419 million based on the euro/U.S. dollar exchange rate as of December 31, 2010, and each export credit facility is secured by, among other things, a first priority security interest in the relevant new ship and a guarantee by NCL Corporation Ltd. The export credit facilities will mature 12 years after delivery of the respective ship and the first facility bears interest at Libor plus 1.6% and the second facility is at a fixed rate of 4.5%. The two term loan facilities provide for borrowings by each of Norwegian Jewel Limited and Pride of Hawaii, LLC, with aggregate capacity of up to approximately €126 million, or $169 million based on the euro/U.S. dollar exchange rate as of December 31, 2010. Each term loan facility is secured by, among other things, subordinated security interests in Norwegian Jewel, with a carrying value of $358.8 million, and Norwegian Jade, with a carrying value of $425.8 million, respectively, and a guarantee by NCL Corporation Ltd. The term loans mature three years after ship delivery and both have a Libor plus 1.6% interest rate. In connection with entering into the agreement for the new ships, we prepaid $100.0 million on certain of our other existing senior secured credit facilities.
In November 2010, we issued $250.0 million aggregate principal amount of 9.50% Senior Notes due 2018 in a private offering which has registration rights. The net proceeds from the offering were used to repay $147.0 million of certain of our secured term loans, $94.7 million of our senior secured revolving credit facility and $0.2 million of our capital lease obligations.
F-13
Table of Contents
In June 2010, we took delivery of Norwegian Epic. To finance the purchase, we drew in full $812.9 million of our related term loan. The loan has a 12-year term with semi-annual amortization and bears interest at LIBOR plus 2.175% for the first twelve months and LIBOR plus 1.675% thereafter.
Costs incurred in connection with the arranging of loan financing have been deferred and are amortized over the life of the loan agreement. The amortization included in interest expense was $26.8 million (including $6.4 million write-off of deferred financing fees), $23.2 million (including $6.7 million write-off of deferred financing fees) and $13.4 million for the years ended December 31, 2010, 2009 and 2008, respectively.
Our debt agreements contain covenants that, among other things, require us to maintain a minimum level of liquidity, as well as limit our net funded debt-to-capital ratio, maintain certain other ratios and restrict our ability to pay dividends. Our ships and substantially all other property and equipment are pledged as collateral for our debt. We were in compliance with these covenants as of December 31, 2010. There are no restrictions in the agreements that limit intercompany borrowings or dividends between our subsidiaries that would impact our ability to meet our cash obligations.
The following are scheduled principal repayments on long-term debt including capital lease obligations as of December 31, 2010 for each of the next five years (in thousands):
| Year |
Amount | |||
| 2011 |
$ | 78,237 | ||
| 2012 |
199,595 | |||
| 2013 |
211,509 | |||
| 2014 |
219,929 | |||
| 2015 |
557,513 | |||
| Thereafter |
1,937,302 | |||
|
|
|
|||
| Total |
$ | 3,204,085 | ||
|
|
|
|||
We had an accrued interest liability of $22.0 million and $19.5 million as of December 31, 2010 and 2009, respectively.
5. Related Party Disclosures
Transactions with Genting HK, the Apollo Funds and the TPG Viking Funds
As of December 31, 2010, our shareholders and their share ownership were as follows:
| Shareholder |
Number of Shares | Percentage Ownership | ||||||
| Genting HK (1) |
10,500,000 | 50.0 | % | |||||
| Apollo Funds (2) |
7,875,000 | 37.5 | % | |||||
| TPG Viking Funds (3) |
2,625,000 | 12.5 | % | |||||
| (1) | Genting HK owns its ordinary shares indirectly through Star NCLC Holdings Ltd., a Bermuda wholly-owned subsidiary. |
| (2) | The Apollo Funds own their ordinary shares indirectly through NCL Investment Ltd., a Bermuda company (2,795,968 ordinary shares) and NCL Investment II Ltd., a Cayman Islands company (5,079,032 ordinary shares). |
| (3) | The TPG Viking Funds own their ordinary shares through TPG Viking I, L.P., a Cayman Islands exempted limited partnership (1,957,525 ordinary shares), TPG Viking II, L.P., a Cayman Islands exempted limited partnership (576,118 ordinary shares) and TPG Viking AIV-III, L.P., a Delaware limited partnership (91,357 ordinary shares). |
F-14
Table of Contents
In July 2010, we agreed to extend the Charter of Norwegian Sky from Genting HK to December 31, 2012. The agreement includes two one-year extension options which require the mutual consent of each party. The new agreement also provides us with an option to purchase the ship during the Charter period.
In November 2009, we returned Norwegian Majesty, which had been operated by us pursuant to a Charter arrangement, to Genting HK.
In July 2009, we entered into an agreement with Harrah’s Operating Company, Inc. (now known as Caesars Entertainment Operating Corporation) establishing a marketing alliance which incorporates marketing resources and cross company marketing, purchasing and loyalty programs as well as customer and business intelligence capabilities for a term of three years. Caesars Entertainment Operating Corporation is owned by Affiliates of both Apollo and TPG Capital.
In April 2009, we received $15.1 million from Genting HK for reimbursements in connection with improvements to Norwegian Dream which left our fleet upon expiration of the relevant Charter agreement.
In April 2009, we increased our authorized share capital from $30,000 to $48,000 by authorizing 15,000,000 additional ordinary shares of $.0012 par value, resulting in an aggregate authorized share capital of 40,000,000 ordinary shares of $.0012 par value. Following this increase, we received $100.0 million from our shareholders and issued an additional 1,000,000 ordinary shares of $.0012 par value to our shareholders pro rata in accordance with their percentage ownership resulting in an aggregate 21,000,000 ordinary shares of $.0012 par value issued and outstanding as of December 31, 2010.
On January 7, 2008, the Apollo Funds became the owner of 50% of our outstanding ordinary shares pursuant to the Subscription Agreement, as defined below, and an assignment agreement dated January 7, 2008 by and among us, NCL Investment Ltd. and NCL Investment II Ltd. (with respect to the assignment agreement only), each an affiliate of the Apollo Funds, and Genting HK. On January 8, 2008, the TPG Viking Funds acquired, in the aggregate, 12.5% of our outstanding ordinary shares from the Apollo Funds for $250.0 million. Prior to these transactions, Genting HK owned 100% of our ordinary shares. Pursuant to a shareholders’ agreement, dated August 17, 2007, among us, Genting HK and NCL Investment Ltd. (the “Shareholders’ Agreement”), Genting HK, subject to certain consent rights, has granted to the Apollo Funds the right to vote its ordinary shares. The Shareholders’ Agreement became effective on January 7, 2008. Both NCL Investment II Ltd. and Star NCLC Holdings Ltd. (on January 7, 2008) along with the TPG Viking Funds (on January 8, 2008) have become parties to the Shareholders’ Agreement through separate joinder agreements. Each of the TPG Viking Funds which purchased ordinary shares is considered a permitted transferee of the Apollo Funds and all ordinary shares purchased by the TPG Viking Funds are deemed owned by the Apollo Funds under the Shareholders’ Agreement.
The Reimbursement and Distribution Agreement
On August 17, 2007, we entered into a Reimbursement and Distribution Agreement (“RDA”) with NCL Investment Ltd. and Genting HK which sets out arrangements in relation to the NCLA Business, including the subsidizing by Genting HK of certain losses and expenses of NCLA. The RDA became effective on January 7, 2008. Pursuant to the RDA, we withdrew Pride of Aloha from the Hawaii market effective May 11, 2008. Although we were required under the terms of the RDA to transfer Pride of Aloha to Genting HK, the parties subsequently agreed to re-flag Pride of Aloha into our international fleet and consequently we renamed and launched the ship as Norwegian Sky. Accordingly, as of December 31, 2008, in lieu of returning the ship, we recorded a liability to Genting HK in the amount of $280.7 million which was the net book value of Pride of Aloha as of December 31, 2008. As a result of the decision to withdraw Pride of Aloha from the Hawaii market, Genting HK was obligated to reimburse us for certain losses and expenses related to NCLA which totaled $56.0 million through December 31, 2008, which were paid to us in January 2009. Also, in January 2009, we transferred Norwegian Sky to Genting HK per the terms of the RDA, which settled the $280.7 million liability to Genting HK as of December 31, 2008. We entered into an additional agreement with Genting HK to Charter Norwegian Sky.
F-15
Table of Contents
Amounts due to Genting HK as of December 31, 2008 of $210.1 million, which were settled in January 2009, represent amounts primarily in connection with the RDA for $280.7 million. For the year ended December 31, 2007, $3.7 million was reimbursed to us by Genting HK for ship-related costs.
In addition, in 2008, we paid Genting HK $196.9 million in connection with the terms of the RDA through a borrowing on a then existing senior secured revolving credit facility.
In June 2009, in connection with the RDA, we agreed with Genting HK to assume and pay any and all costs and expenses related to the maintenance, lay up or docking of the S.S. United States incurred on or prior to December 31, 2009. As part of this transaction, Genting HK agreed that we had satisfied in full our obligations under the RDA and they waived their rights, including title and ownership of, and any sale proceeds of, any assets (other than the S.S. United States) of the NCLA Business including all assets related to our Polynesian Adventure Tours operations. This distribution of the S.S. United States to Genting HK resulted in an equity transaction which reduced property and equipment and additional paid-in capital by $15.0 million.
In December 2009, we reduced additional paid-in capital by $3.5 million pertaining to certain estimated tax positions relating to transactions amongst entities under common control.
The Shareholders’ Agreement
On August 17, 2007, NCL Investment Ltd., Genting HK and the Company entered into the Shareholders’ Agreement to regulate the affairs relating to our management and the rights and obligations of the Apollo Funds and Genting HK as shareholders. The Shareholders’ Agreement became effective on January 7, 2008. Both NCL Investment II Ltd. and Star NCLC Holdings Ltd., a wholly-owned subsidiary of Genting HK, along with the TPG Viking Funds have become parties to the Shareholders’ Agreement through separate joinder agreements.
The Apollo Funds and Genting HK were, up until July 2008, entitled to appoint three and two members to the Board of Directors, respectively. Pursuant to a separate agreement between the Apollo Funds and the TPG Viking Funds, the TPG Viking Funds are entitled to designate a non-voting observer who is permitted to attend meetings of the Board of Directors. In July 2008, an amendment to the Shareholders’ Agreement increased the number of members serving on the Board of Directors by two additional members. As a result, the Apollo Funds and Genting HK have increased their representation to appoint four and three members, respectively.
Subject to Genting HK consent rights as described below, the Apollo Funds have the right to vote the shares held by Genting HK. In the event that the ratio of the aggregate holding of equity securities of the Apollo Funds (and certain of their permitted transferees) to the holding of equity securities of Genting HK (and certain of their permitted transferees, including the TPG Viking Funds) falls below 0.6, these rights will cease.
Provided the shareholding ratios (as described above) remain, certain reserved matters may not be carried out without the prior consent of Genting HK, which include, among others, the following:
| • | any acquisitions or divestitures with the aggregate consideration paid or received exceeding $200.0 million; |
| • | the primary issuance by us of equity securities in a public offering (other than in the case of the initial public offering of primary ordinary shares, if the number of ordinary shares proposed to be issued in the initial public offering does not exceed 20% of the ordinary shares that would be outstanding after giving effect to the initial public offering); |
| • | the issuance by us of equity securities in a private offering to third parties, subject to limited exceptions; |
| • | any capital expenditures with the aggregate amount exceeding $20.0 million; |
F-16
Table of Contents
| • | declaring or paying any non-pro rata dividends or distributions; |
| • | any changes to our memorandum of association or bye-laws; and |
| • | hiring a new chief executive officer of the Company, provided, however, such consent should not be unreasonably withheld. |
Subject to limited exceptions, each shareholder shall have the right to participate on a pro rata basis in any issue of new shares. In addition, the Apollo Funds and Genting HK have the right to make written requests to us to register and thereby transfer all or a portion of its equity securities in us through share offerings, provided that the initial registration may only be made in connection with an underwritten public offering of ordinary shares in which the managing underwriter is a nationally recognized “bulge bracket” investment bank and following which (i) we reasonably expect to qualify for the exemption from U.S. Federal income tax set forth in Section 883 of the Internal Revenue Code of 1986, as amended, or any successor provision and (ii) such ordinary shares are listed on a national securities exchange (a “Qualified Public Offering”). Following an initial public offering, the TPG Viking Funds will also have certain registration rights.
Unless a Qualified Public Offering has occurred whereby the Apollo Funds sells any of their shares or any initial public offering of our primary ordinary shares has occurred to which Genting HK has not given its prior written consent, at any time after 54 months from January 7, 2008, the Apollo Funds shall be entitled to sell all, but not less than all, of its equity securities to a third party in cash, provided that the Apollo Funds shall first offer Genting HK the right to acquire (or cause one or more of its designees to acquire) such equity securities on such terms and conditions as may be specified by the Apollo Funds. Additionally, the Shareholders’ Agreement contains certain drag along and tag along rights.
The Subscription Agreement
On August 17, 2007, Genting HK, NCL Investment Ltd. and we entered into a subscription agreement (the “Subscription Agreement”) which set out the terms for the $1.0 billion equity investment by, and issuance of shares to, NCL Investment Ltd. NCL Investment Ltd. assigned to NCL Investment II Ltd. a portion of its rights and obligations under the Subscription Agreement pursuant to an assignment agreement dated January 7, 2008.
Under the Subscription Agreement, we and Genting HK have agreed to cooperate with each other in developing our respective cruise line businesses, provided that such obligations to cooperate do not extend to any such efforts that could reasonably be expected to have an adverse effect on the operation or prospects of such party’s respective cruise line business.
In addition, subject to the terms below, NCL Investment Ltd. and Genting HK have indemnified each other for certain losses arising from breaches of representations, warranties and covenants made by us, Genting HK and NCL Investment Ltd. Both NCL Investment Ltd.’s and Genting HK’s indemnity obligations relating to breaches of representations and warranties are limited to losses relating to breaches of fundamental representations and warranties to the extent such breaches occurred prior to or on April 30, 2008, subject to certain exceptions for fraudulent or knowing and intentional misrepresentations and except as set forth herein. In addition, Genting HK is obligated to indemnify NCL Investment Ltd. and its affiliates for losses relating to certain undisclosed liabilities, provided that such obligations are limited to those undisclosed liabilities that existed as of January 7, 2008 and of which Genting HK had actual knowledge on such date. Genting HK’s indemnity obligations relating to undisclosed liabilities shall not exceed $20.0 million, either individually or in the aggregate, subject to certain exceptions for fraudulent or knowing and intentional misrepresentations.
Genting HK may elect in its sole discretion to satisfy all or a portion of its indemnity obligations in cash or by causing the Company to issue additional ordinary shares of the Company to NCL Investment Ltd.
F-17
Table of Contents
6. Financial Instruments
Reported fair values are based on a variety of factors and assumptions; therefore, they may not represent actual values of the financial instruments that could have been realized as of the balance sheet date or that will be realized in the future and do not include expenses that could be incurred in an actual sale or settlement. Our financial instruments are not held for trading or speculative purposes.
Our exposure under interest rate and fuel hedging agreements is limited to the cost of replacing the contracts in the event of non-performance by the counterparties to the contracts. To minimize this risk, we select counterparties with credit risks acceptable to us.
The following are the fair values and methods used to estimate the fair values of our financial instruments:
Cash and Cash Equivalents
The carrying amounts of cash and cash equivalents approximate their fair values due to the short-term maturity of these instruments.
Long-Term Debt
As of December 31, 2010 and 2009, the fair value of our long-term debt, including the current portion, was $3,263.7 million and $2,483.1 million, respectively, which was $59.6 million more and $74.6 million less, respectively, than the carrying values. The difference between the fair value and carrying value of our long-term debt is due to our variable rate debt obligations carrying interest rates that are above or below market rates at the measurement dates. The fair value of our long-term debt was calculated based on estimated rates for the same or similar instruments with similar terms and remaining maturities.
Market risk associated with our long-term fixed rate debt is the potential increase in fair value resulting from a decrease in interest rates. Market risk associated with our long-term variable rate debt is the potential increase in interest expense from an increase in interest rates.
Derivatives
As of December 31, 2010 our derivative instruments consisted of fuel swaps which were used to mitigate the financial impact of increases in fuel prices and were designated as hedging instruments (“cash flow hedges”) through June 30, 2012. As of December 31, 2010, 2009 and 2008, the fuel swaps pertained to 248.6 thousand metric tons, 302.5 thousand metric tons and 78.2 thousand metric tons, respectively, of our projected fuel purchases. We also had option contracts designated as cash flow hedges to hedge the exposure to foreign currency exchange rate risk related to our ship construction firm commitments denominated in euros. The notional amount of our option contracts was €150.0 million, $200.8 million based on the euro/U.S dollar exchange rate as of December 31, 2010.
As of December 31, 2009 and 2008, our derivative instruments consisted of an interest rate swap and fuel swaps. We entered into an interest rate swap agreement to mitigate our exposure to interest rate movements and to manage our interest expense. As of December 31, 2009 and 2008, the notional amount of outstanding debt related to the interest rate swap was $400.0 million.
Fair value of our derivative contracts is derived using valuation models that utilize the income valuation approach. These valuation models take into account the contract terms, as well as other inputs such as fuel types, fuel curves, exchange rates, creditworthiness of the counterparty and the Company, as well as other data points.
F-18
Table of Contents
Fair value is defined as the price that would be received to sell an asset or paid to transfer a liability in an orderly transaction between market participants at the measurement date. The following hierarchy for inputs used in measuring fair value should maximize the use of observable inputs and minimize the use of unobservable inputs by requiring that the most observable inputs be used when available:
| Level 1 |
Quoted prices in active markets for identical assets or liabilities that are accessible at the measurement date. | |
| Level 2 |
Significant other observable inputs that are used by market participants in pricing the asset or liability based on market data obtained from independent sources. | |
| Level 3 |
Significant unobservable inputs we believe market participants would use in pricing the asset or liability based on the best information available. | |
The following table sets forth our derivatives measured at fair value and discloses the balance sheet location (in thousands).
| December 31, | ||||||||
| 2010 | 2009 | |||||||
| Fuel swaps designated as hedging instruments: |
||||||||
| Prepaid expenses and other assets |
$ | 10,694 | $ | 8,977 | ||||
| Other long-term assets |
651 | — | ||||||
| Option contracts designated as hedging instruments: |
||||||||
| Other long-term liabilities |
1,105 | — | ||||||
| Interest rate swap not designated as a hedging instrument: |
||||||||
| Accrued expenses and other liabilities |
— | 10,086 | ||||||
These derivatives were categorized as Level 2 in the fair value hierarchy, and we had no derivatives or other financial instruments categorized as Level 1 or Level 3.
We assess whether derivatives used in hedging transactions are “highly effective” in offsetting changes in the cash flow of hedged items. We use regression analysis for this hedge relationship and high effectiveness is achieved when a statistically valid relationship reflects a high degree of offset and correlation between the fair values of the derivative instrument and the hedged item. Cash flows from the derivative instrument are classified in the same category as the cash flows from the underlying hedged item. The determination of ineffectiveness is based on the amount of dollar offset between the change in fair value of the derivative instrument and the change in fair value of the hedged item at the end of the reporting period. If it is determined that a derivative is not highly effective as a hedge then the change in fair value is recognized in earnings. In addition, the ineffective portion of our highly effective hedges is recognized in earnings immediately and reported in other income (expense) in our consolidated statements of operations. There are no amounts excluded from the assessment of hedge effectiveness and there are no credit-risk-related contingent features in our derivative agreements.
We monitor concentrations of credit risk associated with financial and other institutions with which we conduct significant business. Credit risk, including but not limited to counterparty non-performance under derivative instruments and our revolving credit facility, is not considered significant, as we primarily conduct business with large, well-established financial institutions and insurance companies that we have well-established relationships with and that have credit risks acceptable to us or the credit risk is spread out among a large number of creditors. We do not anticipate non-performance by any of our significant counterparties.
F-19
Table of Contents
The changes in fair value of fuel swaps which were designated as cash flow hedges were as follows (in thousands):
| Year
Ended December 31, |
||||||||||||
| 2010 | 2009 | 2008 | ||||||||||
| Income recognized to other comprehensive income—effective portion |
$ | — | $ | 1,625 | $ | — | ||||||
| Income recognized to other income (expense)—ineffective portion |
140 | 170 | — | |||||||||
|
|
|
|
|
|
|
|||||||
| Total income related to derivatives designated as cash flow hedges |
$ | 140 | $ | 1,795 | $ | — | ||||||
|
|
|
|
|
|
|
|||||||
The changes in fair value of the option contracts which were designated as cash flow hedges were as follows (in thousands):
| Year
Ended December 31, |
||||||||||||
| 2010 | 2009 | 2008 | ||||||||||
| Income recognized to other income (expense)-ineffective portion |
$ | 21 | $ | — | $ | — | ||||||
|
|
|
|
|
|
|
|||||||
The changes in fair value of derivatives not designated as hedging instruments were recognized in other income (expense) as follows (in thousands):
| Year
Ended December 31, |
||||||||||||
| 2010 | 2009 | 2008 | ||||||||||
| Interest rate swap |
$ | (623 | ) | $ | (5,527 | ) | $ | (9,365 | ) | |||
| Foreign currency forward contracts |
(33,061 | ) | 20,583 | 1,105 | ||||||||
| Fuel derivative contracts |
— | 20,399 | (86,161 | ) | ||||||||
|
|
|
|
|
|
|
|||||||
| Total income (loss) related to derivatives not designated as hedging instruments |
$ | (33,684 | ) | $ | 35,455 | $ | (94,421 | ) | ||||
|
|
|
|
|
|
|
|||||||
Foreign Currency Contracts
As of December 31, 2010 and 2009, we did not have any foreign currency forward contracts. As of December 31, 2008, we had foreign currency forward contracts related to euro-denominated contractual obligations with an aggregate notional amount of $66.4 million maturing through October 2009. Our exposure to market risk for fluctuations in foreign currency exchange rates related to our ship construction contract. We use foreign currency forward contracts and purchase options to mitigate the impact of fluctuations in foreign currency exchange rates.
Interest Rate Swap
Our exposure to market risk for changes in interest rates relates to our long-term debt obligations. We enter into interest rate swap agreements to modify our exposure to interest rate movements and to manage our interest expense. Market risk associated with our long-term fixed rate debt is the potential increase in fair value resulting from a decrease in interest rates. Market risk associated with our long-term variable rate debt is the potential increase in interest expense from an increase in interest rates. As of December 31, 2009 and 2008, our interest rate swap agreement effectively changed $400.0 million of LIBOR-based variable rate debt to 2.98% fixed rate debt through October 2010.
Non-recurring Measurements of Non-financial Assets
Goodwill and other long-lived assets, principally tradenames, are reviewed for impairment on an annual basis or earlier if there is an event or change in circumstances that would indicate that the carrying value of these assets could not be fully recovered.
F-20
Table of Contents
If the carrying amount of the asset exceeds the estimated expected undiscounted future cash flows, we measure the amount of the impairment by comparing the carrying amount of the asset to its fair value. We estimate fair value based on the best information available making whatever estimates, judgments and projections considered necessary. The estimation of fair value measured by discounting expected future cash flows at discount rates commensurate with the risk involved are considered Level 3 inputs. We do not believe that we have any impairment to our goodwill or tradenames as of December 31, 2010. We believe our estimates and judgments with respect to our goodwill and tradenames are reasonable. Nonetheless, if there was a material change in assumptions used in the determination of such fair values or if there is a material change in the conditions or circumstances that influence such assets, we could be required to record an impairment charge.
7. Employee Benefits and Share Option Plans
Profits Sharing Agreement
In 2009, we adopted a profits sharing agreement which authorizes us to grant profits interests in the Company to certain key employees. These interests generally vest with the holders based on a combination of performance-based and time-based vesting metrics, each as specified in the profits sharing agreement and each holder’s award agreement. The Apollo Funds, Genting HK and the TPG Viking Funds are entitled to initially receive any distributions made by the Company, pro rata based on their shareholdings in the Company. Once the Apollo Funds, Genting HK and the TPG Viking Funds receive distributions in excess of certain hurdle amounts specified in the profits sharing agreement and each holder’s award agreement, each vested profits interest award generally entitles the holder of such award to a portion of such excess distribution amount. At our sole discretion, the settlement of each award is expected to be in the form of ordinary shares, options or a combination thereof, which results in equity award classification.
In 2009, profits interests, generally consisting of fifty percent of “Time-Based Units” (“TBUs”) and fifty percent of “Performance-Based Units” (“PBUs”), were granted to senior management. The TBUs vest over five years commencing on the later of January 7, 2008 or the employee’s employment start date. Upon a distribution event, the vesting amount of the PBUs is based on the amount of proceeds that are realized above certain hurdles.
The termination of employment results in forfeiture of any non-vested TBUs and all PBUs. TBUs that are vested can be either continued by the Company or cancelled and paid to the employee. Cancellation can take place anytime after termination but not before two years after the grant date.
The fair value of the profits interests was computed using a binomial (lattice) model using the following assumptions:
| Year
Ended December 31, | ||||
| 2010 | 2009 | |||
| Dividend yield |
0% | 0% | ||
| Expected stock price volatility |
50.00% | 59.20% | ||
| Risk-free interest rate |
1.41% | 3.39% | ||
| Expected unit life |
3 years | 3 years | ||
Expected stock price volatility was based on annual volatilities of comparable companies in our industry based on three years of historical data. Risk-free interest rates were adjusted to the average risk-free rates applicable at the grant date. The expected unit life was calculated with the expectation of a distribution event occurring within a three-year period. We estimated forfeitures based on our historical termination rates for the last three years.
The aggregate fair value for the profits interests as of December 31, 2010 was comprised of $9.6 million for PBUs and $7.8 million for TBUs. Total compensation expense recognized for the years ended December 31, 2010 and 2009 was $2.5 million and $3.7 million, respectively, and was recorded in marketing, general and administrative expense. As of December 31, 2010, there was $1.6 million of total unrecognized compensation expense related to TBU non-vested shares. As of December 31, 2010, there was no aggregate intrinsic value of options outstanding and exercisable.
F-21
Table of Contents
Pertinent information covering the profits interests pursuant to the profits sharing agreement were as follows:
| Number of Shares |
TBUs Weighted- Average Price |
PBUs Weighted- Average Price |
||||||||||||||
| TBUs | PBUs | |||||||||||||||
| Outstanding as of December 31, 2009 |
303,700 | 295,500 | $ | 21.94 | $ | 22.81 | ||||||||||
| Granted |
97,500 | 197,500 | $ | 8.88 | $ | 12.85 | ||||||||||
| Forfeited |
(38,100 | ) | (47,500 | ) | $ | 11.85 | $ | 22.90 | ||||||||
|
|
|
|
|
|||||||||||||
| Outstanding as of December 31, 2010 |
363,100 | 445,500 | $ | 19.67 | $ | 18.40 | ||||||||||
|
|
|
|
|
|||||||||||||
| Vested as of December 31, 2010 |
110,800 | — | $ | 24.18 | $ | — | ||||||||||
|
|
|
|
|
|||||||||||||
| Non-vested as of December 31, 2010 |
252,300 | 445,500 | $ | 17.68 | $ | 18.40 | ||||||||||
|
|
|
|
|
|||||||||||||
Share option scheme for shares of Genting HK
Share options that are exercisable for shares of Genting HK have been granted to certain directors and employees of Genting HK and NCL under the “Star Cruises Employees Share Option Scheme for Executives” which was originally adopted by Genting HK on April 16, 1997 prior to the listing of its ordinary shares on The Stock Exchange of Hong Kong Limited and the Share Option Scheme adopted by Genting HK on August 23, 2000 (as effected on November 30, 2000 and amended on May 22, 2002 the “Post-Listing Employee Share Option Scheme”).
As of December 31, 2010, outstanding and exercisable share options granted to NCL’s employees under the Post-Listing Employee Share Option Scheme totaled 39,525,827 with a weighted-average exercise price of $0.34 per share, including 2,595,853 and 542,757 granted to a former executive officer and director, respectively. Total compensation expense for options issued under the Pre-Listing Employee Share Option Scheme and the Post-Listing Share Option Scheme was $0.8 million for the year ended December 31, 2008. As of December 31, 2008, all compensation expense had been recognized.
There were no options granted or modified during 2010, 2009 and 2008.
Pertinent information covering the options granted pursuant to the Post-Listing Employee Share Option Scheme were as follows:
| Number of Shares |
Option Price | Weighted- Average Exercise Price |
Weighted- Average Remaining Contractual Life (years) |
Expiration Date |
||||||||||||||||
| Outstanding as of December 31, 2010 |
39,525,827 | $ | 0.21-$0.36 | $ | 0.34 | 1.99 | 2012-14 | |||||||||||||
|
|
|
|||||||||||||||||||
| Options exercisable at December 31, 2010 |
39,525,827 | $ | 0.21-$0.36 | $ | 0.34 | 1.99 | ||||||||||||||
|
|
|
|||||||||||||||||||
F-22
Table of Contents
Significant option groups outstanding as of December 31, 2010 and related price and life information was as follows:
| Options Outstanding | Options Exercisable | |||||||||||||||||||
| Exercise Price |
Outstanding at December 31, 2010 |
Weighted- Average Exercise Price |
Weighted- Average Remaining Contractual Life (years) |
Exercisable at December 31, 2010 |
Weighted- Average Exercise Price |
|||||||||||||||
| $0.36 |
32,849,321 | $ | 0.36 | 1.65 | 32,849,321 | $ | 0.36 | |||||||||||||
| $0.21 |
6,676,506 | $ | 0.21 | 3.65 | 6,676,506 | $ | 0.21 | |||||||||||||
|
|
|
|
|
|||||||||||||||||
| 39,525,827 | $ | 0.34 | 1.99 | 39,525,827 | $ | 0.34 | ||||||||||||||
|
|
|
|
|
|||||||||||||||||
As of December 31, 2010, the intrinsic value of options outstanding and exercisable was $3.0 million for the options priced at $0.36 and $1.6 million for the options priced at $0.21.
Employee Benefit Plans
Certain of our employees are employed pursuant to agreements that provide for severance payments. Severance is generally only payable upon an involuntary termination of the employee’s employment by us without cause or a termination by the employee for good reason. Severance generally includes a cash payment based on the employee’s base salary, and our payment of the employee’s continued medical benefits for the applicable severance period. During 2008, we entered into a severance agreement with our former chief executive officer and recognized costs associated with this of $25.3 million. As of December 31, 2010, the remaining liability was $13.8 million, which includes a fully vested co-investment profits interest award granted under the profits sharing agreement described above.
We maintain annual incentive bonus plans for our executive officers and other key employees. Bonuses under these plans become earned and payable based on both the Company’s and each individual’s performance during the applicable performance period and the individual’s continued employment. Company performance criteria include the attainment of certain financial targets and other strategic objectives.
We maintain a 401(k) Plan for our shoreside employees, including our executive officers. Participants may contribute up to 100% of eligible compensation each pay period, subject to certain limitations. We make matching contributions equal to 100% of the first 3% and 50% of the next 4% - 10% of each participant’s contributions, and our matching contributions may not exceed 6% of each participant’s compensation. Our matching contributions are vested according to a five-year schedule. The 401(k) Plan is subject to the provisions of ERISA and is intended to be qualified under section 401(a) of the U.S. Internal Revenue Code (the “Code”).
Our contributions are reduced by contributions forfeited by those employees who leave the 401(k) Plan prior to vesting fully in the contributions. Forfeited contributions of $0.2 million, $0.3 million and $0.2 million were utilized in each of the years ended December 31, 2010, 2009 and 2008, respectively.
We maintain a Supplemental Executive Retirement Plan (“SERP”), which is a legacy unfunded defined contribution plan for certain of our executives who were employed by the Company in an executive capacity prior to 2008. The SERP was frozen to future participation following that date. The SERP provides for Company contributions on behalf of the participants to compensate them for the benefits that are limited under the 401(k) Plan. We credit participants under the SERP for amounts that would have been contributed by us to the Company’s previous Defined Contribution Retirement Plan and the former 401(k) Plan without regard to any limitations imposed by the Code. Participants do not make any elective contributions under this plan. As of December 31, 2010 and 2009, the aggregate balance of participants’ deferred compensation accounts under the SERP Plan was $0.9 million for each year. The SERP Plan is unfunded.
F-23
Table of Contents
We recorded expenses related to the above 401(k) Plan and SERP of $2.7 million, $3.1million and $3.6 million for the years ended December 31, 2010, 2009 and 2008, respectively.
Effective January 2009, we implemented the Norwegian Shipboard Retirement Plan (“Shipboard Retirement Plan”) which computes benefits based on years of service, subject to eligibility requirements of the Shipboard Retirement Plan. The Shipboard Retirement Plan is unfunded with no plan assets. The projected benefit obligation of $0.8 million was included in accrued expenses and other liabilities as of December 31, 2010 and $8.7 million and $8.0 million was included in other long-term liabilities in our consolidated balance sheet as of December 31, 2010 and 2009, respectively. The amounts related to the Shipboard Retirement Plan were as follows (in thousands).
| Year
Ended December 31, |
||||||||
| 2010 | 2009 | |||||||
| Pension expense: |
||||||||
| Service cost |
$ | 980 | $ | 991 | ||||
| Interest cost |
481 | 496 | ||||||
| Amortization of prior service cost |
378 | 378 | ||||||
| Gain |
(29 | ) | — | |||||
|
|
|
|
|
|||||
| Total pension expense |
$ | 1,810 | $ | 1,865 | ||||
|
|
|
|
|
|||||
| Change in projected benefit obligation: |
||||||||
| Projected benefit obligation |
$ | 8,016 | $ | 7,939 | ||||
| Service cost |
980 | 991 | ||||||
| Interest cost |
481 | 496 | ||||||
| Actuarial Gain |
— | (1,410 | ) | |||||
|
|
|
|
|
|||||
| Projected benefit obligation |
$ | 9,477 | $ | 8,016 | ||||
|
|
|
|
|
|||||
| Amounts recognized in the consolidated balance sheet: |
||||||||
| Projected benefit obligation |
$ | 9,477 | $ | 8,016 | ||||
|
|
|
|
|
|||||
| Amounts recognized in accumulated other comprehensive loss: |
||||||||
| Prior service cost |
$ | (7,183 | ) | $ | (7,561 | ) | ||
| Accumulated gain |
1,381 | 1,410 | ||||||
|
|
|
|
|
|||||
| Accumulated other comprehensive loss |
$ | (5,802 | ) | $ | (6,151 | ) | ||
|
|
|
|
|
|||||
The discount rates used in the net periodic benefit cost calculation for the years ended December 31, 2010 and 2009 are 5.5% and 6.0%, respectively, and the actuarial gain is amortized over 20.63 years. The discount rate is used to measure and recognize obligations, including adjustments to other comprehensive income, and to determine expense during the periods. It is determined by using bond indices which reflect yields on a broad maturity and industry universe of high-quality corporate bonds.
The pension benefits expected to be paid in each of the next five years and in aggregate for the five years thereafter are as follows (in thousands):
| Year |
Amount | |||
| 2011 |
$ | 838 | ||
| 2012 |
557 | |||
| 2013 |
556 | |||
| 2014 |
563 | |||
| 2015 |
584 | |||
| Next five years |
3,810 | |||
F-24
Table of Contents
8. Income Taxes
We are incorporated in Bermuda, and our subsidiary, Arrasas Limited, is incorporated in the Isle of Man. Generally, we are not subject to income tax in respect of activities undertaken outside these countries.
Under current Bermuda law, we are not subject to tax on income or capital gains. We have received from the Minister of Finance under The Exempted Undertakings Tax Protection Act 1966, as amended, an assurance that, in the event that Bermuda enacts legislation imposing tax computed on profits, income, any capital asset, gain or appreciation, or any tax in the nature of estate duty or inheritance, then the imposition of any such tax shall not be applicable to us or to any of our operations or shares, debentures or other obligations, until March 28, 2016. The Bermuda government announced that it intends to extend the period of time for which an assurance may be granted to 2035. Further details are expected to be forthcoming in early 2011.
We previously had operations in Norway through NCL Holdings ASA (“NCLH”) and its subsidiaries. Deferred tax assets and liabilities that relate to our Norwegian taxes were comprised of the following (in thousands):
| December 31, | ||||||||
| 2010 | 2009 | |||||||
| Deferred tax assets: |
||||||||
| Loss carryforwards |
$ | 38,499 | $ | 42,249 | ||||
| Shares in NCL Cruises Ltd. |
70,183 | 73,324 | ||||||
| Pension obligation |
479 | 541 | ||||||
| Other |
188 | 236 | ||||||
|
|
|
|
|
|||||
| 109,349 | 116,350 | |||||||
| Valuation allowance |
(109,349 | ) | (116,350 | ) | ||||
|
|
|
|
|
|||||
| Total net deferred taxes |
$ | — | $ | — | ||||
|
|
|
|
|
|||||
Taxable losses can be carried forward indefinitely. Total losses available for carry forward related to NCLH as of December 31, 2010 and 2009 are $137.4 million and $150.9 million, respectively.
In January 2008, NCL Corporation Ltd. became a partnership for U.S. Federal income tax purposes and therefore incurs no U.S. Federal or State income tax liability. Each partner is required to take into account its allocable share of items of income, gain, loss and deduction of the partnership in computing its U.S. Federal income tax liability, regardless of whether or not cash distributions are made.
In connection with the RDA (we refer you to Note 5 “Related Party Disclosures”), in December 2009, NCL America Holdings, Inc. (NCLAH), the tax owner of the assets of our U.S.-flagged operation, was converted to a limited liability company (LLC) under Delaware law which resulted in a complete liquidation for U.S. income tax purposes. As a result, as of December 31, 2010 and 2009, we have no deferred tax assets, deferred tax liabilities or related valuation allowance on our balance sheet related to our U.S. subsidiaries, and our shareholders are subject to U.S. Federal income taxation with respect to income derived in respect of our U.S.-flagged operations.
9. Commitments and Contingencies
Operating Leases
We operate principally in leased premises. Total expense under non-cancelable operating lease commitments, primarily for offices, motor vehicles and office equipment was $12.4 million, $11.0 million and $11.0 million for the years ended December 31, 2010, 2009 and 2008, respectively.
F-25
Table of Contents
As of December 31, 2010, minimum annual rentals for non-cancelable leases with initial or remaining terms in excess of one year were as follows (in thousands):
| Year |
Amount | |||
| 2011 |
$ | 7,329 | ||
| 2012 |
6,302 | |||
| 2013 |
6,246 | |||
| 2014 |
5,869 | |||
| 2015 |
5,199 | |||
| Thereafter |
19,945 | |||
|
|
|
|||
| Total |
$ | 50,890 | ||
|
|
|
|||
Rental payments applicable to such operating leases are recognized on a straight-line basis over the term of the lease.
Ship Commitments
In September 2010, we reached an agreement with a shipyard to build two new next generation Freestyle Cruising ships with financing commitments in place from a syndicate of banks for export credit financing. These ships, each at 143,500 Gross Tons and capacity of approximately 4,000 Berths, are scheduled for delivery in the second quarter of 2013 and 2014, respectively. The aggregate contract price of the two ships is approximately €1.2 billion, or $1.6 billion based on the euro/U.S. dollar exchange rate as of December 31, 2010. In connection with the contracts to build the two ships, we do not anticipate any contractual breaches or cancellation to occur. However, if any would occur, it could result in, among other things, the forfeiture of prior deposits or payments made by us and potential claims and impairment losses which may materially impact our business, financial condition and results of operations.
Material Litigation
In May 2008, we were served with a complaint in the Circuit Court of Miami-Dade County, Florida, by a former shipboard concessionaire for fraudulent inducement, equitable or promissory estoppel and breach of contract in connection with the termination of a shipboard concessionaire agreement. Discovery is ongoing. We believe that we have meritorious defenses to these claims and, accordingly, are vigorously defending this action and are not able at this time to estimate the impact of these proceedings.
In July 2009, a class action complaint was filed against NCL (Bahamas) Ltd. in the United States District Court, Southern District of Florida on behalf of a purported class of crew members alleging inappropriate deductions of their wages pursuant to the Seaman’s Wage Act and wrongful termination resulting in a loss of retirement benefits. We believe that we have meritorious defenses to these claims and, accordingly, are vigorously defending this action and are not able at this time to estimate the impact of these proceedings.
In the normal course of our business, various other claims and lawsuits have been filed or are pending against us. Most of these claims and lawsuits are covered by insurance and, accordingly, the maximum amount of our liability is typically limited to our deductible amount. Nonetheless, the ultimate outcome of these claims and lawsuits that are not covered by insurance cannot be determined at this time. We have evaluated our overall exposure with respect to all of our threatened and pending litigation and to the extent required, we have accrued amounts for all estimable probable losses associated with our deemed exposure. We are currently unable to estimate any other potential contingent losses beyond those accrued, as discovery is not complete nor is adequate information available to estimate such range of loss or potential recovery. We intend to vigorously defend our legal position on all claims and, to the extent necessary, seek recovery.
F-26
Table of Contents
Port Facility Commitments
As of December 31, 2010, future commitments to pay for usage of certain port facilities were as follows (in thousands):
| Year |
Amount | |||
| 2011 |
$ | 22,330 | ||
| 2012 |
19,263 | |||
| 2013 |
18,654 | |||
| 2014 |
20,183 | |||
| 2015 |
21,091 | |||
| Thereafter |
53,237 | |||
|
|
|
|||
| Total |
$ | 154,758 | ||
|
|
|
|||
The U.S. Federal Maritime Commission requires evidence of financial responsibility for those offering transportation on passenger ships operating out of U.S. ports to indemnify passengers in the event of non-performance of the transportation. Accordingly, we are required to maintain a $15.0 million third-party performance guarantee on our behalf in respect of liabilities for non-performance of transportation and other obligations to passengers. Proposed regulations would revise the financial requirements with respect to both death/injury and non-performance coverages. Also we have a legal requirement for us to maintain a security guarantee based on cruise business originated from the United Kingdom and have a bond with the Association of British Travel Agents currently valued at British Pound Sterling 2.1 million. We also are required to establish financial responsibility by other jurisdictions to meet liability in the event of non-performance of our obligations to passengers from those jurisdictions.
Other
Certain of our service providers have required collateral in the normal course of our business including liens on certain of our ships. The amount of collateral may change based on certain terms and conditions. During the year ended December 31, 2010, our service providers released in aggregate $89.3 million of collateral which was included in other long-term assets in our consolidated balance sheet as of December 31, 2009.
10. Supplemental Cash Flow Information
For the years ended December 31, 2010, 2009 and 2008 we paid interest expense and related fees of $247.1 million, $150.4 million and $167.9 million, respectively.
For the year ended December 31, 2010, we had non-cash operating activities of $1.7 million in connection with cash flow hedges. For the year ended December 31, 2009, we had non-cash financing activities of $297.8 million in connection with the transfers of Norwegian Sky, Norwegian Majesty and Norwegian Dream, as well as the distribution of the S.S. United States to Genting HK. We also had $3.5 million pertaining to certain estimated tax positions relating to transactions amongst entities under common control. In addition, we had $37.1 million of deferred financing fees capitalized and accrued associated with amendments to our debt agreements (we refer you to Note 4 “Long-Term Debt”), $6.9 million of non-cash activities in connection with our Shipboard Retirement Plan (we refer you to Note 7 “Employee Benefit Plans”), $8.5 million in connection with fuel derivative cash flow hedges, and $1.0 million for a note receivable.
For the years ended December 31, 2010 and 2008, we had no non-cash activities related to capital leases. For the year ended December 31, 2009 we had non-cash investing activities related to capital leases of $6.6 million.
F-27
Table of Contents
11. Guarantor Subsidiaries
Our $450.0 million 11.75% Senior Secured Notes due 2016 are guaranteed by certain of our subsidiaries with first-priority mortgage liens on four of our ships, Norwegian Star, Norwegian Spirit, Norwegian Sun and Norwegian Dawn, and a first-priority security interest in all earnings, proceeds of insurance and certain other interests related to those ships, subject to certain exceptions and permitted liens. These subsidiary guarantors are 100% owned subsidiaries of NCL Corporation Ltd. and have fully and unconditionally guaranteed our $450.0 million 11.75% Senior Secured Notes due 2016 on a joint and several basis.
The following condensed consolidating financial information for NCL Corporation Ltd., the non-guarantor subsidiaries and combined guarantor subsidiaries presents condensed consolidating statements of operations for the three years ended December 31, 2010, 2009 and 2008, condensed consolidating balance sheets as of December 31, 2010 and December 31, 2009 and condensed consolidating statements of cash flows for the years ended December 31, 2010, 2009 and 2008 using the equity method of accounting, as well as elimination entries necessary to consolidate the parent company and all of its subsidiaries.
The outstanding debt resides with the primary obligor. Interest expense was allocated based on the value of the ships, and marketing, general and administrative expense was allocated based on Capacity Days. Management fee represents the charge for the allocation of interest expense to the subsidiaries.
F-28
Table of Contents
NCL Corporation Ltd.
Condensed Consolidating Statement of Operations
For the Year Ended December 31, 2010
| (in thousands) | Parent | Guarantor Subsidiaries |
Non-Guarantor Subsidiaries |
Eliminations | Consolidated | |||||||||||||||
| Revenue |
||||||||||||||||||||
| Passenger ticket |
$ | — | $ | 452,920 | $ | 939,586 | $ | — | $ | 1,392,506 | ||||||||||
| Onboard and other |
— | 198,919 | 420,703 | — | 619,622 | |||||||||||||||
|
|
|
|
|
|
|
|
|
|
|
|||||||||||
| Total revenue |
— | 651,839 | 1,360,289 | — | 2,012,128 | |||||||||||||||
|
|
|
|
|
|
|
|
|
|
|
|||||||||||
| Cruise operating expense |
||||||||||||||||||||
| Commissions, transportation and other |
— | 129,827 | 249,828 | — | 379,655 | |||||||||||||||
| Onboard and other |
— | 51,942 | 101,195 | — | 153,137 | |||||||||||||||
| Payroll and related |
— | 83,272 | 182,118 | — | 265,390 | |||||||||||||||
| Fuel |
— | 82,071 | 125,139 | — | 207,210 | |||||||||||||||
| Food |
— | 39,163 | 74,901 | — | 114,064 | |||||||||||||||
| Other |
— | 73,046 | 154,796 | — | 227,842 | |||||||||||||||
|
|
|
|
|
|
|
|
|
|
|
|||||||||||
| Total cruise operating expense |
— | 459,321 | 887,977 | — | 1,347,298 | |||||||||||||||
|
|
|
|
|
|
|
|
|
|
|
|||||||||||
| Other operating expense |
||||||||||||||||||||
| Marketing, general and administrative |
— | 106,684 | 157,714 | — | 264,398 | |||||||||||||||
| Depreciation and amortization |
— | 56,027 | 114,164 | — | 170,191 | |||||||||||||||
|
|
|
|
|
|
|
|
|
|
|
|||||||||||
| Total other operating expense |
— | 162,711 | 271,878 | — | 434,589 | |||||||||||||||
|
|
|
|
|
|
|
|
|
|
|
|||||||||||
| Operating income |
— | 29,807 | 200,434 | — | 230,241 | |||||||||||||||
|
|
|
|
|
|
|
|
|
|
|
|||||||||||
| Non-operating income (expense) |
||||||||||||||||||||
| Interest income |
3 | — | 97 | — | 100 | |||||||||||||||
| Interest expense, net of capitalized interest |
(107,631 | ) | (29,854 | ) | (143,918 | ) | 107,631 | (173,772 | ) | |||||||||||
| Management fee |
107,631 | — | — | (107,631 | ) | — | ||||||||||||||
| Other expense |
(33,498 | ) | (192 | ) | (262 | ) | — | (33,952 | ) | |||||||||||
| Equity in earnings of subsidiaries |
56,112 | — | — | (56,112 | ) | — | ||||||||||||||
|
|
|
|
|
|
|
|
|
|
|
|||||||||||
| Total non-operating income (expense) |
22,617 | (30,046 | ) | (144,083 | ) | (56,112 | ) | (207,624 | ) | |||||||||||
|
|
|
|
|
|
|
|
|
|
|
|||||||||||
| Net income (loss) |
$ | 22,617 | $ | (239 | ) | $ | 56,351 | $ | (56,112 | ) | $ | 22,617 | ||||||||
|
|
|
|
|
|
|
|
|
|
|
|||||||||||
F-29
Table of Contents
NCL Corporation Ltd.
Condensed Consolidating Statement of Operations
For the Year Ended December 31, 2009
| (in thousands) | Parent | Guarantor Subsidiaries |
Non-Guarantor Subsidiaries |
Eliminations | Consolidated | |||||||||||||||
| Revenue |
||||||||||||||||||||
| Passenger ticket |
$ | — | $ | 424,863 | $ | 850,981 | $ | — | $ | 1,275,844 | ||||||||||
| Onboard and other |
— | 193,810 | 385,550 | — | 579,360 | |||||||||||||||
|
|
|
|
|
|
|
|
|
|
|
|||||||||||
| Total revenue |
— | 618,673 | 1,236,531 | — | 1,855,204 | |||||||||||||||
|
|
|
|
|
|
|
|
|
|
|
|||||||||||
| Cruise operating expense |
||||||||||||||||||||
| Commissions, transportation and other |
— | 130,050 | 246,986 | — | 377,036 | |||||||||||||||
| Onboard and other |
— | 53,391 | 104,939 | — | 158,330 | |||||||||||||||
| Payroll and related |
— | 79,678 | 172,748 | — | 252,426 | |||||||||||||||
| Fuel |
— | 66,766 | 95,917 | — | 162,683 | |||||||||||||||
| Food |
— | 42,619 | 76,280 | — | 118,899 | |||||||||||||||
| Other |
— | 63,906 | 156,174 | — | 220,080 | |||||||||||||||
|
|
|
|
|
|
|
|
|
|
|
|||||||||||
| Total cruise operating expense |
— | 436,410 | 853,044 | — | 1,289,454 | |||||||||||||||
|
|
|
|
|
|
|
|
|
|
|
|||||||||||
| Other operating expense |
||||||||||||||||||||
| Marketing, general and administrative |
— | 102,239 | 139,437 | — | 241,676 | |||||||||||||||
| Depreciation and amortization |
— | 56,831 | 95,869 | — | 152,700 | |||||||||||||||
|
|
|
|
|
|
|
|
|
|
|
|||||||||||
| Total other operating expense |
— | 159,070 | 235,306 | — | 394,376 | |||||||||||||||
|
|
|
|
|
|
|
|
|
|
|
|||||||||||
| Operating income |
— | 23,193 | 148,181 | — | 171,374 | |||||||||||||||
|
|
|
|
|
|
|
|
|
|
|
|||||||||||
| Non-operating income (expense) |
||||||||||||||||||||
| Interest income |
1 | — | 835 | — | 836 | |||||||||||||||
| Interest expense, net of capitalized interest |
(67,063 | ) | (23,153 | ) | (92,197 | ) | 67,063 | (115,350 | ) | |||||||||||
| Management fee |
67,063 | — | — | (67,063 | ) | — | ||||||||||||||
| Other income (expense) |
(5,680 | ) | 624 | 15,429 | — | 10,373 | ||||||||||||||
| Equity in earnings of subsidiaries |
72,912 | — | — | (72,912 | ) | — | ||||||||||||||
|
|
|
|
|
|
|
|
|
|
|
|||||||||||
| Total non-operating income (expense) |
67,233 | (22,529 | ) | (75,933 | ) | (72,912 | ) | (104,141 | ) | |||||||||||
|
|
|
|
|
|
|
|
|
|
|
|||||||||||
| Net income |
$ | 67,233 | $ | 664 | $ | 72,248 | $ | (72,912 | ) | $ | 67,233 | |||||||||
|
|
|
|
|
|
|
|
|
|
|
|||||||||||
F-30
Table of Contents
NCL Corporation Ltd.
Condensed Consolidating Statement of Operations
For the Year Ended December 31, 2008
| (in thousands) | Parent | Guarantor Subsidiaries |
Non-Guarantor Subsidiaries |
Eliminations | Consolidated | |||||||||||||||
| Revenue |
||||||||||||||||||||
| Passenger ticket |
$ | — | $ | 474,178 | $ | 1,027,468 | $ | — | $ | 1,501,646 | ||||||||||
| Onboard and other |
— | 199,126 | 405,629 | — | 604,755 | |||||||||||||||
|
|
|
|
|
|
|
|
|
|
|
|||||||||||
| Total revenue |
— | 673,304 | 1,433,097 | — | 2,106,401 | |||||||||||||||
|
|
|
|
|
|
|
|
|
|
|
|||||||||||
| Cruise operating expense |
||||||||||||||||||||
| Commissions, transportation and other |
— | 122,494 | 287,567 | — | 410,061 | |||||||||||||||
| Onboard and other |
— | 55,405 | 127,412 | — | 182,817 | |||||||||||||||
| Payroll and related |
— | 82,498 | 226,585 | — | 309,083 | |||||||||||||||
| Fuel |
— | 99,602 | 158,660 | — | 258,262 | |||||||||||||||
| Food |
— | 41,964 | 84,772 | — | 126,736 | |||||||||||||||
| Other |
— | 87,987 | 203,535 | — | 291,522 | |||||||||||||||
|
|
|
|
|
|
|
|
|
|
|
|||||||||||
| Total cruise operating expense |
— | 489,950 | 1,088,531 | — | 1,578,481 | |||||||||||||||
|
|
|
|
|
|
|
|
|
|
|
|||||||||||
| Other operating expense |
||||||||||||||||||||
| Marketing, general and administrative |
— | 111,132 | 188,695 | — | 299,827 | |||||||||||||||
| Depreciation and amortization |
— | 56,533 | 106,032 | — | 162,565 | |||||||||||||||
| Impairment loss |
— | — | 128,775 | — | 128,775 | |||||||||||||||
|
|
|
|
|
|
|
|
|
|
|
|||||||||||
| Total other operating expense |
— | 167,665 | 423,502 | — | 591,167 | |||||||||||||||
|
|
|
|
|
|
|
|
|
|
|
|||||||||||
| Operating income (loss) |
— | 15,689 | (78,936 | ) | — | (63,247 | ) | |||||||||||||
|
|
|
|
|
|
|
|
|
|
|
|||||||||||
| Non-operating income (expense) |
||||||||||||||||||||
| Interest income |
— | — | 2,796 | — | 2,796 | |||||||||||||||
| Interest expense, net of capitalized interest |
(95,438 | ) | (32,950 | ) | (119,414 | ) | 95,438 | (152,364 | ) | |||||||||||
| Management fee |
95,438 | — | — | (95,438 | ) | — | ||||||||||||||
| Other income (expense) |
94,041 | (904 | ) | (92,125 | ) | — | 1,012 | |||||||||||||
| Equity in loss of subsidiaries |
(305,844 | ) | — | — | 305,844 | — | ||||||||||||||
|
|
|
|
|
|
|
|
|
|
|
|||||||||||
| Total non-operating income (expense) |
(211,803 | ) | (33,854 | ) | (208,743 | ) | 305,844 | (148,556 | ) | |||||||||||
|
|
|
|
|
|
|
|
|
|
|
|||||||||||
| Net loss |
$ | (211,803 | ) | $ | (18,165 | ) | $ | (287,679 | ) | $ | 305,844 | $ | (211,803 | ) | ||||||
|
|
|
|
|
|
|
|
|
|
|
|||||||||||
F-31
Table of Contents
NCL Corporation Ltd.
Condensed Consolidating Balance Sheet
As of December 31, 2010
| (in thousands) | Parent | Guarantor Subsidiaries |
Non-Guarantor Subsidiaries |
Eliminations | Consolidated | |||||||||||||||
| Assets |
||||||||||||||||||||
| Current assets: |
||||||||||||||||||||
| Cash and cash equivalents |
$ | — | $ | 7,833 | $ | 47,214 | $ | — | $ | 55,047 | ||||||||||
| Accounts receivable, net |
1,314 | 403 | 6,162 | — | 7,879 | |||||||||||||||
| Due from Affiliate, net |
2,625,297 | — | — | (2,625,297 | ) | — | ||||||||||||||
| Inventories |
— | 11,116 | 21,647 | — | 32,763 | |||||||||||||||
| Prepaid expenses and other assets |
10,943 | 4,741 | 18,010 | — | 33,694 | |||||||||||||||
|
|
|
|
|
|
|
|
|
|
|
|||||||||||
| Total current assets |
2,637,554 | 24,093 | 93,033 | (2,625,297 | ) | 129,383 | ||||||||||||||
| Property and equipment, net |
— | 1,247,212 | 3,392,069 | — | 4,639,281 | |||||||||||||||
| Goodwill and tradenames |
602,792 | — | — | — | 602,792 | |||||||||||||||
| Other long-term assets |
65,981 | 25 | 126,051 | — | 192,057 | |||||||||||||||
| Investment in subsidiaries |
83,985 | — | — | (83,985 | ) | — | ||||||||||||||
|
|
|
|
|
|
|
|
|
|
|
|||||||||||
| Total assets |
$ | 3,390,312 | $ | 1,271,330 | $ | 3,611,153 | $ | (2,709,282 | ) | $ | 5,563,513 | |||||||||
|
|
|
|
|
|
|
|
|
|
|
|||||||||||
| Liabilities and Shareholders’ Equity |
||||||||||||||||||||
| Current liabilities: |
||||||||||||||||||||
| Current portion of long-term debt |
$ | — | $ | — | $ | 78,237 | $ | — | $ | 78,237 | ||||||||||
| Accounts payable |
— | 998 | 63,401 | — | 64,399 | |||||||||||||||
| Accrued expenses and other liabilities |
24,298 | 46,086 | 146,117 | — | 216,501 | |||||||||||||||
| Due to Affiliate, net |
— | 782,961 | 1,842,336 | (2,625,297 | ) | — | ||||||||||||||
| Advance ticket sales |
— | — | 294,180 | — | 294,180 | |||||||||||||||
|
|
|
|
|
|
|
|
|
|
|
|||||||||||
| Total current liabilities |
24,298 | 830,045 | 2,424,271 | (2,625,297 | ) | 653,317 | ||||||||||||||
| Long-term debt |
1,626,012 | — | 1,499,836 | — | 3,125,848 | |||||||||||||||
| Other long-term liabilities |
8,334 | 2,038 | 42,308 | — | 52,680 | |||||||||||||||
|
|
|
|
|
|
|
|
|
|
|
|||||||||||
| Total liabilities |
1,658,644 | 832,083 | 3,966,415 | (2,625,297 | ) | 3,831,845 | ||||||||||||||
|
|
|
|
|
|
|
|
|
|
|
|||||||||||
| Commitments and contingencies |
||||||||||||||||||||
| Shareholders’ equity: |
||||||||||||||||||||
| Ordinary shares |
25 | 24 | 87,818 | (87,842 | ) | 25 | ||||||||||||||
| Additional paid-in capital |
2,330,792 | 379,946 | 230,283 | (610,229 | ) | 2,330,792 | ||||||||||||||
| Accumulated other comprehensive income (loss) |
4,309 | — | (5,802 | ) | 5,802 | 4,309 | ||||||||||||||
| Retained earnings (deficit) |
(603,458 | ) | 59,277 | (667,561 | ) | 608,284 | (603,458 | ) | ||||||||||||
|
|
|
|
|
|
|
|
|
|
|
|||||||||||
| Total shareholders’ equity |
1,731,668 | 439,247 | (355,262 | ) | (83,985 | ) | 1,731,668 | |||||||||||||
|
|
|
|
|
|
|
|
|
|
|
|||||||||||
| Total liabilities and shareholders’ equity |
$ | 3,390,312 | $ | 1,271,330 | $ | 3,611,153 | $ | (2,709,282 | ) | $ | 5,563,513 | |||||||||
|
|
|
|
|
|
|
|
|
|
|
|||||||||||
F-32
Table of Contents
NCL Corporation Ltd.
Condensed Consolidating Balance Sheet
As of December 31, 2009
| (in thousands) | Parent | Guarantor Subsidiaries |
Non-Guarantor Subsidiaries |
Eliminations | Consolidated | |||||||||||||||
| Assets |
||||||||||||||||||||
| Current assets: |
||||||||||||||||||||
| Cash and cash equivalents |
$ | — | $ | 9,903 | $ | 40,249 | $ | — | $ | 50,152 | ||||||||||
| Accounts receivable, net |
1,289 | 1,182 | 5,397 | — | 7,868 | |||||||||||||||
| Due from Affiliate, net |
2,752,379 | — | — | (2,752,379 | ) | — | ||||||||||||||
| Inventories |
— | 12,225 | 16,640 | — | 28,865 | |||||||||||||||
| Prepaid expenses and other assets |
6,051 | 9,603 | 49,023 | — | 64,677 | |||||||||||||||
|
|
|
|
|
|
|
|
|
|
|
|||||||||||
| Total current assets |
2,759,719 | 32,913 | 111,309 | (2,752,379 | ) | 151,562 | ||||||||||||||
| Property and equipment, net |
— | 1,280,835 | 2,555,292 | — | 3,836,127 | |||||||||||||||
| Goodwill and tradenames |
602,792 | — | — | — | 602,792 | |||||||||||||||
| Other long-term assets |
67,125 | 355 | 153,387 | — | 220,867 | |||||||||||||||
| Investment in subsidiaries |
25,043 | — | — | (25,043 | ) | — | ||||||||||||||
|
|
|
|
|
|
|
|
|
|
|
|||||||||||
| Total assets |
$ | 3,454,679 | $ | 1,314,103 | $ | 2,819,988 | $ | (2,777,422 | ) | $ | 4,811,348 | |||||||||
|
|
|
|
|
|
|
|
|
|
|
|||||||||||
| Liabilities and Shareholders’ Equity |
||||||||||||||||||||
| Current liabilities: |
||||||||||||||||||||
| Current portion of long-term debt |
$ | — | $ | — | $ | 3,586 | $ | — | $ | 3,586 | ||||||||||
| Accounts payable |
— | 5,942 | 22,434 | — | 28,376 | |||||||||||||||
| Accrued expenses and other liabilities |
28,261 | 34,333 | 144,050 | — | 206,644 | |||||||||||||||
| Due to Affiliate, net |
— | 834,342 | 1,918,037 | (2,752,379 | ) | — | ||||||||||||||
| Advance ticket sales |
— | — | 255,432 | — | 255,432 | |||||||||||||||
|
|
|
|
|
|
|
|
|
|
|
|||||||||||
| Total current liabilities |
28,261 | 874,617 | 2,343,539 | (2,752,379 | ) | 494,038 | ||||||||||||||
| Long-term debt |
1,711,023 | — | 843,082 | — | 2,554,105 | |||||||||||||||
| Other long-term liabilities |
10,844 | — | 47,810 | — | 58,654 | |||||||||||||||
|
|
|
|
|
|
|
|
|
|
|
|||||||||||
| Total liabilities |
1,750,128 | 874,617 | 3,234,431 | (2,752,379 | ) | 3,106,797 | ||||||||||||||
|
|
|
|
|
|
|
|
|
|
|
|||||||||||
| Commitments and contingencies |
||||||||||||||||||||
| Shareholders’ equity: |
||||||||||||||||||||
| Ordinary shares |
25 | 24 | 87,818 | (87,842 | ) | 25 | ||||||||||||||
| Additional paid-in capital |
2,328,302 | 379,946 | 227,802 | (607,748 | ) | 2,328,302 | ||||||||||||||
| Accumulated other comprehensive income (loss) |
2,299 | — | (6,151 | ) | 6,151 | 2,299 | ||||||||||||||
| Retained earnings (deficit) |
(626,075 | ) | 59,516 | (723,912 | ) | 664,396 | (626,075 | ) | ||||||||||||
|
|
|
|
|
|
|
|
|
|
|
|||||||||||
| Total shareholders’ equity |
1,704,551 | 439,486 | (414,443 | ) | (25,043 | ) | 1,704,551 | |||||||||||||
|
|
|
|
|
|
|
|
|
|
|
|||||||||||
| Total liabilities and shareholders’ equity |
$ | 3,454,679 | $ | 1,314,103 | $ | 2,819,988 | $ | (2,777,422 | ) | $ | 4,811,348 | |||||||||
|
|
|
|
|
|
|
|
|
|
|
|||||||||||
F-33
Table of Contents
NCL Corporation Ltd.
Condensed Consolidating Statement of Cash Flows
For the Year Ended December 31, 2010
| (in thousands) | Parent | Guarantor Subsidiaries |
Non-Guarantor Subsidiaries |
Eliminations | Consolidated | |||||||||||||||
| Cash flows from operating activities |
||||||||||||||||||||
| Net income |
$ | 22,617 | $ | (239 | ) | $ | 56,351 | $ | (56,112 | ) | $ | 22,617 | ||||||||
| Adjustments to reconcile net income to net cash provided by (used in) operating activities: |
||||||||||||||||||||
| Depreciation and amortization expense |
10,768 | 56,027 | 125,118 | — | 191,913 | |||||||||||||||
| Gain on derivatives |
603 | — | — | — | 603 | |||||||||||||||
| Write-off of deferred financing fees |
1,751 | — | 4,659 | — | 6,410 | |||||||||||||||
| Share-based compensation expense |
— | — | 2,520 | — | 2,520 | |||||||||||||||
| Equity in earnings of subsidiaries |
(56,112 | ) | — | — | 56,112 | — | ||||||||||||||
| Changes in operating assets and liabilities: |
||||||||||||||||||||
| Accounts receivable, net |
(25 | ) | 779 | (765 | ) | — | (11 | ) | ||||||||||||
| Inventories |
— | 1,109 | (5,007 | ) | — | (3,898 | ) | |||||||||||||
| Prepaid expenses and other assets |
(3,849 | ) | 5,192 | 119,493 | — | 120,836 | ||||||||||||||
| Accounts payable |
— | (4,944 | ) | 40,967 | — | 36,023 | ||||||||||||||
| Accrued expenses and other liabilities |
(8,341 | ) | 13,791 | (2,265 | ) | — | 3,185 | |||||||||||||
| Advance ticket sales |
— | — | 38,748 | — | 38,748 | |||||||||||||||
|
|
|
|
|
|
|
|
|
|
|
|||||||||||
| Net cash provided by (used in) operating activities |
(32,588 | ) | 71,715 | 379,819 | — | 418,946 | ||||||||||||||
|
|
|
|
|
|
|
|
|
|
|
|||||||||||
| Cash flows from investing activities |
||||||||||||||||||||
| Additions to property and equipment |
— | (22,404 | ) | (955,062 | ) | — | (977,466 | ) | ||||||||||||
| Changes in restricted cash |
— | — | 8,526 | — | 8,526 | |||||||||||||||
|
|
|
|
|
|
|
|
|
|
|
|||||||||||
| Net cash used in investing activities |
— | (22,404 | ) | (946,536 | ) | — | (968,940 | ) | ||||||||||||
|
|
|
|
|
|
|
|
|
|
|
|||||||||||
| Cash flows from financing activities |
||||||||||||||||||||
| Repayments of long-term debt |
(774,526 | ) | — | (181,254 | ) | — | (955,780 | ) | ||||||||||||
| Proceeds from long-term debt |
689,000 | — | 912,659 | — | 1,601,659 | |||||||||||||||
| Transactions with Affiliate, net |
127,121 | (51,381 | ) | (72,789 | ) | — | 2,951 | |||||||||||||
| Other, primarily deferred financing fees |
(9,007 | ) | — | (84,934 | ) | — | (93,941 | ) | ||||||||||||
|
|
|
|
|
|
|
|
|
|
|
|||||||||||
| Net cash provided by (used in) financing activities |
32,588 | (51,381 | ) | 573,682 | — | 554,889 | ||||||||||||||
|
|
|
|
|
|
|
|
|
|
|
|||||||||||
| Net increase (decrease) in cash and cash equivalents |
— | (2,070 | ) | 6,965 | — | 4,895 | ||||||||||||||
| Cash and cash equivalents at beginning of year |
— | 9,903 | 40,249 | 50,152 | ||||||||||||||||
|
|
|
|
|
|
|
|
|
|
|
|||||||||||
| Cash and cash equivalents at end of year |
$ | — | $ | 7,833 | $ | 47,214 | $ | — | $ | 55,047 | ||||||||||
|
|
|
|
|
|
|
|
|
|
|
|||||||||||
F-34
Table of Contents
NCL Corporation Ltd.
Condensed Consolidating Statement of Cash Flows
For the Year Ended December 31, 2009
| (in thousands) | Parent | Guarantor Subsidiaries |
Non-Guarantor Subsidiaries |
Eliminations | Consolidated | |||||||||||||||
| Cash flows from operating activities |
||||||||||||||||||||
| Net income |
$ | 67,233 | $ | 664 | $ | 72,248 | $ | (72,912 | ) | $ | 67,233 | |||||||||
| Adjustments to reconcile net income to net cash provided by (used in) operating activities: |
||||||||||||||||||||
| Depreciation and amortization expense |
9,456 | 56,831 | 103,414 | — | 169,701 | |||||||||||||||
| Loss on translation of debt |
— | — | 22,677 | — | 22,677 | |||||||||||||||
| Gain on derivatives |
— | — | (35,488 | ) | — | (35,488 | ) | |||||||||||||
| Write-off of deferred financing fees |
6,744 | — | — | — | 6,744 | |||||||||||||||
| Share-based compensation expense |
— | 1,541 | 2,534 | — | 4,075 | |||||||||||||||
| Equity in earnings of subsidiaries |
(72,912 | ) | — | — | 72,912 | — | ||||||||||||||
| Changes in operating assets and liabilities: |
||||||||||||||||||||
| Accounts receivable, net |
(1,289 | ) | (630 | ) | 1,387 | — | (532 | ) | ||||||||||||
| Inventories |
— | (498 | ) | 1,127 | — | 629 | ||||||||||||||
| Prepaid expenses and other assets |
3,917 | 1,659 | (96,181 | ) | — | (90,605 | ) | |||||||||||||
| Accounts payable |
— | 5,271 | (47,307 | ) | — | (42,036 | ) | |||||||||||||
| Accrued expenses and other liabilities |
1,156 | (8,233 | ) | (49,389 | ) | — | (56,466 | ) | ||||||||||||
| Advance ticket sales |
— | — | 4,794 | — | 4,794 | |||||||||||||||
|
|
|
|
|
|
|
|
|
|
|
|||||||||||
| Net cash provided by (used in) operating activities |
14,305 | 56,605 | (20,184 | ) | — | 50,726 | ||||||||||||||
|
|
|
|
|
|
|
|
|
|
|
|||||||||||
| Cash flows from investing activities |
||||||||||||||||||||
| Additions to property and equipment |
— | (11,168 | ) | (150,670 | ) | — | (161,838 | ) | ||||||||||||
| Changes in restricted cash |
— | — | (4,735 | ) | — | (4,735 | ) | |||||||||||||
|
|
|
|
|
|
|
|
|
|
|
|||||||||||
| Net cash used in investing activities |
— | (11,168 | ) | (155,405 | ) | — | (166,573 | ) | ||||||||||||
|
|
|
|
|
|
|
|
|
|
|
|||||||||||
| Cash flows from financing activities |
||||||||||||||||||||
| Repayments of long-term debt |
(1,232,715 | ) | — | (16,349 | ) | — | (1,249,064 | ) | ||||||||||||
| Proceeds from long-term debt |
1,121,021 | — | — | — | 1,121,021 | |||||||||||||||
| Transactions with Affiliate, net |
54,979 | (43,031 | ) | 59,593 | — | 71,541 | ||||||||||||||
| Contribution from Affiliates, net |
100,000 | — | — | — | 100,000 | |||||||||||||||
| Other, primarily deferred financing fees |
(57,945 | ) | — | (5,271 | ) | — | (63,216 | ) | ||||||||||||
|
|
|
|
|
|
|
|
|
|
|
|||||||||||
| Net cash provided by (used in) financing activities |
(14,660 | ) | (43,031 | ) | 37,973 | — | (19,718 | ) | ||||||||||||
|
|
|
|
|
|
|
|
|
|
|
|||||||||||
| Net increase (decrease) in cash and cash equivalents |
(355 | ) | 2,406 | (137,616 | ) | — | (135,565 | ) | ||||||||||||
| Cash and cash equivalents at beginning of year |
355 | 7,497 | 177,865 | 185,717 | ||||||||||||||||
|
|
|
|
|
|
|
|
|
|
|
|||||||||||
| Cash and cash equivalents at end of year |
$ | — | $ | 9,903 | $ | 40,249 | $ | — | $ | 50,152 | ||||||||||
|
|
|
|
|
|
|
|
|
|
|
|||||||||||
F-35
Table of Contents
NCL Corporation Ltd.
Condensed Consolidating Statement of Cash Flows
For the Year Ended December 31, 2008
| (in thousands) | Parent | Guarantor Subsidiaries |
Non-Guarantor Subsidiaries |
Eliminations | Consolidated | |||||||||||||||
| Cash flows from operating activities |
||||||||||||||||||||
| Net loss |
$ | (211,803 | ) | $ | (18,165 | ) | $ | (287,679 | ) | $ | 305,844 | $ | (211,803 | ) | ||||||
| Adjustments to reconcile net loss to net cash provided by (used in) operating activities: |
||||||||||||||||||||
| Depreciation and amortization expense |
— | 56,533 | 106,032 | — | 162,565 | |||||||||||||||
| Impairment loss |
— | — | 128,775 | — | 128,775 | |||||||||||||||
| Gain on translation of debt |
(96,906 | ) | — | (14,558 | ) | — | (111,464 | ) | ||||||||||||
| Loss on derivatives |
— | — | 101,511 | — | 101,511 | |||||||||||||||
| Write-off of deferred financing fees |
6,788 | — | — | — | 6,788 | |||||||||||||||
| Share-based compensation expense |
— | 294 | 571 | — | 865 | |||||||||||||||
| Equity in loss of subsidiaries |
305,844 | — | — | (305,844 | ) | — | ||||||||||||||
| Changes in operating assets and liabilities: |
||||||||||||||||||||
| Accounts receivable, net |
257 | (405 | ) | 2,274 | — | 2,126 | ||||||||||||||
| Inventories |
— | 774 | 11,729 | — | 12,503 | |||||||||||||||
| Prepaid expenses and other assets |
4,346 | (7,153 | ) | (12,516 | ) | — | (15,323 | ) | ||||||||||||
| Accounts payable |
— | (515 | ) | (17,788 | ) | — | (18,303 | ) | ||||||||||||
| Accrued expenses and other liabilities |
(7,485 | ) | 18,720 | (10,608 | ) | — | 627 | |||||||||||||
| Advance ticket sales |
— | — | (82,164 | ) | — | (82,164 | ) | |||||||||||||
|
|
|
|
|
|
|
|
|
|
|
|||||||||||
| Net cash provided by (used in) operating activities |
1,041 | 50,083 | (74,421 | ) | — | (23,297 | ) | |||||||||||||
|
|
|
|
|
|
|
|
|
|
|
|||||||||||
| Cash flows from investing activities |
||||||||||||||||||||
| Additions to property and equipment |
— | (11,046 | ) | (152,561 | ) | — | (163,607 | ) | ||||||||||||
| Changes in restricted cash |
— | — | (2,629 | ) | — | (2,629 | ) | |||||||||||||
|
|
|
|
|
|
|
|
|
|
|
|||||||||||
| Net cash used in investing activities |
— | (11,046 | ) | (155,190 | ) | — | (166,236 | ) | ||||||||||||
|
|
|
|
|
|
|
|
|
|
|
|||||||||||
| Cash flows from financing activities |
||||||||||||||||||||
| Repayments of long-term debt |
(1,428,523 | ) | — | (95,572 | ) | — | (1,524,095 | ) | ||||||||||||
| Proceeds from long-term debt |
1,123,000 | — | — | — | 1,123,000 | |||||||||||||||
| Transactions with Affiliate, net |
(642,555 | ) | (38,794 | ) | 470,082 | — | (211,267 | ) | ||||||||||||
| Contribution from Affiliates, net |
948,111 | — | — | — | 948,111 | |||||||||||||||
| Other |
(719 | ) | — | (71 | ) | — | (790 | ) | ||||||||||||
|
|
|
|
|
|
|
|
|
|
|
|||||||||||
| Net cash provided by (used in) financing activities |
(686 | ) | (38,794 | ) | 374,439 | — | 334,959 | |||||||||||||
|
|
|
|
|
|
|
|
|
|
|
|||||||||||
| Net increase in cash and cash equivalents |
355 | 243 | 144,828 | — | 145,426 | |||||||||||||||
| Cash and cash equivalents at beginning of year |
— | 7,254 | 33,037 | — | 40,291 | |||||||||||||||
|
|
|
|
|
|
|
|
|
|
|
|||||||||||
| Cash and cash equivalents at end of year |
$ | 355 | $ | 7,497 | $ | 177,865 | $ | — | $ | 185,717 | ||||||||||
|
|
|
|
|
|
|
|
|
|
|
|||||||||||
F-36
Table of Contents
12. Norwegian Cruise Line Holdings Ltd. and Reorganization—Pro Forma EPS (Unaudited) and Adjusted Pro Forma EPS (Unaudited)
Norwegian Cruise Line Holdings Ltd. ( Holdings) was incorporated under the laws of Bermuda on February 21, 2011. Holdings has been formed solely for the purpose of reorganizing our corporate structure as described herein. Holdings will not, prior to completion of the reorganization transactions described herein, conduct any activities other than those incidental to its formation and to preparations for its reorganization and the initial public offering (IPO) of its ordinary shares. The closing of the reorganization will occur in connection with the closing of the IPO. In the reorganization, the current shareholders of NCL Corporation Ltd. will exchange their ordinary shares of NCL Corporation Ltd. for ordinary shares of Holdings at an exchange ratio of 1.0 to , and NCL Corporation Ltd.’s outstanding profits interests granted under the Profits Sharing Agreement, including the Ordinary Profits Units, will be exchanged for an economically equivalent number of ordinary shares of Holdings. The share exchange will be considered a nonsubstantive merger. Prior to the closing of the reorganization and IPO, Holdings will have only nominal assets and no liabilities, and upon the closing of the reorganization and IPO, its only assets will be its investment in NCL Corporation Ltd., as its wholly owned direct subsidiary, and cash proceeds of the IPO not otherwise used or contributed to NCL Corporation Ltd.
At the closing of the reorganization and IPO, the shares of Norwegian Cruise Line Holdings Ltd. will consist of 490,000,000 ordinary shares authorized and ordinary shares issued and outstanding with a par value of $.001 per share and 10,000,000 preference shares authorized with a par value of $.001 per share and no preference shares issued or outstanding.
The ordinary shares issued and outstanding will consist of the following on a pro forma basis as adjusted for the reorganization and exchange described above (but not including ordinary shares to be issued pursuant to the IPO):
| December 31, 2010 | ||
| Pro forma |
* | |
| Genting HK, the Apollo Funds and the TPG Viking Funds |
* | |
| Shares exchanged for profits interest |
* | |
|
| ||
| Total shares issued and outstanding |
* | |
|
|
* The pro forma weighted-average shares outstanding, as well as the pro forma earnings (loss) per share, will be calculated based upon the exchange rate determined as a result of the IPO price range.
F-37
Table of Contents
Pro forma Earnings (loss) Per Share
Earnings (loss) per share as reported and on a pro forma basis adjusted for the exchange is as follows:
| Year Ended December 31, | ||||||||||||
| (in thousands, except per share data): | 2010 | 2009 | 2008 | |||||||||
| Net income (loss) |
$ | 22,617 | $ | 67,233 | $ | (211,803 | ) | |||||
|
|
|
|
|
|
|
|||||||
| Weighted-average shares outstanding as reported |
21,100 | 20,756 | 20,000 | |||||||||
| Dilutive effect of time-based profits interests as reported |
236 | 85 | — | |||||||||
|
|
|
|
|
|
|
|||||||
| Dilutive weighted-average shares outstanding as reported |
21,336 | 20,841 | 20,000 | |||||||||
|
|
|
|
|
|
|
|||||||
| Basic earnings (loss) per share as reported |
$ | 1.07 | $ | 3.24 | $ | (10.59 | ) | |||||
|
|
|
|
|
|
|
|||||||
| Dilutive earnings (loss) per share as reported |
$ | 1.06 | $ | 3.23 | $ | (10.59 | ) | |||||
|
|
|
|
|
|
|
|||||||
| Pro forma weighted-average shares outstanding as adjusted |
||||||||||||
| Pro forma dilutive effect for unvested restricted shares as adjusted(1) |
||||||||||||
|
|
|
|
|
|
|
|||||||
| Pro forma dilutive weighted-average shares outstanding as adjusted |
||||||||||||
|
|
|
|
|
|
|
|||||||
| Pro forma basic earnings (loss) per share as adjusted |
$ | $ | $ | |||||||||
|
|
|
|
|
|
|
|||||||
| Pro forma dilutive earnings (loss) per share as adjusted |
$ | $ | $ | |||||||||
|
|
|
|
|
|
|
|||||||
For the year ended December 31, 2008 there were no potentially dilutive shares.
| (1) | Pro forma dilutive effect for unvested restricted shares as adjusted is calculated using the treasury stock method which reflects the unearned compensation as adjusted for shares which could have been repurchased using an average share price. |
Adjusted Pro forma Earnings (loss) Per Share
As a result of the material reduction in earnings per share due to the reorganization described above, adjusted pro forma earnings per share has been included on the statement of operations for the most recent annual and interim period. In addition to the reorganization adjustments as disclosed above, the adjusted pro forma earnings per share has also been adjusted for the assumed reduction in interest expense due to the assumed paydown of debt from the use of proceeds from the offering. We have assumed a reduction in debt of $ , which would result in a reduction in interest expense of $ . Correspondingly, the Company has included shares in the adjusted pro forma earnings per share which represent the incremental number of shares, at the expected offering price, that would be required to pay down the debt described above (which do not include shares to be issued the proceeds of which pay offering expenses).
F-38
Table of Contents
| Unaudited Consolidated Financial Statements of NCL Corporation Ltd. |
||||
| F-40 | ||||
| Consolidated Balance Sheets at June 30, 2011 and December 31, 2010 (unaudited) |
F-41 | |||
| Consolidated Statements of Cash Flows for the Six Months Ended June 30, 2011 and 2010 (unaudited) |
F-42 | |||
| F-43 |
F-39
Table of Contents
Consolidated Statements of Operations
(unaudited, in thousands, except per share data)
| Three Months Ended June 30, |
Six Months Ended June 30, |
|||||||||||||||
| 2011 | 2010 | 2011 | 2010 | |||||||||||||
| Revenue |
||||||||||||||||
| Passenger ticket |
$ | 393,298 | $ | 328,683 | $ | 725,343 | $ | 607,715 | ||||||||
| Onboard and other |
175,288 | 149,232 | 338,753 | 286,702 | ||||||||||||
|
|
|
|
|
|
|
|
|
|||||||||
| Total revenue |
568,586 | 477,915 | 1,064,096 | 894,417 | ||||||||||||
|
|
|
|
|
|
|
|
|
|||||||||
| Cruise operating expense |
||||||||||||||||
| Commissions, transportation and other |
105,376 | 91,676 | 194,990 | 170,502 | ||||||||||||
| Onboard and other |
45,217 | 37,258 | 83,087 | 70,080 | ||||||||||||
| Payroll and related |
74,252 | 64,508 | 144,569 | 126,643 | ||||||||||||
| Fuel |
62,584 | 49,569 | 120,610 | 96,907 | ||||||||||||
| Food |
31,540 | 26,934 | 62,522 | 51,685 | ||||||||||||
| Other |
63,938 | 51,449 | 121,368 | 99,741 | ||||||||||||
|
|
|
|
|
|
|
|
|
|||||||||
| Total cruise operating expense |
382,907 | 321,394 | 727,146 | 615,558 | ||||||||||||
|
|
|
|
|
|
|
|
|
|||||||||
| Other operating expense |
||||||||||||||||
| Marketing, general and administrative |
62,967 | 61,786 | 133,169 | 125,985 | ||||||||||||
| Depreciation and amortization |
46,510 | 38,896 | 92,767 | 76,753 | ||||||||||||
|
|
|
|
|
|
|
|
|
|||||||||
| Total other operating expense |
109,477 | 100,682 | 225,936 | 202,738 | ||||||||||||
|
|
|
|
|
|
|
|
|
|||||||||
| Operating income |
76,202 | 55,839 | 111,014 | 76,121 | ||||||||||||
|
|
|
|
|
|
|
|
|
|||||||||
| Non-operating income (expense) |
||||||||||||||||
| Interest income |
14 | 37 | 24 | 65 | ||||||||||||
| Interest expense, net of capitalized interest |
(46,696 | ) | (37,047 | ) | (94,575 | ) | (72,886 | ) | ||||||||
| Other income (expense) |
(344 | ) | (33,769 | ) | 2,088 | (34,372 | ) | |||||||||
|
|
|
|
|
|
|
|
|
|||||||||
| Total non-operating income (expense) |
(47,026 | ) | (70,779 | ) | (92,463 | ) | (107,193 | ) | ||||||||
|
|
|
|
|
|
|
|
|
|||||||||
| Net income (loss) |
$ | 29,176 | $ | (14,940 | ) | $ | 18,551 | $ | (31,072 | ) | ||||||
|
|
|
|
|
|
|
|
|
|||||||||
| Earnings (loss) per share (Note 1) |
||||||||||||||||
| Basic |
$ | 1.38 | $ | (0.71 | ) | $ | 0.88 | $ | (1.47 | ) | ||||||
|
|
|
|
|
|
|
|
|
|||||||||
| Diluted |
$ | 1.37 | $ | (0.71 | ) | $ | 0.87 | $ | (1.47 | ) | ||||||
|
|
|
|
|
|
|
|
|
|||||||||
| Adjusted pro forma earnings per share (Note 1) |
||||||||||||||||
| Basic |
$ | |||||||||||||||
|
|
|
|||||||||||||||
| Diluted |
$ | |||||||||||||||
|
|
|
|||||||||||||||
The accompanying notes are an integral part of these consolidated financial statements.
F-40
Table of Contents
Consolidated Balance Sheets
(unaudited, in thousands, except share data)
| June 30, |
December 31, | |||||||
| 2011 | 2010 | |||||||
| Assets |
||||||||
| Current assets: |
||||||||
| Cash and cash equivalents |
$ | 60,177 | $ | 55,047 | ||||
| Accounts receivable, net |
9,304 | 7,879 | ||||||
| Inventories |
39,357 | 32,763 | ||||||
| Prepaid expenses and other assets |
58,787 | 33,694 | ||||||
|
|
|
|
|
|||||
| Total current assets |
167,625 | 129,383 | ||||||
| Property and equipment, net |
4,643,864 | 4,639,281 | ||||||
| Goodwill and tradenames |
602,792 | 602,792 | ||||||
| Other long-term assets |
191,828 | 192,057 | ||||||
|
|
|
|
|
|||||
| Total assets |
$ | 5,606,109 | $ | 5,563,513 | ||||
|
|
|
|
|
|||||
| Liabilities and shareholders’ equity |
||||||||
| Current liabilities: |
||||||||
| Current portion of long-term debt |
$ | 132,982 | $ | 78,237 | ||||
| Accounts payable |
63,254 | 64,399 | ||||||
| Accrued expenses and other liabilities |
235,123 | 216,501 | ||||||
| Advance ticket sales |
414,557 | 294,180 | ||||||
|
|
|
|
|
|||||
| Total current liabilities |
845,916 | 653,317 | ||||||
| Long-term debt |
2,939,677 | 3,125,848 | ||||||
| Other long-term liabilities |
51,392 | 52,680 | ||||||
|
|
|
|
|
|||||
| Total liabilities |
3,836,985 | 3,831,845 | ||||||
|
|
|
|
|
|||||
| Commitments and contingencies (Note 4) |
||||||||
| Shareholders’ equity: |
||||||||
| Ordinary shares, $.0012 par value; 40,000,000 shares authorized; 21,000,000 shares issued and outstanding |
25 | 25 | ||||||
| Additional paid-in capital |
2,331,368 | 2,330,792 | ||||||
| Accumulated other comprehensive income |
22,638 | 4,309 | ||||||
| Retained earnings (deficit) |
(584,907 | ) | (603,458 | ) | ||||
|
|
|
|
|
|||||
| Total shareholders’ equity |
1,769,124 | 1,731,668 | ||||||
|
|
|
|
|
|||||
| Total liabilities and shareholders’ equity |
$ | 5,606,109 | $ | 5,563,513 | ||||
|
|
|
|
|
|||||
The accompanying notes are an integral part of these consolidated financial statements.
F-41
Table of Contents
Consolidated Statements of Cash Flows
(unaudited, in thousands)
| Six Months Ended June 30, |
||||||||
| 2011 | 2010 | |||||||
| Cash flows from operating activities |
||||||||
| Net income (loss) |
$ | 18,551 | $ | (31,072 | ) | |||
| Adjustments to reconcile net income (loss) to net cash provided by operating activities: |
||||||||
| Depreciation and amortization expense |
103,808 | 86,238 | ||||||
| Loss (gain) on derivatives |
(4,030 | ) | 2,784 | |||||
| Share-based compensation expense |
601 | 1,260 | ||||||
| Changes in operating assets and liabilities: |
||||||||
| Accounts receivable, net |
(1,425 | ) | (781 | ) | ||||
| Inventories |
(6,594 | ) | (5,988 | ) | ||||
| Prepaid expenses and other assets |
(8,260 | ) | 110,771 | |||||
| Accounts payable |
(1,145 | ) | 19,464 | |||||
| Accrued expenses and other liabilities |
15,447 | 810 | ||||||
| Advance ticket sales |
117,257 | 130,256 | ||||||
|
|
|
|
|
|||||
| Net cash provided by operating activities |
234,210 | 313,742 | ||||||
|
|
|
|
|
|||||
| Cash flows from investing activities |
||||||||
| Additions to property and equipment |
(97,350 | ) | (853,994 | ) | ||||
|
|
|
|
|
|||||
| Net cash used in investing activities |
(97,350 | ) | (853,994 | ) | ||||
|
|
|
|
|
|||||
| Cash flows from financing activities |
||||||||
| Repayments of long-term debt |
(253,791 | ) | (262,433 | ) | ||||
| Proceeds from long-term debt |
122,086 | 873,273 | ||||||
| Other |
(25 | ) | (21,299 | ) | ||||
|
|
|
|
|
|||||
| Net cash used in financing activities |
(131,730 | ) | 589,541 | |||||
|
|
|
|
|
|||||
| Net increase (decrease) in cash and cash equivalents |
5,130 | 49,289 | ||||||
| Cash and cash equivalents at beginning of period |
55,047 | 50,152 | ||||||
|
|
|
|
|
|||||
| Cash and cash equivalents at end of period |
$ | 60,177 | $ | 99,441 | ||||
|
|
|
|
|
|||||
Supplemental disclosures (Note 6)
The accompanying notes are an integral part of these consolidated financial statements.
F-42
Table of Contents
Notes to Consolidated Financial Statements
(unaudited)
References herein to (i) the “Company,” “we,” “our,” and “us” refer to NCL Corporation Ltd. and its subsidiaries, (ii) “Apollo” refers to Apollo Global Management, LLC and the “Apollo Funds” refers to one or more of NCL Investment Limited, NCL Investment II Ltd., AIF VI NCL (AIV), L.P., AIF VI Euro Holdings, L.P., AAA-Guarantor Co-Invest VI, L.P., Apollo Overseas Partners (Delaware) VI, L.P., Apollo Overseas Partners (Delaware 892) VI, L.P., Apollo Overseas Partners VI, L.P. and Apollo Overseas Partners (Germany) VI, L.P., (iii) “TPG Capital” refers to TPG Capital, L.P. and the “TPG Viking Funds” refers to one or more of TPG Viking I, L.P., TPG Viking II, L.P., TPG Viking, L.P., TPG Viking AIV I, L.P., TPG Viking AIV II, L.P., and TPG Viking AIV III, L.P. and/or certain other affiliated investment funds, each an affiliate of TPG Capital, (iv) “Genting HK” refers to Genting Hong Kong Limited and/or its affiliates (formerly Star Cruises Limited and/or its affiliates), and (v) “Affiliate(s)” refers to Genting HK, the Apollo Funds and/or the TPG Viking Funds. References to the “U.S.” are to the United States of America, “dollars” or “$” are to U.S. dollars and “euros” or “€“ are to the official currency of the Eurozone.
| 1. | Summary of Significant Accounting Policies |
Basis of Presentation
The accompanying consolidated financial statements are unaudited and, in our opinion, contain all normal recurring adjustments necessary for a fair statement of the results for the periods presented.
Our operations are seasonal and results for interim periods are not necessarily indicative of the results for the entire fiscal year. Historically, demand for cruises has been strongest during the summer months. The interim consolidated financial statements should be read in conjunction with the audited consolidated financial statements for the year ended December 31, 2010, which are included in our most recently filed Annual Report on Form 20-F.
Reclassification
We reclassified $15.7 million and $30.6 million for the three and six months ended June 30, 2010, respectively, from the line item “payroll and related” to “commissions, transportation and other” in our consolidated statements of operations to conform to the current period presentation. Certain other amounts in the prior period have been reclassified to conform to the current period presentation.
Revenue and Expense Recognition
Revenue and expense includes taxes assessed by governmental authorities that are directly imposed on a revenue-producing transaction between a seller and a customer. The amounts included in revenue on a gross basis were $31.6 million and $26.6 million for the three months ended June 30, 2011 and 2010, respectively, and $60.3 million and $48.5 million for the six months ended June 30, 2011 and 2010, respectively.
Earnings (Loss) Per Share
Basic earnings (loss) per share is computed by dividing net income (loss) by the weighted-average number of shares outstanding during each period. For the three and six months ended June 30, 2011, we had 21,174,584 and 21,170,190 weighted-average shares outstanding, respectively. For the three and six months ended June 30, 2010, we had 21,126,798 and 21,118,557 weighted-average shares outstanding, respectively. For the three and six months ended June 30, 2011, we had 21,354,394 and 21,357,617 diluted weighted-average shares, respectively. For the three and six months ended June 30, 2010, we did not include 167,928 and 172,888 weighted-average shares, respectively, because the effect of including them would have been anti-dilutive.
Norwegian Cruise Line Holdings Ltd. and Reorganization—Pro Forma EPS
Norwegian Cruise Line Holdings Ltd. ( Holdings) was incorporated under the laws of Bermuda on February 21, 2011. Holdings has been formed solely for the purpose of reorganizing our corporate structure as described
F-43
Table of Contents
herein. Holdings will not, prior to completion of the reorganization transactions described herein, conduct any activities other than those incidental to its formation and to preparations for its reorganization and the initial public offering (IPO) of its ordinary shares. The closing of the reorganization will occur in connection with the closing of the IPO. In the reorganization, the current shareholders of NCL Corporation Ltd. will exchange their ordinary shares of NCL Corporation Ltd. for ordinary shares of Holdings at an exchange ratio of 1.0 to , and NCL Corporation Ltd.’s outstanding profits interests granted under the Profits Sharing Agreement, including the Ordinary Profits Units, will be exchanged for an economically equivalent number of ordinary shares of Holdings. The share exchange will be considered a nonsubstantive merger. Prior to the closing of the reorganization and IPO, Holdings will have only nominal assets and no liabilities, and upon the closing of the reorganization and IPO, its only assets will be its investment in NCL Corporation Ltd., as its wholly owned direct subsidiary, and cash proceeds of the IPO not otherwise used or contributed to NCL Corporation Ltd.
At the closing of the reorganization and IPO, the shares of Norwegian Cruise Line Holdings Ltd. will consist of 490,000,000 ordinary shares authorized and ordinary shares issued and outstanding with a par value of $.001 per share and 10,000,000 preference shares authorized with a par value of $.001 per share and no preference shares issued or outstanding.
The ordinary shares issued and outstanding will consist of the following on a pro forma basis as adjusted for the reorganization and exchange described above (but not including ordinary shares to be issued pursuant to the IPO):
| June 30, 2011 |
||||
| Pro forma |
* | |||
| Genting HK, the Apollo Funds and the TPG Viking Funds |
* | |||
| Shares exchanged for profits interest |
* | |||
|
|
|
|||
| Total shares issued and outstanding |
* | |||
|
|
|
|||
* The pro forma weighted-average shares outstanding, as well as the pro forma earnings (loss) per share, will be calculated based upon the exchange rate determined as a result of the IPO price range.
F-44
Table of Contents
Pro forma Earnings (loss) Per Share
Earnings (loss) per share as reported and on a pro forma basis adjusted for the exchange is as follows:
| Three Months Ended June 30, |
Six Months Ended June 30, |
|||||||||||||||
| (in thousands, except per share data): | 2011 | 2010 | 2011 | 2010 | ||||||||||||
| Net income (loss) |
$ | 29,176 | $ | (14.940 | ) | $ | 18,551 | $ | (31,072 | ) | ||||||
|
|
|
|
|
|
|
|
|
|||||||||
| Weighted-average shares outstanding as reported |
21,175 | 21,127 | 21,170 | 21,119 | ||||||||||||
| Dilutive effect of time-based profits interests as reported |
179 | — | 188 | — | ||||||||||||
|
|
|
|
|
|
|
|
|
|||||||||
| Dilutive weighted-average shares outstanding as reported |
21,354 | 21,127 | 21,358 | 21,119 | ||||||||||||
|
|
|
|
|
|
|
|
|
|||||||||
| Basic earnings (loss) per share as reported |
$ | 1.38 | $ | (0.71 | ) | $ | 0.88 | $ | (1.47 | ) | ||||||
|
|
|
|
|
|
|
|
|
|||||||||
| Dilutive earnings (loss) per share as reported |
$ | 1.37 | $ | (0.71 | ) | $ | 0.87 | $ | (1.47 | ) | ||||||
|
|
|
|
|
|
|
|
|
|||||||||
| Pro forma weighted-average shares outstanding as adjusted |
||||||||||||||||
| Pro forma dilutive effect for unvested restricted shares as adjusted(1) |
||||||||||||||||
|
|
|
|
|
|
|
|
|
|||||||||
| Pro forma dilutive weighted-average shares outstanding as adjusted |
||||||||||||||||
|
|
|
|
|
|
|
|
|
|||||||||
| Pro forma basic earnings (loss) per share as adjusted |
$ | $ | $ | $ | ||||||||||||
|
|
|
|
|
|
|
|
|
|||||||||
| Pro forma dilutive earnings (loss) per share as adjusted |
$ | $ | $ | $ | ||||||||||||
|
|
|
|
|
|
|
|
|
|||||||||
For the year ended December 31, 2008 there were no potentially dilutive shares.
| (1) | Pro forma dilutive effect for unvested restricted shares as adjusted is calculated using the treasury stock method which reflects the unearned compensation as adjusted for shares which could have been repurchased using an average share price. |
Adjusted Pro forma Earnings (loss) Per Share
As a result of the material reduction in earnings per share due to the reorganization described above, adjusted pro forma earnings per share has been included on the statement of operations for the most recent annual and interim period. In addition to the reorganization adjustments as disclosed above, the adjusted pro forma earnings per share has also been adjusted for the assumed reduction in interest expense due to the assumed paydown of debt from the use of proceeds from the offering. We have assumed a reduction in debt of $ , which would result in a reduction in interest expense of $ . Correspondingly, the Company has included shares in the adjusted pro forma earnings per share which represent the incremental number of shares, at the expected offering price, that would be required to pay down the debt described above.
| 2. | Fair Value Measurements and Derivatives |
Fair value is defined as the price at which an orderly transaction to sell the asset or to transfer the liability would take place between market participants at the measurement date under current market conditions (that is, an exit price at the measurement date from the perspective of a market participant that holds the asset or owes the liability). The following hierarchy for inputs used in measuring fair value should maximize the use of observable inputs and minimize the use of unobservable inputs by requiring that the most observable inputs be used when available:
| Level 1 | Quoted prices in active markets for identical assets or liabilities that are accessible at the measurement dates. | |
| Level 2 | Significant other observable inputs that are used by market participants in pricing the asset or liability based on market data obtained from independent sources. | |
| Level 3 | Significant unobservable inputs we believe market participants would use in pricing the asset or liability based on the best information available. | |
F-45
Table of Contents
Derivatives
We are exposed to market risk attributable to changes in interest rates, foreign currency exchange rates and fuel prices. We attempt to minimize these risks through a combination of our normal operating and financing activities and through the use of derivatives. We assess whether derivatives used in hedging transactions are “highly effective” in offsetting changes in the cash flow of hedged items. We use regression analysis for this hedge relationship and high effectiveness is achieved when a statistically valid relationship reflects a high degree of offset and correlation between the fair values of the derivative and the hedged item. Cash flows from the derivatives are classified in the same category as the cash flows from the underlying hedged item. The determination of ineffectiveness is based on the amount of dollar offset between the cumulative change in fair value of the derivative and the cumulative change in fair value of the hedged item at the end of the reporting period. If it is determined that a derivative is not highly effective as a hedge then the change in fair value is recognized in earnings. In addition, the ineffective portion of our highly effective hedges is recognized in earnings immediately and reported in other income (expense) in our consolidated statements of operations. There are no amounts excluded from the assessment of hedge effectiveness and there are no credit-risk-related contingent features in our derivative agreements.
We monitor concentrations of credit risk associated with financial and other institutions with which we conduct significant business. Credit risk, including but not limited to counterparty non-performance under derivatives and our revolving credit facility, is not considered significant, as we primarily conduct business with large, well-established financial institutions and insurance companies that we have well-established relationships with and that have credit risks acceptable to us or the credit risk is spread out among a large number of creditors. We do not anticipate non-performance by any of our significant counterparties.
The following table sets forth our derivatives measured at fair value and discloses the balance sheet location (in thousands):
| June 30, 2011 |
December 31, 2010 |
|||||||
| Fuel swaps designated as hedging instruments: |
||||||||
| Prepaid expenses and other assets |
$ | 20,568 | $ | 10,694 | ||||
| Other long-term assets |
912 | 651 | ||||||
| Fuel collars designated as hedging instruments: |
||||||||
| Prepaid expenses and other assets |
3,073 | — | ||||||
| Other long-term assets |
4,264 | — | ||||||
| Fuel options not designated as hedging instruments: |
||||||||
| Accrued expenses and other liabilities |
824 | — | ||||||
| Other long-term liabilities |
1,576 | — | ||||||
| Foreign currency options designated as hedging instruments: |
||||||||
| Other long-term liabilities |
— | 1,105 | ||||||
| Other long-term assets |
6,782 | — | ||||||
These derivatives were categorized as Level 2 in the fair value hierarchy, and we had no derivatives or other financial instruments categorized as Level 1 or Level 3. Fair value of our derivatives is derived using valuation models that utilize the income valuation approach. These valuation models take into account the contract terms, as well as other inputs such as fuel types, fuel curves, exchange rates, creditworthiness of the counterparty and the Company, as well as other data points.
F-46
Table of Contents
Fuel Swaps
As of June 30, 2011 and December 31, 2010, we had fuel swaps maturing through December 31, 2013, which were used to mitigate the financial impact of increases in fuel prices pertaining to approximately 180 thousand metric tons and 249 thousand metric tons, respectively, of our projected fuel purchases.
The changes in fair value of the fuel swaps which were designated as cash flow hedges were as follows (in thousands):
| Three Months Ended June 30, |
Six Months Ended June 30, |
|||||||||||||||
| 2011 | 2010 | 2011 | 2010 | |||||||||||||
| Gain (loss) recognized to other comprehensive income – effective portion |
$ | (6,017 | ) | $ | (15,143 | ) | $ | 8,831 | $ | (13,846 | ) | |||||
| Gain (loss) recognized to other income (expense) – ineffective portion |
(1,678 | ) | (2,537 | ) | 1,304 | (2,228 | ) | |||||||||
|
|
|
|
|
|
|
|
|
|||||||||
| $ | (7,695 | ) | $ | (17,680 | ) | $ | 10,135 | $ | (16,074 | ) | ||||||
|
|
|
|
|
|
|
|
|
|||||||||
Fuel Collars and Options
As of June 30, 2011, we had fuel collars and fuel options maturing through December 31, 2013, which were used to mitigate the financial impact of increases in fuel prices pertaining to approximately 131 thousand metric tons of our projected fuel purchases.
The changes in fair value of the fuel collars which were designated as cash flow hedges were as follows (in thousands):
| Three Months Ended June 30, |
Six Months Ended June 30, |
|||||||||||||||
| 2011 | 2010 | 2011 | 2010 | |||||||||||||
| Gain recognized to other comprehensive income – effective portion |
$ | 2,255 | $ | — | $ | 2,255 | $ | — | ||||||||
| Gain recognized to other income (expense) – ineffective portion |
91 | — | 91 | — | ||||||||||||
|
|
|
|
|
|
|
|
|
|||||||||
| $ | 2,346 | $ | — | $ | 2,346 | $ | — | |||||||||
|
|
|
|
|
|
|
|
|
|||||||||
The changes in fair value of the fuel options which were not designated as hedging instruments were as follows (in thousands):
| Three Months Ended June 30, |
Six Months Ended June 30, |
|||||||||||||||
| 2011 | 2010 | 2011 | 2010 | |||||||||||||
| Gain recognized to other income (expense) |
$ | 2,395 | $ | — | $ | 2,395 | $ | — | ||||||||
|
|
|
|
|
|
|
|
|
|||||||||
Foreign Currency Options
Our exposure to market risk for fluctuations in foreign currency exchange rates relates primarily to ship construction contracts. As of June 30, 2011, we had foreign currency options consisting of call options with deferred premiums to hedge the exposure to foreign currency exchange rate risk related to our ship construction firm commitments denominated in euros. If the spot rate at the date the ships are delivered is less than the strike price under these option contracts we would pay the deferred premium and not exercise the foreign currency options. The notional amount of our foreign currency options was €355.0 million, or $514.8 million based on the euro/U.S dollar exchange rate as of June 30, 2011.
F-47
Table of Contents
The changes in fair value of the foreign currency options which were designated as cash flow hedges were as follows (in thousands):
| Three Months Ended June 30, |
Six Months Ended June 30, |
|||||||||||||||
| 2011 | 2010 | 2011 | 2010 | |||||||||||||
| Gain recognized to other comprehensive income – effective portion |
$ | 4,546 | $ | — | $ | 7,647 | $ | — | ||||||||
| Gain (loss) recognized to other income (expense) – ineffective portion |
(19 | ) | — | 240 | — | |||||||||||
|
|
|
|
|
|
|
|
|
|||||||||
| $ | 4,527 | $ | — | $ | 7,887 | $ | — | |||||||||
|
|
|
|
|
|
|
|
|
|||||||||
Interest Rate Swap
In 2010, we had an interest rate swap which matured in October 2010.
The changes in fair value of the interest rate swap which was not designated as a hedging instrument were as follows (in thousands):
| Three Months Ended June 30, |
Six Months Ended June 30, |
|||||||||||||||
| 2011 | 2010 | 2011 | 2010 | |||||||||||||
| Gain (loss) recognized to other income (expense) |
$ | — | $ | 108 | $ | — | $ | (556 | ) | |||||||
|
|
|
|
|
|
|
|
|
|||||||||
Long-Term Debt
As of June 30, 2011 and December 31, 2010, the fair value of our long-term debt, including the current portion, was $3,192.0 million and $3,263.7 million, respectively, which was $119.3 million and $59.6 million higher, respectively, than the carrying values. The difference between the fair value and carrying value of our long-term debt is due to our fixed and variable rate debt obligations carrying interest rates that are above or below market rates at the measurement dates. The fair value of our long-term debt was calculated based on estimated rates for the same or similar instruments with similar terms and remaining maturities.
Market risk associated with our long-term fixed rate debt is the potential increase in fair value resulting from a decrease in interest rates. Market risk associated with our long-term variable rate debt is the potential increase in interest expense from an increase in interest rates.
Other
The carrying amounts reported in the consolidated balance sheets of all other financial assets and liabilities approximate fair value.
| 3. | Employee Benefit Plan |
The Norwegian Shipboard Retirement Plan (“Shipboard Retirement Plan”) computes benefits based on years of service, subject to certain eligibility requirements. We have recognized pension expense of $0.5 million for each of the three months ended June 30, 2011 and 2010 and $1.0 million for each of the six months ended June 30, 2011 and 2010, in our consolidated statements of operations. Changes in the projected benefit obligation are recognized in accumulated other comprehensive income. We refer you to Note 5 “Comprehensive Income (Loss).”
F-48
Table of Contents
| 4. | Commitments and Contingencies |
Capital Expenditures
Future capital commitments consist of contracted commitments, including ship purchase commitments, and future expected capital expenditures necessary for operations. As of June 30, 2011, anticipated capital expenditures are $191.0 million, $245.5 million and $899.4 million for each of the years ending December 31, 2011, 2012 and 2013, respectively, of which we have export credit financing in place for the expenditures related to ship purchase commitments of $88.4 million, $133.8 million and $701.0 million, respectively, based on the euro/U.S. dollar exchange rate as of June 30, 2011.
We have two ships scheduled for delivery in the second quarter of 2013 and 2014, respectively. The aggregate contract price of the two ships is approximately €1.2 billion, or $1.7 billion based on the euro/U.S. dollar exchange rate as of June 30, 2011.
Capitalized interest for the three and six months ended June 30, 2011, was $5.2 million and $10.1 million, respectively, related to the construction of two ships and for the three and six months ended June 30, 2010, was $4.0 million and $8.6 million, respectively, related to the construction of Norwegian Epic.
Material Litigation
In July 2009, a class action complaint was filed against NCL (Bahamas) Ltd. in the United States District Court, Southern District of Florida, on behalf of a purported class of crew members alleging inappropriate deductions of their wages pursuant to the Seaman’s Wage Act and wrongful termination resulting in a loss of retirement benefits. On December 30, 2010, the Court denied the plaintiffs’ Motion for Class Certification. On February 16,
2011, the plaintiffs filed a Motion for Reconsideration as to the Court’s Order on Class Certification which was denied. The individual plaintiffs’ claims remain and, accordingly, we are vigorously defending this action and are not able at this time to estimate the impact of these proceedings.
In May 2011, a class action complaint was filed against NCL (Bahamas) Ltd. in the United States District Court, Southern District of Florida, on behalf of a purported class of crew members alleging inappropriate deductions of their wages pursuant to the Seaman’s Wage Act and breach of contract. We are vigorously defending this action and are not able at this time to estimate the impact of these proceedings.
In the normal course of our business, various other claims and lawsuits have been filed or are pending against us. Most of these claims and lawsuits are covered by insurance and, accordingly, the maximum amount of our liability is typically limited to our deductible amount. Nonetheless, the ultimate outcome of these claims and lawsuits that are not covered by insurance cannot be determined at this time. We have evaluated our overall exposure with respect to all of our threatened and pending litigation and, to the extent required, we have accrued amounts for all estimable probable losses associated with our deemed exposure. We are currently unable to estimate any other potential contingent losses beyond those accrued, as discovery is not complete nor is adequate information available to estimate such range of loss or potential recovery. We intend to vigorously defend our legal position on all claims and, to the extent necessary, seek recovery.
F-49
Table of Contents
| 5. | Comprehensive Income (Loss) |
Comprehensive income (loss) includes: a) net income (loss), b) changes in the fair value of derivatives that qualify as cash flow hedges, and c) changes in the projected benefit obligation of our Shipboard Retirement Plan. The cumulative changes in fair value of the derivatives are deferred and recorded as a component of accumulated other comprehensive income until the hedged transactions are realized and recognized in earnings. Comprehensive income (loss) was as follows (in thousands):
| Three Months Ended June 30, |
Six Months Ended June 30, |
|||||||||||||||
| 2011 | 2010 | 2011 | 2010 | |||||||||||||
| Net income (loss) |
$ | 29,176 | $ | (14,940 | ) | $ | 18,551 | $ | (31,072 | ) | ||||||
| Change related to our Shipboard Retirement Plan |
94 | 86 | (404 | ) | 174 | |||||||||||
| Change related to cash flow hedges |
784 | (15,143 | ) | 18,733 | (13,846 | ) | ||||||||||
|
|
|
|
|
|
|
|
|
|||||||||
| Total comprehensive income (loss) |
$ | 30,054 | $ | (29,997 | ) | $ | 36,880 | $ | (44,744 | ) | ||||||
|
|
|
|
|
|
|
|
|
|||||||||
| 6. | Supplemental Cash Flow Information |
For the six months ended June 30, 2011 and 2010, we had non-cash operating activities of $18.7 million and $13.8 million, respectively, in connection with cash flow hedges.
| 7. | Guarantor Subsidiaries |
The $450.0 million 11.75% Senior Secured Notes due 2016 issued by us are guaranteed by certain of our subsidiaries with first-priority mortgage liens on four of our ships, Norwegian Star, Norwegian Spirit, Norwegian Sun and Norwegian Dawn, and a first-priority security interest in all earnings, proceeds of insurance and certain other interests related to these ships, subject to certain exceptions and permitted liens. These subsidiary guarantors are 100% owned subsidiaries of NCL Corporation Ltd. and we have fully and unconditionally guaranteed these notes on a joint and several basis.
The following condensed consolidating financial statements for NCL Corporation Ltd., the non-guarantor subsidiaries and combined guarantor subsidiaries presents condensed consolidating statements of operations for
the three and six months ended June 30, 2011 and 2010, condensed consolidating balance sheets as of June 30, 2011 and December 31, 2010, and condensed consolidating statements of cash flows for the six months ended June 30, 2011 and 2010, using the equity method of accounting, as well as elimination entries necessary to consolidate the parent company and all of its subsidiaries.
The outstanding debt resides with the primary obligor. Interest expense was allocated based on the value of the ships, and marketing, general and administrative expense was allocated based on Capacity Days. Management fee represents the charge for the allocation of interest expense to the subsidiaries.
F-50
Table of Contents
Condensed Consolidating Statement of Operations
For the Three Months Ended June 30, 2011
| (unaudited, in thousands) | Parent | Guarantor Subsidiaries |
Non-Guarantor Subsidiaries |
Eliminations | Consolidated | |||||||||||||||
| Revenue |
||||||||||||||||||||
| Passenger ticket |
$ | — | $ | 109,095 | $ | 284,203 | $ | — | $ | 393,298 | ||||||||||
| Onboard and other |
— | 51,798 | 123,490 | — | 175,288 | |||||||||||||||
|
|
|
|
|
|
|
|
|
|
|
|||||||||||
| Total revenue |
— | 160,893 | 407,693 | — | 568,586 | |||||||||||||||
|
|
|
|
|
|
|
|
|
|
|
|||||||||||
| Cruise operating expense |
||||||||||||||||||||
| Commissions, transportation and other |
— | 28,999 | 76,377 | — | 105,376 | |||||||||||||||
| Onboard and other |
— | 14,335 | 30,882 | — | 45,217 | |||||||||||||||
| Payroll and related |
— | 22,834 | 51,418 | — | 74,252 | |||||||||||||||
| Fuel |
— | 23,053 | 39,531 | — | 62,584 | |||||||||||||||
| Food |
— | 9,570 | 21,970 | — | 31,540 | |||||||||||||||
| Other |
— | 22,817 | 41,121 | — | 63,938 | |||||||||||||||
|
|
|
|
|
|
|
|
|
|
|
|||||||||||
| Total cruise operating expense |
— | 121,608 | 261,299 | — | 382,907 | |||||||||||||||
|
|
|
|
|
|
|
|
|
|
|
|||||||||||
| Other operating expense |
||||||||||||||||||||
| Marketing, general and administrative |
— | 23,092 | 39,875 | — | 62,967 | |||||||||||||||
| Depreciation and amortization |
— | 14,067 | 32,443 | — | 46,510 | |||||||||||||||
|
|
|
|
|
|
|
|
|
|
|
|||||||||||
| Total other operating expense |
— | 37,159 | 72,318 | — | 109,477 | |||||||||||||||
|
|
|
|
|
|
|
|
|
|
|
|||||||||||
| Operating income |
— | 2,126 | 74,076 | — | 76,202 | |||||||||||||||
|
|
|
|
|
|
|
|
|
|
|
|||||||||||
| Non-operating income (expense) |
||||||||||||||||||||
| Interest income |
— | — | 14 | — | 14 | |||||||||||||||
| Interest expense, net of capitalized interest |
(30,025 | ) | (8,329 | ) | (38,367 | ) | 30,025 | (46,696 | ) | |||||||||||
| Management fee |
30,025 | — | — | (30,025 | ) | — | ||||||||||||||
| Other income (expense) |
770 | 3 | (1,117 | ) | — | (344 | ) | |||||||||||||
| Equity in earnings (loss) of subsidiaries |
28,406 | — | — | (28,406 | ) | — | ||||||||||||||
|
|
|
|
|
|
|
|
|
|
|
|||||||||||
| Total non-operating income (expense) |
29,176 | (8,326 | ) | (39,470 | ) | (28,406 | ) | (47,026 | ) | |||||||||||
|
|
|
|
|
|
|
|
|
|
|
|||||||||||
| Net income (loss) |
$ | 29,176 | $ | (6,200 | ) | $ | 34,606 | $ | (28,406 | ) | $ | 29,176 | ||||||||
|
|
|
|
|
|
|
|
|
|
|
|||||||||||
F-51
Table of Contents
Condensed Consolidating Statement of Operations
For the Three Months Ended June 30, 2010
| (unaudited, in thousands) | Parent | Guarantor Subsidiaries |
Non-Guarantor Subsidiaries |
Eliminations | Consolidated | |||||||||||||||
| Revenue |
||||||||||||||||||||
| Passenger ticket |
$ | — | $ | 113,401 | $ | 215,282 | $ | — | $ | 328,683 | ||||||||||
| Onboard and other |
— | 51,071 | 98,161 | — | 149,232 | |||||||||||||||
|
|
|
|
|
|
|
|
|
|
|
|||||||||||
| Total revenue |
— | 164,472 | 313,443 | — | 477,915 | |||||||||||||||
|
|
|
|
|
|
|
|
|
|
|
|||||||||||
| Cruise operating expense |
||||||||||||||||||||
| Commissions, transportation and other |
— | 33,499 | 58,177 | — | 91,676 | |||||||||||||||
| Onboard and other |
— | 12,956 | 24,302 | — | 37,258 | |||||||||||||||
| Payroll and related |
— | 21,588 | 42,920 | — | 64,508 | |||||||||||||||
| Fuel |
— | 20,635 | 28,934 | — | 49,569 | |||||||||||||||
| Food |
— | 9,808 | 17,126 | — | 26,934 | |||||||||||||||
| Other |
— | 15,482 | 35,967 | — | 51,449 | |||||||||||||||
|
|
|
|
|
|
|
|
|
|
|
|||||||||||
| Total cruise operating expense |
— | 113,968 | 207,426 | — | 321,394 | |||||||||||||||
|
|
|
|
|
|
|
|
|
|
|
|||||||||||
| Other operating expense |
||||||||||||||||||||
| Marketing, general and administrative |
— | 27,071 | 34,715 | — | 61,786 | |||||||||||||||
| Depreciation and amortization |
— | 13,988 | 24,908 | — | 38,896 | |||||||||||||||
|
|
|
|
|
|
|
|
|
|
|
|||||||||||
| Total other operating expense |
— | 41,059 | 59,623 | — | 100,682 | |||||||||||||||
|
|
|
|
|
|
|
|
|
|
|
|||||||||||
| Operating income |
— | 9,445 | 46,394 | — | 55,839 | |||||||||||||||
|
|
|
|
|
|
|
|
|
|
|
|||||||||||
| Non-operating income (expense) |
||||||||||||||||||||
| Interest income |
— | — | 37 | — | 37 | |||||||||||||||
| Interest expense, net of capitalized interest |
(24,395 | ) | (5,133 | ) | (31,914 | ) | 24,395 | (37,047 | ) | |||||||||||
| Management fee |
24,395 | — | — | (24,395 | ) | — | ||||||||||||||
| Other expense |
(35,450 | ) | 160 | 1,521 | — | (33,769 | ) | |||||||||||||
| Equity in earnings (loss) of subsidiaries |
20,510 | — | — | (20,510 | ) | — | ||||||||||||||
|
|
|
|
|
|
|
|
|
|
|
|||||||||||
| Total non-operating income (expense) |
(14,940 | ) | (4,973 | ) | (30,356 | ) | (20,510 | ) | (70,779 | ) | ||||||||||
|
|
|
|
|
|
|
|
|
|
|
|||||||||||
| Net income (loss) |
$ | (14,940 | ) | $ | 4,472 | $ | 16,038 | $ | (20,510 | ) | $ | (14,940 | ) | |||||||
|
|
|
|
|
|
|
|
|
|
|
|||||||||||
F-52
Table of Contents
Condensed Consolidating Statement of Operations
For the Six Months Ended June 30, 2011
| (unaudited, in thousands) | Parent | Guarantor Subsidiaries |
Non-Guarantor Subsidiaries |
Eliminations | Consolidated | |||||||||||||||
| Revenue |
||||||||||||||||||||
| Passenger ticket |
$ | — | $ | 201,480 | $ | 523,863 | $ | — | $ | 725,343 | ||||||||||
| Onboard and other |
— | 99,207 | 239,546 | — | 338,753 | |||||||||||||||
|
|
|
|
|
|
|
|
|
|
|
|||||||||||
| Total revenue |
— | 300,687 | 763,409 | — | 1,064,096 | |||||||||||||||
|
|
|
|
|
|
|
|
|
|
|
|||||||||||
| Cruise operating expense |
||||||||||||||||||||
| Commissions, transportation and other |
— | 54,082 | 140,908 | — | 194,990 | |||||||||||||||
| Onboard and other |
— | 25,748 | 57,339 | — | 83,087 | |||||||||||||||
| Payroll and related |
— | 44,124 | 100,445 | — | 144,569 | |||||||||||||||
| Fuel |
— | 45,517 | 75,093 | — | 120,610 | |||||||||||||||
| Food |
— | 19,018 | 43,504 | — | 62,522 | |||||||||||||||
| Other |
— | 42,260 | 79,108 | — | 121,368 | |||||||||||||||
|
|
|
|
|
|
|
|
|
|
|
|||||||||||
| Total cruise operating expense |
— | 230,749 | 496,397 | — | 727,146 | |||||||||||||||
|
|
|
|
|
|
|
|
|
|
|
|||||||||||
| Other operating expense |
||||||||||||||||||||
| Marketing, general and administrative |
— | 48,805 | 84,364 | — | 133,169 | |||||||||||||||
| Depreciation and amortization |
— | 27,896 | 64,871 | — | 92,767 | |||||||||||||||
|
|
|
|
|
|
|
|
|
|
|
|||||||||||
| Total other operating expense |
— | 76,701 | 149,235 | — | 225,936 | |||||||||||||||
|
|
|
|
|
|
|
|
|
|
|
|||||||||||
| Operating income |
— | (6,763 | ) | 117,777 | — | 111,014 | ||||||||||||||
|
|
|
|
|
|
|
|
|
|
|
|||||||||||
| Non-operating income (expense) |
||||||||||||||||||||
| Interest income |
— | — | 24 | — | 24 | |||||||||||||||
| Interest expense, net of capitalized interest |
(61,187 | ) | (16,972 | ) | (77,603 | ) | 61,187 | (94,575 | ) | |||||||||||
| Management fee |
61,187 | — | — | (61,187 | ) | — | ||||||||||||||
| Other income (expense) |
3,987 | (60 | ) | (1,839 | ) | — | 2,088 | |||||||||||||
| Equity in earnings (loss) of subsidiaries |
14,564 | — | — | (14,564 | ) | — | ||||||||||||||
|
|
|
|
|
|
|
|
|
|
|
|||||||||||
| Total non-operating income (expense) |
18,551 | (17,032 | ) | (79,418 | ) | (14,564 | ) | (92,463 | ) | |||||||||||
|
|
|
|
|
|
|
|
|
|
|
|||||||||||
| Net income (loss) |
$ | 18,551 | $ | (23,795 | ) | $ | 38,359 | $ | (14,564 | ) | $ | 18,551 | ||||||||
|
|
|
|
|
|
|
|
|
|
|
|||||||||||
F-53
Table of Contents
Condensed Consolidating Statement of Operations
For the Six Months Ended June 30, 2010
| (unaudited, in thousands) | Parent | Guarantor Subsidiaries |
Non-Guarantor Subsidiaries |
Eliminations | Consolidated | |||||||||||||||
| Revenue |
||||||||||||||||||||
| Passenger ticket |
$ | — | $ | 211,911 | $ | 395,804 | $ | — | $ | 607,715 | ||||||||||
| Onboard and other |
— | 98,301 | 188,401 | — | 286,702 | |||||||||||||||
|
|
|
|
|
|
|
|
|
|
|
|||||||||||
| Total revenue |
— | 310,212 | 584,205 | — | 894,417 | |||||||||||||||
|
|
|
|
|
|
|
|
|
|
|
|||||||||||
| Cruise operating expense |
||||||||||||||||||||
| Commissions, transportation and other |
— | 62,408 | 108,094 | — | 170,502 | |||||||||||||||
| Onboard and other |
— | 24,821 | 45,259 | — | 70,080 | |||||||||||||||
| Payroll and related |
— | 43,246 | 83,397 | — | 126,643 | |||||||||||||||
| Fuel |
— | 40,267 | 56,640 | — | 96,907 | |||||||||||||||
| Food |
— | 18,694 | 32,991 | — | 51,685 | |||||||||||||||
| Other |
— | 34,684 | 65,057 | — | 99,741 | |||||||||||||||
|
|
|
|
|
|
|
|
|
|
|
|||||||||||
| Total cruise operating expense |
— | 224,120 | 391,438 | — | 615,558 | |||||||||||||||
|
|
|
|
|
|
|
|
|
|
|
|||||||||||
| Other operating expense |
||||||||||||||||||||
| Marketing, general and administrative |
— | 53,889 | 72,096 | — | 125,985 | |||||||||||||||
| Depreciation and amortization |
— | 28,009 | 48,744 | — | 76,753 | |||||||||||||||
|
|
|
|
|
|
|
|
|
|
|
|||||||||||
| Total other operating expense |
— | 81,898 | 120,840 | — | 202,738 | |||||||||||||||
|
|
|
|
|
|
|
|
|
|
|
|||||||||||
| Operating income |
— | 4,194 | 71,927 | — | 76,121 | |||||||||||||||
|
|
|
|
|
|
|
|
|
|
|
|||||||||||
| Non-operating income (expense) |
||||||||||||||||||||
| Interest income |
— | — | 65 | — | 65 | |||||||||||||||
| Interest expense, net of capitalized interest |
(48,461 | ) | (13,442 | ) | (59,444 | ) | 48,461 | (72,886 | ) | |||||||||||
| Management fee |
48,461 | — | — | (48,461 | ) | — | ||||||||||||||
| Other income (expense) |
(35,783 | ) | — | 1,411 | — | (34,372 | ) | |||||||||||||
| Equity in earnings (loss) of subsidiaries |
4,711 | — | — | (4,711 | ) | — | ||||||||||||||
|
|
|
|
|
|
|
|
|
|
|
|||||||||||
| Total non-operating income (expense) |
(31,072 | ) | (13,442 | ) | (57,968 | ) | (4,711 | ) | (107,193 | ) | ||||||||||
|
|
|
|
|
|
|
|
|
|
|
|||||||||||
| Net income (loss) |
$ | (31,072 | ) | $ | (9,248 | ) | $ | 13,959 | $ | (4,711 | ) | $ | (31,072 | ) | ||||||
|
|
|
|
|
|
|
|
|
|
|
|||||||||||
F-54
Table of Contents
Condensed Consolidating Balance Sheet
As of June 30, 2011
| (unaudited, in thousands) | Parent | Guarantor Subsidiaries |
Non-Guarantor Subsidiaries |
Eliminations | Consolidated | |||||||||||||||
| Assets |
||||||||||||||||||||
| Current assets: |
||||||||||||||||||||
| Cash and cash equivalents |
$ | — | $ | 6,476 | $ | 53,701 | $ | — | $ | 60,177 | ||||||||||
| Accounts receivable, net |
— | 976 | 8,328 | — | 9,304 | |||||||||||||||
| Due from Affiliate, net |
2,487,476 | — | — | (2,487,476 | ) | — | ||||||||||||||
| Inventories |
— | 12,293 | 27,064 | — | 39,357 | |||||||||||||||
| Prepaid expenses and other assets |
27,200 | 8,111 | 23,476 | — | 58,787 | |||||||||||||||
|
|
|
|
|
|
|
|
|
|
|
|||||||||||
| Total current assets |
2,514,676 | 27,856 | 112,569 | (2,487,476 | ) | 167,625 | ||||||||||||||
| Property and equipment, net |
— | 1,240,493 | 3,403,371 | — | 4,643,864 | |||||||||||||||
| Goodwill and tradenames |
602,792 | — | — | — | 602,792 | |||||||||||||||
| Other long-term assets |
73,107 | 142 | 118,579 | — | 191,828 | |||||||||||||||
| Investment in subsidiaries |
98,746 | — | — | (98,746 | ) | — | ||||||||||||||
|
|
|
|
|
|
|
|
|
|
|
|||||||||||
| Total assets |
$ | 3,289,321 | $ | 1,268,491 | $ | 3,634,519 | $ | (2,586,222 | ) | $ | 5,606,109 | |||||||||
|
|
|
|
|
|
|
|
|
|
|
|||||||||||
| Liabilities and shareholders’ equity |
||||||||||||||||||||
| Current liabilities: |
||||||||||||||||||||
| Current portion of long-term debt |
$ | 19,257 | $ | — | $ | 113,725 | $ | — | $ | 132,982 | ||||||||||
| Accounts payable |
— | 483 | 62,771 | — | 63,254 | |||||||||||||||
| Accrued expenses and other liabilities |
25,102 | 55,211 | 154,810 | — | 235,123 | |||||||||||||||
| Due to Affiliate, net |
— | 795,012 | 1,692,464 | (2,487,476 | ) | — | ||||||||||||||
| Advance ticket sales |
— | — | 414,557 | — | 414,557 | |||||||||||||||
|
|
|
|
|
|
|
|
|
|
|
|||||||||||
| Total current liabilities |
44,359 | 850,706 | 2,438,327 | (2,487,476 | ) | 845,916 | ||||||||||||||
| Long-term debt |
1,467,034 | — | 1,472,643 | — | 2,939,677 | |||||||||||||||
| Other long-term liabilities |
8,804 | 2,333 | 40,255 | — | 51,392 | |||||||||||||||
|
|
|
|
|
|
|
|
|
|
|
|||||||||||
| Total liabilities |
1,520,197 | 853,039 | 3,951,225 | (2,487,476 | ) | 3,836,985 | ||||||||||||||
|
|
|
|
|
|
|
|
|
|
|
|||||||||||
| Commitments and contingencies |
||||||||||||||||||||
| Shareholders’ equity: |
||||||||||||||||||||
| Ordinary shares |
25 | 24 | 87,818 | (87,842 | ) | 25 | ||||||||||||||
| Additional paid-in capital |
2,331,368 | 379,946 | 230,884 | (610,830 | ) | 2,331,368 | ||||||||||||||
| Accumulated other comprehensive income (loss) |
22,638 | — | (6,206 | ) | 6,206 | 22,638 | ||||||||||||||
| Retained earnings (deficit) |
(584,907 | ) | 35,482 | (629,202 | ) | 593,720 | (584,907 | ) | ||||||||||||
|
|
|
|
|
|
|
|
|
|
|
|||||||||||
| Total shareholders’ equity |
1,769,124 | 415,452 | (316,706 | ) | (98,746 | ) | 1,769,124 | |||||||||||||
|
|
|
|
|
|
|
|
|
|
|
|||||||||||
| Total liabilities and shareholders’ equity |
$ | 3,289,321 | $ | 1,268,491 | $ | 3,634,519 | $ | (2,586,222 | ) | $ | 5,606,109 | |||||||||
|
|
|
|
|
|
|
|
|
|
|
|||||||||||
F-55
Table of Contents
Condensed Consolidating Balance Sheet
As of December 31, 2010
| (unaudited, in thousands) | Parent | Guarantor Subsidiaries |
Non-Guarantor Subsidiaries |
Eliminations | Consolidated | |||||||||||||||
| Assets |
||||||||||||||||||||
| Current assets: |
||||||||||||||||||||
| Cash and cash equivalents |
$ | — | $ | 7,833 | $ | 47,214 | $ | — | $ | 55,047 | ||||||||||
| Accounts receivable, net |
1,314 | 403 | 6,162 | — | 7,879 | |||||||||||||||
| Due from Affiliate, net |
2,625,297 | — | — | (2,625,297 | ) | — | ||||||||||||||
| Inventories |
— | 11,116 | 21,647 | — | 32,763 | |||||||||||||||
| Prepaid expenses and other assets |
10,943 | 4,741 | 18,010 | — | 33,694 | |||||||||||||||
|
|
|
|
|
|
|
|
|
|
|
|||||||||||
| Total current assets |
2,637,554 | 24,093 | 93,033 | (2,625,297 | ) | 129,383 | ||||||||||||||
| Property and equipment, net |
— | 1,247,212 | 3,392,069 | — | 4,639,281 | |||||||||||||||
| Goodwill and tradenames |
602,792 | — | — | — | 602,792 | |||||||||||||||
| Other long-term assets |
65,981 | 25 | 126,051 | — | 192,057 | |||||||||||||||
| Investment in subsidiaries |
83,985 | — | — | (83,985 | ) | — | ||||||||||||||
|
|
|
|
|
|
|
|
|
|
|
|||||||||||
| Total assets |
$ | 3,390,312 | $ | 1,271,330 | $ | 3,611,153 | $ | (2,709,282 | ) | $ | 5,563,513 | |||||||||
|
|
|
|
|
|
|
|
|
|
|
|||||||||||
| Liabilities and shareholders’ equity |
||||||||||||||||||||
| Current liabilities: |
||||||||||||||||||||
| Current portion of long-term debt |
$ | — | $ | — | $ | 78,237 | $ | — | $ | 78,237 | ||||||||||
| Accounts payable |
— | 998 | 63,401 | — | 64,399 | |||||||||||||||
| Accrued expenses and other liabilities |
24,298 | 46,086 | 146,117 | — | 216,501 | |||||||||||||||
| Due to Affiliate, net |
— | 782,961 | 1,842,336 | (2,625,297 | ) | — | ||||||||||||||
| Advance ticket sales |
— | — | 294,180 | — | 294,180 | |||||||||||||||
|
|
|
|
|
|
|
|
|
|
|
|||||||||||
| Total current liabilities |
24,298 | 830,045 | 2,424,271 | (2,625,297 | ) | 653,317 | ||||||||||||||
| Long-term debt |
1,626,012 | — | 1,499,836 | — | 3,125,848 | |||||||||||||||
| Other long-term liabilities |
8,334 | 2,038 | 42,308 | — | 52,680 | |||||||||||||||
|
|
|
|
|
|
|
|
|
|
|
|||||||||||
| Total liabilities |
1,658,644 | 832,083 | 3,966,415 | (2,625,297 | ) | 3,831,845 | ||||||||||||||
|
|
|
|
|
|
|
|
|
|
|
|||||||||||
| Commitments and contingencies |
||||||||||||||||||||
| Shareholders’ equity: |
||||||||||||||||||||
| Ordinary shares |
25 | 24 | 87,818 | (87,842 | ) | 25 | ||||||||||||||
| Additional paid-in capital |
2,330,792 | 379,946 | 230,283 | (610,229 | ) | 2,330,792 | ||||||||||||||
| Accumulated other comprehensive income (loss) |
4,309 | — | (5,802 | ) | 5,802 | 4,309 | ||||||||||||||
| Retained earnings (deficit) |
(603,458 | ) | 59,277 | (667,561 | ) | 608,284 | (603,458 | ) | ||||||||||||
|
|
|
|
|
|
|
|
|
|
|
|||||||||||
| Total shareholders’ equity |
1,731,668 | 439,247 | (355,262 | ) | (83,985 | ) | 1,731,668 | |||||||||||||
|
|
|
|
|
|
|
|
|
|
|
|||||||||||
| Total liabilities and shareholders’ equity |
$ | 3,390,312 | $ | 1,271,330 | $ | 3,611,153 | $ | (2,709,282 | ) | $ | 5,563,513 | |||||||||
|
|
|
|
|
|
|
|
|
|
|
|||||||||||
F-56
Table of Contents
Condensed Consolidating Statement of Cash Flows
For the Six Months Ended June 30, 2011
| (unaudited, in thousands) | Parent | Guarantor Subsidiaries |
Non-Guarantor Subsidiaries |
Eliminations | Consolidated | |||||||||||||||
| Cash flows from operating activities |
||||||||||||||||||||
| Net income (loss) |
$ | 18,551 | $ | (23,795 | ) | $ | 38,359 | $ | (14,564 | ) | $ | 18,551 | ||||||||
| Adjustments to reconcile net income (loss) to net cash provided by operating activities: |
||||||||||||||||||||
| Depreciation and amortization expense |
5,650 | 27,896 | 70,262 | — | 103,808 | |||||||||||||||
| Gain on derivatives |
(4,030 | ) | — | — | — | (4,030 | ) | |||||||||||||
| Share-based compensation expense |
— | — | 601 | — | 601 | |||||||||||||||
| Equity in earnings of subsidiaries |
(14,564 | ) | — | — | 14,564 | — | ||||||||||||||
| Changes in operating assets and liabilities: |
||||||||||||||||||||
| Accounts receivable, net |
1,314 | (573 | ) | (2,166 | ) | — | (1,425 | ) | ||||||||||||
| Inventories |
— | (1,177 | ) | (5,417 | ) | — | (6,594 | ) | ||||||||||||
| Prepaid expenses and other assets |
(4,697 | ) | (3,487 | ) | (76 | ) | — | (8,260 | ) | |||||||||||
| Accounts payable |
— | (515 | ) | (630 | ) | — | (1,145 | ) | ||||||||||||
| Accrued expenses and other liabilities |
(20 | ) | 9,420 | 6,047 | — | 15,447 | ||||||||||||||
| Due from (to) Affiliate, net |
137,821 | 12,051 | (149,872 | ) | — | — | ||||||||||||||
| Advance ticket sales |
— | — | 117,257 | — | 117,257 | |||||||||||||||
|
|
|
|
|
|
|
|
|
|
|
|||||||||||
| Net cash provided by operating activities |
140,025 | 19,820 | 74,365 | — | 234,210 | |||||||||||||||
|
|
|
|
|
|
|
|
|
|
|
|||||||||||
| Cash flows from investing activities |
||||||||||||||||||||
| Additions to property and equipment |
— | (21,177 | ) | (76,173 | ) | — | (97,350 | ) | ||||||||||||
|
|
|
|
|
|
|
|
|
|
|
|||||||||||
| Net cash used in investing activities |
— | (21,177 | ) | (76,173 | ) | — | (97,350 | ) | ||||||||||||
|
|
|
|
|
|
|
|
|
|
|
|||||||||||
| Cash flows from financing activities |
||||||||||||||||||||
| Repayments of long-term debt |
(215,000 | ) | — | (38,791 | ) | — | (253,791 | ) | ||||||||||||
| Proceeds from long-term debt |
75,000 | — | 47,086 | — | 122,086 | |||||||||||||||
| Other |
(25 | ) | — | — | — | (25 | ) | |||||||||||||
|
|
|
|
|
|
|
|
|
|
|
|||||||||||
| Net cash provided by (used in) financing activities |
(140,025 | ) | — | 8,295 | — | (131,730 | ) | |||||||||||||
|
|
|
|
|
|
|
|
|
|
|
|||||||||||
| Net increase (decrease) in cash and cash equivalents |
— | (1,357 | ) | 6,487 | — | 5,130 | ||||||||||||||
| Cash and cash equivalents at beginning of period |
— | 7,833 | 47,214 | — | 55,047 | |||||||||||||||
|
|
|
|
|
|
|
|
|
|
|
|||||||||||
| Cash and cash equivalents at end of period |
$ | — | $ | 6,476 | $ | 53,701 | $ | — | $ | 60,177 | ||||||||||
|
|
|
|
|
|
|
|
|
|
|
|||||||||||
F-57
Table of Contents
Condensed Consolidating Statement of Cash Flows
For the Six Months Ended June 30, 2010
| (unaudited, in thousands) | Parent | Guarantor Subsidiaries |
Non-Guarantor Subsidiaries |
Eliminations | Consolidated | |||||||||||||||
| Cash flows from operating activities |
||||||||||||||||||||
| Net income (loss) |
$ | (31,072 | ) | $ | (9,248 | ) | $ | 13,959 | $ | (4,711 | ) | $ | (31,072 | ) | ||||||
| Adjustments to reconcile net income (loss) to net cash provided by operating activities: |
||||||||||||||||||||
| Depreciation and amortization expense |
5,034 | 28,009 | 53,195 | — | 86,238 | |||||||||||||||
| Loss on derivatives |
2,784 | — | — | — | 2,784 | |||||||||||||||
| Share-based compensation expense |
— | — | 1,260 | — | 1,260 | |||||||||||||||
| Equity in (earnings) loss of subsidiaries |
(4,711 | ) | — | — | 4,711 | — | ||||||||||||||
| Changes in operating assets and liabilities: |
||||||||||||||||||||
| Accounts receivable, net |
1,061 | 217 | (2,059 | ) | — | (781 | ) | |||||||||||||
| Inventories |
— | 513 | (6,501 | ) | — | (5,988 | ) | |||||||||||||
| Prepaid expenses and other assets |
(2,710 | ) | 3,509 | 109,972 | — | 110,771 | ||||||||||||||
| Accounts payable |
— | 7,048 | 12,416 | — | 19,464 | |||||||||||||||
| Accrued expenses and other liabilities |
(6,893 | ) | 8,319 | (616 | ) | — | 810 | |||||||||||||
| Due from (to) Affiliate, net |
237,950 | (26,730 | ) | (211,220 | ) | — | — | |||||||||||||
| Advance ticket sales |
— | — | 130,256 | — | 130,256 | |||||||||||||||
|
|
|
|
|
|
|
|
|
|
|
|||||||||||
| Net cash provided by operating activities |
201,443 | 11,637 | 100,662 | — | 313,742 | |||||||||||||||
|
|
|
|
|
|
|
|
|
|
|
|||||||||||
| Cash flows from investing activities |
||||||||||||||||||||
| Additions to property and equipment |
— | (14,006 | ) | (839,988 | ) | — | (853,994 | ) | ||||||||||||
|
|
|
|
|
|
|
|
|
|
|
|||||||||||
| Net cash used in investing activities |
— | (14,006 | ) | (839,988 | ) | — | (853,994 | ) | ||||||||||||
|
|
|
|
|
|
|
|
|
|
|
|||||||||||
| Cash flows from financing activities |
||||||||||||||||||||
| Repayments of long-term debt |
(260,300 | ) | — | (2,133 | ) | — | (262,433 | ) | ||||||||||||
| Proceeds from long-term debt |
60,248 | — | 813,025 | — | 873,273 | |||||||||||||||
| Other |
(1,391 | ) | — | (19,908 | ) | — | (21,299 | ) | ||||||||||||
|
|
|
|
|
|
|
|
|
|
|
|||||||||||
| Net cash provided by (used in) financing activities |
(201,443 | ) | — | 790,984 | — | 589,541 | ||||||||||||||
|
|
|
|
|
|
|
|
|
|
|
|||||||||||
| Net increase (decrease) in cash and cash equivalents |
— | (2,369 | ) | 51,658 | — | 49,289 | ||||||||||||||
| Cash and cash equivalents at beginning of period |
— | 9,903 | 40,249 | — | 50,152 | |||||||||||||||
|
|
|
|
|
|
|
|
|
|
|
|||||||||||
| Cash and cash equivalents at end of period |
$ | — | $ | 7,534 | $ | 91,907 | $ | — | $ | 99,441 | ||||||||||
|
|
|
|
|
|
|
|
|
|
|
|||||||||||
8. Proposed Initial Public Offering
We intend to use the net proceeds that we receive to (i) redeem up to $157.5 million in aggregate principal amount of our $450.0 million senior secured notes, (ii) redeem up to $87.5 million in aggregate principal amount of our $250.0 million senior notes, (iii) pay redemption premiums of up to $26.8 million for the senior secured notes and the senior notes, (iv) prepay a portion of the amount outstanding under our $750.0 million senior secured revolving credit facility and (v) pay expenses associated with this offering.
F-58
Table of Contents
The foregoing represents our current intentions with respect to the use of the net proceeds of this offering based upon our present plans and business conditions and no specific allocation of the net proceeds has yet been determined. Our determination of whether to use all or a portion of the net proceeds to redeem a portion of our $450.0 million senior secured notes and/or our $250.0 million senior notes or to repay a portion of the amount outstanding under our $750.0 million senior secured revolving credit facility will depend on interest rates and the prices at which our $450.0 million senior secured notes and $250.0 million senior notes are being purchased and sold in the market (including relative to the redemption price for such notes) at or following the consummation of this offering. Furthermore, there is no assurance regarding the timing of an initial public offering or whether it will be completed. If an initial public offering is postponed or not completed there will not be a material impact on our financial condition and the amounts outstanding with respect to the senior secured notes, the senior notes and the senior secured revolving credit facility would remain outstanding rather than be repaid with the proceeds of the initial public offering. The terms of the agreements governing such debt do not require us to complete the initial public offering.
F-59
Table of Contents
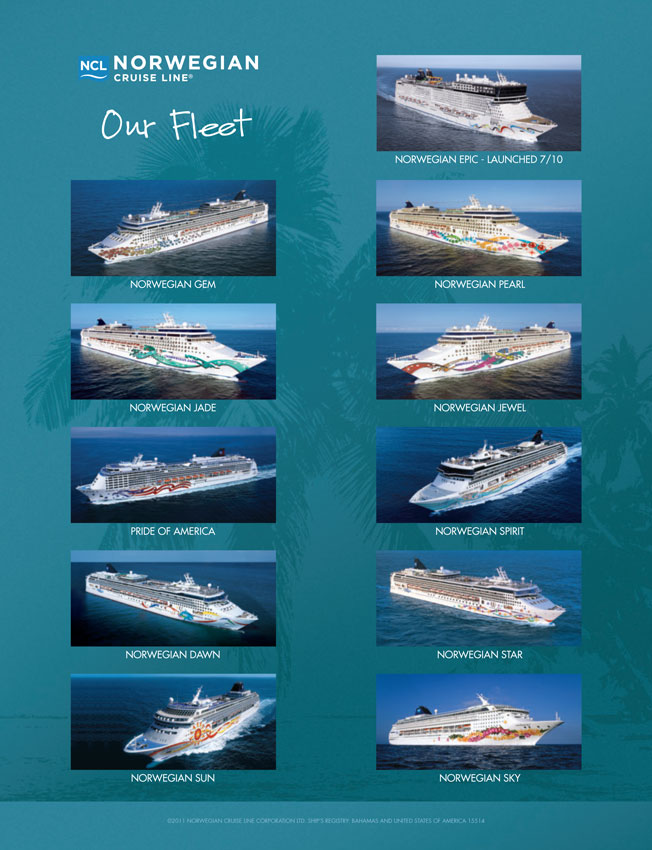
Table of Contents
Dealer Prospectus Delivery Obligation
Until , 2011, all dealers that effect transactions in these securities, whether or not participating in this offering, may be required to deliver a prospectus. This is in addition to the dealers’ obligations to deliver a prospectus when acting as underwriters and with respect to unsold allotments or subscriptions.
NORWEGIAN CRUISE LINE HOLDINGS LTD.
| UBS Investment Bank | Barclays Capital |
Goldman, Sachs & Co.
Table of Contents
Part II
INFORMATION NOT REQUIRED IN PROSPECTUS
| Item 13. | Expenses of Issuance and Distribution |
The following table sets forth the costs and expenses, other than underwriting discounts and commissions, payable by us in connection with the issuance and distribution of the securities being registered. All amounts are estimates, except the SEC registration fee.
| SEC registration fee |
$ | 29,025 | ||
| NASDAQ listing fee |
$ | 225,000 | ||
| Transfer agent and registrar fees and expenses |
* | |||
| Printing and engraving fees and expenses |
* | |||
| Legal and accounting fees and expenses |
* | |||
| Financial Industry Regulatory Authority, Inc. filing fee |
$ | 75,000 | ||
| Miscellaneous expenses |
* | |||
|
|
|
|||
| Total |
* | |||
|
|
|
| * | To be completed by amendment. |
| Item 14. | Indemnification of directors and officers |
The Companies Act 1981 of Bermuda requires every officer, including directors, of a company in exercising powers and discharging duties, to act honestly in good faith with a view to the best interests of the company, and to exercise the care, diligence and skill that a reasonably prudent person would exercise in comparable circumstances. The Companies Act provides that a Bermuda company may indemnify its directors in respect of any loss arising or liability attaching to them as a result of any negligence, default, breach of duty or breach of trust of which they may be guilty. However, the Companies Act further provides that any provision, whether in the bye-laws of a company or in any contract between the company and any officer or any person employed by the company as auditor, exempting such officer or person from, or indemnifying him against, any liability which by virtue of any rule of law would otherwise attach to him, in respect of any fraud or dishonesty of which he may be guilty in relation to the company shall be void.
We have adopted provisions in our bye-laws that, subject to certain exemptions and conditions, require us to indemnify to the full extent permitted by the Companies Act in the event each person who is involved in legal proceedings by reason of the fact that person is or was a Director, Officer or Resident Representative of the Company, or is or was serving at the request of the Company as a Director, Officer, Resident Representative, employee or agent of another company or of a partnership, joint venture, trust or other enterprise, including service with respect to an employee benefit plan against all expense, liability and loss (including attorneys’ fees, judgments, fines, amounts paid or to be paid in settlement, and excise taxes or penalties arising under the Employee Retirement Income Security Act of 1974) incurred and suffered by the person in connection therewith. We are also required under our bye-laws to advance to such persons expenses incurred in defending a proceeding to which indemnification might apply, provided if the Companies Act requires, the recipient provides an undertaking agreeing to repay all such advanced amounts if it is ultimately determined that he is not entitled to be indemnified. In addition, the bye-laws specifically provide that the indemnification rights granted thereunder are non-exclusive.
In addition, we intend to enter into separate contractual indemnification arrangements with our directors. These arrangements provide for indemnification and the advancement of expenses to these directors in circumstance and subject to limitations substantially similar to those described above. Section 98A of the Companies Act and our bye-laws permit us to purchase and maintain insurance for the benefit of any officer or director in respect of any loss or liability attaching to him in respect of any negligence, default, breach of duty or breach of trust, whether or not we may otherwise indemnify such officer or director.
II-1
Table of Contents
The underwriting agreement filed as an exhibit to this Registration Statement contains provisions regarding the indemnification of the Company’s directors and officers against certain liabilities under the Securities Act of 1933, as amended, and regarding contribution with respect to payments that the underwriters, dealers or agents or their controlling persons may be required to make in respect of those liabilities.
| Item 15. | Recent sales of unregistered securities |
In the past three years, we have not sold securities without registration under the Securities Act, except as described below.
On January 7, 2008, NCL Corporation Ltd. issued 10,000,000 ordinary shares, par value $.0012 per share, to the Apollo Funds for an investment of $1.0 billion. The issuance of these securities was effected without registration under the Securities Act in reliance on the exemption from registration provided under Section 4(2) promulgated thereunder.
On April 7, 2009, NCL Corporation Ltd. issued 1,000,000 ordinary shares, par value $.0012 per share, to our then existing shareholders pro-rata in accordance with their then existing percentages of ownership for an aggregate investment of $100.0 million. The issuance of these securities was effected without registration under the Securities Act in reliance on the exemption from registration provided under Section 4(2) promulgated thereunder.
In connection with the consummation of this offering, we will be reorganized by creating a new holding company structure (the “Corporate Reorganization”). The Issuer will become our new parent company, and NCL Corporation Ltd. will become its wholly owned direct subsidiary. As part of the Corporate Reorganization, (i) NCL Corporation Ltd.’s outstanding ordinary shares will be exchanged for ordinary shares of the Issuer and (ii) we will issue an economically equivalent number of our ordinary shares of the Issuer, at an exchange formula based on the initial public offering price in this offering, in exchange for NCL Corporation Ltd.’s outstanding profits interests granted under the Profits Sharing Agreement, including the Ordinary Profits Units described under the heading in “Compensation Discussion & Analysis” in the prospectus included in the Registration Statement. The issuance of these securities will be effected without registration under the Securities Act in reliance on the exemption from registration provided under Section 4(2) promulgated thereunder.
| Item 16. | Exhibits and financial statement schedules |
| (a) | See Exhibit Index. |
| (b) | Financial statement schedules are not submitted because they are not applicable or because the required information is included in the consolidated financial statements or the notes thereto. |
| Item 17. | Undertakings |
The undersigned registrant hereby undertakes to provide to the underwriters at the closing specified in the underwriting agreement certificates in such denominations and registered in such names as required by the underwriters to permit prompt delivery to each purchaser.
Insofar as indemnification for liabilities arising under the Securities Act may be permitted to directors, officers and controlling persons of the registrant pursuant to the foregoing provisions, or otherwise, the registrant has been advised that in the opinion of the Securities and Exchange Commission such indemnification is against public policy as expressed in the Securities Act, and is, therefore, unenforceable. In the event that a claim for indemnification against such liabilities (other than the payment by the registrant of expenses incurred or paid by a director, officer or controlling person of the registrant in the successful defense of any action, suit or proceeding) is asserted by such director, officer or controlling person in connection with the securities being
II-2
Table of Contents
registered, the registrant will, unless in the opinion of its counsel the matter has been settled by controlling precedent, submit to a court of appropriate jurisdiction the question of whether such indemnification is against public policy as expressed in the Securities Act and will be governed by the final adjudication of such issue. The undersigned registrant hereby undertakes that:
| (i) | for purposes of determining any liability under the Securities Act, the information omitted from the form of prospectus filed as part of this registration statement in reliance upon Rule 430A and contained in a form of prospectus filed by the registrant pursuant to Rule 424(b)(1) or (4) or 497(h) under the Securities Act shall be deemed to be part of this registration statement as of the time it was declared effective; and |
| (ii) | for the purpose of determining any liability under the Securities Act, each post-effective amendment that contains a form of prospectus shall be deemed to be a new registration statement relating to the securities offered therein, and the offering of such securities at that time shall be deemed to be the initial bona fide offering thereof. |
II-3
Table of Contents
SIGNATURES
Pursuant to the requirements of the Securities Act of 1933, as amended, the registrant has duly caused this Registration Statement to be signed on its behalf by the undersigned, thereunto duly authorized, in Miami, Florida, on October 21, 2011.
| NORWEGIAN CRUISE LINE HOLDINGS LTD. | ||||
| By: | * | |||
| Name: | Kevin M. Sheehan | |||
| Title: | President and Chief Executive Officer | |||
Pursuant to the requirements of the Securities Act of 1933, as amended, this Registration Statement has been signed below by the following persons in the capacities and on the date indicated.
| Signature |
Title |
Date | ||
| * Kevin M. Sheehan |
President and Chief Executive Officer (Principal Executive Officer) |
October 21, 2011 | ||
| * Wendy A. Beck |
Executive Vice President and Chief Financial Officer (Principal Financial Officer and Principal Accounting Officer) |
October 21, 2011 | ||
| * Tan Sri Lim Kok Thay |
Director, Chairman of the Board | October 21, 2011 | ||
| * David Chua Ming Huat |
Director | October 21, 2011 | ||
| * Marc J. Rowan |
Director | October 21, 2011 | ||
| * Steve Martinez |
Director | October 21, 2011 | ||
| * Adam M. Aron |
Director | October 21, 2011 | ||
| * Walter L. Revell |
Director, Chairman of the Audit Committee | October 21, 2011 | ||
| * Karl Peterson |
Director | October 21, 2011 | ||
| *By: | /S/ DANIEL S. FARKAS | |
| Daniel S. Farkas Attorney-In-Fact | ||
S-1
Table of Contents
EXHIBIT INDEX
| Exhibit |
Description of Exhibit | |
| 1.1* | Underwriting Agreement | |
| 3.1* | Form of Memorandum of Association of Norwegian Cruise Line Holdings Ltd. | |
| 3.2* | Form of Amended and Restated Bye-Laws of Norwegian Cruise Line Holdings Ltd. | |
| 4.1** | Indenture, dated November 12, 2009, by and among NCL Corporation Ltd. as Issuer and Norwegian Dawn Limited, Norwegian Sun Limited, Norwegian Spirit, Ltd. and Norwegian Star Limited as subsidiary guarantors and U.S. Bank National Association as Indenture Trustee with respect to $450.0 million 11.75% Senior Notes due 2016 (incorporated herein by reference to Exhibit 2.5 to our annual report on Form 20-F filed on February 24, 2010 (File No. 333-128780)) | |
| 4.2** | Registration Rights Agreement, dated November 12, 2009, by and among NCL Corporation Ltd. and Norwegian Star Limited, Norwegian Spirit, Ltd., Norwegian Sun Limited and Norwegian Dawn Limited, as guarantors and Deutsche Bank Securities, Inc., Barclays Capital, Inc., Citigroup Global Markets Inc., J.P. Morgan Securities Inc. with respect to $450.0 million 11.75% Senior Notes due 2016 (incorporated herein by reference to Exhibit 2.6 to our annual report on Form 20-F filed on February 24, 2010 (File No. 333-128780)) | |
| 4.3** | Indenture, dated November 9, 2010, by and among NCL Corporation Ltd. as Issuer and U.S. Bank National Association as Indenture Trustee with respect to $250.0 million 9.50% Senior Notes due 2018 (incorporated herein by reference to Exhibit 4.3 to amendment no. 1 to NCL Corporation Ltd.’s registration statement on Form S-1 filed on December 15, 2010 (File No. 333-170141)) | |
| 4.4** | Registration Rights Agreement, dated November 9, 2010, by and among NCL Corporation Ltd. and Deutsche Bank Securities Inc. with respect to $250.0 million 9.50% Senior
Notes due 2018 (incorporated herein by reference to Exhibit 4.4 to amendment no. 1 to NCL Corporation Ltd.’s registration statement on Form S-1 filed on December 15, 2010 (File No. 333-170141)) | |
| 4.5* | Form of Certificate of Ordinary Shares | |
| 5.1 | Form of Opinion of Cox Hallett Wilkinson Limited | |
| 8.1 | Form of tax opinion of O’Melveny & Myers LLP | |
| 10.1** | €298.0 million Pride of America Loans, dated as of April 4, 2003, by and among Ship Holding LLC and a syndicate of international banks and related Guarantee by NCL Corporation Ltd. (incorporated herein by reference to Exhibit 4(e) to our registration statement on Form F-4 filed on October 3, 2005 (File No. 333-128780)) ++ | |
| 10.2** | Supplemental Amendments, dated June 1, 2005, to €298.0 million Pride of America Loans, dated as of April 4, 2003, by and among Pride of America Ship Holding, Inc., NCL Corporation Ltd. and a syndicate of international banks (incorporated herein by reference to Exhibit 4.6 to our annual report on Form 20-F filed on March 29, 2006 (File No. 333- 128780)) | |
| 10.3** | Seventh Supplemental Deed to €258.0 million Pride of America Loans and Sixth Supplemental Deed to €40.0 million Pride of America Loans, both dated November 13, 2006, to €298.0 million Pride of America Loans, dated as of April 4, 2003, as amended, by an agreement dated April 20, 2004, by and among Pride of America Ship Holding, Inc. and a syndicate of international banks and related Guarantee by NCL Corporation Ltd. (incorporated herein by reference to Exhibit 4.27 to our annual report on Form 20-F filed on March 6, 2007 (File No. 333-128780)) ++ | |
1
Table of Contents
| Exhibit |
Description of Exhibit | |
| 10.4** | Eighth Supplemental Deed to €258.0 million Pride of America Loan and Seventh Supplemental Deed to €40.0 million Pride of America Loan, each dated as of April 4, 2003, each as amended, dated December 21, 2007, by and among Pride of America Ship Holding, Inc., NCL Corporation Ltd. and a syndicate of international banks and related amended and restated Guarantees by NCL Corporation Ltd. (incorporated herein by reference to Exhibit 4.58 to our annual report on Form 20-F filed on March 13, 2008 (File No. 333-128780)) ++ | |
| 10.5** | Ninth Supplemental Deed to €258.0 million Pride of America Loan and Eighth Supplemental Deed to €40.0 million Pride of America Loan, each dated as of
April 4, 2003, each as amended, dated April 2, 2009, by and among Pride of America Ship Holding, Inc., NCL Corporation Ltd. and a syndicate of international banks and related amended and restated Guarantee by NCL Corporation Ltd. (incorporated herein by reference to Exhibit 4.36 to Amendment No. 1 to our annual report on Form 20-F filed on May 25, 2010 (File No. 333-128780)) ++ | |
| 10.6** |
Tenth Supplemental Deed to €258.0 million Pride of America Loan and Ninth Supplemental Deed to €40.0 million Pride of America Loan, each dated as of April 4, 2003, each as amended, dated July 22, 2010, by and among Pride of America Ship Holding, LLC, NCL Corporation Ltd. and a syndicate of international banks (incorporated herein by reference to Exhibit 10.6 to amendment no. 4 to NCL Corporation Ltd.’s registration statement on Form S-1 filed on June 9, 2011 (File No. 333-170141)) ++ | |
| 10.7** | Eleventh Supplemental Deed to €258.0 million Pride of America Loan and Tenth Supplemental Deed to €40.0 million Pride of America Loan, each dated as of April 4, 2003, each as amended, dated November 18, 2010, by and among Pride of America Ship Holding, LLC, NCL Corporation Ltd. and a syndicate of international banks (incorporated herein by reference to Exhibit 10.7 to amendment no. 4 to NCL Corporation Ltd.’s registration statement on Form S-1 filed on June 9, 2011 (File No. 333-170141)) | |
| 10.8** | Merchant Services Bankcard Agreement, dated as of March 26, 2004, among NCL Corporation Ltd., Chase Merchant Services, LLC and JPMorgan Chase Bank (incorporated herein by
reference to Exhibit 10(a) to our registration statement on Form F-4 filed on October 3, 2005 (File No. 333-128780)) | |
| 10.9** | Facility Agreement, dated as of September 23, 2005, in connection with Letters of Credit required by the Merchant Services Bankcard Agreement, by and among NCL Corporation Ltd.
and a syndicate of international banks (incorporated herein by reference to Exhibit 4.9 to our annual report on Form 20-F filed on March 29, 2006 (File No. 333-128780)) | |
| 10.10** | First Supplemental Deed, dated November 13, 2006, to Facility Agreement, dated September 23, 2005, in connection with Letters of Credit required by the Merchant Services
Bankcard Agreement, by and among NCL Corporation Ltd. and a syndicate of international banks (incorporated herein by reference to Exhibit 4.29 to our annual report on Form 20-F filed on March 6, 2007 (File No. 333-128780)) ++ | |
| 10.11** | Third Supplemental Deed, dated December 21, 2007, to Facility Agreement, dated as of September 23, 2005, as amended, in connection with Letters of Credit required by the Merchant Services Bankcard Agreement, by and among NCL Corporation Ltd., Norwegian Sun Limited, Norwegian Dawn Limited and a syndicate of international banks (incorporated herein by reference to Exhibit 4.61 to our annual report on Form 20-F filed on March 13, 2008 (File No. 333-128780)) ++ | |
| 10.12** | $334.1 million Norwegian Jewel Loan, dated as of April 20, 2004, by and among Norwegian Jewel Limited and a syndicate of international banks and related Guarantee by NCL Corporation Ltd. (incorporated herein by reference to Exhibit 4(h) to our registration statement on Form F-4 filed on October 3, 2005 (File No. 333-128780)) ++ | |
2
Table of Contents
| Exhibit |
Description of Exhibit | |
| 10.13** | First Supplemental Deed, dated as of September 30, 2005, to $334.1 million Norwegian Jewel Loan, by and among Norwegian Jewel Limited, NCL Corporation Ltd. and a syndicate of international banks (incorporated herein by reference to Exhibit 4.11 to our annual report on Form 20-F filed on March 29, 2006 (File No. 333-128780)) | |
| 10.14** | Second Supplemental Deed, dated April 4, 2006, and Third Supplemental Deed, dated November 13, 2006, to $334.1 million Norwegian Jewel Loan, dated as of April 20, 2004, as amended, by and among Norwegian Jewel Limited and a syndicate of international banks and related Guarantee by NCL Corporation Ltd. (incorporated herein by reference to Exhibit 4.30 and Exhibit 4.31, respectively, to our annual report on Form 20-F filed on March 6, 2007 (File No. 333-128780)) ++ | |
| 10.15** | Fourth Supplemental Deed, dated December 21, 2007, to $334.1 million Norwegian Jewel Loan, dated as of April 20, 2004, as amended, by and among Norwegian Jewel Limited, NCL Corporation Ltd. and a syndicate of international banks and related amended and restated Guarantee by NCL Corporation Ltd. (incorporated herein by reference to Exhibit 4.57 to our annual report on Form 20-F filed on March 13, 2008 (File No. 333-128780)) ++ | |
| 10.16** | Fifth Supplemental Deed, dated April 2, 2009, to $334.1 million Norwegian Jewel Loan, dated as of April 20, 2004, as amended, by and among Norwegian Jewel Limited, NCL Corporation Ltd. and a syndicate of international banks and related amended and restated Guarantee by NCL Corporation Ltd. (incorporated herein by reference to Exhibit 4.35 to Amendment No. 1 to our annual report on Form 20-F filed on May 25, 2010 (File No. 333-128780)) ++ | |
| 10.17** | Sixth Supplemental Deed, dated July 22, 2010, to $334.1 million Norwegian Jewel Loan, dated as of April 20, 2004, as amended, by and among Norwegian Jewel Limited, NCL Corporation Ltd. and a syndicate of international banks (incorporated herein by reference to Exhibit 10.17 to amendment no. 4 to NCL Corporation Ltd.’s registration statement on Form S-1 filed on June 9, 2011 (File No. 333-170141)) ++ | |
| 10.18** | Seventh Supplemental Deed, dated November 18, 2010, to $334.1 million Norwegian Jewel Loan, dated as of April 20, 2004, as amended, by and among Norwegian Jewel Limited, NCL Corporation Ltd. and a syndicate of international banks (incorporated herein by reference to Exhibit 10.18 to amendment no. 4 to NCL Corporation Ltd.’s registration statement on Form S-1 filed on June 9, 2011 (File No. 333-170141)) | |
| 10.19** | €308.1 million Pride of Hawai’i Loan, dated as of April 20, 2004, as amended, by and among Pride of Hawai’i, Inc. and a syndicate of international banks and related Guarantee by NCL Corporation Ltd. (incorporated herein by reference to Exhibit 4(i) to our registration statement on Form F-4 filed on October 3, 2005 (File No. 333-128780)) ++ | |
| 10.20** | Second Supplemental Deed, dated as of September 30, 2005, to €308.1 million Pride of Hawai’i Loan, by and among Pride of Hawai’i, Inc., NCL Corporation Ltd. and a syndicate of international banks (incorporated herein by reference to Exhibit 4.13 to our annual report on Form 20-F filed on March 29, 2006 (File No. 333-128780)) | |
| 10.21** | Third Supplemental Deed, dated November 13, 2006, to €308.1 million Pride of Hawai’i Loan, dated as of April 20, 2004, as amended, by and among Pride of Hawai’i, Inc. and a syndicate of international banks and related Guarantee by NCL Corporation Ltd. (incorporated herein by reference to Exhibit 4.31 to our annual report on Form 20-F filed on March 6, 2007 (File No. 333-128780)) ++ | |
| 10.22** | Fourth Supplemental Deed, dated December 21, 2007, to €308.1 million Pride of Hawai’i Loan, dated as of April 20, 2004, as amended, by and among Pride of Hawai’i, Inc., NCL Corporation Ltd. and a syndicate of international banks and related amended and restated Guarantee by NCL Corporation Ltd. (incorporated herein by reference to Exhibit 4.59 to our annual report on Form 20-F filed on March 13, 2008 (File No. 333-128780)) ++ | |
3
Table of Contents
| Exhibit |
Description of Exhibit | |
| 10.23** | Fifth Supplemental Deed, dated February 10, 2008, to €308.1 million Pride of Hawai’i Loan, dated as of April 20, 2004, as amended, by and among Pride of Hawai’i, Inc., NCL Corporation Ltd. and a syndicate of international banks (incorporated herein by reference to Exhibit 4.60 to our annual report on Form 20-F filed on March 13, 2008 (File No. 333-128780)) ++ | |
| 10.24** | Sixth Supplemental Deed, dated April 2, 2009, to €308.1 million Pride of Hawai’i Loan, dated as of April 20, 2004, as amended, by and among Pride of Hawai’i, Inc., NCL Corporation Ltd. and a syndicate of international banks and related amended and restated Guarantee by NCL Corporation Ltd. (incorporated herein by reference to Exhibit 4.37 to Amendment No. 1 to our annual report on Form 20-F filed on May 25, 2010 (File No. 333-128780)) ++ | |
| 10.25** | Seventh Supplemental Deed, dated October 19, 2009, to €308.1 million Pride of Hawai’i Loan, dated as of April 20, 2004, as amended, by and among Pride of Hawai’i, Inc., NCL Corporation Ltd. and a syndicate of international banks (incorporated herein by reference to Exhibit 10.25 to amendment no. 4 to NCL Corporation Ltd.’s registration statement on Form S-1 filed on June 9, 2011 (File No. 333-170141)) | |
| 10.26** | Eighth Supplemental Deed, dated July 22, 2010, to €308.1 million Pride of Hawai’i Loan, dated as of April 20, 2004, as amended, by and among Pride of Hawai’i, LLC, NCL Corporation Ltd. and a syndicate of international banks (incorporated herein by reference to Exhibit 10.26 to amendment no. 4 to NCL Corporation Ltd.’s registration statement on Form S-1 filed on June 9, 2011 (File No. 333-170141)) ++ | |
| 10.27** | Ninth Supplemental Deed, dated November 18, 2010, to €308.1 million Pride of Hawai’i Loan, dated as of April 20, 2004, as amended, by and among Pride of Hawai’i, LLC, NCL Corporation Ltd. and a syndicate of international banks (incorporated herein by reference to Exhibit 10.27 to amendment no. 4 to NCL Corporation Ltd.’s registration statement on Form S-1 filed on June 9, 2011 (File No. 333-170141)) | |
| 10.28** | Up to €624.0 million Norwegian Pearl and Norwegian Gem Revolving Loan Facility Agreement, dated October 7, 2005, by and among NCL Corporation Ltd. and a syndicate of
international banks (incorporated herein by reference to Exhibit 4.24 to our annual report on Form 20-F filed on March 29, 2006 (File No. 333-128780)) | |
| 10.29** | First Supplemental Deed, dated November 13, 2006, to up to €624.0 million Norwegian Pearl and Norwegian Gem Revolving Loan Facility Agreement, dated October 7, 2005, as amended, by and among NCL Corporation Ltd. and a syndicate of international banks (incorporated herein by reference to Exhibit 4.32 to our annual report on Form 20-F filed on March 6, 2007 (File No. 333-128780)) ++ | |
| 10.30** | Second Supplemental Deed, dated December 21, 2007, to €624.0 million Norwegian Pearl and Norwegian Gem Revolving Loan Facility Agreement, dated as of October 7,
2005, as amended, by and among NCL Corporation Ltd., Norwegian Pearl, Ltd., Norwegian Gem, Ltd. and a syndicate of international banks and related amended and restated Guarantees by Norwegian Pearl, Ltd. and Norwegian Gem, Ltd. (incorporated herein
by reference to Exhibit 4.55 to our annual report on Form 20-F filed on March 13, 2008 (File No. 333-128780)) ++ | |
| 10.31** | Third Supplemental Deed, dated April 2, 2009, to €624.0 million Norwegian Pearl and Norwegian Gem Revolving Loan Facility Agreement, dated as of October 7, 2005, as amended, by and among NCL Corporation Ltd., Norwegian Pearl, Ltd., Norwegian Gem, Ltd. and a syndicate of international banks (incorporated herein by reference to Exhibit 4.34 to Amendment No. 1 to our annual report on Form 20-F filed on May 25, 2010 (File No. 333-128780)) ++ | |
4
Table of Contents
| Exhibit |
Description of Exhibit | |
| 10.32** | Fourth Supplemental Deed, dated July 22, 2010, to €624.0 million Norwegian Pearl and Norwegian Gem Revolving Loan Facility Agreement, dated as of October 7, 2005, as amended, by and among NCL Corporation Ltd., Norwegian Pearl, Ltd., Norwegian Gem, Ltd. and a syndicate of international banks (incorporated herein by reference to Exhibit 10.32 to amendment no. 4 to NCL Corporation Ltd.’s registration statement on Form S-1 filed on June 9, 2011 (File No. 333-170141)) ++ | |
| 10.33** | Shipbuilding Contract for Hull No. D33, dated September 7, 2006, by and between F3 Two, Ltd. and Aker Yards S.A., and AOM No. 1, dated September 7, 2006, AOM No. 2, dated September 7, 2006, AOM No. 3, dated September 7, 2006, and AOM No. 4, dated September 7, 2006 (incorporated herein by reference to Exhibit 4.44 to our annual report on Form 20-F filed on March 6, 2007 (File No. 333-128780)) ++ | |
| 10.34** | Side Letter Agreement, dated as of September 7, 2006, by and between, F3 One, Ltd., F3 Two, Ltd. and Aker Yards S.A. (incorporated herein by reference to Exhibit 4.45 to our
annual report on Form 20-F filed on March 6, 2007 (File No. 333-128780)) ++ | |
| 10.35** | Amendment No. 1, dated May 22, 2007, to Shipbuilding Contract for Hull No. D33, dated September 7, 2006, by and between F3 Two, Ltd. and Aker Yards S.A.
(incorporated herein by reference to Exhibit 4.66 to our annual report on Form 20-F filed on March 13, 2008 (File No. 333-128780)) ++ | |
| 10.36** | AOM No. 5, dated November 6, 2007, AOM No. 11, dated November 6, 2007, AOM No. 12, dated November 6, 2007, AOM No. 13, Revision C, dated November 6, 2007, AOM No. 13, Revision D, dated December 15, 2007, AOM No. 14, dated November 6, 2007, AOM No. 16, dated November 6, 2007, AOM No. 18, dated November 6, 2007, AOM No. 18 A, dated December 15, 2007, AOM No. 19, dated November 6, 2007, AOM No. 22, dated November 6, 2007, AOM No. 25, dated November 6, 2007, AOM No. 28 A, dated December 15, 2007, to Shipbuilding Contract for Hull No. D33, dated September 7, 2006, by and between F3 Two, Ltd. and Aker Yards S.A. (incorporated herein by reference to Exhibit 4.68 to our annual report on Form 20-F filed on March 13, 2008 (File No. 333-128780)) ++ | |
| 10.37** | €662.9 million Syndicated Loan Facility, dated September 22, 2006, by and among F3 Two, Ltd. and a syndicate of international banks and related Guarantee by NCL Corporation Ltd., for the construction of Hull D33 at Aker Yards S.A. (incorporated herein by reference to Exhibit 4.34 to our annual report on Form 20-F filed on March 6, 2007 (File No. 333-128780)) ++ | |
| 10.38** | First Supplemental Deed, dated December 21, 2007, to €662.9 million F3 Two Loan, dated as of September 22, 2006, as amended, by and among F3 Two, Ltd., NCL Corporation Ltd. and a syndicate of international banks and related amended and restated Guarantee by NCL Corporation Ltd. (incorporated herein by reference to Exhibit 4.63 to our annual report on Form 20-F filed on March 13, 2008 (File No. 333-128780)) ++ | |
| 10.39** | Second Supplemental Deed, dated April 24, 2008, to €662.9 million F3 Two Loan, dated as of September 22, 2006, as amended, by and among F3 Two, Ltd., NCL Corporation Ltd. and a syndicate of international banks (incorporated herein by reference to Exhibit 4.70 to our annual report on Form 20-F filed on April 7, 2009 (File No. 333-128780)) ++ | |
| 10.40** | Third Supplemental Deed, dated April 2, 2009, to €662.9 million F3 Two Loan, dated as of September 22, 2006, as amended, by and among F3 Two, Ltd., NCL Corporation Ltd. and a syndicate of international banks and related amended and restated Guarantee by NCL Corporation Ltd. (incorporated herein by reference to Exhibit 4.33 to Amendment No. 1 to our annual report on Form 20-F filed on May 25, 2010 (File No. 333-128780)) ++ | |
5
Table of Contents
| Exhibit |
Description of Exhibit | |
| 10.41** | Fourth Supplemental Deed, dated June 9, 2010, to €662.9 million F3 Two Loan, dated as of September 22, 2006, as amended, by and among Norwegian Epic, Ltd., NCL Corporation Ltd. and a syndicate of international banks (incorporated herein by reference to Exhibit 10.41 to amendment no. 4 to NCL Corporation Ltd.’s registration statement on Form S-1 filed on June 9, 2011 (File No. 333-170141)) ++ | |
| 10.42** | Fifth Supplemental Deed, dated July 22, 2010, to €662.9 million F3 Two Loan, dated as of September 22, 2006, as amended, by and among Norwegian Epic, Ltd., NCL Corporation Ltd. and a syndicate of international banks (incorporated herein by reference to Exhibit 10.42 to amendment no. 4 to NCL Corporation Ltd.’s registration statement on Form S-1 filed on June 9, 2011 (File No. 333-170141)) ++ | |
| 10.43** | Office Lease Agreement, dated as of November 27, 2006, by and between NCL (Bahamas) Ltd. and Hines Reit Airport Corporate Center LLC and related Guarantee by NCL Corporation Ltd., and First Amendment, dated November 27, 2006 (incorporated herein by reference to Exhibit 4.46 to our annual report on Form 20-F filed on March 6, 2007 (File No. 333-128780)) ++ | |
| 10.44** | Amendment No. 1, dated December 1, 2006, Amendment No. 2, dated March 20, 2007, Amendment No. 3, dated July 31, 2007, and Amendment No. 4, dated
December 10, 2007, to Office Lease Agreement, dated December 1, 2006, by and between Hines Reit Airport Corporate Center LLC and NCL (Bahamas) Ltd. (incorporated herein by reference to Exhibit 4.64 to our annual report on Form 20-F filed on March 13, 2008 (File No. 333-128780)) ++ | |
| 10.45** | Amendment No. 5, dated February 2, 2010, to Office Lease Agreement, dated December 1, 2006, by and between Hines Reit Airport Corporate Center LLC and NCL (Bahamas) Ltd. (incorporated herein by reference to Exhibit 10.45 to amendment no. 2 to NCL Corporation Ltd.’s registration statement on Form S-1 filed on January 31, 2011 (File No. 333-170141)) | |
| 10.46** | Reimbursement and Distribution Agreement, dated August 17, 2007, by and among NCL Investment Limited, Star Cruises Limited and NCL Corporation Ltd. (incorporated herein by reference to Exhibit 4.49 to our annual report on Form 20-F filed on March 13, 2008 (File No. 333-128780)) | |
| 10.47** | Shareholders’ Agreement, dated August 17, 2007, by and among NCL Investment Ltd., Star Cruises Limited and NCL Corporation Ltd. (incorporated herein by reference to Exhibit 4.48 to our annual report on Form 20-F filed on March 13, 2008 (File No. 333-128780)) | |
| 10.48** | Joinder, dated January 7, 2008, to the Shareholders’ Agreement, dated August 17, 2007, by and among NCL Corporation Ltd. and Star NCLC Holdings Ltd. (incorporated herein by reference to Exhibit 4.52 to our annual report on Form 20-F filed on March 13, 2008 (File No. 333-128780)) | |
| 10.49** | Joinder, dated January 7, 2008, to the Shareholders’ Agreement, dated August 17, 2007, by and among NCL Corporation Ltd. and NCL Investment II Ltd. (incorporated herein by reference to Exhibit 4.53 to our annual report on Form 20-F filed on March 13, 2008 (File No. 333-128780)) | |
| 10.50** | Joinder, dated January 8, 2008, to the Shareholders’ Agreement, dated August 17, 2007, by and among NCL Corporation Ltd. and TPG Viking I, L.P., TPG Viking II, L.P. and TPG Viking AIV III, L.P. (incorporated herein by reference to Exhibit 4.51 to our annual report on Form 20-F filed on March 13, 2008 (File No. 333-128780)) | |
| 10.51** | Bareboat Charter Agreement, dated January 2, 2009, by and between Ample Avenue Limited and NCL (Bahamas) Ltd. (incorporated herein by reference to Exhibit 4.73 to our annual report on Form 20-F filed on April 7, 2009 (File No. 333-128780)) ++ | |
| 10.52** | Bareboat Charter Agreement, dated August 27, 2010, by and between Ample Avenue Limited and NCL (Bahamas) Ltd. (incorporated herein by reference to Exhibit 10.52 to amendment no. 4 to NCL Corporation Ltd.’s registration statement on Form S-1 filed on June 9, 2011 (File No. 333-170141)) ++ | |
6
Table of Contents
| Exhibit |
Description of Exhibit | |
| 10.53** | $750.0 million Credit Agreement, dated October 28, 2009, by and among NCL Corporation Ltd., various lenders and Nordea Bank Norge ASA (incorporated herein by reference to Exhibit 4.39 to Amendment No. 1 to our annual report on Form 20-F filed on May 25, 2010 (File No. 333-128780)) ++ | |
| 10.54** | First Lien Intercreditor Agreement, dated November 12, 2009, by and among Nordea Bank Norge ASA and U.S. Bank National Association (incorporated herein by reference to Exhibit 4.38 to our annual report on Form 20-F filed on February 24, 2010 (File No. 333-128780)) | |
| 10.55** | Shipbuilding Contract for Hull No. S.678, dated September 24, 2010, by and among Meyer Werft GMBH, Breakaway One, Ltd. and NCL Corporation Ltd. (incorporated herein by reference to Exhibit 10.55 to amendment no. 2 to NCL Corporation Ltd.’s registration statement on Form S-1 filed on January 31, 2011 (File No. 333-170141)) ++ | |
| 10.56** | Shipbuilding Contract for Hull No. S.692, dated September 24, 2010, by and among Meyer Werft GMBH, Breakaway Two, Ltd. and NCL Corporation Ltd. (incorporated herein by reference to Exhibit 10.56 to amendment no. 2 to NCL Corporation Ltd.’s registration statement on Form S-1 filed on January 31, 2011 (File No. 333-170141)) ++ | |
| 10.57** | €529.8 million Breakaway One Credit Agreement, dated November 18, 2010, by and among Breakaway One, Ltd. and a syndicate of international banks and related Guarantee by NCL Corporation Ltd. (incorporated herein by reference to Exhibit 10.57 to amendment no. 4 to NCL Corporation Ltd.’s registration statement on Form S-1 filed on June 9, 2011 (File No. 333-170141)) ++ | |
| 10.58** | €529.8 million Breakaway Two Credit Agreement, dated as of November 18, 2010, by and among Breakaway Two, Ltd. and a syndicate of international banks and related Guarantee by NCL Corporation Ltd. (incorporated herein by reference to Exhibit 10.58 to amendment no. 4 to NCL Corporation Ltd.’s registration statement on Form S-1 filed on June 9, 2011 (File No. 333-170141)) ++ | |
| 10.59** | First Amendment, dated December 21, 2010, to €529.8 million Breakaway Two Credit Agreement, dated as of November 18, 2010, by and among Breakaway Two, Ltd. and a syndicate of international banks and a related Guarantee by NCL Corporation Ltd. (incorporated herein by reference to Exhibit 10.59 to amendment no. 2 to NCL Corporation Ltd.’s registration statement on Form S-1 filed on January 31, 2011 (File No. 333-170141)) | |
| 10.60** | €126.1 million Pride of Hawai’i Credit Agreement, dated November 18, 2010, by and among Pride of Hawaii, LLC and a syndicate of international banks and related Guarantee by NCL Corporation Ltd. (incorporated herein by reference to Exhibit 10.60 to amendment no. 4 to NCL Corporation Ltd.’s registration statement on Form S-1 filed on June 9, 2011 (File No. 333-170141)) ++ | |
| 10.61** | €126.1 million Norwegian Jewel Credit Agreement, dated November 18, 2010, by and among Norwegian Jewel Limited and a syndicate of international banks and related Guarantee by NCL Corporation Ltd. (incorporated herein by reference to Exhibit 10.61 to amendment no. 4 to NCL Corporation Ltd.’s registration statement on Form S-1 filed on June 9, 2011 (File No. 333-170141))++ | |
| 10.62** | Employment Agreement by and between NCL (Bahamas) Ltd. and Kevin M. Sheehan, entered into on May 8, 2009, and effective on November 6, 2008 (incorporated herein by reference to Exhibit 10.62 to amendment no. 3 to NCL Corporation Ltd.’s registration statement on Form S-1 filed on February 11, 2011 (File No. 333-170141)) | |
| 10.63** | Employment Agreement by and between NCL (Bahamas) Ltd. and Wendy A. Beck, entered into on October 21, 2010 (incorporated herein by reference to Exhibit 10.63 to amendment no. 3 to NCL Corporation Ltd.’s registration statement on Form S-1 filed on February 11, 2011 (File No. 333-170141)) | |
7
Table of Contents
| Exhibit |
Description of Exhibit | |
| 10.64** | Employment Agreement by and between NCL (Bahamas) Ltd. and Andrew Stuart, entered into on July 9, 2008 (incorporated herein by reference to Exhibit 10.64 to amendment no. 3 to NCL Corporation Ltd.’s registration statement on Form S-1 filed on February 11, 2011 (File No. 333-170141)) | |
| 10.65** | Employment Agreement by and between NCL (Bahamas) Ltd. and Maria Miller, entered into on June 1, 2009 (incorporated herein by reference to Exhibit 10.65 to amendment no. 3 to NCL Corporation Ltd.’s registration statement on Form S-1 filed on February 11, 2011 (File No. 333-170141)) | |
| 10.66** | Employment Agreement by and between NCL (Bahamas) Ltd. and Robert Becker, entered into on March 17, 2008 (incorporated herein by reference to Exhibit 10.66 to amendment no. 3 to NCL Corporation Ltd.’s registration statement on Form S-1 filed on February 11, 2011 (File No. 333-170141)) | |
| 10.67** | NCL (Bahamas) Ltd. Senior Management Retirement Savings Plan, amended and restated as of January 1, 2008 (incorporated herein by reference to Exhibit 10.67 to amendment no. 3 to NCL Corporation Ltd.’s registration statement on Form S-1 filed on February 11, 2011 (File No. 333-170141)) | |
| 10.68** | NCL (Bahamas) Ltd. Supplemental Executive Retirement Plan, amended and restated as of January 1, 2008 (incorporated herein by reference to Exhibit 10.68 to amendment no. 3 to NCL Corporation Ltd.’s registration statement on Form S-1 filed on February 11, 2011 (File No. 333-170141)) | |
| 10.69* | Form of Indemnification Agreement entered into by Norwegian Cruise Line Holdings Ltd. and each of its directors, executive officers and certain other officers | |
| 21.1*** | List of Subsidiaries of Norwegian Cruise Line Holdings Ltd. | |
| 23.1 | Consent of PricewaterhouseCoopers LLP | |
| 23.2* | Consent of Cox Hallett Wilkinson Limited (included in Exhibit 5.1) | |
| 23.3* | Consent of O’Melveny & Myers LLP (included in Exhibit 8.1) | |
| 24.1*** | Powers of attorney | |
| ++ | Confidential treatment has been requested with respect to certain portions of this exhibit. Omitted portions have been filed separately with the SEC. |
| * | To be filed by amendment. |
| ** | Incorporated by reference. |
| *** | Previously filed. |
8