Attached files
| file | filename |
|---|---|
| EX-31.1 - SECTION 302 CEO CERTIFICATION - IMPERIAL PETROLEUM INC | d244922dex311.htm |
| EX-32.1 - SECTION 906 CEO CERTIFICATION - IMPERIAL PETROLEUM INC | d244922dex321.htm |
Table of Contents
SECURITIES EXCHANGE COMMISSION
Washington D.C. 20549
FORM 10-K
(Mark One)
| x | ANNUAL REPORT PURSUANT TO SECTION 13 OR 15(d) OF THE SECURITIES EXCHANGE ACT OF 1934 |
For the fiscal year ended July 31, 2011
| ¨ | TRANSITION REPORT PURSUANT TO SECTION 13 OR 15(d) OF THE SECURITIES EXCHANGE ACT OF 1934 |
For the transition period from to
Commission file number 000-09923
IMPERIAL PETROLEUM, INC.
(Exact name of registrant as specified in its charter)
| Nevada | 95-3386019 | |
| (State or other jurisdiction of incorporation or organization) |
(IRS Employer identification No.) |
101 NW First Street, Suite 213
Evansville, IN 47708
Registrant’s telephone number, including area code (812) 867-1433
Securities registered pursuant to Section 12(b) of the Act: None.
Securities registered pursuant to Section 13(g) of the Act:
Common Stock. $0.006 par value per share
(Title of class)
Indicate by check mark if the registrant is a well-known seasoned issuer, as defined in Rule 405 of the Securities Act. Yes ¨ No x
Indicate by check mark if the registrant is not required to file reports pursuant to Section 13 or Section 15(d) of the Act. Yes ¨ No x
Indicate by check mark whether the Registrant (1) has filed all reports required to be filed by Section 13 or 15(d) of the Securities Exchange Act of 1934 during the preceding 12 months (or for such shorter period that the Registrant was required to file such reports), and (2) has been subject to such filing requirements for the past 90 days. Yes x No ¨
Indicate by check mark if disclosure of delinquent filers pursuant to Item 405 of the Regulation K is not contained herein, and will not be contained to the best of the Registrant’s knowledge in definitive proxy or information statements incorporated by reference in Part III of this Form 10-K or any amendment to this Form 10-K. x.
Indicate by check mark whether the registrant has submitted electronically and posted on its corporate Web site, if any, every Interactive Data File required to be submitted and posted pursuant to Rule 405 of Regulation S-T (§232.405 of this chapter) during the preceding 12 months (or for such shorter period that the registrant was required to submit and post such files). Yes ¨ No ¨
Indicate by check mark whether the registrant is a large accelerated filer, an accelerated filer, or a non-accelerated filer. See definition of “accelerated filer and large accelerated filer” in Rule 12b-2 of the Exchange Act.
| Large accelerated filer ¨ | Accelerated filer ¨ | Non-Accelerated filer x |
Indicate by check mark whether the registrant is a shell company (as defined in Rule 12b-2 of the Exchange Act.): Yes ¨ No x
On July 31, 2011, there were 34,905,136 shares of the Registrant’s common stock issued and outstanding. The aggregate market value of the Registrant’s voting stock held by non-affiliates is $30,160,758. See Item 5. Market for Registrant’s Common Stock and Related Stockholder Matters.
Documents Incorporated by Reference: NONE
Table of Contents
IMPERIAL PETROLEUM, INC
FORM 10-K
FISCAL YEAR ENDED JULY 31, 2010
| Page | ||||||
| PART I | 1 | |||||
| ITEM 1. | 1 | |||||
| 1 | ||||||
| 3 | ||||||
| 4 | ||||||
| 4 | ||||||
| 6 | ||||||
| ITEM 1A. | 6 | |||||
| ITEM 2. | 16 | |||||
| 17 | ||||||
| 26 | ||||||
| Principal Exploration and Development Projects: Mining Ventures |
29 | |||||
| 29 | ||||||
| 31 | ||||||
| 32 | ||||||
| 32 | ||||||
| 32 | ||||||
| 33 | ||||||
| 33 | ||||||
| ITEM 3. | 33 | |||||
| ITEM 4. | 34 | |||||
| PART II | 35 | |||||
| ITEM 5. | Market For Registrant’s Common Stock; and Related Stockholder Matters |
35 | ||||
| ITEM 6. | 35 | |||||
| ITEM 7. | Management’s Discussion and Analysis of the Financial Condition and Results of Operations |
35 | ||||
| 35 | ||||||
| 38 | ||||||
| 39 | ||||||
| 40 | ||||||
| 40 | ||||||
| 40 | ||||||
| 40 | ||||||
Table of Contents
| ITEM 7A. |
40 | |||||
| 40 | ||||||
| 41 | ||||||
| ITEM 8. | 41 | |||||
| ITEM 9. | Changes in and Disagreements with Accountants on Accounting and Financial Disclosure. |
41 | ||||
| ITEM 9A. | 41 | |||||
| 42 | ||||||
| ITEM 9B. | 42 | |||||
| PART III | 43 | |||||
| ITEM 10. | 43 | |||||
| 43 | ||||||
| 43 | ||||||
| 44 | ||||||
| ITEM 11. | 45 | |||||
| ITEM 12. | Security Ownership of Certain Beneficial Owners and Management |
46 | ||||
| ITEM 13. | 46 | |||||
| ITEM 14. | 47 | |||||
| PART IV | 48 | |||||
| ITEM 15. | Exhibits, Financial Statement Schedules and Reports on Form 8-K |
48 | ||||
| 50 | ||||||
Table of Contents
CAUTIONARY STATEMENT REGARDING FORWARD LOOKING STATEMENTS
In the interest of providing the Company’s stockholders and potential investors with certain information regarding the Company’s future plans and operations, certain statements set forth in this Form 10-K relate to management’s future plans and objectives. Such statements are “forward-looking statements” within the meaning of Section 27A of the Securities Act of 1933, as amended, and Section 21E of the Securities Act of 1934, as amended. Although any forward looking statements contained in this Form 10-K or otherwise expressed on behalf of the Company are, to the knowledge and in the judgment of the officers and directors of the Company, expected to prove to come true and to come to pass, management is not able to predict the future with absolute certainty. Forward looking statements involve known and unknown risks and uncertainties which may cause the Company’s actual performance and financial results in future periods to differ materially from any projection, estimate or forecasted result. These risks and uncertainties include, among other things, volatility of commodity prices, changes in interest rates and capital market conditions, competition, risks inherent in the Company’s operations, the inexact nature of interpretation of seismic and other geological, geophysical, petro-physical and geo-chemical data, the imprecise nature of estimating reserves, events that deprive the Company of the services of its Chairman of the Board, Chief Executive Officer and largest shareholder, and such other risks and uncertainties as described from time to time in the Company’s periodic reports and filings with the Securities and Exchange Commission. Accordingly stockholders and potential investors are cautioned that certain events or circumstances could cause actual results to differ materially from those projected, estimated or predicted. The Company does not intend to update forward-looking statements. You should refer to and carefully review the information in future documents we file with the Securities and Exchange Commission.
Table of Contents
As used in this Form 10-K, the following terms shall have the following meanings.
Biodiesel and Biofuels:
“ASTM” refers to the American Society for Testing and Materials International, an organization that develops and delivers international voluntary consensus standards, including United States standards for fuel.
“ASTM D6751” refers to the ASTM specification for pure biodiesel, or B100, in the United States.
“ASTM D7467” refers to the ASTM specification for biodiesel blends in the United States from 6% to 20% biodiesel.
“ASTM D975” refers to the ASTM specification for diesel fuel in the United States, which includes up to 5% biodiesel.
“Biodiesel” means ASTM quality transportation fuel made from renewable vegetable, mineral, or animal fats and oils.
“B2, B5, B6, B10, B11, B99.9 and B100” refer to blends of biodiesel with petroleum-based diesel. The number represents the biodiesel percentage of the blend. For instance, a blend of 5% biodiesel and 95% petroleum-based diesel would be represented as B5.
“blender’s tax credit” refers to the federal excise tax credit of $1.00 per gallon of biodiesel that is available to the person who blends biodiesel with petroleum-based diesel.
“BQ-9000” refers to a cooperative and voluntary program for the accreditation of biodiesel producers and marketers. The program combines the ASTM standard for biodiesel, ASTM D6751, and a quality systems program that includes storage, sampling, testing, blending, shipping, distribution and fuel management practices.
“CBOT” refers to the Chicago Board of Trade.
“MMGY” refers to million gallons per year.
“nameplate production capacity” refers to the production capacity of a particular facility based on the expected annual throughput in gallons based upon producing at 100% of design capacity for approximately 330 days per year using a particular feedstock.
“Obligated Parties” refers to petroleum refiners and petroleum fuel importers in the 48 contiguous states and Hawaii that have annual renewable fuel volume obligations to use biofuels under RFS2.
“OPIS” refers to the Oil Price Information Service.
“RFS” refers to the renewable fuel standard created under the Energy Policy Act of 2005, which established the first renewable fuel volume requirement in the United States.
“RFS2” refers to the expanded renewable fuel standard that became effective July 1, 2010 requiring for the first time that a specific portion of the diesel fuel consumed in the United States annually be renewable.
“RIN” refers to a renewable identification number, which is a unit of measurement generated in connection with the production or importation of renewable fuel that may be used to satisfy certain renewable fuel requirements of RFS2.
“RVO” refers to a renewable volume obligation, the annual renewable fuel volume requirement for an Obligated Party under RFS2.
1
Table of Contents
“ULSD” refers to ultra low sulfur diesel, which is diesel fuel containing 15 parts per million or less of sulfur, which is the current United States standard for on-road diesel fuel.
Oil & Natural Gas & Mining:
“Base Metals” refers to a family of metallic elements, including copper, lead and zinc.
“Bbl” means barrel.
“Bcf” means billion cubic feet.
“BOE” means equivalent barrels of oil.
“Company,” unless the context requires otherwise, means Imperial Petroleum, Inc., a Nevada corporation (“Imperial”) and its consolidated subsidiaries. Ridgepointe Mining Company, a Delaware corporation (“Ridgepointe”), , Phoenix Metals, Inc., dba The Rig Company a Texas corporation (“Phoenix”), Hoosier Biodiesel Company (formerly Global/Imperial Joint Venture Inc.) a Nevada corporation and e-Biofuels, LLC, an Indiana limited liability corporation.Phoenix was acquired effective April 30, 1997. Phoenix has conducted limited activities since 1997 as Imperial Environmental Company and subsequently as The Rig Company although it has not officially changed its name and now operates under the d/b/a of Imperial Chemical Company. Hoosier Biodiesel Company was incorporated in Nevada in 2000. The Company acquired 100% of the equity of e-Biofuels, LLC, effective on May 24, 2010, and as a result e-Biofuels, LLC became a wholly-owned subsidiary of the Company and its results of operations and financial statements are consolidated beginning on that date.
“Grade” refers to the metal or mineral content of rock, ore or drill or other samples. With respect to precious metals, grade is generally expressed as troy ounces per ton of rock.
“Gross” refers to the total leasehold acres or wells in which the Company has a working interest.
“MBbls” means thousand barrels.
“MBOE” means thousands equivalent barrels of oil.
“Mcf” means thousand cubic feet.
“Mcfe” means thousand cubic feet equivalent.
“Mineable” refers to that portion of a mineral deposit from which it is economically feasible to extract ore.
“MMBbls” means million barrels.
“MMcf” means million cubic feet.
“Mmcfe” means million cubic feet equivalent.
“Net” refers to gross leasehold acres or wells multiplied by the percentage working interest owned by the Company.
“Net production” means production that is owned by the Company less royalties and production due others.
“Net Smelter Royalty” is a royalty based on the actual sale price received for the subject metal less the cost of smelting and/or refining the material at an offsite refinery or smelter along with off-site transportation costs.
“Oil” includes crude oil, condensate and natural gas liquids.
“Patented Mining Claim” is a mining claim, usually comprising about 20 acres, to which the US Government has conveyed title to the owner.
“Proved developed reserves” are those reserves which are expected to be recovered through existing wells with existing equipment and operating methods.
“Proved reserves” are estimated quantities of crude oil, natural gas and natural gas liquids, which geological and engineering data demonstrate with reasonable certainty to be recoverable in future years from known reservoirs under existing economic and operating conditions.
2
Table of Contents
“Proved undeveloped reserves” are those reserves which are expected to be recovered from new wells on undrilled acreage or from existing wells where a relatively major expenditure is required for recompletion.
“Unpatented Mining Claim” is a mining claim which has been staked or marked out in accordance with federal and state mining laws to acquire the exclusive rights to explore for and exploit the minerals which may occur on such lands. The title to the property has not been conveyed to the holder of an unpatented mining claim.
Unless otherwise indicated herein, natural gas volumes are stated at the legal pressure base of the state or area in which the reserves are located and at 60 degrees Fahrenheit. Natural gas equivalents are determined using the ratio of six Mcf of natural gas to one Bbl of crude oil
Imperial Petroleum, Inc., a Nevada corporation (“the Company”), has three primary areas of activity in energy production: (a.) we own and operate a biodiesel production facility with a nameplate capacity of approximately 30 MMGPY in Middletown, Indiana and produce ASTM quality transportation biodiesel; (b.) we own a license to revolutionary tar sand producing technology and the surfactant used therein and (c.) we own operating oil and natural gas wells in Louisiana. Our shares of common stock are quoted on the Over-the-Counter Market (“OTCQX”). The OTCQX is an electronic trading service offered by the National Association of Security Dealers (“NASD”) that shows real-time quotes, last sale prices and volume information for over-the-counter equity securities.
A summary of our activities by segment is included below:
Biodiesel Production: We acquired e-Biofuels, LLC in May 2010. We produce and sell ASTM quality transportation biodiesel as our primary product and crude glycerine as our secondary product. We currently operate a 30 MMGPY nameplate capacity plant located in Middletown, Indiana. In fiscal 2010 and fiscal 2011, we sold approximately 1.9 million and 26.4 million gallons of biodiesel respectively, representing approximately 0.6% in 2010 and an estimated 2.9% of United States biodiesel production. We are currently operating at the capacity of our Middletown plant at approximately 2.5-3.0 million gallons per month and we are undertaking another capacity expansion of the facility to approximately 50 MMGPY at the present time. Our biodiesel business accounted for revenues of $5.5 million in fiscal 2010 and $109.6 million in revenues in fiscal 2011 and currently represents approximately 99.6% of our total revenues for fiscal 2011.
We are a low-cost biodiesel producer. We produce our biodiesel from a wide variety of feedstocks, including soy oil, inedible animal fat, used cooking oil and inedible corn oil. We also have the capability to re-process off-spec methyl esters into ASTM quality biodiesel. We believe our ability to process these feedstocks provides us with a cost advantage over many biodiesel producers, particularly those that rely exclusively on higher cost virgin vegetable oils, such as soybean oil and those facilities that are not feedstock flexible. We are a RIN certified generating facility, we are qualified as an advanced biofuels producer and we are BQ 9000 certified.
Biodiesel is a small but growing part of the distillate pool. According to the United States Energy Information Administration (EIA) the petroleum-based distillate market in the United States comprises some 53 billion gallons annually which includes diesel fuel, heating oil and fuel used for power generation. Biodiesel is compatible with the existing diesel and distillate fuel infrastructure and has been mandated as an additive to petroleum diesel and heating oil in ever-increasing amounts through 2022 under the Renewable Fuel Standard (RFS2) which became effective on July 1, 2010. RFS2 requires that Obligated Parties (primarily refiners and fuel jobbers) blend biomass-based additives to diesel through 2022. Under the current supervision of the United States Environmental Protection Agency (EPA), the mandates, (including advanced biofuels volumes for which biodiesel qualifies) are 1.375 billion gallons in 2011, 2.0 billion gallons in 2012 and 2.75 billion gallons in 2013. Biodiesel is currently the only commercially significant RFS2-compliant biomass-based diesel fuel additive produced in the United States. As a result, demand for biodiesel has increased significantly There are a number of other federal and state incentives for the production of biodiesel and other renewable fuels that are discussed under the section below: “Management’s Discussion and Analysis of Financial Condition and Results of Operations”.
Heavy Oil Production: We formed Arrakis Oil Recovery, LLC in February 2010 to acquire a non-exclusive license for the development of a revolutionary new, eco-friendly process to recover oil (bitumen) from tar (oil) sands outside of Canada. The process is a non-thermal, mechanical and chemical process using a closed loop system to eliminate emissions. The process technology works equally well on oil-wet (US) tar sands or water-wet (Canadian) tar sands. We acquired an exclusive license to use the technology in Canada and completed an agreement with an international partner, wherein we retained an overriding royalty interest of 2.5% in the application of the process technology in Canada, Mexico, Venezuela,
3
Table of Contents
Russia and Argentina in exchange for relinquishing its technology rights outside the United States. We acquired the exclusive rights to manufacture, sell and distribute the chemical surfactant used in the tar sands process technology and set up a distribution facility in Houston, Texas. We have acquired 121 acres in Kentucky and are leasing additional acreage in the vicinity as we complete the permitting process. We intend to move the 2,500 ton per day commercial processing unit we constructed in Texas to a permanent site in Kentucky on our acreage and to begin mining and processing tar sands to recover the heavy oil for sale to refineries.
Oil and Natural Gas Production: At July 31, 2011, we operated 18 oil and gas wells in Louisiana. Net daily production from the Company’s oil and gas properties was approximately 12.5 Bopd and 18 Mmcfpd for the year ended July 31, 2011 although we have established more continuous production since May 2011 at about 70 Bopd. The Company’s estimated net proven oil and gas reserves as of July 31, 2011 were 311 MBO and 3,109 Mmcfg, respectively and has an estimated present value discounted at 10% of approximately $13.99 million.
Gold Mining: We are the operator and owner of certain claims in Utah comprising the Duke Gold Mine, although no significant operations occurred during the fiscal year.
The Company was incorporated on January 16, 1981 and is the surviving member of a merger between itself, Imperial Petroleum, Inc., a Utah corporation incorporated on June 4, 1979 (“Imperial-Utah”), and Calico Exploration Corp., a Utah corporation incorporated on September 27, 1979 (“Calico”). The Company was reorganized under a Reorganization Agreement and Plan and Article of Merger dated August 31, 1981 resulting in the Company being domiciled in Nevada. On August 11, 1982, Petro Minerals Technology, Inc. (“Petro”), a 94% -owned subsidiary of Commercial Technology Inc. (“Comtec”) acquired 58% of the Company’s common stock. Petro assigned to the Company its interests in two producing oil and gas properties in consideration for 5,000,000 shares of previously authorized but unissued shares of common stock of the Company and for a $500,000 line of credit to develop these properties. Petro has since undergone a corporate reorganization and is now known as Petro Imperial Corporation. On August 1, 1988 in an assumption of assets and liabilities agreement, the same 58% of the Company’s common stock was acquired from Petro by Glauber Management Co., a Texas corporation, (“Glauber Management”), a 100% owned subsidiary of Glauber Valve Co., Inc., a Nebraska corporation (“Glauber Valve”).
Pursuant to an Agreement to Exchange Stock and Plan of Reorganization dated August 27, 1993 (the “Stock Exchange Agreement”), as amended by that certain First Amendment to Agreement to Exchange Stock and Plan of Reorganization dated as of August 27, 1993, (the “First Amendment”), between the Company, Glauber Management, Glauber Valve, Jeffrey T. Wilson (“Wilson”), James G. Borem (“Borem”) and those persons listed on Exhibit A attached to the Stock Exchange Agreement and First Amendment (the “Ridgepointe Stockholders”). The Ridgepointe Stockholders agreed to exchange (the “Ridgepointe Exchange Transaction”) a total of 12,560,730 shares of the common stock of Ridgepointe, representing 100% of the issued and outstanding common stock of Ridgepointe, for a total of 12,560,730 newly issued shares of the Company’s common stock, representing 59.59% of the Company’s resulting issued and outstanding common stock. Under the terms of the Stock Exchange Agreement, (i) Wilson exchanged 5,200,000 shares of Ridgepointe common stock for 5,200,000 shares of the Company’s common stock representing 24.67% of the Company’s issued and outstanding common stock, (ii) Borem exchanged 1,500,000 shares of Ridgepointe common stock for 1,500,000 shares of the Company’s common stock representing 7.12% of the Company’s issued and outstanding common stock, and (iii) the remaining Ridgepointe Stockholders in the aggregate exchanged 5,860,730 shares of Ridgepointe common stock for 5,860,730 shares of the Company’s issued and outstanding common stock, representing, in the aggregate, 27.81% of the Company’s issued and outstanding common stock. The one-for-one ratio of the number of shares of the Company’s common stock exchanged for each share of Ridgepointe common stock was determined through arms length negotiations between the Company, Wilson and Borem.
The Ridgepointe Exchange Transaction was closed on August 27, 1993. As a result, Ridgepointe is now a wholly, owned subsidiary of the Company. At the time of acquisition, Ridgepointe was engaged in the development of a copper ore mining operation in Yavapai County, Arizona and, through its wholly owned subsidiary, I.B. Energy, in the exploration for and production of oil and gas in the Mid-continent and Gulf Coast regions of the United States.
In connection with the closing of the Ridgepointe Exchange Transaction, each member of the Board of Directors of the Company resigned and Wilson, Borem and Dewitt C. Shreve (“Shreve”) were elected Directors of the Company. In addition, each officer of the Company resigned and the Company’s new Board of Directors elected Wilson as Chairman of the Board, President and Chief Executive Officer, Borem as Vice President and Cynthia A. Helms as Secretary of the Company.
4
Table of Contents
Ms. Helms subsequently resigned and Kathryn H. Shepherd was elected Secretary. Mr. Borem, Mr. Shreve and Ms. Shepherd subsequently resigned and Mr. Malcolm W. Henley and Mrs. Stacey D. Smethers were elected to the Board. The Board of Directors further authorized the move of the Company’s principal executive offices from Dallas, Texas to its current offices in Evansville, Indiana.
As a condition to closing the Ridgepointe Exchange Transaction, the Company received and canceled 7,232,500 shares of the Company’s common stock from the Company’s former partner, Glauber Management, and 100,000 shares of the common stock of Tech-Electro Technologies, Inc from an affiliate of Glauber Management and Glauber Valve. In addition, pursuant to the terms of the First Amendment, Glauber Management or Glauber Valve, or their affiliates, were to transfer to the Company 75,000 shares of common stock of Wexford Technology, Inc. (formerly Chelsea Street Financial Holding Corp.) no later than October 31, 1993, which such transfer subsequently occurred.
Recent Transactions:
The Company formed Arrakis Oil Recovery, LLC in February 2010 to acquire a non-exclusive license for the development of a revolutionary new, eco-friendly process to recover oil (bitumen) from tar (oil) sands outside of Canada. The process is a non-thermal, mechanical and chemical process using a closed loop system to eliminate emissions. The process technology works equally well on oil-wet (US) tar sands or water-wet (Canadian) tar sands. The Company acquired an exclusive license to use the technology in Canada from Proven Technology in exchange for 1.0 million shares of its restricted common stock in July 2010. The Company signed a Term Sheet on September 1, 2010 to access capital for the construction of a commercial scale demonstration facility and construction of the commercial unit was completed in November 2010 and the Company completed an agreement with an international partner, Clean Sands International, Inc., which included rights to Clean Sands to develop the technology in Canada, Russia, Venezuela, Mexico and Argentina in exchange for a fee paid to the Company of $500,000, an ongoing royalty interest of 2.5% of gross proceeds in the facilities developed by Clean Sands, including a royalty of 1.65% for a facility to be located in the southeastern United States and constructed by Clean Sands. The Company limited its rights to use the technology to the United States as a result of the agreement and consolidated its interest in Arrakis by purchasing its partners. The Company now owns 100% of Arrakis. (See Form 8-K filed February 3, 2011 and incorporated herein by reference.)
The Company acquired e-biofuels, LLC on May 24, 2010, a biodiesel producer located in Middletown, Indiana with a nameplate capacity of 15 million gallons per year. The Company issued 2.0 million shares of its restricted common stock; $3.75 million in four-year term Promissory Notes with an interest rate of 10% and assumed approximately $15 million in debt as a result of the acquisition In May 2011 the principal noteholders converted their principal and accrued interest of approximately $4.0 million into 5,047,461 shares of the Company’s restricted common stock. (See Form 8-K filed May 16, 2011 and incorporated herein by reference.)
The Company signed consulting agreements with two parties in August 2010 and issued 1.4 million shares of its restricted common stock as compensation under the agreements. The consultants’ services are to assist the Company in the development of the Duke Gold Mine in Utah and to assist the Company in website development and maintenance and in the recovery of trade accounts receivable from oil and gas operations and the negotiation of accounts payable within our biofuels subsidiary.
Mr. Malcolm Henley resigned as a director of the Company effective August 16, 2010 due to personal reasons. There were no disputes between Mr. Henley and management of the Company or with its auditors. Mr. John Ryer was approved by the Board to replace Mr. Henley until the next regular shareholders meeting.
In December 2010 the Company agreed to acquire a 26% working interest in the Coquille Bay field and a 25% working interest in the Chrisjo Pipeline that services the Coquille Bay field for 250,000 shares of the Company’s restricted common stock. In addition, the Company agreed to acquire the balance of the pipeline partners’ interest for the issuance of up to 1.25 million additional shares of the Company’s restricted common stock. The purchase of the pipeline and additional interest in Coquille Bay is expected to save the Company approximately $3.00bbl and $1.00/mcf in transportation fees on its future production.
In June 2011, the Company acquired the exclusive rights to manufacture, sell and distribute SANDKLENE 950, the chemical surfactant used in the Arrakis tar sand recovery process in exchange for the payment of $150,000 in cash and 100,000 shares.
5
Table of Contents
In July 2011, Annalee Wilson resigned as a Director of the Company due to personal reasons. There were no disputes between Mrs. Wilson and management of the Company or with its auditors. Mr. Ben Campbell was approved by the Board to replace Mrs. Wilson until the next regular shareholders meeting.
Subsequent Events
On June 9, 2011, the Company entered into an engagement agreement (the “Engagement Agreement”) with Rodman & Renshaw, LLC to act as our exclusive placement agent (the “Placement Agent”) in connection with an offering of the Company’s securities (the “Offering”). On September 21, 2011 (the “Closing Date”), pursuant to a securities purchase agreement (the “Securities Purchase Agreement”), the Company completed the closing of the Offering for total subscription proceeds of $3,177,501.50 through the issuance of (i) 4,236,669 shares of our common stock at a price of $0.75 per share (the “Purchased Shares”) and (ii) five-year warrants (the “Warrants”) exercisable into 2,118,334 shares of common stock (the “Warrants Shares”) equal to 50% of the Purchased Shares at an exercise price of $1.00 per share to certain accredited investors (the “Investors”). The number of shares of common stock to be received upon the exercise of the Warrants and the exercise price of the Warrants are subject to adjustment for reverse and forward stock splits, stock dividends, stock combinations and other similar transactions of the common stock that occur after the Closing Date.
On August 24, 2011 we executed a Letter of Engagement to secure a 2 year feedstock supply agreement for our biodiesel operations in Middletown, Indiana and are working to execute a definitive agreement.
The Company’s management has focused its efforts on the expansion of our biodiesel operations and the development and deployment of new technologies to reduce costs in the production of biodiesel and biofuels, the commercialization and development of our oil sands recovery business and the acquisition and exploitation of energy assets. We believe that the development of multiple forms of energy provides the Company with additional financial flexibility and protection from cycles in the energy commodities.
| ITEM 1A. | Risk Factors. |
In addition to the other information set forth elsewhere in this Form 10-K, you should carefully consider the following factors when evaluating the Company. An investment in the Company is subject to risks inherent in our business. The trading price of the shares of the Company is affected by the performance of our business relative to, among other things, competition, market conditions and general economic and industry conditions. The value of an investment in the Company may decrease, resulting in a loss. The risk factors listed below are not all inclusive.
An investment in us involves a high degree of risk and may result in the loss of all or part of your investment. You should consider carefully all of the information set out in this document and the risks attaching to an investment in us, including, in particular, the risks described below. The information below does not purport to be an exhaustive list and should be considered in conjunction with the contents of the rest of this document.
We have a history of operating losses.
We have had a history of net operating losses. There is no assurance that our current fiscal year results can be sustained.
The federal excise tax credit for biodiesel is set to expire on December 31, 2011 and Congress has not enacted legislation to extend this credit. If the credit is not renewed, our cost of producing biodiesel may increase and our sales price for biodiesel could be reduced, which could have an adverse effect on our financial position.
In October 2004, Congress passed a biodiesel tax incentive, structured as a federal excise tax credit, as part of the American Jobs Creation Act of 2004. The credit amounted to one cent for each percentage point of vegetable oil or animal fat biodiesel that was blended with petrodiesel (and one-half cent for each percentage point of recycled oils and other non-agricultural biodiesel), subsequently amended and increased to one cent. For example, blenders that blended B20 made from soy, canola and other vegetable oils and animal fats received a 20¢ per gallon excise tax credit. The tax incentive generally was taken by petroleum distributors and was passed on to the consumer. It was designed to lower the cost of biodiesel to consumers in both taxable and tax-exempt markets. The tax credit was scheduled to expire at the end of 2006, but was extended in the Energy Policy Act of 2005 to December 31, 2008 and most recently it was extended to December 31, 2011.
Congress did not enact any legislation to extend this tax credit beyond December 31, 2009 and it expired at that time. In December 2009, the United States House of Representatives passed a bill extending this credit to December 31, 2010. On March 10, 2010, the United States Senate passed a similar bill as part of the American Workers, State and Business Relief Act, H.R. 4213. In addition to extending the credit to December 31, 2011, both bills retroactively apply the credit to the beginning of 2010. If the tax credit is not renewed, our biodiesel sales prices will likely decrease by $1.00 per gallon. If biodiesel feedstock costs do not decrease significantly relative to biodiesel prices, we will realize a negative gross margin on biodiesel. As a result, we would cease producing biodiesel, which could have an adverse effect on our financial condition.
The current volatility in global economic conditions and the financial markets may adversely affect our industry, business and results of operations.
The volatility and disruption to the capital and credit markets since mid-2008 have affected global economic conditions, resulting in significant recessionary pressures and declines in consumer confidence and economic growth. These conditions have led to economic contractions in the developed economies and reduced growth rates in the emerging markets. Despite fiscal and monetary intervention, it is possible that further declines in consumer spending and global growth rates may occur in the foreseeable future. Reduced consumer spending may cause changes in customer order patterns including order cancellations, and changes in the level of inventory held by our customers, which may adversely affect our
6
Table of Contents
industry, business and results of operations. The impact of the credit crisis and economic slowdown will vary by region and country. The diversity of our geographic customer and operating footprint limits our reliance and exposure to any single economy.
These conditions have also resulted in a substantial tightening of the credit markets, including lending by financial institutions and other sources of credit and liquidity. This tightening of the credit markets has increased the cost of capital and reduced the availability of credit. Based on our latest discussions, we believe that our sources of credit and liquidity are able to fulfill their commitments to us as of our filing date. We cannot predict, however, how long the current economic and capital and credit market conditions will continue, whether they will deteriorate and which aspects of our products or business could be adversely affected. However, if current levels of economic and capital and credit market disruption and volatility continue or worsen, there can be no assurance that we will not experience an adverse impact, which may be material, on our business, the cost of and access to capital and credit markets, and our results of operations. In addition, we monitor the financial condition of our customers on a regular basis based on public information or data provided directly to us. If the financial condition of one of our major customers was negatively impacted by market conditions or liquidity, we could be adversely impacted in terms of accounts receivable and/or inventory specifically attributable to them.
The industries in which we compete are highly competitive.
The biodiesel industry, as well as the oil and gas business, are highly competitive. There is competition within these industries and also with other industries in supplying the energy, fuel and chemical needs of industry and individual consumers. We will compete with other firms in the sale or purchase of various goods or services in many national and international markets. We will compete with large national and multi-national companies that have longer operating histories, greater financial, technical and other resources and greater name recognition than we do. In addition, we will compete with several smaller companies capable of competing effectively on a regional or local basis, and the number of these smaller companies is increasing. Our competitors may be able to respond more quickly to new or emerging technologies and services and changes in customer requirements. As a result of competition, we may lose market share or be unable to maintain or increase prices for our products and/or services or to acquire additional business opportunities, which could have a material adverse effect on our business, financial condition, results of operations and cash flows. Although we will employ all methods of competition which are lawful and appropriate for such purposes, no assurances can be made that they will be successful. A key component of our competitive position, particularly given the expected commodity-based nature of many of our products, will be our ability to manage expenses successfully, which requires continuous management focus on reducing unit costs and improving efficiency. No assurances can be given that we will be able to successfully manage such expenses.
Our competitive position in the markets in which we participate is, in part, subject to external factors in addition to those that we can impact. Natural disasters, changes in laws or regulations, war or other outbreak of hostilities, or other political factors in any of the countries or regions in which we operate or do business, or in countries or regions that are key suppliers of strategic raw materials, could negatively impact our competitive position and our ability to maintain market share.
Increases in the construction of biodiesel production plants may cause excess biodiesel production capacity in the market. Excess capacity may adversely affect the price at which we are able to sell the biodiesel that we produce and may also adversely affect our anticipated results of operation and financial condition.
In 2008, 2009 and 2010, approximately 700 million gallons; 450-490 million gallons and 315 million gallons, respectively, of biodiesel were produced in the United States. There is a reported 2.49 billion gallons per year of biodiesel production capacity in the United States operated by 173 companies. With such biodiesel production capacity in the United States, compared to historical production levels, there is a risk that there will be a significant amount of excess biodiesel produced in the U.S., which may adversely affect the price at which we are able to sell the biodiesel that we produce and thereby adversely affect our anticipated results of operation and financial condition.
7
Table of Contents
Anti-subsidy and anti-dumping complaints have been filed with the European Commission concerning imports of biodiesel originating in the United States. The existence of such complaints, and an adverse decision by the European Commission, could reduce demand for biodiesel produced in the United States.
Anti-subsidy and anti-dumping complaints have been filed with the European Commission concerning imports of biodiesel originating in the United States. Although we are not a target of such complaints and do not import biodiesel into the European community, the existence of such complaints, and an adverse decision by the European Commission, could reduce demand for biodiesel produced in the United States. Such a reduction in demand could reduce the amount of biodiesel that we sell, which could have an adverse effect on our financial condition.
Fluctuations in commodity prices may cause a reduction in the demand or profitability of the products or services we produce.
Prices for alternative fuels tend to fluctuate widely based on a variety of political and economic factors. These price fluctuations heavily influence the oil and gas industry. Lower energy prices for existing products tend to limit the demand for alternative forms of energy services and related products and infrastructure. Historically, the markets for alternative fuels have been volatile, and they are likely to continue to be volatile. Wide fluctuations in alternative fuel prices may result from relatively minor changes in the supply of and demand for oil and natural gas, market uncertainty and other factors that are beyond our control, including:
| • | worldwide and domestic supplies of oil and gas; |
| • | the price and/or availability of biodiesel feedstocks; |
| • | weather conditions; |
| • | the level of consumer demand; |
| • | the price and availability of alternative fuels; |
| • | the availability of pipeline and refining capacity; |
| • | the price and level of foreign imports; |
| • | domestic and foreign governmental regulations and taxes; |
| • | the ability of the members of the Organization of Petroleum Exporting Countries to agree to and maintain oil price and production controls; |
| • | political instability or armed conflict in oil-producing regions; and |
| • | the overall global economic environment. |
These factors and the volatility of the commodity markets make it extremely difficult to predict future alternative fuel price movements with any certainty. There may be a decrease in the demand for our products or services and our profitability could be adversely affected.
We are reliant on certain strategic raw materials for our operations.
We are reliant on certain strategic raw materials (such as soybean oil, waste greases and fats and methanol) for our operations. We have implemented certain risk management tools, such as a long term supply agreement and hedging, as appropriate, to mitigate short-term market fluctuations in raw material supply and costs. There can be no assurance, however, that such measures will result in cost savings or that all market fluctuation exposure will be eliminated. In addition, natural disasters, changes in laws or regulations, war or other outbreak of hostilities, or other political factors in any of the countries or regions in which we operate or do business, or in countries or regions that are key suppliers of strategic raw materials, could affect availability and costs of raw materials.
While temporary shortages of raw materials may occasionally occur, these items have historically been sufficiently available to cover current requirements. However, their continuous availability and price are impacted by natural disasters, plant interruptions occurring during periods of high demand, domestic and world market and political conditions, changes in government regulation, and war or other outbreak of hostilities. In addition, as we increase our biodiesel capacity, we will require larger supplies of raw materials which have not yet been secured and may not be available for the foregoing reasons, or may be available only at prices higher than current levels. Our operations or products may, at times, be adversely affected by these factors.
8
Table of Contents
Our ability to market our biodiesel may be impaired by capacity constraints, modifications to third party facilities and by weather issues.
We generally sell our biodiesel to large retail outlets such as Element Renewable, Fusion Renewables, Flying J, Pilot and others and much of that product is transported by truck. As such adverse weather conditions or modifications to facilities owned by others could limit our ability to sell our products and result in increased inventories or plant shut-downs.
Changes in technology may render our products or services obsolete.
The alternative fuel industry may be substantially affected by rapid and significant changes in technology. Examples include competitive product technologies, such as green gasoline and renewable diesel produced from catalytic hydroforming of renewable feedstock oils and competitive process technologies such as advanced biodiesel continuous reactor and washing designs that increase throughput. These changes may render obsolete certain existing products, energy sources, services and technologies currently used by us. We cannot assure you that the technologies used by or relied upon by us will not be subject to such obsolescence. While we may attempt to adapt and apply the services provided by us to newer technologies, we cannot assure you that we will have sufficient resources to fund these changes or that these changes will ultimately prove successful.
Failure to comply with governmental regulations could result in the imposition of penalties, fines or restrictions on operations and remedial liabilities.
The biofuel industry subject to extensive federal, state, local and foreign laws and regulations related to the general population’s health and safety and those associated with compliance and permitting obligations (including those related to the use, storage, handling, discharge, emission and disposal of municipal solid waste and other waste, pollutants or hazardous substances or waste, or discharges and air and other emissions) as well as land use and development. Existing laws also impose obligations to clean up contaminated properties or to pay for the cost of such remediation, often upon parties that did not actually cause the contamination. Compliance with these laws, regulations and obligations could require substantial capital expenditures. Failure to comply could result in the imposition of penalties, fines or restrictions on operations and remedial liabilities. These costs and liabilities could adversely affect our operations.
Changes in environmental laws and regulations occur frequently, and any changes that result in more stringent or costly waste handling, storage, transport, disposal or cleanup requirements could require us to make significant expenditures to attain and maintain compliance and may otherwise have a material adverse effect on our business segments in general and on our results of operations, competitive position or financial condition. We are unable to predict the effect of additional environmental laws and regulations which may be adopted in the future, including whether any such laws or regulations would materially adversely increase our cost of doing business or affect our operations in any area.
Under certain environmental laws and regulations, we could be held strictly liable for the removal or remediation of previously released materials or property contamination regardless of whether we were responsible for the release or contamination, or if current or prior operations were conducted consistent with accepted standards of practice. Such liabilities can be significant and, if imposed, could have a material adverse effect on our financial condition or results of operations.
Our biofuels operations may be harmed if the government were to change current laws and regulations.
Alternative fuels businesses benefit from tax credits and government subsidies. If any of the state or federal laws and regulations relating to the tax credits and government subsidies change, the ability to recover capital expenditures from our alternative fuels business could be harmed. Our biofuels platform is subject to federal, state, and local laws and regulations governing the application and use of alternative energy products, including those related specifically to biodiesel. For instance, biodiesel products benefit from being the only alternative fuel certified by the U.S. Environmental Protection Agency that fulfills the requirements of Section 211(B) of the Clean Air Act. If agency determinations, laws, and regulations relating to the application and use of alternative energy are changed, the marketability and sales of biodiesel production could be materially adversely affected.
9
Table of Contents
Market conditions or transportation impediments may hinder access to raw goods and distribution markets.
Market conditions, the unavailability of satisfactory transportation, or the location of our manufacturing complex from more lucrative markets may hinder our access to raw goods and/or distribution markets. The availability of a ready market for biodiesel depends on a number of factors, including the demand for and supply of biodiesel and the proximity of the plant to trucking and terminal facilities. The sale of large quantities of biodiesel necessitates that we transport our biodiesel to other markets since the Indiana regional market is not expected to absorb all of our contemplated production. Currently, common carrier pipelines are not transporting biodiesel. This leaves trucks, barges, and rail cars as the means of distribution of our product from the plant to these storage terminals for further distribution. However, the current availability of rail cars is limited and at times unavailable because of repairs or improvements, or as a result of priority transportation agreements with other shippers. If transportation is restricted or is unavailable, we may not be able to sell into more lucrative markets and consequently our cash flow from sales of biodiesel could be restricted.
The biodiesel industry also faces several challenges to wide biodiesel acceptance, including cold temperature limitations, storage stability, fuel quality standards, and exhaust emissions. If the industry does not satisfy consumers that these issues have been resolved or are being resolved, biodiesel may not gain widespread acceptance which may have an adverse impact on our cash flow from sales of biodiesel.
Our insurance may not protect us against our business and operating risks.
We maintain insurance for some, but not all, of the potential risks and liabilities associated with our business. For some risks, we may not obtain insurance if we believe the cost of available insurance is excessive relative to the risks presented. As a result of market conditions, premiums and deductibles for certain insurance policies can increase substantially and, in some instances, certain insurance policies may become unavailable or available only for reduced amounts of coverage. As a result, we may not be able to renew our existing insurance policies or procure other desirable insurance on commercially reasonable terms, if at all. Although we will maintain insurance at levels we believe are appropriate for our business and consistent with industry practice, we will not be fully insured against all risks which cannot be sourced on economic terms. In addition, pollution and environmental risks generally are not fully insurable. Losses and liabilities from uninsured and underinsured events and delay in the payment of insurance proceeds could have a material adverse effect on our financial condition and results of operations.
If a significant accident or other event resulting in damage to our operations (including severe weather, terrorist acts, war, civil disturbances, pollution, or environmental damage) occurs and is not fully covered by insurance or a recoverable indemnity from a customer, it could adversely affect our financial condition and results of operations.
We depend on key personnel, the loss of any of whom could materially adversely affect our future operations.
Our success will depend to a significant extent upon the efforts and abilities of our executive officers. The loss of the services of one or more of these key employees could have a material adverse effect on us. Our business will also be dependent upon our ability to attract and retain qualified personnel. Acquiring or retaining these personnel could prove more difficult to hire or cost substantially more than estimated. This could cause us to incur greater costs, or prevent us from pursuing our expansion strategy as quickly as we would otherwise wish to do.
We depend heavily on the services of Jeffrey T. Wilson, our chairman, chief executive officer, and chief financial officer and on the services of key management in our biodiesel subsidiary, Craig Ducey, Chad Ducey and Tim Jones. We do not have an employment agreement with any of the parties, and we do not presently have a “key person” life insurance policy on the lives of any of these individuals to offset our losses in the event of their death.
If we are unable to effectively manage the commodity price risk of our raw materials or finished goods, we may have unexpected losses.
We hedge our raw materials and/or finished products for our biofuels segment to some degree to manage the commodity price risk of such items. This requires the purchase or sale of commodity futures contracts and/or options on those contracts or similar financial instruments. We may be forced to make cash deposits available to counterparties as they mark-to-market these financial hedges. This funding requirement may limit the level of commodity price risk management that we are prudently able to complete. If we do not or are not capable of managing the commodity price risk of our raw materials and/or finished products for our biofuels segment, we may incur losses as a result of price fluctuations with respect to these raw materials and/or finished products.
10
Table of Contents
If we are unable to acquire or renew permits and approvals required for our operations, we may be forced to suspend or cease operations altogether.
The operation of our manufacturing plant requires numerous permits and approvals from governmental agencies. We may not be able to obtain all necessary permits (or modifications thereto) and approvals and, as a result, our operations may be adversely affected. In addition, obtaining all necessary renewal permits (or modifications to existing permits) and approvals for future expansions may necessitate substantial expenditures and may create a significant risk of expensive delays or loss of value if a project is unable to function as planned due to changing requirements.
The lack of business diversification may adversely affect our results of operations.
Unlike other entities which may have the resources to complete several business combinations of entities operating in multiple industries or multiple areas of a single industry, it is possible that we will not have the resources to diversify effectively our operations or benefit from the possible spreading of risks or offsetting of losses.
Our indebtedness may limit our ability to borrow additional funds or capitalize on acquisition or other business opportunities.
Our biofuels subsidiary operates under an extension to its credit facility through January 31, 2012. There is no assurance that the bank will grant an additional extension of time if we are unable to secure alternative financing. The restrictions governing this indebtedness may reduce our ability to incur additional indebtedness, engage in certain transactions or capitalize on acquisition or other business opportunities. If we are unable to meet our future debt service obligations and other financial obligations, we could be forced to restructure or refinance such indebtedness and other financial transactions, seek additional equity or sell assets.
We expect to have capital expenditure requirements, and we may be unable to obtain needed financing on satisfactory terms.
We expect to make capital expenditures for the expansion of our biofuels production capacity and complementary infrastructure. We intend to finance these capital expenditures primarily through proceeds from the recent financing, cash flow from our operations and existing cash. However, if our capital requirements vary materially from those provided for in our current projections, we may require additional financing sooner than anticipated. A decrease in expected revenues or adverse change in market conditions could make obtaining this financing economically unattractive or impossible. As a result, we may lack the capital necessary to complete the projected expansions or capitalize on other business opportunities.
We may be unable to successfully integrate future acquisitions with our operations or realize all of the anticipated benefits of such acquisitions.
Failure to successfully integrate future acquisitions, if any, in a timely manner may have a material adverse effect on our business, financial condition, results of operations, and cash flows. The difficulties of combining acquired operations include, among other things:
| • | operating a significantly larger combined organization; |
| • | consolidating corporate technological and administrative functions; |
| • | integrating internal controls and other corporate governance matters; and |
| • | diverting management’s attention from other business concerns. |
In addition, we may not realize all of the anticipated benefits from future acquisitions, such as increased earnings, cost savings, and revenue enhancements, for various reasons, including difficulties integrating operations and personnel, higher and unexpected acquisition and operating costs, unknown liabilities, and fluctuations in markets. If benefits from future acquisitions do not meet the expectations of financial or industry analysts, the market price of our shares of common stock may decline.
11
Table of Contents
Natural gas, and oil prices fluctuate widely, and low prices would have a material adverse effect on our revenues, profitability and growth.
The market price of all energy products remains enormously volatile and recent high prices have been replaced with relatively low prices and all within a few months. Our revenues, profitability and future growth will depend significantly on natural gas and crude oil prices. Prices received also will affect the amount of future cash flow available for capital expenditures and repayment of indebtedness and will affect our ability to raise additional capital. Lower prices may also affect the amount of natural gas, oil and biodiesel that we can economically produce. Factors that can cause price fluctuations include:
| • | The domestic and foreign supply of natural gas and oil. |
| • | Overall economic conditions. |
| • | The level of consumer product demand. |
| • | Adverse weather conditions and natural disasters. |
| • | The price and availability of competitive fuels such as heating oil and coal. |
| • | Political conditions in the Middle East and other natural gas and oil producing regions. |
| • | The level of LNG imports. |
| • | Domestic and foreign governmental regulations. |
| • | Potential price controls and special taxes. |
Natural gas and oil reserves are depleting assets and the failure to replace our reserves would adversely affect our production and cash flows.
Our future natural gas and oil production depends on continuing to make our current properties productive and our success in finding or acquiring new reserves. If we fail to replace reserves, our level of production and cash flows would be adversely impacted. Production from natural gas and oil properties decline as reserves are depleted with the rate of decline depending on reservoir characteristics. Our total proved reserves will decline as reserves are produced unless we conduct other successful exploration and development activities or acquire properties containing proved reserves, or both. Further, the majority of our reserves are proved developed producing. Accordingly, we do not have significant opportunities to increase our production from our existing proved reserves. Our ability to make the necessary capital investment to maintain or expand our asset base of natural gas and oil reserves would be impaired to the extent cash flow from operations is reduced and external sources of capital become limited or unavailable. We may not be successful in exploring for, developing or acquiring additional reserves. If we are not successful, our future production and revenues will be adversely affected.
Reserve estimates depend on many assumptions that may turn out to be inaccurate. Any material inaccuracies in these reserve estimates or underlying assumptions could materially affect the quantities and present values of our reserves.
The process of estimating natural gas and oil reserves is complex and involves a degree of subjective interpretation of technical data and information. It requires analysis of available technical data and the application of various assumptions, including assumptions relating to economic factors. Any significant inaccuracies in these interpretations or assumptions could materially affect the estimated quantities and present value of reserves shown in this report.
In order to prepare these estimates, our independent third party petroleum engineer must project production rates and timing of development expenditures as well as analyze available geological, geophysical, production and engineering data, and the extent, quality and reliability of this data can vary. The process also requires economic assumptions relating to matters such as natural gas and oil prices, drilling and operating expenses, capital expenditures, taxes and availability of funds. Therefore, estimates of natural gas and oil reserves are inherently imprecise.
Actual future production, natural gas and oil prices, revenues, taxes, development expenditures, operating expenses and quantities of recoverable natural gas and oil reserves most likely will vary from our estimates. Any significant variance could materially affect the estimated quantities and pre-tax net present value of reserves shown in this report. In addition, estimates of our proved reserves may be adjusted to reflect production history, results of exploration and development, prevailing natural gas and oil prices and other factors, many of which are beyond our control. Some of the producing wells included in our reserve report have produced for a relatively short period of time. Because some of our reserve estimates are not based on a lengthy production history and are calculated using volumetric analysis, these estimates are less reliable than estimates based on a more lengthy production history.
You should not assume that the pre-tax net present value of our proved reserves prepared in accordance with SEC guidelines referred to in this report is the current market value of our estimated natural gas and oil reserves. We base the pre-tax net present value of future net cash flows from our proved reserves on prices and costs on the date of the estimate. Actual future prices, costs, taxes and the volume of produced reserves may differ materially from those used in the pre-tax net present value estimate.
12
Table of Contents
Exploration is a high risk activity, and our participation in drilling activities may not be successful.
Our future success will largely depend on the success of our exploration drilling program. Participation in exploration drilling activities involves numerous risks, including the risk that no commercially productive natural gas or oil reservoirs will be discovered. The cost of drilling, completing and operating wells is often uncertain, and drilling operations may be curtailed, delayed or canceled as a result of a variety of factors, including:
| • | Unexpected drilling conditions. |
| • | Blowouts, fires or explosions with resultant injury, death or environmental damage. |
| • | Pressure or irregularities in formations. |
| • | Equipment failures or accidents. |
| • | Tropical storms, hurricanes and other adverse weather conditions. |
| • | Compliance with governmental requirements and laws, present and future. |
| • | Shortages or delays in the availability of drilling rigs and the delivery of equipment. |
Even when properly used and interpreted, 3-D seismic data and visualization techniques are only tools used to assist geoscientists in identifying subsurface structures and hydrocarbon indicators. They do not allow the interpreter to know conclusively if hydrocarbons are present or economically producible. Poor results from our drilling activities would materially and adversely affect our future cash flows and results of operations.
In addition, as a “successful efforts” company, we choose to account for unsuccessful exploration efforts (the drilling of “dry holes”) and seismic costs as a current expense of operations, which immediately impacts our earnings. Significant expensed exploration charges in any period would materially adversely affect our earnings for that period and cause our earnings to be volatile from period to period.
The natural gas and oil business involves many operating risks that can cause substantial losses.
The natural gas and oil business involves a variety of operating risks, including:
| • | Blowouts, fires and explosions. |
| • | Surface cratering. |
| • | Uncontrollable flows of underground natural gas, oil or formation water. |
| • | Natural disasters. |
| • | Pipe and cement failures. |
| • | Casing collapses. |
| • | Stuck drilling and service tools. |
| • | Abnormal pressure formations. |
| • | Environmental hazards such as natural gas leaks, oil spills, pipeline ruptures or discharges of toxic gases and liquids. |
If any of these events occur, we could incur substantial losses as a result of:
| • | Injury or loss of life. |
| • | Severe damage to and destruction of property, natural resources or equipment. |
| • | Pollution and other environmental damage. |
| • | Clean-up responsibilities. |
| • | Regulatory investigations and penalties. |
| • | Suspension of our operations or repairs necessary to resume operations. |
Offshore operations are subject to a variety of operating risks peculiar to the marine environment, such as capsizing and collisions. In addition, offshore operations, and in some instances, operations along the Gulf Coast, are subject to damage or loss from hurricanes or other adverse weather conditions. These conditions can cause substantial damage to facilities and interrupt production. As a result, we could incur substantial liabilities that could reduce the funds available for exploration, development or leasehold acquisitions, or result in loss of properties.
13
Table of Contents
If we were to experience any of these problems, it could affect well bores, platforms, gathering systems and processing facilities, any one of which could adversely affect our ability to conduct operations. In accordance with customary industry practices, we maintain insurance against some, but not all, of these risks. Losses could occur for uninsurable or uninsured risks or in amounts in excess of existing insurance coverage. We may not be able to maintain adequate insurance in the future at rates we consider reasonable, and particular types of coverage may not be available. An event that is not fully covered by insurance could have a material adverse effect on our financial position and results of operations.
Not hedging our oil and gas production may result in losses.
Due to the significant volatility in natural gas and oil prices and the potential risk of significant hedging losses if NYMEX natural gas and oil prices spike on the date options settle, our oil and gas production is not currently hedged. By not hedging our production, we may be more adversely affected by declines in natural gas and oil prices than our competitors who engage in hedging arrangements. We do have short term hedges in place for our biodiesel production to cover the period of time from which we purchase the feedstock and produce the biodiesel product. Typically these hedges are in place for less than 30 days and do not provide any long-term protection from volatility.
Our ability to market our natural gas and oil may be impaired by capacity constraints on the gathering systems and pipelines that transport our natural gas and oil.
All of our natural gas and oil is transported through gathering systems and pipelines, which we do not own. Transportation capacity on gathering systems and pipelines is occasionally limited and at times unavailable due to repairs or improvements being made to these facilities or due to capacity being utilized by other natural gas or oil shippers that may have priority transportation agreements. If the gathering systems or our transportation capacity is materially restricted or is unavailable in the future, our ability to market our natural gas or oil could be impaired and cash flow from the affected properties could be reduced, which could have a material adverse effect on our financial condition and results of operations.
We have no conclusive assurance of title to our oil and gas leased interests.
Our practice in acquiring exploration leases or undivided interests in natural gas and oil leases is to not incur the expense of retaining title lawyers to examine the title to the mineral interest prior to executing the lease. Instead, we rely upon the judgment of third party landmen to perform the field work in examining records in the appropriate governmental, county or parish clerk’s office before leasing a specific mineral interest. This practice is widely followed in the industry. Prior to the drilling of an exploration well the operator of the well will typically obtain a preliminary title review of the drillsite lease and/or spacing unit within which the proposed well is to be drilled to identify any obvious deficiencies in title to the well and, if there are deficiencies, to identify measures necessary to cure those defects to the extent reasonably possible. We have no assurance, however, that any such deficiencies have been cured by the operator of any such wells. It does happen, from time to time, that the examination made by title lawyers reveals that the lease or leases are invalid, having been purchased in error from a person who is not the rightful owner of the mineral interest desired. In these circumstances, we may not be able to proceed with our exploration and development of the lease site or may incur costs to remedy a defect. It may also happen, from time to time, that the operator may elect to proceed with a well despite defects to the title identified in the preliminary title opinion.
Competition in the energy industry is intense, and we are smaller and have a more limited operating history than most of our competitors.
We compete with a broad range of energy companies in our activities. We also compete for the equipment and labor required to operate and to develop these properties. Most of our competitors have substantially greater financial resources than we do. These competitors may be able to pay more for exploratory prospects and productive natural gas and oil properties. Further, they may be able to evaluate, bid for and purchase a greater number of properties and prospects than we can. Our ability to explore for natural gas and oil and to acquire additional properties in the future will depend on our ability to evaluate and select suitable properties and to consummate transactions in this highly competitive environment. In addition, most of our competitors have been operating for a much longer time than we have and have substantially larger staffs. We may not be able to compete effectively with these companies or in such a highly competitive environment.
14
Table of Contents
We are subject to complex laws and regulations, including environmental regulations that can adversely affect the cost, manner or feasibility of doing business.
Our operations are subject to numerous laws and regulations governing the operation and maintenance of our facilities and the discharge of materials into the environment. Failure to comply with such rules and regulations could result in substantial penalties and have an adverse effect on us. These laws and regulations may:
| • | Require that we obtain permits before commencing drilling. |
| • | Restrict the substances that can be released into the environment in connection with drilling and production activities. |
| • | Limit or prohibit drilling activities on protected areas, such as wetlands or wilderness areas. |
| • | Require remedial measures to mitigate pollution from former operations, such as plugging abandoned wells. |
Under these laws and regulations, we could be liable for personal injury and clean-up costs and other environmental and property damages, as well as administrative, civil and criminal penalties. We maintain only limited insurance coverage for sudden and accidental environmental damages. Accordingly, we may be subject to liability, or we may be required to cease production from properties in the event of environmental damages. These laws and regulations have been changed frequently in the past. In general, these changes have imposed more stringent requirements that increase operating costs or require capital expenditures in order to remain in compliance. It is also possible that unanticipated factual developments could cause us to make environmental expenditures that are significantly different from those we currently expect. Existing laws and regulations could be changed and any such changes could have an adverse effect on our business and results of operations.
We cannot control the activities on properties we do not operate.
Other companies currently operate properties in which we have an interest. As a result, we have a limited ability to exercise influence over operations for these properties or their associated costs. Our dependence on the operator and other working interest owners for these projects and our limited ability to influence operations and associated costs could materially adversely affect the realization of our targeted returns on capital in drilling or acquisition activities. The success and timing of our drilling and development activities on properties operated by others therefore depend upon a number of factors that are outside of our control, including:
| • | Timing and amount of capital expenditures. |
| • | The operator’s expertise and financial resources. |
| • | Approval of other participants in drilling wells. |
| • | Selection of technology. |
Acquisition prospects are difficult to assess and may pose additional risks to our operations.
We expect to evaluate and, where appropriate, pursue acquisition opportunities on terms our management considers favorable. Acquisition of biodiesel facilities will depend on facility cost versus replacement value, proximity to feedstocks and to retail markets, rail access, operating systems and costs and potential environmental liabilities. We expect to pursue acquisitions that have the potential to increase our biodiesel production and our domestic natural gas and oil reserves. The successful acquisition of natural gas and oil properties requires an assessment of various of the following:
| • | Recoverable reserves. |
| • | Exploration potential. |
| • | Future natural gas and oil prices. |
| • | Operating costs. |
| • | Potential environmental and other liabilities and other factors. |
| • | Permitting and other environmental authorizations required for our operations. |
In connection with such an assessment, we would expect to perform a review of the subject properties that we believe to be generally consistent with industry practices. Nonetheless, the resulting conclusions are necessarily inexact and their accuracy inherently uncertain, and such an assessment may not reveal all existing or potential problems, nor will it necessarily permit a buyer to become sufficiently familiar with the properties to fully assess their merits and deficiencies. Inspections may not always be performed on every platform or well, and structural and environmental problems are not necessarily observable even when an inspection is undertaken.
15
Table of Contents
Future acquisitions could pose additional risks to our operations and financial results, including:
| • | Problems integrating the purchased operations, personnel or technologies. |
| • | Unanticipated costs. |
| • | Diversion of resources and management attention from our exploration business. |
| • | Entry into regions or markets in which we have limited or no prior experience. |
| • | Potential loss of key employees, particularly those of the acquired organizations. |
We do not currently intend to pay dividends on our common stock.
We have never declared or paid a dividend on our common stock and do not expect to do so in the foreseeable future. Our current plan is to retain any future earnings for funding growth, and, therefore, holders of our common stock will not be able to receive a return on their investment unless they sell their shares.
Anti-takeover provisions of our certificate of incorporation, bylaws and Nevada law could adversely affect a potential acquisition by third parties that may ultimately be in the financial interests of our stockholders.
Our certificate of incorporation, bylaws and the Nevada General Corporation Law contain provisions that may discourage unsolicited takeover proposals. These provisions could have the effect of inhibiting fluctuations in the market price of our common stock that could result from actual or rumored takeover attempts, preventing changes in our management or limiting the price that investors may be willing to pay for shares of common stock. These provisions, among other things, authorize the board of directors to:
| • | Designate the terms of and issue new series of preferred stock. |
| • | Limit the personal liability of directors. |
| • | Limit the persons who may call special meetings of stockholders. |
| • | Prohibit stockholder action by written consent. |
| • | Establish advance notice requirements for nominations for election of the board of directors and for proposing matters to be acted on by stockholders at stockholder meetings. |
| • | Require us to indemnify directors and officers to the fullest extent permitted by applicable law. |
| • | Impose restrictions on business combinations with some interested parties. |
Our common stock is thinly traded.
We have approximately 34.9 million shares of common stock outstanding, held by approximately 625 holders of record. Directors, officers and management own or have voting control over approximately 11.8 million shares. Since our common stock is thinly traded, the purchase or sale of relatively small common stock positions may result in disproportionately large increases or decreases in the price of our common stock.
Item 2. Financial Information about Segments
Unless otherwise noted, the financial data presented herein represents our consolidated operations for the twelve-month periods ended July 31, 2011, July 31, 2010, and July 31, 2009. The following table sets forth: (i) our consolidated revenues for the years ended July31, 2011, 2010 and 2009; (ii) our consolidated net income for the years ended July 31, 2011, 2010 and 2009; and (iii) our total assets at July 31, 2011, 2010, and 2009.
(Dollars in thousands)
| Period |
Revenues | Net Income | Total Assets | |||||||||
| Year ended July 31, 2011 |
$ | 109,972 | $ | 6,075 | $ | 24,534 | ||||||
| Year ended July 31, 2010 |
$ | 5,660 | $ | (17,818 | ) | $ | 13,134 | |||||
| Year ended July 31, 2009 |
$ | 1,069 | $ | 10,785 | $ | 3,139 | ||||||
We have two business reporting “segments” as defined by U.S. generally accepted accounting principles: chemicals and biofuels. We are not able to allocate net income and total assets between these two business segments. However, revenues from external customers and gross margins can be allocated between the two business segments as set forth in the following chart.
16
Table of Contents
(Dollars in thousands)
| Period |
Biodiesel Revenues |
Oil/Gas Revenues |
Total Revenues |
Gross Biodiesel Margin |
Gross Oil/ Gas Margin |
Gross Margin |
||||||||||||||||||
| Year ended July 31, 2011 |
$ | 109,573 | 399 | 109,972 | 10,467 | (2,427) | 8,040 | |||||||||||||||||
| Year ended July 31, 2010 |
$ | 5,501 | 159 | 5,660 | (15,717) | (1,363) | (17,080) | |||||||||||||||||
| Year ended July 31, 2009 |
$ | 0 | 1,069 | 1,069 | 0 | (436) | (436) | |||||||||||||||||
Narrative Description of the Business
Principal Executive Offices
Our principal executive offices are located at 101 NW First Street, Suite 213, Evansville, IN 47708. Our telephone number is (812) 867-1433. We have 3 full-time employees at our headquarters location. Our wholly-owned subsidiary, e-Biofuels LLC is located at 710 Norfleet Drive, Middletown, IN 47356. Its telephone number is (765) 810-4751. We have 45 full-time and part-time employees at the biodiesel facility. Our wholly-owned subsidiary, Imperial Chemical Company’s principal executive offices are located at 4533 Brittmoore Road, Houston, TX 77032. Its telephone number at such office is (713) 204-6907. We have one employee at this location. Our oil and natural gas facilities are located in Webster Parish, Louisiana and Plaquemines Parish Louisiana and all of our staff at these locations are independent contractors.
The Company
Our common stock is quoted on the OTCQX under the symbol “IPMN”. Our warrants are not listed or quoted on any national exchange or any other price quotation system. We own approximately 6 acres of land located in Middletown, Indiana about 35 miles northwest of Indianapolis, Indiana. The biodiesel facility sits on a 6-acre plot and is estimated at 28,800 square feet. The general office, administration space and laboratory comprises 2,800 square feet, approximately 13,000 square feet is production space, and 13,000 square feet is used for storage. This facility currently has the capacity to produce approximately 30-35 million gallons of biodiesel annually.
For the year ended July 31, 2011 approximately 99.6% of our revenues were generated from the sale of biodiesel from our Middletown plant. We are committed to growing the biodiesel and biofuels business and our non-traditional oil business, through our wholly-owned subsidiary, Arrakis Oil Recovery, LLC. We intend to: (i) increase production capacity of biodiesel as set forth above, and will make future capacity expansions when market conditions support such an increase; and (ii) pursue commercialization of other products, including renewable boiler fuels. In pursuing this strategy, we will continue to establish a name identity in the biofuels business, leverage our technical capabilities and quality certifications, secure local and regional markets and expand marketing efforts to fleets and regional/national customers. Concurrent efforts will also seek to enhance margins via: (i) volume increases; (ii) conversion cost reductions by transition to lower cost feedstocks and economies of scale; (iii) expansion of feedstock options through technology enhancements; (iv) legislative incentives; and (v) value-enhancing applications for glycerin co-product (from the biodiesel manufacturing process).
Overview
Our biofuels segment was established in early 2006, under the wholly-owned subsidiary, Hoosier Biodiesel Company, as an initiative of the management team to leverage technical and research expertise into viable renewable energy products and ultimately to leverage our expertise into a manufacturing facility to pursue business growth opportunities. After several years of research and development efforts, we developed several proprietary and a patent-pending technology
17
Table of Contents
related to biodiesel and renewable biofuels. In May 2010, we completed the acquisition of e-Biofuels, LLC as a wholly-owned subsidiary of the Company and entered the manufacturing side of the business. The biofuels segment had revenue of $109,573,555 for the year ended July 31, 2011 and $5,541,320 for the year ended July 31, 2010.
Biofuel Products
Our biofuels business segment currently targets ASTM transportation quality biodiesel. We generally sell B100 to our customers. A by-product of the biodiesel production process is glycerine which is generally sold in its crude form. Biodiesel is a sustainable, renewable transportation fuel with a growing market in the United States and internationally.
Key Advantages of Biodiesel
| 1. | Biodiesel is the only alternative fuel that runs in any conventional, unmodified diesel engine. It can be stored exactly like petroleum diesel. |
| 2. | Biodiesel can be used alone or mixed in any ratio with petroleum diesel. |
| 3. | The use of biodiesel can extend the life of diesel engines because it is more lubricating than petroleum diesel fuel, while fuel consumption, auto ignition, power output, and engine torque are relatively unaffected. It is estimated that a bio-diesel blend of just 1% could increase fuel lubricity by as much as 65% (U.S. DOE Office of Transportation Technology). |
| 4. | Biodiesel is safe to handle and transport because it is as biodegradable as sugar (pure biodiesel degrades 85% to 88% in water within 28 days), 10 times less toxic than table salt (lethal dose is greater than 17.4 g/kg body weight, while for salt (NaCl) it is 1.8 g/Kg), and has a high flashpoint of about 200°C compared to petroleum diesel fuel, which has a flash point of 70°C. |
| 5. | Biodiesel is a proven fuel with over 20 years of use in Europe and 30 million successful US road miles. |
| 6. | Biodiesel use does not affect engine manufacturer warranties. |
| 7. | Combustion of biodiesel provides over a 75- 90% reduction in environmental pollution and a 90% reduction in cancer risks. |
| 8. | Biodiesel is the only alternative fuel to meet all environmental and human health requirements for energy sources. |
Key Disadvantages of Biodiesel
| 1. | Biodiesel increases NOx emissions by as much as 13% for B100 use. |
| 2. | Biodiesel has poorer cold flow properties than petroleum diesel. A 20 percent blend of soy-based biodiesel with petrol diesel raises the freezing properties approximately 3° to 5° F (pour point, cloud point, cold filter plugging point). |
| 3. | Biodiesel has a shorter shelf life than petrol diesel. |
Biodiesel Feedstock Considerations
Biodiesel can be produced from a variety of feedstocks including virgin oils, such as soy oil, canola, rapeseed, palm oil, peanut oil or similar materials. It can also be produced from fats and waste greases and oils such as used restaurant oil, trap grease, chicken fat, beef or other animal fats, inedible corn oil and tall oil from the pulp and paper industry. The table below provides the fuel related properties of certain oils:
18
Table of Contents
Fuel-related properties and iodine values of various fats and oils.a
| Oil or Fat |
Iodine Value |
CN |
HG (kJ/kg) |
Viscosity (mm2/s) |
CP (°C) |
PP (°C) |
FP (°C) | |||||||
| Babassu |
10-18 | 38 | ||||||||||||
| Castor |
82-88 | ? | 39500 | 297 (38°) | — | -31.7 | 260 | |||||||
| Coconut |
6-12 | |||||||||||||
| Corn |
103-140 | 37.6 | 39500 | 34.9 (38°) | -1.1 | -40.0 | 277 | |||||||
| Cottonseed |
90-119 | 41.8 | 39468 | 33.5 (38°) | 1.7 | -15.0 | 234 | |||||||
| Crambe |
93 | 44.6 | 40482 | 53.6 (38°) | 10.0 | -12.2 | 274 | |||||||
| Linseed |
168-204 | 34.6 | 39307 | 27.2 (38°) | 1.7 | -15.0 | 241 | |||||||
| Olive |
75-94 | |||||||||||||
| Palm |
35-61 | 42 | ||||||||||||
| Peanut |
80-106 | 41.8 | 39782 | 39.6 (38°) | 12.8 | -6.7 | 271 | |||||||
| Rapeseed |
94-120 | 37.6 | 39709 | 37.0 (38°) | -3.9 | -31.7 | 246 | |||||||
| Safflower |
126-152 | 41.3 | 39519 | 31.3 (38°) | 18.3 | -6.7 | 260 | |||||||
| High-oleic safflower |
90-100 | 49.1 | 39516 | 41.2 (38°) | -12.2 | -20.6 | 293 | |||||||
| Sesame |
104-120 | 40.2 | 39349 | 35.5 (38°) | -3.9 | -9.4 | 260 | |||||||
| Soybean |
117-143 | 37.9 | 39623 | 32.6 (38°) | -3.9 | -12.2 | 254 | |||||||
| Sunflower |
110-143 | 37.1 | 39575 | 37.1 (38°) | 7.2 | -15.0 | 274 | |||||||
| Tallow |
35-48 | — | 40054 | 51.15 (40°) | — | — | 201 | |||||||
| No. 2 DF |
47 | 45343 | 2.7 (38°) | -15.0 | -33.0 | 52 | ||||||||
a) Iodine values combined from Refs. 176 and 181. Fuel properties from Ref. 11. All tallow values from Ref. 177 (No CN given in Ref. 177, calculated. cetane index 40.15).
Under the Renewable Fuel Standard (RFS2) implemented by the Federal government and managed by the Environmental Protection Agency (EPA), producers that are certified under the program, must be able to demonstrate that the feedstocks they use have a designated pathway for RIN generation (the Renewable Information Number assigned to each certified facility is used to track compliance with RFS2) under the law. (Certain of the feedstocks mentioned above do not qualify under RFS2 as discussed later under Legislative Incentives.) Our ability to use a wide range of feedstocks gives us the flexibility to quickly respond to changes in feedstock pricing to maintain our feedstock cost advantage. We have the ability to modify our processing system to accommodate different feedstocks and feedstock mixes. Our plant generally runs on a singular feedstock at any point in time, although we have mixing capability. As different feedstocks are delivered to the plant, they are segregated into our feedstock storage tanks, tested and the plant is tuned to optimize the processing of that specific feedstock.
19
Table of Contents
In the past, we procured our feedstocks from numerous vendors in small to medium quantities, however, more recently our we have begun using Green Grease Solutions as our primary supplier to minimize administrative costs and improve logistics. While soy oil has an established and visible futures market, there is no established futures market for lower cost feedstocks. We generally purchase inedible animal fats and used cooking oil and other products on a freight delivered basis and almost all of our purchases of feedstocks are indexed to the New York Mercantile Exchange( NYMEX) heating oil index. As mentioned earlier, we are completing an agreement designed to secure a two year feedstock purchase arrangement that would fully load the plant in Middletown. This arrangement and relationship will give us an advantage over our competition in procuring reliable volumes of lower cost feedstock at competitive prices. Higher cost virgin vegetable oil feedstocks like soybean oil can be purchased on a spot or forward contract basis from a number of suppliers.
Quality Control: BQ-9000
The BQ-9000 program was launched in late 2005 by the National Biodiesel Board through the National Biodiesel Accreditation Commission, which has full autonomy and design implementation over BQ-9000 certification. The program requires certified and accredited companies to possess a quality manual and quality control system and employ best practices in biodiesel sampling, testing, blending, shipping, storage and distribution. The goal of the program is to help assure quality of biodiesel from plant gate to consumer tank. We are a BQ 9000 certified facility. Consistent with BQ-9000, all manufactured product is tested in an on-site quality control laboratory and confirmed to meet the ASTM D6751 standard. In addition, to insure that we maintain the highest standards of care for our customers’ protection, we retain a physical sample of each load of biodiesel that is shipped from our facility in air-tight containers so that if any of our customers have an issue with the fuel they received from multiple sources, we can immediately re-test our sample to demonstrate the quality of our delivered fuel.
Customers and Markets
We currently market our biodiesel products by truck and rail directly to customers in the United States. The Company sells its biodiesel to a number of companies under short term contracts, usually three months or less. During the fiscal year ended July 31, 2011, the Companies’ major customers were: 36.3% to Fusion Renewables; 24.5% to Element Renewable Energy and 17.1% to Pilot. For the fiscal year ended July 31, 2010, the Company sales were divided as follows: 29.8% to Pilot, 26.4% to RKA Petroleum and 20.6% to Flying J. Because of the legislative mandate under RFS2, the Company does not believe that the loss of any of these purchasers would have a material adverse effect on the Company’s sales because we believe that sufficient alternative markets exist.
Competition
There are many companies and individuals engaged in the biodiesel business. Some are very large and well established with substantial capabilities and long earnings records. The Company is at a competitive disadvantage with some other firms and individuals in purchasing additional biodiesel facilities, since they have greater financial resources and larger technical staffs than the Company. In addition, in recent years a number of new small companies have been formed which have objectives similar to those of the Company and which present substantial competition to the Company.
A number of factors, beyond the Company’s control and the effect of which cannot be accurately predicted, affect the production and marketing of biodiesel. These factors include crude oil imports, actions by foreign oil producing nations, the availability of adequate pipeline and other transportation facilities, the marketing of competitive fuels and other matters affecting the availability of ready market, such as fluctuating supply and demand.
The Biodiesel Board reports there is currently about 2.44 billion gallons of production capacity in the United States , although only approximately 311 million gallons of biodiesel were actually produced in 2010. We produced approximately 26.4 million gallons or an estimated 1.1% of the nameplate capacity in the United States. We compete with other producers of biodiesel, both locally, regionally and nationally. There are a total of five biodiesel plants in the state of Indiana with a nameplate capacity of 106 MMGPY. The largest plant in Indiana has a capacity of 80 MMGPY.
20
Table of Contents
Supply and Distribution
As a result of our feedstock-flexible process, we are able to source feedstock from a broad supplier base which includes pork, chicken and beef rendering facilities from both national and regional suppliers. Soybean oil has been sourced from several national and regional producers. All feedstocks are currently supplied by truck to the plant. In fiscal 2011 96.7% of our feedstock was supplied by Cima Energy while Green Grease Solutions supplied 3%. As we indicated previously, we are negotiating a two year supply agreement to adequately load our facility to capacity. We believe that we have access to an adequate supply of feedstocks to support anticipated production and expansions.
Biodiesel is sold from the plant site by truck and transshipped to a rail terminal approximately 9.5 miles from the plant for shipment by rail. We currently operate a fleet of 15 Company-owned trucks and lease 12 rail cars to deliver biodiesel.
Cyclicality and Seasonality
Because of the location and logistics associated with our facility in Middletown, we experience some seasonality related to transportation and delivery of feedstocks and biodiesel. In fiscal 2011 we experienced some weather-related downtime due to the severity of the winter that year. We estimate that the seasonal issues resulted in the loss of sales of about 2.5% for fiscal 2011 and generally affected the months of January, February and March.
Government Contracts
The Company’s biodiesel business is not subject to re-negotiation of profits or termination of contracts or subcontracts at the election of the Government, as we currently do not have any contracts with federal, state or local entities. We are however qualified as an Advanced Biofuels Producer under the 2008 USDA Advanced Biofuels Program (Section 9005) and as a result we receive certain incentive payments under the program. Under the Program, the USDA allocates certain funds to be paid to qualifying producers based on their percentage of the total qualified production from October 1-September 30 of each year beginning with 2009 through 2012. The allocated funds for the 2010 period were $55 million, for the 2011 period $85 million and for the 2012 period are proposed to be $120 million. The Company received $0.05 million for the 2009 period; $1.53 million for the 2010 period and $1.62 million through the first eleven months of the 2011 period.
Regulation
Federal, state and local authorities extensively regulate the biofuels industry. Legislation affecting this industry is under constant review for amendment or expansion. Numerous departments and agencies, both federal and state, have issued rules and regulations binding on the biofuels industry and their individual members some of which carry substantial penalties for the failure to comply. As discussed below, the most notable regulatory oversight is associated with compliance of RFS2 administered by the EPA. The regulatory burden on this industry increases the cost of doing business and consequently, affects profitability. Inasmuch as such laws and regulations are frequently amended or reinterpreted, the Company is unable to predict the future cost or impact of complying with such regulations.
The Company’s operations are subject to extensive federal, state and local laws and regulations relating to the generation, storage, handling, emission, transportation and discharge of materials into the environment. Permits are required for our biodiesel operations, including air and water permits, and these permits are subject to revocation, modification and renewal by issuing authorities. Governmental authorities have the power to enforce compliance with their regulations and violations are subject to fines, injunctions or both. It is possible that increasingly strict requirements will be imposed by environmental laws and enforcement policies hereunder. The Company is also subject to laws and regulations concerning occupational safety and health. It is not anticipated that the Company will be required in the near future to expend amounts that are material in the aggregate to the Company’s overall operations by reason of environmental or occupational safety and health laws and regulations but inasmuch as such laws and regulations are frequently changed, the Company is unable to predict the ultimate cost of compliance.
Regulation of the transportation fuels industry which affects our biodiesel operations is particularly intense and constantly changing. Mandated fuel mileage and changes in emissions standards by the EPA of the Department of Transportation could have material repercussions to the manufacture and sale of biodiesel and other renewable fuels for transportation use. The Renewable Fuels Standard, recently passed by Congress has already had a significant impact on demand as discussed under “Legislative Incentives”.
21
Table of Contents
Legislative Incentives Affecting Biodiesel
Agencies of the United States government, including the Department of Energy, the Environmental Protection Agency, the Internal Revenue Service and the Department of Agriculture, and many states offer biodiesel incentives or have mandates for the use of biodiesel, or both. There are other governmental incentives that do not directly reduce the net cost of producing or blending biodiesel but that drive the demand for biodiesel. For example, tax credits are available under the Internal Revenue Code for investment in qualifying refueling property, the Environmental Protection Agency will pay 50-100% of the cost for schools to upgrade and/or replace their buses, and programs administered by the Department of Energy indirectly require government fleet operators to purchase substantial amounts of biodiesel. The principal federal incentives that we believe will have the greatest positive effect on our business are discussed below.
The Energy Policy Act of 1992 requires government fleet operators to use a certain percentage of alternatively fueled vehicles. The Act established a goal of replacing 10% of motor fuels with non-petroleum alternatives by 2000, increasing to 30% by the year 2010. Currently, 75% of all new light-duty federal vehicles purchased are required to have alternative fuel capability to set an example for the private automotive and fuel industries.
Under the Energy Conservation Reauthorization Act of 1998, vehicle fleets that are required to purchase alternatively fueled vehicles can generate credit toward this requirement by purchasing and using biodiesel in a conventional vehicle. Since there are few cost-effective options for purchasing heavy-duty alternatively fueled vehicles, federal and state fleet providers can meet up to 50% of their heavy-duty alternatively fueled vehicle purchase requirements with biodiesel. The biodiesel fuel credit allows fleets to purchase and use 450 gallons of biodiesel in vehicles in excess of 8,500 pounds gross vehicle weight instead of alternatively fueled vehicles. Fleets must purchase and use the equivalent of 450 gallons of pure biodiesel in a minimum of a 20% blend to earn one credit. Covered fleets earn one vehicle credit for every light-duty alternatively fueled vehicle they acquire annually beyond their base vehicle acquisition requirements. Credits can be banked or sold.
In October 2004, Congress passed a biodiesel tax incentive, structured as a federal excise tax credit, as part of the American Jobs Creation Act of 2004. The credit amounted to one cent for each percentage point of vegetable oil or animal fat biodiesel that was blended with petrodiesel (and one-half cent for each percentage point of recycled oils and other non-agricultural biodiesel). For example, blenders that blended B20 made from soy, canola and other vegetable oils and animal fats received a 20¢ per gallon excise tax credit, while biodiesel made from recycled restaurant oils (yellow grease) received half of this credit. The tax incentive generally was taken by petroleum distributors and was substantially passed on to the consumer and is referred to in the industry as the Blender’s Tax Credit. It was designed to lower the cost of biodiesel to consumers in both taxable and tax-exempt markets. The tax credit was scheduled to expire at the end of 2006, but was extended in the Energy Policy Act of 2005 to the end of 2008 and subsequently extended to December 31, 2009 through the Emergency Economic Stabilization Act of 2008. This Act also revised the credit for recycled oils from a half credit to a full credit and qualified all biodiesel for a $1.00 per gallon tax credit, including biodiesel made from non-virgin feedstocks such as yellow grease. ( As noted above, prior legislation limited the tax credit for biodiesel manufactured from non-virgin feedstocks to $0.50 per gallon). The tax credit expired on December 31, 2009 but was renewed retroactively in 2010 and is set to expire again at the end of 2011. The Blenders’ Tax Credit provides a $1.00 per gallon excise tax credit to the first person who blends the biodiesel with at least 0.1% petroleum-based diesel fuel. The blenders’ tax credit can then be credited against such blender’s federal excise tax liability or the blender can obtain a cash refund from the United States Treasury for the value of the credit.
RFS1
Congress enacted the Energy Policy Act of 2005 in August 2005 and included a number of provisions intended to spur the production and use of biodiesel. In particular, the Act’s provisions include biodiesel as part of the minimum volume of renewable fuels (the renewable fuels standard or “RFS1”), in the nationwide gasoline and diesel pool, with the Environmental Protection Agency being directed to determine the share to be allocated to biodiesel and other details through its rulemaking process. The Act also extended the biodiesel tax credit to 2008 and included a new tax credit for renewable diesel. More specifically, the RFS requires a specific amount of renewable fuel to be used each year in the nationwide gasoline and diesel pool. The volume increases each year, from 4 billion gallons per year in 2006 to 7.5 billion gallons per year in 2012. The Act required the EPA, beginning in 2006, to publish by November 30 th of each year, “renewable fuel obligations” that will be applicable to refineries, blenders and importers in the contiguous 48 states. There must be no geographic restrictions on where renewable fuel may be used or per-gallon obligations for the use of renewable fuel. The renewable fuel obligations are required to be expressed in terms of a volume percentage of gasoline sold or introduced into commerce and consist of a single applicable percentage that will apply to all categories of refineries, blenders and importers. The renewable fuel obligations are to be based on estimates that the Energy Information Association provides to the Environmental Protection Agency on the volumes of gasoline it expects will be sold or introduced into commerce. The
22
Table of Contents
Environmental Protection Agency released the final rules to implement the RFS on April 10, 2007. Under those rules, the RFS compliance period did not begin until September 1, 2007. The applicable volume of renewable fuel under this program was 4.7 billion gallons for 2007, 5.4 billion gallons for 2008, 11.1 billion gallons for 2009, and 12.95 billion gallon for 2010.
The Energy Policy Act of 2005 also created a new tax credit for small agri-biodiesel producers with production capacity not in excess of 60 million gallons, of 10¢ per gallon for the first 15 million gallons of agri-biodiesel sold. Our 2009, 2010 and 2011 biodiesel production capacity did not and will not exceed 60 million gallons and thus we qualified for this credit.
On December 19, 2007, the Energy Independence and Security Act of 2007 (“Energy Bill of 2007”) was enacted which, among other things, expanded the RFS1. In contrast to the Energy Policy Act of 2005, this bill provided an RFS carve-out applicable specifically to biodiesel; the RFS requirement of the Energy Policy Act of 2005 had mostly been filled by ethanol. Beginning January 1, 2009, the Energy Bill of 2007 mandates that 500 million gallons of biomass-based diesel (biodiesel) be used per year. On November 21, 2008, the USEPA announced that the 2009 RFS for refiners, importers, and blenders was 10.21%. The 2008 RFS was 7.76%. The 2009 RFS represents 11.1 billion gallons of renewable fuel and includes 500 million gallons of biodiesel and renewable diesel. The mandate under the Energy Bill of 2007 increases each year and reaches 1 billion gallons per year in 2012. Beyond 2012, the mandate is to be determined by the Environmental Protection Agency administrator in coordination with the secretaries of energy and agriculture, but with a minimum of that mandated in 2012, thus a 1 billion gallons per year floor.
RFS2
On July 1, 2010, EPA implemented RFS2 as an expansion of the previous RFS1 legislation. RFS2’s biomass-based diesel requirement became effective, requiring for the first time that a certain percentage of the diesel fuel consumed in the United States be made from renewable sources. The biomass-based diesel requirement can be satisfied by two primary fuels, biodiesel and renewable diesel. Renewable diesel is not currently available in the United States in significant commercial quantities and thus, biodiesel is expected to satisfy the vast majority of the RFS2 biomass-based diesel requirement for the foreseeable future. RFS2 requires 800 million gallons of biomass-based diesel in 2011, one billion gallons in 2012 and at least one billion gallons each year thereafter, with such higher amounts subject to EPA discretion. In June 2011, the EPA proposed a 1.28 billion gallon biomass-based diesel requirement for 2013. We expect that the EPA will increase the requirement each year thereafter based on its evaluation of the availability of biodiesel and renewable diesel. As such, we expect RFS2 to create a consistent and stable demand for biodiesel.
The biomass-based diesel requirement is one of four separate renewable fuel requirements under RFS2. The RFS2 requirements are based on two primary categories and two subcategories. The two primary categories are conventional renewable fuel, which is intended to be satisfied by corn ethanol, and advanced biofuel, which is defined as a biofuel that reduces lifecycle greenhouse gas emissions by at least 50% compared to the petroleum-based fuel the biofuel is replacing. The advanced biofuel category has two subcategories, cellulosic biofuel, which is intended to be satisfied by newly developed cellulosic biofuels, such as ethanol made from woody biomass, and biomass-based diesel, which is intended to be satisfied by biodiesel and renewable diesel. RFS2’s total advanced biofuel requirement is larger than the combined cellulosic fuel and biomass-based diesel requirements, thus requiring the use of additional volumes of advanced biofuels.
The RFS2 requirement for additional volumes of advanced biofuels can be satisfied by any advanced biofuel, including biodiesel, renewable diesel, or sugarcane-based ethanol. The additional advanced biofuel requirement is approximately 150 million gallons in 2011 and 500 million gallons in 2012. We expect it will increase each year thereafter through 2022, subject to the EPA’s evaluation of the availability of advanced biofuels. RFS2’s initial compliance schedule required an additional advanced biofuel volume of approximately one billion by 2018. As biodiesel is currently the only advanced biofuel produced in the United States in significant commercial quantities, we expect the RFS2 advanced biofuel requirement to increase demand for biodiesel.
The advanced biofuel RVO is expressed in terms of ethanol equivalent volumes, or EEV, which is based on the fuel’s renewable energy content compared to ethanol. Biodiesel has an EEV of 1.5 compared to 1.0 for sugarcane-based ethanol. Accordingly, it requires less biodiesel than sugarcane-based ethanol to meet the required volumes as each gallon of biodiesel counts as 1.5 gallons for purposes of fulfilling the advanced biofuel RVO, providing an incentive for Obligated Parties to purchase biodiesel to meet their advanced biofuel RVO.
The RFS2 volume requirements apply to petroleum refiners and petroleum fuel importers in the 48 contiguous states or Hawaii, who are defined as “Obligated Parties” in the RFS2 regulations, and requires these Obligated Parties to incorporate
23
Table of Contents
into their petroleum-based fuel a certain percentage of renewable fuel or purchase credits in the form of RINs from those who do. An Obligated Party’s RVO is based on the volume of petroleum-based fuel they produce or import. The largest United States petroleum companies, such as ExxonMobil, Valero, ConocoPhillips, British Petroleum, Chevron and Shell, represent the majority of the total RVOs, with the remainder made up of smaller refiners and importers.
Each Obligated Party’s requirement is tracked, and ultimately satisfied, through the EPA’s renewable identification number, or RIN, system. Each gallon of biodiesel when produced or imported into the United States from an EPA RFS2 registered facility may generate 1.5 biomass-based diesel RINs for the compliance year in which the fuel was produced or imported. These RINs are then used to satisfy the biomass-based diesel or additional advanced biofuel requirements of RFS2. In order to provide an efficient market and facilitate compliance with RFS2, the RFS2 regulations provide that a RIN can be separated from a gallon of biomass-based diesel and sold as a separate commodity once the biomass-based diesel has been blended with petroleum-based diesel and certain other requirements have been met. Each Obligated Party must obtain or generate a sufficient number of RINs within each RFS2 renewable fuel category to satisfy its RVO. An Obligated Party can obtain those RINs by buying renewable fuels with RINs attached, or by buying RINs that have been separated from their renewable fuel and traded, or alternatively, they can generate RINs by producing or importing renewable fuels. Accordingly, diesel providers like truck stops that are not Obligated Parties can purchase biodiesel with RINs for blending into the diesel they sell and then resell the RINs to an Obligated Party or a broker.
In July 2010 when RFS2 became effective, biomass-based diesel RINs began trading at approximately $0.55 per RIN. By the end of the year, the 2010 biomass-based diesel RIN value had increased to $0.74. As of July 31, 2011, biomass-based diesel RINs were about a $1.40 per RIN, contributing $2.07 per gallon to the price of biodiesel.
The chart below shows how biomass-based diesel RINs have traded over time. The value of RINs has become increasingly significant to the price of biodiesel, contributing approximately $0.7904, or 25% of the average OPIS Chicago spot price of a gallon of biodiesel in July 2010 and $2.07, or 38% of the average OPIS Chicago spot price of a gallon of biodiesel in June 2011.
Biomass-Based Diesel RIN Values Have Been Significant Since RFS2 Began in July 2010
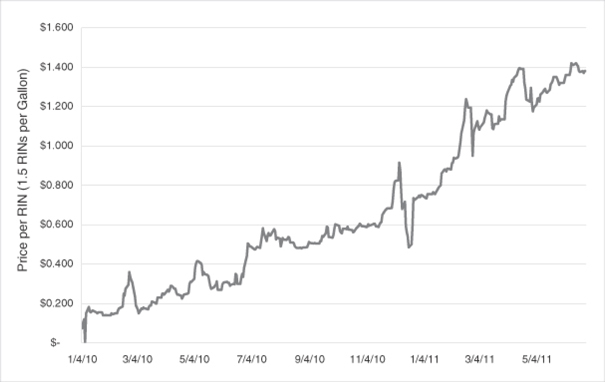
(Source: OPIS)
24
Table of Contents
The EPA has established pathways for the qualification of various types of feedstocks under RFS1 and modified and expanded those pathways under the more recent legislation, RFS2. As discussed above, the mechanism that EPA uses to track compliance with RFS2 is the generation of RINs that are generated by qualified producers and are assigned to each batch of the produced biodiesel fuel to identify its original producer. Compliance with RFS2 for RIN generation is complex, but primarily relies on certifications at various levels to insure the feedstock has an established pathway, the producer is an EPA certified facility and the fuel meets certain quality standards. Under RFS1 and RFS2, in order to qualify as biodiesel, the fuel must meet the specifications as provided under the ASTM D 6751. The fuel we produce meets or exceeds these standards.
RFS2 has established pathways for biodiesel production and RIN generation for feedstocks from soy oil, canola oil, rapeseed oil, waste greases and oils and fats and oils from rendered products such as chicken and tallow fats. The key points for compliance with RFS2 are to certify that the original pathway for the feedstock is established, the fuel meets ASTM D 6751 qualifications and is produced by an EPA certified facility. At the present time there are no pathways established for other potentially useful feedstocks such as palm oil, coconut oil or jatropha, although EPA has established mechanisms to establish new pathways under RFS2 in the future if desired. Compliance with RFS2 can be summarized by the following activities at our facility: (1.) feedstock certification letters obtained from the feedstock supplier certifying that the feedstock source is compliant with RFS2; (2.) certification by the EPA that the biodiesel facility is approved to generate RINs; (3.) monthly reporting of volumes and RINs generated by our Company to the EPA using its automated EMTS reporting system; (4.) issuance of a third party engineering report from a registered professional chemical engineer attesting the production capacities and that the facility complies with the EPA checklist (5.) an annual audit conducted by third party accountants reviewing the generation of RINs and confirming the gallons of fuel sold and the number of RINs generated agree with reported information to the EPA and (6.) an annual plant inspection by EPA personnel.
During August 2011, our facility in Middletown, Indiana was inspected by EPA as part of their annual site inspections and passed the EPA inspection. We had an updated the third party engineering report prepared as of July 2011 to reflect the increased volume capacity of the plant to 30 MMGPY and the 2010 Annual Audit by Weaver & Martin was completed in May 2011 as required. Since passage of RFS1 and RFS2, e-Biofuels facility has had no compliance issues with EPA and is an EPA approved RIN generation facility.
Advanced Biofuels Program
The United States Department of Agriculture (“USDA”) established the Advanced Biofuels Program under the 2008 Farm Bill to provide incentives to qualified biofuels producers to increase production of biofuels. We qualify as an Advanced Biofuels Producer under the program. The USDA makes available each fiscal year (ending September 30) an actual production payment and an incremental production payment to eligible producers.
Actual production - Participating producers will be paid on a quarterly basis for the actual quantity of eligible advanced biofuel produced and sold during the quarter.
Incremental production - For each eligible advanced biofuel facility, the Agency will make an end-of-the-year payment for that facility’s incremental production.
Incremental production calculation - An additional Incremental Production Payment will be calculated at the end of fiscal year based upon documentation of increased production of eligible advanced biofuel over the previous fiscal year. The Incremental Production rate will be calculated so that all of the incremental production funds available will be distributed equally on a per BTU basis.
Each year under the program the USDA allocates a “pool” of funds to be paid out to qualified producers. We received approximately $50,000 in fiscal 2009, $1.53 million in fiscal 2010 and$1.62 million through eleven months of fiscal 2011.Payments under the program are scheduled to be made quarterly by the USDA.
State Programs
Several states have enacted legislation providing incentives for the use of biodiesel, requiring the use of biodiesel, or both. For the State of Indiana the following incentives are available:
Biodiesel Production Tax Credit: A biodiesel producer located in Indiana may receive a credit of $1.00 per gallon of biodiesel produced. The Indiana Economic Development Corporation (IEDC) must review and approve applications for this incentive. The IEDC may grant a single taxpayer no more than $3 million total for all taxable years; this maximum incentive may be increased to $5 million with prior approval from IEDC. As of July 2011, no funds have been appropriated for this incentive. (Reference Indiana Code 6-3.1-27-8)
25
Table of Contents
Biodiesel Blending Tax Credit: A biodiesel blender located in Indiana may receive a credit of $0.02 per gallon of blended biodiesel produced at a facility located in Indiana. The Indiana Economic Development Corporation must review and approve applications for this incentive. The IEDC may grant a single taxpayer no more than $3 million total for all taxable years. As of July 2011, no funds have been appropriated for this incentive. (Reference Indiana Code 6-3.1-27-9)
Biodiesel Price Preference: A governmental body, state educational institution, or instrumentality of the state that performs essential governmental functions on a statewide or local basis is entitled to a 10% price preference for the purchase of fuels containing at least 20% biodiesel (B20) by volume or fuels that are primarily ester-derived (other than alcohol) made from biological materials, such as oilseeds and animal fats, for use in operating compression and ignition engines. (Reference Indiana Code 5-22-15-1, 5-22-15-7, and 5-22-15-19)
Biodiesel Blend Tax Exemption: Biodiesel blends of at least 20% (B20) that are used for personal, noncommercial use by the individual that produced the biodiesel portion of the fuel are exempt from the $0.16 per gallon license tax. The maximum number of gallons of fuel for which the exemption may be claimed is based on the percentage volume of biodiesel in each gallon used. (Reference Indiana Code 6-6-2.5-1.5, 6-6-2.5-28, and 6-6-2.5-30.5)
Other states, for example, Illinois offers different incentives such as an exemption from the generally applicable 6.25% sales tax for biodiesel blends that incentivizes blending at 11% biodiesel, or B11, however such taxes will not apply after December 31, 2013 unless such exemption is extended. Illinois’ program has made that state the largest biodiesel market in the country. Currently, Iowa offers a $0.03 per gallon income tax credit to petroleum marketers of B2 blends. In May 2011, Iowa signed into law a bill that encourages Iowa’s petroleum marketers to blend biodiesel into on-road and off-road diesel in a multi-year incentive program beginning in 2012. In 2012, retailers earn $0.02 per gallon for B2 blends or $0.045 per gallon for B5 blends. For 2013 through 2017, retailers earn $0.045 per gallon of B5. The new law also creates a biodiesel production incentive of $0.03 per gallon in 2012, $0.025 per gallon in 2013, and $0.02 per gallon in 2014, for each gallon produced in an Iowa facility up to the first 25 million gallons per production plant. South Carolina has a retailer cash incentive of $0.25 per gallon of B100 or $0.025 per gallon of B10. In Texas, biodiesel blends are exempt from state excise tax, which results in a $0.20 per gallon incentive for B100.
Currently, more than 40 states have implemented various programs that encourage the use of biodiesel through blending requirements as well as various tax incentives. Minnesota requires a B5 blend, which is scheduled to increase to B10 in 2012. Oregon has implemented a B5 biodiesel blend requirement. New Mexico, Pennsylvania, Massachusetts and Washington have all adopted legislation requiring biodiesel blends. Several northeast states, including Connecticut and Massachusetts, and the City of New York have adopted legislation requiring biodiesel blends for heating oil.
In addition, several states have adopted or are considering adopting a low carbon fuel standard, or LCFS, requiring a reduction in the amount of lifecycle carbon intensity in their transportation fuels. Biodiesel has lower carbon emissions than petroleum-based diesel and is thus expected to benefit from increased demand in states like California that have adopted a LCFS. California’s LCFS calls for a reduction in greenhouse gas emissions from transportation fuels of 10% by 2020.
Oil and Natural Gas Development, Major Properties
Coquille Bay Field
The Company assumed operations of the Coquille Bay field in January 2005 from Royal-T. The field is located in Plaquemines Parish, Louisiana in approximately 4-6 feet of water. Seventeen wells have produced oil and natural gas at depths ranging from 8,000 ft. to 11,000 feet. The Company manages the field under an Operating Agreement with the State of Louisiana and owns a record title 22% working interest and a 21.4% net revenue interest. Through non-consent provisions of the Operating Agreement, the Company currently has a 98.5 % working interest and a 73.875% net revenue interest. Prior to hurricane Katrina, the Company had the field producing at approximately 75 Bopd and 800 mcfpd from six completions, however production has been plagued by continuous repair and maintenance problems and over-sized equipment at the central facility and by the lack of sufficient gas for gas lifting of the oil wells. The Company had completed work on two additional wells that had sufficient gas flow rates to supply the necessary gas lift gas immediately prior to shutting down for
26
Table of Contents
the hurricane. The Company completed a majority of the repairs caused by the hurricane Katrina and began producing on a limited basis in September 2006, however continuous operations were not maintained until replacement of the over-sized rental compressor in April 2007. The field is capable of producing at approximately 70-100 Bopd and 450 mcfpd (net sales 100 mcfpd) but is currently limited by its ability to dispose of salt water produced in the field and by gas available for gas lift. The Coquille Bay field has numerous workover opportunities available to increase production and reserves.
Oil and Natural Gas Reserves
The following table is a summary, as of July 31, 2011, of the proved reserves of oil and natural gas net to the Company’s interest based upon estimates prepared by or for the Company. These estimates are based on assumptions the Company believes are reasonable regarding production costs, future production rates and declines. These estimates are based upon constant prices and costs as of July 31, 2011, of $97.02/Bbl and $4.42/Mmbtu adjusted for differentials. There are numerous uncertainties inherent in the preparation of estimates of reserves, including many factors beyond the Company’s control. The accuracy of any such estimates is a function of the quality of available data and of engineering and geological interpretation and judgment. It can be expected as the Company conducts additional evaluation, drilling and testing with respect to its properties that these estimates will be adjusted and could be revised. Estimates have been filed with the Energy Information Agency as part of its annual survey of oil and gas operators for 2010 based on the Company’s reserves as of July 31, 2010 in addition to reports filed with the Securities and Exchange Commission (“SEC”). The Company has no reserves outside the United States.
| As of July 31, 2011 | ||||||||||||||||
| Category |
Oil MBO |
Natural Gas MMCF |
Future Net Revenue (M$) |
Present Value Discounted @10%(M$) |
||||||||||||
| Producing |
27 | 76 | 1,082 | 921 | ||||||||||||
| Non-Producing |
284 | 2,613 | 28,948 | 12,854 | ||||||||||||
| Undeveloped |
0 | 420 | 508 | 217 | ||||||||||||
| Total Proved |
311 | 3,109 | 30,538 | 13,992 | ||||||||||||
Reserves by State
The following table illustrates the Company’s reserve summaries by State as of July 31, 2011:
| As of July 31, 2011 | ||||||||
| Oil (MBO) | Natural Gas (MMCF) | |||||||
| Texas |
0 | 0 | ||||||
| Louisiana |
311 | 3,109 | ||||||
| Other |
0 | 0 | ||||||
|
|
|
|
|
|||||
| Total |
311 | 3,109 | ||||||
Acreage—The following table shows the developed and undeveloped leasehold acreage held by the Company as of July 31, 2011:
| Developed Acreage | Undeveloped Acreage |
|||||||||||||||
| (1) Gross | (2) Net | (1) Gross | (2) Net | |||||||||||||
| Texas |
0 | 00 | 0 | 0 | ||||||||||||
| Louisiana |
763 | 676 | 0 | 0 | ||||||||||||
| Kentucky |
0 | 0 | 0 | 0 | ||||||||||||
|
|
|
|
|
|
|
|
|
|||||||||
| Various |
0 | 0 | 0 | 0 | ||||||||||||
|
|
|
|
|
|
|
|
|
|||||||||
| Total |
763 | 470 | 0 | 0 | ||||||||||||
27
Table of Contents
Productive Wells—The following table summarizes the productive oil and gas wells in which the Company had an interest at July 31, 2011:
| Oil Wells | Gas Wells | Total | ||||||||||||||||||||||
| (1) Gross | (2) Net | (1) Gross | (2) Net | (1) Gross | (2) Net | |||||||||||||||||||
| Texas |
0 | 0 | 0 | 0 | 0 | 0 | ||||||||||||||||||
| Louisiana |
17 | 16.75 | 1 | 0.75 | 18 | 17.50 | ||||||||||||||||||
| Other |
0 | 0 | 0 | 0 | 0 | 0 | ||||||||||||||||||
|
|
|
|
|
|
|
|
|
|
|
|
|
|||||||||||||
| Total |
17 | 16.75 | 1 | 0.75 | 18 | 17.50 | ||||||||||||||||||
| (1) | A “gross acre” or a “gross well” is an acre or well in which a working interest is owned by the Company and the number of gross acres or gross wells is the total number of acres or wells in which a working interest is owned by the Company. |
| (2) | A “net acre” or a “net well” exists when the sum of the Company’s fractional ownership interests in gross acres or gross wells equals one. The number of net acres or net wells is the sum of the fractional interests owned in gross acres or gross wells, and does not include any royalty, overriding royalty or reversionary interests. |
Production, Price and Cost Data—The following table summarizes certain information relating to the production, price and cost data for the Company for the fiscal years ended, July 31, 2011, 2010, 2009.
| Year Ended July 31, | ||||||||||||
| 2011 | 2010 | 2009 | ||||||||||
| Oil: |
||||||||||||
| Production (Bbls) |
4,578 | 1,529 | 16,190 | |||||||||
| Revenue |
$ | 336,752 | $ | 107,504 | $ | 960,407 | ||||||
| Average barrels per day |
13 | 4 | 44 | |||||||||
| Average sales price per barrel |
$ | 73.55 | $ | 70.31 | $ | 59.32 | ||||||
| Natural Gas: |
||||||||||||
| Production (Mcf) |
6,682 | 12,565 | 24,099 | |||||||||
| Revenue |
$ | 61,941 | $ | 51,086 | $ | 108,953 | ||||||
| Average Mcf per day |
18 | 34 | 66 | |||||||||
| Average sales price per Mcf |
$ | 9.27 | $ | 4.06 | $ | 4.52 | ||||||
| Production costs (1) |
$ | 1,096,432 | $ | 638,854 | $ | 985,753 | ||||||
| Equivalent (Bbls) (2) |
16 | 3,623 | 20,206 | |||||||||
| Production costs per equivalent bbl (3) |
$ | 187.74 | $ | 176.33 | $ | 48.79 | ||||||
|
|
|
|
|
|
|
|||||||
| Total oil and gas revenues |
$ | 398,693 | $ | 158,590 | $ | 1,069,361 | ||||||
| (1) | Includes expense workovers. |
| (2) | Gas production is converted to barrel equivalents at the rate of six Mcf per barrel representing the estimated relative energy content of natural gas to oil. |
| (3) | Historical costs and expenses differ from projections included in the reserve estimates presented above as a result of remedial costs associated with repairs of the Hillside acquisition properties and repairs to the Coquille Bay platform included in historical costs and considered to be non-recurring expenses. To the extent that continued remedial costs are incurred in the future, the economic limit of the producing properties will be affected and will reduce our reserve estimates substantially. |
28
Table of Contents
Drilling Activity
The following table illustrates the results of the drilling activity during each of the three most recent fiscal years as reflected by number of wells drilled:
| July 31, 2011 | July 31, 2010 | July 31, 2009 | ||||||||||||||||||||||
| Gross | Net | Gross | Net | Gross | Net | |||||||||||||||||||
| Texas |
0 | 0 | 0 | 0 | 0 | 0 | ||||||||||||||||||
| New Mexico |
0 | 0 | 0 | 0 | 0 | 0 | ||||||||||||||||||
| Louisiana |
0 | 0 | 0 | 0 | 0 | 0 | ||||||||||||||||||
| Mississippi |
0 | 0 | 0 | 0 | 0 | 0 | ||||||||||||||||||
| Other |
0 | 0 | 0 | 0 | 0 | 0 | ||||||||||||||||||
|
|
|
|
|
|
|
|
|
|
|
|
|
|||||||||||||
| Total |
0 | 0 | 0 | 0 | 0 | 0 | ||||||||||||||||||
Principal Exploration and Development Projects: Mining Ventures
The Company considers its mining activities to be in the exploration stage at this time.
Duke Mine
The focus of the Company’s exploration activity related to the Duke Mine during fiscal 2004 has been to seek a partner to finance or joint venture the operations on the Duke Mine located in San Juan County, Utah. The property comprises some 2,240 acres of unpatented mining claims in the Dry Valley Gold Claim area. Access to the property is excellent via blacktop roads adjacent to the claims. The property is located some 20 miles south of Moab, Utah. The primary mineralization at the Duke Mine occurs as microscopic gold located in very fine grain placer material. Sieve analysis of the sand indicates that about 71% of the material are larger than 200 mesh. Recovery tests have been conducted on a grid sampling pattern throughout the claim area utilizing the Cosmos Concentrator. Because of the nature of the placer material and in particular its size, mining and process recovery activities will be significantly simplified, thereby reducing costs. The Company has conducted additional recovery tests utilizing other equipment in addition to the Cosmos Concentrator. Water is readily available, however, drilling is required.
The Company constructed a pilot plant in 1998 at the Duke Mine and moved a portable Cosmos Concentrator on to the site. The Company spent approximately $185,000 to conduct pilot recovery tests under a small miner’s permit exemption. Pilot plant results were encouraging despite mechanical start-up problems. Upon completion of its pilot tests, the Company suspended any further exploration until construction of a full-scale modular facility can be completed. Subject to capital availability, permitting and construction schedules, the cost to construct a full scale facility is approximately $8.0 million to achieve a capacity of 10,000 tons per day. Presently there are 5 other companies active in the development of claims in the vicinity of the Duke Mine. The Company entered into discussions with a mining company to provide the capital and manage the development of the mine and completed an agreement in connection with the change of control of Warrior in which the Company would retain a 5% net smelter royalty. The mining company was unable to complete its capital efforts in relation to the Duke Mine and as a result the Company re-assumed control of the Duke Mine. We are currently evaluating new opportunities for the development of the mine.
The availability of a market for the Company’s mineral and metal production will be influenced by the proximity of the Company’s operations to refiners and smelting plants. In general the Company intends to sell its mined product to local refineries and smelters. The price received for such products will be dependent upon the Company’s ability to provide primary separation to ensure fineness or quality. The price of gold has increased in recent years due to volatility in global financial markets. Copper prices have generally been volatile, in part due to increased demand of developing economies for electrical wire and other copper related products, however as a result of recent economic turmoil, copper prices have begun to drop.
29
Table of Contents
Changes in the price of gold and copper will significantly affect the Company’s future cash flows and the value of its mineral properties. The Company is unable to predict whether prices for these commodities will increase, decrease or remain constant in future periods.
The Company does not currently classify any of its mineral properties as having reserves as that term is defined by the SEC.
30
Table of Contents
There are many companies and individuals engaged in the energy business. Some are very large and well established with substantial capabilities and long earnings records. The Company is at a competitive disadvantage with some other firms and individuals in acquiring and disposing of oil and gas properties, since they have greater financial resources and larger technical staffs than the Company. In addition, in recent years a number of new small companies have been formed which have objectives similar to those of the Company and which present substantial competition to the Company.
A number of factors, beyond the Company’s control and the effect of which cannot be accurately predicted, affect the production and marketing of biodiesel, crude oil and natural gas and the profitability of the Company. These factors include crude oil imports, actions by foreign oil producing nations, the availability of adequate pipeline and other transportation facilities, the marketing of competitive fuels and other matters affecting the availability of ready market, such as fluctuating supply and demand.
The Company currently sells a substantial portion of its oil and gas production on “spot” market or short term contracts. During the year ended July 31, 2011, the Company sold approximately 95% and 5% of its oil and gas, respectively, to Plains Marketing and Regency Services respectively. The Company does not believe that the loss of any of these purchasers would significantly impair its operation.
31
Table of Contents
The acquisition of mining claims prospective for precious metals or other minerals or oil and natural gas leases is subject to intense competition from a large number of companies and individuals. The ability of the Company to acquire additional leases or additional mining claims could be curtailed severely as a result of this competition.
The principal methods of competition in the industry for the acquisition of mineral leases is the payment of bonus payments at the time of acquisition of leases, delay rentals, advance royalties, the use of differential royalty rates, the amount of annual rental payments and stipulations requiring exploration and production commitments by the lessee. Companies with far greater financial resources, existing staff and labor forces, equipment for exploration and mining, and vast experience will be in a better position than the Company to compete for such leases.
No portion of the Company’s oil and natural gas business is subject to re-negotiation of profits or termination of contracts or subcontracts at the election of the Government. The Company operates the Coquille Bay facility which is subject to an Operating Agreement negotiated by the Company’s predecessor with the State of Louisiana.
Federal, state and local authorities extensively regulate the energy and mining industry. Legislation affecting these industries is under constant review for amendment or expansion. Numerous departments and agencies, both federal and state, have issued rules and regulations binding on the oil and natural gas and mining industry and their individual members some of which carry substantial penalties for the failure to comply. The regulatory burden on these industries increases their cost of doing business and consequently, affects their profitability. Inasmuch as such laws and regulations are frequently amended or reinterpreted, the Company is unable to predict the future cost or impact of complying with such regulations.
The Company’s operations are subject to extensive federal, state and local laws and regulations relating to the generation, storage, handling, emission, transportation and discharge of materials into the environment. Permits are required for various of the Company operations, and these permits are subject to revocation, modification and renewal by issuing authorities. Governmental authorities have the power to enforce compliance with their regulations and violations are subject to fines, injunctions or both. It is possible that increasingly strict requirements will be imposed by environmental laws and enforcement policies hereunder. The Company is also subject to laws and regulations concerning occupational safety and health. It is not anticipated that the Company will be required in the near future to expend amounts that are material in the aggregate to the Company’s overall operations by reason of environmental or occupational safety and health laws and regulations but inasmuch as such laws and regulations are frequently changed, the Company is unable to predict the ultimate cost of compliance.
Oil and Natural Gas
The Company has not obtained conclusive title surveys of its properties. In general, limited or dated and conditional title opinions exist on the leases, however, title surveys have been conducted by land men and title lawyers in the normal course of the Company’s acquisition and financing efforts and are not specifically assurances to the Company of absolute title. The Company has reviewed the validity and recording of the leases at the county courthouses in which the properties are located and believes that it holds valid title to its properties.
Mining
The Company does not have conclusive title opinions on its mining claims or leases and, therefore, has not identified potential adverse claimants nor has it quantified the risk that any adverse claims may successfully contest all or a portion of its title to the claims. Furthermore, the validity of all unpatented mining claims is dependent upon inherent uncertainties such as the sufficiency of the discovery of minerals, proper posting and marking of boundaries, and possible conflicts with other claims not determinable from descriptions of record. In the absence of a discovery of valuable minerals, a mining claim is open to location by others unless the claimant is in actual possession of and diligently working the claim (pedis possessio) No assurance can be given with respect to unpatented mining claims in the exploratory stage that a discovery of a valuable mineral deposit will be made.
To maintain ownership of the possessory title created by an unpatented mining claim against subsequent locators, the locator or his successor in interest must pay an annual fee of $200 per claim.
32
Table of Contents
Biodiesel
We generally have good title to our biodiesel facility and equipment.
Operational Hazards and Insurance
The operations of the Company are subject to all risks inherent in the manufacture of biodiesel and in the exploration for and operation of oil and natural gas properties, wells and facilities and mines and mining equipment, including such natural hazards as blowouts, cratering and fires, which could result in damage or injury to, or destruction of, drilling rigs and equipment, mines, producing facilities or other property or could result in personal injury, loss of life or pollution of the environment. In addition, weather related hazards, such as tornados and hurricanes may pose a threat to certain of the Company’s wells and facilities from time-to-time. Any such event could result in substantial expense to the Company which could have a material adverse effect upon the financial condition of the Company to the extent it is not fully insured against such risk. The Company carries insurance against certain of these risks but, in accordance with standard industry practices, the Company is not fully insured for all risks either because such insurance is unavailable or because the Company elects not to obtain insurance coverage because of cost, although such operational risks and hazards may to some extent be minimized. No combination of experience, knowledge and scientific evaluation can eliminate the risk of investment or assure a profit to any company engaged in oil and gas or mining operations.
The Company employs three people in its Evansville, Indiana office whose functions are associated with management, operations and accounting, one individual in Georgia whose function is related to our oil sands project and 45 people in Middletown, Indiana associated with the operations of our biodiesel facility. The Company uses independent contractors to assist in its land functions and to supervise its oil, gas and mining business.
| ITEM 3. | Legal Proceedings. |
We are subject to a variety of laws and regulations in all jurisdictions in which we operate. We also are involved in legal proceedings, claims or investigations that are incidental to the conduct of our business and cannot be avoided. Some of these proceedings allege damages against us relating to property damage claims (including injuries due to product failure and other product liability related matters), employment matters, and commercial or contractual disputes. We vigorously defend ourselves against all claims which require such action. In future periods, we could be subjected to cash costs or non-cash charges to earnings if any of these matters is resolved on unfavorable terms.
Imperial Petroleum, Inc. versus Ravello Capital LLC
The Company filed suit in Federal District Court in Tulsa County, Oklahoma against Ravello Capital LLC (“Ravello”) on November 20, 2000. The suit alleged breach of contract and sought to have the contract declared partially performed in the amount of $74,800 and sought relief in the amount of $488,390 for the unpaid consideration and punitive damages and attorney’s fees. The Company received a judgment award against Ravello in the amount of $488,390 and subsequently collected and credited the judgment in the amount of $85,638.02 as a result of the re-issuance of certain of its shares in Warrior, held by Ravello in escrow and not released. The Company does not believe it will be successful in collecting the balance of the judgment against Ravello.
Gary Bolen, et al vs. Imperial Petroleum, Inc.: Wrongful Garnishment:
The case filed in Midland County, Texas No. CV 45671 on July 24, 2008 stems from a dispute in 2005 in which Pharoh Oil & Gas, a company owned by Mr. Bolen ceased accepting saltwater from the University BX lease despite a valid saltwater disposal agreement in place, owned by Imperial at the time, and resulted Imperial obtaining a monetary judgment against Pharoh and Bolen and executing garnishment procedures to allow the money to be escrowed pending final outcome of that trial. Imperial prevailed in that trial, through the Supreme Court of Texas, and received the judgment proceeds. Bolen contends that the procedures used by Imperial in garnishing the funds to be escrowed were improper and seeks unspecified damages. No activity occurred in the most recent fiscal year on this case. The Company reached a tentative settlement of the lawsuit for the payment of a nominal amount of cash and is completing final agreements for dismissal of the case.
Pearl River Navigation vs. Imperial Petroleum, Inc.
Pearl River conducted barge and crane operations after hurricane Katrina on the Coquille Bay field in Louisiana on behalf of the working interest owners. A dispute arose between the parties regarding the availability of Pearl River’s crane operator on weekends, despite the fact that Pearl River continued to bill for such operations. The Company refused to pay the disputed invoices and Pearl River filed a lien in the amount of approximately $789,000 despite approximately $225,000 in
33
Table of Contents
payments by the Company. Pearl River filed a lawsuit dated August 1, 2007 in the 25 th Judicial District Court for the Parish of Plaquemines, State of Louisiana. the case was moved to the United States District Court for the Eastern District of Louisiana, Civil Action No. 07-9619, Section “I”(4). The Company and Pearl River reached a settlement in the matter and Pearl River was granted a judgment in the amount of $100,000 and was assigned an overriding royalty interest in the Coquille Bay field. The Company is making payments against the judgment out of revenue from the sale of oil at Coquille Bay.
Aventine Renewable Energy Holdings v. e-biofuels, LLC and
e-biofuels, LLC v. Aventine Renewable Energy Holdings
This suit was filed in the United States Bankruptcy Court for the District of Delaware. e-biofuels and Aventine entered into a purchase agreement on April 4, 2008. Aventine was to purchase fuel at $3.815 per gallon for a total of six million gallons. Aventine failed to purchase six million gallons. e-biofuels claims that Aventine initially breached the agreement when it advised e-biofuels of an anticipatory repudiation of the agreement. e-biofuels and Aventine claim more than $2,500,000.00 in damages due to the other’s breach. This case was settled in the fourth quarter of fiscal 2011.
Settlemyre Industries, Inc. v. e-biofuels, LLC
Settlemyre brought suit in the United States District Court for the Southern District of Ohio, Western Division alleging that it contracted with e-biofuels to purchase 630,000 gallons of biodiesel from e-biofuels at $3.28 per gallon. The contract included a list of quality requirements and specifications that e-biofuels’ biodiesel must satisfy before Settlemyre would accept delivery. Settlemyre claims that e-biofuels was unable to provide a product to meet the specifications, which resulted in a breach of contract. As a result, Settlemyre had to purchase a similar product from other sellers at an increased price, for which Settlemyre seeks more than $630,000 in damages. e-biofuels claims the product met specifications and Settlemyre wrongfully rejected the product. Further, e-biofuels claims that Settlemyre did not properly cover or mitigate their damages, if any. The case was settled and dismissed.
Vinmar Overseas, LTD. v. e-biofuels, LLC
Vinmar filed suit in the United States District Court for the Southern District of Texas, Houston Division, claiming that Vinmar and e-biofuels entered into a contract under which e-biofuels agreed to supply 500,000 gallons of FAME B99 to Vinmar. Vinmar claimed that e-biofuels failed to deliver the required quantities of product and owed $2,000,000.00 plus as a result of the breach and lost profit. Vinmar lost its claim of lost profit. Vinmar filed suit in Henry Circuit Court domesticating the judgment in favor of Vinmar and against e-biofuels for $930,546.87. Payments were completed and the case was dismissed during the fourth quarter of fiscal 2011.
| ITEM 4. | Submission of Matters to a Vote of Security Holders. |
None.
34
Table of Contents
| ITEM 5. | Market For Registrant’s Common Stock; and Related Stockholder Matters. |
The Company’s common stock is traded in the over-the-counter market. From 1984 to 1997 trading had been so limited and sporadic that it was not possible to obtain a continuing quarterly history of high and low bid quotations. Stock information is received from registered securities dealers and reflects inter-dealer prices, without retail mark-up, mark-down or commission and may not necessarily represent actual transactions. The Company was advised that trading in its shares resumed in September 1997 and the Company’s stock was quoted at approximately $0.25 per share in sporadic trading. At July 31, 2011, the approximate closing price for the Company’s common stock was $1.00 per share.
No dividends have ever been paid by the Company on its common stock and it is not anticipated that dividends will be paid in the foreseeable future.
There are approximately 625 holders of record of the Company’s common stock.
| Fiscal 2011 | Fiscal 2010 | |||||||||||||||
| High | Low | High | Low | |||||||||||||
| Fiscal Quarter |
||||||||||||||||
| First Quarter Ended October 31 |
$ | 0.56 | $0.55 | $ | 0.14 | $ | 0.06 | |||||||||
| Second Quarter Ended January 31 |
$ | 0.44 | $0.44 | $ | 0.13 | $ | 0.09 | |||||||||
| Third Quarter Ended April 30 |
$ | 1.00 | $0.85 | $ | 0.35 | $ | 0.10 | |||||||||
| Fourth Quarter Ended July 31 |
$ | 1.40 | $1.23 | $ | 0.28 | $ | 0.15 | |||||||||
| ITEM 6. | Selected Financial Data. |
| 2011 | 2010 | 2009 | 2008 | 2007 | ||||||||||||||||
| Operating Revenue |
109,972,543 | 5,659,364 | 1,069,361 | 1,855,381 | 1,143,194 | |||||||||||||||
| Income (loss) from continuing opns |
8,004,554 | (17,080,676 | ) | (436,536 | ) | (668,891 | ) | (1,655,802 | ) | |||||||||||
| Net Income (loss) |
6,074,863 | (17,718,118 | ) | 10,785,443 | (2,588,859 | ) | (3,243,996 | ) | ||||||||||||
| Net Income (loss) per share |
0.229 | (0.99 | ) | 0.636 | (0.16 | ) | (0.28 | ) | ||||||||||||
| Total Assets |
24,534,720 | 13,133,820 | 3,138,809 | 6,273,704 | 6,101,286 | |||||||||||||||
| Stockholder’s Equity (Deficit) |
431,300 | (15,718,118 | ) | 892,560 | (9,882,882 | ) | (7,354,022 | ) | ||||||||||||
| Cash Dividends Paid per Common Share |
0 | 0 | 0 | 0 | 0 | |||||||||||||||
| Number of Outstanding Shares (weighted) |
26,493,613 | 18,003,438 | 16,694,441 | 16,289,523 | 11,487,701 | |||||||||||||||
| ITEM 7. | Management’s Discussion and Analysis of the Financial Condition and Results of Operations. |
The factors which most significantly affect the Company’s results of operations are (i) the sale prices of biodiesel, biodiesel feedstocks, crude oil and natural gas, (ii) the level of biodiesel, crude oil and natural gas sales, (iii) the level of direct and lease operating expenses, and (iv) the level of and interest rates on borrowings. The same factors listed above will apply to the sale of minerals and metals mined by the Company.
As a result of the collapse of the world economies into recession, crude oil and natural gas prices decreased significantly during fiscal 2009 from 2008 and although rebounding somewhat in fiscal 2010 and 2011, appear again to be heading into a downward spiral. Commodity prices for crude oil based on West Texas Intermediate (“WTI”) prices quoted at approximately $97.02/Bbl for oil and $4.42 per Mmbtu for natural gas at July 31, 2011. Since that time crude oil and natural gas prices declined with crude oil prices currently around $77.00/bbl and natural gas at around $3.90/Mmbtu. Diesel prices are impacted by crude oil prices and determine biodiesel prices to a large degree. Biodiesel prices have steadily climbed during fiscal 2011 and were quoted at approximately $5.43 per gallon at July 31, 2011 based on the average spot price. Currently biodiesel is quoted at $5.79/gallon. The following graph shows the relation of biodiesel and diesel fuel prices compared to crude oil prices on a $/gallon basis.
35
Table of Contents
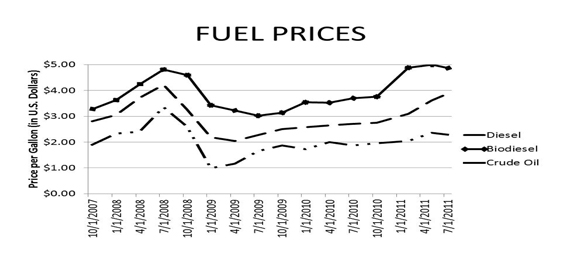
The impact of the volatility of fuel prices has contributed to uncertainty in the energy markets. If pricing remains high, by demand or artificial methods employed by the oil producing countries, the impact will be positive on revenues and cash flow and the exploitation of existing properties owned by the Company, however, continued high prices will reduce the availability of quality acquisitions and could change the Company’s future growth strategy. At the present time the Company believes it has a substantial inventory of quality development opportunities to sustain its growth strategy without additional acquisitions. The Company expects oil and gas prices to continue to widely fluctuate and to be influenced by global economic turmoil, Asian economies and potential disruptions in supplies, in particular events in the Middle East and North Korea. Feedstock prices, and in particular waste grease prices, generally track biodiesel prices. Virgin oil feedstocks however are at times priced too high for use as a biodiesel feedstock. Since the highest value for most waste greases is obtained by selling these commodities to the biodiesel industry, we expect that despite volatility in biodiesel prices, these waste grease feedstocks will continue to track biodiesel prices, both upward and downward and therefore maintain an acceptable margin for biodiesel production.
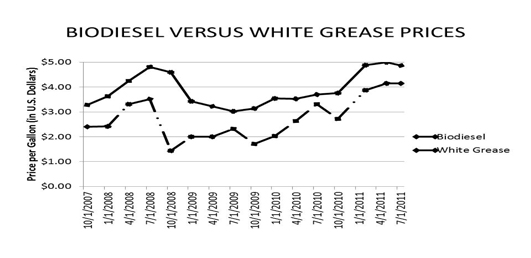
36
Table of Contents
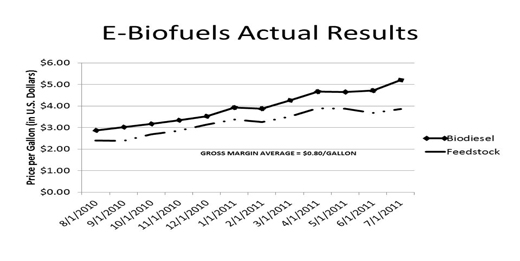
The graph above shows our historical gross margins for fiscal 2011based on a comparison of our actual sales price for biodiesel compared to the cost of feedstock. Because we are a feedstock flexible facility, we can take advantage of variations in feedstock prices and utilize multiple feedstocks in our plant.
Year ended July 31, 2011 compared to year ended July 31, 2010
Total revenues for the Company for the year ended July 31, 2011 were $109,972,543 compared to $5,659,364 for the prior year and represent a full year of production at our biodiesel plant after the acquisition of e-Biofuels. We were able to quickly turn the facility around, expand its operations and increase its capacity during 2011 from a nameplate capacity of 15MMGPY to 30 MMGPY. Our biodiesel operations comprised some 99.6% of our revenues. We are currently operating at about 2.5-3.0 million gallons per month of biodiesel production. The average sales price for biodiesel during the period was $4.12 per gallon. Coquille Bay continues to suffer from a lack of available gas for gas lift and as a result the Company continues to conserve natural gas and limits sales. We presently expect that our biodiesel sales will account for the majority of our revenues during the current fiscal year as well. We expect revenues to increase in fiscal 2012 as a result of a full year of operations at capacity and as a result of planned capacity expansions currently underway.
Total direct operating expenses for the year ended July 31, 2011 were $96,792,145 compared to $5,129,451 for the year earlier. Direct operating expenses have increased due to the costs associated with e-biofuels operations and the significant increase in production rates. Our gross margin from the production of biodiesel is approximately 18% with feedstock costs of approximately $3.38 per gallon and not including any direct government incentives received as an advanced biofuels producer. We experienced only limited activity in Coquille Bay for the year. General and administrative costs (“G&A”) for the year ended July 31, 2011 were $4,295,830 compared to $1,141,281 for the year ended July 31, 2010. The increase in G&A is due to the added staff at e-Biofuels during the fiscal year ended 2011, approximately $1,172,000 in stock for services and non-cash charges from warrants issued. We do not anticipate the addition of significant additional staff at e-biofuels despite increased production levels and as a result we anticipate increased overall margins as plant capacity increases. Interest costs increased to $1,685,292 for the year ended July 31, 2011 compared to $437,231 for the prior year as a result the incorporation of a full year of e-Biofuels’ credit facility.
The Company incurred net after tax income of $6,074,863 ($0.229 per share) or ($0.214 per share fully diluted) for the fiscal year ended July 31, 2011 compared to an after tax loss of $17,818,186 ($0.99 per share) for the prior year. The net loss for the year ended July 31, 2010 was primarily the result of the write-off of goodwill associated with the acquisition of e-biofuels in the amount of $16,276,784. The Company experienced a net gain during the year ended July 31, 2011 of $8,004,554 from continuing operations. Our biofuels subsidiary generated a net gain from continuing operations of $10,467,989 for the fiscal year ended July 31, 2011. Depreciation, depletion and amortization costs increased from a total of$192,524 last year to $880,014 this year as a result of a full year with e-biofuels activity being included.
37
Table of Contents
Year ended July 31, 2010 compared to year ended July 31, 2009
Total revenues for the Company for the year ended July 31, 2010 were $5,659,364 compared to $1,069,361 for the prior year and represent a 529% increase. As a result of the e-biofuels acquisition which is included for the period from May 24, 2010 through July 31, 2010, the Company’s revenues have increased dramatically such that biodiesel sales accounted for 97% of our revenues. Since year end, further increases in biodiesel sales for e-biofuels has increased revenues to approximately $5.87 million for the month of September 2010 on sales of approximately 1.87 million gallons of biodiesel. The average sales price for biodiesel during the period was $3.02 per gallon. Coquille Bay continues to suffer from a lack of available gas for gas lift and as a result the Company continues to conserve natural gas and limits sales. We presently expect that our biodiesel sales will account for the majority of our revenues during the current fiscal year. We expect revenues to increase dramatically compared to the prior fiscal year with a full year of biodiesel sales from our e-biofuels subsidiary.
Total direct operating expenses for the year ended July 31, 2010 were $5,129,451 compared to $985,783 for the year earlier. Direct operating expenses have increased due to the costs associated with e-biofuels. Our gross margin from the production of biodiesel is approximately 19% with feedstock costs of approximately $2.32 per gallon. We experienced on limited activity in Coquille bay for the year. General and administrative costs (“G&A”) for the year ended July 31, 2010 were $1,141,281 compared to $383,101 for the year ended July 31, 2009. We expect significantly increased G&A costs as a result of a full year of inclusion of e-biofuels, however, we do not anticipate the addition of significant staff at e-biofuels despite increased production levels and as a result we anticipate increased overall margins. Interest costs decreased to $437,231 for the year ended July 31, 2010 compared to $1,600,431 for the prior year as a result of the settlement of the Company’s senior debt and offset somewhat by the incorporation of e-biofuels for two months. On a full-year basis, interest rates are expected to increase above 2009 levels.
The Company incurred a net after tax loss of $17,818,186 ($0.99 per share) for the fiscal year ended July 31, 2010 compared to an after tax gain of $10,785,443 ($0.636 per share) for the prior year. The net loss for the year ended July 31, 2010 is primarily the result of the write-off of goodwill associated with the acquisition of e-biofuels in the amount of $16,276,784. The largest component of the net gain for the prior fiscal years was the gain on the settlement of the Company’s debt of $12,984,463. The Company experienced a net loss during the year ended July 31, 2010 of $17,080,676 from continuing operations. Depreciation, depletion and amortization costs increased from a total of $137,043 last year to $192,524 this year and will increase further as a result of a full year with e-biofuels activity included.
Capital Resources and Liquidity
The Company’s capital requirements in the past have related primarily to the remedial efforts to return wells to production and to workover and repair operations on various wells to increase production, including the repairs required at Coquille Bay after hurricane Katrina. Now that the repairs at Coquille Bay are completed and production has been re-established, the Company has a great deal of flexibility in the timing and amount of these expenditures. The Company did not make any capital expenditures for workovers in the most recent quarter due to limited production at Coquille Bay and due to a lack of capital. With the acquisition of e-biofuels, we do not expect significant capital improvements at the current levels of production, however, subject to available capital, we do anticipate expansion of the plant capacity by an additional 10 million gallons per year. The Company announced the completion of a private placement subsequent to year-end which resulted in net proceeds of approximately $2.9 million. The proceeds from this financing will be used to expand our biodiesel operations and begin installation of our commercial tar sand recovery unit in Kentucky.
As a result of the inability of the Company to raise capital for its mining operations, the Company is active in only one mine that will require significant capital expenditures, the Duke Mine located in Utah. The Company has a wide degree of discretion in the level of capital expenditures it must devote to the mining project on an annual basis and the timing of its development. The Company has primarily been engaged, in its recent past, in the acquisition and testing of mineral properties to be inventoried for future development.
The timing of expenditures for the Company’s oil and natural gas and mining activities are generally distributed over several months, however, any cessation of production or catastrophe type expenditures create significant cash flow shortages for the Company. The Company anticipates its current working capital will be sufficient to meet its required capital expenditures and that the Company will not be required to either access additional borrowings from its lender or access outside capital. Currently the Company projects it will require non-discretionary capital expenditures of approximately $500,000 in the next fiscal year to re-establish and maintain economic levels of production at Coquille Bay.
38
Table of Contents
In connection with the acquisition of e-biofuels, LLC as a wholly-owned subsidiary, the Company assumed senior debt under the following facilities: (1.) First Merchants Bank, N.A. Term Loans; (2.) Cienna Capital/Small Business Administration (“SBA”) Mortgage Note; (3.) SBA facilitated equipment loan and (4.) certain Capital Leases for vehicles. The following is a description of the terms and conditions of each facility as of July 31, 2011:
First Merchants Bank, N.A. Term Loans: The Company has three term loans with First Merchants Bank: Term Loan A has a balance due of $2,079,944 and an interest rate of 8%; Term Loan B has a balance due of $4,728,223 with an interest rate of 9%; and Term Loan C has a balance due of $3,115,167 with an interest rate of 12%. The Term loans expire on January 31, 2012 and are secured by all of the assets of e-biofuels; the personal guarantees of Craig Ducey and Chad Ducey and by a corporate guarantee of the Company. The Company is in compliance with the terms of these notes under the extension agreement.
Cienna Capital/ Small Business Administration Mortgage Note: The Company has a mortgage secured by the real estate and facility located in Middletown, Indiana. The balance due is $1,560,589 with an interest rate of 5.125% . The note is further secured by the personal guarantees of Mr. Craig Ducey and Mr. Chad Ducey. The term of the note is 25.5 years from December 2007.
SBA Equipment Loan: The Company obtained a loan for the purchase of equipment through the issuance of a Debenture in December 2007 in the original amount of $772,000. The balance due is $533,945 with an interest rate of 6.5%. The note is secured by certain equipment located at the Middletown, Indiana plant and further secured by the personal guarantees of Mr. Craig Ducey and Mr. Chad Ducey. The term of the note is 120 months.
Capital Leases: The Company has capital leases related to vehicles used in the operation of the facility at Middletown, Indiana which total $384,662 and have varying market based interest rates.
The level of the Company’s capital expenditures will vary in the future depending on commodity market conditions, upon the level of biodiesel production and oil and gas activity achieved by the Company, the success of its remedial workover operations and upon the availability of capital for discretionary and non-discretionary projects. The Company anticipates that its cash flow will be sufficient to fund its operations at their current levels however, additional funds or borrowings will be required for expansion. Because the timing of acquisitions of additional oil and gas properties is uncertain, additional borrowings will be required to fund new acquisitions and the timing of those borrowings is uncertain.
The Company has also has obtained certain unsecured loans from various individuals and from its Chairman and President, Jeffrey T. Wilson, in the approximate amounts of $1,702,132 and $540,286 as of July 31, 2011. These loans bear market rates of interest and flexible terms and are generally unsecured. These funds have been used to maintain the Company’s biodiesel, oil and gas and mining activities and fund its overhead requirements. As of July 31, 2011, the Company has accrued salaries due its Chairman and President of $377,667 and accounts payable due to Werks Management, a company owned by Craig Ducey and Chad Ducey, in the amount of $90,238. Management believes that the Company may need to borrow additional funds from these sources in the future, however there is no assurance such funding sources will continue to make advances to the Company.
At July 31, 2011, the Company had current assets of $8,162,140, including $900,883 in cash and cash equivalents, $1,549,154 in trade and oil and gas accounts receivable, $3,344,919 in advanced biofuels funds due from the USDA and $1,293,171 in inventories. The Company had current liabilities of $21,095,322, which resulted in negative working capital of $12,933,182. The negative working capital position is comprised of senior debt of $10,4459,949; trade accounts payable of $1,307,854; of accrued expenses payable of $5,183,849 consisting primarily of ; accrued liabilities for feedstock purchases of $2,945,134; amounts due customers of $2,901,054 for biodiesel that was not delivered during the year; accrued salaries payable to the Company’s President of $377,677, accrued income taxes of $355,000, and oil and gas suspense accounts; notes payable to the related parties of $540,286; and short-term unsecured third party notes payable of $1,702,132. As of July 31, 2011 the Company had cash and cash equivalents of $900,883.
The results of operations of the Company are seasonal due to seasonal fluctuations in the market prices for biodiesel, crude oil and natural gas. Due to these seasonal fluctuations, results of operations for individual quarterly periods may not be indicative of results, which may be realized on an annual basis. Because of regional issues with cold weather, biodiesel sales are generally lower in colder climates during the winter months. The Company estimates that seasonal issues related to weather impacts result in a loss of sales of about 2.5%.
39
Table of Contents
The Company’s revenues and the value of its biofuels, oil and natural gas and mining properties have been and will be affected by changes in the prices for biodiesel, crude oil, natural gas and gold prices. The Company’s ability to obtain additional capital on attractive terms is also substantially dependent on the price of these commodities. Prices for these commodities are subject to significant fluctuations that are beyond the Company’s ability to control or predict. Government incentives significantly affect the price of biodiesel as discussed previously.
Off Balance Sheet Arrangements
None.
See above, Capital Resources and Liquidity.
(See above, Capital Resources and Liquidity.)
In connection with the acquisition of e-biofuels, LLC as a wholly-owned subsidiary, the Company assumed senior debt under the following facilities: (1.) First Merchants Bank, N.A. Term Loans; (2.) Cienna Capital/Small Business Administration (“SBA”) Mortgage Note; (3.) SBA facilitated equipment loan and (4.) certain Capital Leases for vehicles. The following is a description of the terms and conditions of each facility as of July 31, 2011:
First Merchants Bank, N.A. Term Loans: The Company has three term loans with First Merchants Bank: Term Loan A has a balance due of $2,079,944 and an interest rate of 8%; Term Loan B has a balance due of $4,728,223 with an interest rate of 9%; and Term Loan C has a balance due of $3,115,167 with an interest rate of 12%. The Term loans expire on January 31, 2012 and are secured by all of the assets of e-biofuels; the personal guarantees of Craig Ducey and Chad Ducey and by a corporate guarantee of the Company. The Company is in compliance with the terms of these notes under the extension agreement.
Cienna Capital/ Small Business Administration Mortgage Note: The Company has a mortgage secured by the real estate and facility located in Middletown, Indiana. The balance due is $1,560,589 with an interest rate of 5.125% . The note is further secured by the personal guarantees of Mr. Craig Ducey and Mr. Chad Ducey. The term of the note is 25.5 years from December 2007.
SBA Equipment Loan: The Company obtained a loan for the purchase of equipment through the issuance of a Debenture in December 2007 in the original amount of $772,000. The balance due is $533,945 with an interest rate of 6.5%. The note is secured by certain equipment located at the Middletown, Indiana plant and further secured by the personal guarantees of Mr. Craig Ducey and Mr. Chad Ducey. The term of the note is 120 months.
Capital Leases: The Company has capital leases related to vehicles used in the operation of the facility at Middletown, Indiana which total $384,662 and have varying market based interest rates.
Other Debt: The Company has private notes and debt with various individuals, small companies and its Chairman that totals $1,702,132 as of July 31, 2011. Generally this debt is unsecured and bear market interest rates and flexible terms.
| ITEM 7A. | Quantitative and Qualitative Disclosure about Market Risk. |
Our major commodity price risk exposure is to the prices received for our biodiesel, natural gas and oil production and prices paid for biodiesel feedstock. Realized prices for our production are the spot prices applicable to biodiesel, natural gas and crude oil. Purchase prices for biodiesel feedstocks are generally based on spot prices and are under short term contracts, usually month to month. Prices received for biodiesel, natural gas and oil are volatile and unpredictable and are beyond our control.
For every $0.10 per gallon decrease in the sales price of biodiesel at our current rate of production of 30 MMGPY and assuming there is not a comparable decline in the cost of feedstocks, our revenues will decrease approximately $3.0 million and our net income would decline by $0.20 million. The breakeven price for biodiesel assuming that feedstock costs remain constant and do not decrease with decreasing biodiesel prices is approximately $3.70 per gallon. Currently biodiesel prices are approximately $5.50 per gallon. However, it should be noted that as shown earlier, changes in waste grease prices generally mirror biodiesel prices due to the fact that the highest value that can be obtained by marketers of waste greases is
40
Table of Contents
currently in sales to biodiesel producers. Consequently, it is likely that as long as abundant supplies of waste greases remain available for biodiesel production, very little impact would actually occur due to price adjustments in biodiesel until such prices reach the marginal price under which such waste greases can be sold as animal feed additives or roughly $0.15/lb or $1.20 per gallon in feedstock costs or $2.40 per gallon in biodiesel prices.
Government incentives significantly affect the price of biodiesel in the market, as discussed above. Currently the Blender’s Credit ($1.00/gallon tax credit received by parties that blend B100 with petroleum diesel) is set to expire at the end of calendar 2011. While the Company generally does not receive this credit, indirectly, the subsidy has an impact on overall biodiesel prices and their relation to petroleum diesel prices. Previously in early 2010, when the Blender’s Tax Credit was allowed to expire, as a result of the mandated requirements imposed by RFS2, RIN values increased over a period of a few months and offset the impact to biodiesel prices by the loss of the credit. We would anticipate that a similar adjustment in RIN values would occur again, if the credit is allowed to expire. As a result, we would estimate that the short term impact to a loss of the Blender’s Tax Credit would be reduction in revenues over a three month period and would result in a reduction in annual revenues of about 7%. We believe net income would only be impacted during the adjustment period as RIN values increase and as a result we would estimate the impact to net income to be a reduction of approximately 1-2% for fiscal 2012.
A legislative change that eliminated the RFS2 incentives could have a material adverse effect on our biodiesel sales prices by reducing the price of biodiesel to an equivalent price for petroleum diesel and by eliminating the significant demand premium that biodiesel currently receives. We would estimate that if biodiesel prices were to decline to the current level of petroleum diesel prices and assuming that waste grease prices declined as well in accordance with historical data, our gross margins would be about $0.37/gallon. Our revenues would be decreased by about and 31% while net income would be reduced by about 46%.
We have long-term debt subject to risk of loss associated with movements in interest rates.
| ITEM 8. | Financial Statements and Supplementary Data. |
Our consolidated financial statements are included in this report beginning of page F-1.
| ITEM 9. | Changes in and Disagreements with Accountants on Accounting and Financial Disclosure. |
None.
| ITEM 9A. | Controls and Procedures. |
In connection with the preparation of this annual report on Form 10-K/A, our President and Chief Executive Officer, evaluated the effectiveness of the design and operation of our disclosure controls and procedures as of July 31, 2011, pursuant to Rule 13a-15 under the Securities Exchange Act of 1934, as amended (the “Exchange Act”). Based upon that evaluation , our President and Chief Executive Officer concluded that as of July 31, 2011 our disclosure controls and procedures were not effective to provide reasonable assurance that information required to be disclosed by us in reports that we file or submit under the Exchange Act, is recorded, processed, summarized and reported, within the time periods specified in the Security and Exchange Commission’s rules and forms; and to ensure that information required to be disclosed by us in the reports that we file under the Exchange Act is accumulated and communicated to management, including our certifying officers, as appropriate, to allow timely decisions regarding required disclosures.
Management’s Report on Internal Control over Financial Reporting.
Our Management is responsible for establishing and maintaining adequate internal control over financial reporting as defined in Rules 13a-15(c) and (d) of the Exchange Act. Our internal controls are designed to provide reasonable assurance that the reported financial information is presented fairly, financial disclosures are adequate and that the judgments inherent in the preparation of financial statements are reasonable and in accordance with generally accepted accounting principles of the United States of America (GAAP).
Because of its inherent limitations, a system of internal control over financial reporting can provide only reasonable assurance and may not prevent or detect misstatements. Therefore, even those systems determined to be effective can provide only reasonable assurance with respect to financial statement preparation and presentation. Further, because of changes in conditions, effectiveness of internal control over financial reporting may vary over time.
A significant deficiency is a control deficiency, or combination of control deficiencies, that adversely affects the company’s ability to initiate, authorize, record, process, or report external financial data reliably in accordance with generally accepted accounting principles such that there is more than a remote likelihood that a misstatement of the company’s annual
41
Table of Contents
or interim financial statements that is more than inconsequential will not be prevented or detected. An internal control material weakness is a significant deficiency, or combination of significant deficiencies, that results in more than a remote likelihood that a material misstatement of the annual or interim financial statements will not be prevented or detected.
As part of our compliance efforts relative to Section 404 of the Sarbanes-Oxley Act of 2002, our management assessed the effectiveness of our internal control over financial reporting as of July 31, 2011. In making this assessment, management used the criteria set forth in the Internal Control – Integrated Framework by the Committee of Sponsoring Organizations of the Treadway Commission (“COSO”). We evaluated control deficiencies identified through our test of the design and operating effectiveness of controls over financial reporting to determine whether the deficiencies, individually or in combination, are significant deficiencies or material weaknesses. In performing the assessment, our management has identified two material weaknesses in internal control over financial reporting existing as of July 31, 2011. Our evaluation of the significance of each deficiency included both quantitative and qualitative factors. Based on that evaluation, the Company’s management concluded that as of July 31, 2011, and as of the date that the evaluation of the effectiveness of our internal controls and procedures was completed, the Company’s internal controls are not effective, for the reason discussed below:
Segregation of Duties
As a result of lack of employees, we were unable to meet certain segregation of duties criteria during most of the past fiscal year and did not have existing resources for creating a compensating control mechanism. During our evaluation of our internal controls, Mr. Wilson, our combined Chief Executive Officer and Chief Financial Officer, identified the inability to include proper segregation of transaction authorization, transaction processing and custody within our accounting department, resulting in a material weakness in our internal controls over financial reporting. Despite our material weakness regarding our segregation of duties, we believe that our financial statements included in this report fairly present in all material respects the Company’s financial condition, results of operations and cash flows for the periods presented and that this report does not contain any untrue statement of a material fact or omit to state a material fact necessary to make the statements made, in light of the circumstances under which such statements were made, not misleading with respect to the period covered by this report.
Lack of Effective Accounting Systems to Match Sales Volumes to Contract Volumes
The Company’s accounting system was not able to provide real-time tracking of biodiesel volumes delivered to customers and as a result relied on manual tracking of sales volumes by contracts and as a result was subject to error. The Company under-delivered approximately 577,831gallons of biodiesel through the end of fiscal 2011 that had been paid for by the customer.
Remediation Initiative
With the acquisition of e-biofuels, we have added additional accounting personnel, including a Vice President of Finance, a Controller and a logistics individual at e-Biofuels, which accounts for 99% of our business. We implemented a new accounting system at e-Biofuels to allow our accounting staff to more effectively track sales and inventory and to improve the overall accuracy of our reporting. We are consolidating our overall accounting functions under the control of our accounting staff at e-Biofuels and integrating accounting systems under the new system in place.
Other than the weaknesses identified above and our remediation of the weaknesses, there were no other changes in our internal control over financial reporting that occurred during our most recent fiscal quarter that have materially affected, or are reasonably likely to materially affect, our internal control over financial reporting.
This annual report does not include an attestation report of the Company’s registered public accounting firm regarding internal control over financial reporting. Management’s report was not subject to attestation by the Company’s registered public accounting firm pursuant to temporary rules of the Securities and Exchange Commission that permits the Company to provide only management’s report in this annual report.
No additional changes in internal controls were made during the year ended July 31, 2011.
| ITEM 9B. | Other Information. |
None.
42
Table of Contents
| ITEM 10. | Directors and Executive Officers of Registrant. |
Directors and Executive Officers
The following table sets forth certain information regarding the directors, executive officers and key employees of the Company.
| Name |
Age | Position | ||||
| Jeffrey T. Wilson |
58 | Director, Chairman of the Board, President and Chief Executive Officer | ||||
| Ben Campbell |
70 | Director | ||||
| Aaron M. Wilson |
32 | Director | ||||
| John Ryer |
48 | Director | ||||
| J. Gregory Thagard |
48 | Director | ||||
Jeffrey T. Wilson has been Director, Chairman of the Board, President and Chief Executive Officer of the Company since August 1993. Mr. Wilson was a Director, Chairman and President of LaTex Resources, Inc., an affiliate of the Company, and was the founder of its principal operating subsidiary, LaTex Petroleum Corporation. Prior to his efforts with LaTex, Mr. Wilson was Director and Executive Vice President of Vintage Petroleum, Inc. and was employed by Vintage in various engineering and acquisition assignments from 1983 to 1991. From August 1980 to May 1983 Mr. Wilson was employed by Netherland, Sewell & Associates Inc., a petroleum consulting firm. Mr. Wilson began his career in the oil and gas business in June 1975 with Exxon Company USA in various assignments in the Louisiana and South Texas areas. Mr. Wilson holds a Bachelor of Science Degree in Mechanical Engineering from Rose-Hulman Institute of Technology.
Ben Campbell became a Director of the Company in July 2011. Ben is a 1963 graduate of Texas A&M and completed graduate studies in petroleum engineering at the University of Tulsa. Ben has over 35 years in Oil & Gas Industry in field and managerial positions in exploration, production, transportation and downstream marketing for independent and major O&G companies. More recently Ben has been active in developing biomass sources for ethanol and bio diesel.
Aaron M. Wilson has been a Director of the Company since August 2001. Mr. Wilson is a Vice President of HN Corporation and is the Manager of the Successories franchise store located at Castleton Square Mall owned by HN Corporation. Mr. Wilson received a dual degree in Business Economics and Political Science from the University of Kentucky in 2002. Mr. Wilson is currently active with the Company’s biofuels efforts for the Hoosier Biodiesel subsidiary.
John Ryer has been a Director of the Company since August, 2010 and replaced Malcolm Henley upon his resignation. Mr. Ryer has extensive experience in the financial and financial services industry.
J. Gregory Thagard became a Director of the Company upon the resignation of Mr. Clements in August 2007. Mr. Thagard has extensive oil and gas experience as a landman and has recently been the managing partner of Hillside Oil and Gas LLC. Mr. Thagard is a 1978 graduate of the University of Texas and holds a Bachelor of Science degree.
Other Key Management:
Craig Ducey– President-EBIO received his Bachelors Degree from Indiana University in 1994. Upon graduating, Mr. Ducey worked for a short time as a Quality Control Manager with Young Door, before leaving to take a position with Playwerks, Inc. At Playwerks, Mr. Ducey was responsible for building and implementing multiple facets of the business, including marketing and business development. During his tenure with Playwerks, revenue grew from $40,000 in 1995 to more than $14 million in 2005. In February 2004, Mr. Ducey started an engineering firm, Werks Management, LLC with two other partners, where he played a pivotal role in developing the company from the ground up. Mr. Ducey still devotes time to this venture today. In August 2006, he started e-Biofuels with three other partners. As the president of e-Biofuels, Mr. Ducey was instrumental in the design and development of the Company’s manufacturing facilities and overseas the day-to-day management of the biodiesel business of the Company. In 2006, Mr. Ducey received the National Business Man of the Year Award, which he followed up with the Congressional Merit Award in 2007.
Chad Ducey: Chief Operating Officer-EBIO received his Bachelor’s Degree from the Rose-Hulman Institute of Technology in 1998. While in school, Mr. Ducey held engineering positions with Cyprus-Amax Coal Company and
43
Table of Contents
Burgess and Niple. Upon graduating, he took a position as Field Engineer with Blast Design International where he was tasked with designing explosions using three-dimensional lasers, borehole path probes, and proprietary software. In 2002, he left Blast Design to take a Project Engineer position with Indiana American Water, where he was eventually promoted to Operations Supervisor. In March 2004, he started an engineering firm, Werks Management, LLC, with his brother and another partner. In 2006, Mr. Ducey, along with his brother and two other partners, started e-Biofuels, where Mr. Ducey is the Company’s acting COO. His engineering expertise played a major role in the design and construction of the Company’s production facility in Middletown, Indiana. In addition to Mr. Ducey’s role in the design of e-Biofuels’ production facility, he is also responsible for expanding the Company’s manufacturing capacity and developing internal systems that improve the Company’s overall efficiency and its ability to handle multiple feedstocks.
Section 16(a) Reporting Deficiencies
Section 16(a) of the Exchange Act requires the Company’s directors and officers and persons who own more than 10% of a registered class of the Company’s equity securities, to file initial reports of ownership on Form 3 and reports of changes in ownership on Forms 4 and 5 with the SEC and the National Association of Securities Dealers (“NASD”). Such persons are required by SEC regulation to furnish the company with copies of all Section 16(a) forms they file.
Based upon a review of From 3, 4 and 5 filings made by the Company’s officers and directors during the past fiscal year ended July 31, 2011 under Section 16(a) of the Exchange Act, the Company believes that all requisite filings have been made timely.
44
Table of Contents
ITEM 11. Executive Compensation.
The table below sets forth, in summary form, (1) compensation paid to Jeffrey T. Wilson, the Company’s Chairman of the Board, President and Chief Executive Officer and (2) other compensation paid to officers and directors of the Company. Except as provided in the table below, during the three fiscal years ended July 31, 2011, 2010 and 2009 (i) no restricted stock awards were granted, (ii) no stock appreciation or stock options were granted, (iii) no options, stock appreciation rights or restricted stock awards were exercised, and (iv) except as provided below, no awards under any long term incentive plan were made to any officer or director of the Company.
SUMMARY COMPENSATION TABLE
| Annual Compensation | Long Term Awards Warrants |
|||||||||||||
| Name and Principal Position |
Year | Salary | Bonus | # shares | ||||||||||
| Jeffrey T. Wilson* |
2011 | $ | 156,000 | 200,000 | ||||||||||
|
|
||||||||||||||
| 2010 | $ | 140,000 | 800,000 | |||||||||||
|
|
||||||||||||||
| 2009 | $ | 140,000 | — | |||||||||||
|
|
||||||||||||||
| Annalee C. Wilson** |
2011 | 100,000 | ||||||||||||
|
|
|
|
||||||||||||
| 2010 | 400,000 | |||||||||||||
|
|
|
|
||||||||||||
| 2009 | — | |||||||||||||
|
|
|
|
||||||||||||
| Aaron M. Wilson |
2011 | $ | 96,000 | 200,000 | ||||||||||
|
|
|
|
||||||||||||
| 2010 | 400,000 | |||||||||||||
|
|
|
|
||||||||||||
| 2009 | — | |||||||||||||
|
|
|
|
||||||||||||
| Malcolm W. Henley** |
2011 | — | ||||||||||||
|
|
|
|
||||||||||||
| 2010 | 400,000 | |||||||||||||
|
|
|
|
||||||||||||
| 2009 | — | |||||||||||||
|
|
|
|
||||||||||||
| J. Greg Thagard |
2011 | 100,000 | ||||||||||||
|
|
|
|
||||||||||||
| 2010 | 400,000 | |||||||||||||
|
|
|
|
||||||||||||
| 2009 | — | |||||||||||||
|
|
|
|
||||||||||||
| John Ryer |
2011 | 200,000 | ||||||||||||
|
|
|
|
||||||||||||
| 2010 | — | |||||||||||||
|
|
|
|
||||||||||||
| 2009 | — | |||||||||||||
|
|
|
|
||||||||||||
| Ben Campbell |
2011 | — | ||||||||||||
|
|
|
|
||||||||||||
| 2010 | — | |||||||||||||
|
|
|
|
||||||||||||
| 2009 | — | |||||||||||||
|
|
|
|
||||||||||||
| * | Mr. Wilson’s salary was accrued and unpaid through June 2011. |
| ** | Mr. Henley resigned effective August 16, 2010. Mrs. Wilson resigned effective July 13, 2011. |
None of the executive officers listed received prerequisites or other personal benefits that exceeded the greater of $50,000 or 10% of the salary and bonus for such officers. Directors are currently not paid for their service to the Company. Mr. Thagard received compensation as a consultant to the Company and its subsidiaries in the current fiscal year ending July 31, 2011 in the amount of $84,000. Mr. Thagard settled his accounts payable due from the Company in the amount of $154,500 in exchange for restricted common stock in an amount of 259,542 shares and $20,000 in cash on June 21, 2011.
Craig Ducey, as President of e-Biofuels and Chad Ducey as COO of e-Biofuels are each paid through the relationship with Werks Management. Werks Management is currently paid $62,833 per month by the Company.
The Board of Directors, through the Compensation Committee, from both publicly disclosed sources and from private discussions, periodically determines the level of executive compensation and any increases thereto based on comparable salaries for executives of similar sized companies within our industry in setting the compensation for Mr. Wilson. The Board
45
Table of Contents
believes that the compensation of Mr. Wilson, in light of his many duties typically performed by more than one person, is insufficient compared to the compensation levels for executives of a similar type and functioning in companies of a similar size and will be recommending an increase in salary.
ITEM 12. Security Ownership of Certain Beneficial Owners and Management.
As of July 31, 2011, the Company has 34,905,136 issued and outstanding shares of common stock. The following table sets forth, as of July 31, 2011, the number and percentage of shares of common stock of the Company owned beneficially by (i) each director of the Company, (ii) each executive officer of the Company, (iii) all directors and officers as a group, and (iv) each person known to the Company to own of record or beneficially own more than 5% of the Company’s common stock. Except as otherwise listed, the stockholders listed in the table have sole voting and investment power with respect to the shares listed. As of July 31,2011, the Company had approximately 625 holders of common stock of record.
| Name of Beneficial Owner |
Number of Shares Beneficially Owned |
Percent of Class | ||||||
| Jeffrey T. Wilson (1)(4) |
2,617,275 | 7.5 | % | |||||
| Annalee C. Wilson (2)(4) |
717,155 | 2.1 | % | |||||
| Aaron M. Wilson (3)(4) |
87,475 | 0.3 | % | |||||
| J. Greg Thagard (5) |
1,709,542 | 4.9 | % | |||||
| John Ryer(6) |
143,640 | 0.4 | % | |||||
| Ben Campbell (7) |
50,000 | 0.1 | % | |||||
| Craig Ducey (8) |
3,254,787 | 9.3 | % | |||||
| Chad Ducey (9) |
3,254,787 | 9.3 | % | |||||
| All Officers and Directors (7 people) |
11,834,661 | 33.9 | % | |||||
| Taghmen Ventures Ltd (10) |
1,000,000 | 2.9 | % | |||||
| Total officers, directors and 5% shareholders |
12,834,661 | 36.8 | % | |||||
| (1) | The mailing address of Mr. Jeffrey Wilson is PO Box 1006, Evansville, IN 47706. Includes 147,395 shares held jointly with Mrs. Wilson; includes 416,753 shares owned by HN Corporation in which Mr. Wilson owns 33.3%. Does not include 75,000 shares held in Trust by Old National Bank for Mr. Wilson’s children |
| (2) | The mailing address of Mrs. Annalee Wilson is PO Box 1006, Evansville, IN 47706. Includes 147,396 shares held jointly with Mr. Wilson; includes 833,634 shares owned by HN Corporation in which Mrs. Wilson owns 66.7%. Does not include 75,000 shares held in Trust by Old National Bank for Mrs. Wilson’s children. |
| (3) | The mailing address for Mr. Aaron Wilson is PO Box 1006, Evansville, IN 47706. Includes 31,635 shares held in Trust by Old National Bank. |
| (4) | The mailing address of HN Corporation is 3117 N First Ave., Evansville, IN 47710. Mrs. Annalee Wilson is the President of HN Corporation, Jeffrey T. Wilson is the Vice President of HN Corporation and Aaron M. Wilson is a Vice President of HN Corporation. |
| (5) | The mailing address of Greg Thagard is PO Box 1006, Evansville, IN 47706. The shares are beneficially owned by Valley Falls Company, an entity owned by Mr. Thagard. |
| (6) | The mailing address of John Ryer is PO Box 1006, Evansville, IN 47706. |
| (7) | The mailing address of Ben Campbell is PO Box 1006, Evansville, IN 47706. |
| (8) | The address of Craig Ducey is 701 Norfleet Drive West, Middletown, IN. |
| (9) | The address of Chad Ducey is 701 Norfleet Drive West, Middletown, IN. |
| (10) | The address of Taghmen Ventures Ltd. is EFG House, St Julian’s Avenue, St Peter Port Guernsey. |
| ITEM 13. | Certain Relationships and Related Transactions. |
Jeffrey T. Wilson, Chairman, President and Chief Executive Officer of the Company has made unsecured loans to the Company which total $540,286 in principal as of July 31, 2011 and has accrued salaries due from the Company of $377,677.
HN Corporation, a private retail company owned by Mr. Wilson and his wife, has made unsecured loans to the Company from time-to-time which total $90,000 in principal as of July 31, 2011. Annalee Wilson serves as the President of HN Corporation and owns 66.7% of its common stock, Jeffrey T. Wilson serves as the Vice President and Secretary of HN Corporation and owns 33.3% of its stock and Aaron M. Wilson serves as a Vice President of HN Corporation.
Mr. Thagard, a director of the Company, has received compensation as a consultant to the Company and its subsidiaries in the current fiscal year ending July 31, 2011 in the amounts of $84,000. . Mr. Thagard settled his accounts receivable due from the Company in the amount of $154,500 in exchange for restricted common stock in an amount of 259,542 shares and $20,000 in cash on June 21, 2011.
46
Table of Contents
Mr. Greg Thagard owns Valley Falls Company and owns 1,000,000 shares of the Company’s common stock as a result of the sale of certain assets to the Company and subsequently to Cave Energy.
Mr. Craig Ducey, president of e-Biofuels, is part owner along with Mr. Chad Ducey, COO of e-Biofuels, of Werks Management, a company that provides contract consulting services to e-biofuels. Werks Management receives a contracted amount per month in consulting fees for such services. The contracted amount was $70,000 per month through October of 2010, $60,000 per month from November of 2010 to April of 2011, and $62,833 per month from May of 2011 to July of 2011. Mr. Craig Ducey and Mr. Chad Ducey provide the primary management services for e-Biofuels and are its President and COO, respectively. The Company recorded expenses to Werks Management in the total of $758,500 for the year ended July 31, 2011. The Company owed Werks Management $90,238 and $128,511 as of July 31, 2011 and 2010, respectively.
During July of 2011, the Company entered into a loan agreement loaning Mr. Chad Ducey $340,000 at an interest rate of 5%. The loan has a term of 25 years, is unsecured, and will mature in July of 2036. The current balance on this note receivable is $339,429 as of July 31, 2011.
In September of 2011, Mr. Brian Carmichael, a former owner of Werks Management and Sales Manager for e-Biofuels, signed a new consulting agreement with e-biofuels and will receive a commission of $0.015 per gallon of biodiesel sold through the Middletown, Indiana plant. The agreement was subsequently modified and the amount reduced as the Company began selling larger volumes of biodiesel to Mr. Carmichael’s company, Element Renewable Energy. The agreement has a term of one year and automatically renews in one year increments . Mr. Carmichael no longer owns an interest in Werks Management as a result of this agreement. The Company instituted sales controls during fiscal 2011 to provide additional management oversight of sales contracts to Element, wherein the VP of Finance is required to approve any sales contracts by the Company to Element to insure the contracts are arms-length. The total paid to Mr. Carmichael and his company in relation to this agreement was $294,799 for the year ended July 31, 2011.
| ITEM 14. | Principal Accountant Fees and Services. |
The following table presents the fees for professional audit services rendered by the accountancy firm of Weaver Martin & Samyn, LLC for the audit of the Company’s annual consolidated financial statements for the fiscal year ended July 31, 2011 and for the fiscal year ended July 31, 2010, and fees for other services rendered during those periods:
| Fee Category |
Fiscal 2011 | Fiscal 2010 | ||||||
| Audit Fees |
$ | 89,250 | $ | 69,750 | ||||
| Audit-Related Fees |
$ | 0 | $ | 0 | ||||
| Tax Fees |
$ | 0 | $ | 0 | ||||
| All Other Fees |
$ | 0 | $ | 0 | ||||
|
|
|
|
|
|||||
| Total Fees |
$ | 89,250 | $ | 69,750 | ||||
Audit fees include fees related to the services rendered in connection with the annual audit of the Company’s consolidated financial statements, the quarterly reviews of the Company’s quarterly reports on Form 10-Q and the reviews of and other services related to registration statements and other offering memoranda. The audit fees in 2011 were higher than those incurred in 2010 due to the acquisition of e-biofuels.
Audit-related fees are for assurance and related services by the principal accountants that are reasonably related to the performance of the audit or review of the Company’s financial statements.
Tax Fees include (i) tax compliance, (ii) tax advice, (iii) tax planning, and (iv) tax reporting.
All Other Fees includes fees for all other services provided by the principal accountants not covered in the other categories such as litigation support, etc.
All of the services for 2011 and 2010 were performed by the full-time, permanent employees of Weaver Martin & Samyn, LLC.
All of the 2011 services described above were approved by the Audit Committee pursuant to the SEC rule that requires audit committee pre-approval of audit and non-audit services provided by the Company’s independent auditors to the extent that rule was applicable during fiscal year 2011. Weaver Martin & Samyn, LLC has not provided any services unrelated to the audit during fiscal year 2011 or 2010.
47
Table of Contents
| ITEM 15. | Exhibits, Financial Statement Schedules and Reports on Form 8-K. |
| (a) | Financial Statements and Schedules |
Financial Statements of Imperial Petroleum, Inc.
Reports of Independent Public Accountants;
Consolidated Balance Sheets as of July 31, 2011 and 2010;
Consolidated Statements of Operations for the years ended July 31, 2011, 2010, and 2009;
Consolidated Statements of Stockholder Equity for the years ended July 31, 2011, 2010, and 2009;
Consolidated Statements of Cash Flows for the years ended July 31, 2011, 2010, and 2009;
Notes to Consolidated Financial Statements.
Supplemental Financial Information
Other Schedules are omitted as they are not required.
| (b) | Reports on Form 8-K |
The following reports were filed with the SEC on the dates shown and are included herein by reference:
8/15/05 8-K: Change of Auditors to Briscoe, Burke & Grigsby LLP
8/31/05 8-K: Termination of Merger Agreement with United Heritage Corporation.
12/7/05 8-K: Amendment #3 to Credit Facility and Forbearance Agreement.
2/24/06 8-K: Waiver Agreement with Senior Lender
5/9/06 8-K: Purchase and Sale Agreement with Whittier Energy Company and Premier Natural Resources LLC
7/6/06 DEF 14A: Definitive Proxy
8/4/06: 8-K: Notice of results of Annual Meeting
8/22/06: 8-K: Closing of sale of assets to Whittier & Premier
10/16/06 Change of auditors to Weaver & Martin LLC.
4/18/07: 8-K: Refinance of Senior and Subordinated Debt.
6/22/07: 8-K: Definitive Agreement to acquire assets from Apollo Resources International Inc.
8/07/07: 8-K: Termination of Apollo acquisition.
4/15/08: 8-K: Forbearance Agreement and Amendment Number 1 to Credit Agreement.
10/15/08: 8-K: Notice of Default on Forbearance Agreement.
11/17/08: 8-K: New Forbearance Agreement.
12/23/08: 8-K: Amendment of Forbearance Agreement to extend date.
05/06/09: 8-K: Closing of Settlement Agreement and Sale of Properties.
06/09/09: 8-K: Execution of Stock Subscription Agreement with Novus.
02/26/10: 8-K: Stock Purchase Agreement with e-biofuels, LLC.
03/29/10: 8-K: Extension of Closing of e-biofuels, LLC Agreement.
05/25/10: 8-K: Closing of e-biofuels, LLC.
08/18/2010: 8-K Resignation of Malcolm Henley from the Board; Appointment of John Ryer.
09/13/2010: 8-K Execution of Heartland Resources Purchase and Sales Agreement.
10/04/2010: 8-K Second Amendment to Credit Facility for e-Biofuels.
02/03/2011: 8-K Agreement with Clean Sands International.
03/22/2011: 8-K Third Amendment of Credit Facility for e-Biofuels.
05/16/2011: 8-K Conversion of Promissory Notes.
06/15/2011: 8-K Resignation of Annalee Wilson from the Board; Appointment of Ben Campbell.
09/22/2011: 8-K Completion of PIPE transaction.
48
Table of Contents
| (c) | Exhibits |
| Exhibit Number |
Description | |
| 3.1 | Certificate of Incorporation of the Registrant incorporated herein by reference to exhibit B of the Form 10. | |
| 3.2 | Bylaws of the Registrant incorporated herein by reference to Exhibit B of the Form 10. | |
| 16.1 | Letter re: change in certifying accountant. Included by reference to exhibit of Form 8-K, as filed with the SEC on August 16, 2006. | |
| 31.1 | Certification of Chief Executive Officers as adopted pursuant to Section 302 of the Sarbanes-Oxley Act of 2002. Filed herewith. | |
| 32.1 | Certification of president and Chief Financial Officer as adopted pursuant to Section 302 of the Sarbanes-Oxley Act of 2002. Filed herewith. | |
| 99 | Additional Exhibits: Not applicable. | |
49
Table of Contents
Pursuant to the requirements of Section 13 or 15(d) of the Securities Exchange Act of 1934, the Registrant has duly caused this report to be signed on its behalf by the undersigned, thereunto duly authorized. Imperial Petroleum, Inc.
| IMPERIAL PETROLEUM, INC. | ||
| Date: October 21, 2011 | /s/ JEFFREY T. WILSON | |
| Jeffrey T. Wilson, President and Chief Executive Officer | ||
Pursuant to the requirements of the Securities Act of 1934, this report has been signed below by the following persons on behalf of the Registrant and in the capacities and on the dates indicated:
| Signature |
Title |
Date | ||
| /S/ JEFFREY T. WILSON Jeffrey T. Wilson |
President and Chief Executive Officer (Principal Executive Officer) and Director |
October 21, 2011 | ||
50
Table of Contents
IMPERIAL PETROLEUM, INC.
Index to Consolidated Financial Statements
Audited Financial Statements of Imperial Petroleum, Inc.
(See Item 15: Exhibits, Financial Statements and Reports on Form 8-K)
| Page | ||||
| F-2 | ||||
| F-3 | ||||
| F-5 | ||||
| F-6 | ||||
| F-7 | ||||
| F-8 | ||||
F-1
Table of Contents
IMPERIAL PETROLEUM, INC.
REPORTS OF INDEPENDENT REGISTERED PUBLIC ACCOUNTING FIRM
Board of Directors
Imperial Petroleum, Inc. and Subsidiaries
Evansville, Indiana
We have audited the accompanying consolidated balance sheet of Imperial Petroleum, Inc. and Subsidiaries as of July 31, 2011 and 2010, and the related consolidated statements of operations, stockholders’ equity, and cash flows for the three years ended July 31, 2011. These consolidated financial statements are the responsibility of the Company’s management. Our responsibility is to express an opinion on these financial statements based on our audit.
We conducted our audits in accordance with the standards of the Public Company Accounting Oversight Board (United States). Those standards require that we plan and perform the audits to obtain reasonable assurance about whether the financial statements are free of material misstatement. The Company is not required to have, nor were we engaged to perform, an audit of its internal control over financial reporting. Our audit included consideration of internal control over financial reporting as a basis for designing audit procedures that are appropriate in the circumstances, but not for the purpose of expressing an opinion on the effectiveness of the Company’s internal control over financial reporting. Accordingly, we express no opinion. An audit includes examining, on a test basis, evidence supporting the amounts and disclosures in the financial statements. An audit also includes assessing the accounting principles used and significant estimates made by management, as well as evaluating the overall financial statement presentation. We believe that our audit provides a reasonable basis for our opinion.
In our opinion, the consolidated financial statements referred to above present fairly, in all material respects, the consolidated financial position of Imperial Petroleum, Inc. and Subsidiaries as of July 31, 2011 and 2010, and the consolidated results of its operations, stockholders’ equity and its cash flows for the three years ended July 31, 2011, in conformity with U. S. generally accepted accounting principles.
The accompanying consolidated financial statements have been prepared assuming that the Company will continue as a going concern. As discussed in Note 2 to the financial statements, the Company has suffered recurring losses from operations and is dependent upon obtaining debt financing for funds to meet its cash requirements. These factors raise substantial doubt about the Company’s ability to continue as a going concern. Management’s plans with regard to these matters are also described in Note 2. The financial statements do not include any adjustments that might result from the outcome of this uncertainty.
| /s/ Weaver Martin & Samyn, LLC |
| Kansas City Missouri |
| October 21, 2011 |
F-2
Table of Contents
IMPERIAL PETROLEUM, INC.
July 31, 2011 and 2010
| 2011 | 2010 | |||||||
| ASSETS |
||||||||
| Current Assets: |
||||||||
| Cash |
$ | 900,883 | $ | 28,525 | ||||
| Accounts Receivable |
1,549,154 | 121,252 | ||||||
| Accounts Receivable (Government Incentives) |
3,344,919 | — | ||||||
| Inventory |
1,293,171 | 139,350 | ||||||
| Prepaid expenses (current portion) |
910,407 | 376,086 | ||||||
| Loan Receivable (related party) |
6,440 | — | ||||||
| Other Current Assets |
157,166 | 42,100 | ||||||
|
|
|
|
|
|||||
| Total current assets |
8,162,140 | 707,313 | ||||||
| Property, plant and equipment: |
||||||||
| Mining claims, options, and development costs |
74,500 | — | ||||||
| Fixed Assets |
11,969,451 | 10,709,669 | ||||||
| Land |
515,900 | 273,900 | ||||||
| Oil and gas properties (full cost method) |
4,690,765 | 3,530,375 | ||||||
|
|
|
|
|
|||||
| 17,250,616 | 14,513,944 | |||||||
| Less: accumulated depreciation, depletion and amortization |
(3,092,503 | ) | (2,296,270 | ) | ||||
|
|
|
|
|
|||||
| Net property, plant and equipment |
14,158,113 | 12,217,674 | ||||||
| Other assets: |
||||||||
| License agreements, net of accumulated amortization . |
442,756 | 208,833 | ||||||
| Loan Receivable (related party) |
332,989 | — | ||||||
| Prepaid expenses |
1,438,722 | — | ||||||
|
|
|
|
|
|||||
| Total Other Assets |
2,214,467 | 208,833 | ||||||
|
|
|
|
|
|||||
| Total assets |
$ | 24,534,720 | $ | 13,133,820 | ||||
|
|
|
|
|
|||||
The accompanying notes are an integral part of these consolidated financial statements.
F-3
Table of Contents
IMPERIAL PETROLEUM, INC.
Consolidated Balance Sheet
July 31, 2011 and 2010
| 2011 | 2010 | |||||||
| LIABILITIES AND SHAREHOLDERS’ EQUITY |
||||||||
| Current liabilities: |
||||||||
| Accounts payable |
$ | 1,307,654 | $ | 2,896,376 | ||||
| Accrued expenses |
5,183,849 | 5,218,908 | ||||||
| Customer Deposit Liability |
2,901,054 | 320,375 | ||||||
| Notes payable – current portion |
702,530 | 1,633,849 | ||||||
| Notes payable – related parties |
540,286 | 434,574 | ||||||
| Term Loans |
9,923,335 | 11,067,608 | ||||||
| Other Senior Debt |
536,614 | 670,643 | ||||||
| Other Current Liabilities |
— | 238,023 | ||||||
|
|
|
|
|
|||||
| Total current liabilities |
21,095,322 | 22,480,356 | ||||||
| Long-term liabilities: |
||||||||
| Mortgage Note |
1,525,641 | 1,533,464 | ||||||
| Notes Payable, Other |
1,009,602 | 649,031 | ||||||
| Notes payable, related parties |
— | 3,750,000 | ||||||
| Asset retirement obligation |
472,855 | 439,087 | ||||||
|
|
|
|
|
|||||
| Total long-term liabilities |
3,008,098 | 6,371,472 | ||||||
| STOCKHOLDERS’ EQUITY: |
||||||||
| Common stock of $.006 par value; authorized 150,000,000 shares; 34,905,136 and 21,364,813 issued and outstanding at July 31, 2011 and 2010, respectively |
209,431 | 128,190 | ||||||
| Common stock, owed but not issued - 100,000 and 1,000,000 shares at July 31, 2011 and 2010, respectively |
600 | 6,000 | ||||||
| Paid-in capital |
21,977,786 | 11,979,071 | ||||||
| Retained deficit |
(21,756,517 | ) | (27,831,379 | ) | ||||
|
|
|
|
|
|||||
| Total stockholders’ equity |
431,300 | (15,718,118 | ) | |||||
|
|
|
|
|
|||||
| Total liabilities and stockholders’ equity |
24,534,720 | $ | 13,133,820 | |||||
|
|
|
|
|
|||||
The accompanying notes are an integral part of these consolidated financial statements.
F-4
Table of Contents
IMPERIAL PETROLEUM, INC.
Consolidated Statements of Operations
For the Years Ended July 31, 2011, 2010 and 2009
| 2011 | 2010 | 2009 | ||||||||||
| Revenues and other income: |
||||||||||||
| Biodiesel |
$ | 105,681,725 | $ | 5,500,774 | — | |||||||
| Biodiesel Government Incentives |
3,891,830 | — | — | |||||||||
| Oil and gas |
398,988 | 158,590 | $ | 1,069,361 | ||||||||
|
|
|
|
|
|
|
|||||||
| Total operating income |
109,972,543 | 5,659,364 | 1,069,361 | |||||||||
|
|
|
|
|
|
|
|||||||
| Costs and expenses: |
||||||||||||
| Biofuels Direct Costs |
95,689,601 | 4,489,314 | — | |||||||||
| Production costs and taxes |
1,102,544 | 638,853 | 985,753 | |||||||||
| Mining lease expense |
— | 1,284 | — | |||||||||
| Impairment Costs |
— | 16,276,784 | — | |||||||||
| General and administrative |
4,295,830 | 1,141,281 | 383,101 | |||||||||
| Depreciation, depletion and amortization |
880,014 | 192,524 | 137,043 | |||||||||
|
|
|
|
|
|
|
|||||||
| Total costs and expenses |
101,967,989 | 22,740,040 | 1,505,897 | |||||||||
|
|
|
|
|
|
|
|||||||
| Net Income (Loss) from operations |
8,004,554 | (17,080,676 | ) | (436,536 | ) | |||||||
| Other income and (expense): |
||||||||||||
| Interest expense |
(1,685,292 | ) | (437,231 | ) | (1,600,431 | ) | ||||||
| Interest income |
36,524 | 528 | 2,594 | |||||||||
| Amortization of loan fees |
— | — | (246,146 | ) | ||||||||
| Gain (loss) on sale of licensing rights |
500,000 | — | — | |||||||||
| Other income (expense) |
(439,167 | ) | (300,807 | ) | (14,615 | ) | ||||||
| Gain (loss) on sale of assets |
13,244 | — | 13,080,577 | |||||||||
|
|
|
|
|
|
|
|||||||
| Total other income and (expense) |
(1,574,691 | ) | (737,510 | ) | 11,221,979 | |||||||
|
|
|
|
|
|
|
|||||||
| Net income (loss) before income tax |
$ | 6,429,863 | (17,818,186 | ) | 10,785,443 | |||||||
| Provision for income taxes |
(355,000 | ) | — | — | ||||||||
|
|
|
|
|
|
|
|||||||
| Net Income (Loss) |
6,074,863 | $ | (17,818,186 | ) | $ | 10,785,443 | ||||||
|
|
|
|
|
|
|
|||||||
| NET INCOME/(LOSS) PER SHARE (basic) |
$ | 0.229 | $ | (0.99 | ) | $ | 0.64 | |||||
|
|
|
|
|
|
|
|||||||
| WEIGHTED AVERAGE SHARES OUTSTANDING (basic) |
26,493,613 | 18,003,438 | 16,694,441 | |||||||||
| NET INCOME/(LOSS) PER SHARE (diluted) |
$ | 0.214 | $ | N/A | $ | 0.64 | ||||||
|
|
|
|
|
|
|
|||||||
| WEIGHTED AVERAGE SHARES OUTSTANDING (diluted) |
28,395,536 | N/A | 16,694,441 | |||||||||
The accompanying notes are an integral part of these consolidated financial statements.
F-5
Table of Contents
IMPERIAL PETROLEUM, INC.
Consolidated Statements of Stockholders’ Equity
For the Years Ended July 31, 2011, 2010 and 2009
| Common Stock | Additional Paid-In Capital |
Common Stock, owed but not Issued |
Retained Deficit |
Treasury Stock |
Total Stockholder’s Equity |
|||||||||||||||||||||||
| Shares | Par Value | |||||||||||||||||||||||||||
| BALANCE, July 31, 2008 |
16,964,441 | $ | 101,788 | $ | 11,511,265 | — | $ | (20,798,631 | ) | $ | (707,304 | ) | $ | (9,892,882 | ) | |||||||||||||
| Net income for the year |
— | — | — | — | 10,785,443 | — | 10,785,443 | |||||||||||||||||||||
|
|
|
|
|
|
|
|
|
|
|
|
|
|
|
|||||||||||||||
| Balance as of July 31, 2009 |
16,964,441 | $ | 101,788 | $ | 11,511,265 | — | $ | (10,013,189 | ) | $ | (707,304 | ) | $ | 892,560 | ||||||||||||||
|
|
|
|
|
|
|
|
|
|
|
|
|
|
|
|||||||||||||||
| Stock Issued for acquisition |
3,000,000 | 18,000 | 453,000 | — | — | — | 471,000 | |||||||||||||||||||||
| Stock Issued for services |
250,000 | 1,500 | 190,000 | 6,000 | — | — | 197,500 | |||||||||||||||||||||
| Warrant exercise |
400,000 | 2,400 | 37,600 | — | — | — | 40,000 | |||||||||||||||||||||
| Board Warrants |
— | — | 265,109 | — | — | — | 265,109 | |||||||||||||||||||||
| Cancel Treasury/Other Shares |
(409,628 | ) | (2,458 | ) | (704,846 | ) | — | — | 707,304 | — | ||||||||||||||||||
| Stock Issued for License |
1,000,000 | 6,000 | 204,000 | — | — | — | 210,000 | |||||||||||||||||||||
| Stock Issued for Notes |
160,000 | 960 | 22,940 | — | — | — | 22,940 | |||||||||||||||||||||
| Net loss for the year |
— | — | — | — | (17,818,186 | ) | — | (17,818,186 | ) | |||||||||||||||||||
|
|
|
|
|
|
|
|
|
|
|
|
|
|
|
|||||||||||||||
| Balance as of July 31, 2010 |
21,364,813 | $ | 128,190 | $ | 11,979,071 | $ | 6,000 | $ | (27,831,379 | ) | $ | — | $ | (15,718,118 | ) | |||||||||||||
|
|
|
|
|
|
|
|
|
|
|
|
|
|
|
|||||||||||||||
| Stock Issued for fixed assets |
3,141,669 | 18,850 | 1,399,818 | — | — | — | 1,418,668 | |||||||||||||||||||||
| Stock and warrants issued for services |
1,170,000 | 7,020 | 2,425,990 | — | — | — | 2,433,010 | |||||||||||||||||||||
| Stock issued that was owed |
1,000,000 | 6,000 | — | (6,000 | ) | — | — | — | ||||||||||||||||||||
| Warrant exercise |
609,744 | 3,658 | (4,258 | ) | 600 | — | — | — | ||||||||||||||||||||
| Options issued for compensation |
— | — | 479,193 | — | — | — | 479,193 | |||||||||||||||||||||
| Payables converted to stock |
7,618,910 | 45,713 | 5,697,972 | — | — | — | 5,743,685 | |||||||||||||||||||||
| Net income for the year |
— | — | — | — | 6,074,863 | — | 6,074,863 | |||||||||||||||||||||
|
|
|
|
|
|
|
|
|
|
|
|
|
|
|
|||||||||||||||
| Balance as of July 31, 2011 |
34,905,136 | 209,431 | 21,977,786 | 600 | (21,756,517 | ) | — | 431,300 | ||||||||||||||||||||
|
|
|
|
|
|
|
|
|
|
|
|
|
|
|
|||||||||||||||
The accompanying notes are an integral part of these consolidated financial statements.
F-6
Table of Contents
IMPERIAL PETROLEUM, INC.
Consolidated Statements of Cash Flows
For the Years Ended July 31, 2011, 2010 and 2009
| 2011 | 2010 | 2009 | ||||||||||
| Operating activities: |
||||||||||||
| Net gain/loss |
$ | 6,074,863 | $ | (17,818,186 | ) | $ | 10,785,443 | |||||
| Adjustments to reconcile net loss to net cash provided by (used in) operating activities: |
||||||||||||
| Depreciation, depletion and amortization |
880,015 | 192,524 | 383,189 | |||||||||
| Stock and warrants issued for services |
348,598 | 221,399 | — | |||||||||
| Options issued for compensation |
479,193 | 265,109 | — | |||||||||
| Amortization of stock and options issued for services |
343,579 | — | — | |||||||||
| Impairment expense |
— | 16,276,784 | — | |||||||||
| Gain on sale and disposal of assets |
(13,246 | ) | — | (13,080,577 | ) | |||||||
| Gain on sale of licensing rights |
(500,000 | ) | — | — | ||||||||
| Change in accounts receivable |
(1,429,263 | ) | 19,052 | 823,304 | ||||||||
| Change in Accts. Rec – government incentives |
(3,344,919 | ) | — | — | ||||||||
| Change in inventory |
(1,153,821 | ) | (87,095 | ) | — | |||||||
| Change in prepaid expenses |
(232,209 | ) | — | — | ||||||||
| Change in accounts payable |
(1,089,912 | ) | 149,067 | (710,015 | ) | |||||||
| Change in other assets |
(115,066 | ) | (408,418 | ) | — | |||||||
| Change in other liabilities |
— | 117,204 | (289,720 | ) | ||||||||
| Change in customer deposits |
2,580,679 | — | — | |||||||||
| Change in accrued expenses |
618,011 | 644,753 | 41,490 | |||||||||
|
|
|
|
|
|
|
|||||||
| Net cash provided by (used in) operating activities |
3,446,502 | (427,807 | ) | (2,046,886 | ) | |||||||
| Investing activities: |
||||||||||||
| Cash acquired in acquisition |
— | 32,903 | — | |||||||||
| Purchase of fixed assets |
(1,190,601 | ) | (104,843 | ) | (434,407 | ) | ||||||
| Loans made to related parties, net |
(339,429 | ) | — | — | ||||||||
| Proceeds from certificates of deposit |
— | 52,500 | 23,406 | |||||||||
| Proceeds of sale of licensing rights |
250,000 | — | — | |||||||||
| Proceeds of sale of assets |
221,213 | 64,000 | 15,251,261 | |||||||||
|
|
|
|
|
|
|
|||||||
| Net cash provided by (used in) investing activities |
(1,058,817 | ) | $ | 44,560 | $ | 14,840,260 | ||||||
|
|
|
|
|
|
|
|||||||
| Financing activities: |
||||||||||||
| Advances on notes payable |
947,000 | 436,451 | 10,000 | |||||||||
| Payments on notes payable |
(2,462,327 | ) | — | (429,568 | ) | |||||||
| Proceeds from notes payable-related party |
— | — | 5,000 | |||||||||
| Payments on Line of credit |
— | — | (12,528,775 | ) | ||||||||
| Payments to notes payable-related party |
— | (81,832 | ) | (18,750 | ) | |||||||
| Proceeds from stock warrants exercised |
— | 40,000 | — | |||||||||
|
|
|
|
|
|
|
|||||||
| Net cash provided by (used in) financing activities |
(1,515,327 | ) | 394,619 | (12,962,093 | ) | |||||||
|
|
|
|
|
|
|
|||||||
| Net change in cash and cash equivalents |
872,358 | 11,372 | (168,719 | ) | ||||||||
| Cash and cash equivalents, beginning of year |
28,525 | 17,153 | 185,872 | |||||||||
|
|
|
|
|
|
|
|||||||
| Cash and cash equivalents, end of year |
900,883 | 28,525 | 17,153 | |||||||||
|
|
|
|
|
|
|
|||||||
| Supplemental disclosures for cash flow information: |
||||||||||||
| Cash paid during the period for: |
||||||||||||
| Interest |
$ | 1,298,255 | $ | 394,619 | $ | 4,057,763 | ||||||
| Income taxes |
— | — | — | |||||||||
| Supplemental schedule of non-cash investing and financing: |
||||||||||||
| Note payable issued for acquisition |
— | 3,750,276 | — | |||||||||
| Stock issued for acquisition |
— | 400,000 | — | |||||||||
| Stock issued for fixed assets |
1,418,668 | 281,000 | — | |||||||||
| Note payable converted to stock |
4,353,781 | — | — | |||||||||
| Accounts payable converted to stock |
498,810 | — | — | |||||||||
| Stock and warrants issued for prepaid expenses |
2,084,412 | — | — | |||||||||
| Options issued for compensation |
479,193 | 265,109 | — | |||||||||
| Stock and warrants issued for services |
348,598 | 221,399 | — | |||||||||
| Note payable issued for fixed assets |
617,947 | — | — | |||||||||
| Accrued expenses converted to stock |
891,094 | — | — | |||||||||
The accompanying notes are an integral part of these consolidated financial statements
F-7
Table of Contents
IMPERIAL PETROLEUM, INC.
Notes to Consolidated Financial Statements
For the Years Ended July 31, 2011, 2010 and 2009
1. SUMMARY OF SIGNIFICANT ACCOUNTING POLICIES
Organization
Imperial Petroleum, Inc. (the “Company”), a publicly held corporation, was organized under the laws of the state of Nevada.
The Company’s principal business consists of biodiesel production and oil and gas exploration and production in the United States. The Company, through its wholly owned subsidiary, Ridgepointe Mining Company is attempting to obtain capital, continue testing, defining and developing mineral reserves on mining claims it owns or operates in the southwestern and western United States. At July 31, 2011, the Company had not begun mining activities.
Basis of Presentation
The consolidated financial statements include the accounts of the Company and its wholly owned subsidiaries, Ridgepointe Mining Company, Imperial Chemical Company (formerly The Rig Company ), Hoosier Biodiesel Company (formerly Global-Imperial Joint Venture, Inc.), Arrakis Oil Recovery, LLC, and e-Biofuels, LLC. All significant inter-company accounts and transactions have been eliminated in consolidation.
Use of Estimates
The presentation of financial statements in conformity with generally accepted U.S. accounting principles requires management to make estimates and assumptions that affect the reported amounts of assets and liabilities and disclosure of contingent assets and liabilities at the date of the financial statements and the reported amounts of revenues and expenses during the reporting period. Actual results could differ from those estimates.
Cash and Cash Equivalents
For purposes of the statement of cash flows, the Company considers all highly liquid debt instruments purchased with a maturity of three months or less to be cash equivalents.
Accounts Receivable
Accounts receivable are carried on a gross basis, with no discounting, less the allowance for doubtful accounts. We estimate the allowance for doubtful accounts based on existing economic conditions, the financial conditions of the customers, and the amount and the age of past due accounts. Receivables are considered past due if full payment is not received by the contractual due date. Past due accounts are generally written off against the allowance for doubtful accounts only after all collection attempts have been exhausted. There is no collateral held for accounts receivable. The allowance for doubtful accounts was $44,430 and $0 as of July 31, 2011 and 2010, respectively. Bad debt expense for the year ended July 31, 2011, 2010, and 2009 was $25,001, $0, and $0, respectively.
Fair Value of Financial Instruments
Fair values of cash and cash equivalents, investments and short-term debt approximate their carrying values due to the short period of time to maturity. Fair values of long-term debt are based on quoted market prices or pricing models using current market rates, which approximate carrying values. See Note 15 for further details.
Concentrations of Credit Risk
Financial instruments that potentially subject the Company to significant concentrations of credit risk consist principally of cash and accounts receivable.
The Company’s cash is deposited in four financial institutions. Cash and certificates of deposit at banks are insured by the FDIC up to $250,000. At times, the balances in these accounts may be in excess of federally insured limits. As of July 31, 2011, the Company had approximately $540,000 in excess of federally insured limits.
The Company currently operates in the oil and gas and biodiesel production industry. The concentration of credit risk in a single industry affects the Company’s overall exposure to credit risk because customers may be similarly affected by changes in economic and other conditions. During the year ended July 31, 2011, the Company’s major purchasers of its biodiesel were 36.3% to Fusion Renewables; 24.5% to Element Renewable Energy and 17.1% to Pilot. As of July 31, 2011,
F-8
Table of Contents
these three customers made up 19%, 9%, and 26% of the Company’s accounts receivable, respectively. During the year ended July 31, 2010, the Company’s major purchasers of its biodiesel were29.8% to Pilot, 26.4% to RKA Petroleum, and 20.6% to Flying J. During the year ended July 31, 2011, the Company’s major purchasers of its oil and gas were Plains Marketing and Regency Energy Services, accounting for 95% and 5% of oil and gas revenues respectively. As of July 31, 2011, Plains Marketing made up 18% of the Company’s accounts receivable. The Company’s major purchasers of its oil and gas during 2010 were Plains Marketing and Professional Oil & Gas., accounting for 85% and 15.0% of oil and gas revenues, respectively.
Revenue Recognition
The Company derives revenue from sales of oil, gas, and biodiesel products. The Company recognizes revenue when a formal arrangement exists, the price is fixed or determinable, all obligations have been performed pursuant to the terms of the formal arrangement, and collectability is reasonably assured. The Company also derives revenues from government incentive programs relating to biodiesel production. These revenues are recognized when the amount of the incentive is reasonably determinable and collection is reasonably assured.
Oil and Gas Properties
The Company follows the full cost method of accounting for oil and gas properties. Accordingly, all costs associated with acquisition, exploration, and development of oil and gas reserves, including directly related overhead costs, are capitalized. All capitalized costs of oil and gas properties, including the estimated future costs to develop proved reserves, are amortized on the unit-of-production method using estimates of proved reserves. Investments in unproved properties and major development projects are not amortized until proved reserves associated with the projects can be determined or until impairment occurs. If the results of an assessment indicate that the properties are impaired, the amount of the impairment is added to the capitalized costs to be amortized.
In addition, the capitalized costs are subject to a “ceiling test,” which basically limits such costs to the aggregate of the “estimated present value,” discounted at a 10-percent interest rate of future net revenues from proved reserves, based on current economic and operating conditions, plus the lower of cost or fair market value of unproved properties.
Sales of proved and unproved properties are accounted for as adjustments of capitalized costs with no gain or loss recognized, unless such adjustments would significantly alter the relationship between capitalized costs and proved reserves of oil and gas, in which case the gain or loss is recognized in income.
Other Property and Equipment
Property and equipment are stated at cost. Depreciation is computed by the straight-line method over the estimated useful lives of assets. Expenditures that significantly increase values or extend useful lives are capitalized. Expenditures for maintenance and repairs are charged to expenses as incurred. Upon sale or retirement of property and equipment, the cost and related accumulated depreciation and depletion are eliminated from the respective accounts and the resulting gain or loss is included in current earnings.
Mining exploration costs are expensed as incurred. Development costs are capitalized. Depletion of capitalized mining costs will be calculated on the units of production method based upon current production and reserve estimates when placed in service.
Inventories
Inventories are stated at the lower of cost or market. The inventory as of July 31, 2011 and 2010 was $1,293,171 and $139,350, respectively. All inventory pertains to our operations at e-biofuels. The balance of the inventory as of July 31, 2011 is made up of $641,331 in raw materials and $651,840 in finished goods . The balance of the inventory as of July 31, 2010 is made up of $52,941 in raw materials and $86,409 in finished goods. There is no allowance for obsolete inventory as of July 31, 2011 or 2010.
Long-Lived Assets
Long-lived assets to be held and used or disposed of other than by sale are reviewed for impairment whenever events or changes in circumstances indicate that the carrying amount may not be recoverable. When required, impairment losses on assets to be held and used or disposed of other than by sale are recognized based on the fair value of the asset. Long-lived assets to be disposed of by sale are reported at the lower of its carrying amount of fair value less cost to sell.
F-9
Table of Contents
Amortization of Financing Fees
Deferred financing fees are amortized ratably over the term of the related debt. Amortization expense for the years ended July 31, 2011, 2010 and 2009 was $0, $0, and $ 246,146, respectively.
Income Taxes
Deferred tax assets and liabilities are recognized for the estimated future tax consequences attributable to differences between the financial statement carrying amounts of existing assets and liabilities and their respective tax bases. Deferred tax assets and liabilities are measured using enacted tax rates in effect for the year in which those temporary differences are expected to be recovered or settled. The effect on deferred tax assets and liabilities of change in tax rates is recognized in income in the period that includes the enactment date. See Note 5 for further details.
Earnings and Loss Per Common Share
Earnings (Loss) per common share-basic is computed by dividing reported net income (loss) by the weighted average common shares outstanding. Except where the result would be anti-dilutive, net income (loss) per common share-diluted has been computed assuming the exercise of stock warrants and stock options that are in-the-money as of year-end.
Reclassification
Certain reclassifications have been made to prior periods to conform to the current presentation.
Recent Accounting Pronouncements
The FASB issued ASC subtopic 855-10 (formerly SFAS 165 “Subsequent Events”), incorporating guidance on subsequent events into authoritative accounting literature and clarifying the time following the balance sheet date which management reviewed for events and transactions that may require disclosure in the financial statements. The Company has adopted this standard. The standard increased our disclosure by requiring disclosure reviewing subsequent events. ASC 855-10 is included in the “Subsequent Events” accounting guidance.
In April 2009, the FASB issued ASC subtopic 820-10 (formerly Staff Position No. FAS 157-4, Determining Fair Value When Volume and Level of Activity for the Asset or Liability Have Significantly Decreased and Identifying Transactions That Are Not Orderly”). ASC 820-10 provides guidance on how to determine the fair value of assets and liabilities when the volume and level of activity for the asset/liability has significantly decreased. FSP 157-4 also provides guidance on identifying circumstances that indicate a transaction is not orderly. In addition, FSP 157-4 requires disclosure in interim and annual periods of the inputs and valuation techniques used to measure fair value and a discussion of changes in valuation techniques. The Company determined that adoption of FSP 157-4 did not have a material impact on its results of operations and financial position.
In July 2006, the FASB issued ASC subtopic 740-10 (formerly Interpretation No. (“FIN”) 48, “Accounting for Uncertainty in Income Taxes”). ASC 740-10 sets forth a recognition threshold and valuation method to recognize and measure an income tax position taken, or expected to be taken, in a tax return. The evaluation is based on a two-step approach. The first step requires an entity to evaluate whether the tax position would “more likely than not,” based upon its technical merits, be sustained upon examination by the appropriate taxing authority. The second step requires the tax position to be measured at the largest amount of tax benefit that is greater than 50 percent likely of being realized upon ultimate settlement. In addition, previously recognized benefits from tax positions that no longer meet the new criteria would no longer be recognized. The application of this Interpretation will be considered a change in accounting principle with the cumulative effect of the change recorded to the opening balance of retained earnings in the period of adoption. Adoption of this new standard did not have a material impact on our financial position, results of operations or cash flows.
In April 2008, the FASB issued ASC 815-40 (formerly Emerging Issues Task Force (“EITF”) 07-05, “Determining whether an Instrument (or Embedded Feature) Is Indexed to an Entity’s Own Stock”). ASC815-40 applies to any freestanding financial instruments or embedded features that have the characteristics of a derivative, and to any freestanding financial instruments that are potentially settled in an entity’s own common stock. ASC 815-40 is effective for financial statements issued for fiscal years beginning after December 15, 2008. The adoption of this pronouncement did not have a material impact on its financial position, results of operations or cash flows.
In June 2009, the FASB issued ASC 105 Accounting Standards Codification TM and the Hierarchy of Generally Accepted Accounting Principles. The FASB Accounting Standards Codification TM (the “Codification”) has become the source of authoritative accounting principles recognized by the FASB to be applied by nongovernmental entities in the preparation of financial statements in accordance with Generally Accepted Accounting Principles (“GAAP”). All existing accounting standard documents are superseded by the Codification and any accounting literature not included in the
F-10
Table of Contents
Codification will not be authoritative. Rules and interpretive releases of the SEC issued under the authority of federal securities laws, however, will continue to be the source of authoritative generally accepted accounting principles for SEC registrants. Effective September 30, 2009, all references made to GAAP in our consolidated financial statements will include references to the new Codification. The Codification does not change or alter existing GAAP and, therefore, will not have an impact on our financial position, results of operations or cash flows.
In June 2009, the FASB issued changes to the consolidation guidance applicable to a variable interest entity (VIE). FASB ASC Topic 810, “Consolidation,” amends the guidance governing the determination of whether an enterprise is the primary beneficiary of a VIE, and is, therefore, required to consolidate an entity, by requiring a qualitative analysis rather than a quantitative analysis. The qualitative analysis will include, among other things, consideration of who has the power to direct the activities of the entity that most significantly impact the entity’s economic performance and who has the obligation to absorb losses or the right to receive benefits of the VIE that could potentially be significant to the VIE. This standard also requires continuous reassessments of whether an enterprise is the primary beneficiary of a VIE. FASB ASC 810 also requires enhanced disclosures about an enterprise’s involvement with a VIE. Topic 810 is effective as of the beginning of interim and annual reporting periods that begin after November 15, 2009. This will not have an impact on the Company’s financial position, results of operations or cash flows.
In June 2009, the FASB issued Financial Accounting Standards Codification No. 860 - Transfers and Servicing. FASB ASC No. 860 improves the relevance, representational faithfulness, and comparability of the information that a reporting entity provides in its financial statements about a transfer of financial assets; the effects of a transfer on its financial position, financial performance, and cash flows; and a transferor’s continuing involvement, if any, in transferred financial assets. FASB ASC No. 860 is effective as of the beginning of each reporting entity’s first annual reporting period that begins after November 15, 2009, for interim periods within that first annual reporting period and for interim and annual reporting periods thereafter. The adoption of FASB ASC No. 860 will not have an impact on the Company’s financial statements.
In June 2011, the FASB issued ASU 2011-05 Comprehensive Income (Topic 220 - Presentation of Comprehensive Income). Under this amendment, an entity has the option to present the total of comprehensive income, the components of net income, and the components of other comprehensive income either in a single continuous statement of comprehensive income or in two separate but consecutive statements. In both choices, an entity is required to present each component of net income along with total net income, each component of other comprehensive income along with a total for other comprehensive income, and a total amount for comprehensive income. This Update eliminates the option to present the components of other comprehensive income as part of the statement of changes in stockholders’ equity. The amendments in this Update do not change the items that must be reported in other comprehensive income or when an item of other comprehensive income must be reclassified to net income. For public entities, the amendments in this ASU are effective for fiscal years, and interim periods within those years, beginning after December 15, 2011. We are evaluating the provisions of ASU 2011-05 and do not believe it will have a material impact on the Company’s consolidated financial statements.
In May 2011, the FASB issued ASU No. 2011-04, Fair Value Measurement (Topic 820): Amendments to Achieve Common Fair Value Measurement and Disclosure Requirements in U.S. GAAP and IFRSs. This ASU represents the converged guidance of the FASB and the IASB (the Boards) on fair value measurement. The collective efforts of the Boards and their staffs, reflected in ASU 2011-04, have resulted in common requirements for measuring fair value and for disclosing information about fair value measurements, including a consistent meaning of the term “fair value.” The Boards have concluded the common requirements will result in greater comparability of fair value measurements presented and disclosed in financial statements prepared in accordance with U.S. GAAP and IFRSs. The amendments to the FASB Accounting Standards Codification™ (Codification) in this ASU are to be applied prospectively. For public entities, the amendments are effective during interim and annual periods beginning after December 15, 2011. Early application is not permitted. We are evaluating the provisions of ASU 2011-04 and do not believe it will have a material impact on the Company’s consolidated financial statements.
In December 2010, the FASB issued ASU No. 2010-28-Intangibles - Goodwill and Other (Topic 350): When to Perform Step 2 of the Goodwill Impairment Test for Reporting Units with Zero or Negative Carrying Amounts (“ASU 2010-28”). The amendments in this ASU modify Step 1 of the goodwill impairment test for reporting units with zero or negative carrying amounts. For those reporting units, an entity is required to perform Step 2 of the goodwill impairment test if it is more likely than not that a goodwill impairment exists. In determining whether it is more likely than not that a goodwill impairment exists, an entity should consider whether there are any adverse qualitative factors indicating that an impairment may exist. The qualitative factors are consistent with the existing guidance and examples, which require that goodwill of a reporting unit be tested for impairment between annual tests if an event occurs or circumstances change that would more likely than not reduce the fair value of a reporting unit below its carrying amount. For public entities, the amendments in this ASU are effective for fiscal years, and interim periods within those years, beginning after December 15, 2010. The adoption of ASU 2010-28 did not have a material impact on the Company’s consolidated financial statements.
F-11
Table of Contents
In December 2010, the FASB issued ASU 2010-29-Business Combinations (Topic 805): Disclosure of Supplementary Pro Forma Information for Business Combinations (“ASU 2010-29”). The amendments in this ASU affect any public entity as defined by Topic 805, Business Combinations , that enters into business combinations that are material on an individual or aggregate basis. The amendments in this ASU specify that if a public entity presents comparative financial statements, the entity should disclose revenue and earnings of the combined entity as though the business combination(s) that occurred during the current year had occurred as of the beginning of the comparable prior annual reporting period only. The amendments also expand the supplemental pro forma disclosures to include a description of the nature and amount of material, nonrecurring pro forma adjustments directly attributable to the business combination included in the reported pro forma revenue and earnings. The amendments are effective prospectively for business combinations for which the acquisition date is on or after the beginning of the first annual reporting period beginning on or after December 15, 2010. The adoption of ASU 2010-29 did not have a material impact on the Company’s consolidated financial statements.
International Financial Reporting Standards
In November 2008, the Securities and Exchange Commission (“SEC”) issued for comment a proposed roadmap regarding potential use of financial statements prepared in accordance with International Financial Reporting Standards (“IFRS”) as issued by the International Accounting Standards Board. Under the proposed roadmap, the Company would be required to prepare financial statements in accordance with IFRS in fiscal year 2014, including comparative information also prepared under IFRS for fiscal 2013 and 2012. The Company is currently assessing the potential impact of IFRS on its financial statements and will continue to follow the proposed roadmap for future developments.
2. GOING CONCERN
Financial Condition
The Company’s financial statements for the year ended July 31, 2011 have been prepared on a going concern basis which contemplates the realization of assets and the settlement of liabilities in the normal course of business. The Company had a net income for the year ended July 31, 2011 of $6,074,863 , a net loss for the year ended July 31, 2010 of $17,818,318, and net income of $10,785,443 for the year ended July 31, 2009. As of July 31, 2011, the Company has $900,883 of cash on hand and a working capital deficit of $12,578,182. The Company has approximately $9.9 million of debt maturing on January 31, 2012 as discussed in Note 6.
Management Plans to Continue as a Going Concern
With the acquisition of e-Biofuels, LLC in May 2010 and the rapid increase in sales volumes achieved by the Company, the Company believes that its e-Biofuels subsidiary will result in sufficient positive cash flow to maintain the Company’s operations and service its obligations. The Company is also examining new financing options and has sold some equity securities as noted in the Subsequent event footnote.
3. PROPERTY, PLANT and EQUIPMENT
The Company’s property, plant and equipment consist of the following:
| 2011 | 2010 | |||||||
| Biodiesel: Plant and equipment |
$ | 9,209,058 | $ | 8,967,152 | ||||
| Automobiles |
682,336 | 147,417 | ||||||
| Land |
273,900 | 273,900 | ||||||
| Building |
1,614,996 | 1,595,100 | ||||||
| Oil and gas properties |
4,690,765 | 3,275,525 | ||||||
| Mining claims |
74,500 | — | ||||||
| Oil and gas land |
242,000 | — | ||||||
| Oil and gas equipment |
463,061 | 254,850 | ||||||
|
|
|
|
|
|||||
| Total |
17,250,616 | $ | 14,513,944 | |||||
|
|
|
|
|
|||||
F-12
Table of Contents
As of July 31, 2011 and 2010, accumulated depreciation was $$3,092,503 and $2,296,270, respectively. Depreciation, depletion, and amortization expense was $880,014, $192,524, and $137,043 for the years ended July 31, 2011, 2010, and 2009, respectively.
4. ACQUISITIONS, GOODWILL AND GOODWILL IMPAIRMENT:
e-Biofuels, LLC acquisition
On May 24, 2010, the Company acquired the capital stock and assets of e-biofuels, LLC, a biodiesel producer located in Middletown, Indiana with a manufacturing facility having a nameplate capacity of 15 million gallons per year. E-biofuels is now a 100% wholly-owned subsidiary of the Company. The acquisition has been accounted for under the purchase accounting method . Our consolidated financial statements for the year ended July 31, 2010 include the financial results of e-biofuels, LLC. subsequent to the date of the acquisition.
The fair value of the transaction was $4,150,277. The Company issued promissory notes in the amount of $3,750,277 and issued 2,000,000 shares of common stock, which was valued at $400,000 based on the closing market price on the date of closing.
The aggregate purchase price was allocated to the assets acquired on their preliminary estimated fair values at the date of the acquisition. The preliminary estimate of the excess of purchase price over the fair value of net tangible assets acquired was allocated to identifiable intangible assets and goodwill. In accordance with U.S. generally accepted accounting principles, we have up to twelve months from closing of the acquisition to finalize the valuation. The following table summarizes the preliminary estimate of fair value of assets as part of the acquisition with e-biofuels, LLC:
| 2010 | ||||
| Tangible assets acquired, net of liabilities assumed |
$ | (12,126,507 | ) | |
| Goodwill |
16,276,784 | |||
|
|
|
|||
| $ | 4,150,277 | |||
|
|
|
|||
The Company reviewed the goodwill for impairment as of the date of acquisition. Due to the lack of proven future cash flows generated by the assets acquired, the full amount of the goodwill was impaired during the period ended July 31, 2010. Impairment expense relating to this acquisition was $16,276,784 for the year ended July 31, 2010.
Pro forma financial statements
The unaudited pro forma consolidated statement of operations for the years ended July 31, 2010 and 2009 combines the historical results of Imperial Petroleum, Inc. and the unaudited pro forma results of the Company acquired during 2010 and gives effect to the acquisition as if it occurred on August 1, 2008. Pro forma adjustments have been made related to impairment of goodwill. The pro forma consolidated results do not purport to be indicative of results that would have occurred had the acquisition been in effect for the periods presented, nor do they claim to be indicative of the results that will be obtained in the future, and do not include any adjustments for cost savings or other synergies achieved in the consolidations of the companies.
The following table contains unaudited pro forma results for the years ended July 31, 2010 and 2009 as if the acquisition had occurred on August 1, 2008:
| Year Ended July 31, | ||||||||||||||||
| 2010 Reported |
Pro Forma | 2009 Reported |
Pro Forma | |||||||||||||
| Net Revenues |
$ | 5,659,364 | $ | 15,310,340 | $ | 1,069,361 | $ | 30,570,964 | ||||||||
| Net Income (loss) |
$ | (17,818,186 | ) | $ | (20,140,507 | ) | $ | 10,785,443 | $ | 2,264,407 | ||||||
|
|
|
|
|
|
|
|
|
|||||||||
| Net (loss) per share-basic and fully diluted |
$ | (0.99 | ) | $ | (1.12 | ) | $ | 0.64 | $ | 0.14 | ||||||
|
|
|
|
|
|
|
|
|
|||||||||
F-13
Table of Contents
5. INCOME TAXES
Provisions for income taxes are as follows:
| 2011 | 2010 | 2009 | ||||||||||
| (in thousands) | ||||||||||||
| Current: |
||||||||||||
| Federal |
$ | 2,065 | $ | (5,836 | ) | $ | 3,850 | |||||
| State |
516 | (147 | ) | 639 | ||||||||
|
|
|
|
|
|
|
|||||||
| 2,581 | (5,983 | ) | 4,489 | |||||||||
|
|
|
|
|
|
|
|||||||
| Deferred: |
||||||||||||
| Federal |
(2,065 | ) | 5,836 | (3,850 | ) | |||||||
| State |
(161 | ) | 147 | (639 | ) | |||||||
|
|
|
|
|
|
|
|||||||
| $ | (2,226 | ) | $ | 5,983 | $ | (4,489 | ) | |||||
|
|
|
|
|
|
|
|||||||
The following are the tax effects of temporary differences that give rise to significant portions of the deferred tax assets and liabilities:
| 2011 | 2010 | 2009 | ||||||||||
| (in thousands) | ||||||||||||
| Deferred tax liabilities: |
||||||||||||
| Property, plant and equipment |
(822 | ) | $ | (777 | ) | $ | (8 | ) | ||||
| Other |
— | (14 | ) | — | ||||||||
|
|
|
|
|
|
|
|||||||
| Total deferred tax liabilities |
(822 | ) | (791 | ) | $ | — | ||||||
|
|
|
|
|
|
|
|||||||
| Deferred tax assets: |
||||||||||||
| Unrealized loss on securities |
707 | 707 | $ | 707 | ||||||||
| Property, plant and equipment |
— | — | ||||||||||
| Net operating losses |
575 | 2,750 | 1,921 | |||||||||
| Investment in subsidiary |
5,311 | 5,717 | — | |||||||||
| Biodiesel producer carryover credit |
1,687 | 187 | — | |||||||||
| Other |
184 | 162 | 129 | |||||||||
|
|
|
|
|
|
|
|||||||
| Total deferred tax assets |
8,464 | 9,523 | 2,757 | |||||||||
|
|
|
|
|
|
|
|||||||
| Valuation allowance |
(7,642 | ) | (8,732 | ) | (2,757 | ) | ||||||
|
|
|
|
|
|
|
|||||||
| Net deferred tax assets |
— | — | — | |||||||||
|
|
|
|
|
|
|
|||||||
| Net deferred tax asset (liability) |
$ | — | $ | — | $ | — | ||||||
|
|
|
|
|
|
|
|||||||
A valuation allowance is required when it is more likely than not that all or a portion of the deferred tax assets will not be realized. The ultimate realization of the deferred tax assets is dependent upon future profitability. Accordingly, a valuation allowance has been established to reduce the deferred tax assets to a level which, more likely than not, will be realized. The Company has net operating loss (NOL) carry forwards to offset its earnings of approximately $1,690,349 and a tax credit carry forward of approximately $1,687,000. If not utilized, the net operating losses will expire in varying amounts from 2027 to 2029.
In June 2006, the FASB issued ASC subtopic 740-10, “Accounting for Uncertainty in Income Taxes”. This Interpretation provides guidance on recognition, classification and disclosure concerning uncertain tax liabilities. The evaluation of a tax position requires recognition of a tax benefit if it is more likely than not it will be sustained upon examination. We adopted ASC 740-10 effective August 1, 2008. The adoption did not have a material impact on our financial statements.
F-14
Table of Contents
The following table shows a reconciliation of the beginning and ending unrecognized tax benefits (liabilities) for 2011, 2009 and 2008.
| 2011 | 2010 | 2009 | ||||||||||
| Balance at August 1 |
$ | — | $ | — | $ | — | ||||||
| Additions based on tax positions related to the current year |
— | — | — | |||||||||
| Additions for tax positions of prior years |
— | — | — | |||||||||
| Reductions for tax positions of prior years |
— | — | — | |||||||||
| Settlements |
— | — | — | |||||||||
| Lapse of statute |
— | — | — | |||||||||
|
|
|
|
|
|
|
|||||||
| Balance at July 31 |
$ | — | $ | — | $ | — | ||||||
|
|
|
|
|
|
|
|||||||
Allowable tax credits are applied currently as reductions of the provision for income taxes. Interest related to unrecognized tax benefits is reflected in interest expense, and penalties in operating expenses, if applicable.
At July 31, 2011, 2010 and 2009, accrued liabilities for interest and penalties totaled $0, $0 and $0, respectively, net of accrued income taxes. Interest and penalties affecting earnings in 2011, 2010 and 2009 were $0, $0 and $0, respectively.
The Company has filed tax returns in the U.S. federal jurisdiction, Texas, Louisiana, Indiana, Utah and Kentucky. All tax years since 2007 remain subject to examination. The Company does not believe it has a material unrecognized tax benefit or liability, therefore, none is provided.
The amounts of U. S. and foreign income (loss) before income taxes, with a reconciliation of tax at the federal statutory rate with the provision for income taxes were (in thousands):
| Dollars | Percent of Pretax Income | |||||||||||||||||||||||
| 2011 | 2010 | 2009 | 2011 | 2010 | 2009 | |||||||||||||||||||
| Income (loss) before income taxes |
$ | 5,978 | $ | (2,446 | ) | $ | 10,648 | 100 | % | 100.00 | % | 100.00 | % | |||||||||||
| Federal statutory income tax |
(2,032 | ) | 831 | (3,620 | ) | -34 | % | -34.00 | % | -34.00 | % | |||||||||||||
| State income taxes |
(355 | ) | 147 | (639 | ) | -6 | % | -6.00 | % | -6.00 | % | |||||||||||||
| Nondeductible expense and other |
(3,946 | ) | 5,005 | (230 | ) | -66 | % | -204.21 | % | -2.16 | % | |||||||||||||
|
|
|
|
|
|
|
|
|
|
|
|
|
|||||||||||||
| Income tax (provision) benefit |
$ | (355 | ) | $ | 5,983 | $ | (4,489 | ) | -6 | % | 344.21 | % | -42.16 | % | ||||||||||
|
|
|
|
|
|
|
|
|
|
|
|
|
|||||||||||||
F-15
Table of Contents
6. NOTES PAYABLE, TERM LOANS, MORTGAGE NOTE, AND OTHER SENIOR DEBT
| 2011 | 2010 | |||||||
| Gary S. Williky, unsecured promissory note, dated November 24, 1997, principal due on demand plus interest at 9.0% |
$ | — | $ | 5,858 | ||||
| Greg Thagard, unsecured demand note |
— | 4,000 | ||||||
| John Ryer, secured promissory note by 200,000 sh, dated February 25, 2010, due February 25, 2011, interest at 10% |
— | 25,000 | ||||||
| John Ryer, secured promissory note, dated December 8, 2010, due July 25, 2011, interest at 10% |
20,000 | — | ||||||
| Frank Deleo, secured promissory note by 100,000 sh, dated March 5, 2010, due March 5, 2011, interest at 10% |
— | 10,000 | ||||||
| Titan Recovery Services, unsecured promissory note, dated February 10, 2010, due February 10, 2011, interest at 10% |
— | 25,000 | ||||||
| Charles Sickmeir, unsecured promissory note, dated December 11,2009, due December 11, 2010, interest at 10% |
— | 50,000 | ||||||
| Clint Keown, unsecured promissory note, dated December 11, 2009, due December 11, 2010, interest at 10% |
— | 50,000 | ||||||
| William Stratton, secured by 10% of proceeds at Coquille Bay, dated June 6, 2011 due July 31, 2012, interest at 8% |
50,000 | — | ||||||
| Trinity Industries, secured promissory note, dated January 1, 2010, interest at 6%, collateralized by rail cars, due in monthly payments through March of 2014. |
597,484 | 722,228 | ||||||
| Various unsecured promissory notes of e-biofuels, dated July 1, 2006 through September 11, 2009, interest varying from 5.5% to 14% |
627,707 | 1,240,095 | ||||||
| Mortgage note due a Bank, dated July 1, 2006, secured by facility and real estate of e-biofuels, variable interest rate at 5.125% as of July 31, 2011. Due in monthly payments through December of 2031. |
1,560,589 | 1,601,025 | ||||||
| Various equipment capital leases due to Stark Equipment, principal due from August 2011 to May 2014 plus interest at a variable rates range from 9.3% to 18.2% as of 7/31/11. Collateralized by the equipment. |
384,662 | 150,658 | ||||||
| Equipment note due a SBA, dated October 8, 2007, principal matures on November 2017 plus interest at a variable rate, 6.5% as of 7/31/11. Collateralized by certain equipment. |
533,945 | 603,083 | ||||||
| Term Note Payable to a Bank, debt due 1/31/12, monthly. Interest due monthly at 8%. Collateralized by the assets of e-biofuels. |
2,079,944 | 2,789,119 | ||||||
| Term Note Payable to a Bank, debt due 1/31/12, monthly. Interest due monthly at 9%. Collateralized by the assets of e-biofuels. |
4,728,224 | 5,163,322 | ||||||
| Term Note Payable to a Bank, debt due 1/31/12, monthly. Interest due monthly at 12%. Collateralized by the assets of e-biofuels. |
3,115,167 | 3,115,167 | ||||||
|
|
|
|
|
|||||
| Total |
13,697,722 | 15,554,595 | ||||||
|
|
|
|
|
|||||
| Less: current portion |
11,162,479 | 13,372,100 | ||||||
|
|
|
|
|
|||||
| Long-term notes payable |
2,535,243 | 2,182,495 | ||||||
|
|
|
|
|
|||||
Current maturities of notes payable are as follows:
| 7/31/12 |
11,162,479 | |||
| 7/31/13 |
495,029 | |||
| 7/31/14 |
298,006 | |||
| 7/31/15 |
134,866 | |||
| 7/31/16 |
140,158 | |||
| Thereafter |
1,467,184 | |||
|
|
|
|||
| Total |
$ | 13,697,722 | ||
|
|
|
F-16
Table of Contents
Notes Payable – Related Party
| 2011 | 2010 | |||||||
| Officer—7.5% demand note |
$ | 0 | $ | 13,177 | ||||
| Officer—9.0% demand note |
540,286 | 421,122 | ||||||
| Employee—8% demand note |
0 | 1,675,312 | ||||||
| Employee—8% demand note |
0 | 1,675,312 | ||||||
| Employee—8% demand note |
0 | 268,651 | ||||||
| Employee—8% demand note |
0 | 131,000 | ||||||
|
|
|
|
|
|||||
| Total |
540,286 | $ | 4,184,574 | |||||
|
|
|
|
|
|||||
| Less Current |
540,286 | 434,574 | ||||||
|
|
|
|
|
|||||
| Long Term |
0 | 3,750,000 | ||||||
|
|
|
|
|
|||||
DEBT
As of July 31, 2011, the Company currently has no debt facilities in place other than as noted in the tables above.
In addition to the Debt listed in the above tables that had balances due as of July 31, 2011, the Company also borrowed $545,000 during the year ended July 31, 2011. A $20,000 loan was borrowed in December of 2010 and was converted to common stock in April of 2011at 85% of the average closing market price of the stock for the ten business days before the date of conversion. No balance remains on the loan as of July 31, 2011. See note 11 for further details.
A $500,000 loan and a $25,000 loan were borrowed in June of 2011. Both of these loans were converted to common stock immediately. The loans converted at the average closing price of the Company’s common stock for the thirty business days immediately preceding the conversion date. The loans were converted at $0.98 per share. No beneficial conversion feature was recorded on the transactions because the loan was converted immediately and was effectively treated as a stock sale. There was no interest expense related to these notes. No balance remains on these loans as of July 31, 2011.
In May of 2011, $3,750,000 of notes payable – related parties were converted to common stock along with the related accrued interest. A total of $4,037,969 ($3,750,000 of principal and $287,969 of accrued interest) was converted into 5,047,461 shares of common stock at a negotiated price of $0.80 per share.
In addition to the above conversions, an additional $60,000 of debt along with accrued interst of $14,781 was converted to 219,943 shares of common stock during the year ended July 31, 2011.
In connection with the acquisition of e-biofuels, LLC as a wholly-owned subsidiary, the Company assumed senior debt under the following facilities: (1.) First Merchants Bank, N.A. Term Loans; (2.) Cienna Capital/Small Business Administration (“SBA”) Mortgage Note; (3.) SBA facilitated equipment loan and (4.) certain Capital Leases for vehicles. The following is a description of the terms and conditions of each facility as of July 31, 2011:
First Merchants Bank, N.A. Term Loans: The Company has three term loans with First Merchants Bank: Term Loan A has a balance due of $2,079,944 and an interest rate of 8%; Term Loan B has a balance due of $4,728,224 with an interest rate of 9%; and Term Loan C has a balance due of $3,115,167 with an interest rate of 12%. The Term loans expire on January 31, 2012 and are secured by all of the assets of e-biofuels; the personal guarantees of Craig Ducey and Chad Ducey and by a corporate guarantee of the Company. The Company is in compliance with the terms of these notes under the extension agreement. The amended loan agreements call for a continuation fee of $50,000 per month commencing as of October 31, 2011. The Company must pay the fee for each month they have not paid the loan in full on or before the last day of the month.
Cienna Capital/ Small Business Administration Mortgage Note: The Company has a mortgage secured by the real estate and facility located in Middletown, Indiana. The balance due is $1,560,589 with an interest rate of 5.125% . The note is further secured by the personal guarantees of Mr. Craig Ducey and Mr. Chad Ducey. The term of the note is 25.5 years from December 2007.
SBA Equipment Loan: The Company obtained a loan for the purchase of equipment through the issuance of a Debenture in December 2007 in the original amount of $772,000. The balance due is $533,945 with an interest rate of 6.5%. The note is secured by certain equipment located at the Middletown, Indiana plant and further secured by the personal guarantees of Mr. Craig Ducey and Mr. Chad Ducey. The term of the note is 120 months.
F-17
Table of Contents
Capital Leases: The Company has capital leases related to vehicles used in the operation of the facility at Middletown, Indiana which total $384,662 and have varying market based interest rates and varying maturity dates. See the table above.
Other Debt: The Company has private notes and debt with various individuals, small companies and its Chairman that totals $1,702,132 as of July 31, 2011. Generally this debt is unsecured and bear market interest rates and flexible terms.
Interest expense relating to the above notes was $1,685,292, $437,231, and $1,600,431 for the years ended July 31, 2011, 2010, and 2009, respectively.
7. RELATED PARTY TRANSACTIONS
The Company has entered into transactions with its chief executive officer, Jeffrey T. Wilson and a Company owned and controlled by Mr. Wilson, H.N. Corporation. The amount outstanding as of July 31, 2011 owed to HN Corporation was $90,000 and such amounts are included in the totals due Mr. Wilson. There were no outstanding amounts due HN Corporation as of July 31, 2010. The Company had accrued salaries payable to Mr. Wilson of $377,667 and $261,001 as of July 31, 2011 and 2010 respectively.
The Company owes its Chairman and Chief Executive Officer, Jeffrey T. Wilson, as a result of loans to the Company, a total of $540,286 in principal as of July 31, 2011 (including $90,000 owed to HN Corporation as discussed above). Interest rates on the loans are fixed at 9% . All of the loans are secured by a first mortgage granted by the Company to Wilson on the oil and gas assets. Accrued interest as of July 31, 2011 relating to these loans is $113,691.
Mr. Thagard, a director of the Company, has received compensation as a consultant to the Company and its subsidiaries in the current fiscal year ending July 31, 2011 in the amounts of $84,000. In November of 2010, Mr. Thagard used $4,000 of notes payable and $56,000 of accounts payable due him to exercise options that he held. See note 10 for further details. Mr. Thagard settled his accounts payable due him in the amount of $154,500 in exchange for restricted common stock in an amount of 259,542 shares and $20,000 in cash on June 21, 2011.
Mr. Craig Ducey, president of e-Biofuels, is part owner along with Mr. Chad Ducey of Werks Management, a company that provides management services to e-Biofuels. Werks Management receives a contracted amount per month in consulting fees for such services. The contracted amount was $70,000 per month through October of 2010, $60,000 per month from November of 2010 to April of 2011, and $62,833 per month from May of 2011 to July of 2011. Mr. Craig Ducey and Mr. Chad Ducey provide the primary management services for e-Biofuels and are the President and COO, respectively. The Company recorded expenses to Werks Management in the total of $758,500 for the year ended July 31, 2011. The Company owed Werks Management $90,238 and $128,511 as of July 31, 2011 and 2010, respectively.
During July of 2011, the Company entered into a loan agreement loaning Mr. Chad Ducey $340,000 at an interest rate of 5%. The loan has a term of 25 years, is unsecured, and will mature in July of 2036. The current balance on this note receivable is $339,429 as of July 31, 2011.
In September of 2011, Mr. Brian Carmichael, a former owner of Werks Management and Sales Manager for e-Biofuels, signed a new consulting agreement with e-biofuels and will receive a commission of $0.015 per gallon of biodiesel sold through the Middletown, Indiana plant. The agreement was subsequently modified and the amount reduced as the Company began selling larger volumes of biodiesel to Mr. Carmichael’s company, Element Renewable Energy. The agreement has a term of one year and automatically renews in one year increments . Mr. Carmichael no longer owns an interest in Werks Management as a result of this agreement. The Company instituted sales controls during fiscal 2011 to provide additional management oversight of sales contracts to Element, wherein the VP of Finance is required to approve any sales contracts by the Company to Element to insure the contracts are arms-length. The total paid to Mr. Carmichael and his company in relation to this agreement was $294,799 for the year ended July 31, 2011.
In each of December 2009 and in May 2010, the Company issued 2,400,000 warrants to purchase 2,400,000 shares of common stock to its directors (200,000 each) for compensation for their services for a total of 2,400,000 warrants. The warrants had a term of two and three years and a strike price of $0.10 and $0.20 per share respectively. The warrants were valued at $265,109 using the Black Scholes valuation method using the following factors; risk free interest rate of 5.00%, strike prices of $0.10 and $0.20, market price of $0.07 and $0.20, volatility of 178% and 185%, and no yield. The value of the warrants was expensed as compensation expense in the year ended July 31, 2010. See Note 10 for further information pertaining to the warrants.
In April 2011 the company issued 975,000 warrants to purchase 975,000 shares of common stock to its directors and key employees for their services. The warrants had a term of two years and a strike price of $0.50 per share. The warrants were valued at $363,328 using the Black Scholes valuation method using the following factors; risk free interest rate of .85%, strike prices of $0.50, market price of $0.495, volatility of 163% , and no yield. The value of the warrants was expensed as compensation expense in the year ended July 31, 2011. See Note 10 for further information pertaining to the warrants.
F-18
Table of Contents
In June 2011 the company issued 100,000 warrants to purchase 100,000 shares of common stock to a director for his services. The warrants had a term of two years and a strike price of $0.50 per share. The warrants were valued at $115,865 using the Black Scholes valuation method using the following factors; risk free interest rate of .85%, strike prices of $0.50, market price of $1.35, volatility of 163% , and no yield. The value of the warrants was expensed as compensation expense in the year ended July 31, 2011.
8. ASSET RETIREMENT OBLIGATION
Effective January 1, 2003, the Company implemented the requirements of SFAS 143. Among other things, SFAS 143 requires entities to record a liability and corresponding increase in long-lived assets for the present value of material obligations associated with the retirement of tangible long-lived assets. Over the passage of time, accretion of the liability is recognized as an operation expense and the capitalized cost is depleted over the estimated useful life of the related asset. Additionally, SFAS No. 143 requires that upon initial application of these standards, the Company must recognize a cumulative effect of a change in accounting principle corresponding to the accumulated accretion and depletion expense that would have been recognized had this standard been applied at the time the long-lived assets were acquired or constructed. The Company’s asset retirement obligations relate primarily to the plugging, dismantling and removal of wells drilled to date.
Using a credit-adjusted risk free rate of 8%, and estimated useful life of wells ranging from 30-40 years, and estimated plugging and abandonment cost ranging from $7,000 per well to $25,000 per well, the Company has recorded a non-cash fixed asset addition and associated liability related to its property acquisitions of $457,429. Oil and gas properties were increased by $457,429, which represents the present value of all future obligations to retire the wells at July 31, 2011. At July 31, 2011 the obligation was $472,855 as a result of increases in plugging costs and related services and accretion expenses. For the periods ended July 31, 2011 and 2010, respectively, the Company recorded accretion expenses of $35,126 and $32,525 associated with this liability.
9. LITIGATION, COMMITMENTS AND CONTINGENCIES
The Company is a named defendant in lawsuits, is a party in governmental proceedings, and is subject to claims of third parties from time to time arising in the ordinary course of business. While the outcome of lawsuits or other proceedings and claims against the Company cannot be predicted with certainty, management does not expect these matters to have a material adverse effect on the financial position of the Company.
The Company has accrued revenue payable, legal and petty suspense accounts in the amount of $173,907, $409,671 and $8,948, respectively, as of July 31, 2011. The Company has accrued revenue payable, legal and petty suspense accounts in the amount of $173,907, $323,213 and $6,422, respectively, as of July 31, 2010. The Company has continued to research owner account information in order to properly distribute legal suspense accounts in the normal course of business. Suspense accounts are cleared out annually and paid to the owners. The Company has a plugging liability for oil and gas operations in the various states in the amount of $472,855. The Company has plugging bonds posted with the state regulatory agencies in the amount of $1,208,500 to offset the cost of plugging wells in the future.
The Company has no amounts reserved as a contingent liability as of July 31, 2011 against future losses associated with the litigation listed below.
We are subject to a variety of laws and regulations in all jurisdictions in which we operate. We also are involved in legal proceedings, claims or investigations that are incidental to the conduct of our business and cannot be avoided. Some of these proceedings allege damages against us relating to property damage claims (including injuries due to product failure and other product liability related matters), employment matters, and commercial or contractual disputes. We vigorously defend ourselves against all claims which require such action. In future periods, we could be subjected to cash costs or non-cash charges to earnings if any of these matters is resolved on unfavorable terms.
Imperial Petroleum, Inc. versus Ravello Capital LLC
The Company filed suit in Federal District Court in Tulsa County, Oklahoma against Ravello Capital LLC (“Ravello”) on November 20, 2000. The suit alleged breach of contract and sought to have the contract declared partially performed in the amount of $74,800 and sought relief in the amount of $488,390 for the unpaid consideration and punitive damages and attorney’s fees. The Company received a judgment award against Ravello in the amount of $488,390 and subsequently collected and credited the judgment in the amount of $85,638.02 as a result of the re-issuance of certain of its shares in Warrior, held by Ravello in escrow and not released. The Company does not believe it will be successful in collecting the balance of the judgment against Ravello.
F-19
Table of Contents
Gary Bolen, et al vs. Imperial Petroleum, Inc.: Wrongful Garnishment:
The case filed in Midland County, Texas No. CV 45671 on July 24, 2008 stems from a dispute in 2005 in which Pharoh Oil & Gas, a company owned by Mr. Bolen ceased accepting saltwater from the University BX lease despite a valid saltwater disposal agreement in place, owned by Imperial at the time, and resulted Imperial obtaining a monetary judgment against Pharoh and Bolen and executing garnishment procedures to allow the money to be escrowed pending final outcome of that trial. Imperial prevailed in that trial, through the Supreme Court of Texas, and received the judgment proceeds. Bolen contends that the procedures used by Imperial in garnishing the funds to be escrowed were improper and seeks unspecified damages. No activity occurred in the most recent fiscal year on this case. The Company reached a tentative settlement of the lawsuit for the payment of a nominal amount of cash and is completing final agreements for dismissal of the case.
Pearl River Navigation vs. Imperial Petroleum, Inc.
Pearl River conducted barge and crane operations after hurricane Katrina on the Coquille Bay field in Louisiana on behalf of the working interest owners. A dispute arose between the parties regarding the availability of Pearl River’s crane operator on weekends, despite the fact that Pearl River continued to bill for such operations. The Company refused to pay the disputed invoices and Pearl River filed a lien in the amount of approximately $789,000 despite approximately $225,000 in payments by the Company. Pearl River filed a lawsuit dated August 1, 2007 in the 25 th Judicial District Court for the Parish of Plaquemines, State of Louisiana. the case was moved to the United States District Court for the Eastern District of Louisiana, Civil Action No. 07-9619, Section “I”(4). The Company and Pearl River reached a settlement in the matter and Pearl River was granted a judgment in the amount of $100,000 and was assigned an overriding royalty interest in the Coquille Bay field. The Company is making payments against the judgment out of revenue generated at Coquille Bay.
Aventine Renewable Energy Holdings v. e-biofuels, LLC and
e-biofuels, LLC v. Aventine Renewable Energy Holdings
This suit was filed in the United States Bankruptcy Court for the District of Delaware. e-biofuels and Aventine entered into a purchase agreement on April 4, 2008. Aventine was to purchase fuel at $3.815 per gallon for a total of six million gallons. Aventine failed to purchase six million gallons. e-biofuels claims that Aventine initially breached the agreement when it advised e-biofuels of an anticipatory repudiation of the agreement. e-biofuels and Aventine claim more than $2,500,000.00 in damages due to the other’s breach. This case was settled in the fourth quarter of fiscal 2011. The Company paid Aventine $200,000 in cash and issued them 450,000 shares of common stock in full settlement.
Settlemyre Industries, Inc. v. e-biofuels, LLC
Settlemyre brought suit in the United States District Court for the Southern District of Ohio, Western Division alleging that it contracted with e-biofuels to purchase 630,000 gallons of biodiesel from e-biofuels at $3.28 per gallon. The contract included a list of quality requirements and specifications that e-biofuels’ biodiesel must satisfy before Settlemyre would accept delivery. Settlemyre claims that e-biofuels was unable to provide a product to meet the specifications, which resulted in a breach of contract. As a result, Settlemyre had to purchase a similar product from other sellers at an increased price, for which Settlemyre seeks more than $630,000 in damages. e-biofuels claims the product met specifications and Settlemyre wrongfully rejected the product. Further, e-biofuels claims that Settlemyre did not properly cover or mitigate their damages, if any. The case was settled and dismissed. The Company paid Settlemyre $320,000 in the settlement.
Vinmar Overseas, LTD. v. e-biofuels, LLC
Vinmar filed suit in the United States District Court for the Southern District of Texas, Houston Division, claiming that Vinmar and e-biofuels entered into a contract under which e-biofuels agreed to supply 500,000 gallons of FAME B99 to Vinmar. Vinmar claimed that e-biofuels failed to deliver the required quantities of product and owed $2,000,000.00 plus as a result of the breach and lost profit. Vinmar lost its claim of lost profit. Vinmar filed suit in Henry Circuit Court domesticating the judgment in favor of Vinmar and against e-biofuels for $930,546.87. Payments were completed and the case was dismissed during the fourth quarter of fiscal 2011. The Company paid Vinmar $700,000 in cash and issued 250,000 shares of common stock in full settlement.
10. STOCK WARRANTS AND OPTIONS
During the year ended July 31, 2010, the Company issued 2,400,000 warrants to purchase 2,400,000 shares of common stock to its directors (200,000 each) for compensation for their services. The warrants had a term of two and three years and a
F-20
Table of Contents
strike price of $0.10 and $0.20 per share respectively. The warrants were valued at $265,109 using the Black Scholes valuation method using the following factors; risk free interest rate of 5.00%, strike prices of $0.10 and $0.20, market price of $0.07 and $0.20, volatility of 178% and 185%, and no yield. The value of the warrants was expensed as compensation expense in the year ended July 31, 2010.
In April 2011 the company issued 975,000 warrants to purchase 975,000 shares of common stock to its directors and key employees for their services. The warrants had a term of two years and a strike price of $0.50 per share. The warrants were valued at $363,328 using the Black Scholes valuation method using the following factors; risk free interest rate of .85%, strike prices of $0.50, market price of $0.495, volatility of 163% , and no yield. The value of the warrants was expensed as compensation expense in the year ended July 31, 2011.
In June 2011 the company issued 100,000 warrants to purchase 100,000 shares of common stock to a director for his services. The warrants had a term of two years and a strike price of $0.50 per share. The warrants were valued at $115,865 using the Black Scholes valuation method using the following factors; risk free interest rate of .85%, strike prices of $0.50, market price of $1.35, volatility of 163% , and no yield. The value of the warrants was expensed as compensation expense in the year ended July 31, 2011.
During the year ended July 31, 2011, the Company issued 1,300,000 warrants to purchase 1,300,000 shares of common stock for services. The warrants have terms ranging from 2 to 5 years and strike prices ranging from $0.25 to $1.35. See Note 11 for further details.
During the year ended July 31, 2011, a total of 1,225,000 warrants were exercised. 400,000 warrants (200,000 @ $0.10 and 200,000 @ $0.20) were exercised in return for the forgiveness of $56,000 of accounts payable and $4,000 of notes payable. 825,000 warrants were exercised in a cashless exercise for 609,744 shares of common stock. See Note 11 for further details.
The following schedule summarizes pertinent information with regard to the stock warrants for the years ended July 31, 2011, 2010 and 2009:
| 2011 | 2010 | 2009 | ||||||||||||||||||||||
| Weighted Average Shares-Exercise Outstanding-Price |
Weighted Average Shares-Exercise Outstanding-Price |
Weighted Average Shares-Exercise Outstanding-Price |
||||||||||||||||||||||
| Beginning of year |
2,200,000 | $ | 0.154 | — | $ | — | 1,348,662 | $ | 0.01 | |||||||||||||||
| Granted |
2,350,000 | 0.74 | 2,400,000 | 0.15 | — | — | ||||||||||||||||||
| Exercised |
1,225,000 | 0.186 | 400,000 | 0.10 | — | — | ||||||||||||||||||
| Forfeited |
— | — | — | — | — | — | ||||||||||||||||||
| Expired |
— | — | — | — | 1,348,662 | 0.01 | ||||||||||||||||||
|
|
|
|
|
|
|
|
|
|||||||||||||||||
| End of year |
3,325,000 | $ | 0.558 | 2,200,000 | 0.154 | — | $ | — | ||||||||||||||||
|
|
|
|
|
|
|
|
|
|||||||||||||||||
| Exercisable |
3,325,000 | — | 2,200,000 | — | — | $ | — | |||||||||||||||||
|
|
|
|
|
|
|
|||||||||||||||||||
11. SHAREHOLDER EQUITY TRANSACTIONS
At July 31, 2009, the Company had 16,964,441 shares of common stock issued and held 241,012 shares in treasury. The Company had no shares owed but not issued.
In January 2010, the Company issued 100,000 shares in connection with certain working capital notes. The shares were valued at market value of $0.071 per share for a total expense of $7,100.
In January 2010, the Company issued 1,000,000 shares to Valley Falls Company in connection with the acquisition of certain properties from Valley Falls. The common stock was valued at market value of $0.071 per share for a total purchase price of $71,000.
In April 2010 the Company issued 60,000 shares associated with certain working capital notes. The shares were valued at market value of$0.28 per share for a total expense of $16,800.
In May 2010, Mr. Jeffrey Wilson exercised 400,000 warrants at $0.10 per share for a total of $40,000 and the Company issued 400,000 shares. The note payable balance due Mr. Wilson was reduced by $40,000 for the exercise.
F-21
Table of Contents
In May 2010, The Company issued 2,000,000 shares in connection with its acquisition of e-Biofuels. The shares were valued at market value of $0.20 per share. See note 4 for further details.
In June 2010 the Company issued 250,000 shares for consulting services to four individuals. The shares were valued at market value of $0.23 per share for a total expense of $57,500.
In July 2010 the Company issued 1,000,000 shares to Proven Technologies for an exclusive license to oil sands technology for Canada. The shares were valued at market value $0.23 per share for a total value of $230,000.
In July 2010 the Company granted 1,000,000 shares and $12,500 cash in connection with a consulting agreement for the Duke Mine. The shares were valued at market value of $0.14 per share for a total value of $140,000. As of July 31, 2010, these shares have not been issued and are shown as owed but not issued. The total amount of $152,500 was capitalized as a prepaid expense and will be amortized over the one-year term of the agreement. As of July 31, 2010, $50,000 had been expensed and $102,500 remained in prepaid expense. The remaining $102,500 was expensed in the year ended July 31, 2011 and as of July 31, 2011 nothing remained in prepaid expenses for this agreement.
During the year ended July 31, 2010, the Company issued 2,400,000 warrants to purchase 2,400,000 shares of common stock to its directors (200,000 each) for compensation for their services. The warrants had a term of two and three years and a strike price of $0.10 and $0.20 per share respectively. The warrants were valued at $265,109 using the Black Scholes valuation method using the following factors; risk free interest rate of 5.00%, strike prices of $0.10 and $0.20, market price of $0.07 and $0.20, volatility of 178% and 185%, and no yield. The value of the warrants was expensed as compensation expense in the year ended July 31, 2010.
The Company canceled 409,628 shares held in treasury.
As of July 31, 2010, the Company had 21,364,813 shares issued and outstanding. The Company also had 1,000,000 shares owed but not issued.
In August 2010, the Company issued 400,000 shares and 100,000 warrants for consulting services. The shares were valued at market price of $0.32 for $128,000. The warrants had a term of two years and a strike price of $0.25 per share. The warrants were valued at $22,572 using the Black Scholes valuation method using the following factors; risk free interest rate of .47%, strike prices of $0.25, market price of $0.32, volatility of 173% , and no yield. The total value of the stock and warrants, $150,572, was capitalized as a prepaid expense and amortized over the one year period of the consulting agreement. As of July 31, 2011 all $150,572 has been expensed and nothing remains in prepaid expenses.
In August of 2010, 1,000,000 shares that were owed but not issued as of July 31, 2010 were issued.
In November 2010 the Company issued 400,000 shares to Greg Thagard in connection with the exercise of 400,000 warrants. 200,000 warrants were exercised at $0.10 and 200,000 warrants were exercised at $0.20 for a total of $60,000. In exchange for the exercise, Mr. Thagard forgave $56,000 of accounts payable and $4,000 of notes payable due him from the Company.
In November 2010 the Company issued 310,581 shares to Malcolm Henley in connection with the cashless exercise of warrants. Mr. Henley exercised 200,000 warrants at $0.10 and 200,000 warrants at $0.20.
In December 2010 the Company issued 250,000 shares to Coquille Bay Production Company in connection with the purchase of its interest in the Coquille Bay field and pipeline. The shares were valued at market value of $0.51 per share for a total purchase price of $127,500.
In January 2011 the Company issued 200,000 shares to John Heskett in connection with the purchase of Heskett Holding II and its interest in Arrakis. The shares were valued at market value of $0.50 per share for a total value of $100,000.
In January 2011 the Company issued 1,500,000 shares to Metro Energy in connection with the purchase of certain oil and gas assets. The shares were valued at market value of $0.40 per share for a total purchase price of $600,000.
In January 2011 the Company issued 1,041,669 shares to Chrisjo Energy and others in connection with the purchase of their interest in the Coquille Bay pipeline. The shares were valued at market value of $0.40 per share for a total purchase price of $416,668.
In April 2011 the Company issued 400,000 shares to certain individuals for a consulting services agreement rendered to the Company. 200,000 of the shares are for services rendered and 200,000 are for services to be rendered over the six-month period of the agreement. The shares were valued at market value of $0.50 per share on the date of the agreement for a total amount of $200,000. $100,000 was expensed and $100,000 was capitalized as a prepaid expense to be amortized over the six-month life of the agreement. As of July 31, 2011, $66,668 has been expensed and $33,332 remains in prepaid expenses.
F-22
Table of Contents
In April 2011 the Company issued 219,943 shares to various individuals in connection with the conversion of certain notes payable and related accrued interest totaling $74,781 to common stock. The shares were converted at $0.34 per share.
In April 2011 the company issued 975,000 warrants to purchase 975,000 shares of common stock to its directors and key employees for their services. The warrants had a term of two years and a strike price of $0.50 per share. The warrants were valued at $363,328 using the Black Scholes valuation method using the following factors; risk free interest rate of .85%, strike prices of $0.50, market price of $0.495, volatility of 163% , and no yield. The value of the warrants was expensed as compensation expense in the year ended July 31, 2011.
In April 2011 the Company issued 40,000 shares to various individuals in connection with service rendered to the Company. The shares were valued at market value of $0.90 per share for a total expense of $36.000.
In May 2011 the Company issued 450,000 shares to Terry Louviere in connection with the settlement of certain outstanding accounts payable related to Coquille Bay. Accounts payable of $288,310 was converted to common stock at a conversion price of $0.64 per share.
In May of 2011, $3,750,000 of notes payable – related parties were converted to common stock along with the related accrued interest. A total of $4,037,969 ($3,750,000 of principal and $287,969 of accrued interest) was converted into 5,047,461 shares of common stock at a negotiated price of $0.80 per share.
In May 2011 the Company issued 250,000 shares to Vinmar in connection with the settlement of a lawsuit. The shares were valued at $0.87 per share which was the market value on the date of the settlement.
In June 2011 the Company issued 425,000 shares to Aventine in connection with the settlement of a lawsuit. The shares were valued at $0.90 per share which was the market value on the date of the settlement.
In June of 2011, the Company issued 50,000 warrants for services. The warrants had a term of two years and a strike price of $0.70 per share. The warrants were valued at $38,883 using the Black Scholes valuation method using the following factors; risk free interest rate of .85%, strike prices of $0.70, market price of $0.98, volatility of 163% , and no yield. The total value of the warrants has been expensed during the year ended July 31, 2011.
In June 2011 the company issued 100,000 warrants to purchase 100,000 shares of common stock to a director for his services. The warrants had a term of two years and a strike price of $0.50 per share. The warrants were valued at $115,865 using the Black Scholes valuation method using the following factors; risk free interest rate of .85%, strike prices of $0.50, market price of $1.35, volatility of 163% , and no yield. The value of the warrants was expensed as compensation expense in the year ended July 31, 2011.
In June of 2011, the Company issued 535,714 shares to Ron Frank and Barbara Lyons in connection with the conversion of notes payable. A $500,000 loan and a $25,000 loan were borrowed in June of 2011. Both of these loans were converted to common stock immediately. The loans converted at the average closing price of the Company’s common stock for the thirty business days immediately preceding the conversion date. The loans were converted at $0.98 per share. No beneficial conversion feature was recorded on the transactions because the loan was converted immediately and was effectively treated as a stock sale. There was no interest expense related to these notes. No balance remains on these loans as of July 31, 2011.
In June 2011 the Company issued 30,000 shares to various individuals in connection with services rendered. The shares were valued at market value of $0.90 per share for a total expense of $27,000.
In June 2011 the Company issued 259,542 shares to Greg Thagard in connection with the settlement of certain outstanding accounts payable. Accounts payable of $154,500 was converted at $0.60 per share.
In June of 2011, the Company issued 300,000 shares and 500,000 warrants for consulting services. The shares were valued at market price of $1.49 for $447,000. The warrants had a term of five years and a strike price of $1.00 per share. The warrants were valued at $704,706 using the Black Scholes valuation method using the following factors; risk free interest rate of .85%, strike prices of $1.00, market price of $1.49, volatility of 163% , and no yield. The total value of the stock and warrants, $1,151,706, was capitalized as a prepaid expense and will be amortized over the five-year period of the consulting agreement. As of July 31, 2011, $28,793 has been expensed and $1,122,914 remains in prepaid expenses.
F-23
Table of Contents
In June of 2011, the Company issued 500,000 warrants for consulting services. The warrants had a term of five years and a strike price of $1.00 per share. The warrants were valued at $704,706 using the Black Scholes valuation method using the following factors; risk free interest rate of .85%, strike prices of $1.00, market price of $1.49, volatility of 163% , and no yield. The total value of the warrants, $704,706, was capitalized as a prepaid expense and will be amortized over the five-year period of the consulting agreement. As of July 31, 2011, $17,618 has been expensed and $687,088 remains in prepaid expenses.
In June 2011 the Company issued 100,000 shares and $150,000 to MDEChem Inc. in connection with the execution of a license agreement related to SANDKLENE 950. The cost of the licensing agreement was $250,000 so the shares were valued at $1.00 per share.
In June 2011 the Company issued 50,000 shares to Ben Campbell in connection with the purchase of certain mining claims in Utah. The shares were valued at market value of $1.49 per share for a total purchase price of $74,500.
In June of 2011, the Company issued 100,000 warrants to purchase 100,000 shares of common stock to as a signing bonus to a new employee. The warrants had a term of two years and a strike price of $1.35 per share. The warrants were valued at $114,143 using the Black Scholes valuation method using the following factors; risk free interest rate of .85%, strike prices of $1.35, market price of $1.49, volatility of 163% , and no yield. The value of the warrants was expensed as compensation expense in the year ended July 31, 2011.
In July 2011 the Company issued 99,163 shares to certain individuals in connection with their cashless exercise of warrants. 100,000 warrants were exercised at $0.25and 25,000 were exercised at $0.50.
In July of 2011, the Company issued 200,000 shares in connection with the exercise of 200,000 warrants at $0.10. A note payable in the amount of $20,000 was forgiven in exchange for the conversion. The Company also issued 31,250 shares for the accrued interest on the note of $3,125.
As of July 31, 2011, the Company has 34,905,136 shares of common stock issued and outstanding and 100,000 shares shown as owed but not issued.
12. LEASE OBLIGATIONS
The Company maintains office space at its headquarters at 101 NW 1st Street, Suite 213, Evansville, IN 47708. The Company maintains its current office space under a 3 year lease, ending March of 2014, at the rate of $2,583.33 per month.
Our wholly-owned subsidiary, Imperial Chemical Company’s principal executive offices are located at 4533 Brittmoore Road, Houston, TX under a 5 year lease, ending August of 2016, at the rate of $10,500 per month beginning in August 2011. There was no rent expense in 2011relating to this lease. The Company leases certain vehicles, equipment and railcars for its biodiesel operation in Middletown, IN under operating lease contracts with Stark Leasing, Trinity Industries and others. There are five vehicle leases, ending from September of 2011 to April of 2014, ranging from $525 to $713 per month. The equipment lease ends in November of 2011 and is $21,500 per month. The railcar lease ends in January of 2013 and is $9,800 per month.
Total future lease payments under all of the above operating leases are:
| 2012 | 2013 | 2014 | 2015 | 2016 | Thereafter | Total | ||||||||||||||||||||||
| Total operating lease obligations |
$ | 379,094 | $ | 234,997 | $ | 155,675 | $ | 129,850 | $ | 130,200 | 10,850 | $ | 1,040,667 | |||||||||||||||
13. ACCRUED EXPENSES
The Company has accrued expenses as of July 31 as follows:
| 2011 | 2010 | |||||||
| Revenue in suspense |
$ | 592,525 | $ | 183,166 | ||||
| Accrued officer salary—CEO |
377,678 | 261,001 | ||||||
| Accrued interest on notes |
221,584 | 132,083 | ||||||
| Accrued Settlements |
250,574 | 1,447,432 | ||||||
| Accrued feedstock purchase liabilities |
2,945,135 | 2,402,889 | ||||||
| Contingent liability |
— | 630,000 | ||||||
| Accrued income taxes |
355,000 | — | ||||||
| Other |
441,353 | 162,337 | ||||||
|
|
|
|
|
|||||
| 5,183,849 | 5,218,908 | |||||||
|
|
|
|
|
|||||
F-24
Table of Contents
14. GAIN ON SALE OF ASSETS AND EXTINGUISHMENT OF DEBT
Effective April 30, 2009 the Company sold certain assets located in North Louisiana and Southeast Texas in connection with a Settlement Agreement entered into between the Company and the Agent representing its Senior and Subordinated Debt holders. All of the proceeds of the sale were paid to the lenders in exchange for extinguishment for the debt resulting in a gain to the Company of $12,984,463.
15. FAIR VALUE MEASUREMENTS
We adopted ASC Topic 820-10, “Fair Value Measurements” at the beginning of fiscal year 2010 to measure the fair value of certain of its financial assets required to be measured on a recurring basis. The adoption of ASC Topic 820-10 did not impact our combined financial position or results of operations. ASC Topic 820-10 establishes a fair value hierarchy that prioritizes the inputs to valuation techniques used to measure fair value. The hierarchy gives the highest priority to unadjusted quoted prices in active markets for identical assets or liabilities (Level 1 measurements) and the lowest priority to unobservable inputs (Level 3 measurements). ASC Topic 820-10 defines fair value as the price that would be received to sell an asset or paid to transfer a liability in an orderly transaction between market participants on the measurement date. A fair value measurement assumes that the transaction to sell the asset or transfer the liability occurs in the principal market for the asset or liability. The three levels of the fair value hierarchy under ASC Topic 820-10 are described below:
Level 1. Valuations based on quoted prices in active markets for identical assets or liabilities that an entity has the ability to access.
Level 2. Valuations based on quoted prices for similar assets or liabilities, quoted prices for identical assets or liabilities in markets that are not active, or other inputs that are observable or can be corroborated by observable data for substantially the full term of the assets or liabilities.
Level 3. Valuations based on inputs that are supported by little or no market activity and that are significant to the fair value of the assets or liabilities. We have no level 3 assets or liabilities.
The tables below present reconciliation for all assets and liabilities measured at fair value on a recurring basis as of July 31, 2011 and 2010.
| July 31, 2011 | ||||||||||||||||
| Fair Value Measurements | ||||||||||||||||
| Level 1 Quoted Prices in Active Markets Identical Assets |
Level 2 Significant Other Observable Inputs |
Level 3 Significant Unobservable Inputs |
Assets/ Liabilities At Fair Value |
|||||||||||||
| Assets: |
||||||||||||||||
| Cash |
$ | 900,883 | — | — | $ | 900,883 | ||||||||||
| Accounts receivable |
— | $ | 4,894,073 | — | $ | 4,894,073 | ||||||||||
| Note receivable |
— | $ | 339,429 | — | $ | 339,429 | ||||||||||
| Liabilities |
||||||||||||||||
| Accounts payable, accrued and other liabilities |
— | $ | 9,392,557 | — | $ | 9,392,557 | ||||||||||
| Notes payable |
— | $ | 14,238,008 | — | $ | 14,238,008 | ||||||||||
F-25
Table of Contents
| July 31, 2010 | ||||||||||||||||
| Fair Value Measurements | ||||||||||||||||
| Level 1 Quoted Prices in Active Markets Identical Assets |
Level 2 Significant Other Observable Inputs |
Level 3 Significant Unobservable Inputs |
Assets/ Liabilities At Fair Value |
|||||||||||||
| Assets: |
||||||||||||||||
| Cash |
$ | 28,525 | — | — | $ | 28,525 | ||||||||||
| Accounts receivable |
— | $ | 121,252 | — | $ | 121,252 | ||||||||||
| Liabilities |
||||||||||||||||
| Accounts payable, accrued and other liabilities |
— | $ | 8,673,682 | — | $ | 8,673,682 | ||||||||||
| Notes payable |
— | $ | 19,739,169 | — | $ | 19,739,169 | ||||||||||
16. SUBSEQUENT EVENTS
The Company has evaluated events and transactions for potential recognition or disclosure through the date these financial statements were issued. There were no subsequent events requiring recognition or disclosure in these financial statements other then as noted below.
On June 9, 2011, the Company entered into an engagement agreement (the “Engagement Agreement”) with Rodman & Renshaw, LLC to act as our exclusive placement agent (the “Placement Agent”) in connection with an offering of the Company’s securities (the “Offering”). On September 21, 2011 (the “Closing Date”), pursuant to a securities purchase agreement (the “Securities Purchase Agreement”), the Company completed the closing of the Offering for total subscription proceeds of $3,177,501.50 through the issuance of (i) 4,236,669 shares of our common stock at a price of $0.75 per share (the “Purchased Shares”) and (ii) five-year warrants (the “Warrants”) exercisable into 2,118,334 shares of common stock (the “Warrants Shares”) equal to 50% of the Purchased Shares at an exercise price of $1.00 per share to certain accredited investors (the “Investors”). The number of shares of common stock to be received upon the exercise of the Warrants and the exercise price of the Warrants are subject to adjustment for reverse and forward stock splits, stock dividends, stock combinations and other similar transactions of the common stock that occur after the Closing Date.
In August of 2011, the Company issued 100,000 shares of common stock that were shown as owed but not issued as of July 31, 2011.
In September of 2011, the Company received $3,157,623 from the USDA in relation to government biodiesel production incentives. These incentives were shown as “accounts receivables – Government incentives” as of July 31, 2011.
In September of 2011, in anticipation of completing its Feedstock Supply Agreement the Company issued 500,000 shares at $1.00 per share and 500,000 warrants at a $1.00 per share exercise price.
In September of 2011, the Company issued 10,000 shares at $1.00 per share and 50,000 warrants at a $1.00 per share strike price for services.
In September of 2011, the company issued 100,000 shares at $1.00 per share in connection with the extension of its senior bank debt to the parties that executed the personal guarantees of the debt.
F-26
Table of Contents
IMPERIAL PETROLEUM, INC.
Supplemental Information
(Unaudited)
For the Years Ended July 31, 2011, 2010 and 2009
| Capitalized Costs Relating to Oil and Gas |
2011 | 2010 | 2009 | |||||||||
| Property acquisitions |
727,500 | 0 | 0 | |||||||||
| Proved |
128,531 | 166,372 | 960,432 | |||||||||
| Unproved |
— | — | — | |||||||||
| Less—proceeds from sales of properties |
— | — | (129,521 | ) | ||||||||
| Support equipment and facilities |
— | — | — | |||||||||
|
|
|
|
|
|
|
|||||||
| Oil and gas related costs |
856,031 | 166,372 | 830,911 | |||||||||
|
|
|
|
|
|
|
|||||||
| Results of Operations for Oil and Gas Producing Activities |
2011 | 2010 | 2009 | |||||||||
| Revenues |
$ | 398,988 | $ | 158,590 | $ | 1,069,361 | ||||||
| Production costs and taxes |
(1,102,544 | ) | (638,853 | ) | (985,753 | ) | ||||||
| Depreciation, depletion and amortization |
(86,135 | ) | (23,270 | ) | (419,189 | ) | ||||||
|
|
|
|
|
|
|
|||||||
| Income from oil and gas producing activities |
$ | (789,691 | ) | $ | (503,533 | ) | $ | (335,581 | ) | |||
|
|
|
|
|
|
|
|||||||
The following table sets forth the Company’s net proved oil and gas reserves at July 31, 2011 and the changes in net proved oil and gas reserves for the years then ended. Proved reserves represent the estimated quantities of crude oil and natural gas which geological and engineering data demonstrate with reasonable certainty to be recoverable in the future years from known reservoirs under existing economic and operating conditions. The reserve information indicated below requires substantial judgment on the part of the reserve engineers, resulting in estimates which are not subject to precise determination. Accordingly, it is expected that the estimates of estimates of reserves will change as future production and development information becomes available and that revisions in these estimates could be significant. Reserves are measured in barrels (bbls) in the case of oil, and units of one thousand cubic feet (MCF) in the case of gas.
| Oil (bbls) | Gas (MCF) | |||||||
| Proved reserves: |
||||||||
| Balance at July 31, 2009 |
380,930 | 2,620,060 | ||||||
| Discoveries and extensions |
— | — | ||||||
| Acquisitions |
— | — | ||||||
| Sales and dispositions |
— | — | ||||||
| Revisions of previous estimates |
(42,401 | ) | 651,377 | |||||
| Production |
(1,529 | ) | (12,565 | ) | ||||
| 337,000 | 3,284,000 | |||||||
| Proved reserves: |
||||||||
| Balance at July 31, 2010 |
337,000 | 3,284,000 | ||||||
| Discoveries and extensions |
— | — | ||||||
| Acquisitions |
43,810 | 426,920 | ||||||
| Sales and dispositions |
— | — | ||||||
| Revisions of previous estimates |
(65,058 | ) | (592,212 | ) | ||||
| Production |
(4,578 | ) | (6,682 | ) | ||||
| Proved reserves at July 31, 2011 |
311,174 | 3,109,026 | ||||||
|
|
|
|
|
|||||
| Proved developed July 31, 2009 |
243,405 | 2,165,901 | ||||||
|
|
|
|
|
|||||
| Proved developed July 31, 2010 |
337,000 | 2,822,000 | ||||||
| Proved developed July 31, 2011 |
311,174 | 2,688,887 | ||||||
All of the Company’s reserves are located in the continental United States. In 2006, the Company acquired an interest in the Bastian Bay field in Louisiana, however due to failed workover attempts the reserves for that well were downgraded to probable reserves as of July 31, 2009 and resulted in a substantial revision to prior estimates of proven reserves.
F-27
Table of Contents
Standardized Measure of Discounted Future Net Cash Flows
| July 31, 2011 | July 31, 2010 | July 31, 2009 | ||||||||||
| Future Cash Inflows |
$ | 30,614,592 | $ | 40,921,091 | $ | 16,379,730 | ||||||
| Future production costs and taxes |
9,671,203 | 9,473,518 | 5,806,846 | |||||||||
| Future development costs |
2,157,283 | 3,031,343 | 1,496,282 | |||||||||
| Future income tax expenses |
7,330,186 | 9,434,272 | 3,176,810 | |||||||||
| Net future cash flows |
11,455,920 | 18,981,958 | 5,899,792 | |||||||||
| Discount at 10% |
(6,195,658 | ) | (10,689,109 | ) | (2,419,789 | ) | ||||||
| Discounted future net cash flows from proved reserves |
5,260,261 | 8,292,849 | 3,480,003 | |||||||||
| Balance, beginning of year |
$ | 8,292,849 | $ | 3,480,003 | $ | 13,147,553 | ||||||
| Acquisitions |
2,604,792 | — | — | |||||||||
| Sales of oil and gas net of production costs |
(703,556 | ) | (83,608 | ) | (83,608 | ) | ||||||
| Discoveries and extensions |
— | — | — | |||||||||
| Changes in prices and production costs |
612,292 | 3,638,578 | (21,56,972 | ) | ||||||||
| Extensions, additions and discoveries |
— | — | — | |||||||||
| Revision of quantity estimates |
(7,091,008 | ) | 926,254 | 16,979,230 | ||||||||
| Sales and dispositions |
— | — | (12,089,985 | ) | ||||||||
| Development costs incurred |
(128,531 | ) | (8,795 | ) | (166,372 | ) | ||||||
| Interest factor accretion of discount |
333,257 | 445,450 | 769,860 | |||||||||
| Net change in income taxes |
946,839 | 1,276,522 | 1,218,001 | |||||||||
| Changes in future development costs |
393,327 | (1,381,555 | ) | (1,697,690 | ) | |||||||
| Changes in production rates and other |
— | — | — | |||||||||
|
|
|
|
|
|
|
|||||||
| Balance, end of year |
$ | 5,260,261 | $ | 8,292,849 | $ | 3,480,003 | ||||||
Estimated future net cash flows represent an estimate of the net revenues from the production of proved reserves using current sales prices, along with estimates of the operating costs, production taxes and future development and abandonment costs (less salvage value) necessary to produce such reserves. The average prices used at July 31, 2011 were $97.02 per barrel of oil and $4.42 per MMBTU of gas respectively. No deduction has been made for depreciation, depletion or any indirect costs such as general corporate overhead or interest expense.
Operating costs and production taxes are estimated based on current costs with respect to producing gas properties. Future development costs are based on the best estimate of such costs assuming current economic and operating conditions. The estimates of reserve values include estimated future development costs that the Company does not currently have the ability to fund. If the Company is unable to obtain additional funds, it may not be able to develop its oil and natural gas properties as estimated in its July 31, 2011 reserve report.
The future net revenue information assumes no escalation of costs or prices. Future costs and prices could significantly vary from current amounts and, accordingly, revisions in the future could be significant.
F-28