Attached files
| file | filename |
|---|---|
| 8-K - FORM 8-K - CONSUMERS ENERGY CO | d244949d8k.htm |
 Wells
Fargo Advisors October 19, 2011
Exhibit 99.1 |
 The
presentation also includes non-GAAP measures when describing CMS Energy’s results of
operations and financial performance. A reconciliation of each of these measures
to the most directly
comparable
GAAP
measure
is
included
in
the
appendix
and
posted
on
our
website
at
www.cmsenergy.com. 1
This presentation is made as of the date hereof and contains “forward-looking
statements” as defined in Rule 3b-6 of the Securities Exchange Act of
1934, as amended, Rule 175 of the Securities Act of 1933, as amended, and
relevant legal decisions. The forward-looking statements are subject
to risks and uncertainties. They should be read in conjunction with
“FORWARD-LOOKING STATEMENTS AND INFORMATION” and “RISK FACTORS”
sections of CMS Energy’s and Consumers Energy’s Form 10-K for the
year ended December 31 and as updated in subsequent 10-Qs. CMS
Energy’s and Consumers Energy’s “FORWARD- LOOKING STATEMENTS
AND INFORMATION” and “RISK FACTORS” sections are incorporated
herein by reference and discuss important factors that could cause CMS Energy’s
and Consumers Energy’s results to differ materially from those anticipated in such
statements. CMS Energy and Consumers Energy undertake no obligation to update
any of the information presented herein to reflect facts, events or
circumstances after the date hereof.
Reported earnings could vary because of several factors, such as legacy issues
associated with prior asset sales. Because of those uncertainties, the
company is not providing reported earnings guidance. |
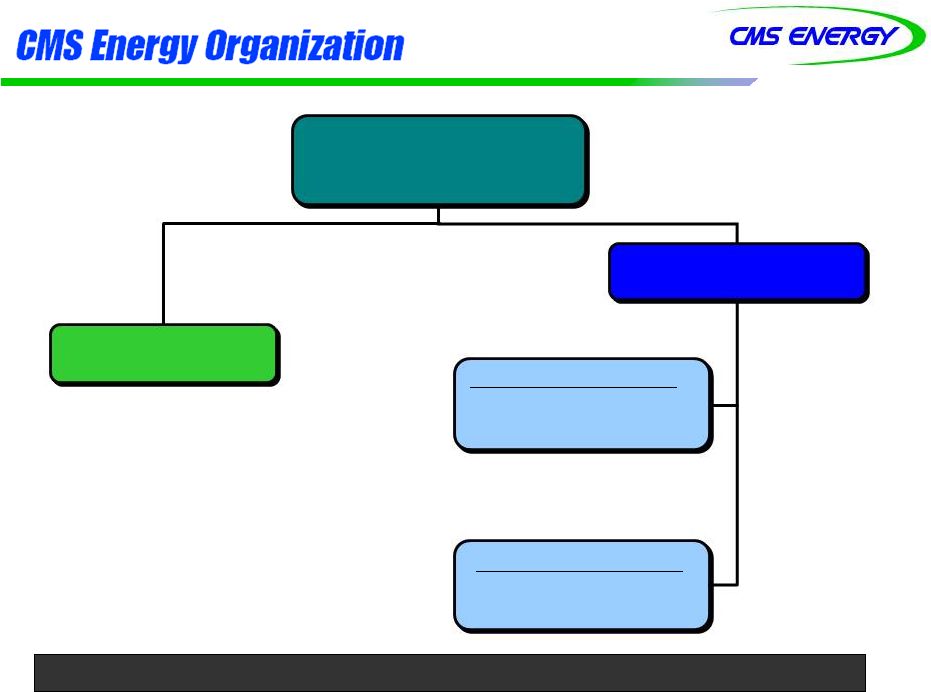 2
CMS Energy
Corporation
Consumers Energy
(Michigan Utility)
Consumers Energy
(Michigan Utility)
YE 2010 financial data
CMS Energy ranks #360 on Fortune 500 list (2011).
CMS Enterprises
Revenue –
$0.2 billion
Gas
Revenue
–
$2.4
billion
Customer
Base
–
1.7
million
Electric
Revenue
–
$3.8
billion
Customer
Base
–
1.8
million |
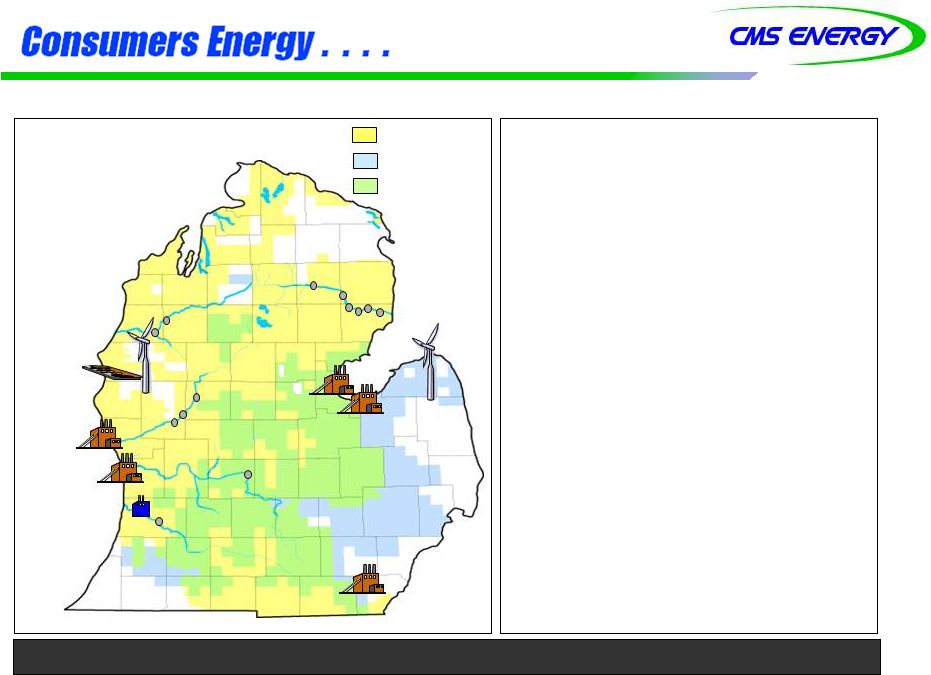 •
•
Fourth largest
Fourth largest
combination Utility in the
combination Utility in the
United States
United States
•
•
1.8 million electric and 1.7
1.8 million electric and 1.7
million gas customers
million gas customers
•
•
Top renewable energy
Top renewable energy
provider in Michigan
provider in Michigan
•
•
One of largest investors
One of largest investors
and employers in
and employers in
Michigan
Michigan
•
•
Celebrating 125
Celebrating 125
th
anniversary
anniversary
Overview
Overview
Territory
Territory
3
D E Karn
D E Karn
J C Weadock
J C Weadock
Mio
Mio
Alcona
Alcona
Cooke
Cooke
Foote
Foote
Loud
Loud
5 Channels
5 Channels
Tippy
Tippy
Rogers
Rogers
Webber
Webber
Electric
Electric
Gas
Gas
Combination
Combination
Zeeland
Zeeland
J R Whiting
J R Whiting
Cross Winds
Energy Park
. . . . is significant contributor to Michigan economy.
Ludington
Ludington
Pumped
Pumped
Storage
Storage
B C Cobb
B C Cobb
J H Campbell
J H Campbell
Allegan
Allegan
Hodenpyl
Hodenpyl
Hardy
Hardy
Croton
Croton
Lake Winds
Energy Park |
 •
•
Attractive dividend yield of 4.2%
Attractive dividend yield of 4.2%
a
a
•
•
58% payout ratio growing to peer average over time
58% payout ratio growing to peer average over time
•
•
5% to 7% estimated long-term EPS growth rate
5% to 7% estimated long-term EPS growth rate
•
•
Driven
Driven
by
by
$6.5
$6.5
billion
billion
investment
investment
in
in
regulated
regulated
Utility
Utility
over
over
next
next
five
five
years
years
•
•
No need for equity next five years
No need for equity next five years
•
•
Constructive regulatory environment supports Utility
Constructive regulatory environment supports Utility
investment in Michigan
investment in Michigan
•
•
Over 95% of business is regulated by the Michigan Public Service
Over 95% of business is regulated by the Michigan Public Service
Commission
Commission
4
_ _ _ _ _
a
Based on closing stock price of $19.79 on September 30, 2011
. . . . represents good total return opportunity. |
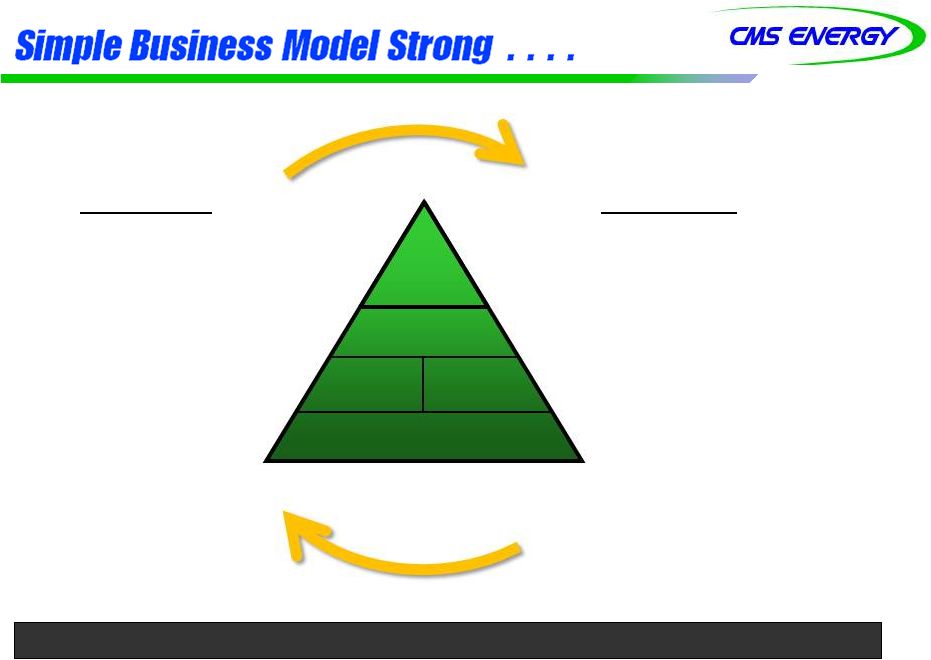 Financial
•
Use Net Operating
Losses to Eliminate
Need for Equity
•
Grow Operating
Cash Flow and
EPS 5% -
7%
Business
•
Invest in Utility
•
Create jobs
•
Enhance customer value
•
Constructive regulation
supports cost recovery
•
Customer Base Rate
Increases <2%
Consistent
Consistent
financial
financial
performance
performance
Utility
Utility
investment
investment
Fair and timely regulation
Fair and timely regulation
Customer
Customer
value
value
Safe, excellent operations
Safe, excellent operations
. . . . predictable and sustainable.
5 |
 6
. . . . “needed”
(vs “wanted”) --
grows rate base 5% to 7%.
Distribution
New
Customers
Generation
Renewables
Smart Grid
Reliability
Environmental |
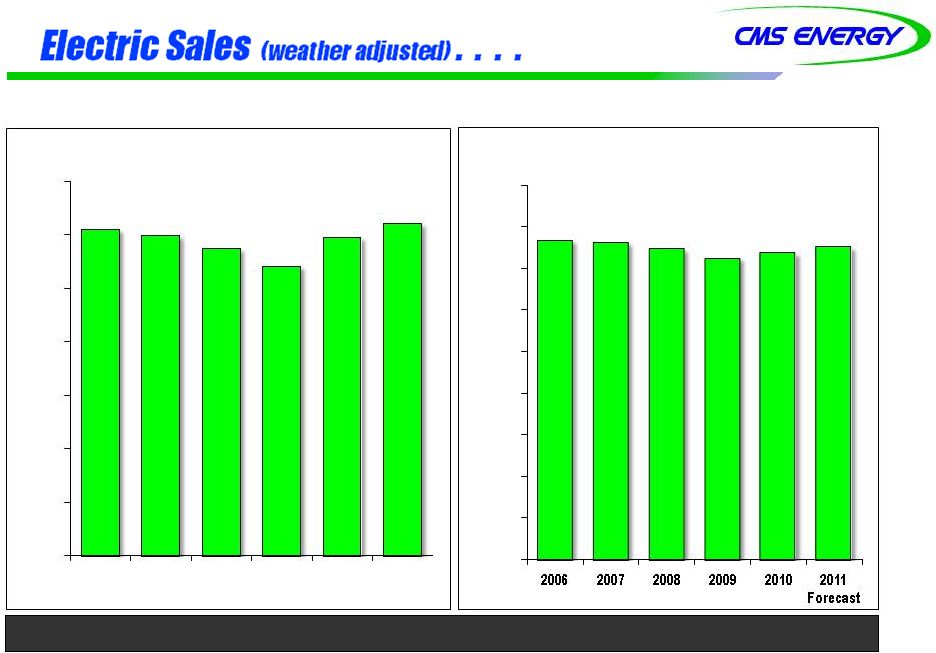 Total
Sales Total Sales
. . . . near pre-recession levels, conservative outlook.
Industrial Sales
Industrial Sales
7
38,379
38,107
37,339
36,229
36,839
37,558
0
5,000
10,000
15,000
20,000
25,000
30,000
35,000
40,000
45,000
GMhs
12,196
11,952
11,482
10,814
11,889
12,414
0
2,000
4,000
6,000
8,000
10,000
12,000
14,000
2006
2007
2008
2009
2010
2011
Forecast
GWhs |
 Growth
Renewable energy
Energy optimization
Speed
File and implement
Forward test year
Risk mitigation
Customer choice cap (10%)
Decoupling
8
. . . . enables timely rate recovery and mitigates risks. |
 9
Regulatory environment –
comparison by state
Tier 1
Tier 2
Tier 3
Tier 4
Tier 5
Delaware
Florida
Hawaii
Kansas
Louisiana
Massachusetts
Missouri
Arizona
Nevada
Arkansas
Alabama
New Jersey
District of Columbia
California
New York
Illinois
Georgia
Ohio
Maine
Idaho
Indiana
Oregon
Michigan (2008)
Connecticut
Colorado
Michigan (2009)
South Carolina
Mississippi
Maryland
Iowa
North Dakota
Texas
Pennsylvania
Montana
Kentucky
Oklahoma
Utah
South Dakota
New Hampshire
Minnesota
Tennessee
Washington
Vermont
New Mexico
Wyoming
Virginia
Wisconsin
West Virginia
Rhode Island
Source: Barclays Capital, 2-7-11
. . . . compares favorably. |
 10
8% CAGR
Annual dividend/share
Payout
25%
30%
40%
84¢
$1.20
$1.25
$1.26
$1.35
5%-7% Growth
58%
68%
Dividend
Increase
$0.81
0.90
0.96
1.08
0.84
$1.36
$0.80
0.85
0.90
1.00
0.80
20¢
50¢
2003
2004
2005
2006
2007
2008
2009
2010
2011
Future
36¢
$1.21
b
Actual
a
Guidance
_ _ _ _ _
a
Adjusted EPS (non-GAAP) excluding MTM in 2004-2006
b
$1.25 excluding discontinued Exeter operations and accounting changes related to
Convertible debt and restricted stock . . . . results from “needed”
investments. |
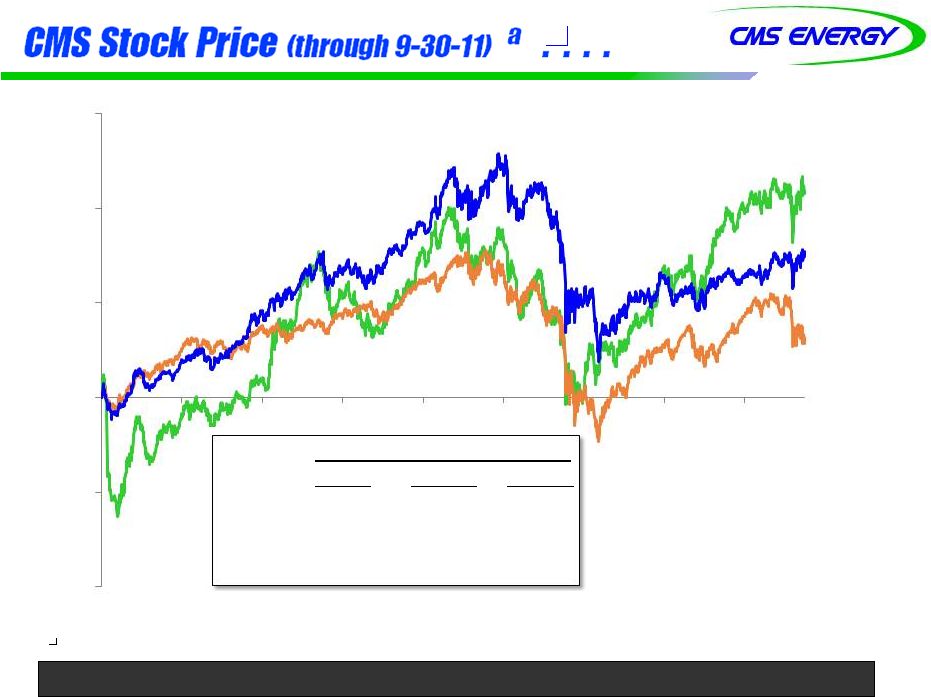 11
2003
2004
2005
2006
2007
2008
2009
2010
2011
CMS
110%
UTY
75%
S&P 500
29%
_ _ _ _ _
a
Historical performance is no prediction of future results
-100%
-50%
0%
50%
100%
150%
Annual Growth
1 Year
3 Years
5 Years
CMS
10%
17%
7%
S&P 500
(1)
(1)
(3)
UTY
7
1
0
. . . . has outperformed past eight years. |
 •
Dividend yield (4%) and EPS growth (5% -
7%)
provide attractive total return
•
“Needed”
Utility investment provides transparent,
long-term earnings growth
•
Constructive regulatory environment and good
energy law support Utility investment in Michigan
12
. . . . predictable and repeatable. |
 GAAP
Reconciliation GAAP Reconciliation |
CMS ENERGY CORPORATION
Earnings Per Share By Year GAAP Reconciliation
(Unaudited)
| 2003 | 2004 | 2005 | 2006 | 2007 | 2008 | 2009 | 2010 | |||||||||||||||||||||||||
| Reported earnings (loss) per share — GAAP |
$ | (0.30 | ) | $ | 0.64 | $ | (0.44 | ) | $ | (0.41 | ) | $ | (1.02 | ) | $ | 1.20 | $ | 0.91 | $ | 1.28 | ||||||||||||
| After-tax items: |
||||||||||||||||||||||||||||||||
| Electric and gas utility |
0.21 | (0.39 | ) | — | — | (0.07 | ) | 0.05 | 0.33 | 0.03 | ||||||||||||||||||||||
| Enterprises |
0.74 | 0.62 | 0.04 | (0.02 | ) | 1.25 | (0.02 | ) | 0.09 | (0.03 | ) | |||||||||||||||||||||
| Corporate interest and other |
0.16 | (0.03 | ) | 0.04 | 0.27 | (0.32 | ) | (0.02 | ) | 0.01 | * | |||||||||||||||||||||
| Discontinued operations (income) loss |
(0.16 | ) | 0.02 | (0.07 | ) | (0.03 | ) | 0.40 | (* | ) | (0.08 | ) | 0.08 | |||||||||||||||||||
| Asset impairment charges, net |
— | — | 1.82 | 0.76 | 0.60 | — | — | — | ||||||||||||||||||||||||
| Cumulative accounting changes |
0.16 | 0.01 | — | — | — | — | — | — | ||||||||||||||||||||||||
| Adjusted earnings per share, including MTM — non-GAAP |
$ | 0.81 | $ | 0.87 | $ | 1.39 | $ | 0.57 | $ | 0.84 | $ | 1.21 | (a) | $ | 1.26 | $ | 1.36 | |||||||||||||||
| Mark-to-market impacts |
0.03 | (0.43 | ) | 0.51 | ||||||||||||||||||||||||||||
| Adjusted earnings per share, excluding MTM — non-GAAP |
NA | $ | 0.90 | $ | 0.96 | $ | 1.08 | NA | NA | NA | NA | |||||||||||||||||||||
| * | Less than $500 thousand or $0.01 per share. |
| (a) | $1.25 excluding discontinued Exeter operations and accounting changes related to convertible debt and restricted stock. |
2003-10 EPS