Attached files
| file | filename |
|---|---|
| EX-99.1 - EXHIBIT 99.1 - STATE STREET CORP | a50031993-ex991.htm |
| EX-99.3 - EXHIBIT 99.3 - STATE STREET CORP | a50031993-ex993.htm |
| 8-K - STATE STREET CORPORATION 8-K - STATE STREET CORP | a50031993.htm |
Exhibit 99.2

Investment Portfolio As of September 30, 2011
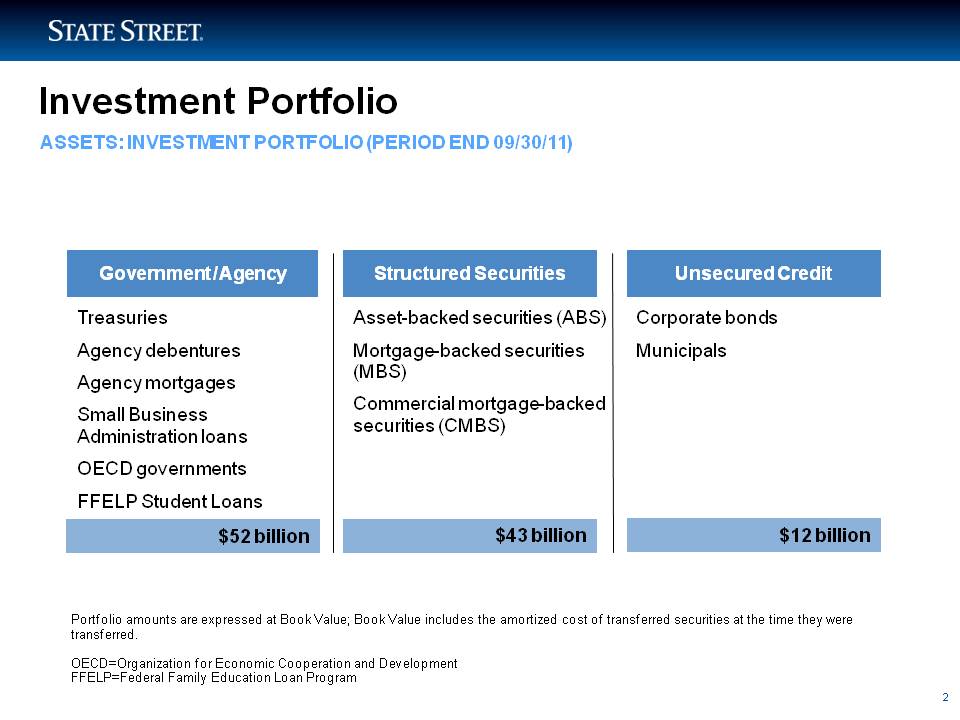
Asset-backed securities (ABS) Mortgage-backed securities (MBS) Commercial mortgage-backed securities (CMBS) $43 billion $12 billion Corporate bonds Municipals TreasuriesAgency debentures Agency mortgages Small Business Administration loans OECD governmentsFFELP Student Loans Investment Portfolio Government / Agency Structured Securities Unsecured Credit Portfolio amounts are expressed at Book Value; Book Value includes the amortized cost of transferred securities at the time they were transferred. OECD=Organization for Economic Cooperation and Development FFELP=Federal Family Education Loan Program ASSETS: INVESTMENT PORTFOLIO (PERIOD END 09/30/11) $52 billion 2
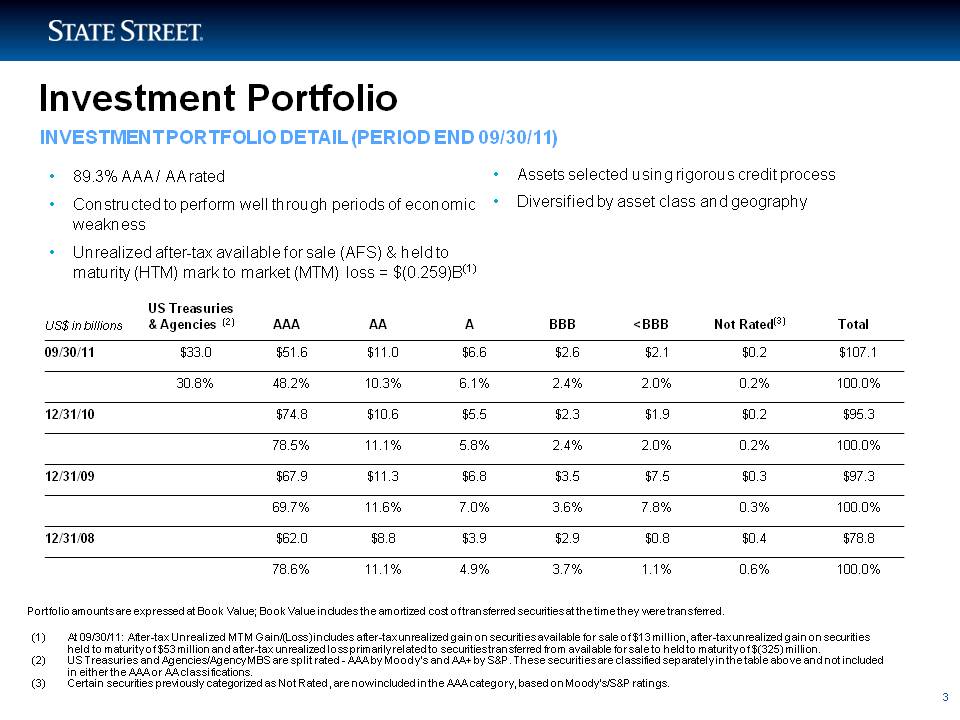
Assets selected using rigorous credit processDiversified by asset class and geography 89.3% AAA / AA rated Constructed to perform well through periods of economic weakness Unrealized after-tax available for sale (AFS) & held to maturity (HTM) mark to market (MTM) loss = $(0.259)B(1) INVESTMENT PORTFOLIO DETAIL (PERIOD END 09/30/11) Investment Portfolio Portfolio amounts are expressed at Book Value; Book Value includes the amortized cost of transferred securities at the time they were transferred. At 09/30/11: After-tax Unrealized MTM Gain/(Loss) includes after-tax unrealized gain on securities available for sale of $13 million, after-tax unrealized gain on securities held to maturity of $53 million and after-tax unrealized loss primarily related to securities transferred from available for sale to held to maturity of $(325) million.US Treasuries and Agencies/Agency MBS are split rated - AAA by Moody’s and AA+ by S&P. These securities are classified separately in the table above and not included in either the AAA or AA classifications.Certain securities previously categorized as Not Rated, are now included in the AAA category, based on Moody’s/S&P ratings. US$ in billions US Treasuries & Agencies (2) AAA AA A BBB <BBB Not Rated(3) Total 09/30/11 $33.0 $51.6 $11.0 $6.6 $2.6 $2.1 $0.2 $107.1 30.8% 48.2% 10.3% 6.1% 2.4% 2.0% 0.2% 100.0% 12/31/10 $74 8 $10 6 $5 5 $2 3 $1 9 $0 2 $95 3 74.8 10.6 5.5 2.3 1.9 0.2 95.3 78.5% 11.1% 5.8% 2.4% 2.0% 0.2% 100.0% 12/31/09 $67.9 $11.3 $6.8 $3.5 $7.5 $0.3 $97.3 69.7% 11.6% 7.0% 3.6% 7.8% 0.3% 100.0% 12/31/08 $62.0 $8.8 $3.9 $2.9 $0.8 $0.4 $78.8 78.6% 11.1% 4.9% 3.7% 1.1% 0.6% 100.0% 3
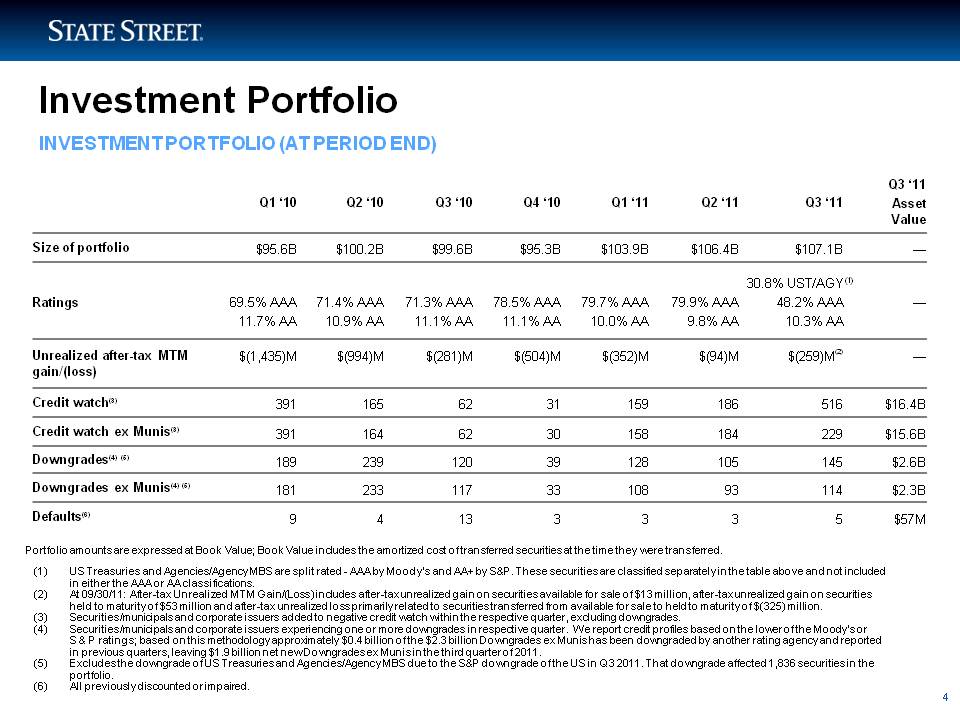
Investment Portfolio US Treasuries and Agencies/Agency MBS are split rated - AAA by Moody’s and AA+ by S&P. These securities are classified separately in the table above and not included in either the AAA or AA classifications. At 09/30/11: After-tax Unrealized MTM Gain/(Loss) includes after-tax unrealized gain on securities available for sale of $13 million, after-tax unrealized gain on securities held to maturity of $53 million and after-tax unrealized loss primarily related to securities transferred from available for sale to held to maturity of $(325) million. Securities/municipals and corporate issuers added to negative credit watch within the respective quarter, excluding downgrades. Securities/municipals and corporate issuers experiencing one or more downgrades in respective quarter. We report credit profiles based on the lower of the Moody’s or S & P ratings; based on this methodology approximately $0.4 billion of the $2.3 billion Downgrades ex Munis has been downgraded by another rating agency and reported in previous quarters, leaving $1.9 billion net new Downgrades ex Munis in the third quarter of 2011. Excludes the downgrade of US Treasuries and Agencies/Agency MBS due to the S&P downgrade of the US in Q3 2011. That downgrade affected 1,836 securities in the portfolio. All previously discounted or impaired. INVESTMENT PORTFOLIO (AT PERIOD END) Portfolio amounts are expressed at Book Value; Book Value includes the amortized cost of transferred securities at the time they were transferred. (1) Q1 ‘10 Q2 ‘10 Q3 ‘10 Q4 ‘10 Q1 ‘11 Q2 ‘11 Q3 ‘11 Q3 ‘11 Asset Value Size of portfolio $95.6B $100.2B $99.6B $95.3B $103.9B $106.4B $107.1B — Ratings 69.5% AAA 71.4% AAA 71.3% AAA 78.5% AAA 79.7% AAA 79.9% AAA 30.8% UST/AGY 48.2% AAA — (1) g 11.7% AA 10.9% AA 11.1% AA 11.1% AA 10.0% AA 9.8% AA 10.3% AA Unrealized after-tax MTM gain/(loss) $(1,435)M $(994)M $(281)M $(504)M $(352)M $(94)M $(259)M(2) — Credit watch(3) 391 165 62 31 159 186 516 $16.4B Credit watch ex Munis(3) 391 164 62 30 158 184 229 $15.6B Downgrades(4) (5) 189 239 120 39 128 105 145 $2.6B Downgrades ex Munis(4) (5) 181 233 117 33 108 93 114 $2.3B Defaults (6) 9 4 13 3 3 3 5 $57M 4
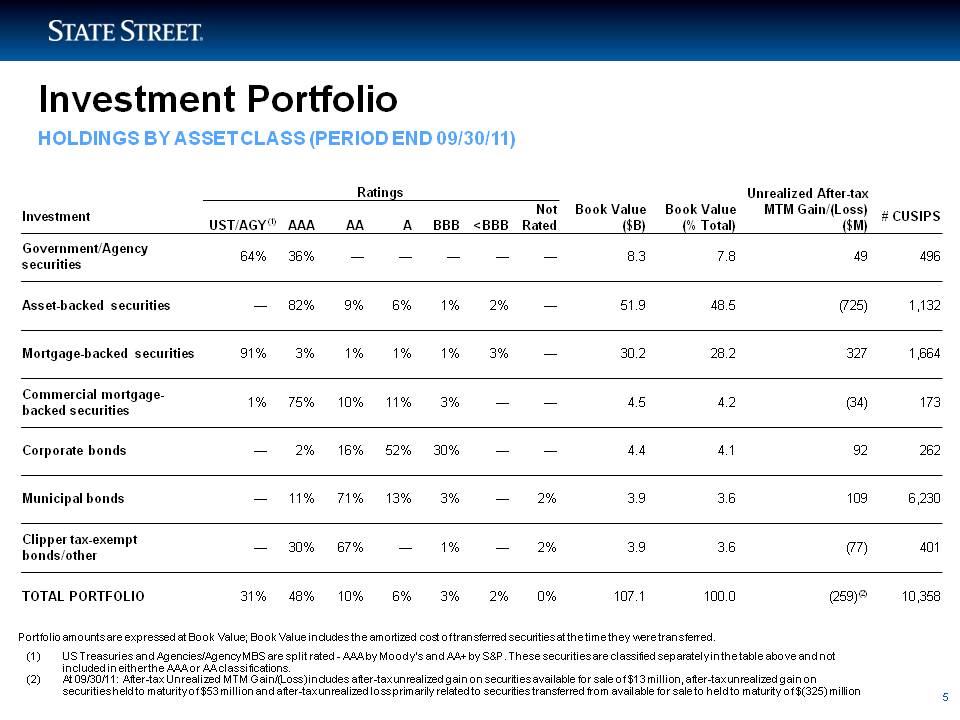
Investment Portfolio HOLDINGS BY ASSET CLASS (PERIOD END 09/30/11) Portfolio amounts are expressed at Book Value; Book Value includes the amortized cost of transferred securities at the time they were transferred. US Treasuries and Agencies/Agency MBS are split rated - AAA by Moody’s and AA+ by S&P. These securities are classified separately in the table above and not included in either the AAA or AA classifications. At 09/30/11: After-tax Unrealized MTM Gain/(Loss) includes after-tax unrealized gain on securities available for sale of $13 million, after-tax unrealized gain on securities held to maturity of $53 million and after-tax unrealized loss primarily related to securities transferred from available for sale to held to maturity of $(325) million (1) Ratings B kV l B kV l Unrealized After-tax MTM G i /(L ) N t Book Value ($B) Book Value (% Total) Gain/(Loss) ($M) Investment UST/AGY AAA AA A BBB <BBB Not Rated # CUSIPS Government/Agency securities 64% 36% — — — — — 8.3 7.8 49 496 Asset-backed securities — 82% 9% 6% 1% 2% — 51 9 48 5 (725) 1 132 (1) Asset 51.9 48.5 1,132 Mortgage-backed securities 91% 3% 1% 1% 1% 3% — 30.2 28.2 327 1,664 Commercial mortgage backed 1% 75% 10% 11% 3% — — 4.5 4.2 (34) 173 backed securities Corporate bonds — 2% 16% 52% 30% — — 4.4 4.1 92 262 Municipal bonds — 11% 71% 13% 3% — 2% 3.9 3.6 109 6,230 Clipper tax-exempt bonds/other — 30% 67% — 1% — 2% 3.9 3.6 (77) 401 TOTAL PORTFOLIO 31% 48% 10% 6% 3% 2% 0% 107.1 100.0 (259)(2) 10,358 5
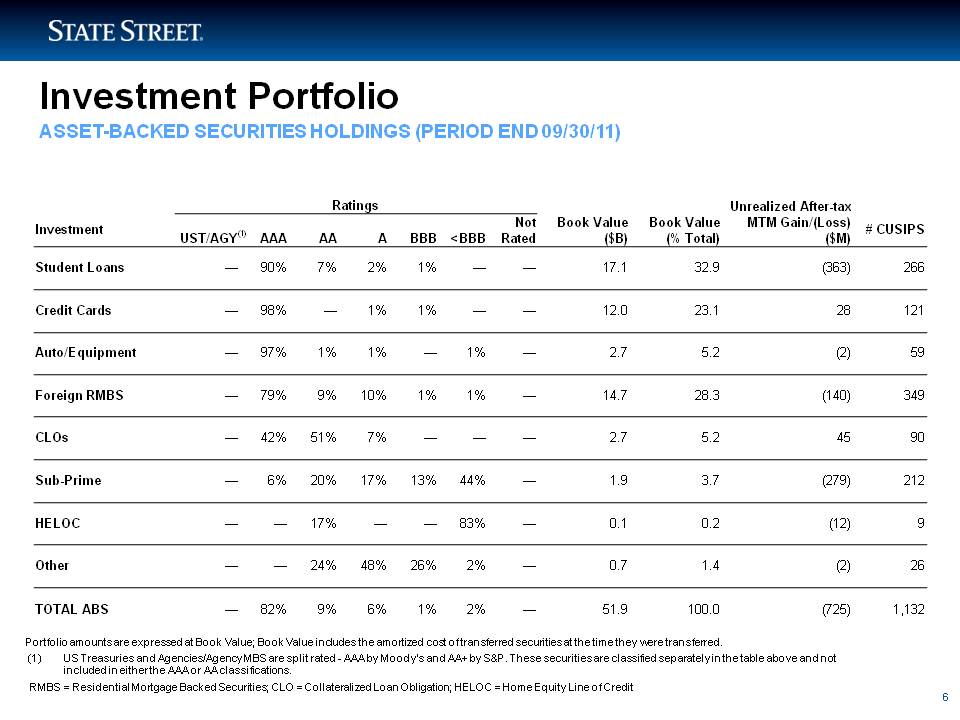
Investment Portfolio ASSET-BACKED SECURITIES HOLDINGS (PERIOD END 09/30/11) Portfolio amounts are expressed at Book Value; Book Value includes the amortized cost of transferred securities at the time they were transferred. (1) US Treasuries and Agencies/Agency MBS are split rated - AAA by Moody’s and AA+ by S&P. These securities are classified separately in the table above and not included in either the AAA or AA classifications. RMBS = Residential Mortgage Backed Securities; CLO = Collateralized Loan Obligation; HELOC = Home Equity Line of Credit Ratings Unrealized After tax Book Value ($B) Book Value (% Total) After-MTM Gain/(Loss) ($M) Investment UST/AGY AAA AA A BBB <BBB Not Rated # CUSIPS Student Loans — 90% 7% 2% 1% — — 17.1 32.9 (363) 266 Credit 98% 1% 1% 12 0 23 1 28 121 (1) Cards — — — — 12.0 23.1 Auto/Equipment — 97% 1% 1% — 1% — 2.7 5.2 (2) 59 Foreign RMBS — 79% 9% 10% 1% 1% — 14.7 28.3 (140) 349 CLOs — 42% 51% 7% — — — 2.7 5.2 45 90 Sub-Prime — 6% 20% 17% 13% 44% — 1.9 3.7 (279) 212 HELOC — — 17% — — 83% — 0.1 0.2 (12) 9 Other — — 24% 48% 26% 2% — 0.7 1.4 (2) 26 TOTAL ABS — 82% 9% 6% 1% 2% — 51.9 100.0 ( 725) 1,132 6
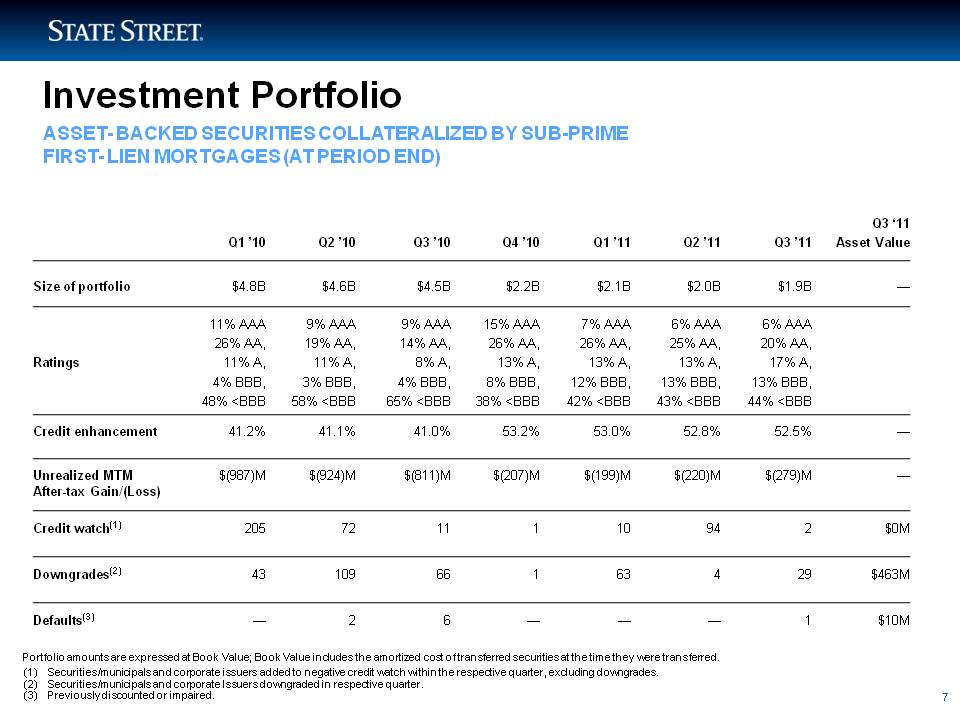
Investment Portfolio ASSET- BACKED SECURITIES COLLATERALIZED BY SUB-PRIME FIRST- LIEN MORTGAGES (AT PERIOD END) (1) Securities/municipals and corporate issuers added to negative credit watch within the respective quarter, excluding downgrades. Securities/municipals and corporate Issuers downgraded in respective quarter. Previously discounted or impaired. Portfolio amounts are expressed at Book Value; Book Value includes the amortized cost of transferred securities at the time they were transferred. Q1 ’10 Q2 ’10 Q3 ’10 Q4 ’10 Q1 ’11 Q2 ’11 Q3 ’11 Q3 ‘11 Asset Value Size of portfolio $4.8B $4.6B $4.5B $2.2B $2.1B $2.0B $1.9B — Ratings 11% AAA 26% AA, 11% A, 4% BBB, 48% <BBB 9% AAA 19% AA, 11% A, 3% BBB, 58% <BBB 9% AAA 14% AA, 8% A, 4% BBB, 65% <BBB 15% AAA 26% AA, 13% A, 8% BBB, 38% <BBB 7% AAA 26% AA, 13% A, 12% BBB, 42% <BBB 6% AAA 25% AA, 13% A, 13% BBB, 43% <BBB 6% AAA 20% AA, 17% A, 13% BBB, 44% <BBB Credit enhancement 41.2% 41.1% 41.0% 53.2% 53.0% 52.8% 52.5% — Unrealized MTM After-tax Gain/(Loss) $(987)M $(924)M $(811)M $(207)M $(199)M $(220)M $(279)M — Credit watch(1) 205 72 11 1 10 94 2 $0M Downgrades(2) 43 109 66 1 63 4 29 $463M D f lt (3) 2 6 1 $10M
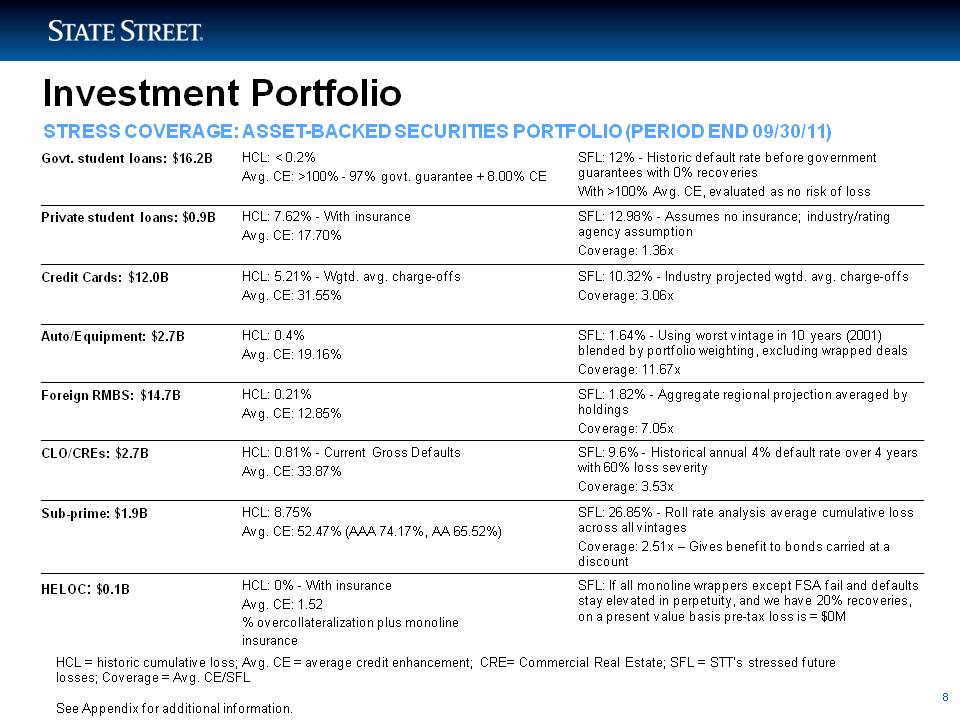
Investment Portfolio HCL = historic cumulative loss; Avg. CE = average credit enhancement; CRE= Commercial Real Estate; SFL = STT’s stressed future losses; Coverage = Avg. CE/SFL See Appendix for additional information. STRESS COVERAGE: ASSET-BACKED SECURITIES PORTFOLIO (PERIOD END 09/30/11) Govt. student loans: $16.2B HCL: < 0.2% Avg. CE: >100% - 97% govt. guarantee + 8.00% CE SFL: 12% - Historic default rate before government guarantees with 0% recoveries With >100% Avg. CE, evaluated as no risk of loss Private student loans: $0.9B HCL: 7.62% - With insurance Avg. CE: 17.70% SFL: 12.98% - Assumes no insurance; industry/rating agency assumption Coverage: 1.36x Credit Cards: $12.0B HCL: 5.21% - Wgtd. avg. charge-offs Avg. CE: 31.55% SFL: 10.32% - Industry projected wgtd. avg. charge-offs Coverage: 3.06x Auto/Equipment: $2.7B HCL: 0.4% Avg. CE: 19.16% SFL: 1.64% - Using worst vintage in 10 years (2001) blended by portfolio weighting, excluding wrapped deals Coverage: 11.67x Foreign RMBS: $14.7B HCL: 0.21% Avg CE: 12 85% SFL: 1.82% - Aggregate regional projection averaged by holdings Avg. 12.85% Coverage: 7.05x CLO/CREs: $2.7B HCL: 0.81% - Current Gross Defaults Avg. CE: 33.87% SFL: 9.6% - Historical annual 4% default rate over 4 years with 60% loss severity Coverage: 3.53x Sub-prime: $1 9B 8 75% SFL: 26 85% - 1.9B HCL: 8.75% Avg. CE: 52.47% (AAA 74.17%, AA 65.52%) 26.85% Roll rate analysis average cumulative loss across all vintages Coverage: 2.51x – Gives benefit to bonds carried at a discount HELOC: $0.1B HCL: 0% - With insurance Avg. CE: 1.52 SFL: If all monoline wrappers except FSA fail and defaults stay elevated in perpetuity, and we have 20% recoveries, on value pre-tax is 8 HCL = historic cumulative loss; Avg. CE = average credit enhancement; CRE= Commercial Real Estate; SFL = STT’s stressed future losses; Coverage = Avg. CE/SFL See Appendix for additional information. % overcollateralization plus monoline insurance a present basis loss = $0M
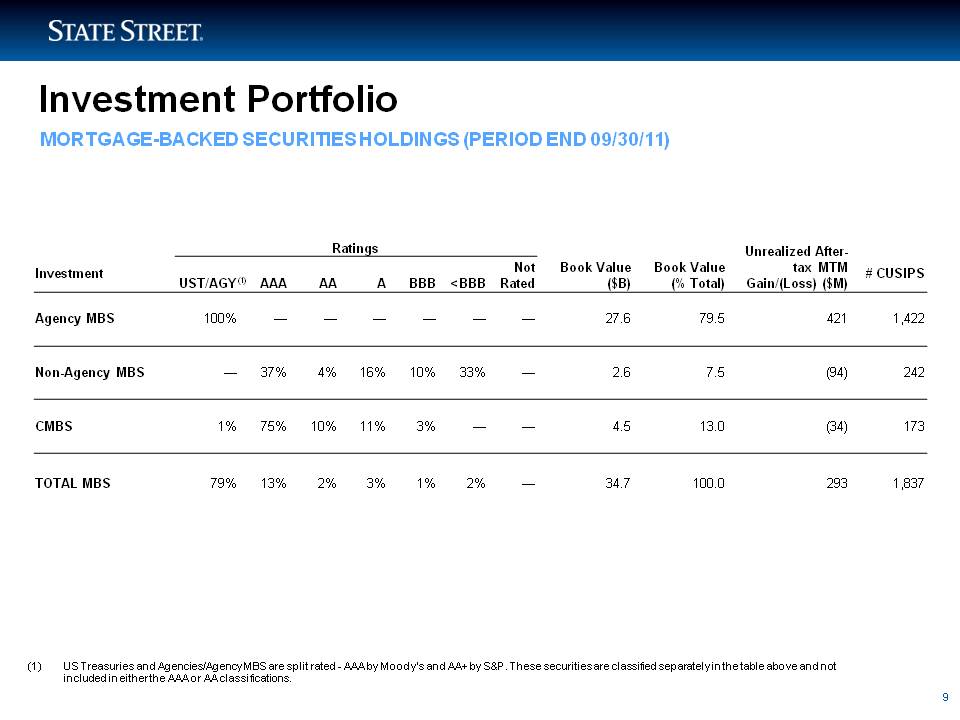
Investment Portfolio MORTGAGE-BACKED SECURITIES HOLDINGS (PERIOD END 09/30/11) (1) US Treasuries and Agencies/Agency MBS are split rated - AAA by Moody’s and AA+ by S&P. These securities are classified separately in the table above and not included in either the AAA or AA classifications. Ratings Book Value ($B) Book Value (% Total) Unrealized Aftertax MTM Gain/(Loss) ($M) Investment UST/AGY AAA AA A BBB <BBB Not Rated # CUSIPS (1) Agency MBS 100% — — — — — — 27.6 79.5 421 1,422 Non-Agency MBS — 37% 4% 16% 10% 33% — 2.6 7.5 (94) 242 CMBS 1% 75% 10% 11% 3% — — 4.5 13.0 (34) 173 TOTAL MBS 79% 13% 2% 3% 1% 2% — 34.7 100.0 293 1,837 9
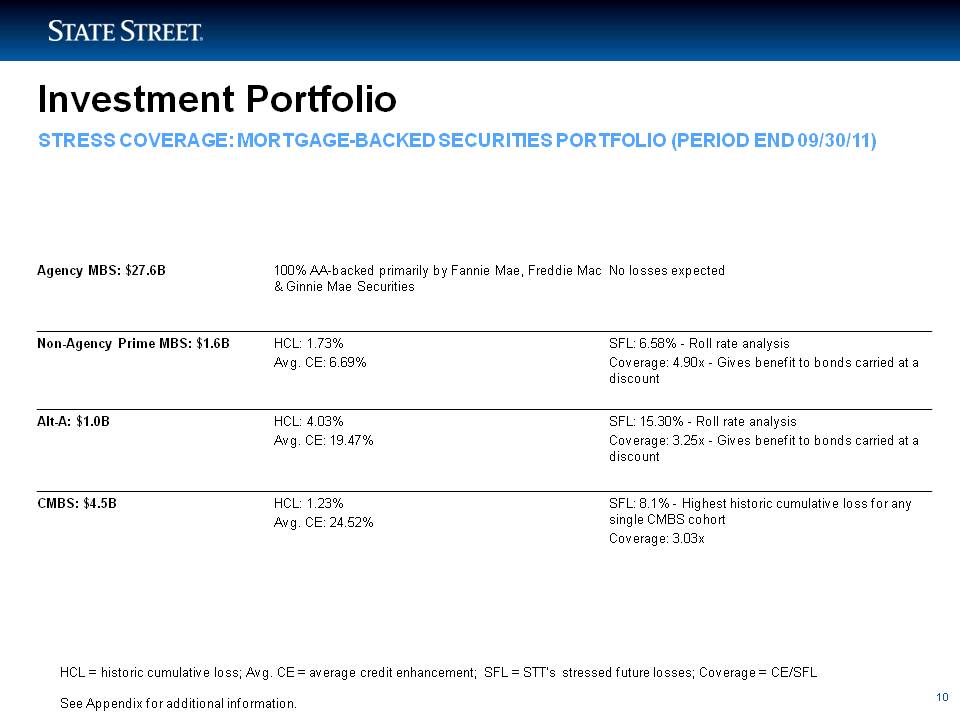
Investment Portfolio STRESS COVERAGE: MORTGAGE-BACKED SECURITIES PORTFOLIO (PERIOD END 09/30/11) HCL = historic cumulative loss; Avg. CE = average credit enhancement; SFL = STT’s stressed future losses; Coverage = CE/SFLSee Appendix for additional information. Agency MBS: $27.6B 100% AA-backed primarily by Fannie Mae, Freddie Mac & Ginnie Mae Securities No losses expected Non-Agency Prime MBS: $1.6B HCL: 1.73% Avg. CE: 6.69% SFL: 6.58% - Roll rate analysis Coverage: 4.90x - Gives benefit to bonds carried at a discount Alt-A: $1.0B HCL: 4.03% Avg. CE: 19.47% SFL: 15.30% - Roll rate analysis Coverage: 3.25x - Gives benefit to bonds carried at a discount CMBS: $4.5B HCL: 1.23% SFL: 8.1% - Highest historic cumulative loss for any Avg. CE: 24.52% single CMBS cohort Coverage: 3.03x
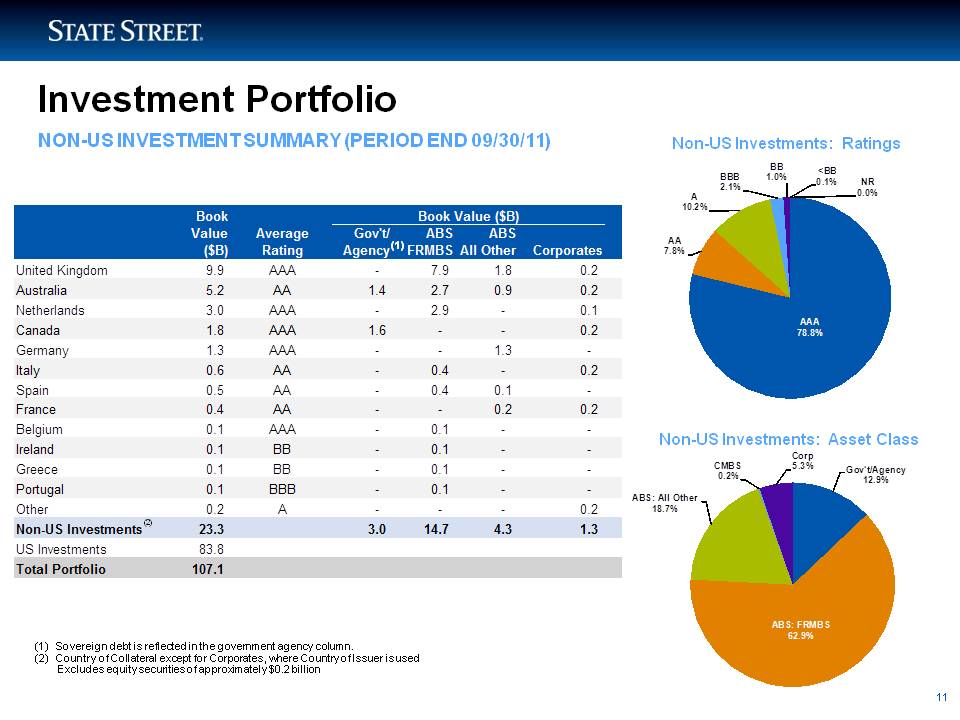
Investment Portfolio NON-US INVESTMENT SUMMARY (PERIOD END 09/30/11) Non-US Investments: Ratings Non-US Investments: Asset Class (1) Country of Collateral except for Corporates, where Country of Issuer is used Excludes equity securities of approximately $0.2 billion United Kingdom 9.9 AAA - 7.9 1.8 0.2 Australia 5.2 AA 1.4 2.7 0.9 0.2 Netherlands 3 0 AAA 2 9 0 1 AA 7.8% 10.2% 3.0 - 2.9 - 0.1 Canada 1.8 AAA 1.6 - - 0.2 Germany 1.3 AAA - - 1.3 - Italy 0.6 AA - 0.4 - 0.2 Spain 0.5 AA - 0.4 0.1 - France 0 4 AA - - 0 2 0 2 AAA 78.8% Gov't/Agency 12.9% ABS: All Other 18.7% CMBS 0.2% Corp 5.3% 0.4 0.2 0.2 Belgium 0.1 AAA - 0.1 - - Ireland 0.1 BB - 0.1 - - Greece 0.1 BB - 0.1 - - Portugal 0.1 BBB - 0.1 - - Other 0.2 A - - - 0.2 Non-US Investments: Asset Class Non-US Investments 23.3 3.0 14.7 4.3 Book 1.3 83.8 107.1 BBB 2.1% BB1.0% <BB 0.1% NR 0.0% 11
Investment Portfolio APPENDIX 12
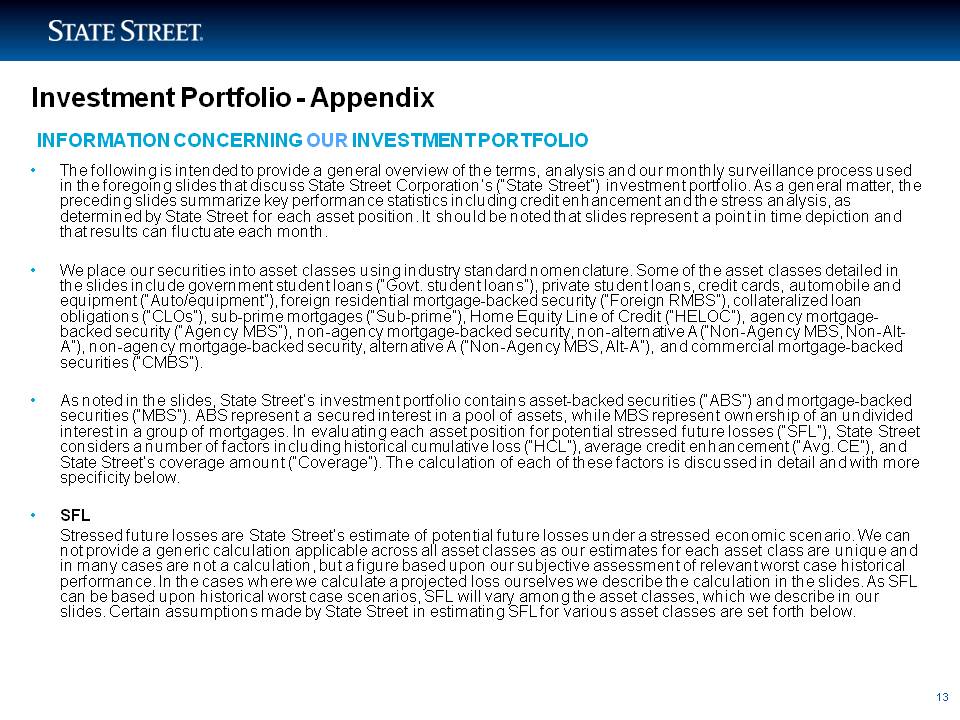
Investment Portfolio – Appendix The following is intended to provide a general overview of the terms, analysis and our monthly surveillance process used in the foregoing slides that discuss State Street Corporation’s (“State Street”) investment portfolio. As a general matter, the preceding slides summarize key performance statistics including credit enhancement and the stress analysis, as determined by State Street for each asset position. It should be noted that slides represent a point in time depiction and that results can fluctuate each month.We place our securities into asset classes using industry standard nomenclature. Some of the asset classes detailed in the slides include government student loans (“Govt. student loans”), private student loans, credit cards, automobile and equipment (“Auto/equipment”), foreign residential mortgage-backed security (“Foreign RMBS”), collateralized loan obligations (“CLOs”), sub-prime mortgages (“Sub-prime”), Home Equity Line of Credit (“HELOC”), agency mortgage-backed security (“Agency MBS”), non-agency mortgage-backed security, non-alternative A (“Non-Agency MBS, Non-Alt-A”), non-agency mortgage-backed security, alternative A (“Non-Agency MBS, Alt-A”), and commercial mortgage-backed securities (“CMBS”).As noted in the slides, State Street’s investment portfolio contains asset-backed securities (“ABS”) and mortgage-backed securities (“MBS”). ABS represent a secured interest in a pool of assets, while MBS represent ownership of an undivided interest in a group of mortgages. In evaluating each asset position for potential stressed future losses (“SFL”), State Street considers a number of factors including historical cumulative loss (“HCL”), average credit enhancement (“Avg. CE”), and State Street’s coverage amount (“Coverage”). The calculation of each of these factors is discussed in detail and with more specificity below. SFL Stressed future losses are State Street’s estimate of potential future losses under a stressed economic scenario. We can not provide a generic calculation applicable across all asset classes as our estimates for each asset class are unique and in many cases are not a calculation, but a figure based upon our subjective assessment of relevant worst case historical performance. In the cases where we calculate a projected loss ourselves we describe the calculation in the slides. As SFL can be based upon historical worst case scenarios, SFL will vary among the asset classes, which we describe in our slides. Certain assumptions made by State Street in estimating SFL for various asset classes are set forth below. INFORMATION CONCERNING OUR INVESTMENT PORTFOLIO 13
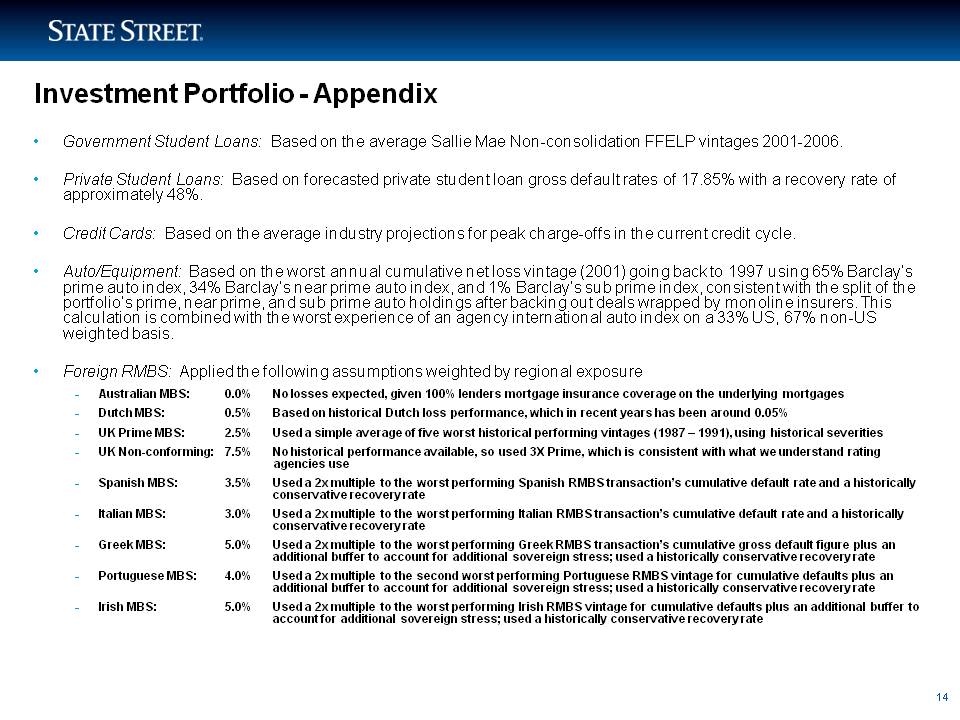
Investment Portfolio – Appendix Government Student Loans: Based on the average Sallie Mae Non-consolidation FFELP vintages 2001-2006.Private Student Loans: Based on forecasted private student loan gross default rates of 17.85% with a recovery rate of approximately 48%.Credit Cards: Based on the average industry projections for peak charge-offs in the current credit cycle.Auto/Equipment: Based on the worst annual cumulative net loss vintage (2001) going back to 1997 using 65% Barclay’s prime auto index, 34% Barclay’s near prime auto index, and 1% Barclay’s sub prime index, consistent with the split of the portfolio’s prime, near prime, and sub prime auto holdings after backing out deals wrapped by monoline insurers. This calculation is combined with the worst experience of an agency international auto index on a 33% US, 67% non-US weighted basis.Foreign RMBS: Applied the following assumptions weighted by regional exposureAustralian MBS: 0.0% No losses expected, given 100% lenders mortgage insurance coverage on the underlying mortgagesDutch MBS: 0.5% Based on historical Dutch loss performance, which in recent years has been around 0.05%UK Prime MBS: 2.5% Used a simple average of five worst historical performing vintages (1987 – 1991), using historical severitiesUK Non-conforming: 7.5% No historical performance available, so used 3X Prime, which is consistent with what we understand rating agencies useSpanish MBS: 3.5% Used a 2x multiple to the worst performing Spanish RMBS transaction’s cumulative default rate and a historically conservative recovery rateItalian MBS: 3.0% Used a 2x multiple to the worst performing Italian RMBS transaction’s cumulative default rate and a historically conservative recovery rateGreek MBS: 5.0% Used a 2x multiple to the worst performing Greek RMBS transaction’s cumulative gross default figure plus an additional buffer to account for additional sovereign stress; used a historically conservative recovery ratePortuguese MBS: 4.0% Used a 2x multiple to the second worst performing Portuguese RMBS vintage for cumulative defaults plus an additional buffer to account for additional sovereign stress; used a historically conservative recovery rateIrish MBS: 5.0% Used a 2x multiple to the worst performing Irish RMBS vintage for cumulative defaults plus an additional buffer to account for additional sovereign stress; used a historically conservative recovery rate 14
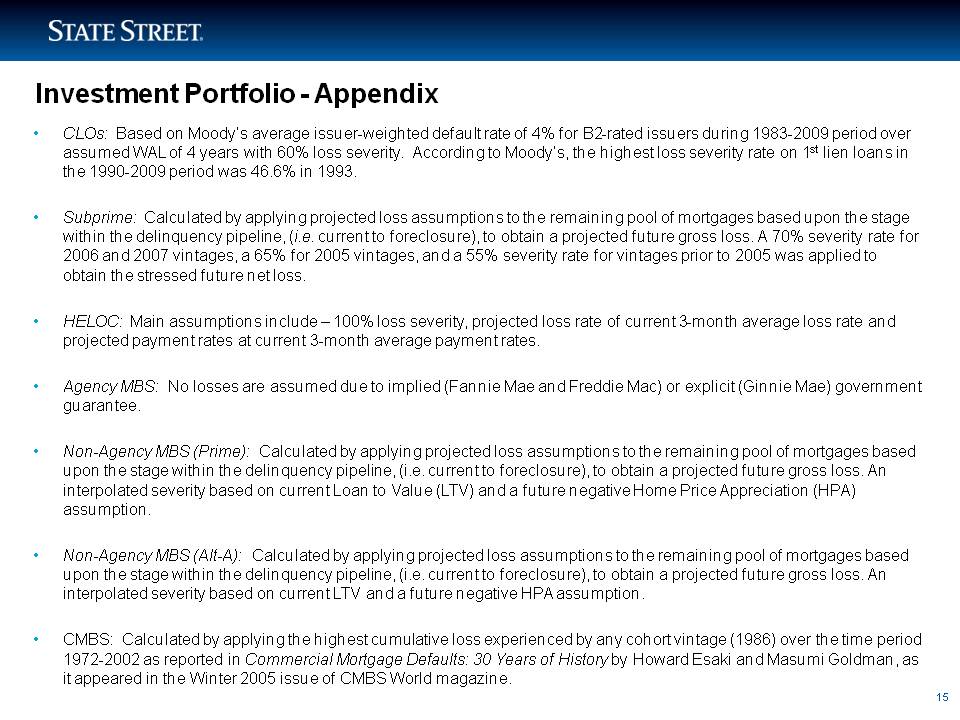
CLOs: Based on Moody’s average issuer-weighted default rate of 4% for B2-rated issuers during 1983-2009 period over assumed WAL of 4 years with 60% loss severity. According to Moody’s, the highest loss severity rate on 1st lien loans in the 1990-2009 period was 46.6% in 1993.Subprime: Calculated by applying projected loss assumptions to the remaining pool of mortgages based upon the stage within the delinquency pipeline, (i.e. current to foreclosure), to obtain a projected future gross loss. A 70% severity rate for 2006 and 2007 vintages, a 65% for 2005 vintages, and a 55% severity rate for vintages prior to 2005 was applied to obtain the stressed future net loss.HELOC: Main assumptions include – 100% loss severity, projected loss rate of current 3-month average loss rate and projected payment rates at current 3-month average payment rates.Agency MBS: No losses are assumed due to implied (Fannie Mae and Freddie Mac) or explicit (Ginnie Mae) government guarantee.Non-Agency MBS (Prime): Calculated by applying projected loss assumptions to the remaining pool of mortgages based upon the stage within the delinquency pipeline, (i.e. current to foreclosure), to obtain a projected future gross loss. An interpolated severity based on current Loan to Value (LTV) and a future negative Home Price Appreciation (HPA) assumption. Non-Agency MBS (Alt-A): Calculated by applying projected loss assumptions to the remaining pool of mortgages based upon the stage within the delinquency pipeline, (i.e. current to foreclosure), to obtain a projected future gross loss. An interpolated severity based on current LTV and a future negative HPA assumption. CMBS: Calculated by applying the highest cumulative loss experienced by any cohort vintage (1986) over the time period 1972-2002 as reported in Commercial Mortgage Defaults: 30 Years of History by Howard Esaki and Masumi Goldman, as it appeared in the Winter 2005 issue of CMBS World magazine. Investment Portfolio - Appendix 15
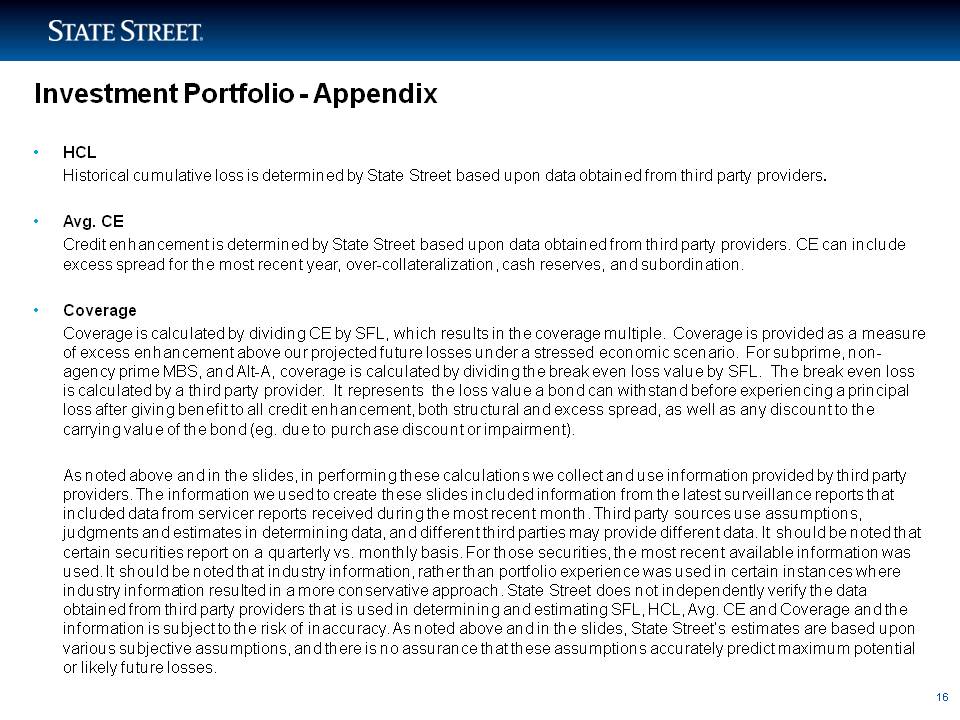
Investment Portfolio – Appendix HCL Historical cumulative loss is determined by State Street based upon data obtained from third party providers. Avg. CE Credit enhancement is determined by State Street based upon data obtained from third party providers. CE can include excess spread for the most recent year, over-collateralization, cash reserves, and subordination. Coverage Coverage is calculated by dividing CE by SFL, which results in the coverage multiple. Coverage is provided as a measure of excess enhancement above our projected future losses under a stressed economic scenario. For subprime, non-agency prime MBS, and Alt-A, coverage is calculated by dividing the break even loss value by SFL. The break even loss is calculated by a third party provider. It represents the loss value a bond can withstand before experiencing a principal loss after giving benefit to all credit enhancement, both structural and excess spread, as well as any discount to the carrying value of the bond (eg. due to purchase discount or impairment). As noted above and in the slides, in performing these calculations we collect and use information provided by third party providers. The information we used to create these slides included information from the latest surveillance reports that included data from servicer reports received during the most recent month. Third party sources use assumptions, judgments and estimates in determining data, and different third parties may provide different data. It should be noted that certain securities report on a quarterly vs. monthly basis. For those securities, the most recent available information was used. It should be noted that industry information, rather than portfolio experience was used in certain instances where industry information resulted in a more conservative approach. State Street does not independently verify the data obtained from third party providers that is used in determining and estimating SFL, HCL, Avg. CE and Coverage and the information is subject to the risk of inaccuracy. As noted above and in the slides, State Street’s estimates are based upon various subjective assumptions, and there is no assurance that these assumptions accurately predict maximum potential or likely future losses.