Attached files
| file | filename |
|---|---|
| 8-K - EASYLINK SERVICES INTERNATIONAL CORP | esic-8k20111018.htm |
Investor Presentation Tom Stallings, Chief Executive Officer Glen Shipley, Chief Financial Officer October 18-19, 2011
Safe Harbor Statements included that are not historical facts (including any statements concerning plans and objectives of management for future operations or economic performance, or assumptions or forecasts related thereto), are forward-looking statements. These statements can be identified by the use of forward-looking terminology including “forecast,” “may,” “believe,” “will,” “expect,” “anticipate,” “estimate,” “continue” or other similar words. These statements discuss future expectations, contain projections of results of operations or of financial condition or state other “forward-looking” information. We and our representatives may from time to time make other oral or written statements that are also forward-looking statements. These forward-looking statements are made based upon management’s current plans, expectations, estimates, assumptions and beliefs concerning future events impacting us and therefore involve a number of risks and uncertainties. We caution that forward-looking statements are not guarantees and that actual results could differ materially from those expressed or implied in the forward-looking statements. Because these forward-looking statements involve risks and uncertainties, actual results could differ materially from those expressed or implied by these forward-looking statements for a number of important reasons. EasyLink Services International Corporation expressly disclaims any intention or obligation to revise or update any forward-looking statements whether as a result of new information, future events, or otherwise. Except for the historical information and discussion contained herein, statements contained in this presentation may constitute forward-looking statements within the meaning of the Private Securities Litigation Reform Act of 1995. These statements involve a number of risks, uncertainties and other factors that could cause actual results to differ materially from those indicated by such forward-looking statements. These and other risk factors are set forth under the caption "Risk Factors" in the Company's Annual Report on Form 10-K, the Company's quarterly reports on Form 10-Q and the Company's other filings with the Securities and Exchange Commission. These filings are available on a website maintained by the Securities and Exchange Commission at www.sec.gov. 2 Safe Harbor:

Agenda Overview EasyLink Services International Corporation The Opportunity Delivering Enterprise Communications Applications Over the Cloud Solutions, Customers, and Growth Strategy Team Financials Summary Questions and Answers 3 Agenda:
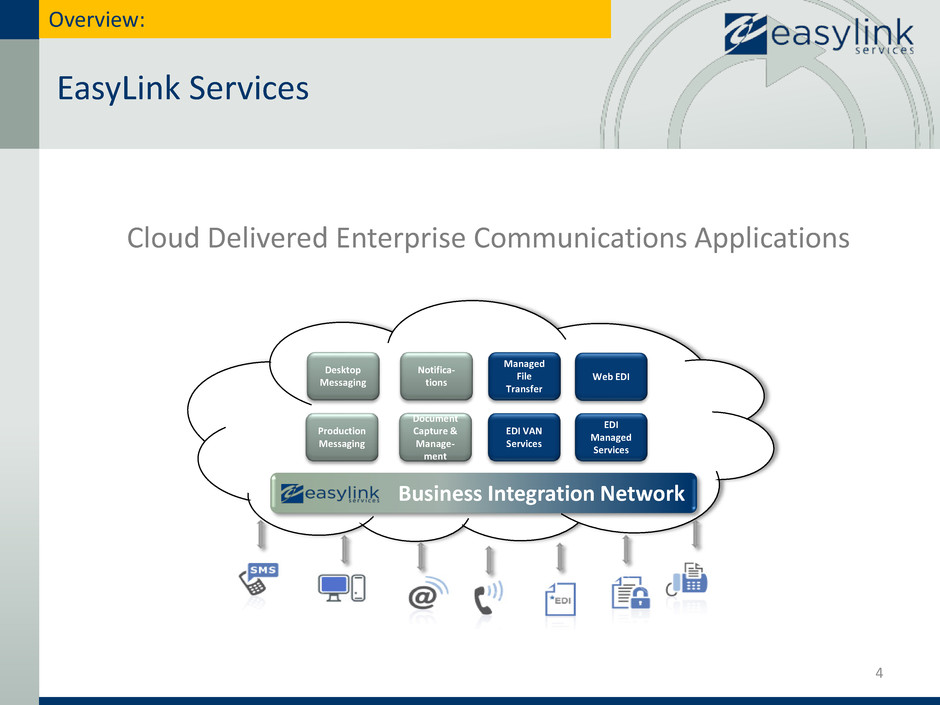
EasyLink Services 4 Overview: Cloud Delivered Enterprise Communications Applications Business Integration Network EDI VAN Services EDI Managed Services Managed File Transfer Web EDI Desktop Messaging Notifica- tions Production Messaging Document Capture & Manage- ment
Investor Snapshot 5 Overview (continued): Exchange: NASDAQ Capital Markets Ticker: ESIC Headquarters: Atlanta, GA International Headquarters: London and Tokyo Employees: 540+ Shares Outstanding: 31.75M Market Cap1: $169.9M Enterprise Value2: $244.7M 1 Market Cap is calculated using shares outstanding and Oct. 14, 2011 closing share price 2 Enterprise Value = Market Cap as stated above + Total Debt - Total Cash & Short Term Investments as of July 31, 2011
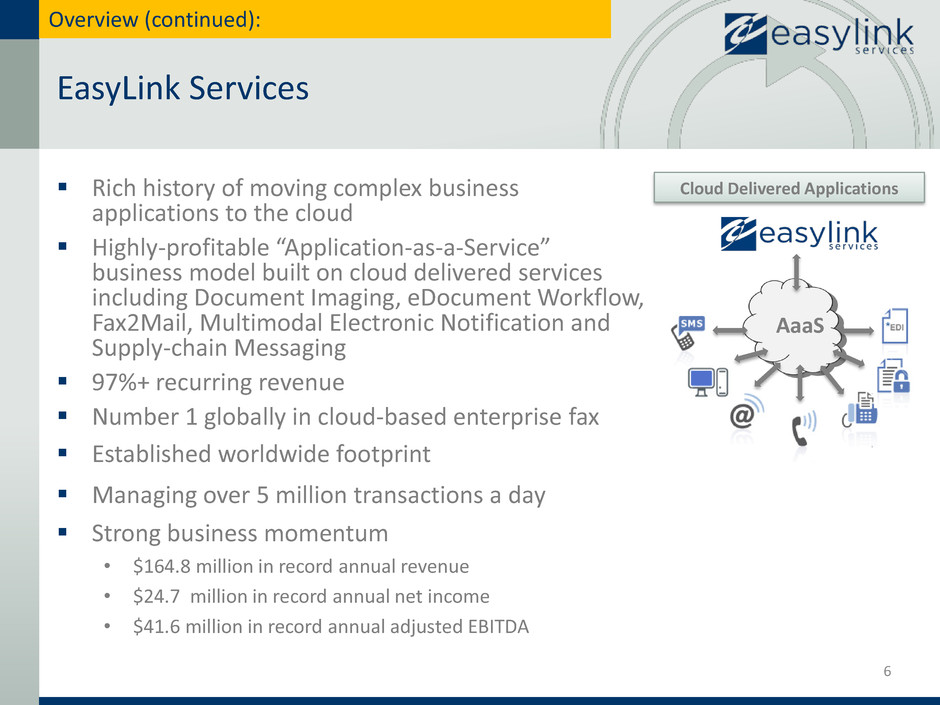
Rich history of moving complex business applications to the cloud Highly-profitable “Application-as-a-Service” business model built on cloud delivered services including Document Imaging, eDocument Workflow, Fax2Mail, Multimodal Electronic Notification and Supply-chain Messaging 97%+ recurring revenue Number 1 globally in cloud-based enterprise fax Established worldwide footprint Managing over 5 million transactions a day Strong business momentum • $164.8 million in record annual revenue • $24.7 million in record annual net income • $41.6 million in record annual adjusted EBITDA EasyLink Services Overview (continued): Cloud Delivered Applications AaaS 6
Enterprise Cloud-based AaaS = High Growth Market The total market for enterprise cloud- based services will grow from $12.1 billion in 2010 to $35.6 billion in 2015 Spending on enterprise communications applications is expected to grow to $17.7 billion in 2015 Our addressable market for cloud delivered enterprise communications applications is >$1B in size 7 Opportunity: Source: Davidson Consulting, Gartner Group, Analysis Mason, 2010 Logos are owned by respective companies

Market Disrupting Transition to The Cloud According to Research and Markets, “the overall fax service industry will increase from $925 million in 2007 to $1.7billion in 2012, a 12.5% compound annual growth rate (CAGR).” Fax machine market keeps falling, profit margins are getting thinner 50% of the $400M annual fax server market will shift to the cloud by 20141 8 Opportunity (continued): Source: 1Davidson Consulting, Gartner Group, Analysis Mason, 2010 Logos are owned by respective companies EXAMPLE: Moving fax from inside the four walls to the cloud

Why Fax? 15.3 Million* Fax Pages Sent/Received Every Day Fax is deeply ingrained as enterprise’s most trusted platform for secure delivery of legal documents and information Intersection between ECM, Unified Communications and ERP Ecosystems Universal, flexible formats: .tiff, .jpeg, .pdf, etc. Legally accepted and binding Compliance and internal control friendly Highly reliable Provides proof of delivery Immune to viruses and malware Economical Paperless -> Environmentally Friendly *Davidson Consulting Opportunity (continued): •AT&T Intros “Wirephoto” 1910 1925 1980 2011 •First Fax Network Linking Berlin, London and Paris •4 Million Fax Machines in use in US •5.6 Billion Pages Faxed Per Year 9
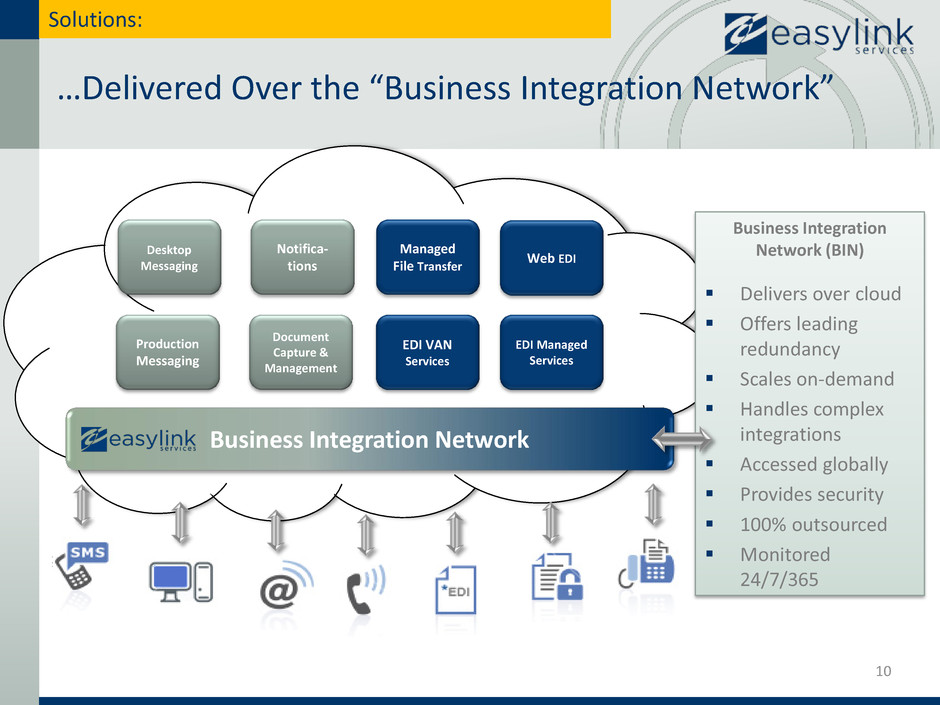
Business Integration Network EDI VAN Services EDI Managed Services Managed File Transfer Web EDI Desktop Messaging Notifica- tions Production Messaging Document Capture & Management 10 …Delivered Over the “Business Integration Network” Solutions: Business Integration Network (BIN) Delivers over cloud Offers leading redundancy Scales on-demand Handles complex integrations Accessed globally Provides security 100% outsourced Monitored 24/7/365
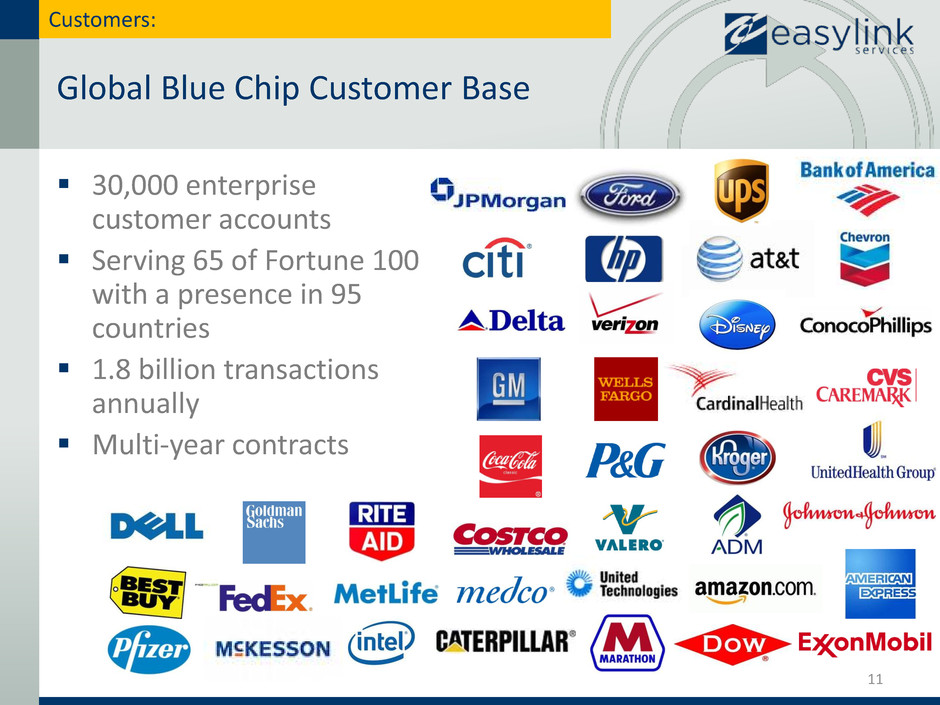
Global Blue Chip Customer Base 30,000 enterprise customer accounts Serving 65 of Fortune 100 with a presence in 95 countries 1.8 billion transactions annually Multi-year contracts Customers: 11

Product Diverse Revenue Generation Customers (continued): Industry Geography International Revenue 12
Competitive Differentiators 100% outsourced and managed risk Global scale and leadership Broader portfolio of applications Complex integration experience Low total cost of ownership 13 Customers (continued):
Organic Growth and Through M&A Organic Growth • Desktop Messaging is growing double digits • Capture new enterprise accounts transitioning to the cloud • Cross-sell broader portfolio of applications into existing 30,000 customer accounts maximizing the number of services per customer • Expand global sales and marketing investments to address adjacent market areas • Usage volumes indicate stability and growth in key business lines M&A • Add additional applications to sell over the business integration network • Acquire new revenues and customer accounts • Extend global reach 14 Growth Strategy:
Proven Ability to Drive EBITDA Through M&A Six acquisitions in six years Strong integration track record with focus on driving synergies Produced results • Significant cash flow from new businesses • More diverse industry base • Expanded application portfolio • Increased geographic, customer and integration scale • More viable partnership network 15 Growth Strategy (continued):

Strong, Experienced Leadership Team 16 Executive Title Experience Years at EasyLink Industry Experience Tom Stallings Chief Executive Officer & Director IBM, Oracle 7 35+ Glen Shipley Chief Financial Officer KPMG, Melita 6 30+ Terri Deuel EVP Worldwide Customer Care IBM, CSI 6 28+ Kevin Maloney EVP Worldwide Sales & Marketing IBM, Check Point 3 30+ Pat Harper SVP Worldwide Operations ACS, DEC 2* 24+ Jim Braun VP Worldwide Development Xpedite, Atl. Simulation 15* 25+ Team: *Includes experience at newly acquired Xpedite

Financial Overview 17 Financial Overview: Glen Shipley, Chief Financial Officer
Financial Overview Fiscal Year: August 1 – July 31 FY 2011 Results reflect approximately 9 months of contribution from the Xpedite acquisition Integration synergies are taking effect • At or near record revenues, cash flow and gross profit forecasted Continuing integration efforts • Data center consolidations • Office and geographical consolidations 18 Financial Overview (continued):

Q4 and Annual FY 2011 Highlights 19 Financial Overview (continued): Q4 FY 2011 FY 2011 Revenue $46.8M $164.8M Gross Profit $30.4M $107.9M Operating Income $5.5M $22.4M Adjusted EBITDA* $10.9M $41.6M Non-GAAP Basic income per share $0.32 $0.81 Aggregated New Contract Value $2.9M $7.0M *Please see GAAP to non-GAAP reconciliation at on slide 25 and 26
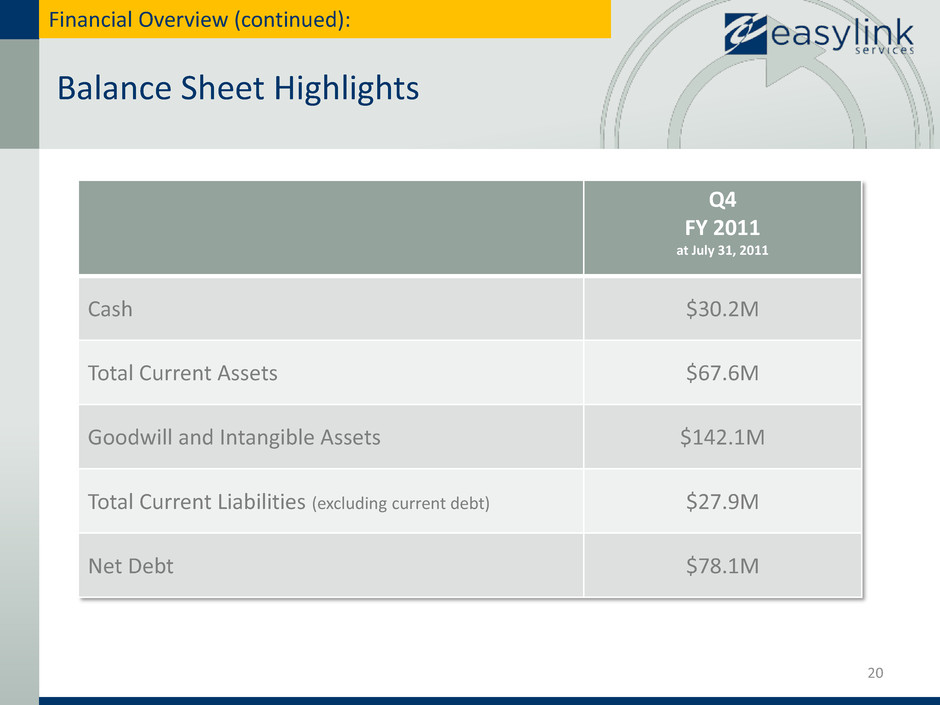
Balance Sheet Highlights 20 Financial Overview (continued): Q4 FY 2011 at July 31, 2011 Cash $30.2M Total Current Assets $67.6M Goodwill and Intangible Assets $142.1M Total Current Liabilities (excluding current debt) $27.9M Net Debt $78.1M
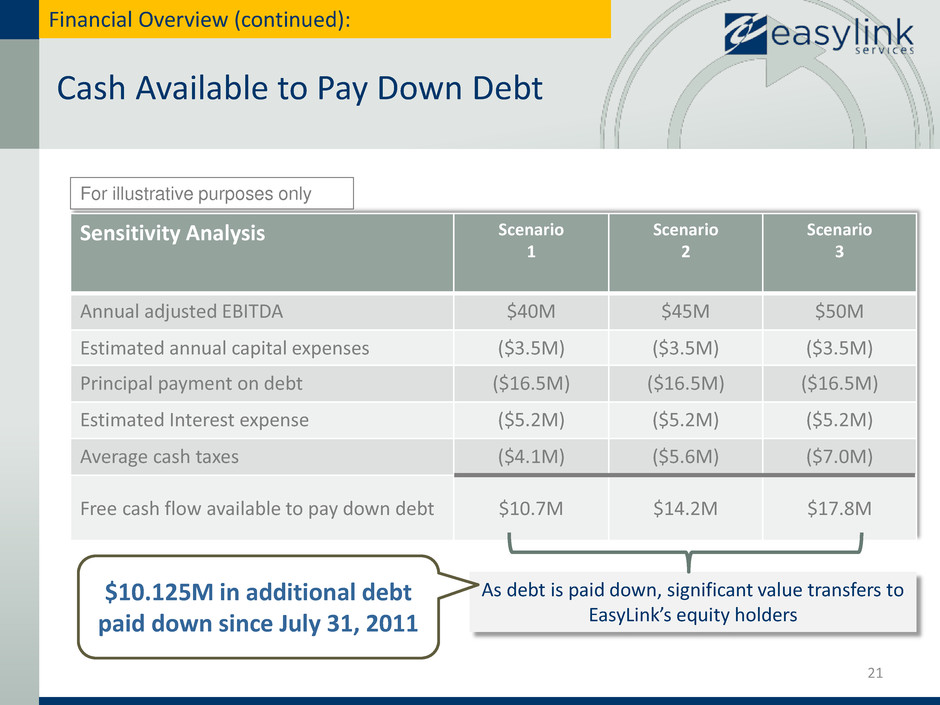
Cash Available to Pay Down Debt 21 Financial Overview (continued): Sensitivity Analysis Scenario 1 Scenario 2 Scenario 3 Annual adjusted EBITDA $40M $45M $50M Estimated annual capital expenses ($3.5M) ($3.5M) ($3.5M) Principal payment on debt ($16.5M) ($16.5M) ($16.5M) Estimated Interest expense ($5.2M) ($5.2M) ($5.2M) Average cash taxes ($4.1M) ($5.6M) ($7.0M) Free cash flow available to pay down debt $10.7M $14.2M $17.8M For illustrative purposes only As debt is paid down, significant value transfers to EasyLink’s equity holders $10.125M in additional debt paid down since July 31, 2011
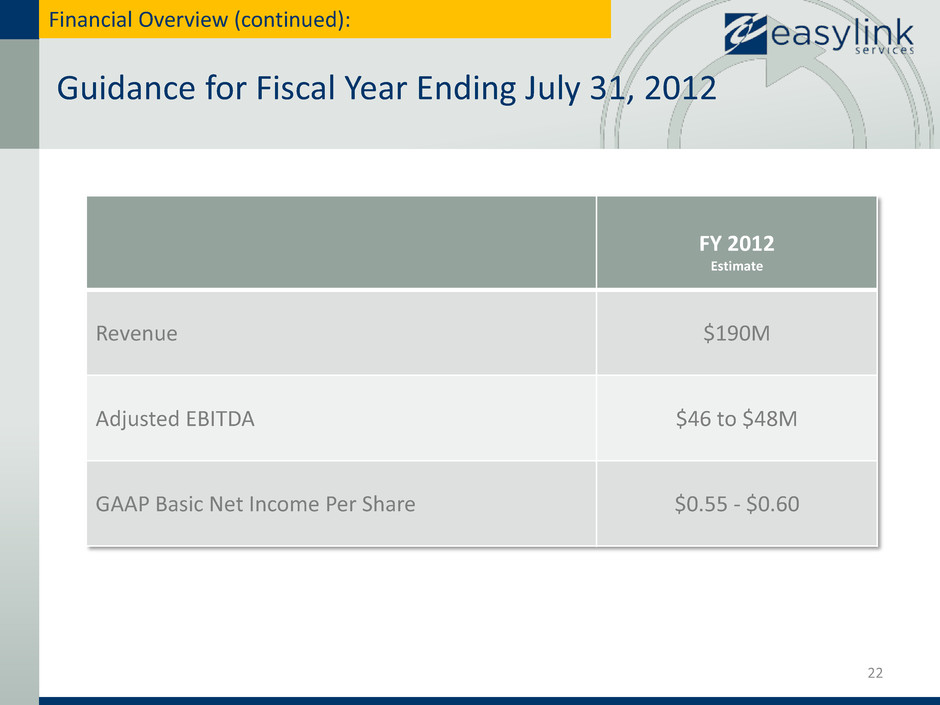
Guidance for Fiscal Year Ending July 31, 2012 22 Financial Overview (continued): FY 2012 Estimate Revenue $190M Adjusted EBITDA $46 to $48M GAAP Basic Net Income Per Share $0.55 - $0.60
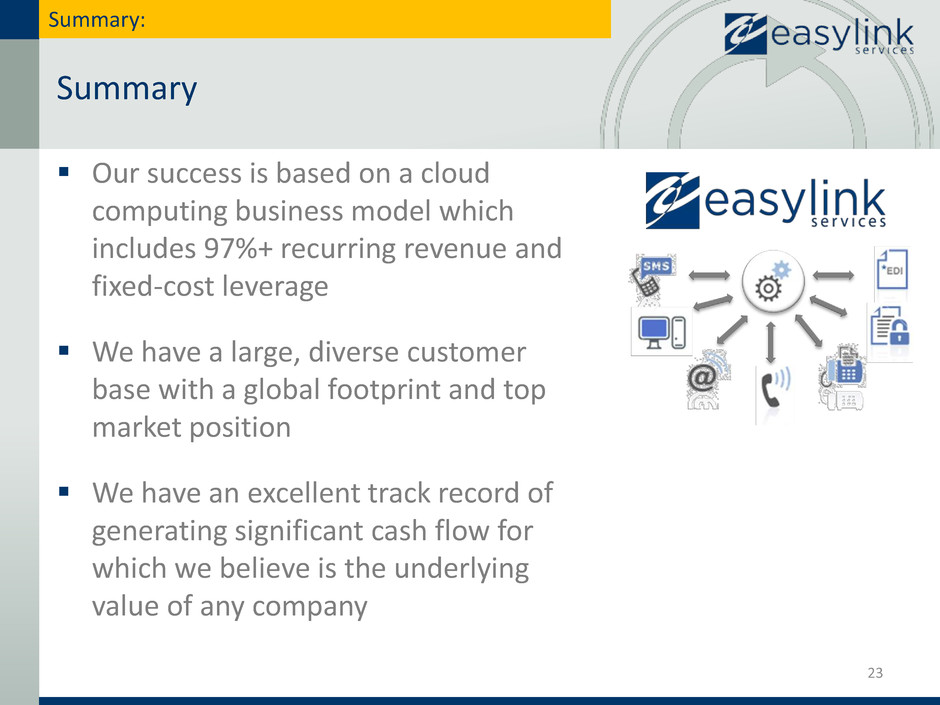
Summary Our success is based on a cloud computing business model which includes 97%+ recurring revenue and fixed-cost leverage We have a large, diverse customer base with a global footprint and top market position We have an excellent track record of generating significant cash flow for which we believe is the underlying value of any company 23 Summary:
Questions and Answers 24 Questions and Answers:

EBITDA Reconciliation (refer to slide 19) 25 Financial Appendix: Q4 FY 2011 FY 2011 Net Income $16,450 $24,696 Interest 1,636 5,699 Taxes (12,424) (7,326) Depreciation and Amortization 3,578 13,533 Non-cash Compensation 708 1,634 Acquisition and Integration related costs 911 3,326 Adjusted EBITDA $10,859 $41,562 in thousands
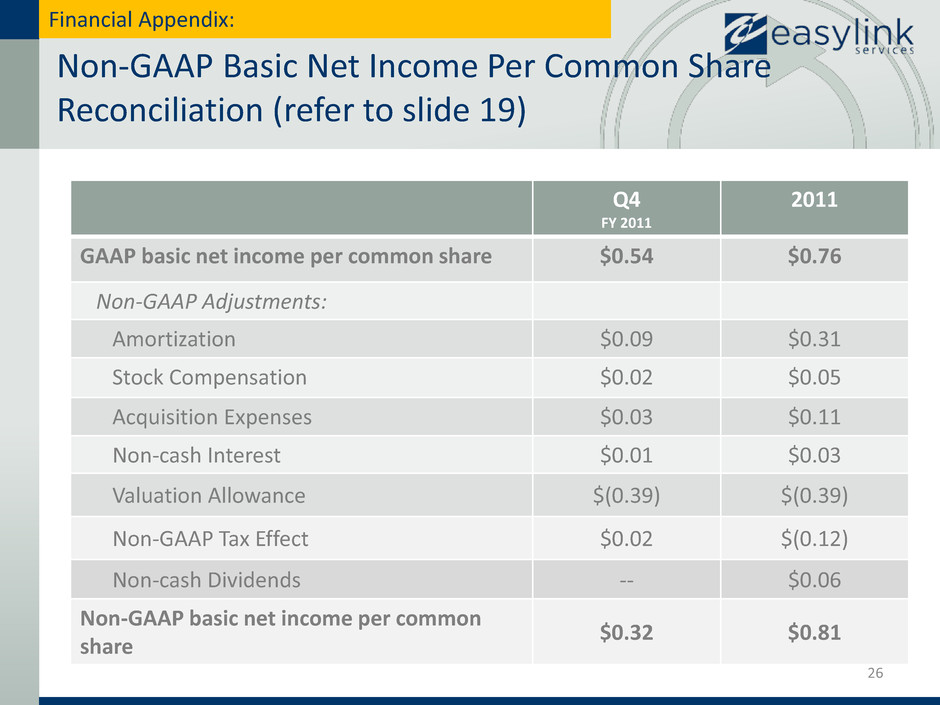
Non-GAAP Basic Net Income Per Common Share Reconciliation (refer to slide 19) 26 Financial Appendix: Q4 FY 2011 2011 GAAP basic net income per common share $0.54 $0.76 Non-GAAP Adjustments: Amortization $0.09 $0.31 Stock Compensation $0.02 $0.05 Acquisition Expenses $0.03 $0.11 Non-cash Interest $0.01 $0.03 Valuation Allowance $(0.39) $(0.39) Non-GAAP Tax Effect $0.02 $(0.12) Non-cash Dividends -- $0.06 Non-GAAP basic net income per common share $0.32 $0.81
