Attached files
| file | filename |
|---|---|
| 8-K - WESTERN ALLIANCE BANCORPORATION 8-K - WESTERN ALLIANCE BANCORPORATION | a50030574.htm |
| EX-99.1 - EXHIBIT 99.1 - WESTERN ALLIANCE BANCORPORATION | a50030574_ex991.htm |
Exhibit 99.2
Ken Vecchione President & COO Dale Gibbons Executive Vice President & CFO 3rd Quarter 2011 Earnings Call Western Alliance Bancorporation (NYSE: WAL) October 18, 2011
Pg. 2 Forward-Looking Information This presentation contains forward-looking statements that relate to expectations, beliefs, projections, future plans and strategies, anticipated events or trends and similar expressions concerning matters that are not historical facts. The forward-looking statements contained herein reflect our current views about future events and financial performance and are subject to risks, uncertainties, assumptions and changes in circumstances that may cause our actual results to differ significantly from historical results and those expressed in any forward-looking statement. Some factors that could cause actual results to differ materially from historical or expected results include: factors listed in the Company’s annual report on Form 10-K as filed with the Securities and Exchange Commission; changes in general economic conditions, either nationally or locally in the areas in which we conduct or will conduct our business; inflation, interest rate, market and monetary fluctuations; increases in competitive pressures among financial institutions and businesses offering similar products and services; higher defaults on our loan portfolio than we expect; changes in management’s estimate of the adequacy of the allowance for loan losses; legislative or regulatory changes or changes in accounting principles, policies or guidelines; supervisory actions by regulatory agencies which may limit our ability to pursue certain growth opportunities; management’s estimates and projections of interest rates and interest rate policy; the execution of our business plan; and other factors affecting the financial services industry generally or the banking industry in particular. We do not intend and disclaim any duty or obligation to update or revise any industry information or forward-looking statements set forth in this presentation to reflect new information, future events or otherwise.
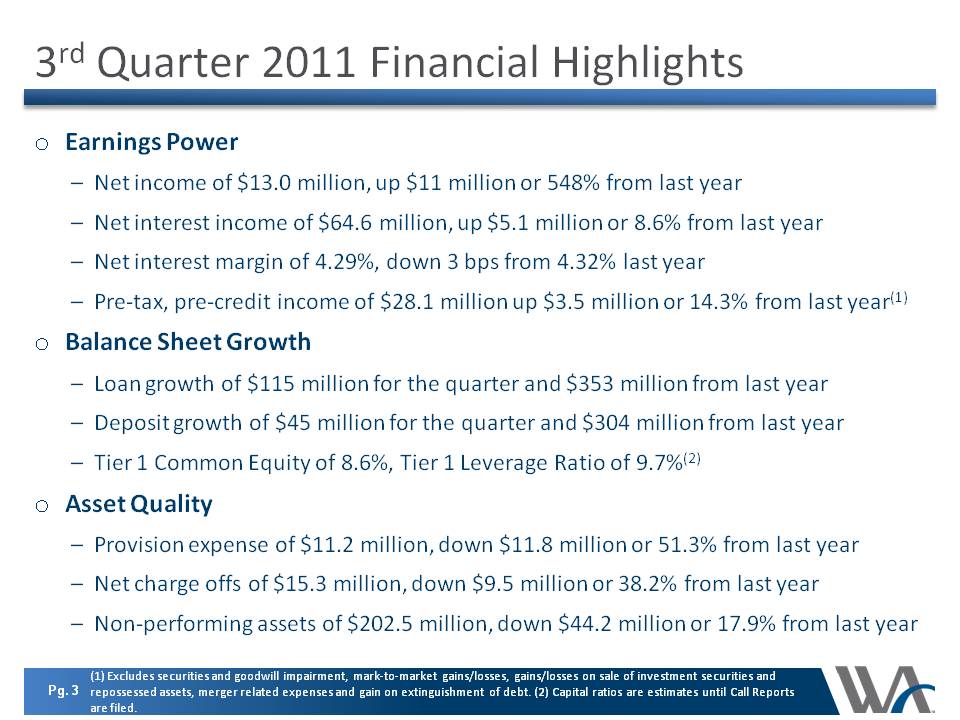
3rd Quarter 2011 Financial Highlights oEarnings Power –Net income of $13.0 million, up $11 million or 548% from last year –Net interest income of $64.6 million, up $5.1 million or 8.6% from last year –Net interest margin of 4.29%, down 3 bps from 4.32% last year –Pre-tax, pre-credit income of $28.1 million up $3.5 million or 14.3% from last year(1) oBalance Sheet Growth –Loan growth of $115 million for the quarter and $353 million from last year –Deposit growth of $45 million for the quarter and $304 million from last year –Tier 1 Common Equity of 8.6%, Tier 1 Leverage Ratio of 9.7%(2) oAsset Quality –Provision expense of $11.2 million, down $11.8 million or 51.3% from last year –Net charge offs of $15.3 million, down $9.5 million or 38.2% from last year –Non-performing assets of $202.5 million, down $44.2 million or 17.9% from last year (1) Excludes securities and goodwill impairment, mark-to-market gains/losses, gains/losses on sale of investment securities and repossessed assets, merger related expenses and gain on extinguishment of debt. (2) Capital ratios are estimates until Call Reports are filed. Pg. 3
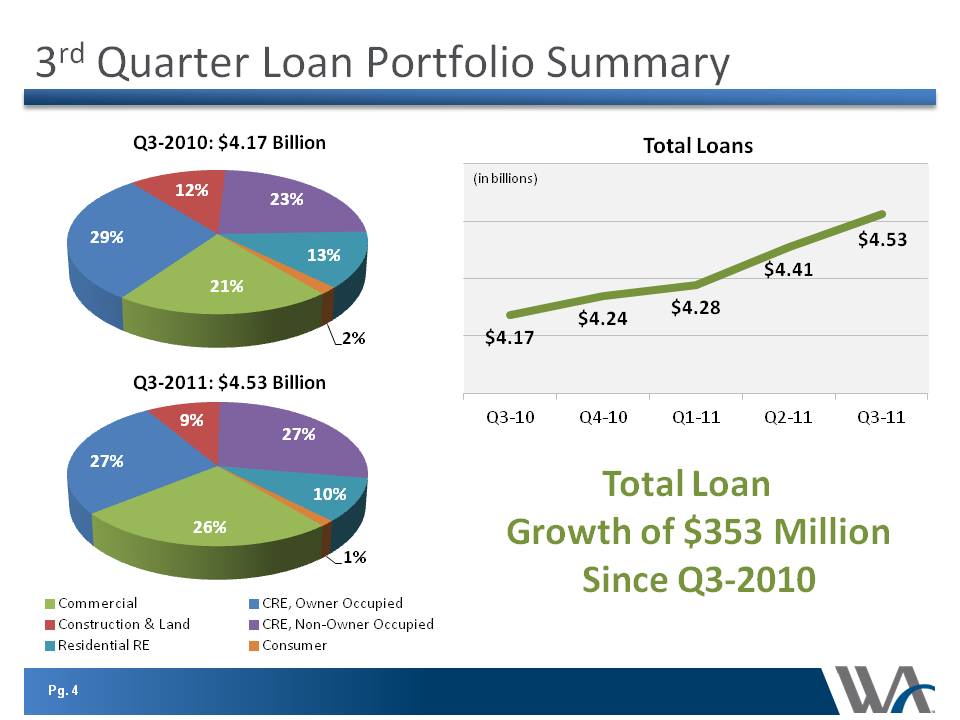
3rd Quarter Loan Portfolio Summary $4.17 $4.24 $4.28 $4.41 $4.53 Q3-10 Q4-10 Q1-11 Q2-11 Q3-11 Total Loans (in billions) Total Loan Growth of $353 Million Since Q3-2010 21% 29% 12% 23% 13% 2% Q3-2010: $4.17 Billion Commercial CRE, Owner Occupied Construction & Land CRE, Non-Owner Occupied Residential RE Consumer 26% 27% 9% 27% 10% 1% Q3-2011: $4.53 Billion Pg. 4 27% 8% 38% 27% Q3-11: $5.63 Billion
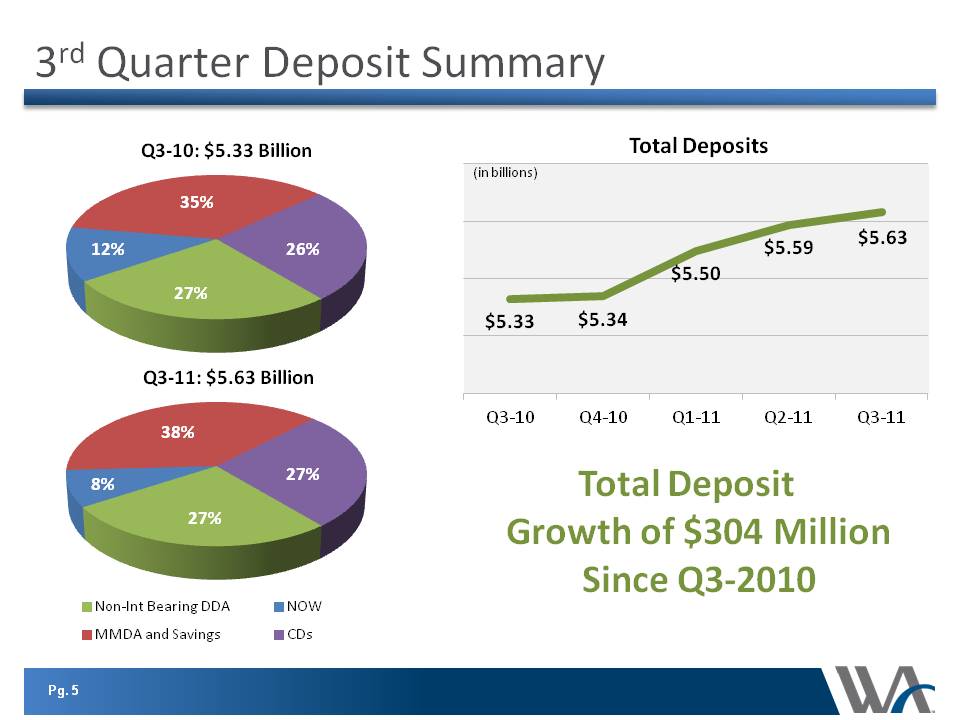
3rd Quarter Deposit Summary $5.33 $5.34 $5.50 $5.59 $5.63 Q3-10 Q4-10 Q1-11 Q2-11 Q3-11 Total Deposits (in billions) Total Deposit Growth of $304 Million Since Q3-2010 27% 12% 35% 26% Q3-10: $5.33 Billion Non-Int Bearing DDA NOW MMDA and Savings CDs Pg. 5 Q3-11: $5.63 Billion
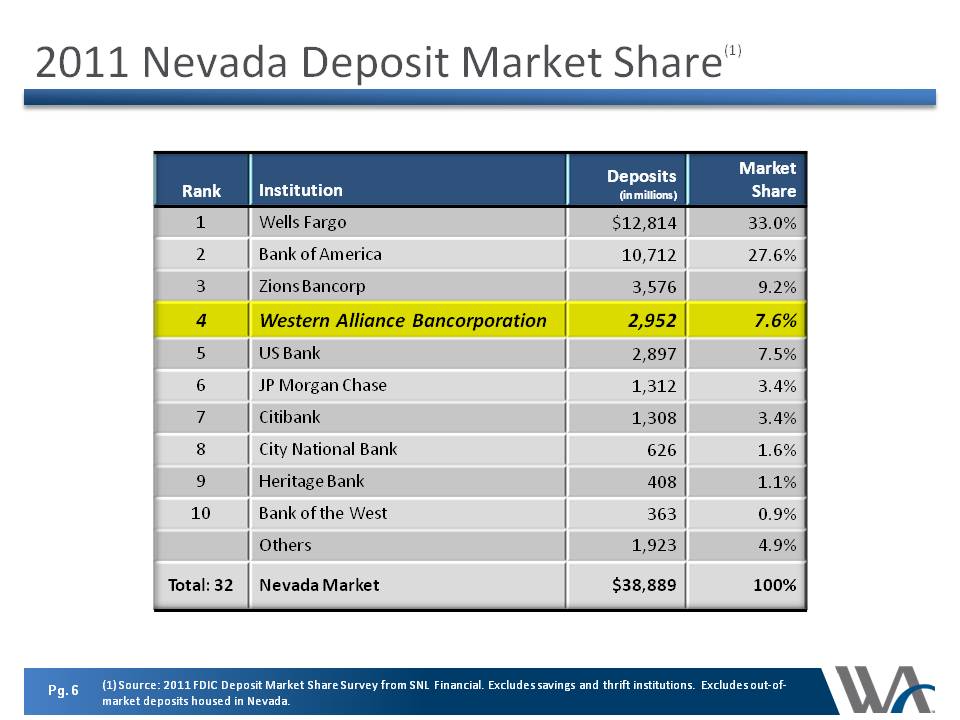
2011 Nevada Deposit Market Share(1) Rank Institution Deposits (in millions) Market Share 1 Wells Fargo $12,814 33.0% 2 Bank of America 10,712 27.6% 3 Zions Bancorp 3,576 9.2% 4 Western Alliance Bancorporation 2,952 7.6% 5 US Bank 2,897 7.5% 6 7 8 9 10 Others JP Morgan Chase Citibank City National Bank Heritage Bank Bank of the West 1,312 1,308 626 408 363 1,923 3.4% 1.6% 1.1% 0.9% 100% $38,889 4.9% Total: 32 Nevada Market (1) Source: 2011 FDIC Deposit Market Share Survey from SNL Financial. Excludes savings and thrift institutions. Excludes out-of-market deposits housed in Nevada.
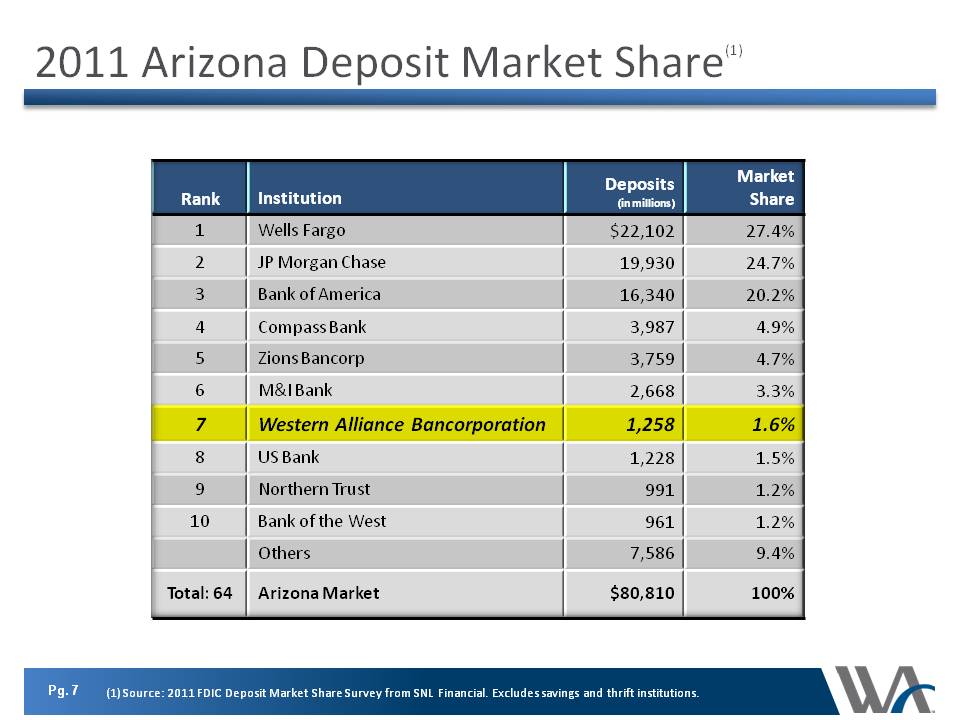
2011 Arizona Deposit Market Share (1) Rank Institution Deposits (in millions) Market Share 1 2 3 4 5 9 7 8 9 10 Others Total: 64 Wells Fargo JP Morgan Chase Bank of America Compass Bank Zions Bancorp M&I Bank Western Alliance Bancorporation US Bank Northern Trust Bank of the West $22,102 19,930 16,340 3,987 3,756 2,668 1,258 991 961 $80,810 27.4% 24.7% 20.2% 4.9% 4.7% 3.3% 1.6% 1.5% 105% 100% 9.4% Arizona Market (1) Source: 2011 FDIC Deposit Market Share Survey from SNL Financial. Excludes savings and thrift institutions. Pg. 7
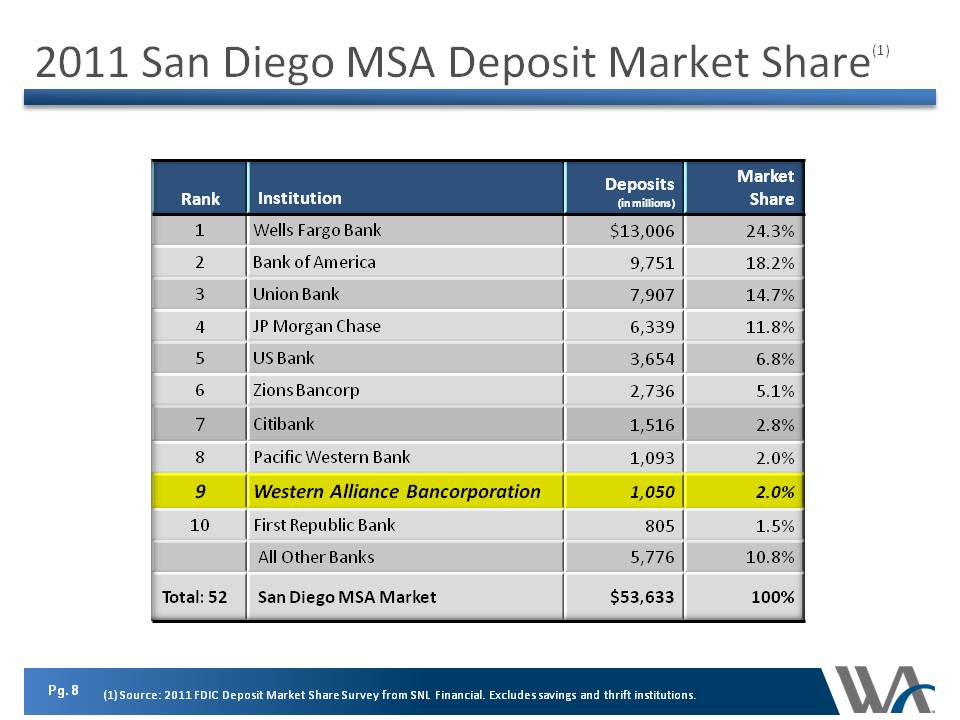
Pg. 8 2011 San Diego MSA Deposit Market Share (1) Rank Institution Deposits (in millions) Market Share 1 2 3 4 5 6 7 8 9 10 All Other Banks Total: 52 San Diego MSA Market Wells Fargo Bank Bank of America Union Bank JP Morgan Chase US Bank Zions Bancorp Citibank Pacific Western Bank Western Alliance Bancorporation First Republic Bank $13,006 9,751 7,907 6,339 3,654 2,736 1,516 1,093 1,050 805 $53,633 24.3% 18.2% 14.7% 11.8% 6.8% 5.1% 2.8% 2.0% 1.5% 100% 10.8% (1) Source: 2011 FDIC Deposit Market Share Survey from SNL Financial. Excludes savings and thrift institutions.
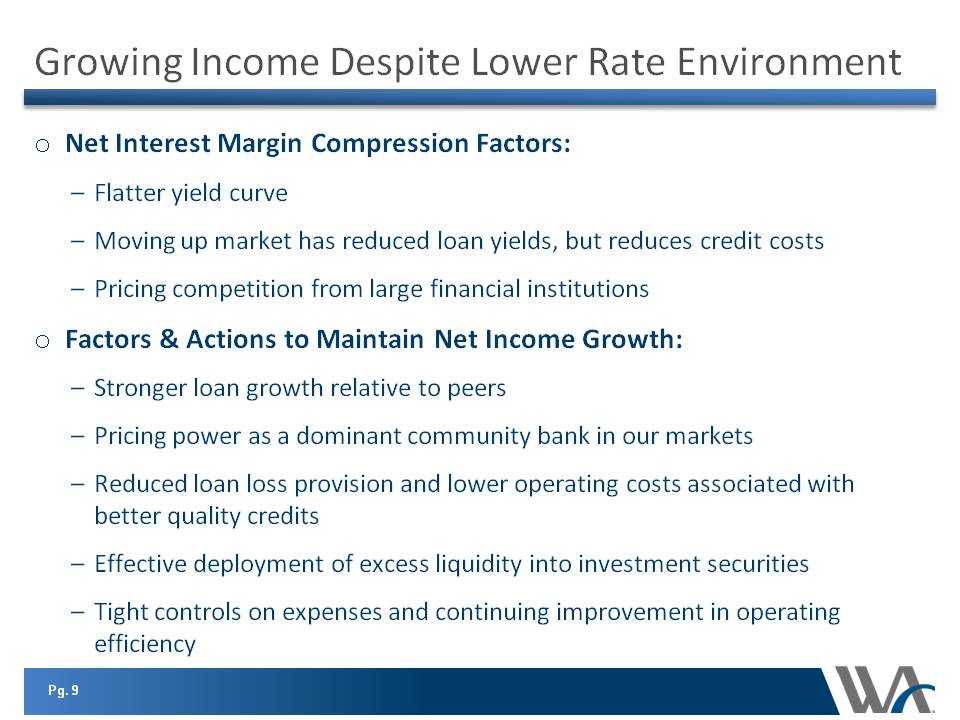
Pg. 9 Growing Income Despite Lower Rate Environment oNet Interest Margin Compression Factors: –Flatter yield curve –Moving up market has reduced loan yields, but reduces credit costs –Pricing competition from large financial institutions oFactors & Actions to Maintain Net Income Growth: –Stronger loan growth relative to peers –Pricing power as a dominant community bank in our markets –Reduced loan loss provision and lower operating costs associated with better quality credits –Effective deployment of excess liquidity into investment securities –Tight controls on expenses and continuing improvement in operating efficiency
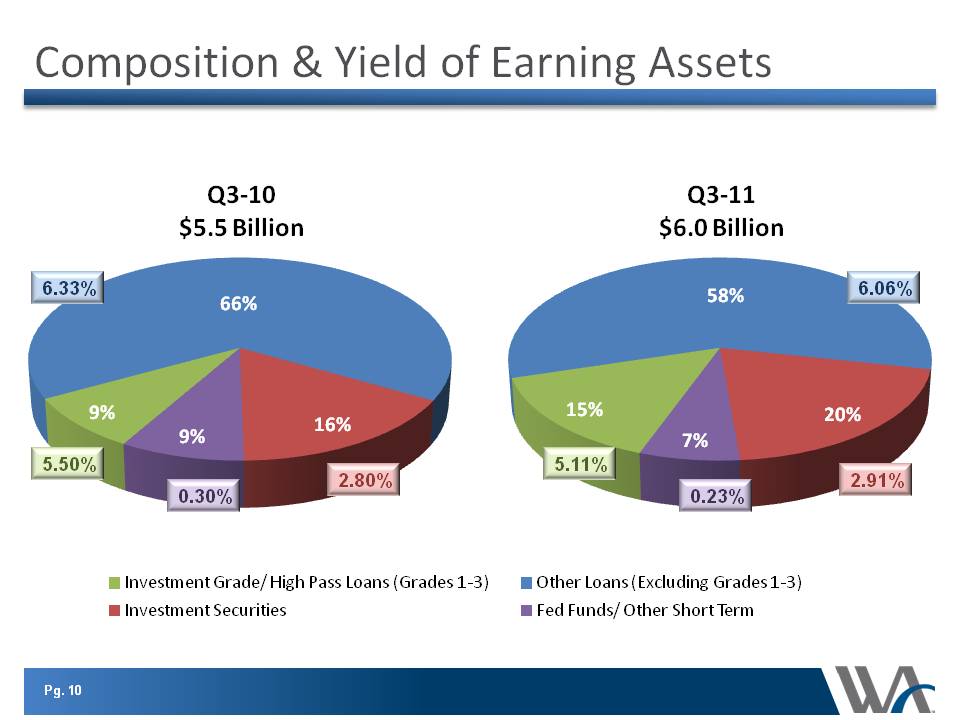
Pg. 10 Composition & Yield of Earning Assets 9% 66% 16% 9% Q3-10 $5.5 Billion Investment Grade/ High Pass Loans (Grades 1-3) Other Loans (Excluding Grades 1-3) Investment Securities Fed Funds/ Other Short Term 0.30% 5.50% 6.33% 15% 58% 20% 7% Q3-11 $6.0 Billion 2.80% 0.23% 5.11% 6.06% 2.91%
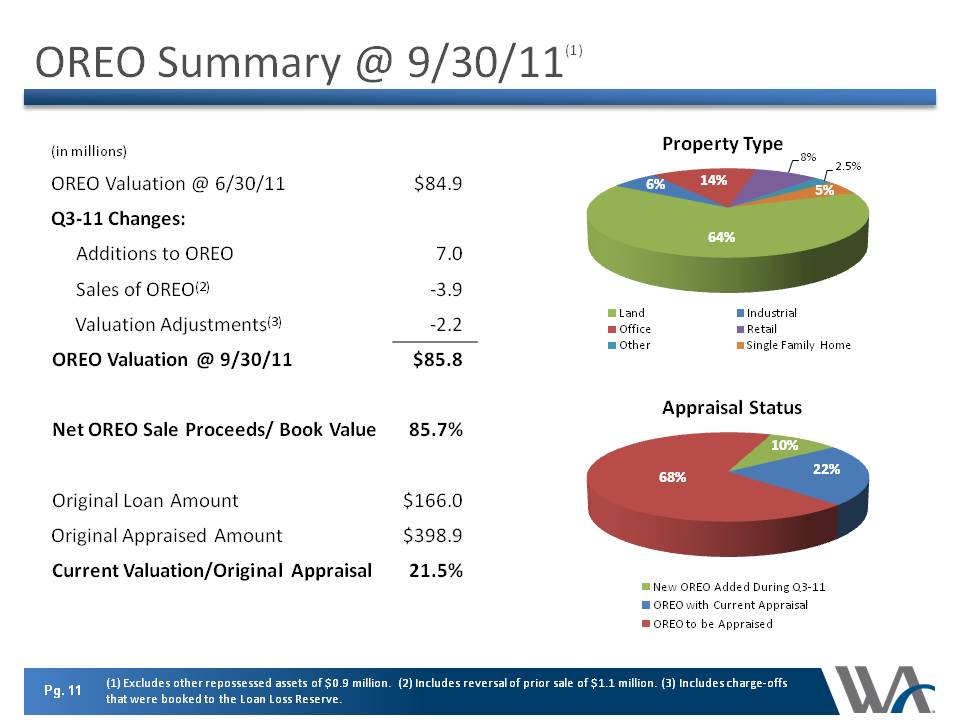
Pg. 11 OREO Summary @ 9/30/11(1) (in millions) OREO Valuation @ 6/30/11 $84.9 Q3-11 Changes: Additions to OREO 7.0 Sales of OREO(2) -3.9 Valuation Adjustments(3) -2.2 OREO Valuation @ 9/30/11 $85.8 Net OREO Sale Proceeds/ Book Value 85.7% Original Loan Amount $166.0 Original Appraised Amount $398.9 Current Valuation/Original Appraisal 21.5% (1) Excludes other repossessed assets of $0.9 million. (2) Includes reversal of prior sale of $1.1 million. (3) Includes charge-offs that were booked to the Loan Loss Reserve. Property Type Land Office Other Industrial Retail Single Family Home 6% 14% 64% 8% 2.5% 5% Appraisal Status New OREO Added During Q3-11 OREO with Current Appraisal OREO to be Appraised 68% 10% 22%
Pg. 12 3rd Quarter 2011 Status Updates oReceived $141 million in funding under the U.S. Department of the Treasury’s Small Business Lending Fund –WAL was the largest of the 332 institutions to receive funds and received the largest amount of any recipient oRepaid $140 million in preferred stock issued under the Troubled Asset Relief Program –Resulted in a one-time charge to income available to common shareholders of $6.9 million oMOUs at Western Alliance Bank and Torrey Pines Bank have been removed
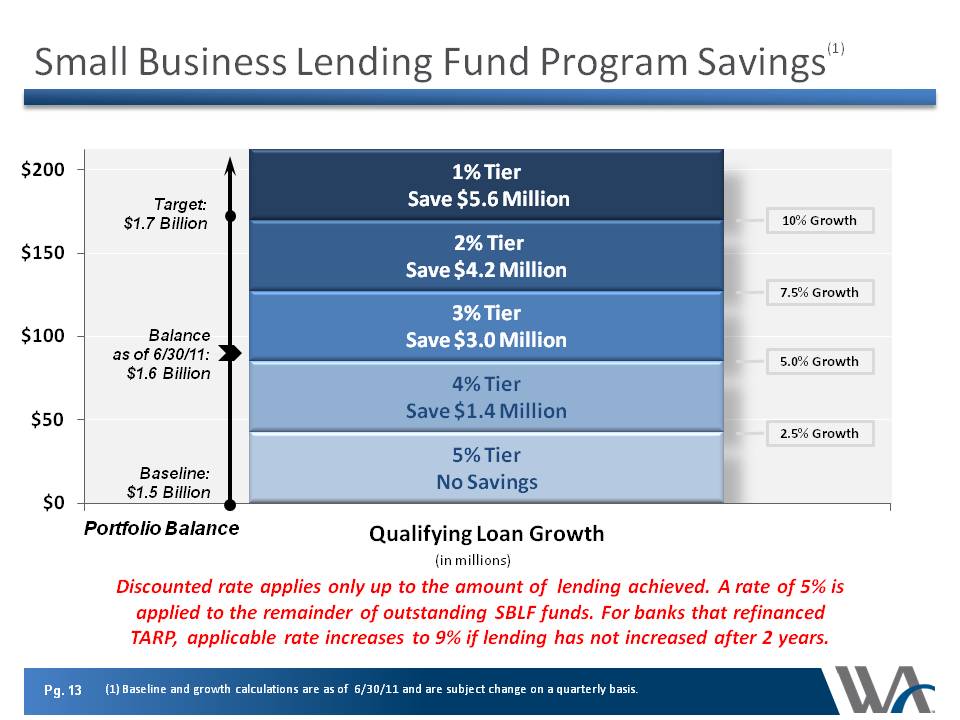
Pg. 13 Small Business Lending Fund Program Savings(1) 5% Tier No Savings 4% Tier Save $1.4 Million 3% Tier Save $3.0 Million 2% Tier Save $4.2 Million 1% Tier Save $5.6 Million $0 $50 $100 $150 $200 Qualifying Loan Growth 10% Growth 7.5% Growth 5.0% Growth 2.5% Growth Baseline: $1.5 Billion Balance as of 6/30/11: $1.6 Billion Target: $1.7 Billion Portfolio Balance (in millions) Discounted rate applies only up to the amount of lending achieved. A rate of 5% is applied to the remainder of outstanding SBLF funds. For banks that refinanced TARP, applicable rate increases to 9% if lending has not increased after 2 years. (1) Baseline and growth calculations are as of 6/30/11 and are subject change on a quarterly basis.
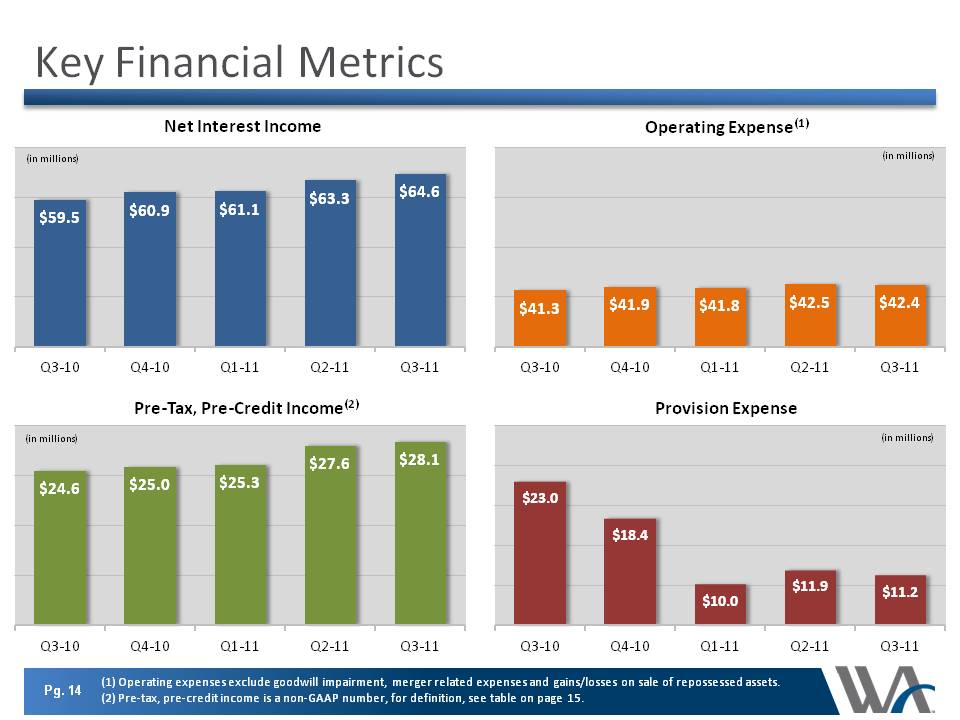
Pg. 14 Key Financial Metrics $59.5 $60.9 $61.1 $63.3 $64.6 Q3-10 Q4-10 Q1-11 Q2-11 Q3-11 Net Interest Income (in millions) $41.3 $41.9 $41.8 $42.5 $42.4 Q3-10 Q4-10 Q1-11 Q2-11 Q3-11 Operating Expense(1) $24.6 $25.0 $25.3 $27.6 $28.1 Q3-10 Q4-10 Q1-11 Q2-11 Q3-11 Pre-Tax, Pre-Credit Income(2) $23.0 $18.4 $10.0 $11.9 $11.2 Q3-10 Q4-10 Q1-11 Q2-11 Q3-11 Provision Expense (1) Operating expenses exclude goodwill impairment, merger related expenses and gains/losses on sale of repossessed assets. (2) Pre-tax, pre-credit income is a non-GAAP number, for definition, see table on page 15.
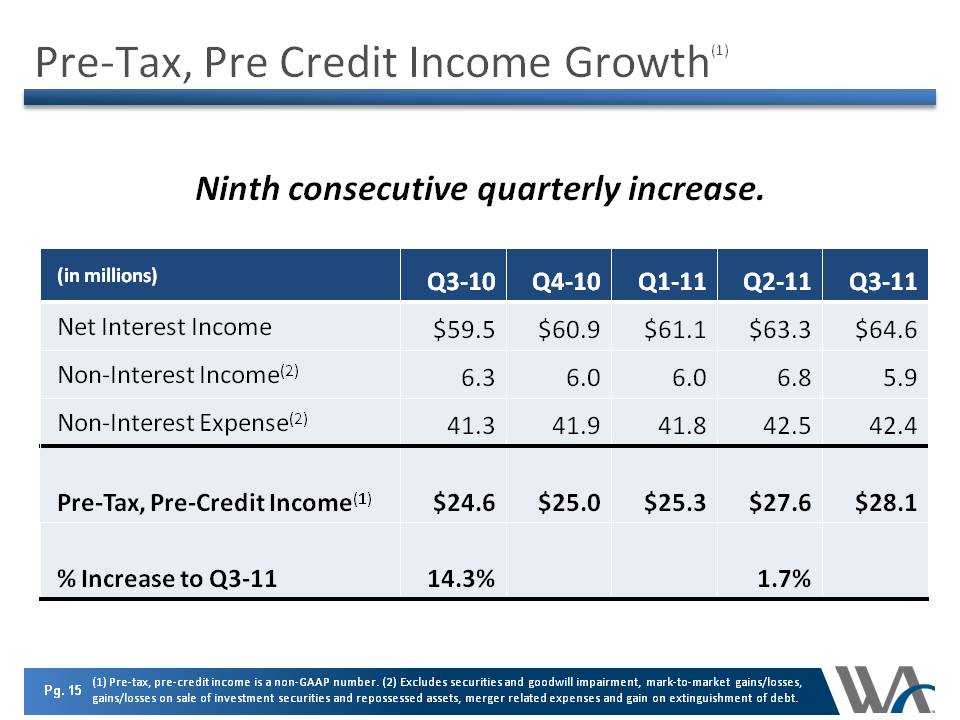
Pre-Tax, Pre Credit Income Growth(1) (in millions) Q3-10 Q4-10 Q1-11 Q2-11 Q3-11 Net Interest Income $59.5 $60.9 $61.1 $63.3 $64.6 Non-Interest Income(2) 6.3 6.0 6.0 6.8 5.9 Non-Interest Expense(2) 41.3 41.9 41.8 42.5 42.4 Pre-Tax, Pre-Credit Income(1) $24.6 $25.0 $25.3 $27.6 $28.1 % Increase to Q3-11 14.3% 1.7% (1) Pre-tax, pre-credit income is a non-GAAP number. (2) Excludes securities and goodwill impairment, mark-to-market gains/losses, gains/losses on sale of investment securities and repossessed assets, merger related expenses and gain on extinguishment of debt. Pg. 15
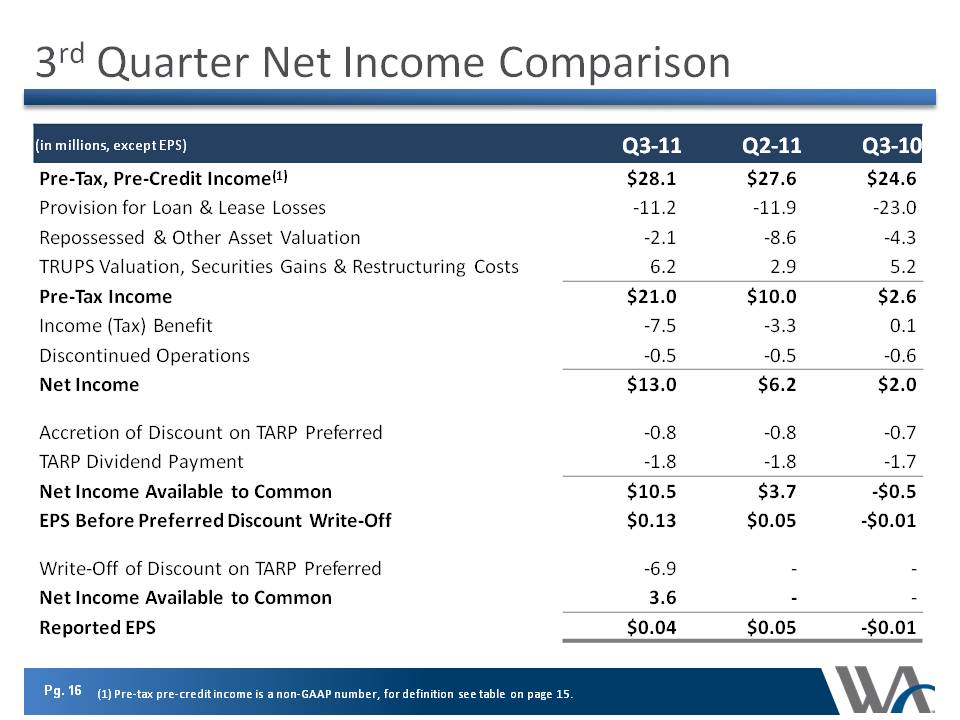
Pg. 16 3rd Quarter Net Income Comparison (in millions, except EPS) Q3-11 Q2-11 Q3-10 Pre-Tax, Pre-Credit Income(1) $28.1 $27.6 $24.6 Provision for Loan & Lease Losses -11.2 -11.9 -23.0 Repossessed & Other Asset Valuation -2.1 -8.6 -4.3 TRUPS Valuation, Securities Gains & Restructuring Costs 6.2 2.9 5.2 Pre-Tax Income $21.0 $10.0 $2.6 Income (Tax) Benefit -7.5 -3.3 0.1 Discontinued Operations -0.5 -0.5 -0.6 Net Income $13.0 $6.2 $2.0 Accretion of Discount on TARP Preferred -0.8 -0.8 -0.7 TARP Dividend Payment -1.8 -1.8 -1.7 Net Income Available to Common $10.5 $3.7 -$0.5 EPS Before Preferred Discount Write-Off $0.13 $0.05 -$0.01 Write-Off of Discount on TARP Preferred -6.9 - - Net Income Available to Common 3.6 - - Reported EPS $0.04 $0.05 -$0.01 (1) Pre-tax pre-credit income is a non-GAAP number, for definition see table on page 15.
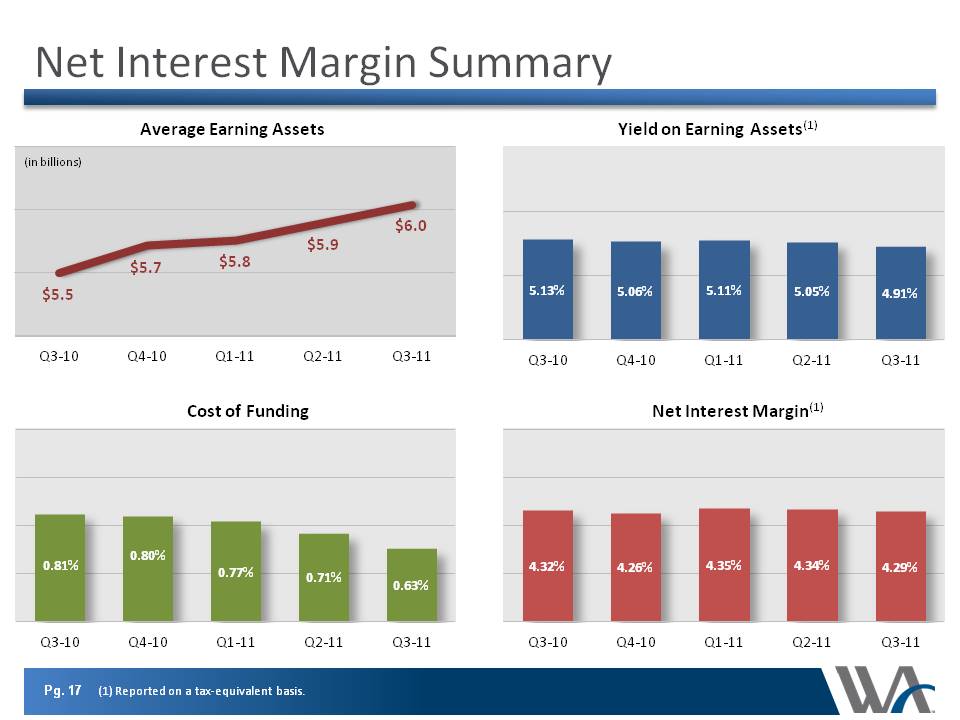
Pg. 17 Net Interest Margin Summary (1) Reported on a tax-equivalent basis. 4.32% 4.26% 4.35% 4.34% 4.29% Q3-10 Q4-10 Q1-11 Q2-11 Q3-11 Net Interest Margin(1) 0.81% 0.80% 0.77% 0.71% 0.63% Q3-10 Q4-10 Q1-11 Q2-11 Q3-11 Cost of Funding 5.13% 5.06% 5.11% 5.05% 4.91% Q3-10 Q4-10 Q1-11 Q2-11 Q3-11 Yield on Earning Assets(1) $5.5 $5.7 $5.8 $5.9 $6.0 Q3-10 Q4-10 Q1-11 Q2-11 Q3-11 Average Earning Assets (in billions) Pg. 18
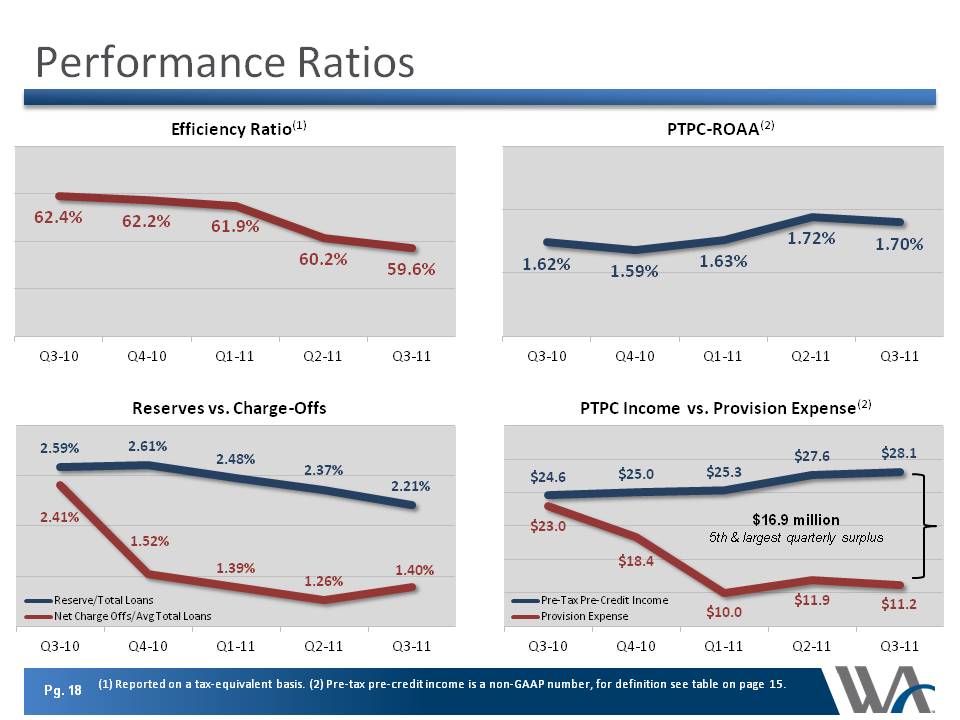
Pg. 18 Performance Ratios (1) Reported on a tax-equivalent basis. (2) Pre-tax pre-credit income is a non-GAAP number, for definition see table on page 15. 62.4% 62.2% 61.9% 60.2% 59.6% Q3-10 Q4-10 Q1-11 Q2-11 Q3-11 Efficiency Ratio(1) 1.62% 1.59% 1.63% 1.72% 1.70% Q3-10 Q4-10 Q1-11 Q2-11 Q3-11 PTPC-ROAA(2) 2.59% 2.61% 2.48% 2.37% 2.21% 2.41% 1.52% 1.39% 1.26% 1.40% Q3-10 Q4-10 Q1-11 Q2-11 Q3-11 Reserves vs. Charge-Offs Reserve/Total Loans Net Charge Offs/Avg Total Loans $24.6 $25.0 $25.3 $27.6 $28.1 $23.0 $18.4 $10.0 $11.9 $11.2 Q3-10 Q4-10 Q1-11 Q2-11 Q3-11 PTPC Income vs. Provision Expense(2) Pre-Tax Pre-Credit Income Provision Expense $16.9 million 5th & largest quarterly
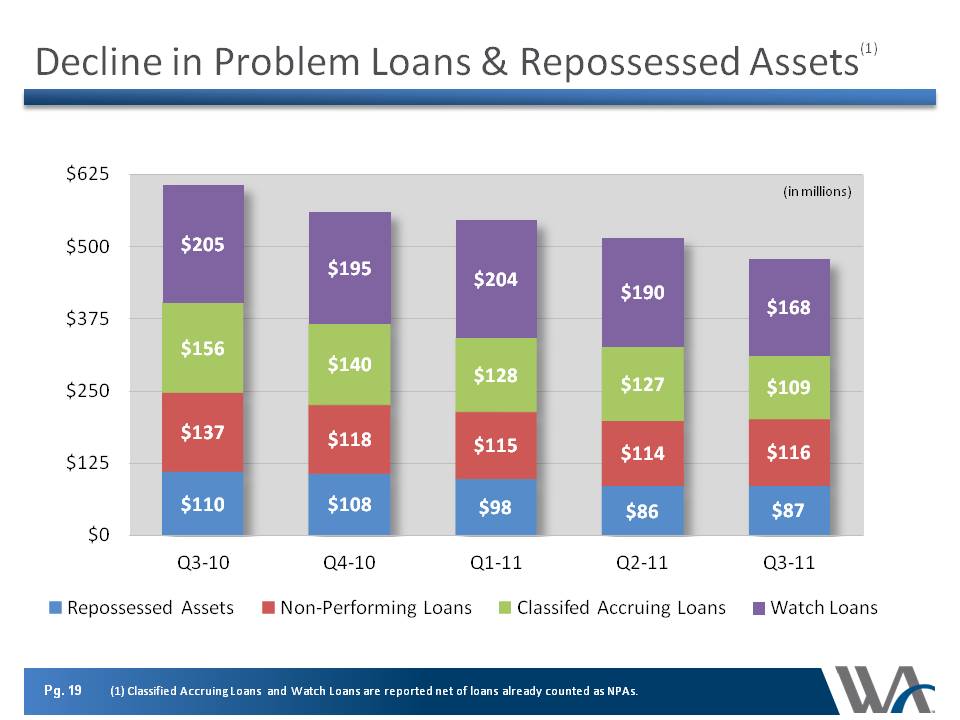
Pg. 19 Decline in Problem Loans & Repossessed Assets(1) $110 $108 $98 $86 $87 $137 $118 $115 $114 $116 $156 $140 $128 $127 $109 $205 $195 $204 $190 $168 $0 $125 $250 $375 $500 $625 Q3-10 Q4-10 Q1-11 Q2-11 Q3-11 Repossessed Assets Non-Performing Loans Classifed Accruing Loans Watch Loans (in millions) (1) Classified Accruing Loans and Watch Loans are reported net of loans already counted as NPAs.
Recent Asset Quality Trends oNPAs remained at 3.1% of total assets compared last quarter, but declined from 3.9% a year ago oClassified loans were 4.9% of total loans, down from 5.4% last quarter and 6.9% a year ago oWatch loans were 3.7% of total loans, down from 4.3% last quarter and 4.9% a year ago oRepossessed assets were $86.7 million, up from $85.7 million last quarter oAccruing TDR loans declined to $79.8 million from $86.8 million last quarter Pg. 20
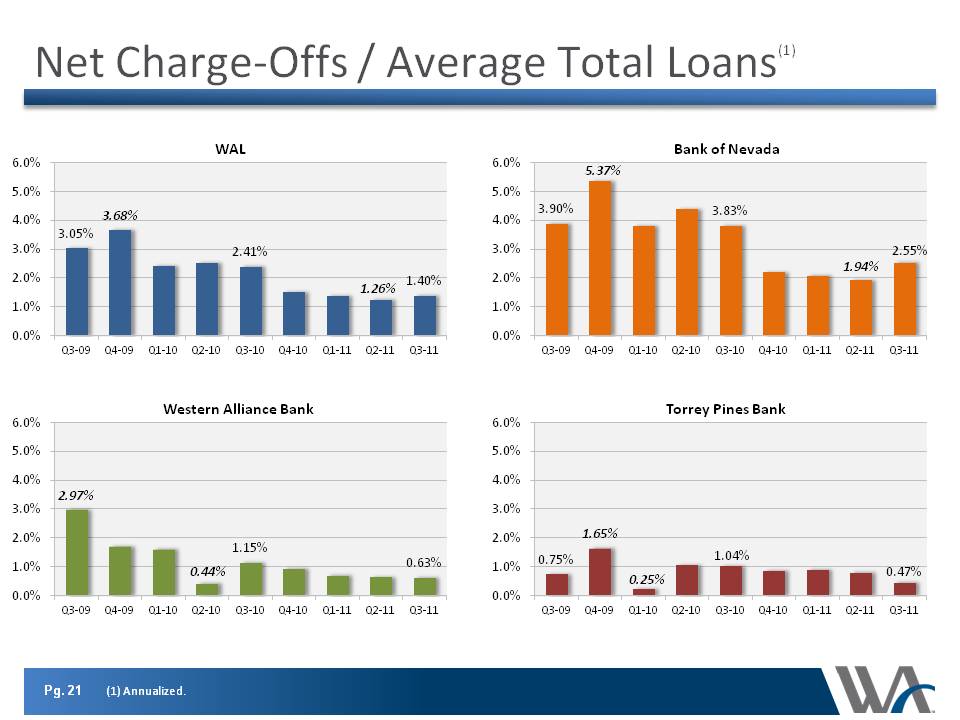
Pg. 21 Net Charge-Offs / Average Total Loans(1) (1) Annualized. 3.05% 3.68% 2.41% 1.26% 1.40% 0.0% 1.0% 2.0% 3.0% 4.0% 5.0% 6.0% Q3-09 Q4-09 Q1-10 Q2-10 Q3-10 Q4-10 Q1-11 Q2-11 Q3-11 WAL 3.90% 5.37% 3.83% 1.94% 2.55% 0.0% 1.0% 2.0% 3.0% 4.0% 5.0% 6.0% Q3-09 Q4-09 Q1-10 Q2-10 Q3-10 Q4-10 Q1-11 Q2-11 Q3-11 Bank of Nevada 2.97% 0.44% 1.15% 0.63% 0.0% 1.0% 2.0% 3.0% 4.0% 5.0% 6.0% Q3-09 Q4-09 Q1-10 Q2-10 Q3-10 Q4-10 Q1-11 Q2-11 Q3-11 Western Alliance Bank 0.75% 1.65% 0.25% 1.04% 0.47% 0.0% 1.0% 2.0% 3.0% 4.0% 5.0% 6.0% Q3-09 Q4-09 Q1-10 Q2-10 Q3-10 Q4-10 Q1-11 Q2-11 Q3-11 Torrey Pines Bank
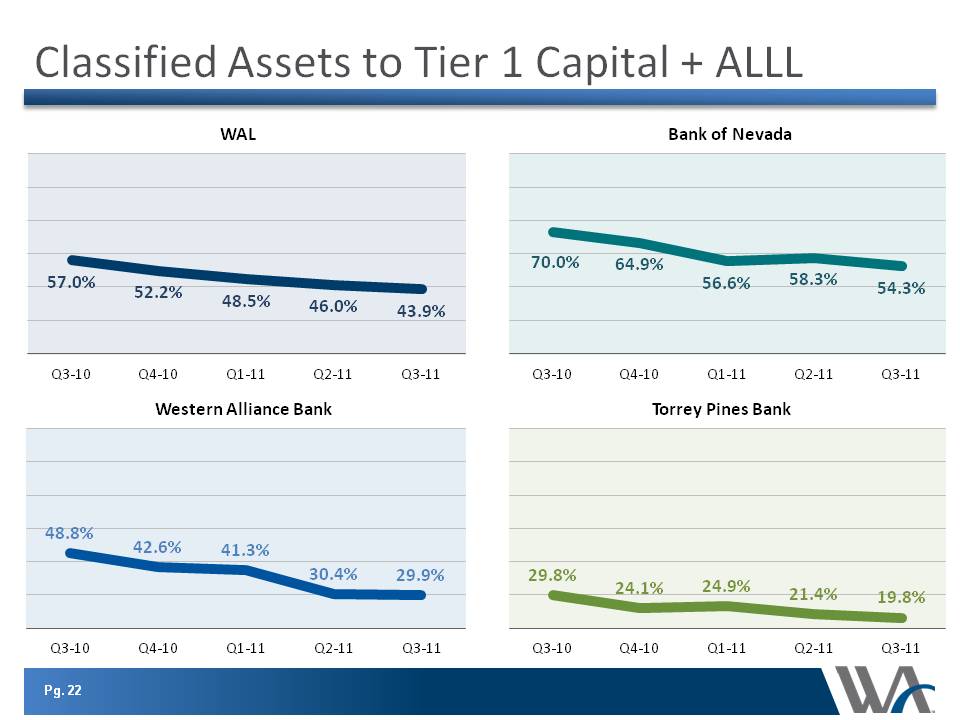
Pg. 22 Classified Assets to Tier 1 Capital + ALLL 57.0% 52.2% 48.5% 46.0% 43.9% Q3-10 Q4-10 Q1-11 Q2-11 Q3-11 WAL 70.0% 64.9% 56.6% 58.3% 54.3% Q3-10 Q4-10 Q1-11 Q2-11 Q3-11 Bank of Nevada 48.8% 42.6% 41.3% 30.4% 29.9% Q3-10 Q4-10 Q1-11 Q2-11 Q3-11 Western Alliance Bank 29.8% 24.1% 24.9% 21.4% 19.8% Q3-10 Q4-10 Q1-11 Q2-11 Q3-11 Torrey Pines Bank
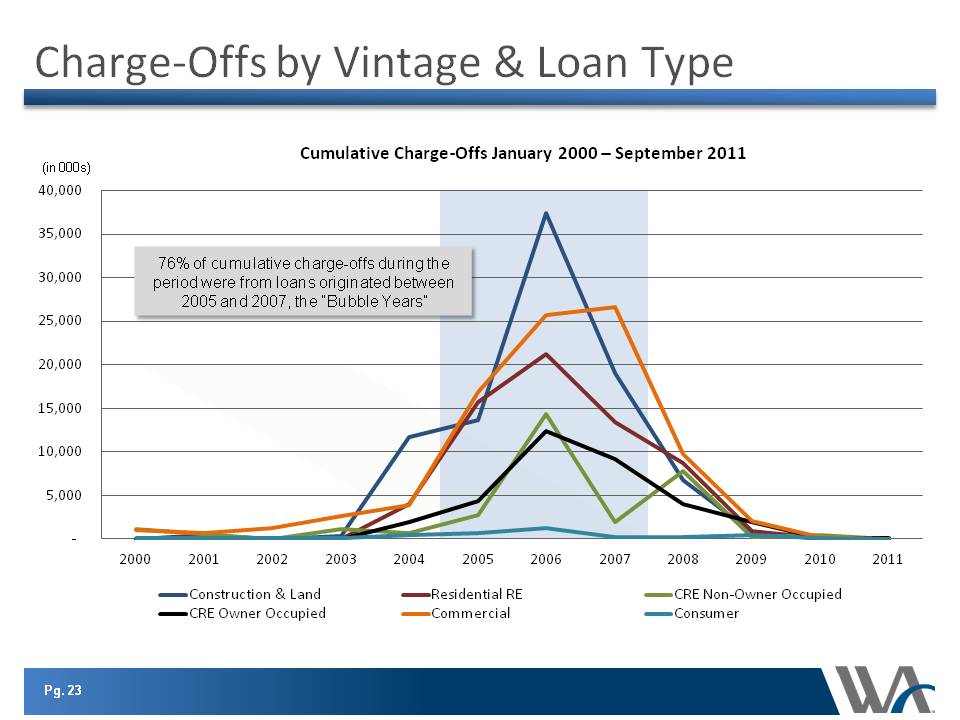
Pg. 23 Pg. 23 - 5,000 10,000 15,000 20,000 25,000 30,000 35,000 40,000 2000 2001 2002 2003 2004 2005 2006 2007 2008 2009 2010 2011 Cumulative Charge-Offs January 2000 – September 2011 Construction & Land Residential RE CRE Non-Owner Occupied CRE Owner Occupied Commercial Consumer (in 000s) 76% of cumulative charge-offs during the period were from loans originated between 2005 and 2007, the “Bubble Years”
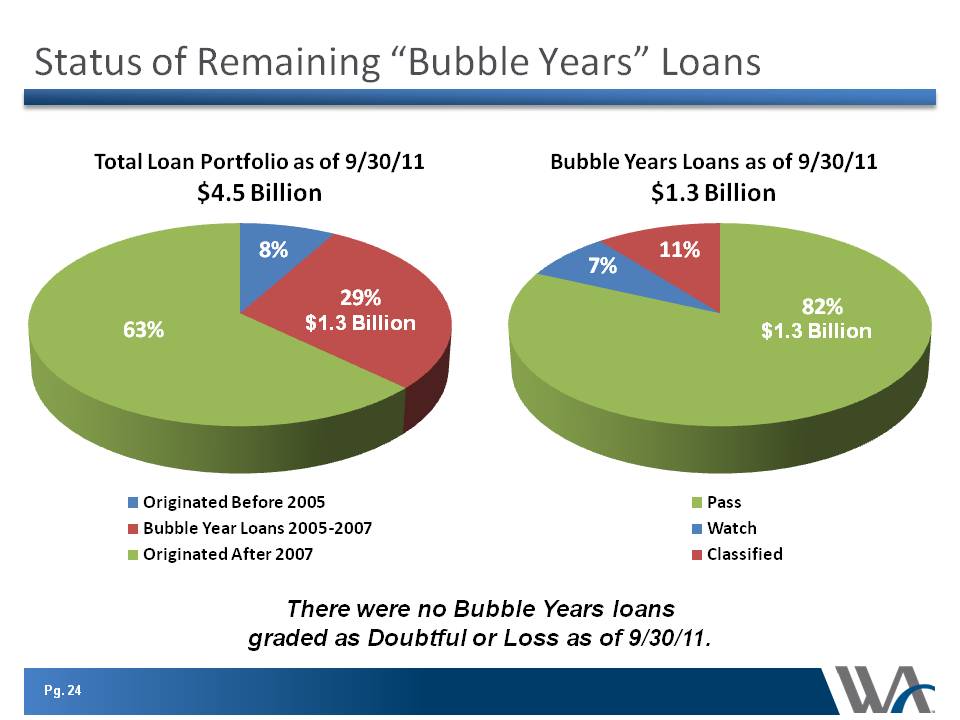
Pg. 24 Status of Remaining “Bubble Years” Loans $1.3 Billion 8% 29% 63% Total Loan Portfolio as of 9/30/11 $4.5 Billion Originated Before 2005 Bubble Year Loans 2005-2007 Originated After 2007 82% 7% 11% Bubble Years Loans as of 9/30/11 $1.3 Billion Pass Watch Classified There were no Bubble Years loans graded as Doubtful or Loss as of 9/30/11. $1.3 Billion $1.3 Billion
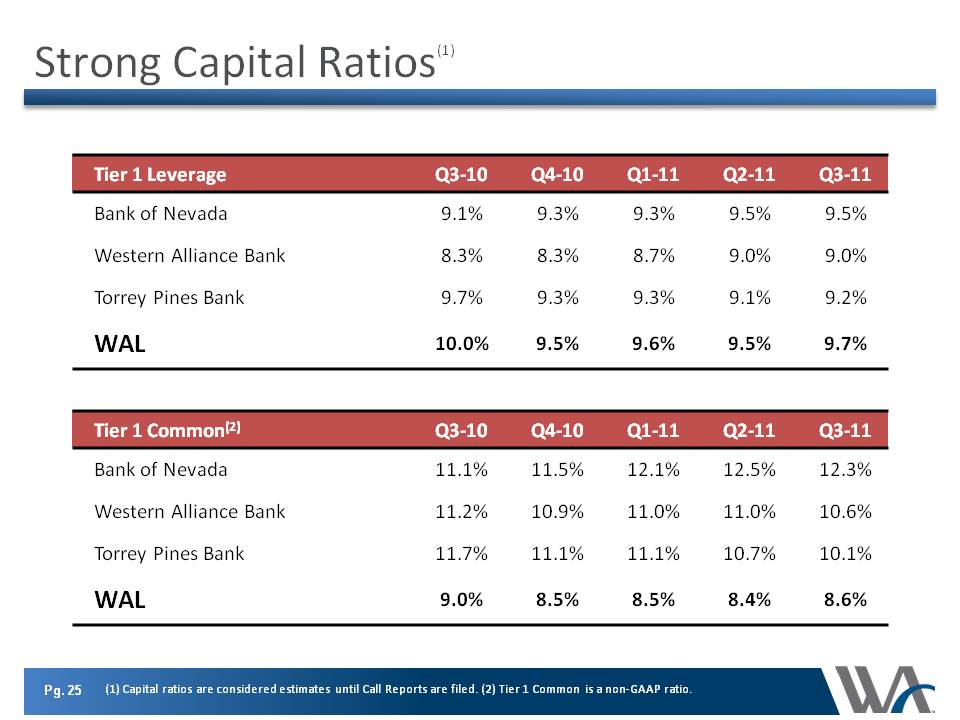
Pg. 25 Strong Capital Ratios(1) Tier 1 Leverage Q3-10 Q4-10 Q1-11 Q2-11 Q3-11 Bank of Nevada 9.1% 9.3% 9.3% 9.5% 9.5% Western Alliance Bank 8.3% 8.3% 8.7% 9.0% 9.0% Torrey Pines Bank 9.7% 9.3% 9.3% 9.1% 9.2% WAL 10.0% 9.5% 9.6% 9.5% 9.7% (1) Capital ratios are considered estimates until Call Reports are filed. (2) Tier 1 Common is a non-GAAP ratio. Tier 1 Common(2) Q3-10 Q4-10 Q1-11 Q2-11 Q3-11 Bank of Nevada 11.1% 11.5% 12.1% 12.5% 12.3% Western Alliance Bank 11.2% 10.9% 11.0% 11.0% 10.6% Torrey Pines Bank 11.7% 11.1% 11.1% 10.7% 10.1% WAL 9.0% 8.5% 8.5% 8.4% 8.6%
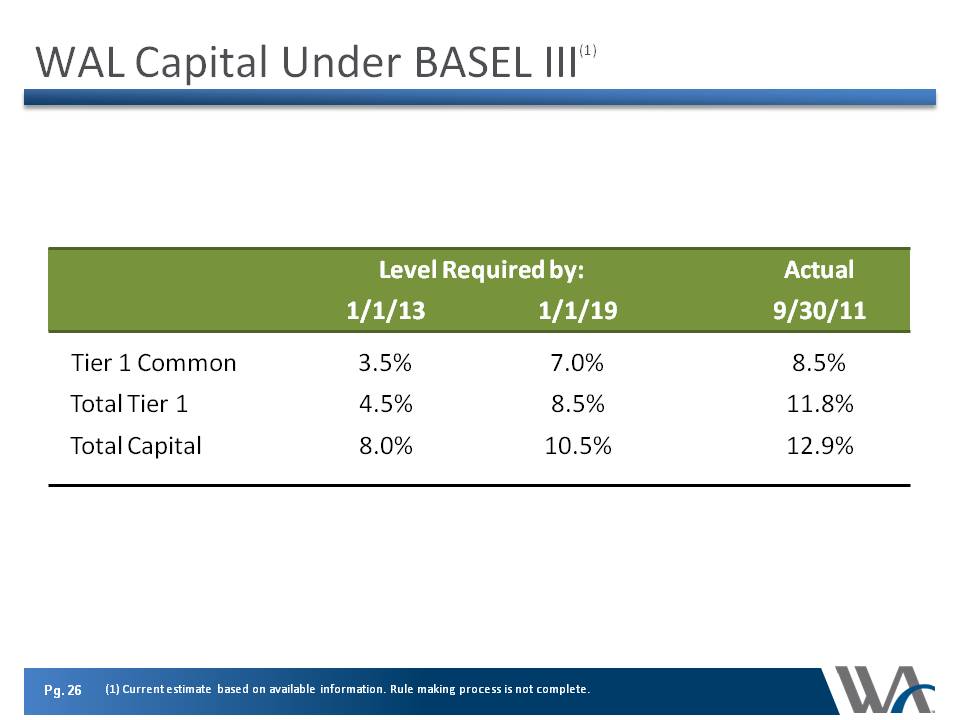
Pg. 26 WAL WAL Capital Under BASEL III(1) Level Required by: Actual 1/1/13 1/1/19 9/30/11 Tier 1 Common 3.5% 7.0% 8.5% Total Tier 1 4.5% 8.5% 11.8% Total Capital 8.0% 10.5% 12.9% (1) Current estimate based on available information. Rule making process is not complete.

Question & Answer