UNITED STATES
SECURITIES AND EXCHANGE COMMISSION
WASHINGTON, D.C. 20549
FORM 8-K
CURRENT REPORT PURSUANT TO SECTION 13 OR 15 (d)
OF THE SECURITIES EXCHANGE ACT OF 1934
Date of Report: October 17, 2011
(Date of earliest event reported)
INTERNATIONAL BUSINESS MACHINES
CORPORATION
(Exact name of registrant as specified in its charter)
|
New York |
|
1-2360 |
|
13-0871985 |
|
(State of Incorporation) |
|
(Commission File Number) |
|
(IRS employer Identification No.) |
|
ARMONK, NEW YORK |
|
10504 |
|
(Address of principal executive offices) |
|
(Zip Code) |
914-499-1900
(Registrant’s telephone number)
Check the appropriate box below if the Form 8-K filing is intended to simultaneously satisfy the filing obligation of the registrant under any of the following provisions:
o Written communications pursuant to Rule 425 under the Securities Act (17 CFR 230.425)
o Soliciting material pursuant to Rule 14a-12 under the Exchange Act (17 CFR 240.14a-12)
o Pre-commencement communications pursuant to Rule 14d-2(b) under the Exchange Act (17 CFR 240.14d-2(b))
o Pre-commencement communications pursuant to Rule 13e-4(c) under the Exchange Act (17 CFR 240.13e-4(c))
Item 2.02. Results of Operations and Financial Condition.
The registrant’s press release dated October 17, 2011, regarding its financial results for the periods ended September 30, 2011, including consolidated financial statements for the periods ended September 30, 2011, is Attachment I of this Form 8-K. Attachment II are the slides for IBM’s Chief Financial Officer Mark Loughridge’s third quarter earnings presentation on October 17, 2011, as well as certain reconciliation and other information (“Non-GAAP Supplementary Materials”) for information in Attachment I (press release), Attachment II (slides) and in Mr. Loughridge’s presentation. All of the information in Attachment I and II is hereby filed.
IBM’s web site (www.ibm.com) contains a significant amount of information about IBM, including financial and other information for investors (www.ibm.com/investor/). IBM encourages investors to visit its various web sites from time to time, as information is updated and new information is posted.
SIGNATURE
Pursuant to the requirements of the Securities Exchange Act of 1934, the registrant has duly caused this report to be signed on its behalf by the undersigned, hereunto duly authorized.
|
Date: October 17, 2011 |
| |
|
|
| |
|
|
By: |
/s/ James J. Kavanaugh |
|
|
|
|
|
|
|
James J. Kavanaugh |
|
|
|
Vice President and Controller |
ATTACHMENT I
IBM REPORTS 2011 THIRD-QUARTER RESULTS
· Diluted EPS:
· GAAP: $3.19, up 13 percent;
· Operating (non-GAAP): $3.28, up 15 percent;
· Revenue: $26.2 billion, up 8 percent, up 3 percent adjusting for currency;
· Net income:
· GAAP: $3.8 billion, up 7 percent;
· Operating (non-GAAP): $4.0 billion, up 9 percent;
· Pre-tax income:
· GAAP: $5.0 billion, up 7 percent;
· Operating (non-GAAP): $5.2 billion, up 10 percent;
· Gross profit margin:
· GAAP: 46.5 percent, up 1.2 points;
· Operating (non-GAAP): 46.8 percent, up 1.5 points;
· Software revenue up 13 percent, 8 percent adjusting for currency;
· Services revenue up 8 percent, 2 percent adjusting for currency;
· Services backlog of $137 billion, up $2.4 billion;
· Systems and Technology revenue up 4 percent, 1 percent adjusting for currency:
· Power Systems up 15 percent;
· Growth markets revenue up 19 percent, 13 percent adjusting for currency;
· Business analytics revenue up 19 percent year to date;
· Smarter Planet revenue up 50 percent year to date;
· Cloud revenue year to date has doubled full-year 2010 revenue;
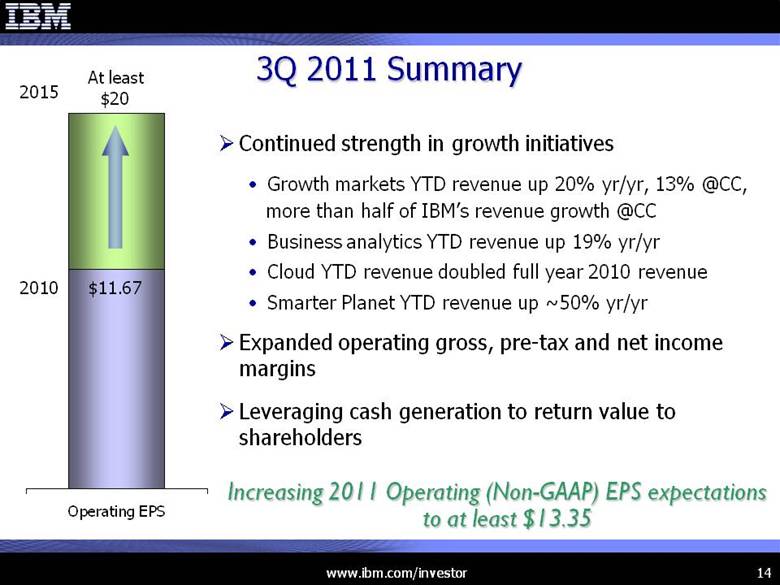
· Full-year 2011 Operating (non-GAAP) EPS expectations raised to at least $13.35 from at least $13.25.
ARMONK, N.Y., October 17, 2011 . . . IBM (NYSE: IBM) today announced third-quarter 2011 diluted earnings of $3.19 per share, compared with diluted earnings of $2.82 per share in the third quarter of 2010, an increase of 13 percent. Operating (non-GAAP) diluted earnings were $3.28 per share, compared with operating diluted earnings of $2.85 per share in the third quarter of 2010, an increase of 15 percent.
Third-quarter net income was $3.8 billion compared with $3.6 billion in the third quarter of 2010, an increase of 7 percent. Operating (non-GAAP) net income was $4.0 billion compared with $3.6 billion in the third quarter of 2010, an increase of 9 percent.
Total revenues for the third quarter of 2011 of $26.2 billion increased 8 percent (3 percent, adjusting for currency) from the third quarter of 2010.
“In the third quarter, we drove revenue growth, margin expansion and increased earnings as a result of our innovation-based strategy and continued investment in growth initiatives,” said Samuel J. Palmisano, IBM chairman, president and chief executive officer. “Growth markets delivered outstanding revenue performance across software, hardware, and services and contributed to the company’s expanded margins. We also achieved strong results in Smarter Planet, business analytics and cloud.
“Based on this performance, we are raising our 2011 full-year operating earnings per share expectations to at least $13.35.”
Third-Quarter GAAP - Operating (non-GAAP) Reconciliation
Third-quarter operating (non-GAAP) diluted earnings exclude $0.09 per share of net charges: $0.11 per share for the amortization of purchased intangible assets and other acquisition-related charges, offset by ($0.01) per share for retirement-related items driven by changes to plan assets and liabilities primarily related to market performance.
Full-Year 2011 Expectations
IBM raised its expectations for full-year 2011 GAAP diluted earnings per share to at least $12.95 from at least $12.87; and operating (non-GAAP) diluted earnings per share to at least $13.35 from at least $13.25. The 2011 operating (non-GAAP) earnings exclude $0.40 per share of charges for amortization of purchased intangible assets, other acquisition-related charges, and retirement-related items driven by changes to plan assets and liabilities primarily related to market performance.
Geographic Regions
The Americas’ third-quarter revenues were $10.9 billion, an increase of 7 percent (6 percent, adjusting for currency) from the 2010 period. Revenues from Europe/Middle East/Africa were $8.0 billion, up 9 percent (flat, adjusting for currency). Asia-Pacific revenues increased 10 percent (1 percent, adjusting for currency) to $6.5 billion. OEM revenues were $743 million, down 8 percent (8 percent, adjusting for currency) compared with the 2010 third quarter.
Growth Markets
Revenues from the company’s growth markets increased 19 percent (13 percent, adjusting for currency). Revenues in the BRIC countries — Brazil, Russia, India and China — increased 17 percent (13 percent, adjusting for currency). Growth markets revenue represents 23 percent of IBM’s total geographic revenue for the third quarter.
Services
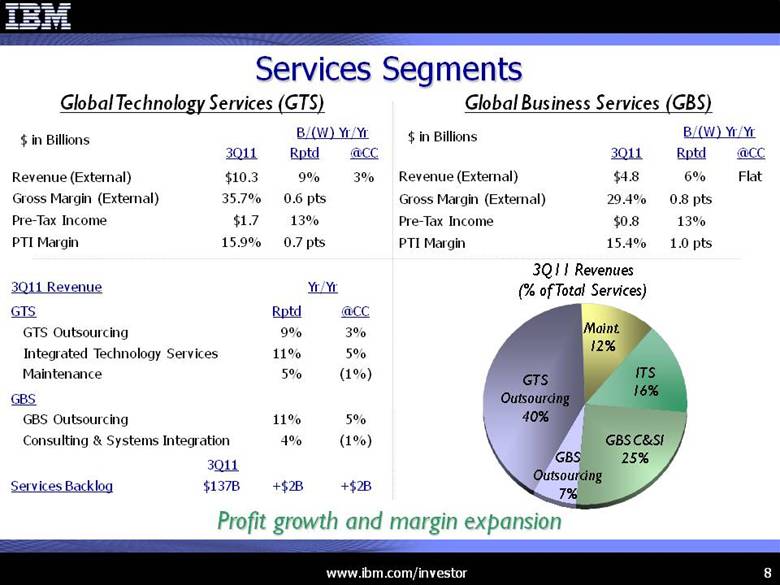
Total Global Services revenues increased 8 percent (2 percent, adjusting for currency). Global Technology Services segment revenues increased 9 percent (3 percent, adjusting for currency) to $10.3 billion. Global Business Services segment revenues were up 6 percent (flat, adjusting for currency) at $4.8 billion.
Total Global Services pre-tax income increased to $2.5 billion, up 13 percent year over year. Pre-tax income from both Global Technology Services and Global Business Services also increased 13 percent.
The estimated services backlog at September 30 was $137 billion, up $2.4 billion year over year at actual rates ($2.3 billion, adjusting for currency). Services backlog at the end of a quarter measures the current value of work under contract expected to be recognized as revenue in future quarters.
Software
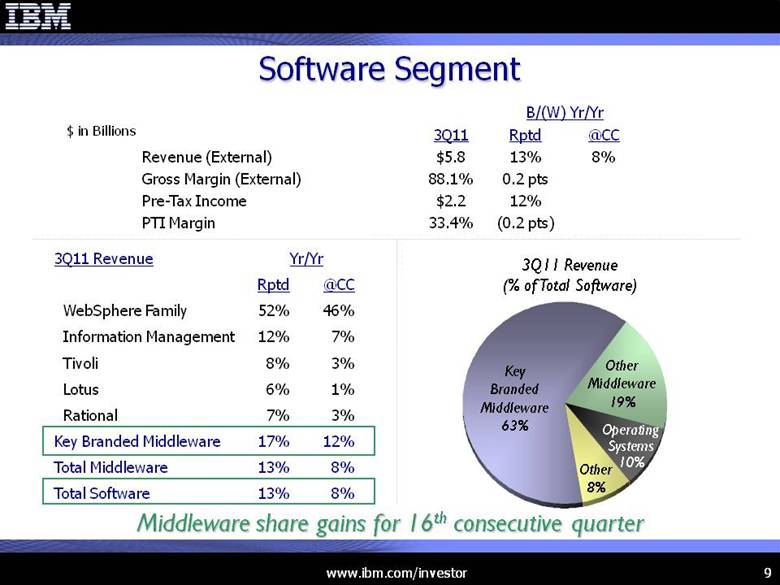
Revenues from the Software segment were $5.8 billion, an increase of 13 percent (8 percent, adjusting for currency). Software pre-tax income of $2.2 billion was up 12 percent year over year.
Revenues from IBM’s key middleware products, which include WebSphere, Information Management, Tivoli, Lotus and Rational products, were $3.6 billion, an increase of 17 percent (12 percent, adjusting for currency) versus the third quarter of 2010. Operating systems revenues of $598 million increased 9 percent (4 percent, adjusting for currency) compared with the prior-year quarter.
Revenues from the WebSphere family of software products increased 52 percent year over year. Information Management software revenues increased 12 percent. Revenues from Tivoli software increased 8 percent. Revenues from Lotus software increased 6 percent, and Rational software increased 7 percent.
Hardware
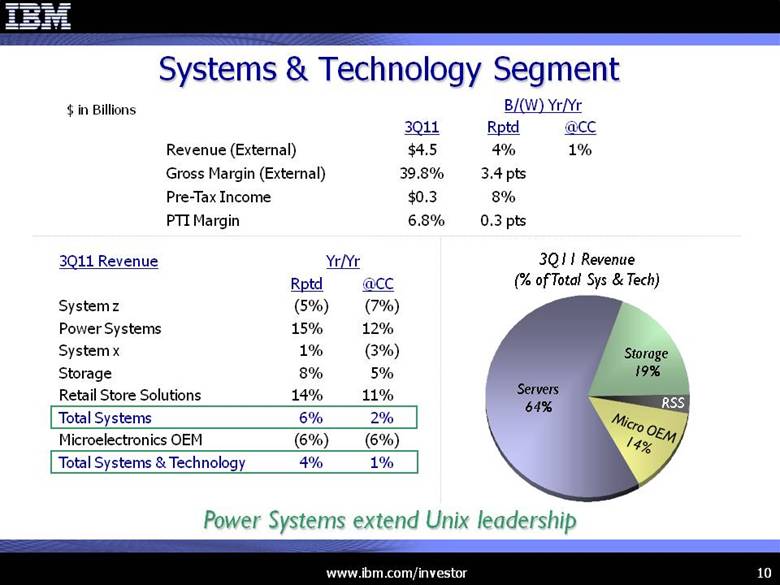
Revenues from the Systems and Technology segment totaled $4.5 billion for the quarter, up 4 percent (1 percent, adjusting for currency) from the third quarter of 2010. Systems and Technology pre-tax income was $318 million, an increase of 8 percent year over year.
Systems revenues increased 6 percent (2 percent, adjusting for currency). Revenues from Power Systems increased 15 percent compared with the 2010 period. Revenues from System x increased 1 percent. Revenues from System z mainframe server products decreased 5 percent compared with the year-ago period. Total delivery of System z computing power, as measured in MIPS (millions of instructions per second), decreased 11 percent. Revenues from System Storage increased 8 percent, and revenues
from Retail Store Solutions increased 14 percent year over year. Revenues from Microelectronics OEM decreased 6 percent.
Financing
Global Financing segment revenues decreased 2 percent (6 percent, adjusting for currency) in the third quarter to $520 million. Pre-tax income for the segment decreased 4 percent to $481 million.
***
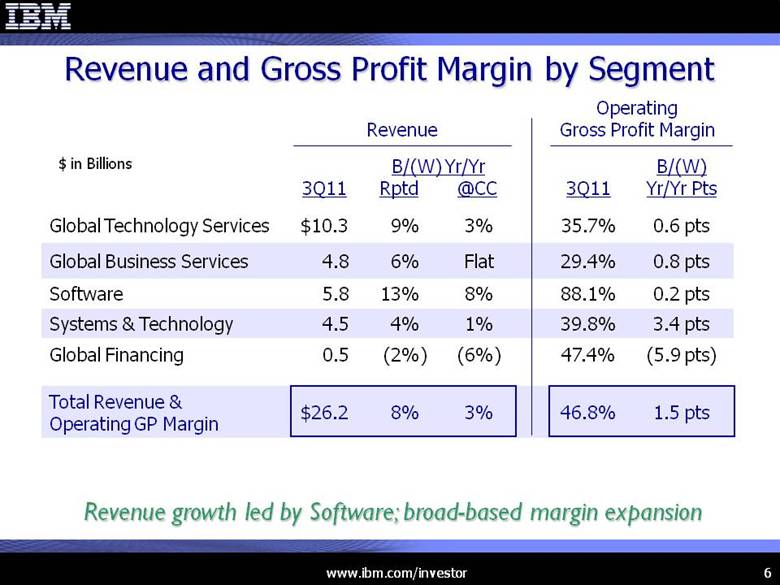
The company’s total gross profit margin was 46.5 percent in the 2011 third quarter compared with 45.3 percent in the 2010 third-quarter period. Total operating (non-GAAP) gross profit margin was 46.8 percent in the 2011 third quarter compared with 45.4 percent in the 2010 third-quarter period, with increases in Software, Services and Systems and Technology.
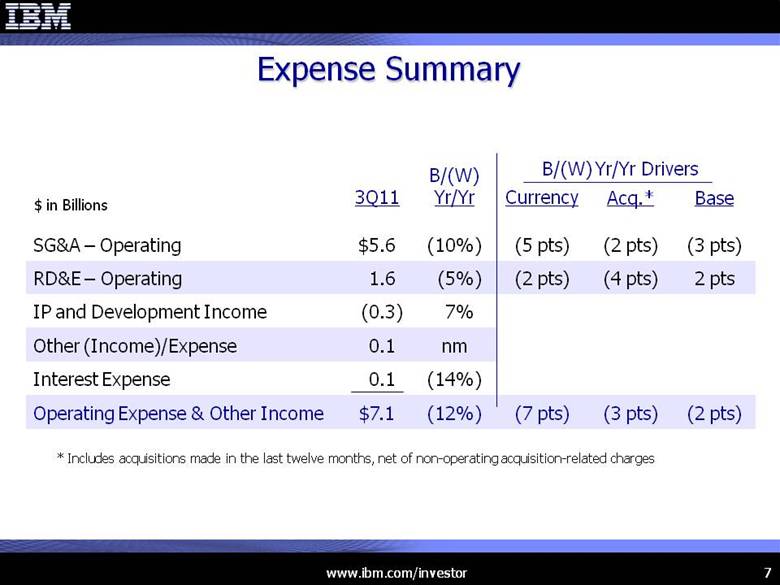
Total expense and other income increased 13 percent to $7.1 billion compared with the prior-year period. S,G&A expense of $5.7 billion increased 10 percent compared with prior-year expense. R,D&E expense of $1.5 billion increased 6 percent compared with the year-ago period. Intellectual property and custom development income increased to $298 million compared with $278 million a year ago. Other (income) and expense was expense of $128 million compared with prior-year income of $106 million. Interest expense increased to $107 million compared with $95 million in the prior year.
Total operating (non-GAAP) expense and other income increased 12 percent to $7.1 billion compared with the prior-year period. Operating (non-GAAP) S,G&A expense of $5.6 billion increased 10 percent year over year compared with prior-year expense. Operating (non-GAAP) R,D&E expense of $1.6 billion increased 5 percent compared with the year-ago period.
Pre-tax income increased 7 percent to $5.0 billion, and pre-tax margin was 19.2 percent, down 0.1 points. Operating (non-GAAP) pre-tax income increased 10 percent to $5.2 billion and pre-tax margin was 19.8 percent, up 0.4 points.
IBM’s tax rate was 23.6 percent, up 0.4 points year over year; operating (non-GAAP) tax rate was also 23.6 percent, up 0.6 points.
Net income margin decreased 0.1 points to 14.7 percent. Operating (non-GAAP) net income margin increased 0.2 points to 15.1 percent.
The weighted-average number of diluted common shares outstanding in the third-quarter 2011 was 1.20 billion compared with 1.27 billion shares in the same period of 2010. As of September 30, 2011, there were 1.18 billion basic common shares outstanding.
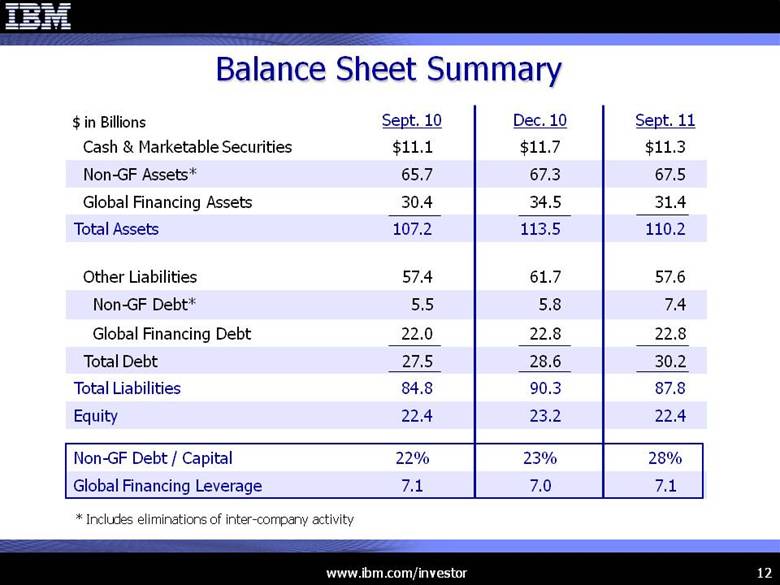
Debt, including Global Financing, totaled $30.2 billion, compared with $28.6 billion at year-end 2010. From a management segment view, Global Financing debt totaled $22.8 billion versus $22.8 billion at year-end 2010, resulting in a debt-to-equity ratio of 7.1 to 1. Non-global financing debt totaled $7.4 billion, an increase of $1.6 billion since year-end 2010, resulting in a debt-to-capitalization ratio of 27.8 percent from 22.6 percent.
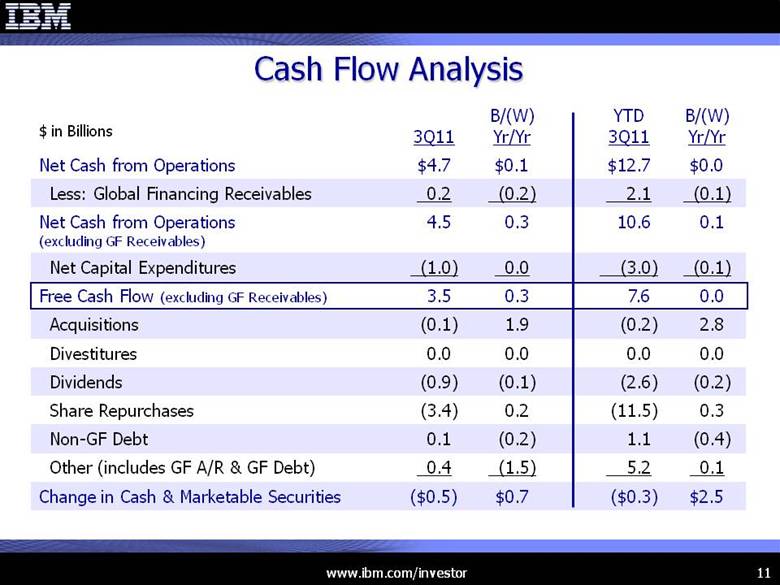
IBM ended the third-quarter 2011 with $11.3 billion of cash on hand and generated free cash flow of $3.5 billion, up approximately $300 million year over year. The company returned $4.3 billion to shareholders through $0.9 billion in dividends and $3.4 billion of share repurchases. The balance sheet remains strong, and the company is well positioned to support the business over the long term.
Year-To-Date 2011 Results
Net income for the nine months ended September 30, 2011 was $10.4 billion compared with $9.6 billion in the year-ago period, an increase of 8 percent. Diluted earnings per share were $8.48 compared with $7.38 per diluted share for the 2010 period, an increase of 15 percent. Revenues for the nine-month period totaled $77.4 billion, an increase of 9 percent (4 percent, adjusting for currency) compared with $70.9 billion for the nine months of 2010.
Operating (non-GAAP) net income for the nine months ended September 30, 2011 was $10.7 billion compared with $9.7 billion in the year-ago period, an increase of 11
percent. Operating (non-GAAP) diluted earnings per share were $8.77 compared with $7.45 per diluted share for the 2010 period, an increase of 18 percent.
Forward-Looking and Cautionary Statements
Except for the historical information and discussions contained herein, statements contained in this release may constitute forward-looking statements within the meaning of the Private Securities Litigation Reform Act of 1995. Forward-looking statements are based on the company’s current assumptions regarding future business and financial performance. These statements involve a number of risks, uncertainties and other factors that could cause actual results to differ materially, including the following: a downturn in economic environment and corporate IT spending budgets; the company’s failure to meet growth and productivity objectives, a failure of the company’s innovation initiatives; risks from investing in growth opportunities; failure of the company’s intellectual property portfolio to prevent competitive offerings and the failure of the company to obtain necessary licenses; breaches of data security; fluctuations in financial results and purchases, impact of local legal, economic, political and health conditions; adverse effects from environmental matters, tax matters and the company’s pension plans; ineffective internal controls; the company’s use of accounting estimates; the company’s ability to attract and retain key personnel and its reliance on critical skills; impacts of relationships with critical suppliers and business with government clients; currency fluctuations and customer financing risks; impact of changes in market liquidity conditions and customer credit risk on receivables; reliance on third party distribution channels; the company’s ability to successfully manage acquisitions and alliances; risk factors related to IBM securities; and other risks, uncertainties and factors discussed in the company’s Form 10-Q, Form 10-K and in the company’s other filings with the U.S. Securities and Exchange Commission (SEC) or in materials incorporated therein by reference. Any forward-looking statement in this release speaks only as of the date on which it is made. The company assumes no obligation to update or revise any forward-looking statements.
Presentation of Information in this Press Release
In an effort to provide investors with additional information regarding the company’s results as determined by generally accepted accounting principles (GAAP), the company has also disclosed in this press release the following non-GAAP information which management believes provides useful information to investors:
IBM results and expectations –
· presenting operating (non-GAAP) earnings per share amounts and related income statement items;
· presenting non-global financing debt-to-capitalization ratio;
· adjusting for free cash flow;
· adjusting for currency (i.e., at constant currency).
The rationale for management’s use of non-GAAP measures is included as part of the supplementary materials presented within the third-quarter earnings materials. These materials are available on the IBM investor relations Web site at www.ibm.com/investor and are being included in Attachment II (“Non-GAAP Supplementary Materials”) to the Form 8-K that includes this press release and is being submitted today to the SEC.
Conference Call and Webcast
IBM’s regular quarterly earnings conference call is scheduled to begin at 4:30 p.m. EDT, today. Investors may participate by viewing the Webcast at www.ibm.com/investor/3q11. Presentation charts will be available on the Web site shortly before the Webcast.
Financial Results Below (certain amounts may not add due to use of rounded numbers; percentages presented are calculated from the underlying whole-dollar amounts).
INTERNATIONAL BUSINESS MACHINES CORPORATION
COMPARATIVE FINANCIAL RESULTS
(Unaudited; Dollars in millions except per share amounts)
|
|
|
Three Months Ended |
|
Nine Months Ended |
| ||||||||||||
|
|
|
2011 |
|
2010* |
|
Percent |
|
2011 |
|
2010* |
|
Percent |
| ||||
|
REVENUE |
|
|
|
|
|
|
|
|
|
|
|
|
| ||||
|
|
|
|
|
|
|
|
|
|
|
|
|
|
| ||||
|
Global Technology Services |
|
$ |
10,322 |
|
$ |
9,496 |
|
8.7 |
% |
$ |
30,427 |
|
$ |
28,036 |
|
8.5 |
% |
|
Gross margin |
|
35.7 |
% |
35.1 |
% |
|
|
34.5 |
% |
34.5 |
% |
|
| ||||
|
|
|
|
|
|
|
|
|
|
|
|
|
|
| ||||
|
Global Business Services |
|
4,832 |
|
4,572 |
|
5.7 |
% |
14,407 |
|
13,465 |
|
7.0 |
% | ||||
|
Gross margin |
|
29.4 |
% |
28.6 |
% |
|
|
28.6 |
% |
28.0 |
% |
|
| ||||
|
|
|
|
|
|
|
|
|
|
|
|
|
|
| ||||
|
Software |
|
5,817 |
|
5,151 |
|
12.9 |
% |
17,295 |
|
15,447 |
|
12.0 |
% | ||||
|
Gross margin |
|
88.1 |
% |
87.9 |
% |
|
|
87.9 |
% |
87.2 |
% |
|
| ||||
|
|
|
|
|
|
|
|
|
|
|
|
|
|
| ||||
|
Systems and Technology |
|
4,482 |
|
4,325 |
|
3.6 |
% |
13,182 |
|
11,696 |
|
12.7 |
% | ||||
|
Gross margin |
|
39.8 |
% |
36.4 |
% |
|
|
39.5 |
% |
35.2 |
% |
|
| ||||
|
|
|
|
|
|
|
|
|
|
|
|
|
|
| ||||
|
Global Financing |
|
520 |
|
529 |
|
-1.7 |
% |
1,555 |
|
1,610 |
|
-3.4 |
% | ||||
|
Gross margin |
|
47.4 |
% |
53.3 |
% |
|
|
49.9 |
% |
51.1 |
% |
|
| ||||
|
|
|
|
|
|
|
|
|
|
|
|
|
|
| ||||
|
Other |
|
182 |
|
199 |
|
-8.3 |
% |
563 |
|
599 |
|
-5.9 |
% | ||||
|
Gross margin |
|
-48.3 |
% |
-10.8 |
% |
|
|
-66.7 |
% |
-13.3 |
% |
|
| ||||
|
|
|
|
|
|
|
|
|
|
|
|
|
|
| ||||
|
TOTAL REVENUE |
|
26,157 |
|
24,271 |
|
7.8 |
% |
77,430 |
|
70,852 |
|
9.3 |
% | ||||
|
|
|
|
|
|
|
|
|
|
|
|
|
|
| ||||
|
GROSS PROFIT |
|
12,173 |
|
11,001 |
|
10.6 |
% |
35,416 |
|
31,787 |
|
11.4 |
% | ||||
|
Gross margin |
|
46.5 |
% |
45.3 |
% |
|
|
45.7 |
% |
44.9 |
% |
|
| ||||
|
|
|
|
|
|
|
|
|
|
|
|
|
|
| ||||
|
EXPENSE AND OTHER INCOME |
|
|
|
|
|
|
|
|
|
|
|
|
| ||||
|
|
|
|
|
|
|
|
|
|
|
|
|
|
| ||||
|
S,G&A |
|
5,662 |
|
5,149 |
|
10.0 |
% |
17,518 |
|
15,886 |
|
10.3 |
% | ||||
|
% of revenue |
|
21.6 |
% |
21.2 |
% |
|
|
22.6 |
% |
22.4 |
% |
|
| ||||
|
|
|
|
|
|
|
|
|
|
|
|
|
|
| ||||
|
R,D&E |
|
1,546 |
|
1,464 |
|
5.6 |
% |
4,703 |
|
4,448 |
|
5.7 |
% | ||||
|
% of revenue |
|
5.9 |
% |
6.0 |
% |
|
|
6.1 |
% |
6.3 |
% |
|
| ||||
|
|
|
|
|
|
|
|
|
|
|
|
|
|
| ||||
|
Intellectual property and custom development income |
|
(298 |
) |
(278 |
) |
7.2 |
% |
(855 |
) |
(836 |
) |
2.2 |
% | ||||
|
Other (income) and expense |
|
128 |
|
(106 |
) |
nm |
|
23 |
|
(746 |
) |
nm |
| ||||
|
Interest expense |
|
107 |
|
95 |
|
13.5 |
% |
298 |
|
267 |
|
11.6 |
% | ||||
|
|
|
|
|
|
|
|
|
|
|
|
|
|
| ||||
|
TOTAL EXPENSE AND OTHER INCOME |
|
7,146 |
|
6,324 |
|
13.0 |
% |
21,687 |
|
19,019 |
|
14.0 |
% | ||||
|
% of revenue |
|
27.3 |
% |
26.1 |
% |
|
|
28.0 |
% |
26.8 |
% |
|
| ||||
|
|
|
|
|
|
|
|
|
|
|
|
|
|
| ||||
|
INCOME BEFORE INCOME TAXES |
|
5,027 |
|
4,677 |
|
7.5 |
% |
13,729 |
|
12,767 |
|
7.5 |
% | ||||
|
Pre-tax margin |
|
19.2 |
% |
19.3 |
% |
|
|
17.7 |
% |
18.0 |
% |
|
| ||||
|
|
|
|
|
|
|
|
|
|
|
|
|
|
| ||||
|
Provision for income taxes |
|
1,188 |
|
1,088 |
|
9.2 |
% |
3,364 |
|
3,192 |
|
5.4 |
% | ||||
|
Effective tax rate |
|
23.6 |
% |
23.3 |
% |
|
|
24.5 |
% |
25.0 |
% |
|
| ||||
|
|
|
|
|
|
|
|
|
|
|
|
|
|
| ||||
|
NET INCOME |
|
$ |
3,839 |
|
$ |
3,589 |
|
7.0 |
% |
$ |
10,365 |
|
$ |
9,576 |
|
8.2 |
% |
|
Net margin |
|
14.7 |
% |
14.8 |
% |
|
|
13.4 |
% |
13.5 |
% |
|
| ||||
|
|
|
|
|
|
|
|
|
|
|
|
|
|
| ||||
|
EARNINGS PER SHARE OF COMMON STOCK: |
|
|
|
|
|
|
|
|
|
|
|
|
| ||||
|
ASSUMING DILUTION |
|
$ |
3.19 |
|
$ |
2.82 |
|
13.1 |
% |
$ |
8.48 |
|
$ |
7.38 |
|
14.9 |
% |
|
BASIC |
|
$ |
3.23 |
|
$ |
2.86 |
|
12.9 |
% |
$ |
8.60 |
|
$ |
7.49 |
|
14.8 |
% |
|
|
|
|
|
|
|
|
|
|
|
|
|
|
| ||||
|
WEIGHTED-AVERAGE NUMBER OF COMMON SHARES OUT- STANDING (M’s): |
|
|
|
|
|
|
|
|
|
|
|
|
| ||||
|
ASSUMING DILUTION |
|
1,204.9 |
|
1,272.8 |
|
|
|
1,222.1 |
|
1,297.0 |
|
|
| ||||
|
BASIC |
|
1,188.6 |
|
1,255.2 |
|
|
|
1,205.2 |
|
1,278.3 |
|
|
| ||||
nm — not meaningful
* Segment gross profit margins in 2010 reclassified to conform with 2011 presentation.
INTERNATIONAL BUSINESS MACHINES CORPORATION
CONSOLIDATED STATEMENT OF FINANCIAL POSITION
(Unaudited)
|
(Dollars in Millions) |
|
At |
|
At |
| ||
|
ASSETS |
|
|
|
|
| ||
|
|
|
|
|
|
| ||
|
Current Assets: |
|
|
|
|
| ||
|
Cash and cash equivalents |
|
$ |
11,303 |
|
$ |
10,661 |
|
|
Marketable securities |
|
— |
|
990 |
| ||
|
Notes and accounts receivable - trade |
|
|
|
|
| ||
|
(net of allowances of $282 in 2011 and $324 in 2010) |
|
9,719 |
|
10,834 |
| ||
|
Short-term financing receivables |
|
|
|
|
| ||
|
(net of allowances of $266 in 2011 and $342 in 2010) |
|
14,145 |
|
16,257 |
| ||
|
Other accounts receivable |
|
|
|
|
| ||
|
(net of allowances of $11 in 2011 and $10 in 2010) |
|
1,123 |
|
1,134 |
| ||
|
Inventories, at lower of average cost or market: |
|
|
|
|
| ||
|
Finished goods |
|
618 |
|
432 |
| ||
|
Work in process and raw materials |
|
2,045 |
|
2,018 |
| ||
|
Total inventories |
|
2,663 |
|
2,450 |
| ||
|
Deferred taxes |
|
1,247 |
|
1,564 |
| ||
|
Prepaid expenses and other current assets |
|
5,172 |
|
4,226 |
| ||
|
Total Current Assets |
|
45,373 |
|
48,116 |
| ||
|
|
|
|
|
|
| ||
|
Plant, rental machines, and other property |
|
40,139 |
|
40,289 |
| ||
|
Less: Accumulated depreciation |
|
26,252 |
|
26,193 |
| ||
|
Plant, rental machines, and other property - net |
|
13,887 |
|
14,096 |
| ||
|
Long-term financing receivables |
|
|
|
|
| ||
|
(net of allowances of $37 in 2011 and $58 in 2010) |
|
9,830 |
|
10,548 |
| ||
|
Prepaid pension assets |
|
5,131 |
|
3,068 |
| ||
|
Deferred taxes |
|
2,570 |
|
3,220 |
| ||
|
Goodwill |
|
24,913 |
|
25,136 |
| ||
|
Intangible assets - net |
|
3,033 |
|
3,488 |
| ||
|
Investments and sundry assets |
|
5,422 |
|
5,778 |
| ||
|
Total Assets |
|
$ |
110,158 |
|
$ |
113,452 |
|
|
LIABILITIES |
|
|
|
|
| ||
|
|
|
|
|
|
| ||
|
Current Liabilities: |
|
|
|
|
| ||
|
Taxes |
|
$ |
2,360 |
|
$ |
4,216 |
|
|
Short-term debt |
|
6,071 |
|
6,778 |
| ||
|
Accounts payable |
|
7,093 |
|
7,804 |
| ||
|
Compensation and benefits |
|
4,826 |
|
5,028 |
| ||
|
Deferred income |
|
11,252 |
|
11,580 |
| ||
|
Other accrued expenses and liabilities |
|
4,426 |
|
5,156 |
| ||
|
Total Current Liabilities |
|
36,028 |
|
40,562 |
| ||
|
|
|
|
|
|
| ||
|
Long-term debt |
|
24,089 |
|
21,846 |
| ||
|
Retirement and nonpension postretirement benefit obligations |
|
15,375 |
|
15,978 |
| ||
|
Deferred income |
|
3,634 |
|
3,666 |
| ||
|
Other liabilities |
|
8,654 |
|
8,226 |
| ||
|
Total Liabilities |
|
87,781 |
|
90,279 |
| ||
|
|
|
|
|
|
| ||
|
EQUITY |
|
|
|
|
| ||
|
IBM Stockholders’ Equity: |
|
|
|
|
| ||
|
Common stock |
|
47,558 |
|
45,418 |
| ||
|
Retained earnings |
|
100,266 |
|
92,532 |
| ||
|
Treasury stock — at cost |
|
(107,434 |
) |
(96,161 |
) | ||
|
Accumulated other comprehensive income/(loss) |
|
(18,099 |
) |
(18,743 |
) | ||
|
Total IBM stockholders’ equity |
|
22,291 |
|
23,046 |
| ||
|
|
|
|
|
|
| ||
|
Noncontrolling interests |
|
87 |
|
126 |
| ||
|
Total Equity |
|
22,378 |
|
23,172 |
| ||
|
Total Liabilities and Equity |
|
$ |
110,158 |
|
$ |
113,452 |
|
INTERNATIONAL BUSINESS MACHINES CORPORATION
CASH FLOW ANALYSIS
(Unaudited)
|
|
|
Three Months Ended |
|
Nine Months Ended |
| ||||||||
|
(Dollars in Millions) |
|
2011 |
|
2010 |
|
2011 |
|
2010 |
| ||||
|
|
|
|
|
|
|
|
|
|
| ||||
|
Net Cash from Operating Activities per GAAP: |
|
$ |
4,678 |
|
$ |
4,551 |
|
$ |
12,750 |
|
$ |
12,754 |
|
|
|
|
|
|
|
|
|
|
|
| ||||
|
Less: the change in Global Financing (GF) Receivables |
|
207 |
|
374 |
|
2,110 |
|
2,257 |
| ||||
|
|
|
|
|
|
|
|
|
|
| ||||
|
Net Cash from Operating Activities |
|
|
|
|
|
|
|
|
| ||||
|
(Excluding GF Receivables) |
|
4,471 |
|
4,177 |
|
10,640 |
|
10,497 |
| ||||
|
|
|
|
|
|
|
|
|
|
| ||||
|
Capital Expenditures, Net |
|
(991 |
) |
(1,007 |
) |
(3,000 |
) |
(2,881 |
) | ||||
|
|
|
|
|
|
|
|
|
|
| ||||
|
Free Cash Flow |
|
|
|
|
|
|
|
|
| ||||
|
(Excluding GF Receivables) |
|
3,481 |
|
3,169 |
|
7,640 |
|
7,616 |
| ||||
|
|
|
|
|
|
|
|
|
|
| ||||
|
Acquisitions |
|
(64 |
) |
(1,984 |
) |
(223 |
) |
(2,993 |
) | ||||
|
Divestitures |
|
0 |
|
0 |
|
4 |
|
0 |
| ||||
|
Dividends |
|
(893 |
) |
(818 |
) |
(2,593 |
) |
(2,369 |
) | ||||
|
Share Repurchase |
|
(3,444 |
) |
(3,653 |
) |
(11,465 |
) |
(11,774 |
) | ||||
|
Non-GF Debt |
|
86 |
|
273 |
|
1,093 |
|
1,534 |
| ||||
|
Other (includes GF Receivables, and GF Debt) |
|
374 |
|
1,858 |
|
5,196 |
|
5,099 |
| ||||
|
|
|
|
|
|
|
|
|
|
| ||||
|
Change in Cash, Cash Equivalents and Short-term Marketable Securities |
|
$ |
(461 |
) |
$ |
(1,154 |
) |
$ |
(348 |
) |
$ |
(2,887 |
) |
INTERNATIONAL BUSINESS MACHINES CORPORATION
SEGMENT DATA
(Unaudited)
|
|
|
THIRD-QUARTER 2011 |
| ||||||||||||
|
|
|
Revenue |
|
Pre-tax |
|
Pre-tax |
| ||||||||
|
(Dollars in Millions) |
|
External |
|
Internal |
|
Total |
|
Income |
|
Margin |
| ||||
|
SEGMENTS |
|
|
|
|
|
|
|
|
|
|
| ||||
|
|
|
|
|
|
|
|
|
|
|
|
| ||||
|
Global Technology Services |
|
$ |
10,322 |
|
$ |
316 |
|
$ |
10,638 |
|
$ |
1,695 |
|
15.9 |
% |
|
Y-T-Y change |
|
8.7 |
% |
-12.6 |
% |
7.9 |
% |
12.5 |
% |
|
| ||||
|
|
|
|
|
|
|
|
|
|
|
|
| ||||
|
Global Business Services |
|
4,832 |
|
199 |
|
5,031 |
|
775 |
|
15.4 |
% | ||||
|
Y-T-Y change |
|
5.7 |
% |
0.1 |
% |
5.5 |
% |
12.8 |
% |
|
| ||||
|
|
|
|
|
|
|
|
|
|
|
|
| ||||
|
Software |
|
5,817 |
|
804 |
|
6,621 |
|
2,214 |
|
33.4 |
% | ||||
|
Y-T-Y change |
|
12.9 |
% |
10.4 |
% |
12.6 |
% |
12.0 |
% |
|
| ||||
|
|
|
|
|
|
|
|
|
|
|
|
| ||||
|
Systems and Technology |
|
4,482 |
|
190 |
|
4,672 |
|
318 |
|
6.8 |
% | ||||
|
Y-T-Y change |
|
3.6 |
% |
-3.2 |
% |
3.3 |
% |
7.8 |
% |
|
| ||||
|
|
|
|
|
|
|
|
|
|
|
|
| ||||
|
Global Financing |
|
520 |
|
480 |
|
999 |
|
481 |
|
48.2 |
% | ||||
|
Y-T-Y change |
|
-1.7 |
% |
10.9 |
% |
4.0 |
% |
-4.0 |
% |
|
| ||||
|
|
|
|
|
|
|
|
|
|
|
|
| ||||
|
TOTAL REPORTABLE SEGMENTS |
|
$ |
25,974 |
|
$ |
1,989 |
|
$ |
27,963 |
|
$ |
5,484 |
|
19.6 |
% |
|
Y-T-Y change |
|
7.9 |
% |
3.7 |
% |
7.6 |
% |
10.4 |
% |
|
| ||||
|
|
|
|
|
|
|
|
|
|
|
|
| ||||
|
Eliminations / Other |
|
182 |
|
(1,989 |
) |
(1,806 |
) |
(457 |
) |
|
| ||||
|
|
|
|
|
|
|
|
|
|
|
|
| ||||
|
TOTAL IBM CONSOLIDATED |
|
$ |
26,157 |
|
$ |
0 |
|
$ |
26,157 |
|
$ |
5,027 |
|
19.2 |
% |
|
Y-T-Y change |
|
7.8 |
% |
|
|
7.8 |
% |
7.5 |
% |
|
| ||||
|
|
|
THIRD-QUARTER 2010 |
| ||||||||||||
|
|
|
Revenue |
|
Pre-tax |
|
Pre-tax |
| ||||||||
|
(Dollars in Millions) |
|
External |
|
Internal |
|
Total |
|
Income* |
|
Margin* |
| ||||
|
SEGMENTS |
|
|
|
|
|
|
|
|
|
|
| ||||
|
|
|
|
|
|
|
|
|
|
|
|
| ||||
|
Global Technology Services |
|
$ |
9,496 |
|
$ |
362 |
|
$ |
9,857 |
|
$ |
1,506 |
|
15.3 |
% |
|
|
|
|
|
|
|
|
|
|
|
|
| ||||
|
Global Business Services |
|
4,572 |
|
199 |
|
4,771 |
|
687 |
|
14.4 |
% | ||||
|
|
|
|
|
|
|
|
|
|
|
|
| ||||
|
Software |
|
5,151 |
|
728 |
|
5,879 |
|
1,978 |
|
33.6 |
% | ||||
|
|
|
|
|
|
|
|
|
|
|
|
| ||||
|
Systems and Technology |
|
4,325 |
|
196 |
|
4,521 |
|
295 |
|
6.5 |
% | ||||
|
|
|
|
|
|
|
|
|
|
|
|
| ||||
|
Global Financing |
|
529 |
|
432 |
|
961 |
|
502 |
|
52.2 |
% | ||||
|
|
|
|
|
|
|
|
|
|
|
|
| ||||
|
TOTAL REPORTABLE SEGMENTS |
|
$ |
24,072 |
|
$ |
1,917 |
|
$ |
25,990 |
|
$ |
4,968 |
|
19.1 |
% |
|
|
|
|
|
|
|
|
|
|
|
|
| ||||
|
Eliminations / Other |
|
199 |
|
(1,917 |
) |
(1,718 |
) |
(291 |
) |
|
| ||||
|
|
|
|
|
|
|
|
|
|
|
|
| ||||
|
TOTAL IBM CONSOLIDATED |
|
$ |
24,271 |
|
$ |
0 |
|
$ |
24,271 |
|
$ |
4,677 |
|
19.3 |
% |
* Reclassified to conform with 2011 presentation.
INTERNATIONAL BUSINESS MACHINES CORPORATION
SEGMENT DATA
(Unaudited)
|
|
|
NINE-MONTHS 2011 |
| ||||||||||||
|
|
|
Revenue |
|
Pre-tax |
|
Pre-tax |
| ||||||||
|
(Dollars in Millions) |
|
External |
|
Internal |
|
Total |
|
Income |
|
Margin |
| ||||
|
SEGMENTS |
|
|
|
|
|
|
|
|
|
|
| ||||
|
|
|
|
|
|
|
|
|
|
|
|
| ||||
|
Global Technology Services |
|
$ |
30,427 |
|
$ |
943 |
|
$ |
31,370 |
|
$ |
4,353 |
|
13.9 |
% |
|
Y-T-Y change |
|
8.5 |
% |
-7.0 |
% |
8.0 |
% |
12.7 |
% |
|
| ||||
|
|
|
|
|
|
|
|
|
|
|
|
| ||||
|
Global Business Services |
|
14,407 |
|
604 |
|
15,012 |
|
2,166 |
|
14.4 |
% | ||||
|
Y-T-Y change |
|
7.0 |
% |
0.9 |
% |
6.7 |
% |
19.6 |
% |
|
| ||||
|
|
|
|
|
|
|
|
|
|
|
|
| ||||
|
Software |
|
17,295 |
|
2,425 |
|
19,720 |
|
6,260 |
|
31.7 |
% | ||||
|
Y-T-Y change |
|
12.0 |
% |
11.4 |
% |
11.9 |
% |
1.5 |
% |
|
| ||||
|
|
|
|
|
|
|
|
|
|
|
|
| ||||
|
Systems and Technology |
|
13,182 |
|
652 |
|
13,834 |
|
843 |
|
6.1 |
% | ||||
|
Y-T-Y change |
|
12.7 |
% |
14.1 |
% |
12.8 |
% |
197.9 |
% |
|
| ||||
|
|
|
|
|
|
|
|
|
|
|
|
| ||||
|
Global Financing |
|
1,555 |
|
1,524 |
|
3,078 |
|
1,497 |
|
48.6 |
% | ||||
|
Y-T-Y change |
|
-3.4 |
% |
20.3 |
% |
7.0 |
% |
7.6 |
% |
|
| ||||
|
|
|
|
|
|
|
|
|
|
|
|
| ||||
|
TOTAL REPORTABLE SEGMENTS |
|
$ |
76,866 |
|
$ |
6,148 |
|
$ |
83,015 |
|
$ |
15,118 |
|
18.2 |
% |
|
Y-T-Y change |
|
9.4 |
% |
9.3 |
% |
9.4 |
% |
11.9 |
% |
|
| ||||
|
|
|
|
|
|
|
|
|
|
|
|
| ||||
|
Eliminations / Other |
|
563 |
|
(6,148 |
) |
(5,585 |
) |
(1,389 |
) |
|
| ||||
|
|
|
|
|
|
|
|
|
|
|
|
| ||||
|
TOTAL IBM CONSOLIDATED |
|
$ |
77,430 |
|
$ |
0 |
|
$ |
77,430 |
|
$ |
13,729 |
|
17.7 |
% |
|
Y-T-Y change |
|
9.3 |
% |
|
|
9.3 |
% |
7.5 |
% |
|
| ||||
|
|
|
NINE-MONTHS 2010 |
| ||||||||||||
|
|
|
Revenue |
|
Pre-tax |
|
Pre-tax |
| ||||||||
|
(Dollars in Millions) |
|
External |
|
Internal |
|
Total |
|
Income* |
|
Margin* |
| ||||
|
SEGMENTS |
|
|
|
|
|
|
|
|
|
|
| ||||
|
|
|
|
|
|
|
|
|
|
|
|
| ||||
|
Global Technology Services |
|
$ |
28,036 |
|
$ |
1,014 |
|
$ |
29,050 |
|
$ |
3,863 |
|
13.3 |
% |
|
|
|
|
|
|
|
|
|
|
|
|
| ||||
|
Global Business Services |
|
13,465 |
|
599 |
|
14,064 |
|
1,811 |
|
12.9 |
% | ||||
|
|
|
|
|
|
|
|
|
|
|
|
| ||||
|
Software |
|
15,447 |
|
2,176 |
|
17,623 |
|
6,167 |
|
35.0 |
% | ||||
|
|
|
|
|
|
|
|
|
|
|
|
| ||||
|
Systems and Technology |
|
11,696 |
|
572 |
|
12,267 |
|
283 |
|
2.3 |
% | ||||
|
|
|
|
|
|
|
|
|
|
|
|
| ||||
|
Global Financing |
|
1,610 |
|
1,267 |
|
2,877 |
|
1,391 |
|
48.3 |
% | ||||
|
|
|
|
|
|
|
|
|
|
|
|
| ||||
|
TOTAL REPORTABLE SEGMENTS |
|
$ |
70,253 |
|
$ |
5,627 |
|
$ |
75,880 |
|
$ |
13,514 |
|
17.8 |
% |
|
|
|
|
|
|
|
|
|
|
|
|
| ||||
|
Eliminations / Other |
|
599 |
|
(5,627 |
) |
(5,028 |
) |
(747 |
) |
|
| ||||
|
|
|
|
|
|
|
|
|
|
|
|
| ||||
|
TOTAL IBM CONSOLIDATED |
|
$ |
70,852 |
|
$ |
0 |
|
$ |
70,852 |
|
$ |
12,767 |
|
18.0 |
% |
* Reclassified to conform with 2011 presentation.
INTERNATIONAL BUSINESS MACHINES CORPORATION
U.S. GAAP TO OPERATING RESULTS RECONCILIATION
(Unaudited, Dollars in millions except per share amounts)
|
|
|
THIRD-QUARTER 2011 |
| ||||||||||
|
|
|
|
|
Acquisition- |
|
Retirement- |
|
|
| ||||
|
|
|
|
|
Related |
|
Related |
|
Operating |
| ||||
|
|
|
GAAP |
|
Adjustments* |
|
Adjustments |
|
(Non-GAAP) |
| ||||
|
Gross Profit |
|
$ |
12,173 |
|
$ |
87 |
|
$ |
(7 |
) |
$ |
12,253 |
|
|
|
|
|
|
|
|
|
|
|
| ||||
|
Gross Profit Margin |
|
46.5 |
% |
0.3Pts |
|
0.0Pts |
|
46.8 |
% | ||||
|
|
|
|
|
|
|
|
|
|
| ||||
|
S,G&A |
|
5,662 |
|
(75 |
) |
(0 |
) |
5,587 |
| ||||
|
|
|
|
|
|
|
|
|
|
| ||||
|
R,D&E |
|
1,546 |
|
0 |
|
22 |
|
1,568 |
| ||||
|
|
|
|
|
|
|
|
|
|
| ||||
|
Other (Income) & Expense |
|
128 |
|
(18 |
) |
0 |
|
111 |
| ||||
|
|
|
|
|
|
|
|
|
|
| ||||
|
Total Expense & Other (Income) |
|
7,146 |
|
(92 |
) |
21 |
|
7,075 |
| ||||
|
|
|
|
|
|
|
|
|
|
| ||||
|
Pre-Tax Income |
|
5,027 |
|
180 |
|
(29 |
) |
5,178 |
| ||||
|
|
|
|
|
|
|
|
|
|
| ||||
|
Pre-Tax Income Margin |
|
19.2 |
% |
0.7Pts |
|
-0.1Pts |
|
19.8 |
% | ||||
|
|
|
|
|
|
|
|
|
|
| ||||
|
Provision for Income Taxes** |
|
1,188 |
|
47 |
|
(11 |
) |
1,224 |
| ||||
|
|
|
|
|
|
|
|
|
|
| ||||
|
Effective Tax Rate |
|
23.6 |
% |
0.1Pts |
|
-0.1Pts |
|
23.6 |
% | ||||
|
|
|
|
|
|
|
|
|
|
| ||||
|
Net Income |
|
3,839 |
|
133 |
|
(17 |
) |
3,954 |
| ||||
|
|
|
|
|
|
|
|
|
|
| ||||
|
Net Income Margin |
|
14.7 |
% |
0.5Pts |
|
-0.1Pts |
|
15.1 |
% | ||||
|
|
|
|
|
|
|
|
|
|
| ||||
|
Diluted Earnings Per Share |
|
$ |
3.19 |
|
$ |
0.11 |
|
$ |
(0.01 |
) |
$ |
3.28 |
|
|
|
|
THIRD-QUARTER 2010 |
| ||||||||||
|
|
|
|
|
Acquisition- |
|
Retirement- |
|
|
| ||||
|
|
|
|
|
Related |
|
Related |
|
Operating |
| ||||
|
|
|
GAAP |
|
Adjustments* |
|
Adjustments |
|
(Non-GAAP) |
| ||||
|
Gross Profit |
|
$ |
11,001 |
|
$ |
65 |
|
$ |
(53 |
) |
$ |
11,013 |
|
|
|
|
|
|
|
|
|
|
|
| ||||
|
Gross Profit Margin |
|
45.3 |
% |
0.3Pts |
|
-0.2Pts |
|
45.4 |
% | ||||
|
|
|
|
|
|
|
|
|
|
| ||||
|
S,G&A |
|
5,149 |
|
(76 |
) |
20 |
|
5,094 |
| ||||
|
|
|
|
|
|
|
|
|
|
| ||||
|
R,D&E |
|
1,464 |
|
0 |
|
31 |
|
1,495 |
| ||||
|
|
|
|
|
|
|
|
|
|
| ||||
|
Other (Income) & Expense |
|
(106 |
) |
1 |
|
0 |
|
(105 |
) | ||||
|
|
|
|
|
|
|
|
|
|
| ||||
|
Total Expense & Other (Income) |
|
6,324 |
|
(75 |
) |
51 |
|
6,301 |
| ||||
|
|
|
|
|
|
|
|
|
|
| ||||
|
Pre-Tax Income |
|
4,677 |
|
139 |
|
(104 |
) |
4,712 |
| ||||
|
|
|
|
|
|
|
|
|
|
| ||||
|
Pre-Tax Income Margin |
|
19.3 |
% |
0.6Pts |
|
-0.4Pts |
|
19.4 |
% | ||||
|
|
|
|
|
|
|
|
|
|
| ||||
|
Provision for Income Taxes** |
|
1,088 |
|
34 |
|
(38 |
) |
1,084 |
| ||||
|
|
|
|
|
|
|
|
|
|
| ||||
|
Effective Tax Rate |
|
23.3 |
% |
0.0Pts |
|
-0.3Pts |
|
23.0 |
% | ||||
|
|
|
|
|
|
|
|
|
|
| ||||
|
Net Income |
|
3,589 |
|
105 |
|
(66 |
) |
3,628 |
| ||||
|
|
|
|
|
|
|
|
|
|
| ||||
|
Net Income Margin |
|
14.8 |
% |
0.4Pts |
|
-0.3Pts |
|
14.9 |
% | ||||
|
|
|
|
|
|
|
|
|
|
| ||||
|
Diluted Earnings Per Share |
|
$ |
2.82 |
|
$ |
0.08 |
|
$ |
(0.05 |
) |
$ |
2.85 |
|
* Includes amortization of acquired intangible assets and other acquisition-related charges.
** Tax impact on operating (non-GAAP) pre-tax income is calculated under the same accounting principles applied to the GAAP pre-tax income which employs an annual effective tax rate method to the results.
INTERNATIONAL BUSINESS MACHINES CORPORATION
U.S. GAAP TO OPERATING RESULTS RECONCILIATION
(Unaudited, Dollars in millions except per share amounts)
|
|
|
NINE-MONTHS 2011 |
| ||||||||||
|
|
|
|
|
Acquisition- |
|
Retirement- |
|
|
| ||||
|
|
|
|
|
Related |
|
Related |
|
Operating |
| ||||
|
|
|
GAAP |
|
Adjustments* |
|
Adjustments |
|
(Non-GAAP) |
| ||||
|
Gross Profit |
|
$ |
35,416 |
|
$ |
259 |
|
$ |
12 |
|
$ |
35,687 |
|
|
|
|
|
|
|
|
|
|
|
| ||||
|
Gross Profit Margin |
|
45.7 |
% |
0.3Pts |
|
0.0Pts |
|
46.1 |
% | ||||
|
|
|
|
|
|
|
|
|
|
| ||||
|
S,G&A |
|
17,518 |
|
(226 |
) |
(16 |
) |
17,276 |
| ||||
|
|
|
|
|
|
|
|
|
|
| ||||
|
R,D&E |
|
4,703 |
|
0 |
|
65 |
|
4,768 |
| ||||
|
|
|
|
|
|
|
|
|
|
| ||||
|
Other (Income) & Expense |
|
23 |
|
(23 |
) |
0 |
|
1 |
| ||||
|
|
|
|
|
|
|
|
|
|
| ||||
|
Total Expense & Other (Income) |
|
21,687 |
|
(249 |
) |
49 |
|
21,487 |
| ||||
|
|
|
|
|
|
|
|
|
|
| ||||
|
Pre-Tax Income |
|
13,729 |
|
508 |
|
(37 |
) |
14,200 |
| ||||
|
|
|
|
|
|
|
|
|
|
| ||||
|
Pre-Tax Income Margin |
|
17.7 |
% |
0.7Pts |
|
0.0Pts |
|
18.3 |
% | ||||
|
|
|
|
|
|
|
|
|
|
| ||||
|
Provision for Income Taxes** |
|
3,364 |
|
132 |
|
(17 |
) |
3,479 |
| ||||
|
|
|
|
|
|
|
|
|
|
| ||||
|
Effective Tax Rate |
|
24.5 |
% |
0.1Pts |
|
-0.1Pts |
|
24.5 |
% | ||||
|
|
|
|
|
|
|
|
|
|
| ||||
|
Net Income |
|
10,365 |
|
376 |
|
(20 |
) |
10,721 |
| ||||
|
|
|
|
|
|
|
|
|
|
| ||||
|
Net Income Margin |
|
13.4 |
% |
0.5Pts |
|
0.0Pts |
|
13.8 |
% | ||||
|
|
|
|
|
|
|
|
|
|
| ||||
|
Diluted Earnings Per Share |
|
$ |
8.48 |
|
$ |
0.31 |
|
$ |
(0.02 |
) |
$ |
8.77 |
|
|
|
|
NINE-MONTHS 2010 |
| ||||||||||
|
|
|
|
|
Acquisition- |
|
Retirement- |
|
|
| ||||
|
|
|
|
|
Related |
|
Related |
|
Operating |
| ||||
|
|
|
GAAP |
|
Adjustments* |
|
Adjustments |
|
(Non-GAAP) |
| ||||
|
Gross Profit |
|
$ |
31,787 |
|
$ |
178 |
|
$ |
(144 |
) |
$ |
31,820 |
|
|
|
|
|
|
|
|
|
|
|
| ||||
|
Gross Profit Margin |
|
44.9 |
% |
0.3Pts |
|
-0.2Pts |
|
44.9 |
% | ||||
|
|
|
|
|
|
|
|
|
|
| ||||
|
S,G&A |
|
15,886 |
|
(199 |
) |
56 |
|
15,744 |
| ||||
|
|
|
|
|
|
|
|
|
|
| ||||
|
R,D&E |
|
4,448 |
|
0 |
|
93 |
|
4,541 |
| ||||
|
|
|
|
|
|
|
|
|
|
| ||||
|
Other (Income) & Expense |
|
(746 |
) |
(2 |
) |
0 |
|
(747 |
) | ||||
|
|
|
|
|
|
|
|
|
|
| ||||
|
Total Expense & Other (Income) |
|
19,019 |
|
(200 |
) |
149 |
|
18,968 |
| ||||
|
|
|
|
|
|
|
|
|
|
| ||||
|
Pre-Tax Income |
|
12,767 |
|
378 |
|
(293 |
) |
12,853 |
| ||||
|
|
|
|
|
|
|
|
|
|
| ||||
|
Pre-Tax Income Margin |
|
18.0 |
% |
0.5Pts |
|
-0.4Pts |
|
18.1 |
% | ||||
|
|
|
|
|
|
|
|
|
|
| ||||
|
Provision for Income Taxes** |
|
3,192 |
|
106 |
|
(114 |
) |
3,184 |
| ||||
|
|
|
|
|
|
|
|
|
|
| ||||
|
Effective Tax Rate |
|
25.0 |
% |
0.1Pts |
|
-0.3Pts |
|
24.8 |
% | ||||
|
|
|
|
|
|
|
|
|
|
| ||||
|
Net Income |
|
9,576 |
|
272 |
|
(179 |
) |
9,669 |
| ||||
|
|
|
|
|
|
|
|
|
|
| ||||
|
Net Income Margin |
|
13.5 |
% |
0.4Pts |
|
-0.3Pts |
|
13.6 |
% | ||||
|
|
|
|
|
|
|
|
|
|
| ||||
|
Diluted Earnings Per Share |
|
$ |
7.38 |
|
$ |
0.21 |
|
$ |
(0.14 |
) |
$ |
7.45 |
|
* Includes amortization of acquired intangible assets and other acquisition-related charges.
** Tax impact on operating (non-GAAP) pre-tax income is calculated under the same accounting principles applied to the GAAP pre-tax income which employs an annual effective tax rate method to the results.
|
Contact: |
IBM |
|
|
Mike Fay, 914-499-6107 |
|
|
mikefay@us.ibm.com |
|
|
John Bukovinsky, 732-618-3531 |
|
|
jbuko@us.ibm.com |
ATTACHMENT II
|
|
3Q 2011 Earnings Presentation October 17, 2011 |

|
|
Forward Looking Statements and Non-GAAP Information Certain comments made in this presentation may be characterized as forward looking under the Private Securities Litigation Reform Act of 1995. Forward-looking statements are based on the company's current assumptions regarding future business and financial performance. Those statements by their nature address matters that are uncertain to different degrees. Those statements involve a number of factors that could cause actual results to differ materially. Additional information concerning these factors is contained in the Company's filings with the SEC. Copies are available from the SEC, from the IBM web site, or from IBM Investor Relations. Any forward-looking statement made during this presentation speaks only as of the date on which it is made. The company assumes no obligation to update or revise any forward-looking statements. These charts and the associated remarks and comments are integrally related, and are intended to be presented and understood together. In an effort to provide additional and useful information regarding the company’s financial results and other financial information as determined by generally accepted accounting principles (GAAP), the company also discusses, in its earnings press release and earnings presentation materials, certain non-GAAP information including "operating earnings" and other "operating" financial measures. The rationale for management’s use of this non-GAAP information, the reconciliation of that information to GAAP, and other related information are included in supplementary materials entitled “Non-GAAP Supplementary Materials” that are posted on the Company’s investor relations web site at http://www.ibm.com/investor/3q11/ The Non-GAAP Supplementary Materials are also included as Attachment II to the Company’s Form 8-K dated October 17, 2011. |
|
|
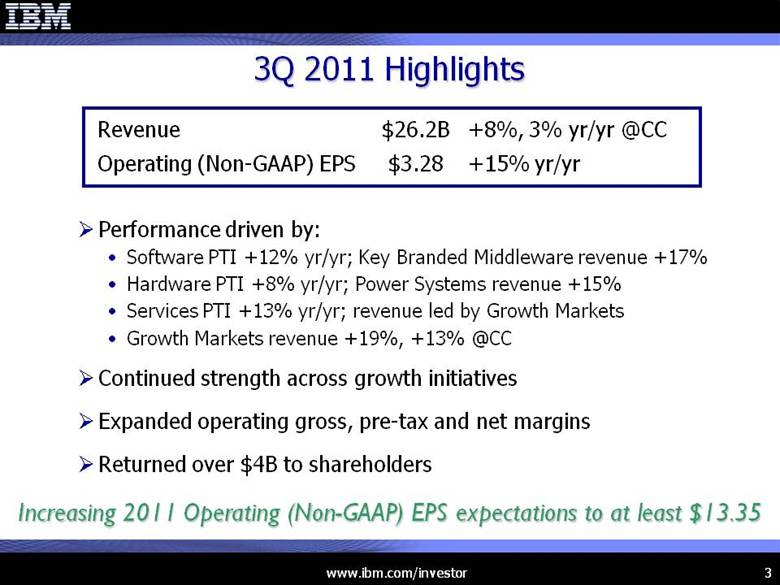
3Q 2011 Highlights Increasing 2011 Operating (Non-GAAP) EPS expectations to at least $13.35 Performance driven by: Software PTI +12% yr/yr; Key Branded Middleware revenue +17% Hardware PTI +8% yr/yr; Power Systems revenue +15% Services PTI +13% yr/yr; revenue led by Growth Markets Growth Markets revenue +19%, +13% @CC Continued strength across growth initiatives Expanded operating gross, pre-tax and net margins Returned over $4B to shareholders +15% yr/yr $3.28 Operating (Non-GAAP) EPS +8%, 3% yr/yr @CC $26.2B Revenue |
|
|
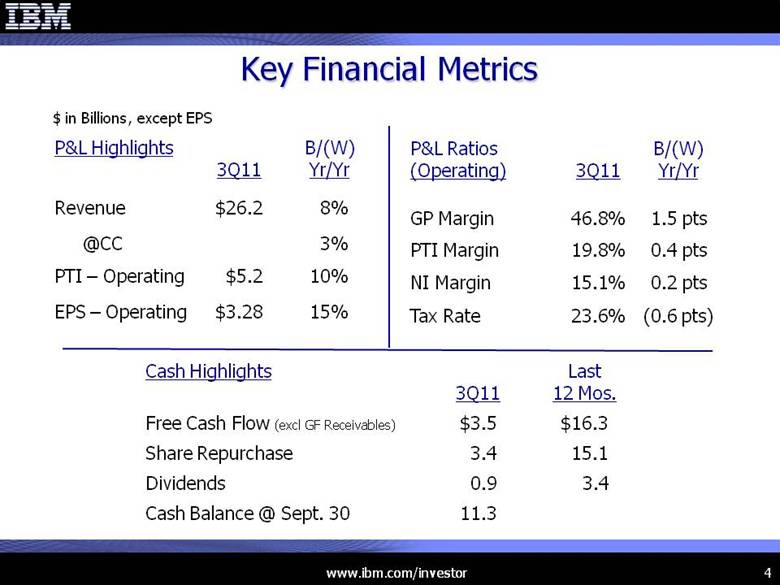
Key Financial Metrics 0.4 pts 19.8% PTI Margin (0.6 pts) 23.6% Tax Rate 0.2 pts 15.1% NI Margin 1.5 pts 46.8% GP Margin B/(W) Yr/Yr 3Q11 P&L Ratios (Operating) 3% @CC 10% $5.2 PTI – Operating 15% $3.28 EPS – Operating 8% $26.2 Revenue B/(W) Yr/Yr 3Q11 P&L Highlights $ in Billions, except EPS 3.4 15.1 $16.3 Last 12 Mos. Cash Balance @ Sept. 30 Dividends Share Repurchase Free Cash Flow (excl GF Receivables) Cash Highlights 11.3 0.9 3.4 $3.5 3Q11 |
|
|
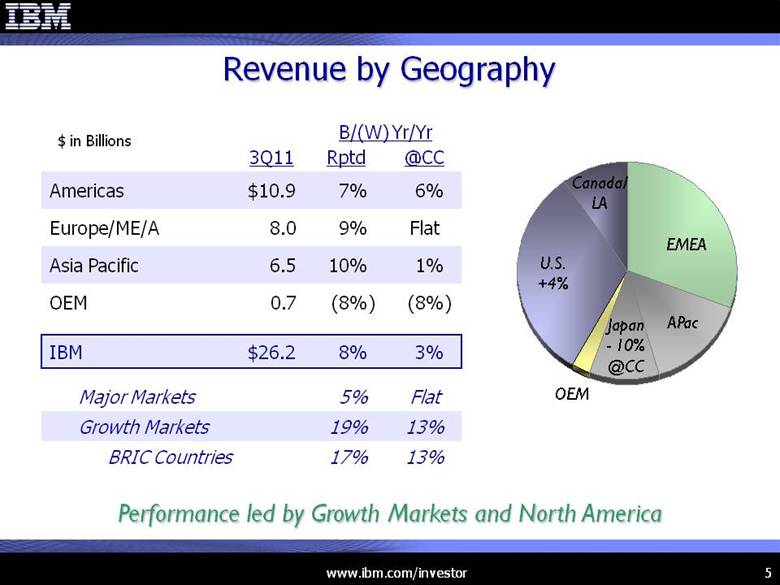
Revenue by Geography Flat 5% Major Markets 13% 19% Growth Markets 13% 17% BRIC Countries Flat 9% 8.0 Europe/ME/A (8%) (8%) 0.7 OEM 3% 8% $26.2 IBM 3Q11 1% 10% 6.5 Asia Pacific 6% 7% $10.9 Americas Rptd @CC $ in Billions APac U.S. +4% EMEA Canada/ LA Japan - 10% @CC Performance led by Growth Markets and North America B/(W) Yr/Yr OEM |
|
|
Revenue and Gross Profit Margin by Segment 46.8% 47.4% 39.8% 88.1% 29.4% 35.7% 3Q11 1.5 pts (5.9 pts) 3.4 pts 0.2 pts 0.8 pts 0.6 pts B/(W) Yr/Yr Pts 8% 13% 5.8 Software 3Q11 3% 8% $26.2 Total Revenue & Operating GP Margin (6%) (2%) 0.5 Global Financing 1% 4% 4.5 Systems & Technology Flat 6% 4.8 Global Business Services 3% 9% $10.3 Global Technology Services B/(W) Yr/Yr Rptd @CC $ in Billions Operating Gross Profit Margin Revenue Revenue growth led by Software; broad-based margin expansion |
|
|
Expense Summary (2 pts) 2 pts (3 pts) Base (3 pts) (7 pts) (12%) $7.1 Operating Expense & Other Income (14%) 0.1 Interest Expense nm 0.1 Other (Income)/Expense 7% (0.3) IP and Development Income (4 pts) (2 pts) (5%) 1.6 RD&E – Operating (2 pts) (5 pts) (10%) $5.6 SG&A – Operating Acq.* Currency B/(W) Yr/Yr 3Q11 $ in Billions B/(W) Yr/Yr Drivers * Includes acquisitions made in the last twelve months, net of non-operating acquisition-related charges |
|
|
13% $1.7 Pre-Tax Income 0.7 pts 15.9% PTI Margin @CC Rptd 3Q11 0.6 pts 35.7% Gross Margin (External) 3% 9% $10.3 Revenue (External) B/(W) Yr/Yr Services Segments Global Technology Services (GTS) Global Business Services (GBS) Profit growth and margin expansion 3Q11 Revenues (% of Total Services) $ in Billions 13% $0.8 Pre-Tax Income 1.0 pts 15.4% PTI Margin @CC Rptd 3Q11 0.8 pts 29.4% Gross Margin (External) Flat 6% $4.8 Revenue (External) B/(W) Yr/Yr $ in Billions 3Q11 @CC Rptd GTS +$2B (1%) 5% (1%) 5% 3% +$2B Services Backlog $137B 4% Consulting & Systems Integration 11% GBS Outsourcing GBS Yr/Yr 3Q11 Revenue 5% Maintenance 11% Integrated Technology Services 9% GTS Outsourcing GTS Outsourcing 40% GBS C&SI 25% Maint. 12% ITS 16% GBS Outsourcing 7% |
|
|
Software Segment 12% $2.2 Pre-Tax Income @CC Rptd 3Q11 (0.2 pts) 33.4% PTI Margin 0.2 pts 88.1% Gross Margin (External) 8% 13% $5.8 Revenue (External) B/(W) Yr/Yr @CC Rptd 8% 8% 12% 3% 1% 3% 7% 46% 13% Total Software 13% Total Middleware 17% Key Branded Middleware 7% Rational 6% Lotus Yr/Yr 3Q11 Revenue 8% Tivoli 12% Information Management 52% WebSphere Family 3Q11 Revenue (% of Total Software) Key Branded Middleware 63% Operating Systems 10% Other Middleware 19% Other 8% $ in Billions Middleware share gains for 16th consecutive quarter |
|
|
Systems & Technology Segment 8% $0.3 Pre-Tax Income @CC Rptd 3Q11 0.3 pts 6.8% PTI Margin 3.4 pts 39.8% Gross Margin (External) 1% 4% $4.5 Revenue (External) B/(W) Yr/Yr $ in Billions 3Q11 Revenue (% of Total Sys & Tech) Servers 64% Storage 19% Micro OEM 14% RSS Yr/Yr 3Q11 Revenue 1% (6%) 2% 11% 5% (3%) 12% (7%) @CC 15% Power Systems 6% Total Systems 4% Total Systems & Technology (6%) Microelectronics OEM 14% Retail Store Solutions 8% Storage 1% System x Rptd (5%) System z Power Systems extend Unix leadership |
|
|
Cash Flow Analysis $2.5 0.1 (0.4) 0.3 (0.2) 0.0 2.8 0.0 (0.1) 0.1 (0.1) $0.0 B/(W) Yr/Yr ($0.3) $0.7 ($0.5) Change in Cash & Marketable Securities 5.2 1.1 (11.5) (2.6) 0.0 (0.2) 7.6 (3.0) 10.6 2.1 $12.7 YTD 3Q11 (1.5) 0.4 Other (includes GF A/R & GF Debt) (0.2) 0.1 Non-GF Debt 0.2 (3.4) Share Repurchases (0.1) (0.9) Dividends 0.0 0.0 Divestitures 1.9 (0.1) Acquisitions 0.3 3.5 Free Cash Flow (excluding GF Receivables) 0.0 (1.0) Net Capital Expenditures B/(W) Yr/Yr 3Q11 0.3 4.5 Net Cash from Operations (excluding GF Receivables) (0.2) 0.2 Less: Global Financing Receivables $0.1 $4.7 Net Cash from Operations $ in Billions |
|
|
7.1 28% 22.4 87.8 30.2 22.8 7.4 57.6 110.2 31.4 67.5 $11.3 Sept. 11 7.0 23% 23.2 90.3 28.6 22.8 5.8 61.7 113.5 34.5 67.3 $11.7 Dec. 10 22.4 Equity 84.8 Total Liabilities 27.5 Total Debt 22.0 Global Financing Debt 5.5 Non-GF Debt* 7.1 Global Financing Leverage 22% 57.4 107.2 30.4 65.7 $11.1 Sept. 10 Non-GF Debt / Capital Other Liabilities Total Assets Global Financing Assets Non-GF Assets* Cash & Marketable Securities Balance Sheet Summary $ in Billions * Includes eliminations of inter-company activity |
|
|
3Q10 Operating EPS Revenue Growth @ Actual Margin Expansion Share Repurchases 3Q11 Operating EPS Operating EPS Bridge – 3Q10 to 3Q11 Tax (0.03) Gross Margin 0.23 Expense E/R (0.17) $0.22 $0.03 $0.18 $2.85 $3.28 |

|
|
3Q 2011 Summary Increasing 2011 Operating (Non-GAAP) EPS expectations to at least $13.35 Continued strength in growth initiatives Growth markets YTD revenue up 20% yr/yr, 13% @CC, more than half of IBM’s revenue growth @CC Business analytics YTD revenue up 19% yr/yr Cloud YTD revenue doubled full year 2010 revenue Smarter Planet YTD revenue up ~50% yr/yr Expanded operating gross, pre-tax and net income margins Leveraging cash generation to return value to shareholders 2010 2015 $11.67 At least $20 Operating EPS |
|
|
[LOGO] |

|
|
Supplemental Materials Currency – Year/Year Comparison Supplemental Segment Information – Global Services Supplemental Segment Information – Systems & Technology, Software Global Financing Portfolio Revenue by Key Industry Sales Unit Cash Flow (FAS 95) Non-GAAP Supplementary Materials Operating (Non-GAAP) Earnings Per Share and Related Income Statement Items, Constant Currency Cash Flow, Debt-to-Capital Ratio, Income Tax Settlement Reconciliation of Operating Earnings Per Share GAAP to Operating (Non-GAAP) Bridge – 3Q 2011 GAAP to Operating (Non-GAAP) Bridge – 3Q 2010 GAAP to Operating (Non-GAAP) Bridge – YTD GAAP to Operating (Non-GAAP) Bridge – 3Q 2011 GAAP to Operating (Non-GAAP) Bridge – 3Q 2010 GAAP to Operating (Non-GAAP) Bridge – YTD 3Q 2011 GAAP to Operating (Non-GAAP) Bridge – YTD 3Q 2010 Reconciliation of Free Cash Flow (excluding GF Receivables) Reconciliation of Revenue Growth Rates – Geographies Reconciliation of B/(W) Yr/Yr Expense Drivers Reconciliation of Debt-to-Capital Ratio Reconciliation of Operating EPS Bridge 3Q10 to 3Q11 Some columns and rows in these materials, including the supplemental exhibits, may not add due to rounding Supplemental Materials |
|
|
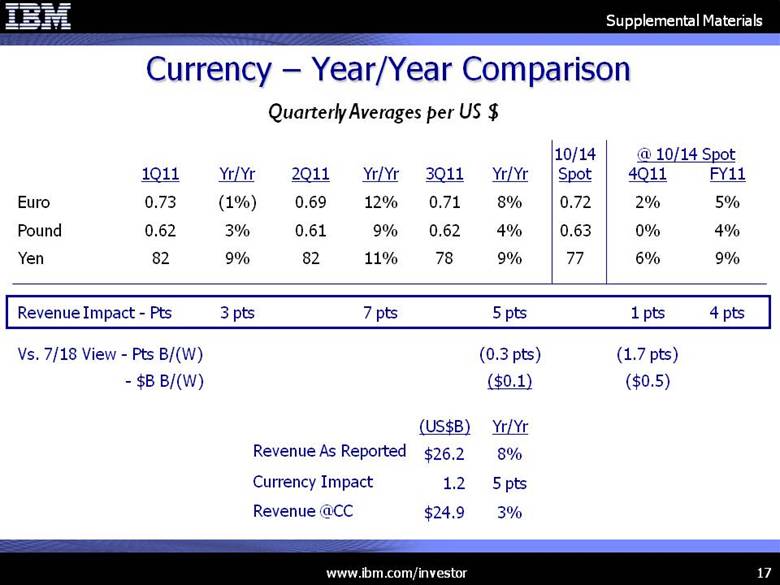
Currency – Year/Year Comparison (1.7 pts) (0.3 pts) Vs. 7/18 View - Pts B/(W) ($0.5) ($0.1) - $B B/(W) 5 pts 1.2 8% $26.2 77 0.63 0.72 10/14 Spot 3% Yr/Yr 5 pts 9% 4% 8% Yr/Yr 82 0.61 0.69 2Q11 7 pts 11% 9% 12% Yr/Yr (US$B) $24.9 4 pts 9% 4% 5% FY11 78 0.62 0.71 3Q11 1 pts 6% 0% 2% 4Q11 3 pts 9% 3% (1%) Yr/Yr 1Q11 Revenue Impact - Pts 82 Yen 0.62 Pound 0.73 Euro @ 10/14 Spot Quarterly Averages per US $ Revenue As Reported Currency Impact Revenue @CC Supplemental Materials |
|
|
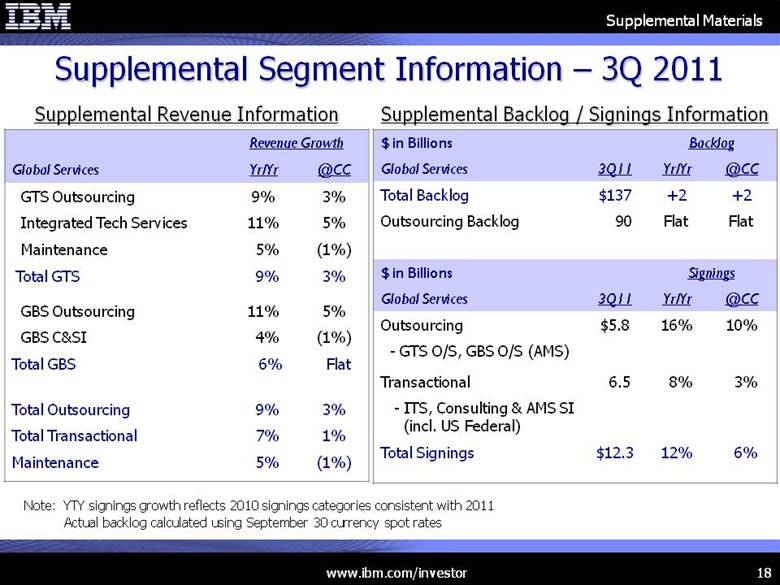
Supplemental Segment Information – 3Q 2011 10% 16% $5.8 Outsourcing - GTS O/S, GBS O/S (AMS) 3% 8% 6.5 Transactional - ITS, Consulting & AMS SI (incl. US Federal) 6% 12% $12.3 Total Signings Backlog $ in Billions @CC Yr/Yr 3Q11 Global Services +2 +2 $137 Total Backlog Flat Flat 90 Outsourcing Backlog Signings $ in Billions @CC Yr/Yr 3Q11 Global Services Note: YTY signings growth reflects 2010 signings categories consistent with 2011 Actual backlog calculated using September 30 currency spot rates 3% 9% Total GTS (1%) 5% Maintenance Flat 6% Total GBS (1%) 5% Maintenance 5% 11% Integrated Tech Services (1%) 4% GBS C&SI 3% 9% Total Outsourcing @CC Yr/Yr Global Services 1% 7% Total Transactional Revenue Growth 5% 11% GBS Outsourcing 3% 9% GTS Outsourcing Supplemental Revenue Information Supplemental Backlog / Signings Information Supplemental Materials |
|
|
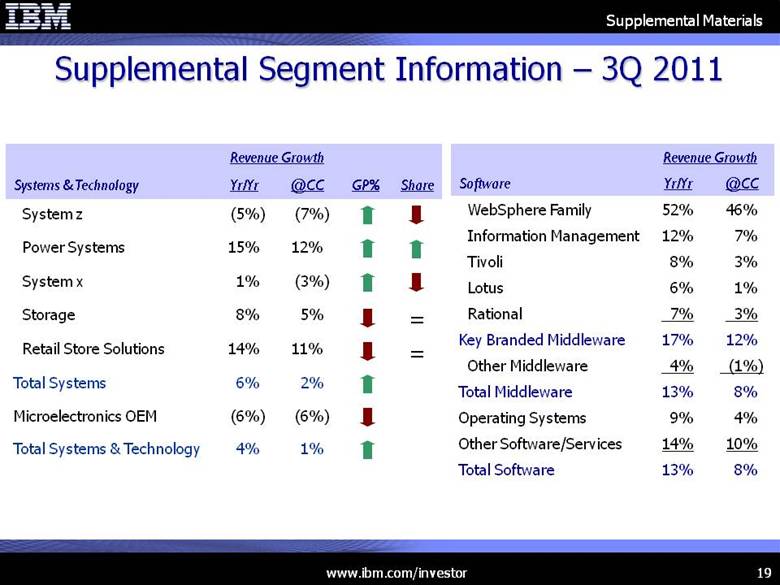
Supplemental Segment Information – 3Q 2011 Share GP% @CC Yr/Yr Systems & Technology 1% (6%) 2% 11% 5% (3%) 12% (7%) = = 4% Total Systems & Technology (6%) Microelectronics OEM 6% Total Systems 14% Retail Store Solutions 8% Storage 1% System x Revenue Growth 15% Power Systems (5%) System z Revenue Growth 8% 13% Total Software 10% 14% Other Software/Services 4% 9% Operating Systems 8% 13% Total Middleware (1%) 4% Other Middleware 12% 17% Key Branded Middleware 3% 7% Rational 1% 6% Lotus @CC Yr/Yr Software 3% 8% Tivoli 7% 12% Information Management 46% 52% WebSphere Family Supplemental Materials |
|
|
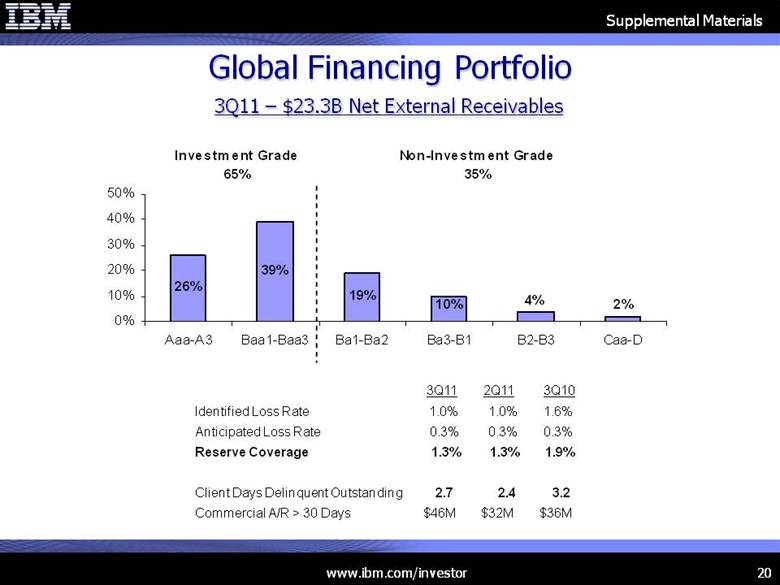
20 Global Financing Portfolio 3Q11 – $23.3B Net External Receivables 3Q11 2Q11 3Q10 Identified Loss Rate 1.0% 1.0% 1.6% Anticipated Loss Rate 0.3% 0.3% 0.3% Reserve Coverage 1.3% 1.3% 1.9% Client Days Delinquent Outstanding 2.7 2.4 3.2 Commercial A/R > 30 Days $46M $32M $36M Supplemental Materials 26% 39% 19% 10% 4% 2% 0% 10% 20% 30% 40% 50% Aaa-A3 Baa1-Baa3 Ba1-Ba2 Ba3-B1 B2-B3 Caa-D Investment Grade 65% Non-Investment Grade 35% |
|
|
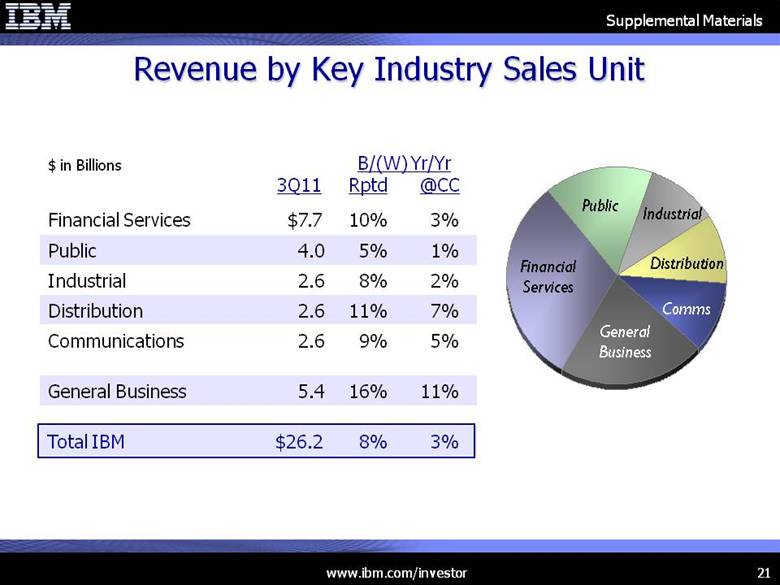
3% 8% $26.2 Total IBM 11% 16% 5.4 General Business 3Q11 5% 9% 2.6 Communications 7% 11% 2.6 Distribution 2% 8% 2.6 Industrial 1% 5% 4.0 Public 3% 10% $7.7 Financial Services B/(W) Yr/Yr Rptd @CC Revenue by Key Industry Sales Unit $ in Billions General Business Comms Distribution Industrial Public Financial Services Supplemental Materials |
|
|
Cash Flow (FAS 95) $0.6 (0.3) (10.9) 2.0 (11.5) (2.6) 1.1 (0.9) 2.3 (0.2) 0.0 (3.0) 12.7 2.1 (3.9) 0.5 3.6 $10.4 YTD 3Q11 ($0.4) (0.6) (3.7) 0.5 (3.4) (0.9) 0.2 (0.8) 0.2 (0.1) 0.0 (1.0) 4.7 0.2 (0.7) 0.2 1.2 $3.8 QTD 3Q11 ($2.3) (0.1) (10.6) 2.6 (11.8) (2.4) 0.9 (4.4) 1.4 (3.0) 0.0 (2.9) 12.8 2.3 (3.1) 0.5 3.6 $9.6 YTD 3Q10 ($0.5) 0.2 (3.5) 0.8 (3.7) (0.8) 0.2 (1.8) 1.2 (2.0) 0.0 (1.0) 4.6 0.4 (0.8) 0.2 1.2 $3.6 QTD 3Q10 Net Change in Cash & Cash Equivalents Working Capital / Other Effect of Exchange Rate changes on Cash Net Cash used in Financing Activities Common Stock Transactions - Other Common Stock Repurchases Dividends Debt, net of payments & proceeds Net Cash used in Investing Activities Marketable Securities / Other Investments, net Acquisitions, net of cash acquired Divestitures, net of cash transferred Capital Expenditures, net of payments & proceeds Net Cash provided by Operating Activities Global Financing A/R Stock-based Compensation Depreciation / Amortization of Intangibles Net Income from Operations $ in Billions Supplemental Materials |
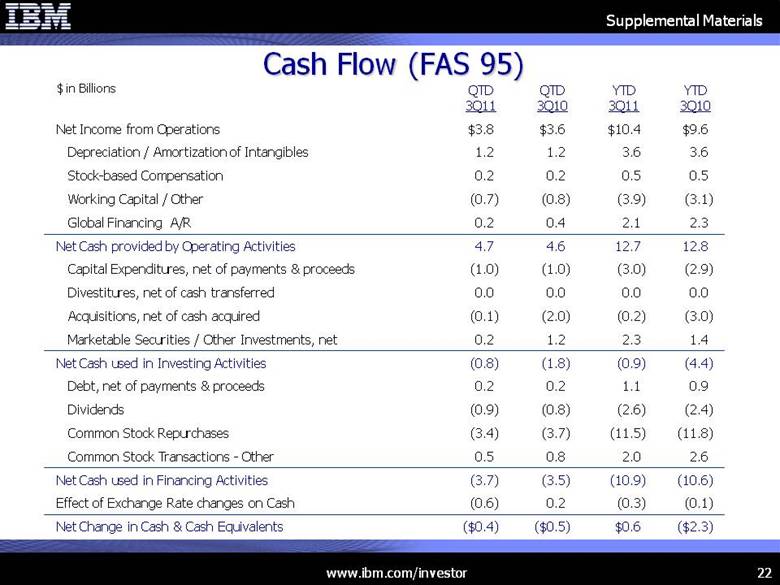
|
|
Non-GAAP Supplementary Materials In an effort to provide investors with additional information regarding the company's results as determined by generally accepted accounting principles (GAAP), the company also discusses, in its earnings press release and earnings presentation materials, the following Non-GAAP information which management believes provides useful information to investors. Operating (Non-GAAP) Earnings Per Share and Related Income Statement Items Management presents certain financial measures excluding the effects of certain acquisition-related charges, non-operating retirement-related costs, and any related tax impacts. Management uses the term "operating" to describe this view of the company's financial results and other financial information. For acquisitions, these measures exclude the amortization of purchased intangible assets and acquisition-related charges such as in-process research and development, transaction costs, applicable restructuring and related expenses, and tax charges related to acquisition integration. For retirement-related costs, the company has characterized certain items as operating and others as non-operating. The company includes service cost, amortization of prior service cost and the cost of defined contribution plans in its operating results. Non-operating retirement-related costs include interest cost, expected return on plan assets, amortized actuarial gains/losses, the impacts of any plan curtailments/settlements, multi-employer plan costs, pension insolvency costs, and other costs. Non-operating costs primarily relate to changes in pension plan assets and liabilities which are tied to market performance, and management considers these costs to be outside the operational performance of the business. Management’s calculation of these operating measures, as presented, may differ from similarly titled measures reported by other companies. Overall, management believes that providing investors with an operating view as described above provides increased transparency and clarity into both the operational results of the business and the performance of the company’s pension plans, improves visibility to management decisions and their impacts on operational performance, enables better comparison to peer companies, and allows the company to provide a long term strategic view of the business going forward. For the 2015 earnings per share roadmap, the company is utilizing an operating view to establish its objectives and track its progress. Effective January 1, 2011, the company’s segment financial results and performance reflect operating earnings, consistent with the company’s management and measurement system. Constant Currency Management refers to growth rates at constant currency or adjusting for currency so that certain financial results can be viewed without the impact of fluctuations in foreign currency exchange rates, thereby facilitating period-to-period comparisons of the company's business performance. Financial results adjusted for currency are calculated by translating current period activity in local currency using the comparable prior year period’s currency conversion rate. This approach is used for countries where the functional currency is the local currency. Generally, when the dollar either strengthens or weakens against other currencies, the growth at constant currency rates or adjusting for currency will be higher or lower than growth reported at actual exchange rates. Supplemental Materials |
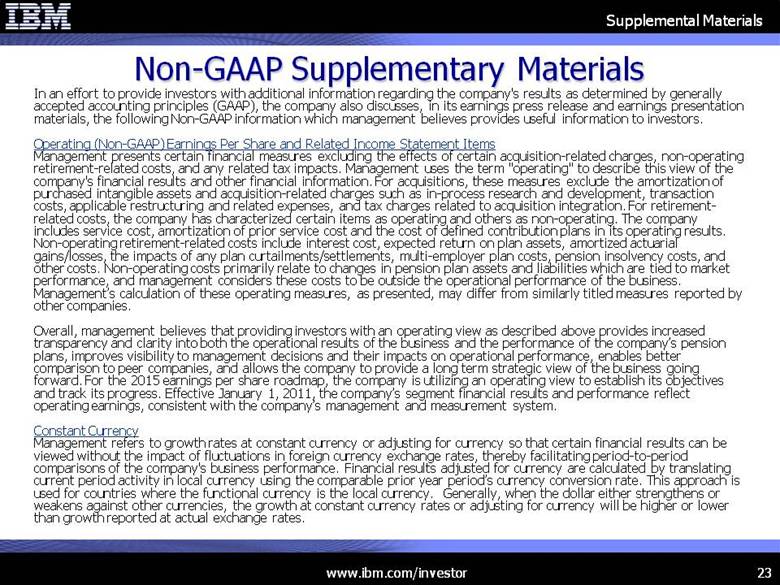
|
|
Non-GAAP Supplementary Materials Cash Flow Management uses a free cash flow measure to evaluate the company’s operating results, plan share repurchase levels, evaluate strategic investments and assess the company’s ability and need to incur and service debt. The entire free cash flow amount is not necessarily available for discretionary expenditures. The company defines free cash flow as net cash from operating activities less the change in Global Financing receivables and net capital expenditures, including the investment in software. A key objective of the Global Financing business is to generate strong returns on equity, and increasing receivables is the basis for growth. Accordingly, management considers Global Financing receivables as a profit-generating investment, not as working capital that should be minimized for efficiency. Therefore, management includes presentations of both free cash flow and cash flow from operations that exclude the effect of Global Financing receivables. Debt-to-Capital Ratio Management presents its debt-to-capital ratio excluding the Global Financing business. A financing business is managed on a leveraged basis. The company funds its Global Financing segment using a debt-to-equity ratio target of approximately 7 to 1. Given this significant leverage, the company presents a debt-to-capital ratio which excludes the Global Financing segment debt and equity because the company believes this is more representative of the company’s core business operations. Income Tax Settlement Management presents free cash flow excluding the effects of certain income tax settlement payments. Management believes that presenting free cash flow without this item is more representative of the company’s operational performance and provides additional insight into, and clarifies the basis for, historical and/or future performance, which may be more useful for investors. Supplemental Materials |
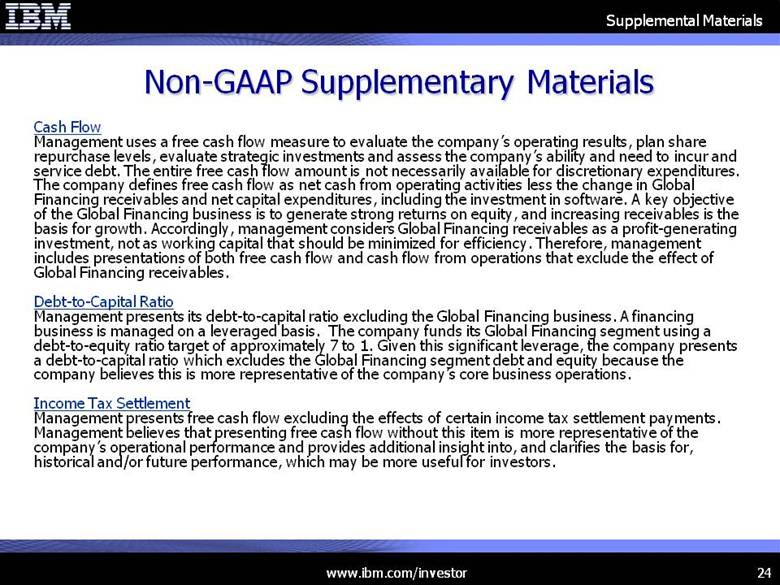
|
|
Non-GAAP Supplementary Materials Reconciliation of Operating Earnings Per Share IBM Operating EPS (Non-GAAP) Acquisition-Related Charges * Amortization of Purchased Intangibles Other Acquisition-Related Charges Non-Operating Retirement-Related Items IBM GAAP EPS Adjustments 2011 Expectations $12.95+ $13.35+ $0.42 $0.39 $0.03 ($0.02) * Includes acquisitions closed as of 9/30/2011 The above serves to reconcile the Non-GAAP financial information contained in the “3Q 2011 Highlights” and “3Q 2011 Summary” discussion in the company’s earnings presentation. See Slide 23 of this presentation for additional information on the use of these Non-GAAP financial measures. Supplemental Materials |
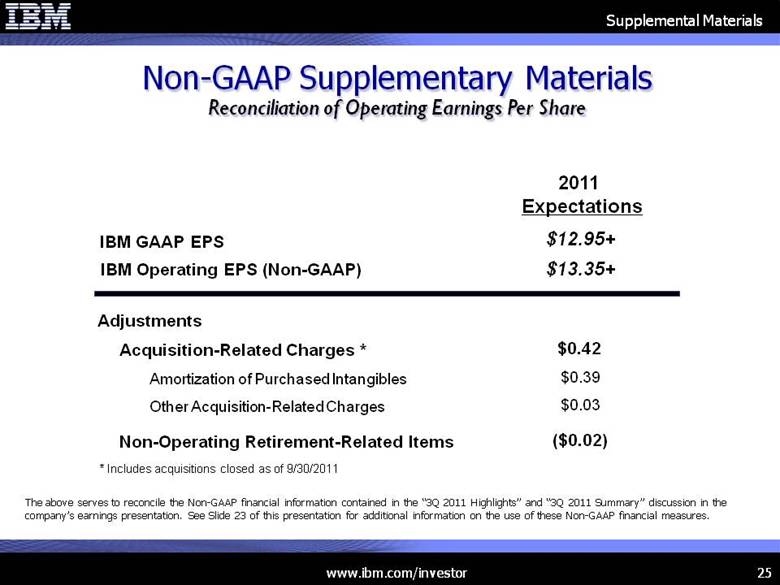
|
|
Non-GAAP Supplementary Materials GAAP to Operating (Non-GAAP) Bridge – 3Q 2011 111 0 (18) 128 Other Income & Expense 7,075 21 (92) 7,146 Total Operating Expense & Other Income 1,224 (11) 47 1,188 Tax *** $3.28 ($0.01) $0.11 $3.19 Diluted Earnings Per Share 3,954 (17) 133 3,839 Net Income 5,178 (29) 180 5,027 Pre-Tax Income 1,568 22 0 1,546 RD&E 5,587 0 (75) 5,662 SG&A $12,253 ($7) $87 $12,173 Gross Profit Operating (Non-GAAP) Retirement-related Adjustments** Acquisition-related Adjustments* GAAP $ in Millions, except EPS * Includes amortization of purchased intangibles, in process R&D, severance cost for acquired employees, vacant space for acquired companies, and deal costs ** Includes retirement related interest cost, expected return on plan assets, recognized actuarial losses or gains, amortization of transition assets, other settlements, curtailments, multi-employer plans and insolvency insurance ***The tax impact on the Operating (Non-GAAP) Pre-Tax Income is calculated under the same accounting principles applied to the As Reported Pre-Tax Income under ASC 740, which employs an annual effective tax rate method to the results. The above serves to reconcile the Non-GAAP financial information contained in the “3Q 2011 Highlights,” “Key Financial Metrics” and “Expense Summary” discussion in the company’s earnings presentation. See Slide 23 of this presentation for additional information on the use of these Non-GAAP financial measures. Supplemental Materials |
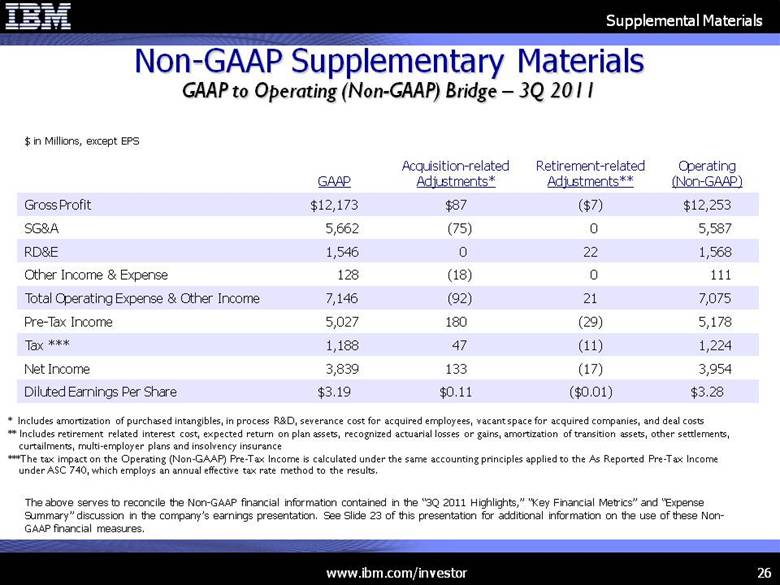
|
|
Non-GAAP Supplementary Materials GAAP to Operating (Non-GAAP) Bridge – 3Q 2010 (105) 0 1 (106) Other Income & Expense 6,301 51 (75) 6,324 Total Operating Expense & Other Income 1,084 (38) 34 1,088 Tax *** $2.85 ($0.05) $0.08 $2.82 Diluted Earnings Per Share 3,628 (66) 105 3,589 Net Income 4,712 (104) 139 4,677 Pre-Tax Income 1,495 31 0 1,464 RD&E 5,094 20 (76) 5,149 SG&A $11,013 ($53) $65 $11,001 Gross Profit Operating (Non-GAAP) Retirement-related Adjustments** Acquisition-related Adjustments* GAAP $ in Millions, except EPS * Includes amortization of purchased Intangibles, in process R&D, severance cost for acquired employees, vacant space for acquired companies, and deal costs ** Includes retirement related interest cost, expected return on plan assets, recognized actuarial losses or gains, amortization of transition assets, other settlements, curtailments, multi-employer plans and insolvency insurance ***The tax impact on the Operating (Non-GAAP) Pre-Tax Income is calculated under the same accounting principles applied to the As Reported Pre-Tax Income under ASC 740, which employs an annual effective tax rate method to the results. The above serves to reconcile the Non-GAAP financial information contained in the “3Q 2011 Highlights,” “Key Financial Metrics” and “Expense Summary” discussion in the company’s earnings presentation. See Slide 23 of this presentation for additional information on the use of these Non-GAAP financial measures. Supplemental Materials |
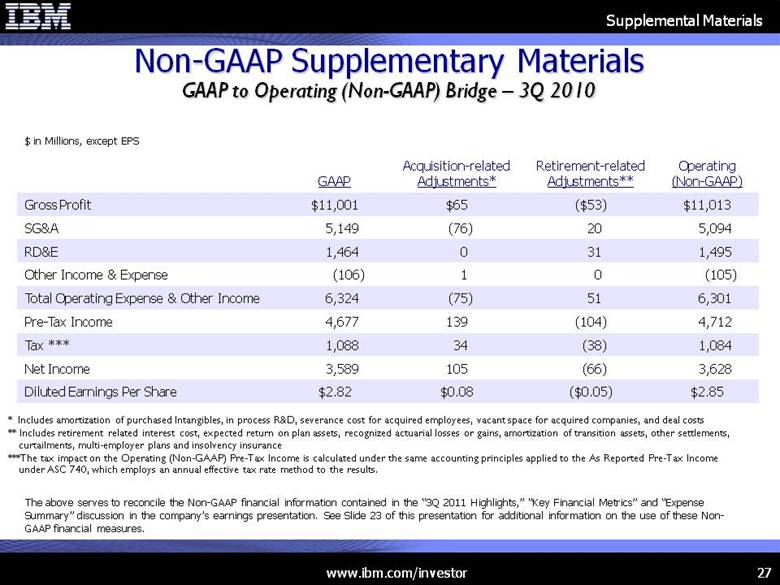
|
|
Non-GAAP Supplementary Materials GAAP to Operating (Non-GAAP) Bridge – YTD 18,968 149 (200) 19,019 Total Operating Expense & Other Income 21,487 49 (249) 21,687 Total Operating Expense & Other Income $7.45 ($0.14) $0.21 $7.38 Diluted Earnings Per Share 9,669 (179) 272 9,576 Net Income 12,853 (293) 378 12,767 Pre-Tax Income $8.77 ($0.02) $0.31 $8.48 Diluted Earnings Per Share YTD 3Q 2010 YTD 3Q 2011 14,200 (37) 508 13,729 Pre-Tax Income 10,721 (20) 376 10,365 Net Income Operating (Non-GAAP) Retirement-related Adjustments** Acquisition-related Adjustments* GAAP $ in Millions, except EPS * Includes amortization of purchased Intangibles, in process R&D, severance cost for acquired employees, vacant space for acquired companies, and deal costs ** Includes retirement related interest cost, expected return on plan assets, recognized actuarial losses or gains, amortization of transition assets, other settlements, curtailments, multi-employer plans and insolvency insurance The above serves to reconcile the Non-GAAP financial information contained in the “3Q 2011 Summary” discussion in the company’s earnings presentation. See Slide 23 of this presentation for additional information on the use of these Non-GAAP financial measures. Supplemental Materials |
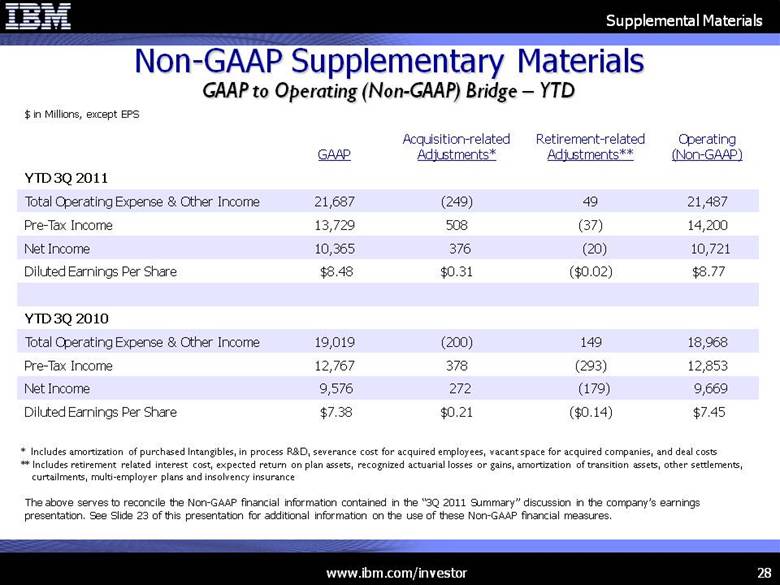
|
|
15.1% (0.1) pts 0.5 pts 14.7 % Net Income Margin 23.6% (0.1) pts 0.1 pts 23.6% Tax Rate *** 19.8% (0.1) pts 0.7 pts 19.2% PTI Margin 46.8% 0.0 pts 0.3 pts 46.5% Gross Profit Margin Operating (Non-GAAP) Retirement-related ** adjustments Acquisition- related * adjustments GAAP * Includes Amortization of Purchased Intangibles, In Process R&D, Severance Cost for Acquired employees, vacant space for acquired companies, deal costs ** Includes Retirement Related Interest Cost, Expected ROA, Recognized actuarial losses or gains, amortization of transition assets, other settlements, curtailments, multi-employer plans and insolvency insurance *** The tax impact on the Operating (Non-GAAP) Pre-Tax Income is calculated under the same accounting principles applied to the As Reported Pre-Tax Income under ASC 740, which employs an annual effective tax rate method to the results. Non-GAAP Supplementary Materials GAAP to Operating (Non-GAAP) Bridge -- 3Q 2011 The above serves to reconcile the Non-GAAP financial information contained in the “Key Financial Metrics” and “3Q 2011 Summary” discussion in the company’s earnings presentation. See Slide 23 of this presentation for additional information on the use of these Non-GAAP financial measures. Supplemental Materials |
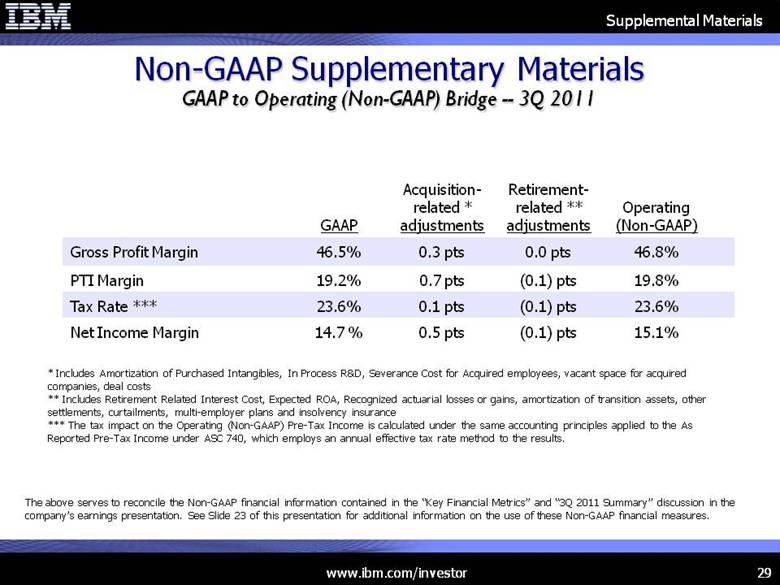
|
|
14.9 % (0.3) pts 0.4 pts 14.8 % Net Income Margin 23.0 % (0.3) pts 0.0 pts 23.3 % Tax Rate *** 19.4 % (0.4) pts 0.6 pts 19.3% PTI Margin 45.4 % (0.2) pts 0.3 pts 45.3% Gross Profit Margin Operating (Non-GAAP) Retirement-related ** adjustments Acquisition- related * adjustments GAAP * Includes Amortization of Purchased Intangibles, In Process R&D, Severance Cost for Acquired employees, vacant space for acquired companies, deal costs ** Includes Retirement Related Interest Cost, Expected ROA, Recognized actuarial losses or gains, amortization of transition assets, other settlements, curtailments, multi-employer plans and insolvency insurance *** The tax impact on the Operating (Non-GAAP) Pre-Tax Income is calculated under the same accounting principles applied to the As Reported Pre-Tax Income under ASC 740, which employs an annual effective tax rate method to the results. Non-GAAP Supplementary Materials GAAP to Operating (Non-GAAP) Bridge -- 3Q 2010 The above serves to reconcile the Non-GAAP financial information contained in the “Key Financial Metrics” and “3Q 2011 Summary” discussion in the company’s earnings presentation. See Slide 23 of this presentation for additional information on the use of these Non-GAAP financial measures. Supplemental Materials |
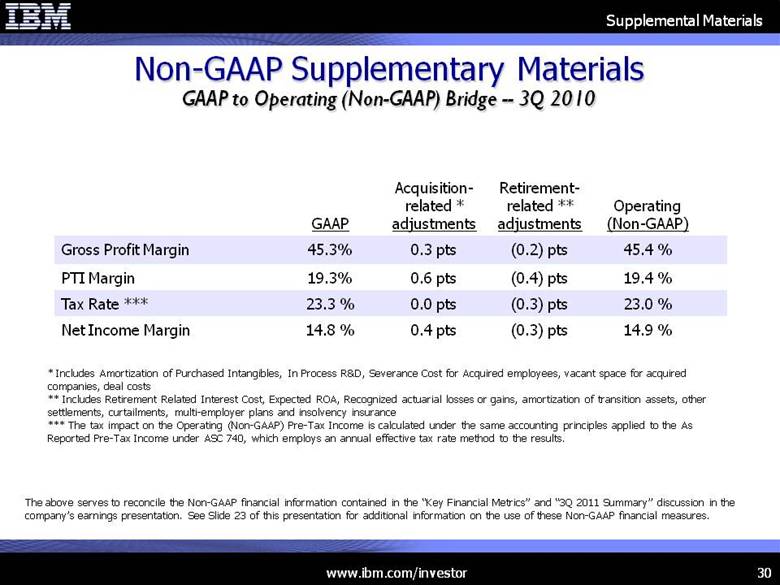
|
|
13.8% 0.0 pts 0.5 pts 13.4 % Net Income Margin 24.5 % (0.1) pts 0.1 pts 24.5 % Tax Rate *** 18.3 % 0.0 pts 0.7 pts 17.7% PTI Margin 46.1 % 0.0 pts 0.3 pts 45.7% Gross Profit Margin Operating (Non-GAAP) Retirement-related ** adjustments Acquisition- related * adjustments GAAP * Includes Amortization of Purchased Intangibles, In Process R&D, Severance Cost for Acquired employees, vacant space for acquired companies, deal costs ** Includes Retirement Related Interest Cost, Expected ROA, Recognized actuarial losses or gains, amortization of transition assets, other settlements, curtailments, multi-employer plans and insolvency insurance *** The tax impact on the Operating (Non-GAAP) Pre-Tax Income is calculated under the same accounting principles applied to the As Reported Pre-Tax Income under ASC 740, which employs an annual effective tax rate method to the results. Non-GAAP Supplementary Materials GAAP to Operating (Non-GAAP) Bridge – YTD 3Q 2011 The above serves to reconcile the Non-GAAP financial information contained in the “3Q 2011 Summary” discussion in the company’s earnings presentation. See Slide 23 of this presentation for additional information on the use of these Non-GAAP financial measures. Supplemental Materials |
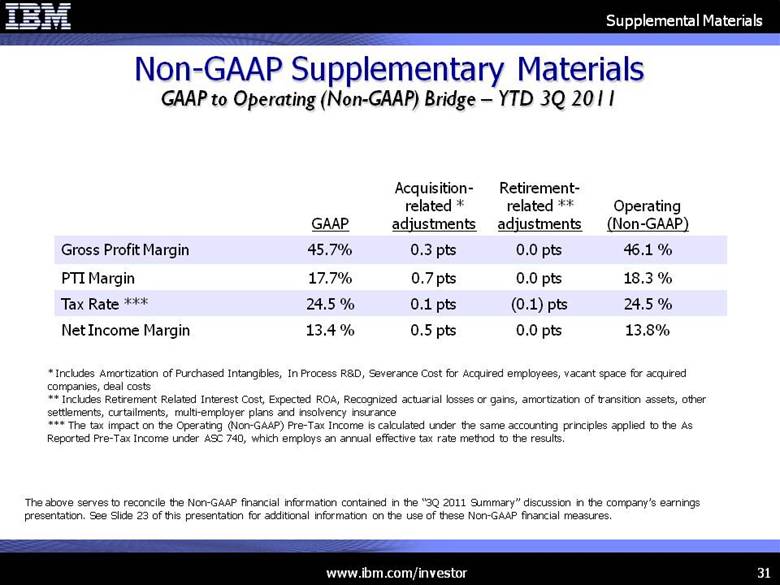
|
|
13.6 % (0.3) pts 0.4 pts 13.5 % Net Income Margin 24.8 % (0.3) pts 0.1 pts 25.0 % Tax Rate *** 18.1 % (0.4) pts 0.5 pts 18.0% PTI Margin 44.9 % (0.2) pts 0.3 pts 44.9% Gross Profit Margin Operating (Non-GAAP) Retirement-related ** adjustments Acquisition- related * adjustments GAAP * Includes Amortization of Purchased Intangibles, In Process R&D, Severance Cost for Acquired employees, vacant space for acquired companies, deal costs ** Includes Retirement Related Interest Cost, Expected ROA, Recognized actuarial losses or gains, amortization of transition assets, other settlements, curtailments, multi-employer plans and insolvency insurance *** The tax impact on the Operating (Non-GAAP) Pre-Tax Income is calculated under the same accounting principles applied to the As Reported Pre-Tax Income under ASC 740, which employs an annual effective tax rate method to the results. Non-GAAP Supplementary Materials GAAP to Operating (Non-GAAP) Bridge – YTD 3Q 2010 The above serves to reconcile the Non-GAAP financial information contained in the “3Q 2011 Summary” discussion in the company’s earnings presentation. See Slide 23 of this presentation for additional information on the use of these Non-GAAP financial measures. Supplemental Materials |

|
|
Non-GAAP Supplementary Materials $16.3 Free Cash Flow (excluding GF Receivables) (4.1) Net Capital Expenditures 12 months ended 9/30/11 20.4 Net Cash from Operations (excluding GF Receivables) (0.9) Less: Global Financing Receivables $19.5 Net Cash from Operations $ in Billions Reconciliation of Free Cash Flow (excluding GF Receivables) The above serves to reconcile the Non-GAAP financial information contained in the “Key Financial Metrics” discussion in the company’s earnings presentation. See Slide 24 of this presentation for additional information on the use of these Non-GAAP financial measures. Supplemental Materials |
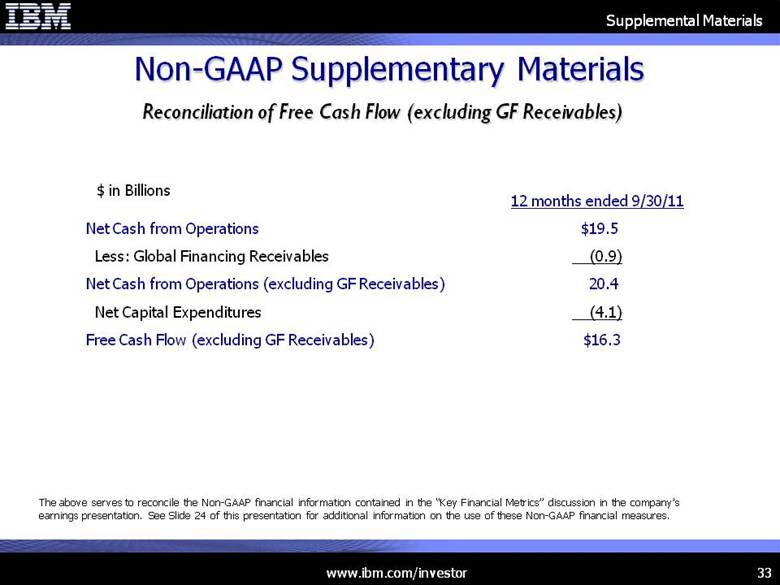
|
|
Non-GAAP Supplementary Materials Reconciliation of Revenue Growth @CC As Rptd 7% 9% 5% (10%) 10% 12% 15% 14% 19% 9% (0%) 20% 16% 21% Canada Spain UK Japan Growth Markets GTS Outsourcing Systems & Technology System x 3Q11 Yr/Yr The above serves to reconcile the Non-GAAP financial information contained in the "Revenue by Geography,” “Services Segments,” and “Systems & Technology Segment” discussion in the company’s earnings presentation. See Slide 23 of this presentation for additional information on the use of these Non-GAAP financial measures. Supplemental Materials |
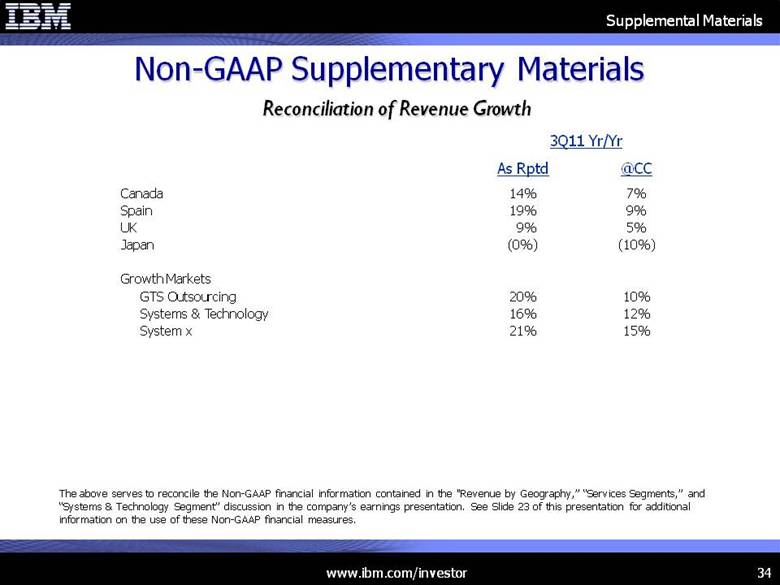
|
|
(2 pts) 0 pts (2 pts) Currency (4 pts) 0 pts (4 pts) Acquisitions 2 pts 1 pt 1 pts Base Operating Expense & Other Income (7 pts) 0 pts (7 pts) Currency (3 pts) 0 pts (3 pts) Acquisitions SG&A (5 pts) 0 pts (5 pts) Currency (2 pts) 0 pts (3 pts) Acquisitions (3 pts) 0 pts (2 pts) Base RD&E (2 pts) 0 pts (2 pts) Base Operating (Non-GAAP) Non-GAAP Adjustments GAAP Non-GAAP Supplementary Materials Reconciliation of B/(W) Yr/Yr Expense Drivers The above serves to reconcile the Non-GAAP financial information contained in the “Expense Summary” discussion in the company’s earnings presentation. See Slide 23 of this presentation for additional information on the use of these Non-GAAP financial measures. Supplemental Materials |
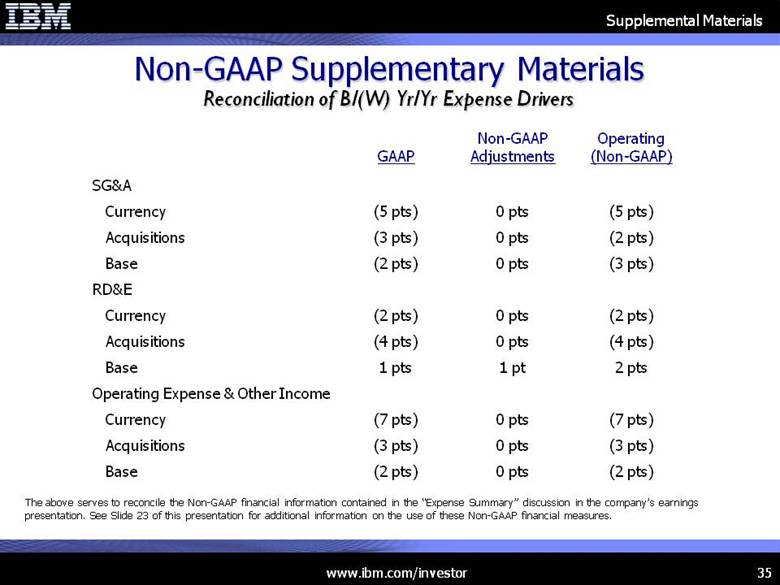
|
|
Reconciliation of Debt-to-Capital Ratio 22% 55% 3Q10 23% 55% FY10 3Q11 28% 57% Non-Global Financing Debt / Capital IBM Consolidated Debt / Capital The above serves to reconcile the Non-GAAP financial information contained in the “Balance Sheet Summary” discussion regarding the non-Global Financing debt-to-capital ratio in the company’s earnings presentation. See Slide 24 of this presentation for additional information on the use of these Non-GAAP financial measures. Non-GAAP Supplementary Materials Supplemental Materials |
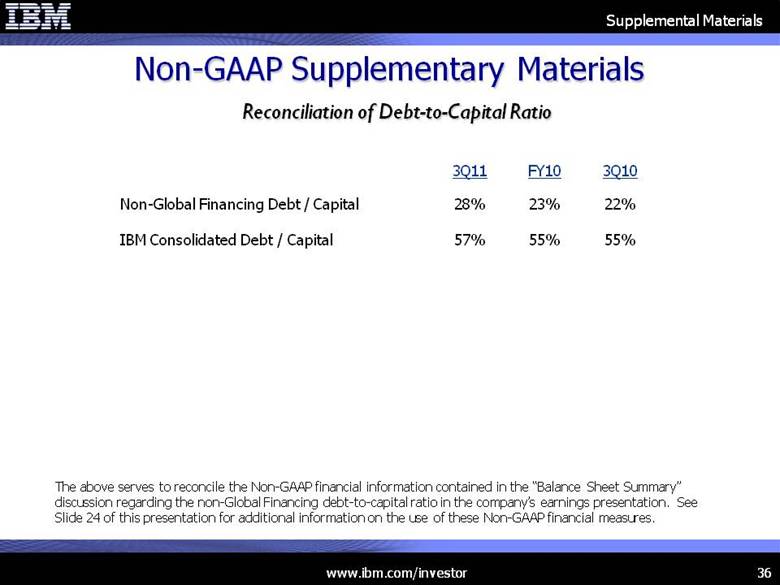
|
|
* Includes amortization of purchased intangibles, in process R&D, severance cost for acquired employees, vacant space for acquired companies, deal costs ** Includes retirement related interest cost, expected return on plan assets, recognized actuarial losses or gains, amortization of transition assets, other settlements, curtailments, multi-employer plans and insolvency insurance Non-GAAP Supplementary Materials Reconciliation of Operating EPS Bridge 3Q10 to 3Q11 The above serves to reconcile the Non-GAAP financial information contained in the “Operating EPS Bridge – 3Q10 to 3Q11” discussion in the company’s earnings presentation. See Slide 23 of this presentation for additional information on the use of these Non-GAAP financial measures. $3.28 ($0.01) $0.11 $3.19 3Q11 EPS 0.18 0.00 0.01 0.17 Share repurchases 0.23 (0.17) (0.03) 0.04 0.02 (0.01) 0.01 0.01 (0.01) 0.19 (0.20) (0.01) Margin expansion Gross Margin Expense Tax 0.22 (0.01) 0.01 0.22 Revenue growth @ actual $2.85 ($0.05) $0.08 $2.82 3Q10 EPS Operating (Non-GAAP) Retirement-related Adjustments** Acquisition- related Adjustments* GAAP Supplemental Materials |
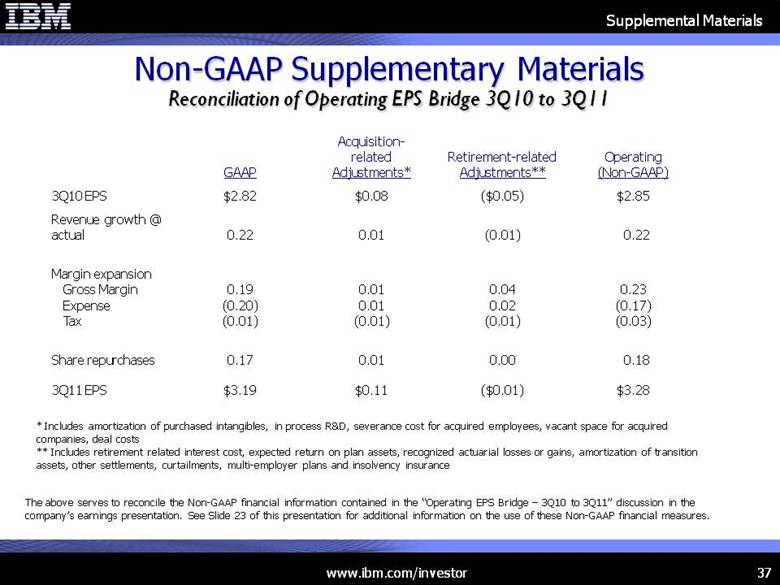
|
|
[LOGO] |