Attached files
| file | filename |
|---|---|
| 8-K - FORM 8-K - FIRST HORIZON CORP | d244230d8k.htm |
Table of Contents
Exhibit 99.1

THIRD QUARTER 2011
FINANCIAL SUPPLEMENT
If you need further information, please contact:
Aarti Bowman, Investor Relations
901-523-4017
aagoorha@firsthorizon.com
Table of Contents
| TABLE OF CONTENTS |

|
| Page | ||||||
| 3 | ||||||
| 4 | ||||||
| Charges for Restructuring, Repositioning, & Efficiency Initiatives |
6 | |||||
| Consolidated Results |
||||||
| Income Statement |
||||||
| 7 | ||||||
| 8 | ||||||
| 9 | ||||||
| Balance Sheet |
||||||
| 10 | ||||||
| 11 | ||||||
| 12 | ||||||
| 13 | ||||||
| 14 | ||||||
| Business Segment Detail |
||||||
| 15 | ||||||
| 16 | ||||||
| 17 | ||||||
| 18 | ||||||
| 19 | ||||||
| 20 | ||||||
| 21 | ||||||
| Asset Quality |
||||||
| 22 | ||||||
| 24 | ||||||
| 25 | ||||||
| 26 | ||||||
| 27 | ||||||
| 28 | ||||||
| 29 | ||||||
Other Information
This financial supplement contains forward-looking statements involving significant risks and uncertainties. A number of important factors could cause actual results to differ materially from those in the forward-looking information. Those factors include general economic and financial market conditions, including expectations of and actual timing and amount of interest rate movements including the slope of the yield curve, competition, customer and investor responses to these conditions, ability to execute business plans, geopolitical developments, recent and future legislative and regulatory developments, natural disasters, and items mentioned in this financial supplement and in First Horizon National Corporation’s (FHN) most recent press release, as well as critical accounting estimates and other factors described in FHN’s recent filings with the SEC. FHN disclaims any obligation to update any such factors or to publicly announce the result of any revisions to any of the forward-looking statements included herein or therein to reflect future events or developments.
Use of Non-GAAP Measures
Certain ratios are included in this financial supplement that are non-GAAP, meaning they are not presented in accordance with generally accepted accounting principles (GAAP) in the U.S. FHN’s management believes such ratios are relevant to understanding the capital position and results of the Company. The non-GAAP ratios presented in this financial supplement are tangible common equity to tangible assets, tangible book value per common share, tier 1 common to risk weighted assets, adjusted tangible common equity to risk weighted assets, and net interest margin adjusted for fully taxable equivalent (“FTE”). These ratios are reported to FHN’s management and Board of Directors through various internal reports. Additionally, disclosure of non-GAAP capital ratios provides a meaningful base for comparability to other financial institutions as the capital ratios have become an important measure of the capital strength of banks as demonstrated by the inclusion in the stress tests administered by the United States Treasury Department under the Capital Assistance Program. Non-GAAP measures are not formally defined by GAAP or codified in the federal banking regulations, and other entities may use calculation methods that differ from those used by FHN. Tier 1 capital is a regulatory term and is generally defined as the sum of core capital (including common equity and instruments that can not be redeemed at the option of the holder) adjusted for certain items under risk based capital regulations. Also a regulatory term, risk weighted assets includes total assets adjusted for credit risk and is used to determine capital ratios. Refer to the tabular reconciliation of non-GAAP to GAAP measures and presentation of the most comparable GAAP items on page 29 of this financial supplement.
Table of Contents
| FIRST HORIZON NATIONAL CORPORATION SEGMENT STRUCTURE |
|
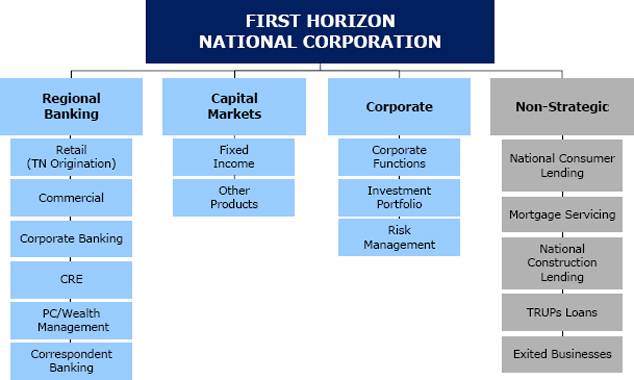
Regional Banking
-Traditional lending and deposit taking, investments, financial planning, trust services, asset management, and cash management
-Correspondent banking which provides credit, depository, and other banking related services to other financial institutions
-First lien mortgage originations through regional banking channels
Capital Markets
-Fixed income sales, trading, and strategies for institutional clients in the U.S. and abroad
-Other capital markets products such as portfolio advisory, derivatives, and loan trading
Corporate
-Executive management, enterprise-wide risk management, corporate finance, corporate communications, low income housing activities, legal functions and funding for the corporation including any impact from balance sheet positioning
-Various charges related to restructuring, repositioning, and efficiency initiatives
Non-Strategic
-Wind-down businesses that include:
-National commercial and consumer lending loan portfolios
-Trust preferred loan portfolio
-Legacy mortgage servicing
-Exited businesses such as First Horizon Msaver, Inc. (“Msaver”), First Horizon Insurance, Inc. (“FHI”), and Highland Capital Management Corporation (“Highland Capital”) and associated restructuring, repositioning, and efficiency charges
3
Table of Contents
| PERFORMANCE HIGHLIGHTS |
|
Summary of Third Quarter 2011 Significant Items
(Millions)
| Segment | Item | Income Statement | Amount | Comments | ||||||
| Corporate |
Sale of Visa Shares | Noninterest Income: Securities gains/(losses), net | $35.1 million | Pre-tax gain associated with the sale of Visa Class B Shares. | ||||||
| Non-Strategic |
Divestitures | Discontinued operations, net of tax | $5.7 million | After-tax gain on sale of Msaver. | ||||||
| Primarily Non-Strategic |
Nonperforming loan sales | Provision for loan losses | (~$36) million | Losses on sales of nonperforming consumer and commercial loans. | ||||||
(Third Quarter 2011 vs. Second Quarter 2011)
Consolidated
- Net income available to common shareholders was $36.1 million, or $.14 per diluted share, compared to $20.0 million, or $.08 per diluted share, in second quarter
- Net interest income increased $3.5 million during third quarter primarily within the regional banking segment
- Noninterest income (including security gains) was $220.9 million, an increase of $33.3 million from second quarter
- Increase primarily driven by securities gains in corporate and fixed income revenue within capital markets
- Provision expense was $32.0 million in third quarter compared to $1.0 million in the second quarter
- Increase is driven by losses on sales of consumer and commercial nonperforming loans
- Noninterest expense decreased $21.7 million to $322.7 million in third quarter
- The regional banking, capital markets, and corporate segments had lower expenses during third quarter
- Expenses within the non-strategic segment increased primarily due to elevated repurchase provision
- Period-end loan balance increased slightly in third quarter to $16.3 billion as commercial loan growth offset loan sale activities and runoff
- Average core deposits increased from $14.9 billion in second quarter to $15.2 billion in third quarter
Regional Banking
- Net interest margin decreased 4 basis points to 5.17%, net interest income (“NII”) increased $4.4 million to $140.6 million in third quarter
- Increase in NII primarily attributable to higher balances of loans to mortgage companies
- Provision credit was $22.7 million in third quarter compared to $13.7 million in the second quarter
- Decline in provision driven by improved performance of the Income CRE and C&I loan portfolios
- Includes $4.3 million of provision expense related to commercial nonperforming loan (“NPL”) sales
- Period-end loans increased $543.7 million primarily driven by loans to mortgage companies
- Noninterest income was relatively stable at $67.9 million in third quarter
- Deposit fee income increased slightly due to seasonality in consumer non-sufficient funds (“NSF”) fee structure
- Noninterest expense declined $6.1 million to $137.3 million in third quarter
- Decline driven by lower personnel costs, provision for unfunded commitments, credit and technology costs, and FDIC premiums
- The decline in expense was partially offset by negative valuation adjustments to foreclosed assets and higher advertising costs
Capital Markets
- Fixed income revenues increased to $92.6 million in third quarter from $71.2 million in second quarter
- Fixed income average daily revenue (“ADR”) was $1.4 million in third quarter, up from $1.1 million in prior quarter
- ADR increased in third quarter due to strong performance in both depository and non-depository customer segments
- Noninterest expense decreased to $77.2 million in third quarter from $103.4 million in prior quarter
- Decrease reflects a $36.7 million loss accrual recognized in second quarter 2011 related to the settlement of a litigation matter
- Legal and professional fees decreased $2.5 million from second quarter 2011
- Variable compensation costs increased consistent with the rise in fixed income sales revenue
Corporate
- Noninterest income (including securities gains) increased to $38.1 million from $9.0 million in prior quarter
- Third quarter includes $35.1 million of security gains related to the sale of Visa Class B Shares
- Deferred compensation income declined due to market conditions and is mirrored by a reduction in deferred compensation expense
- Second quarter included $3.4 million of interest related to a tax refund
- Noninterest expense decreased to $19.0 million in third quarter from $36.3 million in prior quarter
- Corporate restructuring charges were $3.2 million in third quarter compared to $16.6 million in prior quarter
- Second quarter included $9.0 million charge to terminate a technology-related services contract
- Severance and other employee-related restructuring costs decreased $5.4 million to $2.1 million in third quarter
4
Table of Contents
| PERFORMANCE HIGHLIGHTS (continued)
|
|
(Third Quarter 2011 vs. Second Quarter 2011)
Non-Strategic
- NII was flat at $30.6 million in third quarter driven by a favorable adjustment to accrued interest receivable of warehouse loans
- Provision expense increased to $54.7 million in third quarter from $14.7 million in prior quarter
- Provision includes $29.8 million attributable to the sale of $188 million in unpaid principal balance (“UPB”) ($126 million book value) of nonperforming permanent mortgages
- Losses on commercial NPL sales reflected within provision were $1.6 million in third quarter
- Noninterest income decreased to $15.4 million in third quarter from $33.0 million in prior quarter due to a decline in mortgage banking income
- Positive net hedging results decreased to $7.0 million from $15.4 million in prior quarter
- Mortgage warehouse valuation adjustments were negative $7.1 million in third quarter compared to $1.8 million of favorable adjustments in prior quarter
- Third quarter valuation adjustments driven by credit deterioration
- Noninterest expense increased to $89.2 million in third quarter from $61.4 million in prior quarter
- Provisioning for repurchase and foreclosure losses was $52.8 million in third quarter compared to $24.6 million in prior quarter
- Reserve levels remained flat at $169.3 million due to higher inflow and unfavorable resolution and loss severity trends in third quarter
- New requests/primary mortgage insurance (“PMI”) cancellation notices were $200.3 million in third quarter, an increase of $13.7 million
- Active pipeline declined to $417.9 million from $450.8 million in prior quarter, primarily due to elevated charge-off levels
- Cumulative rescission rates averaging between 45% and 55% with average loss severities ranging between 50% and 60%
- Contract employment costs increased $6.3 million in third quarter to $11.2 million
- Increase related to higher base subservicing fees and one-time costs associated with transition to new subservicer
- Discontinued operations, net of tax includes operating results from Msaver and FHI
- The Msaver divestiture resulted in an after-tax gain of $5.7 million in third quarter
- Closing of FHI and Highland Capital divestitures resulted in after-tax gains of approximately $4.2 million in second quarter
Asset Quality
- Allowance as a percentage of loans ratio decreased to 277 basis points from 326 basis points in prior quarter
- Reflects a $74.4 million net allowance decrease in third quarter
- Reserves decreased for all loan portfolios with exception of the Credit Card and Other Consumer portfolio
- Provision expense increased $31.0 million in third quarter driven by losses on nonperforming loan sales
- Annualized net charge-offs increased to 265 basis points of average loans from 167 basis points in prior quarter
- Net charge-offs were $106.4 million in third quarter compared to $66.0 million in prior quarter
- NPL sales contributed to $40.2 million of consumer and $7.4 million commercial net charge-offs in third quarter
- Exclusive of NPL sales, net charge-offs decreased $7.1 million driven by the consumer portfolio
- Nonperforming assets (“NPAs”) decreased 22 percent from prior quarter; NPA ratio declined to 302 basis points from 409 basis points
- Decline primarily driven by consumer distressed loan sales in third quarter
- Foreclosed assets relatively stable as inflow has stabilized and disposition activity continues
- Troubled debt restructurings (“TDRs”) were $331.8 million at the end of third quarter compared with $376.3 million in prior quarter
- Decline primarily due to sale of nonperforming permanent mortgages
- Commercial Portfolio:
- Reserve decrease of $24.0 million for the C&I portfolio driven by improved borrower financial conditions resulting in upgrades
- Aggregate improved risk profile primarily due to property stabilization of Income CRE portfolio resulted in $32.0 million reserve decrease
- Consumer Portfolio:
- Performance of the home equity portfolio was relatively stable with 30+ delinquency rates up slightly to 157 basis points from prior quarter
- Nonperforming permanent mortgages declined while net charge-offs increased due to the loan sale
Taxes (Operating Results)
- Approximately $7.8 million positive quarterly effect from permanent tax credits
- Prior quarter tax expense aided by $2.1 million favorable tax audit resolution
Capital and Liquidity
- Paid $0.01 per share dividend October 1, 2011
- Current ratios strong (regulatory capital ratios estimated based on period-end balances)
- 9.00% for tangible common equity to tangible assets
- 14.47% for Tier 1
- 18.25% for Total Capital
- 11.98% for Tier 1 Common
5
Table of Contents
| CHARGES FOR RESTRUCTURING, REPOSITIONING, & EFFICIENCY INITIATIVES |
| |||
| Quarterly, Unaudited | ||||
| (Thousands) | 3Q11 | 2Q11 | 1Q11 | 4Q10 | 3Q10 | |||||||||||||||
| By Income Statement Impact |
||||||||||||||||||||
| Noninterest income |
||||||||||||||||||||
| All other income and commissions (a) |
$ | 1,200 | $ | - | $ | - | $ | - | $ | - | ||||||||||
| Noninterest expense |
||||||||||||||||||||
| Employee compensation, incentives, and benefits |
2,128 | 7,511 | 2,253 | 2,225 | 778 | |||||||||||||||
| Occupancy |
1,031 | 59 | 795 | 17 | 39 | |||||||||||||||
| Legal and professional fees |
- | - | - | 1 | - | |||||||||||||||
| All other expense (b) |
74 | 9,026 | 13 | 2,801 | 326 | |||||||||||||||
| Total loss before income taxes |
(2,033 | ) | (16,596 | ) | (3,061 | ) | (5,044 | ) | (1,143 | ) | ||||||||||
| Income/(loss) from discontinued operations (c) (d) |
8,951 | 441 | (10,514 | ) | (335 | ) | - | |||||||||||||
| Net impact resulting from restructuring, repositioning, and efficiency initiatives |
$ | 6,918 | $ | (16,155 | ) | $ | (13,575 | ) | $ | (5,379 | ) | $ | (1,143 | ) | ||||||
| (a) | Includes reversal of contingent liability associated with the expiration of subservicing agreement with purchaser of legacy mortgage operations. |
| (b) | 2Q11 includes $9.0 million charge associated with termination of technology-related services contract. |
| (c) | Includes amounts related to Msaver, First Horizon Insurance, and Highland Capital. |
| (d) | 3Q11 includes a $9.4 million pre-tax gain related to the Msaver divestiture. |
6
Table of Contents
| CONSOLIDATED SUMMARY RESULTS |
| |
| Quarterly, Unaudited |
| 3Q11 Change vs. | ||||||||||||||||||||||||||||||||
| (Dollars in thousands, except per share data) | 3Q11 | 2Q11 | 1Q11 | 4Q10 | 3Q10 | 2Q11 | 3Q10 | |||||||||||||||||||||||||
| Income Statement Highlights |
||||||||||||||||||||||||||||||||
| Net interest income |
$ | 176,340 | $ | 172,860 | $ | 172,755 | $ | 182,236 | $ | 186,143 | 2% | (5)% | ||||||||||||||||||||
| Noninterest income |
185,725 | 187,592 | 195,537 | 189,483 | 245,633 | (1)% | (24)% | |||||||||||||||||||||||||
| Securities gains/(losses), net |
35,162 | 1 | 798 | 15,681 | (2,928 | ) | NM | NM | ||||||||||||||||||||||||
| Total revenue |
397,227 | 360,453 | 369,090 | 387,400 | 428,848 | 10% | (7)% | |||||||||||||||||||||||||
| Noninterest expense |
322,708 | 344,455 | 313,796 | 328,294 | 341,490 | (6)% | (6)% | |||||||||||||||||||||||||
| Provision for loan losses |
32,000 | 1,000 | 1,000 | 45,000 | 50,000 | NM | (36)% | |||||||||||||||||||||||||
| Income before income taxes |
42,519 | 14,998 | 54,294 | 14,106 | 37,358 | NM | 14% | |||||||||||||||||||||||||
| Provision/(benefit) for income taxes |
8,367 | (4,167 | ) | 12,162 | (6,637 | ) | 3,290 | NM | NM | |||||||||||||||||||||||
| Income from continuing operations |
34,152 | 19,165 | 42,132 | 20,743 | 34,068 | 78% | * | |||||||||||||||||||||||||
| Income/(loss) from discontinued operations, net of tax |
4,828 | 3,671 | 871 | (3,435 | ) | (358 | ) | 32% | NM | |||||||||||||||||||||||
| Net income |
38,980 | 22,836 | 43,003 | 17,308 | 33,710 | 71% | 16% | |||||||||||||||||||||||||
| Net income attributable to noncontrolling interest |
2,875 | 2,844 | 2,844 | 2,840 | 2,875 | 1% | * | |||||||||||||||||||||||||
| Net income attributable to controlling interest |
36,105 | 19,992 | 40,159 | 14,468 | 30,835 | 81% | 17% | |||||||||||||||||||||||||
| Preferred stock dividends |
- | - | - | 63,154 | 14,960 | NM | NM | |||||||||||||||||||||||||
| Net income/(loss) available to common shareholders |
$ | 36,105 | $ | 19,992 | $ | 40,159 | $ | (48,686 | ) | $ | 15,875 | 81% | NM | |||||||||||||||||||
| Common Stock Data |
||||||||||||||||||||||||||||||||
| Diluted EPS from continuing operations |
$ | 0.12 | $ | 0.06 | $ | 0.15 | $ | (0.19 | ) | $ | 0.07 | NM | 71% | |||||||||||||||||||
| Diluted EPS |
0.14 | 0.08 | 0.15 | (0.20 | ) | 0.07 | 75% | NM | ||||||||||||||||||||||||
| Diluted shares |
262,803 | 262,756 | 265,556 | 239,095 | 238,867 | * | 10% | |||||||||||||||||||||||||
| Period-end shares outstanding |
263,619 | 263,699 | 263,335 | 263,366 | 237,061 | * | 11% | |||||||||||||||||||||||||
| Cash dividends declared per share |
$ | 0.01 | $ | 0.01 | $ | 0.01 | N/A | N/A | ||||||||||||||||||||||||
| Stock dividend rate declared per share |
N/A | N/A | N/A | 1.8122 | % | 1.6567 | % | |||||||||||||||||||||||||
| Balance Sheet Highlights (Period-End) |
||||||||||||||||||||||||||||||||
| Total loans, net of unearned income (Restricted - $.7 billion) (a) |
$ | 16,241,402 | $ | 16,061,646 | $ | 15,972,372 | $ | 16,782,572 | $ | 17,059,489 | 1% | (5)% | ||||||||||||||||||||
| Total deposits |
15,698,255 | 15,896,027 | 15,350,967 | 15,208,231 | 14,975,920 | (1)% | 5% | |||||||||||||||||||||||||
| Total assets (Restricted - $.7 billion) (a) |
25,571,469 | 25,054,066 | 24,438,344 | 24,698,952 | 25,384,181 | 2% | 1% | |||||||||||||||||||||||||
| Total liabilities (Restricted - $.7 billion) (a) |
22,828,239 | 22,372,684 | 21,798,287 | 22,020,947 | 22,077,293 | 2% | 3% | |||||||||||||||||||||||||
| Total equity |
2,743,230 | 2,681,382 | 2,640,057 | 2,678,005 | 3,306,888 | 2% | (17)% | |||||||||||||||||||||||||
| Asset Quality Highlights |
||||||||||||||||||||||||||||||||
| Allowance for loan losses (Restricted - $32.4 million) (a) |
$ | 449,645 | $ | 524,091 | $ | 589,128 | $ | 664,799 | $ | 719,899 | (14)% | (38)% | ||||||||||||||||||||
| Allowance / period-end loans |
2.77 | % | 3.26 | % | 3.69 | % | 3.96 | % | 4.22 | % | ||||||||||||||||||||||
| Net charge-offs |
$ | 106,446 | $ | 66,037 | $ | 76,671 | $ | 100,100 | $ | 111,370 | 61% | (4)% | ||||||||||||||||||||
| Net charge-offs (annualized) / average loans |
2.65 | % | 1.67 | % | 1.93 | % | 2.36 | % | 2.60 | % | ||||||||||||||||||||||
| Non-performing assets (NPA) |
$ | 582,571 | $ | 747,860 | $ | 818,969 | $ | 836,502 | $ | 919,242 | (22)% | (37)% | ||||||||||||||||||||
| NPA % (b) |
3.02 | % | 4.09 | % | 4.55 | % | 4.48 | % | 5.00 | % | ||||||||||||||||||||||
| Key Ratios & Other |
||||||||||||||||||||||||||||||||
| Return on average assets (annualized) (c) |
0.62 | % | 0.37 | % | 0.71 | % | 0.27 | % | 0.52 | % | ||||||||||||||||||||||
| Return on average common equity (annualized) (d) |
5.90 | % | 3.36 | % | 6.82 | % | (8.59 | )% | 2.86 | % | ||||||||||||||||||||||
| Net interest margin (e) (f) |
3.23 | % | 3.20 | % | 3.22 | % | 3.18 | % | 3.23 | % | ||||||||||||||||||||||
| Fee income to total revenue (g) |
51.30 | % | 52.04 | % | 53.09 | % | 50.97 | % | 56.89 | % | ||||||||||||||||||||||
| Efficiency ratio (h) |
89.13 | % | 95.56 | % | 85.20 | % | 88.32 | % | 79.09 | % | ||||||||||||||||||||||
| Book value per common share |
$ | 9.29 | $ | 9.05 | $ | 8.90 | $ | 9.05 | $ | 9.28 | ||||||||||||||||||||||
| Tangible book value per common share (f) |
$ | 8.68 | $ | 8.43 | $ | 8.21 | $ | 8.31 | $ | 8.45 | ||||||||||||||||||||||
| Adjusted tangible common equity to risk weighted assets (f) |
11.11 | % | 11.05 | % | 10.84 | % | 10.66 | % | 9.55 | % | ||||||||||||||||||||||
| Full time equivalent employees |
4,748 | 4,950 | 5,159 | 5,435 | 5,506 | (4)% | (14)% | |||||||||||||||||||||||||
N/A - Not applicable
NM - Not meaningful
* Amount is less than one percent.
| (a) | Restricted balances parenthetically presented are as of September 30, 2011. |
| (b) | NPAs related to the loan portfolio over period-end loans plus foreclosed real estate and other assets. |
| (c) | Calculated using net income. |
| (d) | Calculated using net income available to common shareholders. |
| (e) | Net interest margin is computed using total net interest income adjusted for FTE. |
| (f) | Refer to the Non-GAAP to GAAP Reconciliation on page 29 of this financial supplement. |
| (g) | Ratio excludes securities gains/(losses). |
| (h) | Noninterest expense divided by total revenue excluding securities gains/(losses). |
7
Table of Contents
| CONSOLIDATED INCOME STATEMENT |
| |
|
Quarterly, Unaudited |
| 3Q11 Change vs. | ||||||||||||||||||||||||||||||||
| (Thousands) | 3Q11 | 2Q11 | 1Q11 | 4Q10 | 3Q10 | 2Q11 | 3Q10 | |||||||||||||||||||||||||
| Interest income |
$ | 208,360 | $ | 206,757 | $ | 207,605 | $ | 217,260 | $ | 223,165 | 1% | (7)% | ||||||||||||||||||||
| Less: interest expense |
32,020 | 33,897 | 34,850 | 35,024 | 37,022 | (6)% | (14)% | |||||||||||||||||||||||||
| Net interest income |
176,340 | 172,860 | 172,755 | 182,236 | 186,143 | 2% | (5)% | |||||||||||||||||||||||||
| Provision for loan losses (a) |
32,000 | 1,000 | 1,000 | 45,000 | 50,000 | NM | (36)% | |||||||||||||||||||||||||
| Net interest income after provision for loan losses |
144,340 | 171,860 | 171,755 | 137,236 | 136,143 | (16)% | 6% | |||||||||||||||||||||||||
| Noninterest income: |
||||||||||||||||||||||||||||||||
| Capital markets |
99,557 | 77,921 | 90,057 | 94,573 | 114,014 | 28% | (13)% | |||||||||||||||||||||||||
| Mortgage banking |
12,751 | 32,101 | 27,726 | 16,057 | 53,122 | (60)% | (76)% | |||||||||||||||||||||||||
| Deposit transactions and cash management |
35,701 | 34,726 | 32,279 | 34,875 | 34,523 | 3% | 3% | |||||||||||||||||||||||||
| Trust services and investment management |
6,086 | 6,684 | 6,360 | 6,330 | 6,171 | (9)% | (1)% | |||||||||||||||||||||||||
| Brokerage management fees and commissions |
5,648 | 6,134 | 6,883 | 5,772 | 6,425 | (8)% | (12)% | |||||||||||||||||||||||||
| Insurance commissions |
739 | 764 | 689 | 588 | 705 | (3)% | 5% | |||||||||||||||||||||||||
| Securities gains/(losses), net (b) |
35,162 | 1 | 798 | 15,681 | (2,928 | ) | NM | NM | ||||||||||||||||||||||||
| Other (c) |
25,243 | 29,262 | 31,543 | 31,288 | 30,673 | (14)% | (18)% | |||||||||||||||||||||||||
| Total noninterest income |
220,887 | 187,593 | 196,335 | 205,164 | 242,705 | 18% | (9)% | |||||||||||||||||||||||||
| Adjusted gross income after provision for loan losses |
365,227 | 359,453 | 368,090 | 342,400 | 378,848 | 2% | (4)% | |||||||||||||||||||||||||
| Noninterest expense: |
||||||||||||||||||||||||||||||||
| Employee compensation, incentives, and benefits (c) |
153,540 | 151,160 | 156,512 | 164,410 | 170,786 | 2% | (10)% | |||||||||||||||||||||||||
| Repurchase and foreclosure provision |
52,791 | 24,563 | 37,203 | 44,223 | 48,712 | NM | 8% | |||||||||||||||||||||||||
| Operations services |
11,978 | 13,907 | 13,861 | 14,832 | 14,749 | (14)% | (19)% | |||||||||||||||||||||||||
| Occupancy (c) |
13,523 | 13,061 | 14,861 | 13,756 | 14,213 | 4% | (5)% | |||||||||||||||||||||||||
| Legal and professional fees |
18,132 | 20,451 | 18,352 | 16,086 | 14,069 | (11)% | 29% | |||||||||||||||||||||||||
| FDIC premium expense (d) |
5,904 | 8,839 | 8,055 | 9,326 | 10,123 | (33)% | (42)% | |||||||||||||||||||||||||
| Computer software |
8,689 | 8,375 | 8,085 | 8,406 | 7,569 | 4% | 15% | |||||||||||||||||||||||||
| Contract employment (e) |
14,352 | 8,142 | 6,888 | 7,826 | 7,330 | 76% | 96% | |||||||||||||||||||||||||
| Equipment rentals, depreciation, and maintenance |
8,795 | 8,481 | 7,890 | 7,821 | 7,127 | 4% | 23% | |||||||||||||||||||||||||
| Foreclosed real estate |
4,691 | 5,803 | 6,789 | 4,178 | 5,159 | (19)% | (9)% | |||||||||||||||||||||||||
| Communications and courier |
4,428 | 5,069 | 5,219 | 5,134 | 5,029 | (13)% | (12)% | |||||||||||||||||||||||||
| Miscellaneous loan costs |
959 | 859 | 1,492 | 1,796 | 1,913 | 12% | (50)% | |||||||||||||||||||||||||
| Amortization of intangible assets |
1,004 | 1,006 | 1,006 | 1,037 | 1,037 | * | (3)% | |||||||||||||||||||||||||
| Other (c) (f) |
23,922 | 74,739 | 27,583 | 29,463 | 33,674 | (68)% | (29)% | |||||||||||||||||||||||||
| Total noninterest expense |
322,708 | 344,455 | 313,796 | 328,294 | 341,490 | (6)% | (6)% | |||||||||||||||||||||||||
| Income before income taxes |
42,519 | 14,998 | 54,294 | 14,106 | 37,358 | NM | 14% | |||||||||||||||||||||||||
| Provision/(benefit) for income taxes |
8,367 | (4,167 | ) | 12,162 | (6,637 | ) | 3,290 | NM | NM | |||||||||||||||||||||||
| Income from continuing operations |
34,152 | 19,165 | 42,132 | 20,743 | 34,068 | 78% | * | |||||||||||||||||||||||||
| Income/(loss) from discontinued operations, net of tax (c) |
4,828 | 3,671 | 871 | (3,435 | ) | (358 | ) | 32% | NM | |||||||||||||||||||||||
| Net income |
38,980 | 22,836 | 43,003 | 17,308 | 33,710 | 71% | 16% | |||||||||||||||||||||||||
| Net income attributable to noncontrolling interest |
2,875 | 2,844 | 2,844 | 2,840 | 2,875 | 1% | * | |||||||||||||||||||||||||
| Net income attributable to controlling interest |
36,105 | 19,992 | 40,159 | 14,468 | 30,835 | 81% | 17% | |||||||||||||||||||||||||
| Preferred stock dividends |
- | - | - | 63,154 | 14,960 | NM | NM | |||||||||||||||||||||||||
| Net income/(loss) available to common shareholders |
$ | 36,105 | $ | 19,992 | $ | 40,159 | $ | (48,686 | ) | $ | 15,875 | 81% | NM | |||||||||||||||||||
| NM | - Not meaningful |
* Amount is less than one percent.
| Certain | previously reported amounts have been reclassified to agree with current presentation. |
| (a) | 3Q11 includes approximately $36 million of losses on sales of nonperforming loans. |
| (b) | 3Q11 includes a $35.1 million gain associated with the sale of Visa Class B Shares. |
| (c) | 2Q11 and 3Q11 includes a portion of net charges related to Restructuring, Repositioning, & Efficiency Initiatives. |
| (d) | 3Q11 includes refinement of FDIC premium calculation methodology, which was first implemented in 2Q11. |
| (e) | 3Q11 includes transition costs and elevated base subservicing costs in connection with the transition of servicing to a new mortgage servicer. |
| (f) | 2Q11 includes a $36.7 million loss accrual related to a litigation settlement. |
8
Table of Contents
| OTHER INCOME AND OTHER EXPENSE |
| |
| Quarterly, Unaudited |
| 3Q11 Change vs. | ||||||||||||||||||||||||||||||
| (Thousands) | 3Q11 | 2Q11 | 1Q11 | 4Q10 | 3Q10 | 2Q11 | 3Q10 | |||||||||||||||||||||||
| Other Income |
||||||||||||||||||||||||||||||
| Bank owned life insurance |
$ | 5,116 | $ | 4,920 | $ | 4,815 | $ | 7,732 | $ | 5,913 | 4% | (13)% | ||||||||||||||||||
| Bankcard income |
5,258 | 5,151 | 4,720 | 4,977 | 4,965 | 2% | 6% | |||||||||||||||||||||||
| ATM interchange fees |
3,709 | 3,791 | 3,535 | 3,748 | 3,532 | (2)% | 5% | |||||||||||||||||||||||
| Other service charges |
2,969 | 2,819 | 2,853 | 2,844 | 2,829 | 5% | 5% | |||||||||||||||||||||||
| Electronic banking fees |
1,609 | 1,536 | 1,534 | 1,629 | 1,870 | 5% | (14)% | |||||||||||||||||||||||
| Letter of credit fees |
1,407 | 1,869 | 1,776 | 1,508 | 1,544 | (25)% | (9)% | |||||||||||||||||||||||
| Deferred compensation |
(2,093 | ) | 221 | 979 | 2,260 | 1,121 | NM | NM | ||||||||||||||||||||||
| Gains on extinguishment of debt |
- | - | 5,761 | - | - | NM | NM | |||||||||||||||||||||||
| Other (a) |
7,268 | 8,955 | 5,570 | 6,590 | 8,899 | (19)% | (18)% | |||||||||||||||||||||||
| Total |
$ | 25,243 | $ | 29,262 | $ | 31,543 | $ | 31,288 | $ | 30,673 | (14)% | (18)% | ||||||||||||||||||
| Other Expense |
||||||||||||||||||||||||||||||
| Losses from litigation and regulatory matters |
$ | - | $ | 38,260 | $ | 2,325 | $ | - | $ | 1,128 | NM | NM | ||||||||||||||||||
| Advertising and public relations |
4,571 | 3,558 | 3,790 | 5,687 | 6,508 | 28% | (30)% | |||||||||||||||||||||||
| Low income housing expense |
4,712 | 4,973 | 4,697 | 5,886 | 5,513 | (5)% | (15)% | |||||||||||||||||||||||
| Other insurance and taxes |
3,352 | 3,507 | 3,467 | 1,808 | 2,985 | (4)% | 12% | |||||||||||||||||||||||
| Travel and entertainment |
2,075 | 2,137 | 1,770 | 2,429 | 2,454 | (3)% | (15)% | |||||||||||||||||||||||
| Customer relations |
1,185 | 1,152 | 1,270 | 1,720 | 1,535 | 3% | (23)% | |||||||||||||||||||||||
| Employee training and dues |
1,009 | 1,342 | 1,247 | 1,119 | 1,116 | (25)% | (10)% | |||||||||||||||||||||||
| Supplies |
1,092 | 792 | 963 | 1,208 | 1,120 | 38% | (3)% | |||||||||||||||||||||||
| Bank examination costs |
1,138 | 1,117 | 1,118 | 1,147 | 1,147 | 2% | (1)% | |||||||||||||||||||||||
| Loan insurance expense |
744 | 706 | 781 | 603 | 903 | 5% | (18)% | |||||||||||||||||||||||
| Federal services fees |
338 | 291 | 464 | 471 | 520 | 16% | (35)% | |||||||||||||||||||||||
| Other (a) (b) |
3,706 | 16,904 | 5,691 | 7,385 | 8,745 | (78)% | (58)% | |||||||||||||||||||||||
| Total |
$ | 23,922 | $ | 74,739 | $ | 27,583 | $ | 29,463 | $ | 33,674 | (68)% | (29)% | ||||||||||||||||||
NM - Not meaningful
* Amount is less than one percent.
Certain previously reported amounts have been reclassified to agree with current presentation.
| (a) | 3Q11 includes a portion of the net impact of Restructuring, Repositioning, & Efficiency Initiatives. |
| (b) | 2Q11 includes a $9.0 million charge associated with the termination of a technology-related services contract. |
9
Table of Contents
| CONSOLIDATED PERIOD-END BALANCE SHEET |
| |
| Quarterly, Unaudited |
| 3Q11 Change vs. | ||||||||||||||||||||||||||||||||
| (Thousands) | 3Q11 | 2Q11 | 1Q11 | 4Q10 | 3Q10 | 2Q11 | 3Q10 | |||||||||||||||||||||||||
| Assets |
||||||||||||||||||||||||||||||||
| Investment securities |
$ | 3,327,846 | $ | 3,230,477 | $ | 3,085,478 | $ | 3,031,930 | $ | 2,611,460 | 3% | 27% | ||||||||||||||||||||
| Loans held for sale |
386,147 | 397,931 | 370,487 | 375,289 | 414,259 | (3)% | (7)% | |||||||||||||||||||||||||
| Loans, net of unearned income (Restricted - $.7 billion) (a) |
16,241,402 | 16,061,646 | 15,972,372 | 16,782,572 | 17,059,489 | 1% | (5)% | |||||||||||||||||||||||||
| Federal funds sold and securities purchased under agreements to resell |
719,400 | 598,000 | 527,563 | 424,390 | 602,407 | 20% | 19% | |||||||||||||||||||||||||
| Interest bearing cash (b) |
358,537 | 263,441 | 308,636 | 517,739 | 266,469 | 36% | 35% | |||||||||||||||||||||||||
| Trading securities |
1,227,197 | 1,196,380 | 924,854 | 769,750 | 1,214,595 | 3% | 1% | |||||||||||||||||||||||||
| Total earning assets |
22,260,529 | 21,747,875 | 21,189,390 | 21,901,670 | 22,168,679 | 2% | * | |||||||||||||||||||||||||
| Cash and due from banks (Restricted - $4.7 million) (a) |
339,895 | 313,416 | 337,002 | 344,384 | 331,743 | 8% | 2% | |||||||||||||||||||||||||
| Capital markets receivables |
521,198 | 625,243 | 595,594 | 146,091 | 564,879 | (17)% | (8)% | |||||||||||||||||||||||||
| Mortgage servicing rights, net |
150,803 | 186,958 | 207,748 | 207,319 | 191,943 | (19)% | (21)% | |||||||||||||||||||||||||
| Goodwill |
133,659 | 135,683 | 152,080 | 162,180 | 162,180 | (1)% | (18)% | |||||||||||||||||||||||||
| Other intangible assets, net |
27,243 | 28,384 | 31,545 | 32,881 | 34,263 | (4)% | (20)% | |||||||||||||||||||||||||
| Premises and equipment, net |
326,667 | 330,392 | 320,871 | 322,319 | 311,947 | (1)% | 5% | |||||||||||||||||||||||||
| Real estate acquired by foreclosure (c) |
91,492 | 92,662 | 110,127 | 125,401 | 139,359 | (1)% | (34)% | |||||||||||||||||||||||||
| Allowance for loan losses (Restricted - $32.4 million) (a) |
(449,645 | ) | (524,091 | ) | (589,128 | ) | (664,799 | ) | (719,899 | ) | 14% | 38% | ||||||||||||||||||||
| Other assets (Restricted - $13.6 million) (a) |
2,169,628 | 2,117,544 | 2,083,115 | 2,121,506 | 2,199,087 | 2% | (1)% | |||||||||||||||||||||||||
| Total assets (Restricted - $.7 billion) (a) |
$ | 25,571,469 | $ | 25,054,066 | $ | 24,438,344 | $ | 24,698,952 | $ | 25,384,181 | 2% | 1% | ||||||||||||||||||||
| Liabilities and Equity |
||||||||||||||||||||||||||||||||
| Deposits |
||||||||||||||||||||||||||||||||
| Savings |
$ | 6,467,377 | $ | 6,382,963 | $ | 6,296,533 | $ | 6,036,895 | $ | 5,436,451 | 1% | 19% | ||||||||||||||||||||
| Other interest-bearing deposits |
3,096,621 | 2,784,787 | 2,679,437 | 2,842,306 | 3,088,224 | 11% | * | |||||||||||||||||||||||||
| Time deposits |
1,210,661 | 1,277,905 | 1,336,666 | 1,390,995 | 1,473,622 | (5)% | (18)% | |||||||||||||||||||||||||
| Total interest-bearing core deposits |
10,774,659 | 10,445,655 | 10,312,636 | 10,270,196 | 9,998,297 | 3% | 8% | |||||||||||||||||||||||||
| Noninterest-bearing deposits |
4,412,375 | 4,937,103 | 4,480,413 | 4,376,285 | 4,393,107 | (11)% | * | |||||||||||||||||||||||||
| Total core deposits (d) |
15,187,034 | 15,382,758 | 14,793,049 | 14,646,481 | 14,391,404 | (1)% | 6% | |||||||||||||||||||||||||
| Certificates of deposit $100,000 and more |
511,221 | 513,269 | 557,918 | 561,750 | 584,516 | * | (13)% | |||||||||||||||||||||||||
| Total deposits |
15,698,255 | 15,896,027 | 15,350,967 | 15,208,231 | 14,975,920 | (1)% | 5% | |||||||||||||||||||||||||
| Federal funds purchased and securities sold under agreements to repurchase |
2,101,953 | 2,005,999 | 2,125,793 | 2,114,908 | 2,439,542 | 5% | (14)% | |||||||||||||||||||||||||
| Trading liabilities |
471,120 | 498,915 | 384,250 | 361,920 | 414,666 | (6)% | 14% | |||||||||||||||||||||||||
| Other short-term borrowings and commercial paper |
621,998 | 187,902 | 237,583 | 180,735 | 193,361 | NM | NM | |||||||||||||||||||||||||
| Term borrowings (Restricted - $.7 billion) (a) |
2,509,804 | 2,502,517 | 2,514,754 | 3,228,070 | 2,805,731 | * | (11)% | |||||||||||||||||||||||||
| Capital markets payables |
509,164 | 464,993 | 413,334 | 65,506 | 379,526 | 9% | 34% | |||||||||||||||||||||||||
| Other liabilities (Restricted - $.1 million) (a) |
915,945 | 816,331 | 771,606 | 861,577 | 868,547 | 12% | 5% | |||||||||||||||||||||||||
| Total liabilities (Restricted - $.7 billion) (a) |
22,828,239 | 22,372,684 | 21,798,287 | 22,020,947 | 22,077,293 | 2% | 3% | |||||||||||||||||||||||||
| Equity |
||||||||||||||||||||||||||||||||
| Common stock |
164,762 | 164,812 | 164,584 | 164,604 | 145,526 | * | 13% | |||||||||||||||||||||||||
| Capital surplus |
1,641,878 | 1,638,423 | 1,636,623 | 1,630,210 | 1,344,307 | * | 22% | |||||||||||||||||||||||||
| Capital surplus common stock warrant - (CPP) |
- | - | - | 83,860 | 83,860 | NM | NM | |||||||||||||||||||||||||
| Undivided profits |
724,977 | 691,490 | 674,064 | 631,712 | 737,014 | 5% | (2)% | |||||||||||||||||||||||||
| Accumulated other comprehensive loss, net |
(83,552 | ) | (108,508 | ) | (130,379 | ) | (127,546 | ) | (109,958 | ) | 23% | 24% | ||||||||||||||||||||
| Preferred stock capital surplus - (CPP) |
- | - | - | - | 810,974 | NM | NM | |||||||||||||||||||||||||
| Noncontrolling interest (e) |
295,165 | 295,165 | 295,165 | 295,165 | 295,165 | * | * | |||||||||||||||||||||||||
| Total equity |
2,743,230 | 2,681,382 | 2,640,057 | 2,678,005 | 3,306,888 | 2% | (17)% | |||||||||||||||||||||||||
| Total liabilities and equity |
$ | 25,571,469 | $ | 25,054,066 | $ | 24,438,344 | $ | 24,698,952 | $ | 25,384,181 | 2% | 1% | ||||||||||||||||||||
NM - Not meaningful
* Amount is less than one percent.
| (a) | Restricted balances parenthetically presented are as of September 30, 2011. |
| (b) | Includes excess balances held at Fed. |
| (c) | 3Q11 includes $11.4 million of foreclosed assets related to government insured mortgages. |
| (d) | 3Q11 average core deposits were $15.2 billion. |
| (e) | Includes preferred stock of subsidiary. |
10
Table of Contents
| CONSOLIDATED AVERAGE BALANCE SHEET |
| |
| Quarterly, Unaudited |
| 3Q11 Change vs. | ||||||||||||||||||||||||||||||||
| (Thousands) | 3Q11 | 2Q11 | 1Q11 | 4Q10 | 3Q10 | 2Q11 | 3Q10 | |||||||||||||||||||||||||
| Assets: |
||||||||||||||||||||||||||||||||
| Earning assets: |
||||||||||||||||||||||||||||||||
| Loans, net of unearned income: |
||||||||||||||||||||||||||||||||
| Commercial, Financial, and Industrial (C&I) |
$ | 7,181,058 | $ | 6,867,893 | $ | 6,823,350 | $ | 7,229,808 | $ | 7,017,427 | 5% | 2% | ||||||||||||||||||||
| Income CRE |
1,308,059 | 1,362,459 | 1,422,837 | 1,472,182 | 1,570,928 | (4)% | (17)% | |||||||||||||||||||||||||
| Residential CRE |
169,049 | 203,721 | 249,777 | 306,292 | 361,217 | (17)% | (53)% | |||||||||||||||||||||||||
| Consumer real estate |
5,346,893 | 5,436,358 | 5,549,490 | 5,706,103 | 5,872,695 | (2)% | (9)% | |||||||||||||||||||||||||
| Permanent mortgage |
985,359 | 1,009,804 | 1,064,893 | 980,383 | 986,444 | (2)% | * | |||||||||||||||||||||||||
| Credit card and other |
292,800 | 299,904 | 299,861 | 318,000 | 338,987 | (2)% | (14)% | |||||||||||||||||||||||||
| Restricted real estate loans |
681,469 | 708,966 | 741,413 | 779,793 | 818,149 | (4)% | (17)% | |||||||||||||||||||||||||
| Total loans, net of unearned income (Restricted - $.7 billion) (a) (b) |
$ | 15,964,687 | $ | 15,889,105 | $ | 16,151,621 | $ | 16,792,561 | $ | 16,965,847 | * | (6)% | ||||||||||||||||||||
| Loans held for sale |
384,108 | 366,557 | 353,384 | 385,047 | 481,317 | 5% | (20)% | |||||||||||||||||||||||||
| Investment securities: |
||||||||||||||||||||||||||||||||
| U.S. Treasuries |
43,812 | 62,970 | 82,197 | 72,375 | 68,570 | (30)% | (36)% | |||||||||||||||||||||||||
| U.S. Government agencies |
2,990,375 | 2,938,623 | 2,669,852 | 2,418,015 | 2,198,754 | 2% | 36% | |||||||||||||||||||||||||
| States and municipalities |
19,365 | 23,869 | 26,015 | 38,914 | 41,756 | (19)% | (54)% | |||||||||||||||||||||||||
| Other |
221,664 | 220,440 | 224,565 | 228,866 | 244,766 | 1% | (9)% | |||||||||||||||||||||||||
| Total investment securities |
3,275,216 | 3,245,902 | 3,002,629 | 2,758,170 | 2,553,846 | 1% | 28% | |||||||||||||||||||||||||
| Capital markets securities inventory |
1,250,249 | 1,235,642 | 1,110,584 | 1,118,090 | 1,338,535 | 1% | (7)% | |||||||||||||||||||||||||
| Mortgage banking trading securities |
30,320 | 32,263 | 34,549 | 36,040 | 37,814 | (6)% | (20)% | |||||||||||||||||||||||||
| Other earning assets: |
||||||||||||||||||||||||||||||||
| Federal funds sold and securities purchased under agreements to resell |
660,048 | 653,984 | 581,861 | 553,432 | 572,078 | 1% | 15% | |||||||||||||||||||||||||
| Interest bearing cash (c) |
403,482 | 381,586 | 586,411 | 1,312,006 | 1,095,006 | 6% | (63)% | |||||||||||||||||||||||||
| Total other earning assets |
1,063,530 | 1,035,570 | 1,168,272 | 1,865,438 | 1,667,084 | 3% | (36)% | |||||||||||||||||||||||||
| Total earning assets (Restricted - $.7 billion) (a) |
21,968,110 | 21,805,039 | 21,821,039 | 22,955,346 | 23,044,443 | 1% | (5)% | |||||||||||||||||||||||||
| Allowance for loan losses (Restricted - $32.7 million) (a) |
(507,478 | ) | (567,923 | ) | (644,107 | ) | (717,297 | ) | (778,326 | ) | (11)% | (35)% | ||||||||||||||||||||
| Cash and due from banks (Restricted - $6.3 million) (a) |
346,100 | 343,162 | 351,488 | 338,619 | 363,445 | 1% | (5)% | |||||||||||||||||||||||||
| Capital markets receivables |
124,192 | 112,289 | 124,395 | 197,294 | 161,239 | 11% | (23)% | |||||||||||||||||||||||||
| Premises and equipment, net |
328,172 | 324,584 | 320,485 | 320,341 | 309,713 | 1% | 6% | |||||||||||||||||||||||||
| Other assets (Restricted - $13.8 million) (a) |
2,519,020 | 2,500,864 | 2,596,870 | 2,694,155 | 2,657,126 | 1% | (5)% | |||||||||||||||||||||||||
| Total assets (Restricted - $.7 billion) (a) |
$ | 24,778,116 | $ | 24,518,015 | $ | 24,570,170 | $ | 25,788,458 | $ | 25,757,640 | 1% | (4)% | ||||||||||||||||||||
| Liabilities and equity: |
||||||||||||||||||||||||||||||||
| Interest-bearing liabilities: |
||||||||||||||||||||||||||||||||
| Interest-bearing deposits: |
||||||||||||||||||||||||||||||||
| Other interest-bearing deposits |
$ | 2,900,808 | $ | 2,673,090 | $ | 2,662,421 | $ | 3,010,572 | $ | 3,008,241 | 9% | (4)% | ||||||||||||||||||||
| Savings |
6,479,880 | 6,320,779 | 6,184,409 | 5,926,061 | 5,782,596 | 3% | 12% | |||||||||||||||||||||||||
| Time deposits |
1,244,602 | 1,315,764 | 1,360,180 | 1,434,238 | 1,505,267 | (5)% | (17)% | |||||||||||||||||||||||||
| Total interest-bearing core deposits |
10,625,290 | 10,309,633 | 10,207,010 | 10,370,871 | 10,296,104 | 3% | 3% | |||||||||||||||||||||||||
| Certificates of deposit $100,000 and more |
507,086 | 547,262 | 560,805 | 558,860 | 617,560 | (7)% | (18)% | |||||||||||||||||||||||||
| Federal funds purchased and securities sold under agreements to repurchase |
2,081,379 | 2,130,832 | 2,259,138 | 2,618,819 | 2,523,719 | (2)% | (18)% | |||||||||||||||||||||||||
| Capital markets trading liabilities |
626,982 | 620,726 | 561,429 | 514,992 | 520,046 | 1% | 21% | |||||||||||||||||||||||||
| Other short-term borrowings and commercial paper |
284,163 | 340,015 | 172,601 | 207,315 | 199,588 | (16)% | 42% | |||||||||||||||||||||||||
| Term borrowings (Restricted - $.7 billion) (a) |
2,491,227 | 2,499,794 | 2,838,034 | 2,856,014 | 2,913,979 | * | (15)% | |||||||||||||||||||||||||
| Total interest-bearing liabilities |
16,616,127 | 16,448,262 | 16,599,017 | 17,126,871 | 17,070,996 | 1% | (3)% | |||||||||||||||||||||||||
| Noninterest-bearing deposits |
4,546,876 | 4,574,342 | 4,414,758 | 4,470,436 | 4,454,907 | (1)% | 2% | |||||||||||||||||||||||||
| Capital markets payables |
102,831 | 79,463 | 79,389 | 98,738 | 124,008 | 29% | (17)% | |||||||||||||||||||||||||
| Other liabilities |
789,190 | 735,786 | 795,176 | 823,170 | 799,734 | 7% | (1)% | |||||||||||||||||||||||||
| Equity |
2,723,092 | 2,680,162 | 2,681,830 | 3,269,243 | 3,307,995 | 2% | (18)% | |||||||||||||||||||||||||
| Total liabilities and equity (Restricted - $.7 billion) (a) |
$ | 24,778,116 | $ | 24,518,015 | $ | 24,570,170 | $ | 25,788,458 | $ | 25,757,640 | 1% | (4)% | ||||||||||||||||||||
NM - Not meaningful
* Amount is less than one percent.
| (a) | Restricted balances parenthetically presented are quarterly averages as of September 30, 2011. |
| (b) | Includes loans on nonaccrual status. |
| (c) | Includes excess balances held at Fed. |
11
Table of Contents
| CONSOLIDATED AVERAGE BALANCE SHEET: INCOME AND EXPENSE |
| |||
| Quarterly, Unaudited | ||||
| 3Q11 Change vs. | ||||||||||||||||||||||||||||||||
| (Thousands) | 3Q11 | 2Q11 | 1Q11 | 4Q10 | 3Q10 | 2Q11 | 3Q10 | |||||||||||||||||||||||||
| Assets: |
||||||||||||||||||||||||||||||||
| Earning assets: |
||||||||||||||||||||||||||||||||
| Loans, net of unearned income (a) |
$ | 163,773 | $ | 162,281 | $ | 164,747 | $ | 175,650 | $ | 177,059 | 1% | (8)% | ||||||||||||||||||||
| Loans held for sale |
5,126 | 3,267 | 3,657 | 3,487 | 4,747 | 57% | 8% | |||||||||||||||||||||||||
| Investment securities: |
||||||||||||||||||||||||||||||||
| U.S. Treasuries |
66 | 88 | 119 | 119 | 117 | (25)% | (44)% | |||||||||||||||||||||||||
| U.S. Government agencies |
27,615 | 28,643 | 26,513 | 24,753 | 24,181 | (4)% | 14% | |||||||||||||||||||||||||
| States and municipalities |
115 | 196 | 208 | 154 | 188 | (41)% | (39)% | |||||||||||||||||||||||||
| Other |
2,250 | 2,391 | 2,423 | 2,267 | 2,410 | (6)% | (7)% | |||||||||||||||||||||||||
| Total investment securities |
30,046 | 31,318 | 29,263 | 27,293 | 26,896 | (4)% | 12% | |||||||||||||||||||||||||
| Capital markets securities inventory |
10,141 | 10,479 | 10,027 | 10,039 | 13,479 | (3)% | (25)% | |||||||||||||||||||||||||
| Mortgage banking trading securities |
706 | 820 | 889 | 903 | 936 | (14)% | (25)% | |||||||||||||||||||||||||
| Other earning assets: |
||||||||||||||||||||||||||||||||
| Federal funds sold and securities purchased under agreements to resell (b) |
(58 | ) | (93 | ) | 78 | 130 | 169 | 38% | NM | |||||||||||||||||||||||
| Interest bearing cash |
180 | 180 | 330 | 806 | 669 | * | (73)% | |||||||||||||||||||||||||
| Total other earning assets |
122 | 87 | 408 | 936 | 838 | 40% | (85)% | |||||||||||||||||||||||||
| Total earning assets / interest income |
$ | 209,914 | $ | 208,252 | $ | 208,991 | $ | 218,308 | $ | 223,955 | 1% | (6)% | ||||||||||||||||||||
| Liabilities: |
||||||||||||||||||||||||||||||||
| Interest-bearing liabilities: |
||||||||||||||||||||||||||||||||
| Interest-bearing deposits: |
||||||||||||||||||||||||||||||||
| Other interest-bearing deposits |
$ | 1,650 | $ | 1,638 | $ | 1,552 | $ | 1,715 | $ | 1,959 | 1% | (16)% | ||||||||||||||||||||
| Savings |
6,773 | 7,018 | 7,250 | 7,821 | 7,975 | (3)% | (15)% | |||||||||||||||||||||||||
| Time deposits |
7,096 | 7,783 | 8,032 | 8,759 | 9,355 | (9)% | (24)% | |||||||||||||||||||||||||
| Total interest-bearing core deposits |
15,519 | 16,439 | 16,834 | 18,295 | 19,289 | (6)% | (20)% | |||||||||||||||||||||||||
| Certificates of deposit $100,000 and more |
2,328 | 2,612 | 2,710 | 2,894 | 3,324 | (11)% | (30)% | |||||||||||||||||||||||||
| Federal funds purchased and securities sold under agreements to repurchase |
1,159 | 1,237 | 1,324 | 1,569 | 1,518 | (6)% | (24)% | |||||||||||||||||||||||||
| Capital markets trading liabilities |
3,703 | 4,102 | 3,791 | 3,504 | 4,127 | (10)% | (10)% | |||||||||||||||||||||||||
| Other short-term borrowings and commercial paper |
229 | 231 | 216 | 370 | 307 | (1)% | (25)% | |||||||||||||||||||||||||
| Term borrowings |
9,081 | 9,274 | 9,975 | 8,392 | 8,456 | (2)% | 7% | |||||||||||||||||||||||||
| Total interest-bearing liabilities / interest expense |
32,019 | 33,895 | 34,850 | 35,024 | 37,021 | (6)% | (14)% | |||||||||||||||||||||||||
| Net interest income - tax equivalent basis |
177,895 | 174,357 | 174,141 | 183,284 | 186,934 | 2% | (5)% | |||||||||||||||||||||||||
| Fully taxable equivalent adjustment |
(1,555 | ) | (1,497 | ) | (1,386 | ) | (1,048 | ) | (791 | ) | (4)% | (97)% | ||||||||||||||||||||
| Net interest income |
$ | 176,340 | $ | 172,860 | $ | 172,755 | $ | 182,236 | $ | 186,143 | 2% | (5)% | ||||||||||||||||||||
NM - Not meaningful
* Amount is less than one percent.
Certain previously reported amounts have been reclassified to agree with current presentation.
| (a) | Includes loans on nonaccrual status. |
| (b) | 3Q11 and 2Q11 are driven by negative market rates on reverse repurchase agreements. |
12
Table of Contents
| CONSOLIDATED AVERAGE BALANCE SHEET: YIELDS AND RATES |
|
|||
|
Quarterly, Unaudited |
|
(Thousands) |
3Q11 | 2Q11 | 1Q11 | 4Q10 | 3Q10 | |||||||||||||||
| Assets: |
||||||||||||||||||||
| Earning assets: |
||||||||||||||||||||
| Loans, net of unearned income: |
||||||||||||||||||||
| Commercial loans |
3.84 | % | 3.90 | % | 3.84 | % | 3.99 | % | 3.92 | % | ||||||||||
| Retail loans |
4.37 | 4.31 | 4.42 | 4.36 | 4.41 | |||||||||||||||
| Total loans, net of unearned income (a) |
4.08 | 4.09 | 4.12 | 4.16 | 4.15 | |||||||||||||||
| Loans held for sale |
5.34 | 3.57 | 4.14 | 3.62 | 3.95 | |||||||||||||||
| Investment securities: |
||||||||||||||||||||
| U.S. Treasuries |
0.60 | 0.56 | 0.59 | 0.65 | 0.68 | |||||||||||||||
| U.S. Government agencies |
3.69 | 3.90 | 3.97 | 4.09 | 4.40 | |||||||||||||||
| States and municipalities |
2.39 | 3.29 | 3.19 | 1.58 | 1.80 | |||||||||||||||
| Other |
4.06 | 4.34 | 4.32 | 3.96 | 3.94 | |||||||||||||||
| Total investment securities |
3.67 | 3.86 | 3.90 | 3.96 | 4.21 | |||||||||||||||
| Capital markets securities inventory |
3.24 | 3.39 | 3.61 | 3.59 | 4.03 | |||||||||||||||
| Mortgage banking trading securities |
9.31 | 10.17 | 10.29 | 10.02 | 9.90 | |||||||||||||||
| Other earning assets: |
||||||||||||||||||||
| Federal funds sold and securities purchased under agreements to resell (b) |
(0.03 | ) | (0.06 | ) | 0.05 | 0.09 | 0.12 | |||||||||||||
| Interest bearing cash |
0.18 | 0.19 | 0.23 | 0.24 | 0.24 | |||||||||||||||
| Total other earning assets (c) |
0.05 | 0.03 | 0.14 | 0.20 | 0.20 | |||||||||||||||
| Total earning assets / interest income |
3.80 | % | 3.83 | % | 3.86 | % | 3.79 | % | 3.87 | % | ||||||||||
| Liabilities: |
||||||||||||||||||||
| Interest-bearing liabilities: |
||||||||||||||||||||
| Interest-bearing deposits: |
||||||||||||||||||||
| Other interest-bearing deposits |
0.23 | % | 0.25 | % | 0.24 | % | 0.23 | % | 0.26 | % | ||||||||||
| Savings |
0.41 | 0.45 | 0.48 | 0.52 | 0.55 | |||||||||||||||
| Time deposits |
2.26 | 2.37 | 2.39 | 2.42 | 2.47 | |||||||||||||||
| Total interest-bearing core deposits |
0.58 | 0.64 | 0.67 | 0.70 | 0.74 | |||||||||||||||
| Certificates of deposit $100,000 and more |
1.82 | 1.91 | 1.96 | 2.05 | 2.14 | |||||||||||||||
| Federal funds purchased and securities sold under agreements to repurchase |
0.22 | 0.23 | 0.24 | 0.24 | 0.24 | |||||||||||||||
| Capital markets trading liabilities |
2.34 | 2.65 | 2.74 | 2.70 | 3.15 | |||||||||||||||
| Other short-term borrowings and commercial paper |
0.32 | 0.27 | 0.51 | 0.71 | 0.61 | |||||||||||||||
| Term borrowings (d) |
1.46 | 1.49 | 1.41 | 1.18 | 1.16 | |||||||||||||||
| Total interest-bearing liabilities / interest expense |
0.77 | 0.83 | 0.85 | 0.81 | 0.86 | |||||||||||||||
| Net interest spread |
3.00 | % | 3.00 | % | 3.01 | % | 2.98 | % | 3.01 | % | ||||||||||
| Effect of interest-free sources used to fund earning assets |
0.20 | 0.20 | 0.21 | 0.20 | 0.22 | |||||||||||||||
| Net interest margin |
3.23 | % | 3.20 | % | 3.22 | % | 3.18 | % | 3.23 | % | ||||||||||
Yields are adjusted to a fully taxable equivalent (“FTE”). Refer to the Non-GAAP to GAAP Reconciliation on page 29 for reconciliation of net interest income (GAAP) to net interest income adjusted for impact of FTE - (non-GAAP).
| (a) | Includes loans on nonaccrual status. |
| (b) | 3Q11 and 2Q11 are driven by negative market rates on reverse repurchase agreements. |
| (c) | Earning assets yields are expressed net of unearned income. |
| (d) | Rates are expressed net of unamortized debenture cost for term borrowings. |
13
Table of Contents
| MORTGAGE SERVICING RIGHTS |
| |
| Quarterly, Unaudited |
| 3Q11 Change vs. | ||||||||||||||||||||||||||||||
| (Thousands) |
3Q11 | 2Q11 | 1Q11 | 4Q10 | 3Q10 | 2Q11 | 3Q10 | |||||||||||||||||||||||
| First Liens |
||||||||||||||||||||||||||||||
| Fair value beginning balance |
$ | 183,530 | $ | 204,257 | $ | 203,812 | $ | 188,397 | $ | 197,953 | ||||||||||||||||||||
| Reductions due to loan payments |
(5,286 | ) | (5,522 | ) | (7,163 | ) | (10,160 | ) | (8,752 | ) | ||||||||||||||||||||
| Reductions due to sale |
- | - | - | - | - | |||||||||||||||||||||||||
| Reductions due to exercise of cleanup calls |
- | (195 | ) | - | (1,110 | ) | - | |||||||||||||||||||||||
| Changes in fair value due to: |
||||||||||||||||||||||||||||||
| Changes in valuation model inputs or assumptions (a) |
(30,813 | ) | (15,010 | ) | 7,592 | 26,685 | 385 | |||||||||||||||||||||||
| Other changes in fair value |
- | - | 16 | - | (1,189 | ) | ||||||||||||||||||||||||
| Fair value ending balance |
$ | 147,431 | $ | 183,530 | $ | 204,257 | $ | 203,812 | $ | 188,397 | (20)% | (22)% | ||||||||||||||||||
| Second Liens |
||||||||||||||||||||||||||||||
| Fair value beginning balance |
$ | 251 | $ | 259 | $ | 262 | $ | 250 | $ | 242 | ||||||||||||||||||||
| Reductions due to loan payments |
(10 | ) | (8 | ) | (13 | ) | (17 | ) | (8 | ) | ||||||||||||||||||||
| Changes in fair value due to: |
||||||||||||||||||||||||||||||
| Other changes in fair value |
- | - | 10 | 29 | 16 | |||||||||||||||||||||||||
| Fair value ending balance |
$ | 241 | $ | 251 | $ | 259 | $ | 262 | $ | 250 | (4)% | (4)% | ||||||||||||||||||
| HELOC |
||||||||||||||||||||||||||||||
| Fair value beginning balance |
$ | 3,177 | $ | 3,232 | $ | 3,245 | $ | 3,296 | $ | 3,551 | ||||||||||||||||||||
| Reductions due to loan payments |
(59 | ) | (59 | ) | (42 | ) | (76 | ) | (514 | ) | ||||||||||||||||||||
| Changes in fair value due to: |
||||||||||||||||||||||||||||||
| Other changes in fair value |
13 | 4 | 29 | 25 | 259 | |||||||||||||||||||||||||
| Fair value ending balance |
$ | 3,131 | $ | 3,177 | $ | 3,232 | $ | 3,245 | $ | 3,296 | (1)% | (5)% | ||||||||||||||||||
| Total Consolidated |
||||||||||||||||||||||||||||||
| Fair value beginning balance |
$ | 186,958 | $ | 207,748 | $ | 207,319 | $ | 191,943 | $ | 201,746 | ||||||||||||||||||||
| Reductions due to loan payments |
(5,355 | ) | (5,589 | ) | (7,218 | ) | (10,253 | ) | (9,274 | ) | ||||||||||||||||||||
| Reductions due to sale |
- | - | - | - | - | |||||||||||||||||||||||||
| Reductions due to exercise of cleanup calls |
- | (195 | ) | - | (1,110 | ) | - | |||||||||||||||||||||||
| Changes in fair value due to: |
||||||||||||||||||||||||||||||
| Changes in valuation model inputs or assumptions (a) |
(30,813 | ) | (15,010 | ) | 7,592 | 26,685 | 385 | |||||||||||||||||||||||
| Other changes in fair value |
13 | 4 | 55 | 54 | (914 | ) | ||||||||||||||||||||||||
| Fair value ending balance |
$ | 150,803 | $ | 186,958 | $ | 207,748 | $ | 207,319 | $ | 191,943 | (19)% | (21)% | ||||||||||||||||||
| (a) | Principally reflects changes in discount rates and prepayment speed assumptions, mostly due to changes in interest rates. |
14
Table of Contents
| BUSINESS SEGMENT HIGHLIGHTS |
| |
|
Quarterly, Unaudited |
| 3Q11 Change vs. | ||||||||||||||||||||||||||||||
| (Thousands) |
3Q11 | 2Q11 | 1Q11 | 4Q10 | 3Q10 | 2Q11 | 3Q10 | |||||||||||||||||||||||
| Regional Banking |
||||||||||||||||||||||||||||||
| Net interest income |
$ | 140,603 | $ | 136,249 | $ | 134,671 | $ | 144,492 | $ | 142,220 | 3% | (1)% | ||||||||||||||||||
| Noninterest income |
67,952 | 67,696 | 66,156 | 70,774 | 71,970 | * | (6)% | |||||||||||||||||||||||
| Total revenues |
208,555 | 203,945 | 200,827 | 215,266 | 214,190 | 2% | (3)% | |||||||||||||||||||||||
| Provision for loan losses |
(22,698 | ) | (13,748 | ) | (12,404 | ) | 2,002 | 10,298 | 65% | NM | ||||||||||||||||||||
| Noninterest expense |
137,300 | 143,353 | 147,800 | 150,052 | 152,173 | (4)% | (10)% | |||||||||||||||||||||||
| Income before income taxes |
93,953 | 74,340 | 65,431 | 63,212 | 51,719 | 26% | 82% | |||||||||||||||||||||||
| Provision for income taxes |
34,739 | 27,268 | 23,948 | 22,894 | 18,822 | 27% | 85% | |||||||||||||||||||||||
| Net income |
$ | 59,214 | $ | 47,072 | $ | 41,483 | $ | 40,318 | $ | 32,897 | 26% | 80% | ||||||||||||||||||
| Capital Markets |
||||||||||||||||||||||||||||||
| Net interest income |
$ | 5,555 | $ | 5,564 | $ | 5,576 | $ | 5,877 | $ | 8,584 | * | (35)% | ||||||||||||||||||
| Noninterest income |
99,505 | 77,925 | 90,080 | 94,555 | 114,055 | 28% | (13)% | |||||||||||||||||||||||
| Total revenues |
105,060 | 83,489 | 95,656 | 100,432 | 122,639 | 26% | (14)% | |||||||||||||||||||||||
| Noninterest expense (a) |
77,163 | 103,378 | 73,558 | 76,812 | 79,434 | (25)% | (3)% | |||||||||||||||||||||||
| Income/(loss) before income taxes |
27,897 | (19,889 | ) | 22,098 | 23,620 | 43,205 | NM | (35)% | ||||||||||||||||||||||
| Provision/(benefit) for income taxes |
10,659 | (7,734 | ) | 8,436 | 8,829 | 16,214 | NM | (34)% | ||||||||||||||||||||||
| Net income/(loss) |
$ | 17,238 | $ | (12,155 | ) | $ | 13,662 | $ | 14,791 | $ | 26,991 | NM | (36)% | |||||||||||||||||
| Corporate |
||||||||||||||||||||||||||||||
| Net interest income/(expense) |
$ | (463 | ) | $ | 444 | $ | (269 | ) | $ | (2,064 | ) | $ | (2,845 | ) | NM | 84% | ||||||||||||||
| Noninterest income |
38,058 | 9,007 | 12,871 | 26,252 | 7,943 | NM | NM | |||||||||||||||||||||||
| Total revenues |
37,595 | 9,451 | 12,602 | 24,188 | 5,098 | NM | NM | |||||||||||||||||||||||
| Noninterest expense |
19,013 | 36,288 | 20,672 | 19,014 | 19,413 | (48)% | (2)% | |||||||||||||||||||||||
| Income/(loss) before income taxes |
18,582 | (26,837 | ) | (8,070 | ) | 5,174 | (14,315 | ) | NM | NM | ||||||||||||||||||||
| Provision/(benefit) for income taxes |
666 | (18,844 | ) | (10,533 | ) | (9,008 | ) | (15,449 | ) | NM | NM | |||||||||||||||||||
| Net income/(loss) |
$ | 17,916 | $ | (7,993 | ) | $ | 2,463 | $ | 14,182 | $ | 1,134 | NM | NM | |||||||||||||||||
| Non-Strategic |
||||||||||||||||||||||||||||||
| Net interest income |
$ | 30,645 | $ | 30,603 | $ | 32,777 | $ | 33,931 | $ | 38,184 | * | (20)% | ||||||||||||||||||
| Noninterest income |
15,372 | 32,965 | 27,228 | 13,583 | 48,737 | (53)% | (68)% | |||||||||||||||||||||||
| Total revenues |
46,017 | 63,568 | 60,005 | 47,514 | 86,921 | (28)% | (47)% | |||||||||||||||||||||||
| Provision for loan losses |
54,698 | 14,748 | 13,404 | 42,998 | 39,702 | NM | 38% | |||||||||||||||||||||||
| Noninterest expense |
89,232 | 61,436 | 71,766 | 82,416 | 90,470 | 45% | (1)% | |||||||||||||||||||||||
| Loss before income taxes |
(97,913 | ) | (12,616 | ) | (25,165 | ) | (77,900 | ) | (43,251 | ) | NM | NM | ||||||||||||||||||
| Benefit for income taxes |
(37,697 | ) | (4,857 | ) | (9,689 | ) | (29,352 | ) | (16,297 | ) | NM | NM | ||||||||||||||||||
| Loss from continuing operations |
(60,216 | ) | (7,759 | ) | (15,476 | ) | (48,548 | ) | (26,954 | ) | NM | NM | ||||||||||||||||||
| Income/(loss) from discontinued operations, net of tax |
4,828 | 3,671 | 871 | (3,435 | ) | (358 | ) | 32% | NM | |||||||||||||||||||||
| Net loss |
$ | (55,388 | ) | $ | (4,088 | ) | $ | (14,605 | ) | $ | (51,983 | ) | $ | (27,312 | ) | NM | NM | |||||||||||||
| Total Consolidated |
||||||||||||||||||||||||||||||
| Net interest income |
$ | 176,340 | $ | 172,860 | $ | 172,755 | $ | 182,236 | $ | 186,143 | 2% | (5)% | ||||||||||||||||||
| Noninterest income |
220,887 | 187,593 | 196,335 | 205,164 | 242,705 | 18% | (9)% | |||||||||||||||||||||||
| Total revenues |
397,227 | 360,453 | 369,090 | 387,400 | 428,848 | 10% | (7)% | |||||||||||||||||||||||
| Provision for loan losses |
32,000 | 1,000 | 1,000 | 45,000 | 50,000 | NM | (36)% | |||||||||||||||||||||||
| Noninterest expense |
322,708 | 344,455 | 313,796 | 328,294 | 341,490 | (6)% | (6)% | |||||||||||||||||||||||
| Income before income taxes |
42,519 | 14,998 | 54,294 | 14,106 | 37,358 | NM | 14% | |||||||||||||||||||||||
| Provision/(benefit) for income taxes |
8,367 | (4,167 | ) | 12,162 | (6,637 | ) | 3,290 | NM | NM | |||||||||||||||||||||
| Income from continuing operations |
34,152 | 19,165 | 42,132 | 20,743 | 34,068 | 78% | * | |||||||||||||||||||||||
| Income/(loss) from discontinued operations, net of tax |
4,828 | 3,671 | 871 | (3,435 | ) | (358 | ) | 32% | NM | |||||||||||||||||||||
| Net income |
$ | 38,980 | $ | 22,836 | $ | 43,003 | $ | 17,308 | $ | 33,710 | 71% | 16% | ||||||||||||||||||
NM - Not meaningful
| * | Amount is less than one percent. |
Certain previously reported amounts have been reclassified to agree with current presentation.
| (a) | 2Q11 includes a $36.7 million loss accrual related to a litigation settlement. |
15
Table of Contents
| REGIONAL BANKING |
| |
|
Quarterly, Unaudited |
| 3Q11 Change vs. | ||||||||||||||||||||||||||||||
| (Thousands) |
3Q11 | 2Q11 | 1Q11 | 4Q10 | 3Q10 | 2Q11 | 3Q10 | |||||||||||||||||||||||
| Income Statement |
||||||||||||||||||||||||||||||
| Net interest income |
$ | 140,603 | $ | 136,249 | $ | 134,671 | $ | 144,492 | $ | 142,220 | 3% | (1)% | ||||||||||||||||||
| Provision for loan losses |
(22,698 | ) | (13,748 | ) | (12,404 | ) | 2,002 | 10,298 | 65% | NM | ||||||||||||||||||||
| Noninterest income |
67,952 | 67,696 | 66,156 | 70,774 | 71,970 | * | (6)% | |||||||||||||||||||||||
| Noninterest expense |
137,300 | 143,353 | 147,800 | 150,052 | 152,173 | (4)% | (10)% | |||||||||||||||||||||||
| Income before income taxes |
$ | 93,953 | $ | 74,340 | $ | 65,431 | $ | 63,212 | $ | 51,719 | 26% | 82% | ||||||||||||||||||
| Efficiency ratio (a) |
65.83 | % | 70.29 | % | 73.60 | % | 69.71 | % | 71.05 | % | ||||||||||||||||||||
| Balance Sheet (millions) |
||||||||||||||||||||||||||||||
| Average loans |
$ | 10,844 | $ | 10,528 | $ | 10,516 | $ | 10,994 | $ | 10,863 | 3% | * | ||||||||||||||||||
| Average other earning assets |
58 | 58 | 71 | 103 | 201 | * | (71)% | |||||||||||||||||||||||
| Total average earning assets |
10,902 | 10,586 | 10,587 | 11,097 | 11,064 | 3% | (1)% | |||||||||||||||||||||||
| Average core deposits |
13,078 | 12,736 | 12,456 | 12,489 | 12,217 | 3% | 7% | |||||||||||||||||||||||
| Average other deposits |
507 | 547 | 561 | 560 | 605 | (7)% | (16)% | |||||||||||||||||||||||
| Total average deposits |
13,585 | 13,283 | 13,017 | 13,049 | 12,822 | 2% | 6% | |||||||||||||||||||||||
| Total period end deposits |
13,729 | 13,664 | 13,236 | 13,094 | 12,773 | * | 7% | |||||||||||||||||||||||
| Total period end assets |
12,066 | 11,417 | 11,063 | 11,636 | 11,808 | 6% | 2% | |||||||||||||||||||||||
| Net interest margin (b) |
5.17 | % | 5.21 | % | 5.20 | % | 5.20 | % | 5.13 | % | ||||||||||||||||||||
| Loan yield |
4.01 | 4.02 | 4.04 | 4.07 | 4.12 | |||||||||||||||||||||||||
| Deposit average yield |
0.48 | 0.54 | 0.57 | 0.60 | 0.65 | |||||||||||||||||||||||||
| Noninterest Income Detail (thousands) |
||||||||||||||||||||||||||||||
| NSF / Overdraft fees |
$ | 14,239 | $ | 13,316 | $ | 11,749 | $ | 13,678 | $ | 14,039 | 7% | 1% | ||||||||||||||||||
| Cash management fees |
9,206 | 9,536 | 9,132 | 10,148 | 9,509 | (3)% | (3)% | |||||||||||||||||||||||
| Debit card income |
6,826 | 6,941 | 6,414 | 6,414 | 6,408 | (2)% | 7% | |||||||||||||||||||||||
| Other |
5,256 | 4,738 | 4,777 | 4,421 | 4,307 | 11% | 22% | |||||||||||||||||||||||
| Total deposit transactions and cash management |
35,527 | 34,531 | 32,072 | 34,661 | 34,263 | 3% | 4% | |||||||||||||||||||||||
| Insurance commissions |
732 | 756 | 679 | 579 | 695 | (3)% | 5% | |||||||||||||||||||||||
| Trust services and investment management |
6,098 | 6,714 | 6,354 | 6,312 | 6,218 | (9)% | (2)% | |||||||||||||||||||||||
| Bankcard income |
4,882 | 4,759 | 4,322 | 4,564 | 4,537 | 3% | 8% | |||||||||||||||||||||||
| Mortgage banking |
1,121 | 947 | 2,591 | 5,736 | 3,997 | 18% | (72)% | |||||||||||||||||||||||
| Other service charges |
3,312 | 3,359 | 3,526 | 3,506 | 3,504 | (1)% | (5)% | |||||||||||||||||||||||
| Miscellaneous revenue |
16,280 | 16,630 | 16,612 | 15,416 | 18,756 | (2)% | (13)% | |||||||||||||||||||||||
| Total noninterest income |
$ | 67,952 | $ | 67,696 | $ | 66,156 | $ | 70,774 | $ | 71,970 | * | (6)% | ||||||||||||||||||
| Key Statistics |
||||||||||||||||||||||||||||||
| Financial center locations |
176 | 178 | 178 | 183 | 182 | (1)% | (3)% | |||||||||||||||||||||||
| Trust assets - total managed assets (millions) |
$ | 3,296 | $ | 3,421 | $ | 4,756 | $ | 4,955 | $ | 4,892 | (4)% | (33)% | ||||||||||||||||||
| First lien mortgage production (millions) |
$ | 54 | $ | 51 | $ | 111 | $ | 262 | $ | 225 | 6% | (76)% | ||||||||||||||||||
NM - Not meaningful
| * | Amount is less than one percent. |
Certain previously reported amounts have been reclassified to agree with current presentation.
| (a) | Noninterest expense divided by total revenue. |
| (b) | Net interest margin is computed using total net interest income adjusted for FTE. Refer to the Non-GAAP to GAAP Reconciliation on page 29 of this supplement. |
16
Table of Contents
| CAPITAL MARKETS |
| |
|
Quarterly, Unaudited |
| 3Q11 Change vs. | ||||||||||||||||||||||||||||||
| (Thousands) |
3Q11 | 2Q11 | 1Q11 | 4Q10 | 3Q10 | 2Q11 | 3Q10 | |||||||||||||||||||||||
| Income Statement |
||||||||||||||||||||||||||||||
| Net interest income |
$ | 5,555 | $ | 5,564 | $ | 5,576 | $ | 5,877 | $ | 8,584 | * | (35)% | ||||||||||||||||||
| Noninterest income: |
||||||||||||||||||||||||||||||
| Fixed income |
92,624 | 71,164 | 83,194 | 86,106 | 106,908 | 30% | (13)% | |||||||||||||||||||||||
| Other |
6,881 | 6,761 | 6,886 | 8,449 | 7,147 | 2% | (4)% | |||||||||||||||||||||||
| Total noninterest income |
99,505 | 77,925 | 90,080 | 94,555 | 114,055 | 28% | (13)% | |||||||||||||||||||||||
| Noninterest expense (a) |
77,163 | 103,378 | 73,558 | 76,812 | 79,434 | (25)% | (3)% | |||||||||||||||||||||||
| Income/(loss) before income taxes |
$ | 27,897 | $ | (19,889 | ) | $ | 22,098 | $ | 23,620 | $ | 43,205 | NM | (35)% | |||||||||||||||||
| Efficiency ratio (b) |
73.45 | % | NM | 76.90 | % | 76.48 | % | 64.77 | % | |||||||||||||||||||||
| Fixed income average daily revenue |
$ | 1,447 | $ | 1,130 | $ | 1,342 | $ | 1,389 | $ | 1,670 | 28% | (13)% | ||||||||||||||||||
| Balance Sheet (millions) |
||||||||||||||||||||||||||||||
| Average trading inventory |
$ | 1,250 | $ | 1,236 | $ | 1,111 | $ | 1,118 | $ | 1,339 | 1% | (7)% | ||||||||||||||||||
| Average other earning assets |
689 | 664 | 579 | 541 | 553 | 4% | 25% | |||||||||||||||||||||||
| Average total earning assets |
1,939 | 1,900 | 1,690 | 1,659 | 1,892 | 2% | 2% | |||||||||||||||||||||||
| Total period end assets |
2,782 | 2,693 | 2,256 | 1,529 | 2,637 | 3% | 5% | |||||||||||||||||||||||
| Net interest margin (c) |
1.17 | % | 1.18 | % | 1.32 | % | 1.44 | % | 1.84 | % | ||||||||||||||||||||
NM - Not meaningful
* Amount is less than one percent.
Certain previously reported amounts have been reclassified to agree with current presentation.
| (a) | 2Q11 includes a $36.7 million loss accrual related to a litigation settlement. |
| (b) | Noninterest expense divided by total revenue. |
| (c) | Net interest margin is computed using total net interest income adjusted for FTE. Refer to the Non-GAAP to GAAP Reconciliation on page 29 of this supplement. |
17
Table of Contents
| CORPORATE |
| |
| Quarterly, Unaudited |
| 3Q11 Change vs. | ||||||||||||||||||||||||||||||
| (Thousands) |
3Q11 | 2Q11 | 1Q11 | 4Q10 | 3Q10 | 2Q11 | 3Q10 | |||||||||||||||||||||||
| Income Statement |
||||||||||||||||||||||||||||||
| Net interest income/(expense) |
$ | (463 | ) | $ | 444 | $ | (269 | ) | $ | (2,064 | ) | $ | (2,845 | ) | NM | (84)% | ||||||||||||||
| Noninterest income |
2,911 | 9,005 | 12,100 | 10,718 | 7,943 | (68)% | (63)% | |||||||||||||||||||||||
| Securities gains, net |
35,147 | 2 | 771 | 15,534 | - | NM | NM | |||||||||||||||||||||||
| Noninterest expense |
19,013 | 36,288 | 20,672 | 19,014 | 19,413 | (48)% | (2)% | |||||||||||||||||||||||
| Income/(loss) before income taxes |
$ | 18,582 | $ | (26,837 | ) | $ | (8,070 | ) | $ | 5,174 | $ | (14,315 | ) | NM | NM | |||||||||||||||
| Average Balance Sheet (millions) |
||||||||||||||||||||||||||||||
| Average loans |
$ | 168 | $ | 151 | $ | 159 | $ | 35 | $ | - | 11% | NM | ||||||||||||||||||
| Total earning assets |
$ | 3,812 | $ | 3,747 | $ | 3,712 | $ | 4,052 | $ | 3,572 | 2% | 7% | ||||||||||||||||||
| Net interest margin (a) |
(.01 | )% | .04 | % | (.08 | )% | (.16 | )% | (.27 | )% | ||||||||||||||||||||
NM - Not meaningful
* Amount is less than one percent.
Certain previously reported amounts have been reclassified to agree with current presentation.
| (a) | Net interest margin is computed using total net interest income adjusted for FTE. Refer to the Non-GAAP to GAAP Reconciliation on page 29 of this supplement. |
18
Table of Contents
| NON-STRATEGIC |
| |
| Quarterly, Unaudited |
| 3Q11 Change vs. | ||||||||||||||||||||||||||||||
| (Thousands) |
3Q11 | 2Q11 | 1Q11 | 4Q10 | 3Q10 | 2Q11 | 3Q10 | |||||||||||||||||||||||
| Income Statement |
||||||||||||||||||||||||||||||
| Net interest income |
$ | 30,645 | $ | 30,603 | $ | 32,777 | $ | 33,931 | $ | 38,184 | * | (20)% | ||||||||||||||||||
| Noninterest income |
15,357 | 32,965 | 27,202 | 13,436 | 51,664 | (53)% | (70)% | |||||||||||||||||||||||
| Securities gains/(losses), net |
15 | - | 26 | 147 | (2,927 | ) | NM | NM | ||||||||||||||||||||||
| Noninterest expense: |
||||||||||||||||||||||||||||||
| Repurchase and foreclosure provision |
52,791 | 24,563 | 37,203 | 44,223 | 48,714 | NM | 8% | |||||||||||||||||||||||
| Other expenses |
36,441 | 36,873 | 34,563 | 38,193 | 41,756 | (1)% | (13)% | |||||||||||||||||||||||
| Total noninterest expense |
89,232 | 61,436 | 71,766 | 82,416 | 90,470 | 45% | (1)% | |||||||||||||||||||||||
| Provision for loan losses |
54,698 | 14,748 | 13,404 | 42,998 | 39,702 | NM | 38% | |||||||||||||||||||||||
| Loss before income taxes |
$ | (97,913 | ) | $ | (12,616 | ) | $ | (25,165 | ) | $ | (77,900 | ) | $ | (43,251 | ) | NM | NM | |||||||||||||
| Average Balance Sheet (millions) |
||||||||||||||||||||||||||||||
| Loans |
$ | 4,951 | $ | 5,206 | $ | 5,474 | $ | 5,760 | $ | 6,101 | (5)% | (19)% | ||||||||||||||||||
| Loans held for sale |
302 | 303 | 290 | 299 | 304 | * | (1)% | |||||||||||||||||||||||
| Trading securities |
30 | 32 | 35 | 36 | 38 | (6)% | (21)% | |||||||||||||||||||||||
| Mortgage servicing rights |
174 | 194 | 208 | 192 | 195 | (10)% | (11)% | |||||||||||||||||||||||
| Other assets |
422 | 366 | 357 | 347 | 328 | 15% | 28% | |||||||||||||||||||||||
| Total assets |
5,879 | 6,101 | 6,364 | 6,634 | 6,966 | (4)% | (16)% | |||||||||||||||||||||||
| Escrow balances |
338 | 484 | 514 | 660 | 699 | (30)% | (52)% | |||||||||||||||||||||||
| Net interest margin (a) |
2.30 | % | 2.20 | % | 2.26 | % | 2.20 | % | 2.33 | % | ||||||||||||||||||||
| Efficiency ratio (b) |
193.98 | % | 96.65 | % | 119.65 | % | 173.99 | % | 100.69 | % | ||||||||||||||||||||
| Mortgage warehouse (millions) |
||||||||||||||||||||||||||||||
| Ending warehouse balance (loans held for sale) |
$ | 299 | $ | 307 | $ | 293 | $ | 290 | $ | 303 | (3)% | (1)% | ||||||||||||||||||
NM - Not meaningful
* Amount is less than one percent.
Certain previously reported amounts have been reclassified to agree with current presentation.
| (a) | Net interest margin is computed using total net interest income adjusted for FTE. Refer to the Non-GAAP to GAAP Reconciliation on page 29 of this supplement. |
| (b) | Noninterest expense divided by total revenue excluding securities gains/(losses). |
19
Table of Contents
| NON-STRATEGIC: MORTGAGE SERVICING |
| |
|
Quarterly, Unaudited |
| 3Q11 Change vs. | ||||||||||||||||||||||||||||||||||
| (Thousands) |
3Q11 | 2Q11 | 1Q11 | 4Q10 | 3Q10 | 2Q11 | 3Q10 | |||||||||||||||||||||||||||
| Servicing Income |
||||||||||||||||||||||||||||||||||
| Service fees |
$ | 16,731 | $ | 19,248 | $ | 20,827 | $ | 17,119 | $ | 21,351 | (13 | )% | (22 | )% | ||||||||||||||||||||
| Change in MSR value - runoff |
(5,286 | ) | (5,526 | ) | (7,164 | ) | (10,160 | ) | (8,752 | ) | (4 | )% | (40 | )% | ||||||||||||||||||||
| Hedging results |
7,033 | 15,416 | 12,472 | 7,026 | 31,824 | (54 | )% | (78 | )% | |||||||||||||||||||||||||
| Total servicing income |
$ | 18,478 | $ | 29,138 | $ | 26,135 | $ | 13,985 | $ | 44,423 | (37 | )% | (58 | )% | ||||||||||||||||||||
| Key Servicing Metrics (millions) (a) |
||||||||||||||||||||||||||||||||||
| Ending servicing portfolio (b) |
$ | 23,650 | $ | 25,223 | $ | 26,452 | $ | 27,787 | $ | 29,787 | (6 | )% | (21 | )% | ||||||||||||||||||||
| Average servicing portfolio (b) |
24,562 | 25,666 | 26,862 | 28,418 | 30,523 | (4 | )% | (20 | )% | |||||||||||||||||||||||||
| Average number of loans serviced (b) |
140,270 | 146,520 | 152,083 | 158,743 | 170,931 | (4 | )% | (18 | )% | |||||||||||||||||||||||||
| Portfolio Product Mix (Average) (a) |
||||||||||||||||||||||||||||||||||
| GNMA |
3 | % | 3 | % | 3 | % | 3 | % | 3 | % | ||||||||||||||||||||||||
| FNMA/FHLMC |
36 | % | 36 | % | 36 | % | 36 | % | 37 | % | ||||||||||||||||||||||||
| Private |
57 | % | 57 | % | 57 | % | 57 | % | 56 | % | ||||||||||||||||||||||||
| Sub-Total |
96 | % | 96 | % | 96 | % | 96 | % | 96 | % | ||||||||||||||||||||||||
| Warehouse |
4 | % | 4 | % | 4 | % | 4 | % | 4 | % | ||||||||||||||||||||||||
| Total |
100 | % | 100 | % | 100 | % | 100 | % | 100 | % | ||||||||||||||||||||||||
| Other Portfolio Statistics |
||||||||||||||||||||||||||||||||||
| Weighted average base servicing fee - legacy mortgage banking (c) |
34 | 34 | 34 | 34 | 34 | |||||||||||||||||||||||||||||
| Weighted average base servicing fee - legacy equity lending (HELOCs and ILs) |
50 | 50 | 50 | 50 | 50 | |||||||||||||||||||||||||||||
| Servicing cost per loan (annualized) (d) |
$ | 223.03 | $ | 135.34 | $ | 121.47 | $ | 124.84 | $ | 97.68 | ||||||||||||||||||||||||
| Average mortgage trading securities |
$ | 30 | $ | 32 | $ | 35 | $ | 36 | $ | 38 | ||||||||||||||||||||||||
| Average MSR (millions) |
174 | 194 | 208 | 192 | 195 | |||||||||||||||||||||||||||||
| Servicing book value (bps) (e) (f) |
75 | 79 | 80 | 72 | 69 | |||||||||||||||||||||||||||||
| Change in MSR asset / average servicing asset |
3 | % | 22 | % | 5 | % | (8 | )% | 43 | % | ||||||||||||||||||||||||
| 90+ Delinquency rate, excluding foreclosures (g) |
12.47 | % | 11.35 | % | 11.57 | % | 11.46 | % | 10.93 | % | ||||||||||||||||||||||||
Certain previously reported amounts have been reclassified to agree with current presentation.
| (a) | Includes servicing of first liens, second liens, and HELOCs. |
| (b) | Includes loans serviced from FHN’s legacy mortgage banking business, legacy equity lending, and FHN’s portfolio loans. Excludes UPB of loans transferred that did not qualify for sales treatment. |
| (c) | Includes weighted average fee of servicing assets and excess interest. |
| (d) | Calculated based on fees charged by subservicer divided by average number of loans serviced during the quarter. Base subservicing costs increased driven by transfer to new subservicer. |
| (e) | Includes average MSR and mortgage trading securities divided by total average servicing portfolio. |
| (f) | For purposes of this calculation, average MSR excludes servicing transferred that did not qualify for sales treatment due to certain recourse provisions. |
| (g) | Excludes delinquency of second liens and HELOCs. |
20
Table of Contents
| CAPITAL HIGHLIGHTS |
| |
|
Quarterly, Unaudited |
| 3Q11 Change vs. | ||||||||||||||||||||||||||||||
| (Dollars in thousands, except per share amounts) |
3Q11 | 2Q11 | 1Q11 | 4Q10 | 3Q10 | 2Q11 | 3Q10 | |||||||||||||||||||||||
| Tier 1 capital (a) (b) |
$ | 2,875,112 | $ | 2,818,535 | $ | 2,790,335 | $ | 2,812,471 | $ | 3,526,115 | 2% | (18)% | ||||||||||||||||||
| Tier 2 capital (a) |
750,691 | 748,225 | 868,792 | 937,115 | 940,784 | * | (20)% | |||||||||||||||||||||||
| Total capital (a) |
$ | 3,625,803 | $ | 3,566,760 | $ | 3,659,127 | $ | 3,749,586 | $ | 4,466,899 | 2% | (19)% | ||||||||||||||||||
| Risk weighted assets (a) |
$ | 19,867,400 | $ | 19,589,310 | $ | 19,569,006 | $ | 20,102,775 | $ | 20,332,364 | 1% | (2)% | ||||||||||||||||||
| Tier 1 ratio (a) |
14.47 | % | 14.39 | % | 14.26 | % | 13.99 | % | 17.34 | % | ||||||||||||||||||||
| Tier 2 ratio (a) |
3.78 | % | 3.82 | % | 4.44 | % | 4.66 | % | 4.63 | % | ||||||||||||||||||||
| Total capital ratio (a) |
18.25 | % | 18.21 | % | 18.70 | % | 18.65 | % | 21.97 | % | ||||||||||||||||||||
| Tier 1 common ratio (a) (c) |
11.98 | % | 11.86 | % | 11.73 | % | 11.53 | % | 10.43 | % | ||||||||||||||||||||
| Leverage ratio (a) |
11.65 | % | 11.54 | % | 11.39 | % | 10.96 | % | 13.76 | % | ||||||||||||||||||||
| Shareholders’ equity/assets ratio (d) |
10.73 | % | 10.70 | % | 10.80 | % | 10.84 | % | 13.03 | % | ||||||||||||||||||||
| Adjusted tangible common equity/RWA (a) (c) (e) |
11.11 | % | 11.05 | % | 10.84 | % | 10.66 | % | 9.55 | % | ||||||||||||||||||||
| Tangible common equity/tangible assets (c) (d) |
9.00 | % | 8.93 | % | 8.91 | % | 8.93 | % | 7.96 | % | ||||||||||||||||||||
| Tangible book value per common share (c) (d) |
$ | 8.68 | $ | 8.43 | $ | 8.21 | $ | 8.31 | $ | 8.45 | ||||||||||||||||||||
| Book value per common share (c) (d) |
$ | 9.29 | $ | 9.05 | $ | 8.90 | $ | 9.05 | $ | 9.28 | ||||||||||||||||||||
* Amount is less than one percent.
Certain previously reported amounts have been reclassified to agree with current presentation.
| (a) | Current quarter is an estimate. |
| (b) | All quarters presented include $200 million of tier 1 qualifying trust preferred securities except 3Q10, which includes $300 million. |
| (c) | Refer to the Non-GAAP to GAAP Reconciliation on page 29 of this financial supplement. |
| (d) | Calculated using period-end balances. |
| (e) | See Glossary of Terms for definition of ratios. |
21
Table of Contents
| ASSET QUALITY: CONSOLIDATED |
| |
|
Quarterly, Unaudited |
| 3Q11 Change vs. | ||||||||||||||||||||||||||||||
| (Thousands) |
3Q11 | 2Q11 | 1Q11 | 4Q10 | 3Q10 | 2Q11 | 3Q10 | |||||||||||||||||||||||
| Allowance for Loan Losses Walk-Forward |
||||||||||||||||||||||||||||||
| Beginning reserve |
$ | 524,091 | $ | 589,128 | $ | 664,799 | $ | 719,899 | $ | 781,269 | (11)% | (33)% | ||||||||||||||||||
| Provision |
32,000 | 1,000 | 1,000 | 45,000 | 50,000 | NM | (36)% | |||||||||||||||||||||||
| Charge-offs |
(120,655 | ) | (83,344 | ) | (87,352 | ) | (110,797 | ) | (125,801 | ) | (45)% | 4% | ||||||||||||||||||
| Recoveries |
14,209 | 17,307 | 10,681 | 10,697 | 14,431 | (18)% | (2)% | |||||||||||||||||||||||
| Ending balance (Restricted - $32.4 million) (a) |
$ | 449,645 | $ | 524,091 | $ | 589,128 | $ | 664,799 | $ | 719,899 | (14)% | (38)% | ||||||||||||||||||
| Reserve for unfunded commitments |
9,220 | 12,522 | 14,371 | 14,253 | 13,838 | (26)% | (33)% | |||||||||||||||||||||||
| Total allowance for loan losses plus reserve for unfunded commitments |
$ | 458,865 | $ | 536,613 | $ | 603,499 | $ | 679,052 | $ | 733,737 | (14)% | (37)% | ||||||||||||||||||
| Allowance for Loan Losses |
||||||||||||||||||||||||||||||
| Regional Banking |
$ | 232,269 | $ | 278,693 | $ | 310,470 | $ | 349,572 | $ | 382,246 | (17)% | (39)% | ||||||||||||||||||
| Non-Strategic |
217,376 | 245,398 | 278,658 | 315,227 | 337,653 | (11)% | (36)% | |||||||||||||||||||||||
| Corporate (b) |
NM | NM | NM | NM | N/A | NM | NM | |||||||||||||||||||||||
| Total allowance for loan losses |
$ | 449,645 | $ | 524,091 | $ | 589,128 | $ | 664,799 | $ | 719,899 | (14)% | (38)% | ||||||||||||||||||
| Non-Performing Assets |
||||||||||||||||||||||||||||||
| Regional Banking |
||||||||||||||||||||||||||||||
| Nonperforming loans |
$ | 243,366 | $ | 283,754 | $ | 317,109 | $ | 326,986 | $ | 358,176 | (14)% | (32)% | ||||||||||||||||||
| Foreclosed real estate |
24,943 | 28,121 | 33,134 | 30,138 | 38,771 | (11)% | (36)% | |||||||||||||||||||||||
| Total Regional Banking |
$ | 268,309 | $ | 311,875 | $ | 350,243 | $ | 357,124 | $ | 396,947 | (14)% | (32)% | ||||||||||||||||||
| Non-Strategic |
||||||||||||||||||||||||||||||
| Nonperforming loans - including held for sale (c) |
$ | 259,151 | $ | 384,174 | $ | 406,305 | $ | 398,422 | $ | 437,595 | (33)% | (41)% | ||||||||||||||||||
| Foreclosed real estate |
55,111 | 50,671 | 61,281 | 80,398 | 84,700 | 9% | (35)% | |||||||||||||||||||||||
| Total Non-Strategic |
$ | 314,262 | $ | 434,845 | $ | 467,586 | $ | 478,820 | $ | 522,295 | (28)% | (40)% | ||||||||||||||||||
| Corporate |
||||||||||||||||||||||||||||||
| Nonperforming loans |
NM | $ | 1,140 | $ | 1,140 | $ | 558 | N/A | NM | NM | ||||||||||||||||||||
| Total nonperforming assets |
$ | 582,571 | $ | 747,860 | $ | 818,969 | $ | 836,502 | $ | 919,242 | (22)% | (37)% | ||||||||||||||||||
| Net Charge-Offs |
||||||||||||||||||||||||||||||
| Regional Banking |
$ | 23,727 | $ | 18,033 | $ | 26,703 | $ | 34,683 | $ | 39,595 | 32% | (40)% | ||||||||||||||||||
| Non-Strategic |
82,719 | 48,004 | 49,968 | 65,417 | 71,775 | 72% | 15% | |||||||||||||||||||||||
| Total net charge-offs |
$ | 106,446 | $ | 66,037 | $ | 76,671 | $ | 100,100 | $ | 111,370 | 61% | (4)% | ||||||||||||||||||
| Consolidated Key Ratios (d) |
||||||||||||||||||||||||||||||
| NPL % |
2.55 | % | 3.62 | % | 3.99 | % | 3.85 | % | 4.31 | % | ||||||||||||||||||||
| NPA % |
3.02 | 4.09 | 4.55 | 4.48 | 5.00 | |||||||||||||||||||||||||
| Net charge-offs % |
2.65 | 1.67 | 1.93 | 2.36 | 2.60 | |||||||||||||||||||||||||
| Allowance / loans |
2.77 | 3.26 | 3.69 | 3.96 | 4.22 | |||||||||||||||||||||||||
| Allowance / NPL |
1.09 | x | 0.90 | x | 0.92 | x | 1.03 | x | 0.98 | x | ||||||||||||||||||||
| Allowance / NPA |
0.91 | x | 0.79 | x | 0.81 | x | 0.88 | x | 0.84 | x | ||||||||||||||||||||
| Allowance / charge-offs |
1.06 | x | 1.98 | x | 1.92 | x | 1.66 | x | 1.62 | x | ||||||||||||||||||||
| Other |
||||||||||||||||||||||||||||||
| Loans past due 90 days or more (e) |
$ | 102,420 | $ | 108,923 | $ | 125,989 | $ | 128,653 | $ | 155,532 | (6 | )% | (34 | )% | ||||||||||||||||
| Guaranteed portion (e) |
39,572 | 39,613 | 37,858 | 39,883 | 38,397 | * | 3 | % | ||||||||||||||||||||||
| Foreclosed real estate from government insured loans |
11,438 | 13,870 | 15,711 | 14,865 | 15,888 | (18 | )% | (28 | )% | |||||||||||||||||||||
| Period-end loans, net of unearned income (millions) |
16,241 | 16,062 | 15,972 | 16,783 | 17,059 | 1 | % | (5 | )% | |||||||||||||||||||||
| Remaining unfunded commitments (millions) |
7,418 | 7,938 | 8,285 | 7,905 | 8,071 | (7 | )% | (8 | )% | |||||||||||||||||||||
N/A - Not applicable
NM - Not meaningful
* Amount is less than one percent.
Certain previously reported amounts have been reclassified to agree with current presentation.
| (a) | Restricted balances parenthetically presented are as of September 30, 2011. See Glossary of Terms for definition of restricted balances. |
| (b) | The valuation adjustments taken upon exercise of clean-up calls include expected losses. |
| (c) | 3Q11 includes $88.9 million of loans held for sale. |
| (d) | See Glossary of Terms for definitions of Consolidated Key Ratios. |
| (e) | Includes loans held for sale. |
22
Table of Contents
| ASSET QUALITY: CONSOLIDATED |
| |
|
Quarterly, Unaudited |
| 3Q11 Change vs. | ||||||||||||||||||||||||||||||
| 3Q11 | 2Q11 | 1Q11 | 4Q10 | 3Q10 | 2Q11 | 3Q10 | ||||||||||||||||||||||||
| Key Portfolio Details |
||||||||||||||||||||||||||||||
| C&I |
||||||||||||||||||||||||||||||
| Period-end loans ($ millions) |
$ | 7,706 | $ | 7,180 | $ | 6,808 | $ | 7,338 | $ | 7,337 | 7% | 5% | ||||||||||||||||||
| 30+ Delinq. % (a) |
0.43 | % | 0.52 | % | 0.46 | % | 0.36 | % | 0.68 | % | ||||||||||||||||||||
| NPL % |
2.60 | 2.96 | 3.13 | 2.92 | 3.34 | |||||||||||||||||||||||||
| Charge-offs % (qtr. annualized) |
0.70 | 0.35 | 0.60 | 0.79 | 1.33 | |||||||||||||||||||||||||
| Allowance / loans % |
2.37 | % | 2.87 | % | 3.24 | % | 3.26 | % | 3.54 | % | ||||||||||||||||||||
| Allowance / charge-offs |
3.61 | x | 8.72 | x | 5.46 | x | 4.17 | x | 2.76 | x | ||||||||||||||||||||
| Income CRE |
||||||||||||||||||||||||||||||
| Period-end loans ($ millions) |
$ | 1,287 | $ | 1,311 | $ | 1,398 | $ | 1,407 | $ | 1,519 | (2)% | (15)% | ||||||||||||||||||
| 30+ Delinq. % (a) |
1.47 | % | 1.11 | % | 1.12 | % | 1.20 | % | 2.04 | % | ||||||||||||||||||||
| NPL % |
6.27 | 8.54 | 10.07 | 10.06 | 10.13 | |||||||||||||||||||||||||
| Charge-offs % (qtr. annualized) |
1.40 | 1.03 | 2.26 | 3.63 | 1.94 | |||||||||||||||||||||||||
| Allowance / loans % |
3.67 | % | 6.04 | % | 7.05 | % | 8.87 | % | 9.46 | % | ||||||||||||||||||||
| Allowance / charge-offs |
2.56 | x | 5.63 | x | 3.11 | x | 2.31 | x | 4.68 | x | ||||||||||||||||||||
| Residential CRE |
||||||||||||||||||||||||||||||
| Period-end loans ($ millions) |
$ | 142 | $ | 183 | $ | 221 | $ | 264 | $ | 324 | (22)% | (56)% | ||||||||||||||||||
| 30+ Delinq. % (a) |
0.61 | % | 5.14 | % | 5.08 | % | 3.19 | % | 0.93 | % | ||||||||||||||||||||
| NPL % |
38.80 | 38.40 | 42.19 | 42.04 | 46.45 | |||||||||||||||||||||||||
| Charge-offs % (qtr. annualized) |
8.01 | 8.19 | 4.96 | 6.54 | 5.03 | |||||||||||||||||||||||||
| Allowance / loans % |
12.67 | % | 11.10 | % | 11.30 | % | 11.51 | % | 11.99 | % | ||||||||||||||||||||
| Allowance / charge-offs |
1.31 | x | 1.22 | x | 2.05 | x | 1.50 | x | 2.12 | x | ||||||||||||||||||||
| Consumer Real Estate |
||||||||||||||||||||||||||||||
| Period-end loans ($ millions) |
$ | 5,305 | $ | 5,383 | $ | 5,487 | $ | 5,618 | $ | 5,788 | (1)% | (8)% | ||||||||||||||||||
| 30+ Delinq. % (a) |
1.57 | % | 1.53 | % | 1.73 | % | 2.03 | % | 2.03 | % | ||||||||||||||||||||
| NPL % |
0.80 | 0.64 | 0.69 | 0.58 | 0.46 | |||||||||||||||||||||||||
| Charge-offs % (qtr. annualized) |
2.04 | 2.34 | 2.50 | 2.94 | 3.09 | |||||||||||||||||||||||||
| Allowance / loans % |
2.55 | % | 2.47 | % | 2.60 | % | 2.67 | % | 2.64 | % | ||||||||||||||||||||
| Allowance / charge-offs |
1.23 | x | 1.05 | x | 1.04 | x | 0.89 | x | 0.84 | x | ||||||||||||||||||||
| Permanent Mortgage |
||||||||||||||||||||||||||||||
| Period-end loans ($ millions) (b) |
$ | 838 | $ | 1,015 | $ | 1,038 | $ | 1,087 | $ | 969 | (17)% | (14)% | ||||||||||||||||||
| 30+ Delinq. % (a) |
5.21 | % | 4.00 | % | 5.47 | % | 5.16 | % | 5.43 | % | ||||||||||||||||||||
| NPL % (b) |
2.87 | 13.53 | 12.64 | 11.27 | 12.76 | |||||||||||||||||||||||||
| Charge-offs % (qtr. annualized) (c) |
18.83 | 3.21 | 3.34 | 3.58 | 5.60 | |||||||||||||||||||||||||
| Allowance / loans % |
3.12 | % | 4.28 | % | 5.04 | % | 5.49 | % | 6.08 | % | ||||||||||||||||||||
| Allowance / charge-offs |
0.14 | x | 1.34 | x | 1.49 | x | 1.68 | x | 1.06 | x | ||||||||||||||||||||
| Credit Card and Other (d) |
||||||||||||||||||||||||||||||
| Period-end loans ($ millions) |
$ | 299 | $ | 295 | $ | 298 | $ | 312 | $ | 326 | 1% | (8)% | ||||||||||||||||||
| 30+ Delinq. % (a) |
1.29 | % | 1.20 | % | 1.34 | % | 1.43 | % | 1.90 | % | ||||||||||||||||||||
| NPL % |
1.69 | 3.21 | 5.12 | 6.18 | 9.31 | |||||||||||||||||||||||||
| Charge-offs % (qtr. annualized) |
5.27 | 5.61 | 4.43 | 6.00 | 4.77 | |||||||||||||||||||||||||
| Allowance / loans % |
2.84 | % | 3.08 | % | 3.36 | % | 4.13 | % | 5.49 | % | ||||||||||||||||||||
| Allowance / charge-offs |
0.55 | x | 0.54 | x | 0.76 | x | 0.67 | x | 1.10 | x | ||||||||||||||||||||
| Restricted Real Estate Loans |
||||||||||||||||||||||||||||||
| Period-end loans ($ millions) (e) |
$ | 666 | $ | 694 | $ | 722 | $ | 757 | $ | 797 | (4)% | (16)% | ||||||||||||||||||
| 30+ Delinq. % (a) |
3.29 | % | 2.77 | % | 2.94 | % | 3.44 | % | 3.73 | % | ||||||||||||||||||||
| NPL % |
0.87 | 0.80 | 0.75 | 0.82 | 0.67 | |||||||||||||||||||||||||
| Charge-offs % (qtr. annualized) |
4.46 | 4.76 | 5.08 | 5.71 | 5.75 | |||||||||||||||||||||||||
| Allowance / loans % |
4.86 | % | 4.76 | % | 5.52 | % | 6.26 | % | 6.01 | % | ||||||||||||||||||||
| Allowance / charge-offs |
1.06 | x | 0.98 | x | 1.07 | x | 1.06 | x | 1.01 | x | ||||||||||||||||||||
* Amount is less than one percent
Certain previously reported amounts have been reclassified to agree with current presentation.
| (a) | 30+ Delinquency % includes all accounts delinquent more than one month and still accruing interest. |
| (b) | 3Q11 includes the impact of the sale of $126 million in book value of nonperforming permanent mortgages. |
| (c) | Includes $40.2 million of net charge-offs (“NCO”) recognized due to the sale of nonperforming loans. |
| (d) | Select remaining OTC amounts: PE loans: $5.0 million; NPL: 100%; Allowance: $1.0 million; 3Q11 Net Charge-offs: $1.0 million. |
| (e) | 3Q11 includes $623.3 million of consumer real estate loans and $42.4 million of permanent mortgage loans. |
23
Table of Contents
| ROLLFORWARDS OF NONPERFORMING LOANS AND OREO INVENTORY |
| |
|
Unaudited
|
| (Millions) | 3Q11 | 2Q11 | 1Q11 | 4Q10 | 3Q10 | |||||||||||||||
| NPL Rollforward (a) |
||||||||||||||||||||
| Beginning NPLs |
$ | 404 | $ | 462 | $ | 486 | $ | 580 | $ | 593 | ||||||||||
| + Additions |
36 | 31 | 46 | 54 | 98 | |||||||||||||||
| + Principal Increase |
2 | 2 | 4 | 3 | 7 | |||||||||||||||
| - Resolutions and payments |
(54 | ) | (66 | ) | (47 | ) | (97 | ) | (46 | ) | ||||||||||
| - Net Charge-Offs |
(22 | ) | (15 | ) | (22 | ) | (34 | ) | (37 | ) | ||||||||||
| - Transfer to OREO |
(10 | ) | (5 | ) | (3 | ) | (14 | ) | (35 | ) | ||||||||||
| - Upgrade to Accrual |
(15 | ) | (5 | ) | (2 | ) | (6 | ) | - | |||||||||||
| Ending NPLs |
$ | 341 | $ | 404 | $ | 462 | $ | 486 | $ | 580 | ||||||||||
| (a) Includes Commercial and One-Time Close Portfolios only.
|
||||||||||||||||||||
| (Millions) | 3Q11 | 2Q11 | 1Q11 | 4Q10 | 3Q10 | |||||||||||||||
| OREO Inventory Rollforward (b) |
||||||||||||||||||||
| Beginning balance |
$ | 78.8 | $ | 94.4 | $ | 110.5 | $ | 123.4 | $ | 109.3 | ||||||||||
| Valuation adjustments |
(4.3 | ) | (4.6 | ) | (5.0 | ) | (4.2 | ) | (4.6 | ) | ||||||||||
| Adjusted balance |
$ | 74.5 | $ | 89.8 | $ | 105.5 | $ | 119.2 | $ | 104.7 | ||||||||||
| + New OREO |
17.0 | 17.0 | 16.1 | 29.4 | 50.6 | |||||||||||||||
| + Capitalized expenses |
0.5 | 1.0 | 0.6 | 1.0 | 0.7 | |||||||||||||||
| Disposals: |
||||||||||||||||||||
| - Single transactions |
(10.2 | ) | (24.7 | ) | (27.4 | ) | (39.0 | ) | (31.1 | ) | ||||||||||
| - Bulk sales |
(1.7 | ) | (4.3 | ) | - | (0.1 | ) | (1.5 | ) | |||||||||||
| - Auctions |
- | - | (0.4 | ) | - | - | ||||||||||||||
| Ending balance |
$ | 80.1 | $ | 78.8 | $ | 94.4 | $ | 110.5 | $ | 123.4 | ||||||||||
| (b) | OREO excludes foreclosed assets related to government insured mortgages. |
24
Table of Contents
| ASSET QUALITY: REGIONAL BANKING |
| |
|
Quarterly, Unaudited |
| 3Q11 Change vs. | ||||||||||||||||||||||||||||||
| 3Q11 | 2Q11 | 1Q11 | 4Q10 | 3Q10 | 2Q11 | 3Q10 | ||||||||||||||||||||||||
| Total Regional Banking |
||||||||||||||||||||||||||||||
| Period-end loans ($ millions) |
$ | 11,378 | $ | 10,832 | $ | 10,486 | $ | 11,040 | $ | 11,147 | 5% | 2% | ||||||||||||||||||
| 30+ Delinq. % (a) |
0.61 | % | 0.82 | % | 0.84 | % | 0.80 | % | 0.95 | % | ||||||||||||||||||||
| NPL % |
2.14 | 2.62 | 3.02 | 2.96 | 3.21 | |||||||||||||||||||||||||
| Charge-offs % (qtr. annualized) |
0.87 | 0.69 | 1.03 | 1.25 | 1.45 | |||||||||||||||||||||||||
| Allowance / loans % |
2.04 | % | 2.57 | % | 2.96 | % | 3.17 | % | 3.43 | % | ||||||||||||||||||||
| Allowance / charge-offs |
2.45x | 3.86x | 2.91x | 2.52x | 2.41x | |||||||||||||||||||||||||
| Key Portfolio Details |
||||||||||||||||||||||||||||||
| C&I |
||||||||||||||||||||||||||||||
| Period-end loans ($ millions) |
$ | 7,142 | $ | 6,604 | $ | 6,227 | $ | 6,750 | $ | 6,745 | 8% | 6% | ||||||||||||||||||
| 30+ Delinq. % (a) |
0.45 | % | 0.56 | % | 0.48 | % | 0.40 | % | 0.55 | % | ||||||||||||||||||||
| NPL % |
1.67 | 1.98 | 2.39 | 2.36 | 2.70 | |||||||||||||||||||||||||
| Charge-offs % (qtr. annualized) |
0.73 | 0.39 | 0.66 | 0.83 | 1.46 | |||||||||||||||||||||||||
| Allowance / loans % |
1.94 | % | 2.43 | % | 2.77 | % | 2.80 | % | 3.07 | % | ||||||||||||||||||||
| Allowance / charge-offs |
2.87x | 6.61x | 4.27x | 3.40x | 2.20x | |||||||||||||||||||||||||
| Income CRE |
||||||||||||||||||||||||||||||
| Period-end loans ($ millions) |
$ | 1,235 | $ | 1,245 | $ | 1,278 | $ | 1,271 | $ | 1,358 | (1)% | (9)% | ||||||||||||||||||
| 30+ Delinq. % (a) |
.63 | % | 1.17 | % | 1.23 | % | 1.06 | % | 2.00 | % | ||||||||||||||||||||
| NPL % |
5.75 | 7.76 | 8.04 | 7.62 | 7.30 | |||||||||||||||||||||||||
| Charge-offs % (qtr. annualized) |
1.17 | 0.91 | 1.94 | 2.28 | 1.62 | |||||||||||||||||||||||||
| Allowance / loans % |
3.49 | % | 5.88 | % | 6.93 | % | 8.53 | % | 8.76 | % | ||||||||||||||||||||
| Allowance / charge-offs |
2.94x | 6.39x | 3.59x | 3.56x | 5.20x | |||||||||||||||||||||||||
| Residential CRE |
||||||||||||||||||||||||||||||
| Period-end loans ($ millions) |
$ | 103 | $ | 124 | $ | 142 | $ | 169 | $ | 193 | (17)% | (47)% | ||||||||||||||||||
| 30+ Delinq. % (a) |
0.56 | % | 6.87 | % | 7.35 | % | 4.98 | % | 1.48 | % | ||||||||||||||||||||
| NPL % |
36.74 | 35.22 | 36.09 | 34.98 | 37.02 | |||||||||||||||||||||||||
| Charge-offs % (qtr. annualized) |
4.91 | 7.64 | 5.61 | 9.11 | 5.46 | |||||||||||||||||||||||||
| Allowance / loans % |
14.27 | % | 12.62 | % | 13.51 | % | 13.15 | % | 13.47 | % | ||||||||||||||||||||
| Allowance / charge-offs |
2.54x | 1.55x | 2.19x | 1.29x | 2.27x | |||||||||||||||||||||||||
| Consumer Real Estate |
||||||||||||||||||||||||||||||
| Period-end loans ($ millions) |
$ | 2,604 | $ | 2,571 | $ | 2,554 | $ | 2,555 | $ | 2,553 | 1% | 2% | ||||||||||||||||||
| 30+ Delinq. % (a) |
0.99 | % | 0.96 | % | 1.07 | % | 1.37 | % | 1.30 | % | ||||||||||||||||||||
| NPL % |
0.57 | 0.48 | 0.54 | 0.46 | 0.21 | |||||||||||||||||||||||||
| Charge-offs % (qtr. annualized) |
0.61 | 0.63 | 1.05 | 0.90 | 0.76 | |||||||||||||||||||||||||
| Allowance / loans % |
1.09 | % | 0.88 | % | 0.91 | % | 0.87 | % | 0.82 | % | ||||||||||||||||||||
| Allowance / charge-offs |
1.79x | 1.40x | 0.88x | 0.96x | 1.08x | |||||||||||||||||||||||||
| Credit Card, Permanent Mortgage, and Other |
||||||||||||||||||||||||||||||
| Period-end loans ($ millions) |
$ | 293 | $ | 288 | $ | 285 | $ | 295 | $ | 299 | 2% | (2)% | ||||||||||||||||||
| 30+ Delinq. % (a) |
1.19 | % | 1.23 | % | 1.57 | % | 1.65 | % | 1.97 | % | ||||||||||||||||||||
| NPL % |
0.03 | 0.12 | 0.12 | 0.05 | 0.06 | |||||||||||||||||||||||||
| Charge-offs % (qtr. annualized) |
3.52 | 3.52 | 2.34 | 4.13 | 3.40 | |||||||||||||||||||||||||
| Allowance / loans % |
2.40 | % | 2.41 | % | 2.51 | % | 2.67 | % | 3.15 | % | ||||||||||||||||||||
| Allowance / charge-offs |
0.69x | 0.68x | 1.08x | 0.64x | 0.91x | |||||||||||||||||||||||||
| ASSET QUALITY: CORPORATE | ||||||||||||||||||||||||||||||
| Permanent Mortgage |
||||||||||||||||||||||||||||||
| Period-end loans ($ millions) |
$ | 161 | $ | 175 | $ | 151 | $ | 168 | N/A | (8)% | NM | |||||||||||||||||||
| 30+ Delinq. % (a) |
0.73 | % | 2.03 | % | 1.98 | % | 2.46 | % | N/A | |||||||||||||||||||||
| NPL % |
NM | 0.65 | 0.76 | 0.33 | N/A | |||||||||||||||||||||||||
| Charge-offs % (qtr. annualized) |
NM | NM | NM | NM | N/A | |||||||||||||||||||||||||
| Allowance / loans % |
NM | NM | NM | NM | N/A | |||||||||||||||||||||||||
| Allowance / charge-offs |
NM | NM | NM | NM | N/A | |||||||||||||||||||||||||
NM - Not meaningful
N/A - Not applicable
Certain previously reported amounts have been reclassified to agree with current presentation.
(a) 30+ Delinquency % includes all accounts delinquent more than one month and still accruing interest.
25
Table of Contents
| ASSET QUALITY: NON-STRATEGIC |
| |
|
Quarterly, Unaudited |
| 3Q11 Change vs. | ||||||||||||||||||||||||||||||
| 3Q11 | 2Q11 | 1Q11 | 4Q10 | 3Q10 | 2Q11 | 3Q10 | ||||||||||||||||||||||||
| Total Non-Strategic Lending |
||||||||||||||||||||||||||||||
| Period-end loans ($ millions) |
$ | 4,703 | $ | 5,055 | $ | 5,336 | $ | 5,575 | $ | 5,913 | (7 | )% | (20 | )% | ||||||||||||||||
| 30+ Delinq. % (a) |
2.87 | % | 2.27 | % | 2.69 | % | 2.87 | % | 3.11 | % | ||||||||||||||||||||
| NPL % |
3.62 | 5.87 | 5.98 | 5.73 | 6.38 | |||||||||||||||||||||||||
| Charge-offs % (qtr. annualized) |
6.63 | 3.70 | 3.70 | 4.51 | 4.67 | |||||||||||||||||||||||||
| Allowance / loans % |
4.62 | % | 4.85 | % | 5.22 | % | 5.65 | % | 5.71 | % | ||||||||||||||||||||
| Allowance / charge-offs |
0.66x | 1.28x | 1.39x | 1.20x | 1.18x | |||||||||||||||||||||||||
| Key Portfolio Details |
||||||||||||||||||||||||||||||
| C&I (b) |
||||||||||||||||||||||||||||||
| Period-end loans ($ millions) |
$ | 563 | $ | 576 | $ | 582 | $ | 588 | $ | 592 | (2 | )% | (5 | )% | ||||||||||||||||
| 30+ Delinq. % (a) |
0.18 | % | — | % | 0.17 | % | — | % | 2.14 | % | ||||||||||||||||||||
| NPL % |
14.37 | 14.08 | 11.11 | 9.33 | 10.63 | |||||||||||||||||||||||||
| Charge-offs % (qtr. annualized) |
0.37 | NM | 0.01 | 0.30 | — | |||||||||||||||||||||||||
| Allowance / loans % |
7.71 | % | 8.00 | % | 8.31 | % | 8.62 | % | 8.91 | % | ||||||||||||||||||||
| Allowance / charge-offs |
20.25x | NM | NM | 28.34x | NM | |||||||||||||||||||||||||
| Income CRE |
||||||||||||||||||||||||||||||
| Period-end loans ($ millions) |
$ | 52 | $ | 66 | $ | 120 | $ | 136 | $ | 161 | (21 | )% | (68 | )% | ||||||||||||||||
| 30+ Delinq. % (a) |
21.51 | % | — | % | — | % | 2.55 | % | 2.31 | % | ||||||||||||||||||||
| NPL % |
18.80 | 23.20 | 31.62 | 32.84 | 33.97 | |||||||||||||||||||||||||
| Charge-offs % (qtr. annualized) |
6.29 | 2.64 | 5.44 | 15.60 | 4.57 | |||||||||||||||||||||||||
| Allowance / loans % |
7.82 | % | 9.01 | % | 8.29 | % | 11.96 | % | 15.31 | % | ||||||||||||||||||||
| Allowance / charge-offs |
1.08x | 2.30x | 1.42x | 0.69x | 3.16x | |||||||||||||||||||||||||
| Residential CRE |
||||||||||||||||||||||||||||||
| Period-end loans ($ millions) |
$ | 38 | $ | 59 | $ | 79 | $ | 95 | $ | 131 | (36 | )% | (71 | )% | ||||||||||||||||
| 30+ Delinq. % (a) |
0.76 | % | 1.49 | % | 0.98 | % | — | % | 0.13 | % | ||||||||||||||||||||
| NPL % |
44.39 | 45.06 | 53.26 | 54.60 | 60.36 | |||||||||||||||||||||||||
| Charge-offs % (qtr. annualized) |
15.10 | 9.22 | 3.81 | 2.51 | 4.44 | |||||||||||||||||||||||||
| Allowance / loans % |
8.33 | % | 7.90 | % | 7.28 | % | 8.59 | % | 9.80 | % | ||||||||||||||||||||
| Allowance / charge-offs |
0.41x | 0.71x | 1.67x | 2.71x | 1.87x | |||||||||||||||||||||||||
| Consumer Real Estate |
||||||||||||||||||||||||||||||
| Period-end loans ($ millions) |
$ | 2,701 | $ | 2,812 | $ | 2,933 | $ | 3,062 | $ | 3,235 | (4 | )% | (17 | )% | ||||||||||||||||
| 30+ Delinq. % (a) |
2.14 | % | 2.06 | % | 2.30 | % | 2.57 | % | 2.61 | % | ||||||||||||||||||||
| NPL % |
1.03 | 0.80 | 0.82 | 0.68 | 0.65 | |||||||||||||||||||||||||
| Charge-offs % (qtr. annualized) |
3.38 | 3.86 | 3.74 | 4.60 | 4.85 | |||||||||||||||||||||||||
| Allowance / loans % |
3.95 | % | 3.91 | % | 4.08 | % | 4.18 | % | 4.08 | % | ||||||||||||||||||||
| Allowance / charge-offs |
1.14x | 0.99x | 1.08x | 0.88x | 0.81x | |||||||||||||||||||||||||
| Permanent Mortgage |
||||||||||||||||||||||||||||||
| Period-end loans ($ millions) (c) |
$ | 658 | $ | 818 | $ | 864 | $ | 894 | $ | 944 | (20 | )% | (30 | )% | ||||||||||||||||
| 30+ Delinq. % (a) |
6.35 | % | 4.46 | % | 6.09 | % | 5.66 | % | 5.50 | % | ||||||||||||||||||||
| NPL % (c) |
3.64 | 16.64 | 15.04 | 13.62 | 13.08 | |||||||||||||||||||||||||
| Charge-offs % (qtr. annualized) (d) |
23.30 | 3.88 | 4.05 | 3.82 | 5.79 | |||||||||||||||||||||||||
| Allowance / loans % |
3.94 | % | 5.24 | % | 5.99 | % | 6.62 | % | 6.21 | % | ||||||||||||||||||||
| Allowance / charge-offs |
0.14x | 1.33x | 1.48x | 1.67x | 1.04x | |||||||||||||||||||||||||
| Other Consumer (e) |
||||||||||||||||||||||||||||||
| Period-end loans ($ millions) |
$ | 25 | $ | 30 | $ | 36 | $ | 41 | $ | 52 | (17 | )% | (52 | )% | ||||||||||||||||
| 30+ Delinq. % (a) |
4.32 | % | 2.07 | % | 1.92 | % | 2.19 | % | 2.02 | % | ||||||||||||||||||||
| NPL % |
20.12 | 31.24 | 42.03 | 46.75 | 58.04 | |||||||||||||||||||||||||
| Charge-offs % (qtr. annualized) |
19.63 | 19.98 | 18.01 | 15.00 | 8.81 | |||||||||||||||||||||||||
| Allowance / loans % |
6.98 | % | 9.27 | % | 9.53 | % | 13.13 | % | 16.92 | % | ||||||||||||||||||||
| Allowance / charge-offs |
0.32x | 0.41x | 0.53x | 0.79x | 1.58x | |||||||||||||||||||||||||
| Restricted Real Estate Loans |
||||||||||||||||||||||||||||||
| Period-end loans ($ millions) (f) |
$ | 666 | $ | 694 | $ | 722 | $ | 757 | $ | 797 | (4 | )% | (16 | )% | ||||||||||||||||
| 30+ Delinq. % (a) |
3.29 | % | 2.77 | % | 2.94 | % | 3.44 | % | 3.73 | % | ||||||||||||||||||||
| NPL % |
0.87 | 0.80 | 0.75 | 0.82 | 0.67 | |||||||||||||||||||||||||
| Charge-offs % (qtr. annualized) |
4.46 | 4.76 | 5.08 | 5.71 | 5.75 | |||||||||||||||||||||||||
| Allowance / loans % |
4.86 | % | 4.76 | % | 5.52 | % | 6.26 | % | 6.01 | % | ||||||||||||||||||||
| Allowance / charge-offs |
1.06x | 0.98x | 1.07x | 1.06x | 1.01x | |||||||||||||||||||||||||
Certain previously reported amounts have been reclassified to agree with current presentation.
| (a) | 30+ Delinquency % includes all accounts delinquent more than one month and still accruing interest. |
| (b) | Includes trust preferred loan portfolio and other exited businesses. |
| (c) | 3Q11 includes the impact of the sale of $126 million in book value of nonperforming permanent mortgages. |
| (d) | 3Q11 includes $40.2 million of net charge-offs (“NCO”) recognized due to the sale of nonperforming loans. |
| (e) | Select remaining OTC amounts: PE loans: $5.0 million; NPL: 100%; Allowance: $1.0 million; 3Q11 Net charge-offs: $1.0 million. |
| (f) | 3Q11 includes $623.3 million of consumer real estate loans and $42.4 million of permanent mortgage loans. |
26
Table of Contents
| ASSET QUALITY: PORTFOLIO METRICS |
| |
|
Unaudited |
C&I Portfolio: $7.7 Billion (47.5% of Total Loans)
| % OS | ||||
| General Corporate, Commercial, and Business Banking Loans |
78% | |||
| Mortgage Warehouse Line Balances |
14% | |||
| Trust Preferred Loans |
6% | |||
| Bank Holding Company Lending |
2% | |||
Income CRE Portfolio: $1.3 Billion (7.9% of Total Loans)
| Top 10 States as of September 30, 2011 |
% NPL | % OS | ||||||||
| Tennessee |
4.69% | 56% | ||||||||
| North Carolina |
9.84% | 8% | ||||||||
| Georgia |
1.52% | 7% | ||||||||
| Florida |
25.05% | 5% | ||||||||
| Mississippi |
11.53% | 4% | ||||||||
| Texas |
2.16% | 4% | ||||||||
| South Carolina |
5.37% | 4% | ||||||||
| West Virginia |
-% | 2% | ||||||||
| Indiana |
-% | 2% | ||||||||
| Kentucky |
2.69% | 2% |
Consumer Real Estate (primarily Home Equity) Portfolio: $5.9 Billion (36.5% of Total Loans) (a)
| Origination LTV and FICO for Portfolio as of September 30, 2011 | Loan-to-Value | |||||||||||||||||
| (excludes whole loan insurance) |
<=80% | 80% - 90% | >90% | |||||||||||||||
| FICO score greater than or equal to 740 |
32% | 15% | 6% | |||||||||||||||
| FICO score 720-739 |
7% | 4% | 2% | |||||||||||||||
| FICO score 700-719 |
6% | 4% | 2% | |||||||||||||||
| FICO score 660-699 |
7% | 4% | 3% | |||||||||||||||
| FICO score 620-659 |
2% | 1% | 1% | |||||||||||||||
| FICO score less than 620 |
1% | -% | 1% | |||||||||||||||
| Consumer Real Estate Portfolio Detail: | ||||||||||||||||
| Origination Characteristics | NCO’s % | |||||||||||||||
| Vintage | Balance % | CLTV | FICO | % Broker (b) | % TN | % 1st lien | QTD | |||||||||
| pre-2003 |
4% | 76% | 717 | 16% | 46% | 33% | 0.78% | |||||||||
| 2003 |
8% | 75% | 729 | 16% | 33% | 40% | 0.87% | |||||||||
| 2004 |
12% | 79% | 726 | 28% | 22% | 27% | 1.64% | |||||||||
| 2005 |
17% | 81% | 731 | 19% | 18% | 16% | 3.87% | |||||||||
| 2006 |
15% | 78% | 734 | 6% | 23% | 18% | 3.70% | |||||||||
| 2007 |
17% | 80% | 739 | 15% | 27% | 19% | 4.16% | |||||||||
| 2008 |
8% | 75% | 748 | 8% | 72% | 52% | 1.61% | |||||||||
| 2009 |
5% | 72% | 753 | -% | 88% | 59% | 0.33% | |||||||||
| 2010 |
7% | 80% | 751 | -% | 92% | 73% | -% | |||||||||
| 2011 |
7% | 79% | 757 | -% | 91% | 83% | -% | |||||||||
| Total |
100% | 78% | 737(c) | 13% | 41% | 34% | 2.33% | |||||||||
(a) Consumer Real Estate portfolio includes $623.3 million of restricted real estate loans.
(b) Correspondent and Wholesale.
(c) 737 average portfolio origination FICO; 728 weighted average portfolio FICO (refreshed).
Permanent Mortgage Portfolio: $0.9 Billion (5.4% of Total Loans) (a) (b) (c)
| Top 10 States as of September 30, 2011 | Del. % | % OS | ||||||||
| California |
11.50% | 24% | ||||||||
| Texas |
14.95% | 10% | ||||||||
| Washington |
8.77% | 8% | ||||||||
| Virginia |
5.38% | 6% | ||||||||
| Arizona |
20.52% | 4% | ||||||||
| Maryland |
2.21% | 4% | ||||||||
| Oregon |
14.91% | 4% | ||||||||
| Florida |
20.59% | 3% | ||||||||
| North Carolina |
18.27% | 3% | ||||||||
| Tennessee |
8.70% | 3% | ||||||||
(a) Permanent Mortgage portfolio includes $42.4 million of restricted real estate loans.
(b) Documentation type: 70% full doc; 25% stated; 5% other.
(c) Product type: 71% jumbo; 13% Alt A; 16% other.
27
Table of Contents
|
|
Adjusted Tangible Equity/RWA: Shareholders’ equity excluding intangible assets and unrealized gains/losses on available for sale securities and cash flow hedges divided by risk weighted assets.
Core Business Segments: Management treats regional banking, capital markets, and corporate as FHN’s core businesses. Non-strategic has significant legacy assets and operations that are being wound down.
Individually Impaired Loans: Commercial loans over $1 million that are not expected to pay all contractually due principal and interest and consumer loans that have experienced a troubled debt restructuring and are individually evaluated for impairment. The estimated loss on these loans is determined using a discounted cash flow (“DCF”) methodology or the estimated fair value of the underlying collateral less costs to sell, if the loan is considered collateral dependent. In accordance with accounting requirements, DCF loans are discounted using the applicable note rate, and typically reserves are maintained for DCF loans. Collateral dependent loans are generally charged off to the estimate of collateral value less cost to sell leaving no associated reserve.
Lower of Cost or Market (LOCOM): A method of accounting for certain assets by recording them at the lower of their historical cost or their current market value.
Restricted Balances: Assets of a consolidated variable interest entity that can be used only to settle obligations of the consolidated variable interest entity and liabilities of a consolidated variable interest entity for which creditors (or beneficial interest holders) do not have recourse to the general credit of the primary beneficiary.
Troubled Debt Restructuring (TDR): A restructuring of debt whereby a creditor for economic or legal reasons related to the borrower’s financial difficulties grants a concession to the borrower that it would not otherwise consider. Such concession is granted in an attempt to protect as much of the creditor’s investment as possible by increasing the probability of repayment.
Asset Quality - Consolidated Key Ratios
NPL %: Ratio is nonperforming loans in the loan portfolio to total period end loans.
NPA %: Ratio is nonperforming assets related to the loan portfolio to total period end loans plus foreclosed real estate and other assets.
Net charge-offs %: Ratio is annualized net charge-offs to total average loans.
Allowance / loans: Ratio is allowance for loan losses to total period end loans.
Allowance to loans excluding insured loans: Ratio is allowance for loan losses to total period end loans excluding insured loans.
Allowance / NPL: Ratio is allowance for loan losses to nonperforming loans in the loan portfolio.
Allowance / NPA: Ratio is allowance for loan losses to nonperforming assets related to the loan portfolio.
Allowance / charge-offs: Ratio is allowance for loan losses to annualized net charge-offs.
28
Table of Contents
| NON-GAAP TO GAAP RECONCILIATION |
| |
|
Quarterly, Unaudited |
| (Thousands) | 3Q11 | 2Q11 | 1Q11 | 4Q10 | 3Q10 | |||||||||||||||
| Tangible Common Equity (Non-GAAP) |
||||||||||||||||||||
| (A) Total equity (GAAP) |
$ | 2,743,230 | $ | 2,681,382 | $ | 2,640,057 | $ | 2,678,005 | $ | 3,306,888 | ||||||||||
| Less: Preferred stock capital surplus - CPP |
- | - | - | - | 810,974 | |||||||||||||||
| Less: Noncontrolling interest (a) |
295,165 | 295,165 | 295,165 | 295,165 | 295,165 | |||||||||||||||
| (B) Total common equity |
$ | 2,448,065 | $ | 2,386,217 | $ | 2,344,892 | $ | 2,382,840 | $ | 2,200,749 | ||||||||||
| Less: Intangible assets (GAAP) (b) |
160,902 | 164,067 | 183,625 | 195,061 | 196,443 | |||||||||||||||
| (C) Tangible common equity (Non-GAAP) |
$ | 2,287,163 | $ | 2,222,150 | $ | 2,161,267 | $ | 2,187,779 | $ | 2,004,306 | ||||||||||
| Less: Unrealized gains on AFS securities, net of tax |
79,358 | 58,068 | 39,338 | 45,366 | 61,836 | |||||||||||||||
| (D) Adjusted tangible common equity (Non-GAAP) (c) |
$ | 2,207,805 | $ | 2,164,082 | $ | 2,121,929 | $ | 2,142,413 | $ | 1,942,470 | ||||||||||
| Tangible Assets (Non-GAAP) |
||||||||||||||||||||
| (E) Total assets (GAAP) |
$ | 25,571,469 | $ | 25,054,066 | $ | 24,438,344 | $ | 24,698,952 | $ | 25,384,181 | ||||||||||
| Less: Intangible assets (GAAP) (b) |
160,902 | 164,067 | 183,625 | 195,061 | 196,443 | |||||||||||||||
| (F) Tangible assets (Non-GAAP) |
$ | 25,410,567 | $ | 24,889,999 | $ | 24,254,719 | $ | 24,503,891 | $ | 25,187,738 | ||||||||||
| Period-end Shares Outstanding |
||||||||||||||||||||
| (G) Period-end shares outstanding |
263,619 | 263,699 | 263,335 | 263,366 | 237,061 | |||||||||||||||
| Tier 1 Common (Non-GAAP) |
||||||||||||||||||||
| (H) Tier 1 capital (d) (e) |
$ | 2,875,112 | $ | 2,818,535 | $ | 2,790,335 | $ | 2,812,471 | $ | 3,526,115 | ||||||||||
| Less: Preferred stock capital surplus - CPP |
- | - | - | - | 810,974 | |||||||||||||||
| Less: Noncontrolling interest - FTBNA preferred stock (a) (f) |
294,816 | 294,816 | 294,816 | 294,816 | 294,816 | |||||||||||||||
| Less: Trust preferred (g) |
200,000 | 200,000 | 200,000 | 200,000 | 300,000 | |||||||||||||||
| (I) Tier 1 common (Non-GAAP) |
$ | 2,380,296 | $ | 2,323,719 | $ | 2,295,519 | $ | 2,317,655 | $ | 2,120,325 | ||||||||||
| Risk Weighted Assets |
||||||||||||||||||||
| (J) Risk weighted assets (d) (e) |
$ | 19,867,400 | $ | 19,589,310 | $ | 19,569,006 | $ | 20,102,775 | $ | 20,332,364 | ||||||||||
| Ratios |
||||||||||||||||||||
| (C)/(F) Tangible common equity to tangible assets (TCE/TA) (Non-GAAP) |
9.00 | % | 8.93 | % | 8.91 | % | 8.93 | % | 7.96 | % | ||||||||||
| (A)/(E) Total equity to total assets (GAAP) |
10.73 | % | 10.70 | % | 10.80 | % | 10.84 | % | 13.03 | % | ||||||||||
| (C)/(G) Tangible book value per common share (Non-GAAP) |
$ | 8.68 | $ | 8.43 | $ | 8.21 | $ | 8.31 | $ | 8.45 | ||||||||||
| (B)/(G) Book value per common share (GAAP) |
$ | 9.29 | $ | 9.05 | $ | 8.90 | $ | 9.05 | $ | 9.28 | ||||||||||
| (I)/(J) Tier 1 common ratio (Non-GAAP) (d) |
11.98 | % | 11.86 | % | 11.73 | % | 11.53 | % | 10.43 | % | ||||||||||
| (H)/(E) Tier 1 capital to total assets (GAAP) (d) |
11.24 | % | 11.25 | % | 11.42 | % | 11.39 | % | 13.89 | % | ||||||||||
| (D)/(J) Adjusted tangible common equity to risk weighted assets (TCE/RWA) (Non-GAAP) (c) (d) |
11.11 | % | 11.05 | % | 10.84 | % | 10.66 | % | 9.55 | % | ||||||||||
| Net interest income adjusted for impact of FTE (Non-GAAP) |
||||||||||||||||||||
| Regional Banking |
||||||||||||||||||||
| Net interest income (GAAP) |
$ | 140,603 | $ | 136,249 | $ | 134,671 | $ | 144,492 | $ | 142,220 | ||||||||||
| Fully taxable equivalent (“FTE”) adjustment |
1,434 | 1,353 | 1,243 | 924 | 666 | |||||||||||||||
| Net interest income adjusted for impact of FTE (Non-GAAP) |
$ | 142,037 | $ | 137,602 | $ | 135,914 | $ | 145,416 | $ | 142,886 | ||||||||||
| Capital Markets |
||||||||||||||||||||
| Net interest income (GAAP) |
$ | 5,555 | $ | 5,564 | $ | 5,576 | $ | 5,877 | $ | 8,584 | ||||||||||
| Fully taxable equivalent (“FTE”) adjustment |
81 | 76 | 72 | 71 | 66 | |||||||||||||||
| Net interest income adjusted for impact of FTE (Non-GAAP) |
$ | 5,636 | $ | 5,640 | $ | 5,648 | $ | 5,948 | $ | 8,650 | ||||||||||
| Corporate |
||||||||||||||||||||
| Net interest income (GAAP) |
$ | (463 | ) | $ | 444 | $ | (269 | ) | $ | (2,064 | ) | $ | (2,845 | ) | ||||||
| Fully taxable equivalent (“FTE”) adjustment |
40 | 68 | 71 | 53 | 59 | |||||||||||||||
| Net interest income adjusted for impact of FTE (Non-GAAP) |
$ | (423 | ) | $ | 512 | $ | (198 | ) | $ | (2,011 | ) | $ | (2,786 | ) | ||||||
| Non-Strategic |
||||||||||||||||||||
| Net interest income (GAAP) |
$ | 30,645 | $ | 30,603 | $ | 32,777 | $ | 33,931 | $ | 38,184 | ||||||||||
| Fully taxable equivalent (“FTE”) adjustment |
- | - | - | - | - | |||||||||||||||
| Net interest income adjusted for impact of FTE (Non-GAAP) |
$ | 30,645 | $ | 30,603 | $ | 32,777 | $ | 33,931 | $ | 38,184 | ||||||||||
| Total Consolidated |
||||||||||||||||||||
| Net interest income (GAAP) |
$ | 176,340 | $ | 172,860 | $ | 172,755 | $ | 182,236 | $ | 186,143 | ||||||||||
| Fully taxable equivalent (“FTE”) adjustment |
1,555 | 1,497 | 1,386 | 1,048 | 791 | |||||||||||||||
| Net interest income adjusted for impact of FTE (Non-GAAP) |
$ | 177,895 | $ | 174,357 | $ | 174,141 | $ | 183,284 | $ | 186,934 | ||||||||||
Certain previously reported amounts have been reclassified to agree with current presentation.
| (a) | Included in total equity on the consolidated balance sheet. |
| (b) | Includes goodwill and other intangible assets, net of amortization. |
| (c) | See Glossary of Terms for definition of ratio. |
| (d) | Current quarter is an estimate. |
| (e) | Defined by and calculated in conformity with bank regulations. |
| (f) | Represents FTBNA preferred stock included in noncontrolling interest. |
| (g) | Included in term borrowings on the consolidated balance sheet. |
29
Table of Contents
 First Horizon
National Corporation Third Quarter 2011 Earnings
October 17, 2011 |
Table of Contents
 Portions of
this presentation use non-GAAP financial information. Each of those portions is so noted, and a
reconciliation
of
that
non-GAAP
information
to
comparable
GAAP
information
is
provided
in
a
footnote
or
in
the
appendix at the end of this presentation.
This presentation contains forward-looking statements, which may include guidance,
involving significant risks and uncertainties which will be identified by words such as
“believe”,“expect”,“anticipate”,“intend”,“estimate”,
“should”,“is
likely”,“will”,“going
forward”
and
other
expressions
that
indicate
future
events
and
trends
and
may
be
followed
by
or
reference
cautionary
statements.
A
number
of
factors
could
cause
actual
results
to
differ
materially
from those in the forward-looking information.
These factors are outlined in our recent earnings and other press
releases
and
in
more
detail
in
the
most
current
10-Q
and
10-K.
FHN
disclaims
any
obligation
to
update
any
such
factors or to publicly announce the result of any revisions to any of the forward-looking
statements included herein or therein to reflect future events or developments.
2 |
Table of Contents
 3
Successful Execution:
Controlling What We Can Control
Core Businesses’
pre-tax income at $140mm, up $113mm
linked quarter and $60mm year over year
Capital Markets fixed income average daily revenue at
$1.4mm up from $1.1mm
Core
Businesses¹
Non-
Strategic
Period end Non-Strategic loans declined 7%
Loan sales of ~$150mm of net book value; $36mm impact to
provision from loss on loan sales
Mortgage repurchase provision expense up $28mm to $53mm
Net hedging results declined to $7mm
Optimizing Business Mix For
Profitability And Returns
Driving Value From
Balance Sheet
Focus On Expense Control
Regional Bank revenue per FTE of $66k, up from $62k
Executing ~$124mm of cost saves in core businesses
Environmental Costs
Tier 1 ratio at 14.5%
Tier 1 Common at 12.0%
TCE + Reserves at 13.8%
TCE/TA at 9.0%
Strong Capital Position
Period end Regional Bank loans up 5%
Regional Bank loan yields relatively stable at 4.01%
Regional Bank average deposits up 2% with the rate paid on
deposits down 6bps to 48bps
All data is 3Q11 compared to 2Q11 unless otherwise noted.
Tier 1 Common, TCE, & TA, TCE+Reserves/Risk Weighted Assets are consolidated ratios and
non-GAAP numbers, and a reconciliation is provided in the appendix. 1
Core Businesses include Regional Banking, Capital Markets, and Corporate segments. Tier 1,
Tier 1 Common, TCE+Reserves/Risk Weighted Assets: consolidated ratios and current quarter is estimate;
|
Table of Contents
 4
Solid Pre-Tax Income in Core Business Segments
FHN 3Q11 Pre-Tax Income By Business Segment
1
Core Businesses include Regional Banking, Capital Markets, and Corporate segments.
$200mm
Core Businesses’
3Q11 pre-tax income grew $113mm linked quarter, up $60mm since 3Q10
Includes Visa gain of $35mm in 3Q11 and litigation expense of $37mm in 2Q11
Regional Banking showing continued improvement in profitability
Capital markets higher from strong sales results from increased activity in fixed income
Non-Strategic results lower primarily due to higher loan loss provision and increased
mortgage repurchase provision -$150
-$100
-$50
$0
$50
$100
$150
Regional Bank
Capital Markets
Corporate
Core Businesses¹
Non-
Strategic
Consolidated |
Table of Contents
 FINANCIAL
RESULTS 5 |
Table of Contents
 Consolidated
Financial Results Net income available to common shareholders of
$36mm, diluted EPS of $0.14
Net income from continuing operations of $34mm
Core Businesses¹
pre-tax income of $140mm
Total revenues of $397mm, up 10%
Includes $35mm gain from sale of Visa stock
Regional Banking revenues up 2%
Capital Markets revenues up 26%
Non-Strategic revenues down 28%
Total expenses at $323mm, down 6%
Regional Banking expenses down 4%
Capital markets expenses declined 25%
2Q11 included litigation expense of $37mm
Non-Strategic expenses up 45%
$53mm of mortgage repurchase
expense vs $25mm
Charges for restructuring, repositioning & efficiency in
of $2mm vs $17mm
Total provision at $32mm; provision related to the loan
sale was $36mm
Net charge-offs at $106mm; excluding loan sale at
$59mm
Net charge-offs, excluding loan sale, down 11%
linked quarter and down 47% from 3Q10
6
NII
$186
$173
$176
Noninterest income
246
188
186
Securities gains / (losses), net
(3)
0
35
Total revenue
429
360
397
Noninterest expense
341
344
323
Provision
50
1
32
Pre-tax income
37
15
43
Taxes
3
(4)
8
Continuing operations
34
19
34
Discontinued operations
(0)
4
5
Net income
$34
$23
$39
Net income attributable to
controlling interest
31
20
36
Preferred stock dividends
15
-
-
Net income available
to common shareholders
16
20
36
Diluted shares
239
263
263
Diluted EPS from continuing
operations
$0.07
$0.06
$0.12
Diluted EPS
$0.07
$0.08
$0.14
($mm, except per share)
2Q11
3Q10
3Q11
All data is 3Q11 compared to 2Q11 unless otherwise noted.
Numbers may not add to total due to
rounding.
1
Core
businesses
include
Regional
Banking,
Capital
Markets,
and
Corporate
segments.
Core
Businesses’
pre-tax
income
is
a
non-GAAP
number
and
is
reconciled
on
slide
7. |
Table of Contents
 7
Third Quarter 2011 Segment Highlights
Numbers may not add to total due to
rounding.
Pre-tax earnings, Revenue, and Expense are in
millions.
Revenue includes securities gain / losses.
2Q11 Drivers / Impacts
3Q11 Revenue
3Q11 Expense
Pre-Tax Earnings ($mm)
3Q11
Linked Quarter
Change
$mm / Percent
3Q10
2Q11
Regional
Banking
Capital
Markets
Corporate
Non-Strategic
$209
$137
$105
$77
$38
$19
$46
$89
Core Business
(subtotal)
Total
$351
$233
$397
$323
$5 / 2%
$22 / 26%
$28 / NM
$(18) / (28)%
$54 / 18%
$37 / 10%
$(6) / (4)%
$(26) / (25)%
$(17) / (48)%
$(50) / (18)%
$28 / 45%
$(22) / (6)%
$52
$43
$(14)
$81
$(43)
$37
$94
$28
$19
$140
$(98)
$43
$74
$(20)
$(27)
$28
$(13)
$15
Loan loss provision of $55mm in 3Q11
vs $15mm in 2Q11. Repurchase
provision of $53mm in 3Q11 vs $25mm
in 2Q11
Fixed income average daily revenue
of $1.4mm in 3Q11 vs $1.1mm in
2Q11
Mortgage warehouse valuation
adjustments of $(7)mm in 3Q11 vs
$2mm in 2Q11. Net hedging results of
$7mm in 3Q11 vs $15mm 2Q11
Provision credit in 3Q11 of $23mm
vs provision credit of $14mm in
2Q11
3Q11 included $35mm of securities
gain from sale of Visa stock
2Q11 expenses include $37mm loss
accrual related to settlement of a
litigation matter
NII up 3% primarily due to loan
volume. Fee income flat linked
quarter
3Q11 included restructuring costs of
$3mm vs $17mm in 2Q11 |
Table of Contents
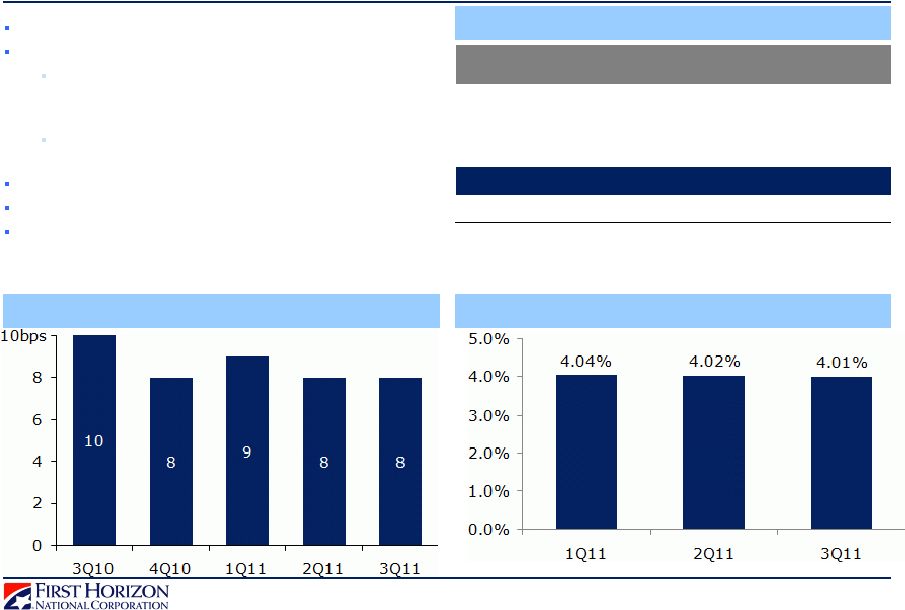 Successful
Execution: Balance Sheet and NIM Regional Bank Loan Yields
3Q11 period end total assets at $26B
3Q11 total period end loans at $16B, up 1% vs 2Q11
Period end Regional Banking loans increased
$546mm or 5% from 2Q11, including $484mm
growth in loans to mortgage companies
Period end Non-Strategic loans decreased
$352mm or 7% from 2Q11
Average core deposits rose 2% linked quarter
Consolidated NIM up 3bps linked quarter to 3.23%
Core Businesses’
NIM
at 3.52%, down 3bps linked
quarter
Adverse Impact from Commercial Non-Accruals
Net Interest Margin by Segment¹
8
NIM
3Q11
% of Total
Period End Assets
Regional Banking
5.17%
47%
Capital Markets
1.17%
11%
Corporate
-0.01%
20%
Core Businesses
3.52%
78%
Non-Strategic
2.30%
22%
First Horizon
3.23%
Numbers/percentages may not add due to rounding.
1
Core Businesses NIM is a non-GAAP number relating to the three core business
segments: Regional Banking, Capital Markets, and Corporate. Net interest margin is computed using total net interest income adjusted for FTE. Refer to the
non-GAAP to GAAP reconciliations in the appendix. 1 |
Table of Contents
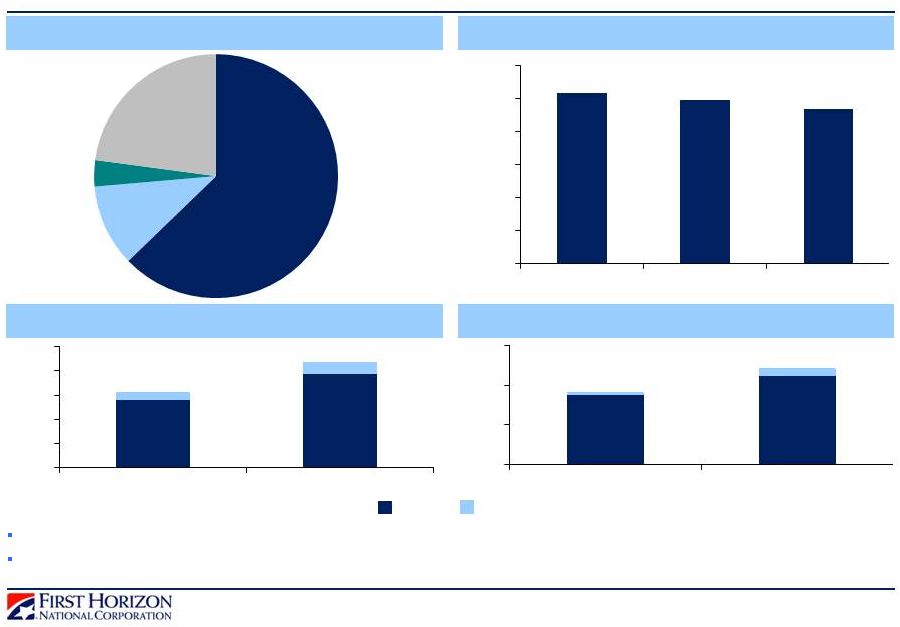 Successful
Execution: Driving More Value from the Balance Sheet
3Q11 Regional Bank Loan Balances
Regional Bank Commercial Loan Yields
Regional Bank Commercial Loan Commitments
Regional Bank Commercial Loans Funded
9
C&I
CRE
Current
loan
composition
in
Regional
Bank
reflects
desirable
mix
for
consolidated
balance
sheet
Trends in loan pipeline highlights an emphasis on C&I loans (Corporate, Asset Based
Lending, Loans to Mortgage Companies;
industries
in
pipeline
include
medical,
manufacturing
and
government);
opportunities
in
CRE
$0.0
$0.5
$1.0
$1.5
$2.0
$2.5B
2010 (First 9 Months)
YTD 2011
$0.0
$0.5
$1.0
$1.5B
2010 (First 9 Months)
YTD 2011
4.02%
4.00%
3.97%
3.5%
3.6%
3.7%
3.8%
3.9%
4.0%
4.1%
1Q11
2Q11
3Q11
C&I
63%
Income
CRE
11%
Other 3%
Consumer
Real
Estate
23% |
Table of Contents
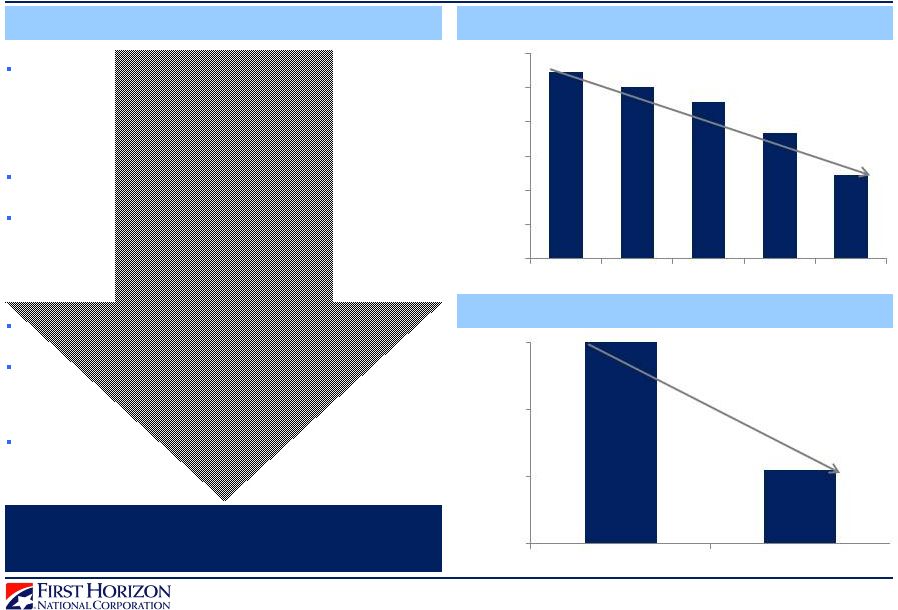   Improving
Productivity and Efficiency in Core Businesses, Environmental Costs Remain Elevated
~$124mm Identified in Cost Savings
Regional Banking Expenses
Non-Strategic Expenses
10
16%
Goal of 60%-65% Efficiency Ratio
~$124mm identified in cost savings, in addition to
expected reduction in Non-Strategic expenses over the
long-term
$88mm annualized impact in 3Q11 run rate
Additional $27mm of actions in execution, targeted to
be largely completed by the end of 2011; an additional
$9mm to be executed by the end of 2012
3Q11 FTE decline of 4% linked quarter, 14% YOY
Near-term offsets from technology investments and
elevated environmental costs
Targeting 25% reduction from the level of 2010
consolidated expenses by the end of 2013
10%
$152
$150
$148
$143
$137
$125
$130
$135
$140
$145
$150
3Q10
4Q10
1Q11
2Q11
3Q11
$200
$220
$240
2010 (First 9 Months)
YTD 2011
$265
$222
$155mm
$260mm |
Table of Contents
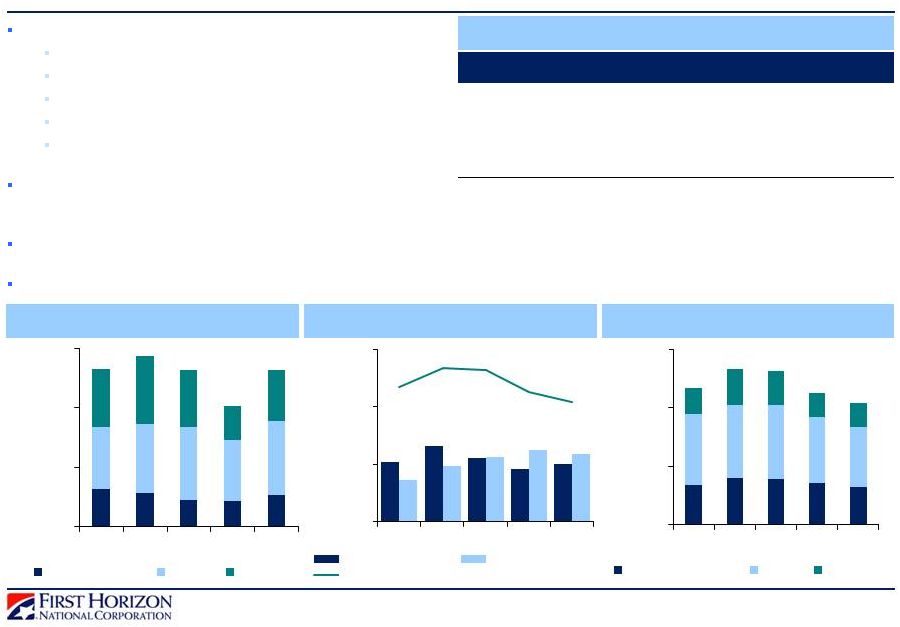 11
Mortgage Repurchase-Related
Expenses Remain Manageable
Pipeline at $418mm for 3Q11 vs $451mm in 2Q11
$284mm of GSE-related claims
$86mm of mortgage-insurer (MI) related claims
$4mm of private whole loan related claims
$44mm of other non-repurchase requests
Loans where MI is lost are considered in reserve
calculation, but not in pipeline
Cumulative rescission rates averaging between 45%
and 55% with average loss severities ranging between
50% and 60%
Higher mix of MI related resolutions leading to higher
loss content in 3Q11
Sold mortgage origination platform in August 2008
($ in mm)
3Q10
4Q10
1Q11
2Q11
3Q11
Beginning Balance
$162
$175
$183
$183
$169
Net Realized Loss
($36)
($36)
($37)
($39)
($53)
Provision
$49
$44
$37
$25
$53
Ending Balance
$175
$183
$183
$169
$169
$150mm
$600mm
$600mm
Mortgage Repurchase Reserve
New GSE Repurchase Requests
by Vintage
Total Pipeline of
Repurchase Requests
2
Total
Pipeline
by
Vintage
1
$0
$50
$100
3Q10
4Q10
1Q11
2Q11
3Q11
2006 & Prior
2007
2008
$0
$200
$400
3Q10
4Q10
1Q11
2Q11
3Q11
New Requests
Resolved
Pipeline
$0
$200
$400
3Q10
4Q10
1Q11
2Q11
3Q11
2006 and Prior
2007
2008
As of 3Q11. Numbers may not add due to rounding. ¹Requests
reflect pipeline as of each respective quarter end. 2
As of 9/30/11. Based on UPB. The pipeline represents active investor claims and mortgage
insurance (MI) cancellations under review, both of which could occur on the same loan.
Excludes MI cancellation notices that have been reviewed and coverage has been lost. For
purposes of estimating loss, MI cancellation notices where coverage has been lost are contemplated. |
Table of Contents
 12
Private Mortgage Securitizations:
Private Securitization Risk Remains Manageable
2004-2007 Private Mortgage Securitizations¹
Private Loan Repurchase Risk
Different than GSE Risk
~$33B of originations from 2004 to 2007
102 active mortgage securitizations with a current UPB
of ~$12B
46 Jumbo and 56 Alt-A first lien securitizations
FHN originated 60% Alt-A, 40% Jumbo, and no
Subprime private securitizations
At origination, FHN’s average securitization size was
$325mm
Industry average securitization size of $858mm
Private Mortgage Securitization Facts¹
No private mortgage securitization loan
repurchase requests
Four private securitization-related lawsuits
outstanding² 66% of current UPB dollar-weighted
2004-2007 private securitizations are outperforming industry cohort on
cumulative loss
81% of current UPB dollar-weighted 2004-2007 private
securitizations are outperforming industry cohort on
60D+ delinquencies
1
Data source: LoanPerformance, CPRCDR, Intex, PolyPaths, Bloomberg with company analysis. FHN
has not verified data accuracy. Excludes inactive deals. Data as of Aug 2011 with Sept remits.
2
Two lawsuits are from 2H10 and the other two, including a suit by FHFA, are from 3Q11. A
fifth suit, filed in 2010, has been withdrawn as to FHN. Resolution
Representations
Access
Voting Rights
Generally, reps and warranties
are not as comprehensive as
GSE whole-loan reps and
warranties
No specific representation and
warranty on third-party fraud
in the origination
Difficult for most non-
governmental investors to
access loan files
Significant upfront cost with
unknown returns; must
indemnify trustee
Generally requires a
coordinated investor effort to
compel trustees to investigate
and pursue repurchase claims
Investor interests are not
necessarily aligned
Longer resolution
process expected
Longer timeline may decrease
probability of successful claims |
Table of Contents
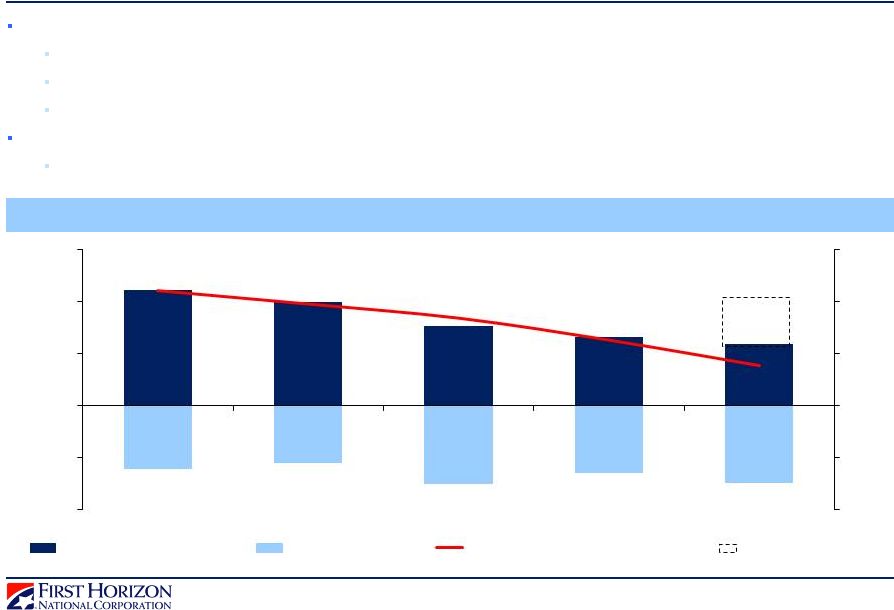 13
Successful Execution:
Asset Quality Trends Continue to Improve
Net charge-offs of $106mm, including $48mm of charge-offs related to loan sales
NCOs excluding loan sale of $58mm, down 11% from 2Q11
Regional Bank NCOs down $16mm or 40% year over year
Non-Strategic NCOs, excluding $42mm of NCOs related to loan sales, down $31mm or 43% year
over year Reserves for loan losses decreased $74mm linked quarter to $450mm or 2.77% of
period end loans Reserve decrease of $12mm related to loan sales
Reserves and Net Charge-Offs
Data as of 9/30/11, unless otherwise noted. Numbers may not add due to rounding.
Loan Sales NCOs
$111
$100
$77
$66
$58
-$61
-$55
-$76
-$65
-$74
4.22%
3.96%
3.69%
3.26%
2.77%
0.0%
1.0%
2.0%
3.0%
4.0%
5.0%
-$100
-$50
$0
$50
$100
3Q10
4Q10
1Q11
2Q11
3Q11
Net Charge
-
Offs (NCOs)
Reserve Decrease
Reserve % of Loans (right axis)
$48
$150mm |
Table of Contents
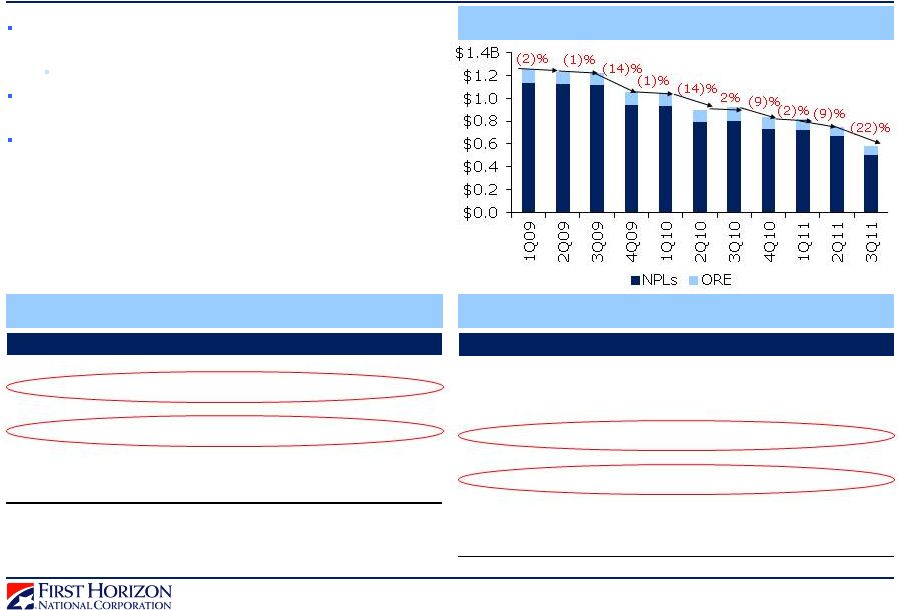 14
($ mm)
1Q11
2Q11
3Q11
Beginning ORE
$110
$94
$79
Valuation Adjustments
($5)
($5)
($4)
Adjusted Balance
$106
$90
$75
+ New ORE
$16
$17
$17
+ Capitalized Expenses
$1
$1
$1
- Dispositions:
($28)
($29)
($12)
Single Transactions
($27)
($25)
($10)
Auctions
(0)
0
0
Bulk Sales
0
(4)
(2)
Ending ORE
$94
$79
$80
($ mm)
1Q11
2Q11
3Q11
Beginning NPLs
$486
$462
$404
+ Additions
$46
$31
$36
+ Principal Increase
$4
$2
$2
- Resolutions/Payments
($47)
($66)
($54)
- Net Charge-Offs
($22)
($15)
($22)
- Transfer to ORE
($3)
($5)
($10)
- Upgrade to Accrual
($2)
($5)
($15)
Ending NPLs
$462
$404
$341
Successful Execution:
Non-Performing Assets Decline 22% in 3Q11
Non-Performing Assets
NPAs down $165mm or 22% linked quarter, and down
37% or $337mm year over year
Loan sales of ~$150mm
NPL levels down 25% from 2Q11, down 37%
since 3Q10
ORE balances stable from continued disposition activity
NPL Activity from Commercial and OTC
ORE Activity
Numbers may not add due to rounding.
1
Does not includes Consumer loan sales in 3Q11.
2
ORE excludes foreclosed real estate from government insured loans.
1
2 |
Table of Contents
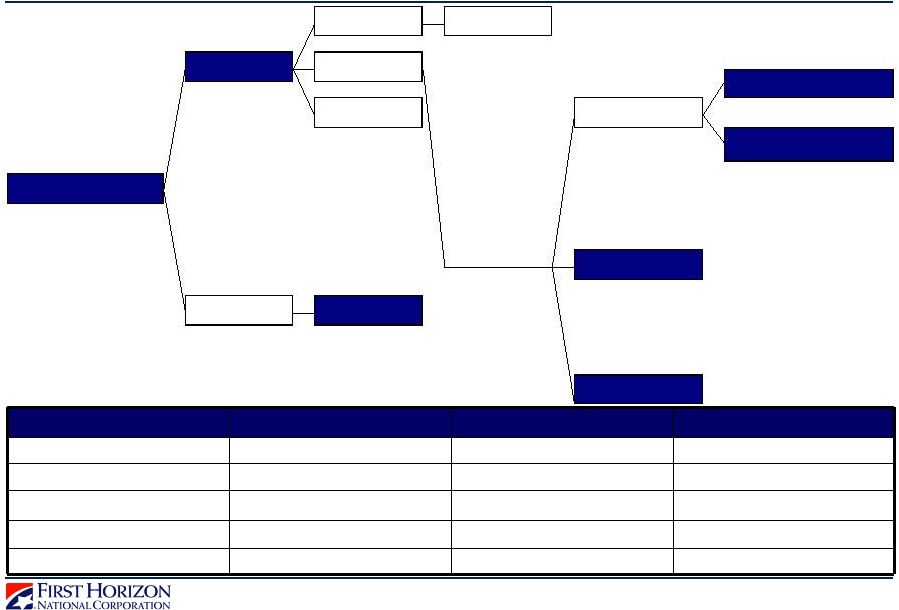 15
Building Long-Term Earnings Power:
FHNC Bonefish –
Long-Term Targets
1
Core Businesses include Regional Banking, Capital Markets, and Corporate segment. Certain core
data is non-GAAP and a reconciliation is provided in the appendix.
2
ROA and NCO / Average Loans are
annualized.
3Q11 Consolidated
3Q11 Core
Long-Term Targets
ROA
0.62%
1.98%
1.25 -
1.45%
NIM
3.23%
3.52%
3.50 -
4.00%
NCO
/
Average
Loans
2.65%
0.85%
0.30 -
0.70%
Fee Income as % of Revenue
51%
49%
40 -
50%
Efficiency Ratio
89%
74%
60 -
65%
Efficiency Ratio
60% -
65%
Tax Rate
Annualized Net Charge-Offs
0.30% -
0.70%
Net Interest Margin
3.50% -
4.00%
Return on Tangible Equity
15% -
20%
Tier 1 Common
8% -
9%
Equity / Assets
Return on Assets
1.25% -
1.45%
Risk Adjusted Margin
Total Assets
Earning Assets
Pre-tax Income
% Fee Income
40% -
50%
1
2 |
Table of Contents
 Successful
Execution: FHN Strategic Priorities 1)
Optimize
business
mix
for
profitability
and
returns
Replace runoff, low margin, Non-Strategic assets with higher margin, Regional Banking
assets Focused on improving profitability in all lines of business
Capital Markets continues to be strong long-term contributor to fee income
2)
Improve
productivity
and
efficiency
Replace revenue impacted by regulation
Reduce wind-down and environmental expenses
Business process optimization, organization and infrastructure simplification
3)
Manage
excess
capital smartly
Maintain appropriate levels for future banking environment
Disciplined approach to deploying capital
16
Building a Foundation for Long-Term Earnings Power |
Table of Contents
 APPENDIX
17 |
Table of Contents
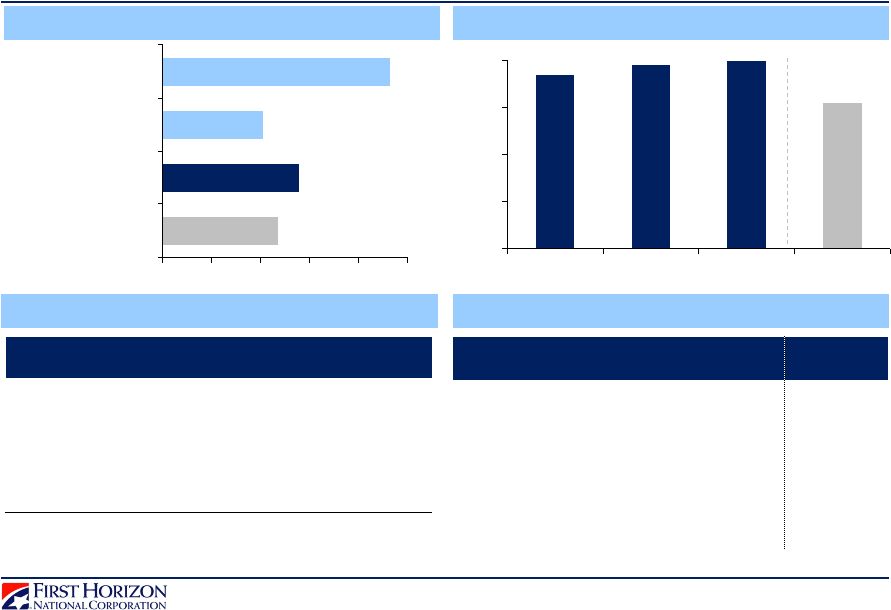 18
Liquidity, Capital, and Reserves
Tier 1 Common Ratio
Wholesale Funding
Capital Ratios
Period End ($B)
1Q11
2Q11
3Q11
Fed Funds Purchased
$1.6
$1.3
$1.6
Senior Debt
0.5
0.5
0.5
Insured Network Deposits
1.7
1.7
1.8
Borrowing from FHLB
0.1
-
0.4
Other
0.1
0.2
0.2
$3.9
$3.7
$4.5
Total Capital
18.7%
18.2%
18.3%
15.4%
Tier 1 Capital
14.3%
14.4%
14.5%
12.7%
TCE/TA
8.9%
8.9%
9.0%
7.8%
TCE/RWA
11.0%
11.3%
11.5%
11.1%
3Q11
2Q11 Peer
Median
1Q11
2Q11
Reserves vs. Peers
2.34%
2.77%
2.04%
4.62%
0%
1%
2%
3%
4%
5%
Peer Median
FHN Consolidated
FHN Regional Bank
FHN Non-Strategic
11.7%
11.9%
12.0%
11.1%
8%
9%
10%
11%
12%
1Q11
2Q11
3Q11
2Q11 Peer
Median
2
1
1
1
Numbers may not add to total due to rounding.
1
Source: SNL. Peer median includes top 50 publicly traded U.S. banks by total asset size at
2Q11. TCE/RWA is not adjusted for unrealized gains on AFS securities, Tier 1 Common, and TCE/TA are
non-GAAP numbers, and a reconciliation is provided at the end of the appendix. 2
Excluding Securities Sold Repos, Trading Liabilities, and sub-debt and other
collateralized borrowings of $3.0B. |
Table of Contents
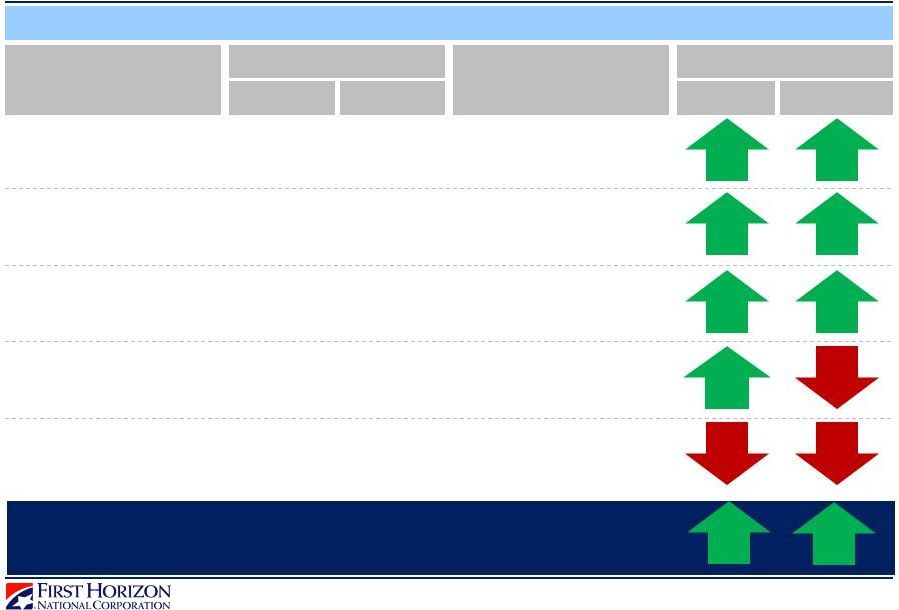 FDIC Market
Share FDIC Deposit Market Share
Source: FDIC. Data as of June 30, 2011.
19
Market
FHN Market Share
2011 FHN Deposits
YOY Deposit Growth
2010
2011
FHN
Overall Market
14.7%
5.8%
2.2%
6.9%
8.4%
7.4%
2.0%
0.4%
4.7%
2.4%
West Tennessee
$7.5B
32.6%
33.7%
East Tennessee
$2.9B
21.9%
21.6%
Middle Tennessee
$2.4B
6.3%
6.6%
Southeast Tennessee
$2.1B
21.0%
24.1%
Northeast Tennessee
$1.1B
22.2%
21.7%
Total FHN Footprint
$16.0B
18.0%
18.7%
6.5%
2.5% |
Table of Contents
 3Q11 Credit
Quality Summary by Portfolio As of 9/30/11; numbers may not add to total due to
rounding. 20
Period End
Commercial
(C&I & Other)
Income
CRE
Residential
CRE
HE &
HELOC
Other
1
Permanent
Mortgage
Commercial
(C&I & Other)
Income
CRE
Residential
CRE
HE &
HELOC
Permanent
Mortgage
Other
2
Total
End Loans
$7,142
$1,235
$103
$2,604
$293
$161
$563
$52
$38
$2,701
$658
$691
$16,241
30+ Delinquency
0.45%
0.63%
0.56%
0.99%
1.19%
0.73%
0.18%
21.51%
0.76%
2.14%
6.35%
3.33%
1.27%
Dollars
$32
$8
$1
$26
$3
$1
$1
$11
$0
$58
$42
$23
$206
NPL %
1.67%
5.75%
36.74%
0.57%
0.03%
NM
14.37%
18.80%
44.39%
1.02%
3.64%
1.57%
2.55%
Dollars
$120
$71
$38
$15
$0
NM
$81
$10
$17
$28
$24
$11
$413
Net
Charge-offs
3
%
0.73%
1.17%
4.91%
0.61%
3.52%
NM
0.37%
6.29%
15.10%
3.38%
23.30%
5.08%
2.65%
Dollars
$12
$4
$1
$4
$3
NM
$1
$1
$2
$24
$47
$9
$106
Allowance
$139
$43
$15
$28
$7
NM
$43
$4
$3
$107
$26
$34
$450
Allowance / Loans %
1.94%
3.49%
14.27%
1.09%
2.40%
NM
7.71%
7.82%
8.33%
3.95%
3.94%
4.94%
2.77%
Allowance / Charge-offs
2.87x
2.94x
2.54x
1.79x
0.69x
NM
20.25x
1.08x
0.41x
1.14x
0.14x
0.95x
1.06x
(1) Credit Card, Permanent Mortgage, and Other
(2) Restricted Consumer Real Estate Loans, OTC, and Other Consumer
(3) Net Charge-Offs are quarterly annualized
(NM) Not meaningful
(4) Exercised clean-up calls on jumbo securitizations in 2Q11 and 4Q10, which are now on
balance sheet in the Corporate segment ($ in millions)
Regional Bank
Non-Strategic
Corporate
4 |
Table of Contents
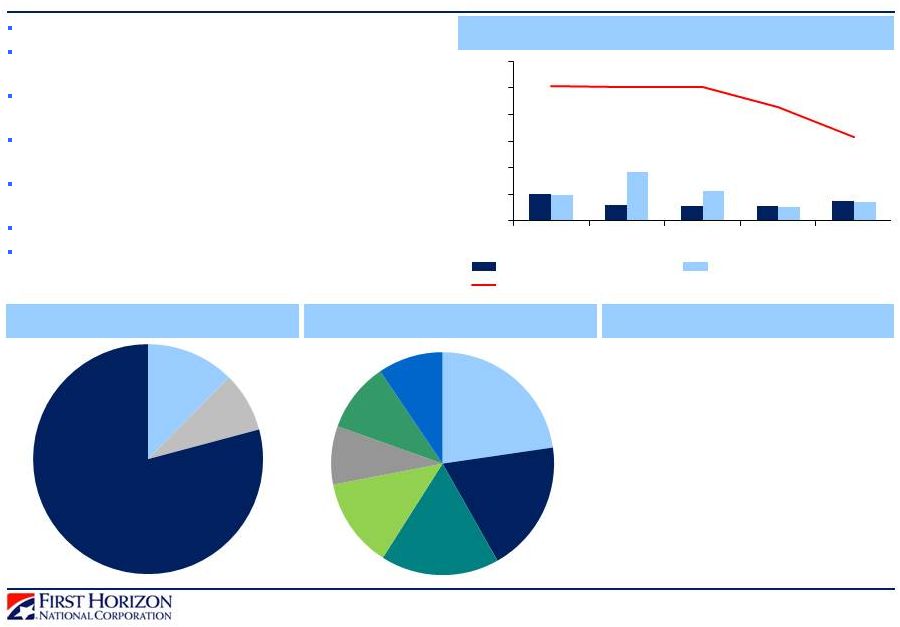 21
Income CRE Portfolio
Balances of $1.3B at 9/30/11
96% managed in Regional Banking with relationship-
oriented customers
Proactively managing problem projects and maturities
to regulatory standards
Do not capitalize interest and do not fund interest on
distressed properties
Net charge-offs down $1mm or 33% linked quarter to
$5mm
Reserves of 3.7% at 9/30/11
Continued improvement and stabilization
Numbers may not add to total due to
rounding.
1
As of 9/30/11; NPLs as a percentage of each
portfolio. 2
“Other”
includes Non-Owner Occupied Single Family Residential and Multi-Use Projects.
Land
Other²
Office
Multi-Family
Retail
Industrial
Hospitality
35.8%
11.7%
5.3%
3.1%
1.7%
1.3%
0.0%
Land
35.8%
10.13%
10.06%
10.07%
8.54%
6.27%
0%
2%
4%
6%
8%
10%
12%
3Q10
4Q10
1Q11
2Q11
3Q11
30+ Delq.
Net Charge
-
Offs (ann.)
NPLs/Total Loans
Construction
12%
Land
9%
-Perm/Non-
79%
Retail
23%
Multi-Family
19%
Office
17%
Industrial
13%
Land
9%
Other
10%
Hospitality
9%
Loan Type¹
Collateral Type¹
NPLs By Product Type¹
Performance
Construction
Mini |
Table of Contents
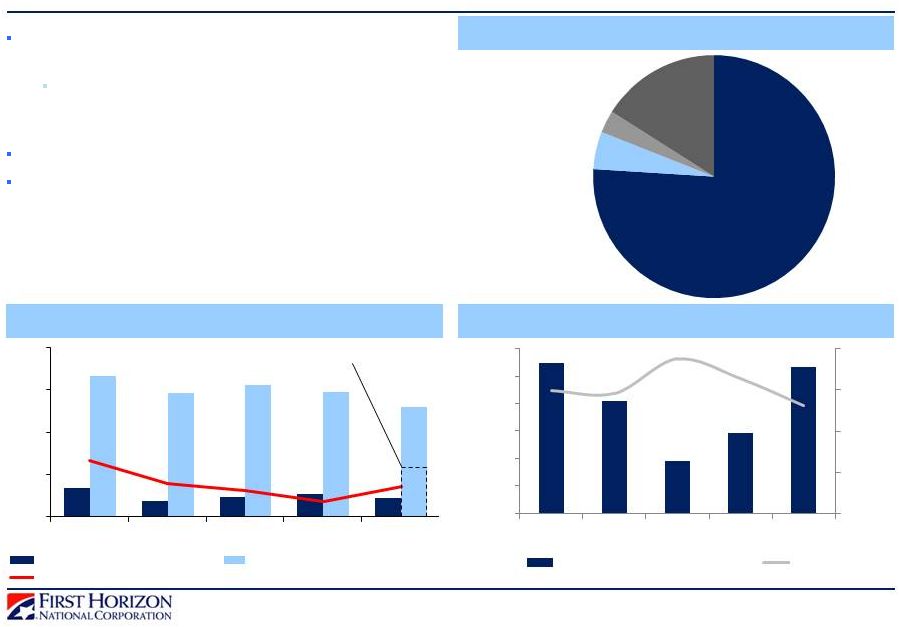 C&I
Portfolio NPLs/Total Loans of 1.18% without TRUPs and
Bank Related loans
Numbers may not add to total due to
rounding.
22
$7.7B portfolio, diversified by industry, managed in
Regional Bank
Includes loans to mortgage warehouse companies
(correspondent banking) of $1.1B in 3Q11 vs
$583mm in 2Q11
Net charge-offs down $7mm linked quarter
C&I consolidated reserves of 2.37% at 9/30/11
C&I Portfolio
NPLs/Total Loans of 1.18% without TRUPs and
Bank Related loans
Numbers may not add to total due to
rounding.
22
$7.7B portfolio, diversified by industry, managed in
Regional Bank
Includes loans to mortgage warehouse companies
(correspondent banking) of $1.1B in 3Q11 vs
$583mm in 2Q11
Net charge-offs down $7mm linked quarter
C&I consolidated reserves of 2.37% at 9/30/11
0%
1%
2%
3%
4%
3Q10
4Q10
1Q11
2Q11
3Q11
30+ Delq.
NPLs/Total Loans
Net Charge
-
Offs (Ann.)
4.0%
4.5%
5.0%
5.5%
6.0%
$0.0
$0.2
$0.4
$0.6
$0.8
$1.0
3Q10
4Q10
1Q11
2Q11
3Q11
Period End Balances
Yields
TRUPs 5%
C&I Portfolio: Loans to Mortgage Companies
C&I Loan Composition
Consolidated C&I Portfolio
All Other C&I
76%
Bank-Related
3%
Correspondent
Banking
16%
$1.2B |
Table of Contents
 C&I
Portfolio: TRUPS & Bank-Related Loans 3Q11
TRUPs & Bank-
Related Loans
C&I w/o TRUPs &
Bank-Related Loans
Total C&I Portfolio
PE Balances ($mm)
$653
$7,053
$7,706
Reserves ($mm)
$107
$111
$182
Reserve Coverage
16.38%
1.57%
2.37%
NPL %
17.96%
1.18%
2.60%
NCO %
3.55%
0.41%
0.70%
TRUPS and Bank-Related Loan Coverage
$653mm balances in TRUPS and bank-related loans
$301mm whole-loan TRUPs to banks
$156mm whole-loan TRUPs to insurance companies
$119mm loans to bank holding companies
$76mm other loans secured by bank stock
Average TRUP size of $9mm
Significant focus is directed at this portfolio
TRUPs and bank holding company loans are re-graded quarterly
Eleven TRUPs on deferral at 9/30/11
23
1
Reserve coverage includes $35.3mm of LOCOM on
TRUPs. 2
NCO% is QTD Annualized. Numbers may not add to total due to rounding.
2
1
1 |
Table of Contents
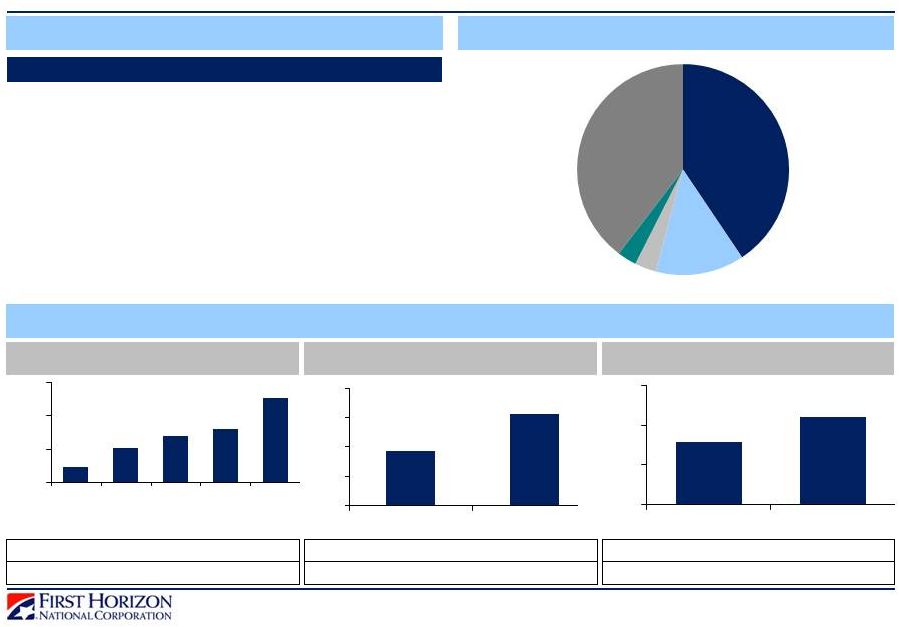 24
Home Equity: Performance and Characteristics
Numbers/Percentages may not add due to
rounding.
All charts and graphs include $623.3mm of restricted consumer real estate loans.
52%
% of portfolio
13%
13%
15%
8%
87%
13%
% of portfolio
34%
66%
% of portfolio
First
Second
Total
Balance
$2.0B
$3.9B
$5.9B
Original FICO
740
736
737
Refreshed FICO
738
724
728
Original CLTV
73%
81%
78%
Full Doc
83%
71%
75%
Owner Occupied
87%
96%
93%
HELOCs
$0.8B
$3.0B
$3.8B
Weighted Average
HELOC Utilization
52%
62%
60%
Home Equity: Performance and Characteristics
30+ Delinquency: Key Drivers
FICO Score-Origination
Channel
Lien Position
0.98%
2.07%
2.81%
3.22%
5.09%
0%
2%
4%
6%
>=740
720-
739
700-
719
660-
699
<660
1.83%
3.10%
0%
1%
2%
3%
4%
Retail
Wholesale
1.58%
2.21%
0%
1%
2%
3%
1st Lien
2nd Lien
Core
Banking
Customers
TN
40%
CA
14%
GA
3%
FL
3%
Other
40%
Geographic Distribution
Portfolio Characteristics |
Table of Contents
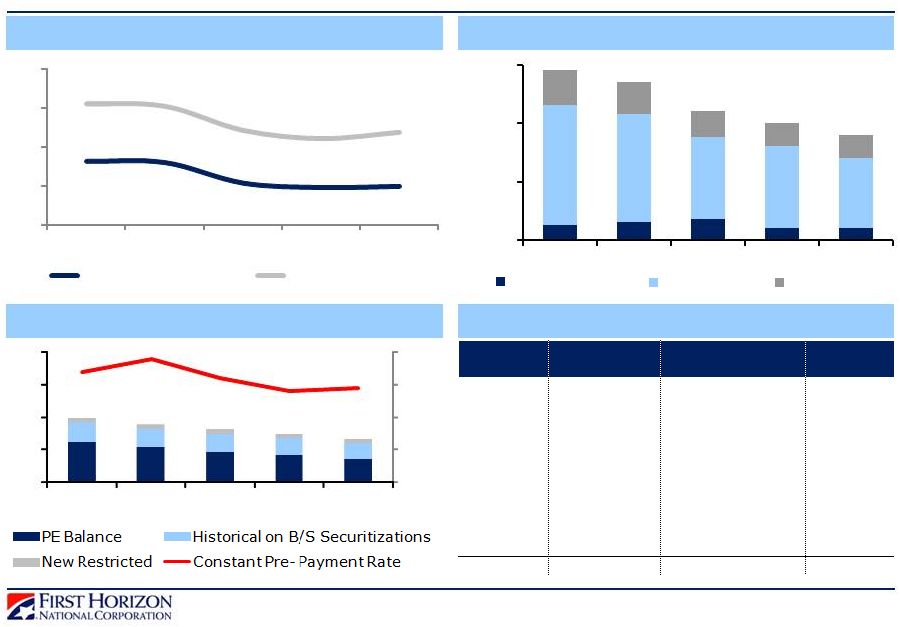  25
Consumer Real Estate Portfolio
30+ Delinquency: Non-Strategic vs. Regional
Net Charge-Offs
Non-Strategic Portfolio Run-Off²
Vintage Mix
1
Source: McDash industry data as of July
2011.
2
Channeling changed beginning March 2010 to be consistent with Accounting
Segments.
All
charts
and
graphs
include
$623.3mm
of
restricted
real
estate
loans.
Industry¹
= 6.75%
$44
$40
$35
$58
$54
Balance ($B)
W/A
9/30/2011
2Q11
3Q11
Age (mo.)
pre-2002
$0.3
0.65%
0.78%
118
2003
$0.5
0.87%
0.87%
99
2004
$0.7
1.80%
1.64%
86
2005
$1.0
5.35%
3.87%
74
2006
$0.9
3.64%
3.70%
63
2007
$1.0
3.43%
4.16%
51
2008
$0.5
2.54%
1.61%
40
2009
$0.3
0.65%
0.33%
28
2010
$0.4
0.00%
0.00%
14
2011
$0.4
0.00%
0.00%
4
Total
$5.9
2.70%
2.40%
60
Vintage
NCOs QTD Ann.
$0
$20
$40
$60mm
3Q10
4Q10
1Q11
2Q11
3Q11
Regional Banking
Non-Strategic
Restricted
0.99%
2.36%
0%
1%
2%
3%
4%
3Q10
4Q10
1Q11
2Q11
3Q11
Regional Banking
Non-Strategic
17%
19%
16%
14%
15%
0%
5%
10%
15%
20%
$2
$3
$4
$5
$6B
3Q10
4Q10
1Q11
2Q11
3Q11 |
Table of Contents
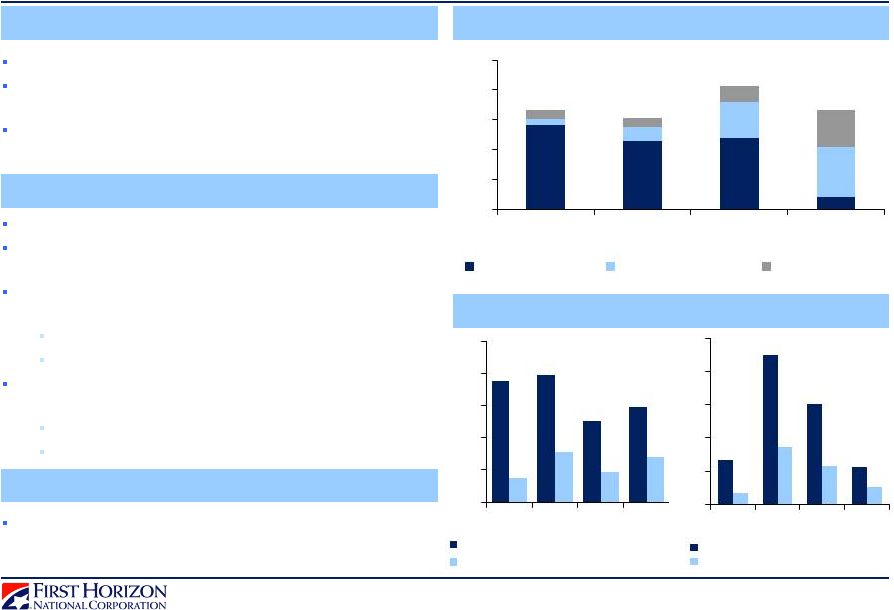 26
Mortgage Repurchases:
Origination and Loan Characteristics
GSE
GSE Originations
~$70B of originations from 2005 to 2008
Received ~$1.1B of GSE-related repurchase requests
to date, or 1.6% of originations
Represent 98% of all active repurchase/make whole
requests
in
pipeline
at
9/30/11
Private
Mortgage
Securitizations
Jumbo and Alt-A
5
~$47B of originations from 2000 to 2007
9 securitizations of jumbo loans called in 2Q11 and
4Q10
4
102
active
2004
–
2007
securitizations,
reflected
in
current UPB
46 first lien Jumbo securitizations
56 first lien Alt-A securitizations
Outstanding
UPB
of
the
2004
–
2007
securitizations
of ~$12B
62% Alt-A
38% Jumbo Loans
1
Requests include MI cancellation notices. ²GSEs account
for 98 percent of all actual repurchase/make-whole requests in the pipeline as of 9/30/11 and
89 percent of the active pipeline inclusive of PMI cancellation notices and all other
claims. ³Supplemental private securitization data provided on FHN’s website at
ir.fhnc.com.
4
Aggregate original UPB of $3.8B. Upon recognition by FHN called loans are no longer subject to
repurchase risk.
5
Data source: LoanPerformance, CPRCDR, Intex, PolyPaths, Bloomberg with company analysis.
FHN has not verified the data accuracy. Jumbo original balances exclude inactive deals.
Whole Loan Sales/Non-GSE
Represent 2% of all active repurchase/make whole
requests in 3Q11 pipeline
$25B
$10B
$5B
$0
$1
$2
$3
$4
2004
2005
2006
2007
Jumbo Original Balance (~$13B)
$0
$2
$4
$6
$8
2004
2005
2006
2007
Alt-A Original Balance (~$20B)
Alt-A Remaining Balance (~$8B)
$0
$5
$10
$15
$20
2005
2006
2007
2008
FNMA ("Fannie")
FHLMC ("Freddie")
GNMA("Ginnie")
Jumbo Remaining Balance (~$ 5B)
2
1
3 |
Table of Contents
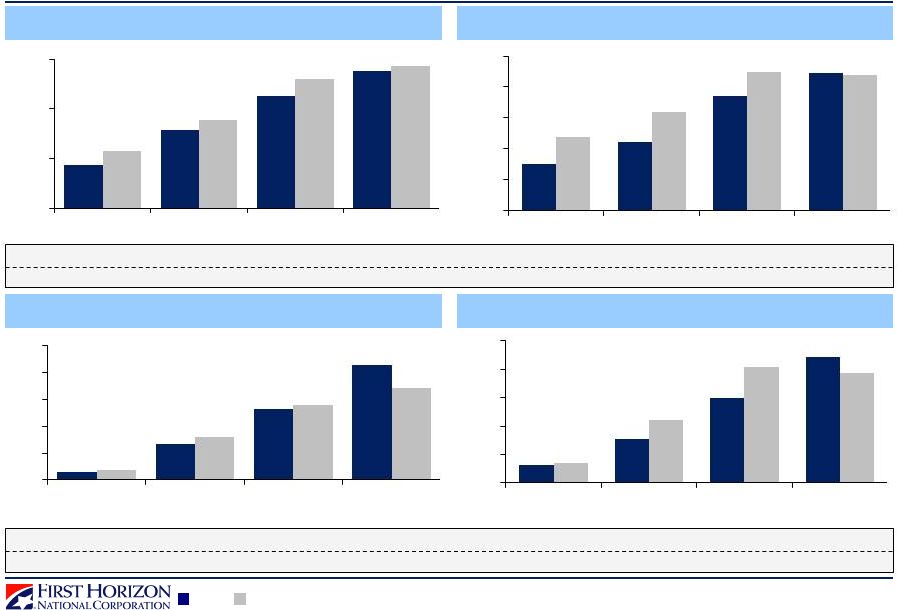 27
Private Mortgage Securitizations:
Delinquencies and Cumulative Losses
Jumbo 60+ Day Delinquencies
Alt-A 60+ Day Delinquencies
Jumbo Cumulative Losses
Alt-A Cumulative Losses
Data as of August 2011. September
Remits.
Data source: LoanPerformance, CPRCDR, Intex, PolyPaths, Bloomberg with company analysis.
FHN has not verified the data accuracy.
Cohort (Industry) = Loans of similar type/vintage relevant reference
group.
Numbers may not add to total due to rounding. Supplemental private securitization data
provided on FHN’s website at ir.fhnc.com. 6%
13%
8%
11%
Vintage Remaining Balance / Total 2004-2007 Current Jumbo and Alt-A Balance
6%
28%
19%
9%
11%
12%
8%
9%
Vintage Original Balance / Total 2004-2007 Original Jumbo and Alt-A Balance
8%
27%
18%
7%
FHN
Industry
0%
1%
2%
3%
4%
5%
2004
2005
2006
2007
0%
3%
6%
9%
12%
15%
2004
2005
2006
2007
0%
7%
14%
21%
28%
35%
2004
2005
2006
2007
0%
6%
12%
18%
2004
2005
2006
2007
1 |
Table of Contents
 FHFA
Litigation Certificate Breakdown FHFA Litigation Securitizations
$874mm*
28
*The original balance related to the FHFA lawsuit is $874mm, plus an additional $9mm of cost
over par, totaling $883mm Paid Off 53%
Performing UPB 34%
60D+ Delinqent²
9%
Cumulative Loss 4%
$0.0
$0.2
$0.4
$0.6
$0.8
$1.0B
Data source: September Trustee Reports and the FHFA lawsuit filed on 9/2/11.
¹In April 2007, the GSEs purchased the remaining $161mm of UPB
in the FHAMS 2005-AA12 IIA1 tranche, as reported in the FHFA lawsuit. This tranche had an origination balance of $213mm.
²60D+ Delinquent defined as a delinquency status of 60 days or
more for bankruptcies, foreclosures, REO, and delinquencies. ($ in Millions)
Alt-A Deal
FHFA-Related
Tranche
Original
UPB
Paid
Off
Current
UPB
Performing
UPB
60D+
Delinq
Cumulative
Loss
FHAMS 2005-AA9
IIA1
$214
$117
$91
$75
$16
$6
FHAMS 2005-AA10
IA1
$140
$79
$58
$47
$11
$3
FHAMS 2005-AA11
IA1
$129
$66
$55
$45
$10
$8
FHAMS 2005-AA12
IIA1
$161
$67
$85
$67
$17
$8
FHAMS 2006-AA1
IA1
$230
$132
$88
$66
$22
$10
FHFA
Total
1
$874
$461
$377
$301
$77
$35 |
Table of Contents
 Reconciliation
to GAAP Financials Slides in this presentation use non-GAAP information of net
interest income adjusted for impact of FTE. That information is not presented according
to generally accepted accounting principles (GAAP), and is reconciled to GAAP
information below.
29
($ in 000s)
3Q11
2Q11
1Q11
Regional Banking
Net interest income (GAAP)
$140,603
$136,249
$134,671
Fully taxable equivalent ("FTE") adjustment
$1,434
$1,353
$1,243
Net interest income adjusted for impact of FTE (Non-GAAP)
$142,037
$137,602
$135,914
Capital Markets
Net interest income (GAAP)
$5,555
$5,564
$5,576
Fully taxable equivalent ("FTE") adjustment
$81
$76
$72
Net interest income adjusted for impact of FTE (Non-GAAP)
$5,636
$5,640
$5,648
Corporate
Net interest income (GAAP)
($463)
$444
($269)
Fully taxable equivalent ("FTE") adjustment
$40
$68
$71
Net interest income adjusted for impact of FTE (Non-GAAP)
($423)
$512
($198)
Non-Strategic
Net interest income (GAAP)
$30,645
$30,603
$32,777
Fully taxable equivalent ("FTE") adjustment
$0
$0
$0
Net interest income adjusted for impact of FTE (Non-GAAP)
$30,645
$30,603
$32,777
Total Consolidated
Net interest income (GAAP)
$176,340
$172,860
$172,755
Fully taxable equivalent ("FTE") adjustment
$1,555
$1,497
$1,386
Net interest income adjusted for impact of FTE (Non-GAAP)
$177,895
$174,357
$174,141 |
Table of Contents
 Reconciliation
to GAAP Financials Slides in this presentation use non-GAAP information of tangible
assets, tangible common equity, tier 1 common capital,
and
various
ratios
using
one
or
more
of
those
measures.
That
information
is
not
presented
according
to
generally accepted accounting principles (GAAP), and is reconciled to GAAP information
below. 30
1
Includes goodwill and other intangible assets, net of
amortization.
2
Current quarter is an
estimate.
Numbers may not add to total due to rounding.
($ Millions)
3Q11
2Q11
1Q11
Tangible Common Equity (Non-GAAP)
Total equity (GAAP)
$2,743.2
$2,681.4
$2,640.1
Less:
Preferred
stock
capital
surplus
-
CPP
-
-
-
Less: Noncontrolling interest
295.2
295.2
295.2
Total common equity
2,448.1
2,386.2
2,344.9
Less:
Intangible
assets
(GAAP)
160.9
164.1
183.6
Tangible common equity (Non-GAAP)
2,287.2
2,222.2
2,161.3
Less: Unrealized gains on AFS securities, net of tax
79.4
58.1
39.3
Adjusted tangible common equity (Non-GAAP)
2,207.8
2,164.1
2,121.9
Tangible Assets (Non-GAAP)
Total assets (GAAP)
$25,571.5
$25,054.1
$24,438.3
Less:
Intangible
assets
(GAAP)
160.9
164.1
183.6
Tangible assets (Non-GAAP)
25,410.6
24,890.0
24,254.7
Tier 1 Common (Non-GAAP)
Tier 1 capital
$2,875.1
$2,818.5
$2,790.3
Less:
Preferred
stock
capital
surplus
-
CPP
-
-
-
Less:
Noncontrolling
interest
-
FTBNA Preferred Stock
294.8
294.8
294.8
Less: Trust preferred
200.0
200.0
200.0
Tier
1
common
(Non-GAAP)
2,380.3
2,323.7
2,295.5
Risk Weighted Assets
Risk weighted assets
$19,867.4
$19,589.3
$19,569.0
Ratios
Tangible common equity to tangible assets (TCE/TA) (Non-GAAP)
9.00%
8.93%
8.91%
Total equity to total assets (GAAP)
10.73%
10.70%
10.80%
Tier
1
common
ratio
(Non-GAAP)
11.98%
11.86%
11.73%
Tier
1
capital
to
total
assets
(GAAP)
11.24%
11.25%
11.42%
Tangible
common
equity
to
risk
weighted
assets
(TCE/RWA)
(Non-GAAP)
11.51%
11.34%
11.04%
Tangible
common
equity
plus
reserves
to
risk
weighted
assets
(TCE/RWA)
(Non-GAAP)
13.78%
14.02%
14.05%
Total equity plus reserves to total assets (GAAP)
12.49%
12.79%
13.21%
1
1
2
2
2
2
2
2
2 |
Table of Contents
 Reconciliation
to GAAP Financials Slides in this presentation use non-GAAP information of net
interest income, assets, net interest margin, net charge- offs,
fee
income,
revenue,
expense
and
various
ratios
using
one
or
more
of
those
measures.
That
information
is
not
presented according to generally accepted accounting principles (GAAP), and is reconciled to
GAAP information below. 31
Numbers may not add to total due to
rounding.
1
ROA and Net Charge-offs / Average loans are annualized.
Regional Banking
3Q11
2Q11
Total Revenue ($000)
$208,555
$203,945
FTEs
3,172
3,270
Revenue Per FTE ($000)
$66
$62
3Q11
Return
on Assets
Net Interest
Margin
Net Charge-Offs/
Average Loans
Fee Income /
Total Revenue
Efficiency
Ratio
Regional Bank (GAAP)
2.05%
5.17%
0.87%
32%
66%
Capital Markets (GAAP)
2.92%
1.17%
0.00%
95%
73%
Corporate (GAAP)
1.39%
-0.01%
0.00%
9%
777%
Core (Non-GAAP)
1.98%
3.52%
0.85%
49%
74%
Non-Strategic (GAAP)
-3.74%
2.30%
6.63%
33%
194%
Consolidated (GAAP)
0.62%
3.23%
2.65%
47%
89%
1
1 |