Attached files
| file | filename |
|---|---|
| 8-K - FORM 8-K - JPMORGAN CHASE & CO | y93007e8vk.htm |
| EX-12.2 - EX-12.2 - JPMORGAN CHASE & CO | y93007exv12w2.htm |
| EX-12.1 - EX-12.1 - JPMORGAN CHASE & CO | y93007exv12w1.htm |
| EX-99.1 - EX-99.1 - JPMORGAN CHASE & CO | y93007exv99w1.htm |
Exhibit 99.2

EARNINGS RELEASE FINANCIAL SUPPLEMENT
THIRD QUARTER 2011
THIRD QUARTER 2011
| JPMORGAN CHASE & CO. TABLE OF CONTENTS |
 |
| Page(s) | ||
Consolidated Results |
||
Consolidated Financial Highlights |
2-3 | |
Statements of Income |
4 | |
Consolidated Balance Sheets |
5 | |
Condensed Average Balance Sheets and Annualized Yields |
6 | |
Reconciliation from Reported to Managed Summary |
7 | |
Business Detail |
||
Line of Business Financial Highlights — Managed Basis |
8 | |
Investment Bank |
9-12 | |
Retail Financial Services |
13-19 | |
Card Services & Auto |
20-22 | |
Commercial Banking |
23-24 | |
Treasury & Securities Services |
25-26 | |
Asset Management |
27-31 | |
Corporate/Private Equity |
32-33 | |
Credit-Related Information |
34-39 | |
Market Risk-Related Information |
40 | |
Supplemental Detail |
||
Capital and Other Selected Balance Sheet Items |
41 | |
Mortgage Loan Repurchase Liability |
42 | |
Per Share-Related Information |
43 | |
Non-GAAP Financial Measures |
44 | |
Glossary of Terms |
45-48 | |
Memo: Business Segment Reorganization Summary |
49 |
Page 1
| JPMORGAN CHASE & CO. CONSOLIDATED FINANCIAL HIGHLIGHTS (in millions, except per share and ratio data) |
|
| QUARTERLY TRENDS | NINE MONTHS ENDED SEPTEMBER 30, | |||||||||||||||||||||||||||||||||||||||
| 3Q11 Change | 2011 Change | |||||||||||||||||||||||||||||||||||||||
| 3Q11 | 2Q11 | 1Q11 | 4Q10 | 3Q10 | 2Q11 | 3Q10 | 2011 | 2010 | 2010 | |||||||||||||||||||||||||||||||
SELECTED INCOME STATEMENT DATA |
||||||||||||||||||||||||||||||||||||||||
Reported Basis |
||||||||||||||||||||||||||||||||||||||||
Total net revenue |
$ | 23,763 | $ | 26,779 | $ | 25,221 | $ | 26,098 | $ | 23,824 | (11 | )% | — | % | $ | 75,763 | $ | 76,596 | (1) | % | ||||||||||||||||||||
Total noninterest expense |
15,534 | 16,842 | 15,995 | 16,043 | 14,398 | (8 | ) | 8 | 48,371 | 45,153 | 7 | |||||||||||||||||||||||||||||
Pre-provision profit |
8,229 | 9,937 | 9,226 | 10,055 | 9,426 | (17 | ) | (13 | ) | 27,392 | 31,443 | (13 | ) | |||||||||||||||||||||||||||
Provision for credit losses |
2,411 | 1,810 | 1,169 | 3,043 | 3,223 | 33 | (25 | ) | 5,390 | 13,596 | (60 | ) | ||||||||||||||||||||||||||||
NET INCOME |
4,262 | 5,431 | 5,555 | 4,831 | 4,418 | (22 | ) | (4 | ) | 15,248 | 12,539 | 22 | ||||||||||||||||||||||||||||
Managed Basis (a) |
||||||||||||||||||||||||||||||||||||||||
Total net revenue |
24,368 | 27,410 | 25,791 | 26,722 | 24,335 | (11 | ) | — | 77,569 | 78,120 | (1 | ) | ||||||||||||||||||||||||||||
Total noninterest expense |
15,534 | 16,842 | 15,995 | 16,043 | 14,398 | (8 | ) | 8 | 48,371 | 45,153 | 7 | |||||||||||||||||||||||||||||
Pre-provision profit |
8,834 | 10,568 | 9,796 | 10,679 | 9,937 | (16 | ) | (11 | ) | 29,198 | 32,967 | (11 | ) | |||||||||||||||||||||||||||
Provision for credit losses |
2,411 | 1,810 | 1,169 | 3,043 | 3,223 | 33 | (25 | ) | 5,390 | 13,596 | (60 | ) | ||||||||||||||||||||||||||||
NET INCOME |
4,262 | 5,431 | 5,555 | 4,831 | 4,418 | (22 | ) | (4 | ) | 15,248 | 12,539 | 22 | ||||||||||||||||||||||||||||
PER COMMON SHARE DATA |
||||||||||||||||||||||||||||||||||||||||
Basic earnings |
1.02 | 1.28 | 1.29 | 1.13 | 1.02 | (20 | ) | — | 3.60 | 2.86 | 26 | |||||||||||||||||||||||||||||
Diluted earnings |
1.02 | 1.27 | 1.28 | 1.12 | 1.01 | (20 | ) | 1 | 3.57 | 2.84 | 26 | |||||||||||||||||||||||||||||
Cash dividends declared (b) |
0.25 | 0.25 | 0.25 | 0.05 | 0.05 | — | 400 | 0.75 | 0.15 | 400 | ||||||||||||||||||||||||||||||
Book value |
45.93 | 44.77 | 43.34 | 43.04 | 42.29 | 3 | 9 | 45.93 | 42.29 | 9 | ||||||||||||||||||||||||||||||
Closing share price (c) |
30.12 | 40.94 | 46.10 | 42.42 | 38.06 | (26 | ) | (21 | ) | 30.12 | 38.06 | (21 | ) | |||||||||||||||||||||||||||
Market capitalization |
114,422 | 160,083 | 183,783 | 165,875 | 149,418 | (29 | ) | (23 | ) | 114,422 | 149,418 | (23 | ) | |||||||||||||||||||||||||||
COMMON SHARES OUTSTANDING |
||||||||||||||||||||||||||||||||||||||||
Average: Basic |
3,859.6 | 3,958.4 | 3,981.6 | 3,917.0 | 3,954.3 | (2 | ) | (2 | ) | 3,933.2 | 3,969.4 | (1 | ) | |||||||||||||||||||||||||||
Diluted |
3,872.2 | 3,983.2 | 4,014.1 | 3,935.2 | 3,971.9 | (3 | ) | (3 | ) | 3,956.5 | 3,990.7 | (1 | ) | |||||||||||||||||||||||||||
Common shares at period-end |
3,798.9 | 3,910.2 | 3,986.6 | 3,910.3 | 3,925.8 | (3 | ) | (3 | ) | 3,798.9 | 3,925.8 | (3 | ) | |||||||||||||||||||||||||||
FINANCIAL RATIOS (d) |
||||||||||||||||||||||||||||||||||||||||
Return on common equity (“ROE”) |
9 | % | 12 | % | 13 | % | 11 | % | 10 | % | 11 | % | 10 | % | ||||||||||||||||||||||||||
Return on tangible common equity (“ROTCE”) (e) |
13 | 17 | 18 | 16 | 15 | 16 | 15 | |||||||||||||||||||||||||||||||||
Return on assets (“ROA”) |
0.76 | 0.99 | 1.07 | 0.92 | 0.86 | 0.94 | 0.82 | |||||||||||||||||||||||||||||||||
CAPITAL RATIOS |
||||||||||||||||||||||||||||||||||||||||
Tier 1 capital ratio |
12.1 | (g) | 12.4 | 12.3 | 12.1 | 11.9 | ||||||||||||||||||||||||||||||||||
Total capital ratio |
15.3 | (g) | 15.7 | 15.6 | 15.5 | 15.4 | ||||||||||||||||||||||||||||||||||
Tier 1 common capital ratio (f) |
9.9 | (g) | 10.1 | 10.0 | 9.8 | 9.5 | ||||||||||||||||||||||||||||||||||
| (a) | For further discussion of managed basis, see Reconciliation from Reported to Managed Summary on page 7. | |
| (b) | On March 18, 2011, the Board of Directors increased the Firm’s quarterly common stock dividend from $0.05 to $0.25 per share. | |
| (c) | Share prices shown for JPMorgan Chase’s common stock are from the New York Stock Exchange. JPMorgan Chase’s common stock is also listed and traded on the London Stock Exchange and the Tokyo Stock Exchange. | |
| (d) | Ratios are based upon annualized amounts. | |
| (e) | ROTCE, a non-GAAP financial ratio, measures the Firm’s earnings as a percentage of tangible common equity. In management’s view, this measure is meaningful to the Firm, as well as analysts and investors in assessing the Firm’s use of equity and in facilitating comparisons with competitors. For further discussion, see page 44. | |
| (f) | Tier 1 common capital ratio is Tier 1 common capital divided by risk-weighted assets. The Firm uses Tier 1 common capital along with the other capital measures to assess and monitor its capital position. For further discussion of Tier 1 common capital ratio, see page 44. | |
| (g) | Estimated. |
Page 2
| JPMORGAN CHASE & CO. CONSOLIDATED FINANCIAL HIGHLIGHTS, CONTINUED (in millions, except ratio and headcount data) |
|
| QUARTERLY TRENDS | NINE MONTHS ENDED SEPTEMBER 30, | ||||||||||||||||||||||||||||||||||||||||
| 3Q11 Change | 2011 Change | ||||||||||||||||||||||||||||||||||||||||
| 3Q11 | 2Q11 | 1Q11 | 4Q10 | 3Q10 | 2Q11 | 3Q10 | 2011 | 2010 | 2010 | ||||||||||||||||||||||||||||||||
SELECTED BALANCE SHEET DATA (Period-end) |
|||||||||||||||||||||||||||||||||||||||||
Total assets |
$ | 2,289,240 | $ | 2,246,764 | $ | 2,198,161 | $ | 2,117,605 | $ | 2,141,595 | 2 | % | 7 | % | $ | 2,289,240 | $ | 2,141,595 | 7 | % | |||||||||||||||||||||
Wholesale loans |
259,483 | 248,823 | 236,007 | 227,633 | 220,597 | 4 | 18 | 259,483 | 220,597 | 18 | |||||||||||||||||||||||||||||||
Consumer, excluding credit card loans |
310,235 | 315,390 | 321,186 | 327,618 | 333,498 | (2 | ) | (7 | ) | 310,235 | 333,498 | (7 | ) | ||||||||||||||||||||||||||||
Credit card loans |
127,135 | 125,523 | 128,803 | 137,676 | 136,436 | 1 | (7 | ) | 127,135 | 136,436 | (7 | ) | |||||||||||||||||||||||||||||
Deposits |
1,092,708 | 1,048,685 | 995,829 | 930,369 | 903,138 | 4 | 21 | 1,092,708 | 903,138 | 21 | |||||||||||||||||||||||||||||||
Common stockholders’ equity |
174,487 | 175,079 | 172,798 | 168,306 | 166,030 | — | 5 | 174,487 | 166,030 | 5 | |||||||||||||||||||||||||||||||
Total stockholders’ equity |
182,287 | 182,879 | 180,598 | 176,106 | 173,830 | — | 5 | 182,287 | 173,830 | 5 | |||||||||||||||||||||||||||||||
Deposits-to-loans ratio |
157 | % | 152 | % | 145 | % | 134 | % | 131 | % | 157 | % | 131 | % | |||||||||||||||||||||||||||
Headcount |
256,663 | 250,095 | 242,929 | 239,831 | 236,810 | 3 | 8 | 256,663 | 236,810 | 8 | |||||||||||||||||||||||||||||||
LINE OF BUSINESS NET INCOME/(LOSS) |
|||||||||||||||||||||||||||||||||||||||||
Investment Bank |
$ | 1,636 | $ | 2,057 | $ | 2,370 | $ | 1,501 | $ | 1,286 | (20 | ) | 27 | $ | 6,063 | $ | 5,138 | 18 | |||||||||||||||||||||||
Retail Financial Services |
1,161 | 383 | (399 | ) | 459 | 716 | 203 | 62 | 1,145 | 1,269 | (10 | ) | |||||||||||||||||||||||||||||
Card Services & Auto |
849 | 1,110 | 1,534 | 1,548 | 926 | (24 | ) | (8 | ) | 3,493 | 1,324 | 164 | |||||||||||||||||||||||||||||
Commercial Banking |
571 | 607 | 546 | 530 | 471 | (6 | ) | 21 | 1,724 | 1,554 | 11 | ||||||||||||||||||||||||||||||
Treasury & Securities Services |
305 | 333 | 316 | 257 | 251 | (8 | ) | 22 | 954 | 822 | 16 | ||||||||||||||||||||||||||||||
Asset Management |
385 | 439 | 466 | 507 | 420 | (12 | ) | (8 | ) | 1,290 | 1,203 | 7 | |||||||||||||||||||||||||||||
Corporate/Private Equity |
(645 | ) | 502 | 722 | 29 | 348 | NM | NM | 579 | 1,229 | (53 | ) | |||||||||||||||||||||||||||||
NET INCOME |
$ | 4,262 | $ | 5,431 | $ | 5,555 | $ | 4,831 | $ | 4,418 | (22 | ) | (4 | ) | $ | 15,248 | $ | 12,539 | 22 | ||||||||||||||||||||||
Page 3
| JPMORGAN CHASE & CO. STATEMENTS OF INCOME (in millions, except per share and ratio data) |
|
| QUARTERLY TRENDS | NINE MONTHS ENDED SEPTEMBER 30, | |||||||||||||||||||||||||||||||||||||||
| 3Q11 Change | 2011 Change | |||||||||||||||||||||||||||||||||||||||
| 3Q11 | 2Q11 | 1Q11 | 4Q10 | 3Q10 | 2Q11 | 3Q10 | 2011 | 2010 | 2010 | |||||||||||||||||||||||||||||||
REVENUE |
||||||||||||||||||||||||||||||||||||||||
Investment banking fees |
$ | 1,052 | $ | 1,933 | $ | 1,793 | $ | 1,832 | $ | 1,476 | (46) | % | (29 | )% | $ | 4,778 | $ | 4,358 | 10 | % | ||||||||||||||||||||
Principal transactions |
1,370 | 3,140 | 4,745 | 1,915 | 2,341 | (56 | ) | (41 | ) | 9,255 | 8,979 | 3 | ||||||||||||||||||||||||||||
Lending- and deposit-related fees |
1,643 | 1,649 | 1,546 | 1,545 | 1,563 | — | 5 | 4,838 | 4,795 | 1 | ||||||||||||||||||||||||||||||
Asset management, administration and commissions |
3,448 | 3,703 | 3,606 | 3,697 | 3,188 | (7 | ) | 8 | 10,757 | 9,802 | 10 | |||||||||||||||||||||||||||||
Securities gains |
607 | 837 | 102 | 1,253 | 102 | (27 | ) | 495 | 1,546 | 1,712 | (10 | ) | ||||||||||||||||||||||||||||
Mortgage fees and related income |
1,380 | 1,103 | (487 | ) | 1,617 | 707 | 25 | 95 | 1,996 | 2,253 | (11 | ) | ||||||||||||||||||||||||||||
Credit card income |
1,666 | 1,696 | 1,437 | 1,558 | 1,477 | (2 | ) | 13 | 4,799 | 4,333 | 11 | |||||||||||||||||||||||||||||
Other income |
780 | 882 | 574 | 579 | 468 | (12 | ) | 67 | 2,236 | 1,465 | 53 | |||||||||||||||||||||||||||||
Noninterest revenue |
11,946 | 14,943 | 13,316 | 13,996 | 11,322 | (20 | ) | 6 | 40,205 | 37,697 | 7 | |||||||||||||||||||||||||||||
Interest income |
15,160 | 15,632 | 15,447 | 15,612 | 15,606 | (3 | ) | (3 | ) | 46,239 | 48,170 | (4 | ) | |||||||||||||||||||||||||||
Interest expense |
3,343 | 3,796 | 3,542 | 3,510 | 3,104 | (12 | ) | 8 | 10,681 | 9,271 | 15 | |||||||||||||||||||||||||||||
Net interest income |
11,817 | 11,836 | 11,905 | 12,102 | 12,502 | — | (5 | ) | 35,558 | 38,899 | (9 | ) | ||||||||||||||||||||||||||||
TOTAL NET REVENUE |
23,763 | 26,779 | 25,221 | 26,098 | 23,824 | (11 | ) | — | 75,763 | 76,596 | (1 | ) | ||||||||||||||||||||||||||||
Provision for credit losses |
2,411 | 1,810 | 1,169 | 3,043 | 3,223 | 33 | (25 | ) | 5,390 | 13,596 | (60 | ) | ||||||||||||||||||||||||||||
NONINTEREST EXPENSE |
||||||||||||||||||||||||||||||||||||||||
Compensation expense |
6,908 | 7,569 | 8,263 | 6,571 | 6,661 | (9 | ) | 4 | 22,740 | 21,553 | 6 | |||||||||||||||||||||||||||||
Occupancy expense |
935 | 935 | 978 | 1,045 | 884 | — | 6 | 2,848 | 2,636 | 8 | ||||||||||||||||||||||||||||||
Technology, communications and equipment expense |
1,248 | 1,217 | 1,200 | 1,198 | 1,184 | 3 | 5 | 3,665 | 3,486 | 5 | ||||||||||||||||||||||||||||||
Professional and outside services |
1,860 | 1,866 | 1,735 | 1,789 | 1,718 | — | 8 | 5,461 | 4,978 | 10 | ||||||||||||||||||||||||||||||
Marketing |
926 | 744 | 659 | 584 | 651 | 24 | 42 | 2,329 | 1,862 | 25 | ||||||||||||||||||||||||||||||
Other expense |
3,445 | 4,299 | 2,943 | 4,616 | 3,082 | (20 | ) | 12 | 10,687 | 9,942 | 7 | |||||||||||||||||||||||||||||
Amortization of intangibles |
212 | 212 | 217 | 240 | 218 | — | (3 | ) | 641 | 696 | (8 | ) | ||||||||||||||||||||||||||||
TOTAL NONINTEREST EXPENSE |
15,534 | 16,842 | 15,995 | 16,043 | 14,398 | (8 | ) | 8 | 48,371 | 45,153 | 7 | |||||||||||||||||||||||||||||
Income before income tax expense |
5,818 | 8,127 | 8,057 | 7,012 | 6,203 | (28 | ) | (6 | ) | 22,002 | 17,847 | 23 | ||||||||||||||||||||||||||||
Income tax expense |
1,556 | 2,696 | 2,502 | 2,181 | 1,785 | (42 | ) | (13 | ) | 6,754 | 5,308 | 27 | ||||||||||||||||||||||||||||
NET INCOME |
$ | 4,262 | $ | 5,431 | $ | 5,555 | $ | 4,831 | $ | 4,418 | (22 | ) | (4 | ) | $ | 15,248 | $ | 12,539 | 22 | |||||||||||||||||||||
PER COMMON SHARE DATA |
||||||||||||||||||||||||||||||||||||||||
Basic earnings |
$ | 1.02 | $ | 1.28 | $ | 1.29 | $ | 1.13 | $ | 1.02 | (20 | ) | — | $ | 3.60 | $ | 2.86 | 26 | ||||||||||||||||||||||
Diluted earnings |
1.02 | 1.27 | 1.28 | 1.12 | 1.01 | (20 | ) | 1 | 3.57 | 2.84 | 26 | |||||||||||||||||||||||||||||
FINANCIAL RATIOS |
||||||||||||||||||||||||||||||||||||||||
Return on equity (a) |
9 | % | 12 | % | 13 | % | 11 | % | 10 | % | 11 | % | 10 | % | ||||||||||||||||||||||||||
Return on tangible common equity (a)(b) |
13 | 17 | 18 | 16 | 15 | 16 | 15 | |||||||||||||||||||||||||||||||||
Return on assets (a) |
0.76 | 0.99 | 1.07 | 0.92 | 0.86 | 0.94 | 0.82 | |||||||||||||||||||||||||||||||||
Effective income tax rate |
27 | (c) | 33 | 31 | 31 | 29 | 31 | 30 | ||||||||||||||||||||||||||||||||
Overhead ratio |
65 | 63 | 63 | 61 | 60 | 64 | 59 | |||||||||||||||||||||||||||||||||
| (a) | Ratios are based upon annualized amounts. | |
| (b) | ROTCE, a non-GAAP financial ratio, measures the Firm’s earnings as a percentage of tangible common equity. In management’s view, this measure is meaningful to the Firm, as well as analysts and investors in assessing the Firm’s use of equity and in facilitating comparisons with competitors. For further discussion, see page 44. | |
| (c) | The decrease in the effective tax rate in the third quarter of 2011 was primarily the result of lower reported pretax book income, as well as changes in the proportion of income subject to U.S. federal and state and local taxes. |
Page 4
| JPMORGAN CHASE & CO. | |
|
| CONSOLIDATED BALANCE SHEETS | ||
| (in millions) |
| September 30, 2011 | ||||||||||||||||||||||||||||
| Change | ||||||||||||||||||||||||||||
| Sep 30 | Jun 30 | Mar 31 | Dec 31 | Sep 30 | Jun 30 | Sep 30 | ||||||||||||||||||||||
| 2011 | 2011 | 2011 | 2010 | 2010 | 2011 | 2010 | ||||||||||||||||||||||
ASSETS |
||||||||||||||||||||||||||||
Cash and due from banks |
$ | 56,766 | $ | 30,466 | $ | 23,469 | $ | 27,567 | $ | 23,960 | 86 | % | 137 | % | ||||||||||||||
Deposits with banks |
128,877 | 169,880 | 80,842 | 21,673 | 31,077 | (24 | ) | 315 | ||||||||||||||||||||
Federal funds sold and securities purchased under
resale agreements |
248,042 | 213,362 | 217,356 | 222,554 | 235,390 | 16 | 5 | |||||||||||||||||||||
Securities borrowed |
131,561 | 121,493 | 119,000 | 123,587 | 127,365 | 8 | 3 | |||||||||||||||||||||
Trading assets: |
||||||||||||||||||||||||||||
Debt and equity instruments |
352,678 | 381,339 | 422,404 | 409,411 | 378,222 | (8 | ) | (7 | ) | |||||||||||||||||||
Derivative receivables |
108,853 | 77,383 | 78,744 | 80,481 | 97,293 | 41 | 12 | |||||||||||||||||||||
Securities |
339,349 | 324,741 | 334,800 | 316,336 | 340,168 | 4 | — | |||||||||||||||||||||
Loans |
696,853 | 689,736 | 685,996 | 692,927 | 690,531 | 1 | 1 | |||||||||||||||||||||
Less: Allowance for loan losses |
28,350 | 28,520 | 29,750 | 32,266 | 34,161 | (1 | ) | (17 | ) | |||||||||||||||||||
Loans, net of allowance for loan losses |
668,503 | 661,216 | 656,246 | 660,661 | 656,370 | 1 | 2 | |||||||||||||||||||||
Accrued interest and accounts receivable |
72,080 | 80,292 | 79,236 | 70,147 | 63,224 | (10 | ) | 14 | ||||||||||||||||||||
Premises and equipment |
13,812 | 13,679 | 13,422 | 13,355 | 11,316 | 1 | 22 | |||||||||||||||||||||
Goodwill |
48,180 | 48,882 | 48,856 | 48,854 | 48,736 | (1 | ) | (1 | ) | |||||||||||||||||||
Mortgage servicing rights |
7,833 | 12,243 | 13,093 | 13,649 | 10,305 | (36 | ) | (24 | ) | |||||||||||||||||||
Other intangible assets |
3,396 | 3,679 | 3,857 | 4,039 | 3,982 | (8 | ) | (15 | ) | |||||||||||||||||||
Other assets |
109,310 | 108,109 | 106,836 | 105,291 | 114,187 | 1 | (4 | ) | ||||||||||||||||||||
TOTAL ASSETS |
$ | 2,289,240 | $ | 2,246,764 | $ | 2,198,161 | $ | 2,117,605 | $ | 2,141,595 | 2 | 7 | ||||||||||||||||
LIABILITIES |
||||||||||||||||||||||||||||
Deposits |
$ | 1,092,708 | $ | 1,048,685 | $ | 995,829 | $ | 930,369 | $ | 903,138 | 4 | 21 | ||||||||||||||||
Federal funds purchased and securities loaned or sold
under repurchase agreements |
238,585 | 254,124 | 285,444 | 276,644 | 314,161 | (6 | ) | (24 | ) | |||||||||||||||||||
Commercial paper |
51,073 | 51,160 | 46,022 | 35,363 | 38,611 | — | 32 | |||||||||||||||||||||
Other borrowed funds (a) |
29,318 | 30,208 | 36,704 | 34,325 | 35,736 | (3 | ) | (18 | ) | |||||||||||||||||||
Trading liabilities: |
||||||||||||||||||||||||||||
Debt and equity instruments |
76,592 | 84,865 | 80,031 | 76,947 | 82,919 | (10 | ) | (8 | ) | |||||||||||||||||||
Derivative payables |
79,249 | 63,668 | 61,362 | 69,219 | 74,902 | 24 | 6 | |||||||||||||||||||||
Accounts payable and other liabilities |
199,769 | 184,490 | 171,638 | 170,330 | 169,365 | 8 | 18 | |||||||||||||||||||||
Beneficial interests issued by consolidated VIEs |
65,971 | 67,457 | 70,917 | 77,649 | 77,438 | (2 | ) | (15 | ) | |||||||||||||||||||
Long-term debt (a) |
273,688 | 279,228 | 269,616 | 270,653 | 271,495 | (2 | ) | 1 | ||||||||||||||||||||
TOTAL LIABILITIES |
2,106,953 | 2,063,885 | 2,017,563 | 1,941,499 | 1,967,765 | 2 | 7 | |||||||||||||||||||||
STOCKHOLDERS’ EQUITY |
||||||||||||||||||||||||||||
Preferred stock |
7,800 | 7,800 | 7,800 | 7,800 | 7,800 | — | — | |||||||||||||||||||||
Common stock |
4,105 | 4,105 | 4,105 | 4,105 | 4,105 | — | — | |||||||||||||||||||||
Capital surplus |
95,078 | 95,061 | 94,660 | 97,415 | 96,938 | — | (2 | ) | ||||||||||||||||||||
Retained earnings |
85,726 | 82,612 | 78,342 | 73,998 | 69,531 | 4 | 23 | |||||||||||||||||||||
Accumulated other comprehensive income |
1,964 | 1,638 | 712 | 1,001 | 3,096 | 20 | (37 | ) | ||||||||||||||||||||
Shares held in RSU Trust, at cost |
(53 | ) | (53 | ) | (53 | ) | (53 | ) | (68 | ) | — | 22 | ||||||||||||||||
Treasury stock, at cost |
(12,333 | ) | (8,284 | ) | (4,968 | ) | (8,160 | ) | (7,572 | ) | (49 | ) | (63 | ) | ||||||||||||||
TOTAL STOCKHOLDERS’ EQUITY |
182,287 | 182,879 | 180,598 | 176,106 | 173,830 | — | 5 | |||||||||||||||||||||
TOTAL LIABILITIES AND STOCKHOLDERS’ EQUITY |
$ | 2,289,240 | $ | 2,246,764 | $ | 2,198,161 | $ | 2,117,605 | $ | 2,141,595 | 2 | 7 | ||||||||||||||||
| (a) | Effective January 1, 2011, the long-term portion of advances from Federal Home Loan Banks (“FHLBs”) was reclassified from other borrowed funds to long-term debt. Prior periods have been revised to conform with the current presentation. |
Page 5
| JPMORGAN CHASE & CO. | |
|
| CONDENSED AVERAGE BALANCE SHEETS AND ANNUALIZED YIELDS | ||
| (in millions, except rates) |
| QUARTERLY TRENDS | NINE MONTHS ENDED SEPTEMBER 30, | ||||||||||||||||||||||||||||||||||||||||
| 3Q11 Change | 2011 Change | ||||||||||||||||||||||||||||||||||||||||
| AVERAGE BALANCES | 3Q11 | 2Q11 | 1Q11 | 4Q10 | 3Q10 | 2Q11 | 3Q10 | 2011 | 2010 | 2010 | |||||||||||||||||||||||||||||||
ASSETS |
|||||||||||||||||||||||||||||||||||||||||
Deposits with banks |
$ | 116,062 | $ | 75,801 | $ | 37,155 | $ | 29,213 | $ | 38,747 | 53 | % | 200 | % | $ | 76,628 | $ | 53,811 | 42 | % | |||||||||||||||||||||
Federal funds sold and securities purchased under
resale agreements |
211,884 | 202,036 | 202,481 | 201,489 | 192,099 | 5 | 10 | 205,501 | 183,983 | 12 | |||||||||||||||||||||||||||||||
Securities borrowed |
131,615 | 124,806 | 114,589 | 119,973 | 121,302 | 5 | 9 | 123,732 | 116,554 | 6 | |||||||||||||||||||||||||||||||
Trading assets — debt instruments |
257,950 | 285,104 | 275,512 | 273,929 | 251,790 | (10 | ) | 2 | 272,791 | 248,484 | 10 | ||||||||||||||||||||||||||||||
Securities |
331,330 | 342,248 | 318,936 | 328,126 | 327,798 | (3 | ) | 1 | 330,884 | 330,853 | — | ||||||||||||||||||||||||||||||
Loans |
692,794 | 686,111 | 688,133 | 690,529 | 693,791 | 1 | — | 689,030 | 707,924 | (3 | ) | ||||||||||||||||||||||||||||||
Other assets (a) |
42,760 | 48,716 | 49,887 | 42,583 | 36,912 | (12 | ) | 16 | 47,095 | 33,108 | 42 | ||||||||||||||||||||||||||||||
Total interest-earning assets |
1,784,395 | 1,764,822 | 1,686,693 | 1,685,842 | 1,662,439 | 1 | 7 | 1,745,661 | 1,674,717 | 4 | |||||||||||||||||||||||||||||||
Trading assets — equity instruments |
119,890 | 137,611 | 141,951 | 122,827 | 96,200 | (13 | ) | 25 | 133,070 | 91,697 | 45 | ||||||||||||||||||||||||||||||
Trading assets — derivative receivables |
96,612 | 82,860 | 85,437 | 87,569 | 92,857 | 17 | 4 | 88,344 | 83,702 | 6 | |||||||||||||||||||||||||||||||
All other noninterest-earning assets |
229,650 | 207,250 | 190,371 | 192,906 | 189,617 | 11 | 21 | 209,234 | 191,040 | 10 | |||||||||||||||||||||||||||||||
TOTAL ASSETS |
$ | 2,230,547 | $ | 2,192,543 | $ | 2,104,452 | $ | 2,089,144 | $ | 2,041,113 | 2 | 9 | $ | 2,176,309 | $ | 2,041,156 | 7 | ||||||||||||||||||||||||
LIABILITIES |
|||||||||||||||||||||||||||||||||||||||||
Interest-bearing deposits |
$ | 740,901 | $ | 732,766 | $ | 700,921 | $ | 669,346 | $ | 659,027 | 1 | 12 | $ | 725,009 | $ | 668,403 | 8 | ||||||||||||||||||||||||
Federal funds purchased and securities loaned or
sold under repurchase agreements |
235,438 | 281,843 | 278,250 | 287,493 | 281,171 | (16 | ) | (16 | ) | 265,020 | 275,607 | (4 | ) | ||||||||||||||||||||||||||||
Commercial paper |
47,027 | 41,682 | 36,838 | 34,507 | 34,523 | 13 | 36 | 41,886 | 36,503 | 15 | |||||||||||||||||||||||||||||||
Trading liabilities — debt, short-term and other liabilities (b)(c) |
215,064 | 212,878 | 193,814 | 196,840 | 188,010 | 1 | 14 | 207,330 | 182,424 | 14 | |||||||||||||||||||||||||||||||
Beneficial interests issued by consolidated VIEs |
66,545 | 69,399 | 72,932 | 78,114 | 83,928 | (4 | ) | (21 | ) | 69,602 | 90,654 | (23 | ) | ||||||||||||||||||||||||||||
Long-term debt (c) |
279,235 | 273,934 | 269,156 | 273,066 | 267,556 | 2 | 4 | 274,145 | 273,077 | — | |||||||||||||||||||||||||||||||
Total interest-bearing liabilities |
1,584,210 | 1,612,502 | 1,551,911 | 1,539,366 | 1,514,215 | (2 | ) | 5 | 1,582,992 | 1,526,668 | 4 | ||||||||||||||||||||||||||||||
Noninterest-bearing deposits |
297,610 | 247,137 | 229,461 | 225,966 | 213,700 | 20 | 39 | 258,319 | 207,846 | 24 | |||||||||||||||||||||||||||||||
Trading liabilities — equity instruments |
1,948 | 3,289 | 7,872 | 7,166 | 6,560 | (41 | ) | (70 | ) | 4,348 | 5,838 | (26 | ) | ||||||||||||||||||||||||||||
Trading liabilities — derivative payables |
75,828 | 66,009 | 71,288 | 71,727 | 69,350 | 15 | 9 | 71,058 | 63,688 | 12 | |||||||||||||||||||||||||||||||
All other noninterest-bearing liabilities |
88,697 | 81,729 | 66,705 | 70,307 | 65,335 | 9 | 36 | 79,125 | 69,281 | 14 | |||||||||||||||||||||||||||||||
TOTAL LIABILITIES |
2,048,293 | 2,010,666 | 1,927,237 | 1,914,532 | 1,869,160 | 2 | 10 | 1,995,842 | 1,873,321 | 7 | |||||||||||||||||||||||||||||||
Preferred stock |
7,800 | 7,800 | 7,800 | 7,800 | 7,991 | — | (2 | ) | 7,800 | 8,098 | (4 | ) | |||||||||||||||||||||||||||||
Common stockholders’ equity |
174,454 | 174,077 | 169,415 | 166,812 | 163,962 | — | 6 | 172,667 | 159,737 | 8 | |||||||||||||||||||||||||||||||
TOTAL STOCKHOLDERS’ EQUITY |
182,254 | 181,877 | 177,215 | 174,612 | 171,953 | — | 6 | 180,467 | 167,835 | 8 | |||||||||||||||||||||||||||||||
TOTAL LIABILITIES AND |
|||||||||||||||||||||||||||||||||||||||||
STOCKHOLDERS’ EQUITY |
$ | 2,230,547 | $ | 2,192,543 | $ | 2,104,452 | $ | 2,089,144 | $ | 2,041,113 | 2 | 9 | $ | 2,176,309 | $ | 2,041,156 | 7 | ||||||||||||||||||||||||
AVERAGE
RATES |
|||||||||||||||||||||||||||||||||||||||||
INTEREST-EARNING ASSETS |
|||||||||||||||||||||||||||||||||||||||||
Deposits with banks |
0.63 | % | 0.76 | % | 1.11 | % | 1.02 | % | 0.85 | % | 0.75 | % | 0.67 | % | |||||||||||||||||||||||||||
Federal funds sold and securities purchased under
resale agreements |
1.28 | 1.20 | 1.09 | 1.05 | 0.92 | 1.19 | 0.91 | ||||||||||||||||||||||||||||||||||
Securities borrowed |
0.05 | 0.10 | 0.17 | 0.16 | 0.22 | 0.10 | 0.15 | ||||||||||||||||||||||||||||||||||
Trading assets — debt instruments |
4.32 | 4.23 | 4.31 | 4.29 | 4.37 | 4.28 | 4.39 | ||||||||||||||||||||||||||||||||||
Securities |
2.66 | 3.10 | 2.89 | 2.44 | 2.67 | 2.88 | 3.12 | ||||||||||||||||||||||||||||||||||
Loans |
5.28 | 5.36 | 5.62 | 5.71 | 5.71 | 5.42 | 5.77 | ||||||||||||||||||||||||||||||||||
Other assets (a) |
1.47 | 1.30 | 1.20 | 1.54 | 1.57 | 1.32 | 1.52 | ||||||||||||||||||||||||||||||||||
Total interest-earning assets |
3.40 | 3.58 | 3.74 | 3.70 | 3.75 | 3.57 | 3.87 | ||||||||||||||||||||||||||||||||||
INTEREST
— BEARING LIABILITIES |
|||||||||||||||||||||||||||||||||||||||||
Interest-bearing deposits |
0.53 | 0.61 | 0.53 | 0.50 | 0.51 | 0.56 | 0.51 | ||||||||||||||||||||||||||||||||||
Federal funds purchased and securities loaned or
sold under repurchase agreements |
0.18 | 0.29 | 0.17 | 0.12 | (0.28 | ) (d) | 0.22 | (0.14 | )(d) | ||||||||||||||||||||||||||||||||
Commercial paper |
0.16 | 0.19 | 0.21 | 0.21 | 0.20 | 0.19 | 0.19 | ||||||||||||||||||||||||||||||||||
Trading liabilities — debt, short-term and other liabilities (b)(c) |
1.05 | 1.26 | 1.43 | 1.57 | 1.27 | 1.24 | 1.25 | ||||||||||||||||||||||||||||||||||
Beneficial interests issued by consolidated VIEs |
1.05 | 1.17 | 1.19 | 1.13 | 1.36 | 1.14 | 1.36 | ||||||||||||||||||||||||||||||||||
Long-term debt (c) |
2.10 | 2.31 | 2.39 | 2.25 | 2.30 | 2.27 | 2.10 | ||||||||||||||||||||||||||||||||||
Total interest-bearing liabilities |
0.84 | 0.94 | 0.93 | 0.90 | 0.81 | 0.90 | 0.81 | ||||||||||||||||||||||||||||||||||
INTEREST RATE SPREAD |
2.56 | % | 2.64 | % | 2.81 | % | 2.80 | % | 2.94 | % | 2.67 | % | 3.06 | % | |||||||||||||||||||||||||||
NET YIELD
ON INTEREST — EARNING ASSETS |
2.66 | % | 2.72 | % | 2.89 | % | 2.88 | % | 3.01 | % | 2.75 | % | 3.13 | % | |||||||||||||||||||||||||||
| (a) | Includes margin loans. | |
| (b) | Includes brokerage customer payables. | |
| (c) | Effective January 1, 2011, the long-term portion of the advances from FHLBs was reclassified from other borrowed funds, which is included in short-term and other liabilities, to long-term debt. Prior periods have been revised to conform with the current presentation. | |
| (d) | Reflects a benefit from the favorable market environments for dollar-roll financings. |
Page 6
| JPMORGAN CHASE & CO. | |
|
| RECONCILIATION FROM REPORTED TO MANAGED SUMMARY | ||
| (in millions) |
The Firm prepares its consolidated financial statements using accounting principles generally
accepted in the U.S. (“U.S. GAAP”). That presentation, which is referred to as “reported” basis,
provides the reader with an understanding of the Firm’s results that can be tracked consistently
from year to year and enables a comparison of the Firm’s performance with other companies’ U.S.
GAAP financial statements. In addition to analyzing the Firm’s results on a reported basis,
management reviews the Firm’s results and the results of the lines of business on a “managed”
basis, which is a non-GAAP financial measure. For additional information on managed basis, refer to
the notes on Non-GAAP Financial Measures on page 44.
The following summary table provides a reconciliation from the Firm’s reported U.S.
GAAP results to managed basis.
| QUARTERLY TRENDS | NINE MONTHS ENDED SEPTEMBER 30, | |||||||||||||||||||||||||||||||||||||||
| 3Q11 Change | 2011 Change | |||||||||||||||||||||||||||||||||||||||
| 3Q11 | 2Q11 | 1Q11 | 4Q10 | 3Q10 | 2Q11 | 3Q10 | 2011 | 2010 | 2010 | |||||||||||||||||||||||||||||||
OTHER INCOME |
||||||||||||||||||||||||||||||||||||||||
Other income — reported |
$ | 780 | $ | 882 | $ | 574 | $ | 579 | $ | 468 | (12 | )% | 67 | % | $ | 2,236 | $ | 1,465 | 53 | % | ||||||||||||||||||||
Fully tax-equivalent adjustments |
472 | 510 | 451 | 503 | 415 | (7 | ) | 14 | 1,433 | 1,242 | 15 | |||||||||||||||||||||||||||||
Other income — managed |
$ | 1,252 | $ | 1,392 | $ | 1,025 | $ | 1,082 | $ | 883 | (10 | ) | 42 | $ | 3,669 | $ | 2,707 | 36 | ||||||||||||||||||||||
TOTAL NONINTEREST REVENUE |
||||||||||||||||||||||||||||||||||||||||
Total noninterest revenue — reported |
$ | 11,946 | $ | 14,943 | $ | 13,316 | $ | 13,996 | $ | 11,322 | (20 | ) | 6 | $ | 40,205 | $ | 37,697 | 7 | ||||||||||||||||||||||
Fully tax-equivalent adjustments |
472 | 510 | 451 | 503 | 415 | (7 | ) | 14 | 1,433 | 1,242 | 15 | |||||||||||||||||||||||||||||
Total noninterest revenue — managed |
$ | 12,418 | $ | 15,453 | $ | 13,767 | $ | 14,499 | $ | 11,737 | (20 | ) | 6 | $ | 41,638 | $ | 38,939 | 7 | ||||||||||||||||||||||
NET INTEREST INCOME |
||||||||||||||||||||||||||||||||||||||||
Net interest income — reported |
$ | 11,817 | $ | 11,836 | $ | 11,905 | $ | 12,102 | $ | 12,502 | — | (5 | ) | $ | 35,558 | $ | 38,899 | (9 | ) | |||||||||||||||||||||
Fully tax-equivalent adjustments |
133 | 121 | 119 | 121 | 96 | 10 | 39 | 373 | 282 | 32 | ||||||||||||||||||||||||||||||
Net interest income — managed |
$ | 11,950 | $ | 11,957 | $ | 12,024 | $ | 12,223 | $ | 12,598 | — | (5 | ) | $ | 35,931 | $ | 39,181 | (8 | ) | |||||||||||||||||||||
TOTAL NET REVENUE |
||||||||||||||||||||||||||||||||||||||||
Total net revenue — reported |
$ | 23,763 | $ | 26,779 | $ | 25,221 | $ | 26,098 | $ | 23,824 | (11 | ) | — | $ | 75,763 | $ | 76,596 | (1 | ) | |||||||||||||||||||||
Fully tax-equivalent adjustments |
605 | 631 | 570 | 624 | 511 | (4 | ) | 18 | 1,806 | 1,524 | 19 | |||||||||||||||||||||||||||||
Total net revenue — managed |
$ | 24,368 | $ | 27,410 | $ | 25,791 | $ | 26,722 | $ | 24,335 | (11 | ) | — | $ | 77,569 | $ | 78,120 | (1 | ) | |||||||||||||||||||||
PRE-PROVISION PROFIT |
||||||||||||||||||||||||||||||||||||||||
Total pre-provision profit — reported |
$ | 8,229 | $ | 9,937 | $ | 9,226 | $ | 10,055 | $ | 9,426 | (17 | ) | (13 | ) | $ | 27,392 | $ | 31,443 | (13 | ) | ||||||||||||||||||||
Fully tax-equivalent adjustments |
605 | 631 | 570 | 624 | 511 | (4 | ) | 18 | 1,806 | 1,524 | 19 | |||||||||||||||||||||||||||||
Total pre-provision profit — managed |
$ | 8,834 | $ | 10,568 | $ | 9,796 | $ | 10,679 | $ | 9,937 | (16 | ) | (11 | ) | $ | 29,198 | $ | 32,967 | (11 | ) | ||||||||||||||||||||
INCOME TAX EXPENSE |
||||||||||||||||||||||||||||||||||||||||
Income tax expense — reported |
$ | 1,556 | $ | 2,696 | $ | 2,502 | $ | 2,181 | $ | 1,785 | (42 | ) | (13 | ) | $ | 6,754 | $ | 5,308 | 27 | |||||||||||||||||||||
Fully tax-equivalent adjustments |
605 | 631 | 570 | 624 | 511 | (4 | ) | 18 | 1,806 | 1,524 | 19 | |||||||||||||||||||||||||||||
Income tax expense — managed |
$ | 2,161 | $ | 3,327 | $ | 3,072 | $ | 2,805 | $ | 2,296 | (35 | ) | (6 | ) | $ | 8,560 | $ | 6,832 | 25 | |||||||||||||||||||||
Page 7
| JPMORGAN CHASE & CO. | |
|
| LINE OF BUSINESS FINANCIAL HIGHLIGHTS — MANAGED BASIS (a) | ||
| (in millions, except ratio data) |
| QUARTERLY TRENDS | NINE MONTHS ENDED SEPTEMBER 30, | |||||||||||||||||||||||||||||||||||||||
| 3Q11 Change | 2011 Change | |||||||||||||||||||||||||||||||||||||||
| 3Q11 | 2Q11 | 1Q11 | 4Q10 | 3Q10 | 2Q11 | 3Q10 | 2011 | 2010 | 2010 | |||||||||||||||||||||||||||||||
TOTAL NET REVENUE (FTE) |
||||||||||||||||||||||||||||||||||||||||
Investment Bank (b) |
$ | 6,369 | $ | 7,314 | $ | 8,233 | $ | 6,213 | $ | 5,353 | (13) | % | 19 | % | $ | 21,916 | $ | 20,004 | 10 | % | ||||||||||||||||||||
Retail Financial Services |
7,535 | 7,142 | 5,466 | 7,699 | 6,814 | 6 | 11 | 20,143 | 20,748 | (3 | ) | |||||||||||||||||||||||||||||
Card Services & Auto |
4,775 | 4,761 | 4,791 | 5,072 | 5,085 | — | (6 | ) | 14,327 | 15,400 | (7 | ) | ||||||||||||||||||||||||||||
Commercial Banking |
1,588 | 1,627 | 1,516 | 1,611 | 1,527 | (2 | ) | 4 | 4,731 | 4,429 | 7 | |||||||||||||||||||||||||||||
Treasury & Securities Services |
1,908 | 1,932 | 1,840 | 1,913 | 1,831 | (1 | ) | 4 | 5,680 | 5,468 | 4 | |||||||||||||||||||||||||||||
Asset Management |
2,316 | 2,537 | 2,406 | 2,613 | 2,172 | (9 | ) | 7 | 7,259 | 6,371 | 14 | |||||||||||||||||||||||||||||
Corporate/Private Equity (b) |
(123 | ) | 2,097 | 1,539 | 1,601 | 1,553 | NM | NM | 3,513 | 5,700 | (38 | ) | ||||||||||||||||||||||||||||
TOTAL NET REVENUE |
$ | 24,368 | $ | 27,410 | $ | 25,791 | $ | 26,722 | $ | 24,335 | (11 | ) | — | $ | 77,569 | $ | 78,120 | (1 | ) | |||||||||||||||||||||
TOTAL PRE-PROVISION PROFIT |
||||||||||||||||||||||||||||||||||||||||
Investment Bank (b) |
$ | 2,570 | $ | 2,982 | $ | 3,217 | $ | 2,012 | $ | 1,649 | (14 | ) | 56 | $ | 8,769 | $ | 6,940 | 26 | ||||||||||||||||||||||
Retail Financial Services |
2,970 | 1,871 | 566 | 3,228 | 2,644 | 59 | 12 | 5,407 | 8,736 | (38 | ) | |||||||||||||||||||||||||||||
Card Services & Auto |
2,660 | 2,773 | 2,874 | 3,205 | 3,293 | (4 | ) | (19 | ) | 8,307 | 10,089 | (18 | ) | |||||||||||||||||||||||||||
Commercial Banking |
1,015 | 1,064 | 953 | 1,053 | 967 | (5 | ) | 5 | 3,032 | 2,788 | 9 | |||||||||||||||||||||||||||||
Treasury & Securities Services |
438 | 479 | 463 | 443 | 421 | (9 | ) | 4 | 1,380 | 1,334 | 3 | |||||||||||||||||||||||||||||
Asset Management |
520 | 743 | 746 | 836 | 684 | (30 | ) | (24 | ) | 2,009 | 2,036 | (1 | ) | |||||||||||||||||||||||||||
Corporate/Private Equity (b) |
(1,339 | ) | 656 | 977 | (98 | ) | 279 | NM | NM | 294 | 1,044 | (72 | ) | |||||||||||||||||||||||||||
TOTAL PRE-PROVISION PROFIT |
$ | 8,834 | $ | 10,568 | $ | 9,796 | $ | 10,679 | $ | 9,937 | (16 | ) | (11 | ) | $ | 29,198 | $ | 32,967 | (11 | ) | ||||||||||||||||||||
NET INCOME/(LOSS) |
||||||||||||||||||||||||||||||||||||||||
Investment Bank |
$ | 1,636 | $ | 2,057 | $ | 2,370 | $ | 1,501 | $ | 1,286 | (20 | ) | 27 | $ | 6,063 | $ | 5,138 | 18 | ||||||||||||||||||||||
Retail Financial Services |
1,161 | 383 | (399 | ) | 459 | 716 | 203 | 62 | 1,145 | 1,269 | (10 | ) | ||||||||||||||||||||||||||||
Card Services & Auto |
849 | 1,110 | 1,534 | 1,548 | 926 | (24 | ) | (8 | ) | 3,493 | 1,324 | 164 | ||||||||||||||||||||||||||||
Commercial Banking |
571 | 607 | 546 | 530 | 471 | (6 | ) | 21 | 1,724 | 1,554 | 11 | |||||||||||||||||||||||||||||
Treasury & Securities Services |
305 | 333 | 316 | 257 | 251 | (8 | ) | 22 | 954 | 822 | 16 | |||||||||||||||||||||||||||||
Asset Management |
385 | 439 | 466 | 507 | 420 | (12 | ) | (8 | ) | 1,290 | 1,203 | 7 | ||||||||||||||||||||||||||||
Corporate/Private Equity |
(645 | ) | 502 | 722 | 29 | 348 | NM | NM | 579 | 1,229 | (53 | ) | ||||||||||||||||||||||||||||
TOTAL NET INCOME |
$ | 4,262 | $ | 5,431 | $ | 5,555 | $ | 4,831 | $ | 4,418 | (22 | ) | (4 | ) | $ | 15,248 | $ | 12,539 | 22 | |||||||||||||||||||||
AVERAGE EQUITY (c) |
||||||||||||||||||||||||||||||||||||||||
Investment Bank |
$ | 40,000 | $ | 40,000 | $ | 40,000 | $ | 40,000 | $ | 40,000 | — | — | $ | 40,000 | $ | 40,000 | — | |||||||||||||||||||||||
Retail Financial Services |
25,000 | 25,000 | 25,000 | 24,600 | 24,600 | — | 2 | 25,000 | 24,600 | 2 | ||||||||||||||||||||||||||||||
Card Services & Auto |
16,000 | 16,000 | 16,000 | 18,400 | 18,400 | — | (13 | ) | 16,000 | 18,400 | (13 | ) | ||||||||||||||||||||||||||||
Commercial Banking |
8,000 | 8,000 | 8,000 | 8,000 | 8,000 | — | — | 8,000 | 8,000 | — | ||||||||||||||||||||||||||||||
Treasury & Securities Services |
7,000 | 7,000 | 7,000 | 6,500 | 6,500 | — | 8 | 7,000 | 6,500 | 8 | ||||||||||||||||||||||||||||||
Asset Management |
6,500 | 6,500 | 6,500 | 6,500 | 6,500 | — | — | 6,500 | 6,500 | — | ||||||||||||||||||||||||||||||
Corporate/Private Equity |
71,954 | 71,577 | 66,915 | 62,812 | 59,962 | 1 | 20 | 70,167 | 55,737 | 26 | ||||||||||||||||||||||||||||||
TOTAL AVERAGE EQUITY |
$ | 174,454 | $ | 174,077 | $ | 169,415 | $ | 166,812 | $ | 163,962 | — | 6 | $ | 172,667 | $ | 159,737 | 8 | |||||||||||||||||||||||
RETURN ON EQUITY (c) |
||||||||||||||||||||||||||||||||||||||||
Investment Bank |
16 | % | 21 | % | 24 | % | 15 | % | 13 | % | 20 | % | 17 | % | ||||||||||||||||||||||||||
Retail Financial Services |
18 | 6 | (6 | ) | 7 | 12 | 6 | 7 | ||||||||||||||||||||||||||||||||
Card Services & Auto |
21 | 28 | 39 | 33 | 20 | 29 | 10 | |||||||||||||||||||||||||||||||||
Commercial Banking |
28 | 30 | 28 | 26 | 23 | 29 | 26 | |||||||||||||||||||||||||||||||||
Treasury & Securities Services |
17 | 19 | 18 | 16 | 15 | 18 | 17 | |||||||||||||||||||||||||||||||||
Asset Management |
24 | 27 | 29 | 31 | 26 | 27 | 25 | |||||||||||||||||||||||||||||||||
JPMORGAN CHASE |
9 | 12 | 13 | 11 | 10 | 11 | 10 | |||||||||||||||||||||||||||||||||
| (a) | Commencing July 1, 2011, the Firm’s business segments have been reorganized as follows: (1) Auto and Student Lending transferred from the current Retail Financial Services (“RFS”) reportable/operating segment and is now reported with Card Services & Auto (“Card”) in a single reportable/operating segment, and (2) RFS continues as a reportable/operating segment, organized in two components: Consumer & Business Banking (formerly Retail Banking) and Mortgage Banking (including Mortgage Production and Servicing, and Real Estate Portfolios). All prior period disclosures have been revised to conform with the current period presentation. For further details on the reorganization, see page 49. | |
| (b) | Corporate/Private Equity includes an adjustment to offset Investment Bank’s (“IB”) inclusion of a credit allocation income/(expense) to Treasury & Securities Services (“TSS”) in total net revenue; TSS reports the credit allocation as a separate line on its income statement (not within total net revenue). | |
| (c) | Equity for a line of business represents the amount the Firm believes the business would require if it were operating independently, incorporating sufficient capital to address regulatory capital requirements (including Basel III Tier 1 common capital requirements), economic risk measures, and capital levels for similarly rated peers. Capital is also allocated to each line of business for, among other things, goodwill and other intangibles associated with acquisitions effected by the line of business. ROE is measured and internal targets for expected returns are established as key measures of a business segment’s performance. Effective January 1, 2011, capital allocated to Card was reduced by $2.4 billion, to $16.0 billion, largely reflecting portfolio runoff and the improving risk profile of the business; capital allocated to TSS was increased by $500 million, to $7.0 billion, reflecting growth in the underlying business. The Firm continues to assess the level of capital required for each line of business, as well as the assumptions and methodologies used to allocate capital to the business segments, and further refinements may be implemented in future periods. |
Page 8
| JPMORGAN CHASE & CO. | |
|
| INVESTMENT BANK | ||
| FINANCIAL HIGHLIGHTS | ||
| (in millions, except ratio data) |
| QUARTERLY TRENDS | NINE MONTHS ENDED SEPTEMBER 30, | |||||||||||||||||||||||||||||||||||||||
| 3Q11 Change | 2011 Change | |||||||||||||||||||||||||||||||||||||||
| 3Q11 | 2Q11 | 1Q11 | 4Q10 | 3Q10 | 2Q11 | 3Q10 | 2011 | 2010 | 2010 | |||||||||||||||||||||||||||||||
INCOME STATEMENT |
||||||||||||||||||||||||||||||||||||||||
REVENUE |
||||||||||||||||||||||||||||||||||||||||
Investment banking fees |
$ | 1,039 | $ | 1,922 | $ | 1,779 | $ | 1,833 | $ | 1,502 | (46) | % | (31) | % | $ | 4,740 | $ | 4,353 | 9 | % | ||||||||||||||||||||
Principal transactions |
2,253 | 2,309 | 3,398 | 1,289 | 1,129 | (2 | ) | 100 | 7,960 | 7,165 | 11 | |||||||||||||||||||||||||||||
Lending- and deposit-related fees |
210 | 218 | 214 | 209 | 205 | (4 | ) | 2 | 642 | 610 | 5 | |||||||||||||||||||||||||||||
Asset management, administration and commissions |
563 | 548 | 619 | 652 | 565 | 3 | — | 1,730 | 1,761 | (2 | ) | |||||||||||||||||||||||||||||
All other income (a) |
228 | 236 | 166 | 185 | 61 | (3 | ) | 274 | 630 | 196 | 221 | |||||||||||||||||||||||||||||
Noninterest revenue |
4,293 | 5,233 | 6,176 | 4,168 | 3,462 | (18 | ) | 24 | 15,702 | 14,085 | 11 | |||||||||||||||||||||||||||||
Net interest income |
2,076 | 2,081 | 2,057 | 2,045 | 1,891 | — | 10 | 6,214 | 5,919 | 5 | ||||||||||||||||||||||||||||||
TOTAL NET REVENUE (b) |
6,369 | 7,314 | 8,233 | 6,213 | 5,353 | (13 | ) | 19 | 21,916 | 20,004 | 10 | |||||||||||||||||||||||||||||
Provision for credit losses |
54 | (183 | ) | (429 | ) | (271 | ) | (142 | ) | NM | NM | (558 | ) | (929 | ) | 40 | ||||||||||||||||||||||||
NONINTEREST EXPENSE |
||||||||||||||||||||||||||||||||||||||||
Compensation expense |
1,850 | 2,564 | 3,294 | 1,845 | 2,031 | (28 | ) | (9 | ) | 7,708 | 7,882 | (2 | ) | |||||||||||||||||||||||||||
Noncompensation expense |
1,949 | 1,768 | 1,722 | 2,356 | 1,673 | 10 | 16 | 5,439 | 5,182 | 5 | ||||||||||||||||||||||||||||||
TOTAL NONINTEREST EXPENSE |
3,799 | 4,332 | 5,016 | 4,201 | 3,704 | (12 | ) | 3 | 13,147 | 13,064 | 1 | |||||||||||||||||||||||||||||
Income before income tax expense |
2,516 | 3,165 | 3,646 | 2,283 | 1,791 | (21 | ) | 40 | 9,327 | 7,869 | 19 | |||||||||||||||||||||||||||||
Income tax expense |
880 | 1,108 | 1,276 | 782 | 505 | (21 | ) | 74 | 3,264 | 2,731 | 20 | |||||||||||||||||||||||||||||
NET INCOME |
$ | 1,636 | $ | 2,057 | $ | 2,370 | $ | 1,501 | $ | 1,286 | (20 | ) | 27 | $ | 6,063 | $ | 5,138 | 18 | ||||||||||||||||||||||
FINANCIAL RATIOS |
||||||||||||||||||||||||||||||||||||||||
ROE |
16 | % | 21 | % | 24 | % | 15 | % | 13 | % | 20 | % | 17 | % | ||||||||||||||||||||||||||
ROA |
0.81 | 0.98 | 1.18 | 0.75 | 0.68 | 0.99 | 0.97 | |||||||||||||||||||||||||||||||||
Overhead ratio |
60 | 59 | 61 | 68 | 69 | 60 | 65 | |||||||||||||||||||||||||||||||||
Compensation expense as a percent of total net revenue |
29 | 35 | 40 | 30 | 38 | 35 | 39 | (f) | ||||||||||||||||||||||||||||||||
REVENUE BY BUSINESS |
||||||||||||||||||||||||||||||||||||||||
Investment banking fees: |
||||||||||||||||||||||||||||||||||||||||
Advisory |
$ | 365 | $ | 601 | $ | 429 | $ | 424 | $ | 385 | (39 | ) | (5 | ) | $ | 1,395 | $ | 1,045 | 33 | |||||||||||||||||||||
Equity underwriting |
178 | 455 | 379 | 489 | 333 | (61 | ) | (47 | ) | 1,012 | 1,100 | (8 | ) | |||||||||||||||||||||||||||
Debt underwriting |
496 | 866 | 971 | 920 | 784 | (43 | ) | (37 | ) | 2,333 | 2,208 | 6 | ||||||||||||||||||||||||||||
Total investment banking fees |
1,039 | 1,922 | 1,779 | 1,833 | 1,502 | (46 | ) | (31 | ) | 4,740 | 4,353 | 9 | ||||||||||||||||||||||||||||
Fixed income markets (c) |
3,328 | 4,280 | 5,238 | 2,875 | 3,123 | (22 | ) | 7 | 12,846 | 12,150 | 6 | |||||||||||||||||||||||||||||
Equity markets (d) |
1,424 | 1,223 | 1,406 | 1,128 | 1,135 | 16 | 25 | 4,053 | 3,635 | 11 | ||||||||||||||||||||||||||||||
Credit portfolio (a)(e) |
578 | (111 | ) | (190 | ) | 377 | (407 | ) | NM | NM | 277 | (134 | ) | NM | ||||||||||||||||||||||||||
Total net revenue |
$ | 6,369 | $ | 7,314 | $ | 8,233 | $ | 6,213 | $ | 5,353 | (13 | ) | 19 | $ | 21,916 | $ | 20,004 | 10 | ||||||||||||||||||||||
| (a) | IB manages traditional credit exposures related to Global Corporate Bank (“GCB”) on behalf of IB and TSS. Effective January 1, 2011, IB and TSS share the economics related to the Firm’s GCB clients. IB recognizes this sharing agreement within all other income. The prior-year periods reflected the reimbursement from TSS for a portion of the total costs of managing the credit portfolio on behalf of TSS. | |
| (b) | Total net revenue included tax-equivalent adjustments, predominantly due to income tax credits related to affordable housing and alternative energy investments, as well as tax-exempt income from municipal bond investments of $440 million, $493 million, $438 million, $475 million and $390 million for the three months ended September 30, 2011, June 30, 2011, March 31, 2011, December 31, 2010 and September 30, 2010, respectively, and $1.4 billion and $1.2 billion for the nine months ended September 30, 2011 and 2010, respectively. | |
| (c) | Fixed income markets primarily include revenue related to market-making across global fixed income markets, including foreign exchange, interest rate, credit and commodities markets. | |
| (d) | Equities markets primarily include revenue related to market-making across global equity products, including cash instruments, derivatives, convertibles and Prime Services. | |
| (e) | Credit portfolio revenue includes net interest income, fees and loan sale activity, as well as gains or losses on securities received as part of a loan restructuring, for IB’s credit portfolio. Credit portfolio revenue also includes the results of risk management related to the Firm’s lending and derivative activities. | |
| (f) | The compensation expense as a percentage of total net revenue ratio for the nine months ended September 30, 2010, excluding the payroll tax expense related to the U.K. Bank Payroll Tax on certain compensation awarded from December 9, 2009 to April 5, 2010 to relevant banking employees, which is a non-GAAP financial measure, was 37%. IB excludes this tax from the ratio because it enables comparability between periods. |
Page 9
| JPMORGAN CHASE & CO. INVESTMENT BANK FINANCIAL HIGHLIGHTS, CONTINUED (in millions, except headcount and ratio data) |
|
| QUARTERLY TRENDS | NINE MONTHS ENDED SEPTEMBER 30, | ||||||||||||||||||||||||||||||||||||||||
| 3Q11 Change | 2011 Change | ||||||||||||||||||||||||||||||||||||||||
| 3Q11 | 2Q11 | 1Q11 | 4Q10 | 3Q10 | 2Q11 | 3Q10 | 2011 | 2010 | 2010 | ||||||||||||||||||||||||||||||||
SELECTED BALANCE SHEET DATA (period-end) |
|||||||||||||||||||||||||||||||||||||||||
Loans: |
|||||||||||||||||||||||||||||||||||||||||
Loans retained (a) |
$ | 58,163 | $ | 56,107 | $ | 52,712 | $ | 53,145 | $ | 51,299 | 4 | % | 13 | % | $ | 58,163 | $ | 51,299 | 13 | % | |||||||||||||||||||||
Loans held-for-sale and loans at fair value |
2,311 | 3,466 | 5,070 | 3,746 | 2,252 | (33 | ) | 3 | 2,311 | 2,252 | 3 | ||||||||||||||||||||||||||||||
Total loans |
60,474 | 59,573 | 57,782 | 56,891 | 53,551 | 2 | 13 | 60,474 | 53,551 | 13 | |||||||||||||||||||||||||||||||
Equity |
40,000 | 40,000 | 40,000 | 40,000 | 40,000 | — | — | 40,000 | 40,000 | — | |||||||||||||||||||||||||||||||
SELECTED BALANCE SHEET DATA (average) |
|||||||||||||||||||||||||||||||||||||||||
Total assets |
$ | 803,667 | $ | 841,355 | $ | 815,828 | $ | 792,703 | $ | 746,926 | (4 | ) | 8 | $ | 820,239 | $ | 711,277 | 15 | |||||||||||||||||||||||
Trading assets — debt and equity instruments |
329,984 | 374,694 | 368,956 | 346,990 | 300,517 | (12 | ) | 10 | 357,735 | 293,605 | 22 | ||||||||||||||||||||||||||||||
Trading assets — derivative receivables |
79,044 | 69,346 | 67,462 | 72,491 | 76,530 | 14 | 3 | 71,993 | 69,547 | 4 | |||||||||||||||||||||||||||||||
Loans: |
|||||||||||||||||||||||||||||||||||||||||
Loans retained (a) |
57,265 | 54,590 | 53,370 | 52,502 | 53,331 | 5 | 7 | 55,089 | 55,042 | — | |||||||||||||||||||||||||||||||
Loans held-for-sale and loans at fair value |
2,431 | 4,154 | 3,835 | 3,504 | 2,678 | (41 | ) | (9 | ) | 3,468 | 3,118 | 11 | |||||||||||||||||||||||||||||
Total loans |
59,696 | 58,744 | 57,205 | 56,006 | 56,009 | 2 | 7 | 58,557 | 58,160 | 1 | |||||||||||||||||||||||||||||||
Adjusted assets (b) |
597,513 | 628,475 | 611,038 | 587,307 | 539,459 | (5 | ) | 11 | 612,292 | 524,658 | 17 | ||||||||||||||||||||||||||||||
Equity |
40,000 | 40,000 | 40,000 | 40,000 | 40,000 | — | — | 40,000 | 40,000 | — | |||||||||||||||||||||||||||||||
Headcount |
26,615 | 27,716 | 26,494 | 26,314 | 26,373 | (4 | ) | 1 | 26,615 | 26,373 | 1 | ||||||||||||||||||||||||||||||
CREDIT DATA AND QUALITY STATISTICS |
|||||||||||||||||||||||||||||||||||||||||
Net charge-offs/(recoveries) |
$ | (168 | ) | $ | 7 | $ | 123 | $ | (23 | ) | $ | 33 | NM | NM | $ | (38 | ) | $ | 758 | NM | |||||||||||||||||||||
Nonperforming assets: |
|||||||||||||||||||||||||||||||||||||||||
Nonaccrual loans: |
|||||||||||||||||||||||||||||||||||||||||
Nonaccrual loans retained (a)(c) |
1,274 | 1,494 | 2,388 | 3,159 | 2,025 | (15 | ) | (37 | ) | 1,274 | 2,025 | (37 | ) | ||||||||||||||||||||||||||||
Nonaccrual loans held-for-sale and loans
at fair value |
150 | 193 | 259 | 460 | 361 | (22 | ) | (58 | ) | 150 | 361 | (58 | ) | ||||||||||||||||||||||||||||
Total nonaccrual loans |
1,424 | 1,687 | 2,647 | 3,619 | 2,386 | (16 | ) | (40 | ) | 1,424 | 2,386 | (40 | ) | ||||||||||||||||||||||||||||
Derivative receivables |
7 | 18 | 21 | 34 | 255 | (61 | ) | (97 | ) | 7 | 255 | (97 | ) | ||||||||||||||||||||||||||||
Assets acquired in loan satisfactions |
77 | 83 | 73 | 117 | 148 | (7 | ) | (48 | ) | 77 | 148 | (48 | ) | ||||||||||||||||||||||||||||
Total nonperforming assets |
1,508 | 1,788 | 2,741 | 3,770 | 2,789 | (16 | ) | (46 | ) | 1,508 | 2,789 | (46 | ) | ||||||||||||||||||||||||||||
Allowance for credit losses: |
|||||||||||||||||||||||||||||||||||||||||
Allowance for loan losses |
1,337 | 1,178 | 1,330 | 1,863 | 1,976 | 13 | (32 | ) | 1,337 | 1,976 | (32 | ) | |||||||||||||||||||||||||||||
Allowance for lending-related commitments |
444 | 383 | 424 | 447 | 570 | 16 | (22 | ) | 444 | 570 | (22 | ) | |||||||||||||||||||||||||||||
Total allowance for credit losses |
1,781 | 1,561 | 1,754 | 2,310 | 2,546 | 14 | (30 | ) | 1,781 | 2,546 | (30 | ) | |||||||||||||||||||||||||||||
Net charge-off/(recovery) rate (a)(d) |
(1.16) | % | 0.05 | % | 0.93 | % | (0.17 | )% | 0.25 | % | (0.09) | % | 1.84 | % | |||||||||||||||||||||||||||
Allow. for loan losses to period-end loans retained (a)(d) |
2.30 | 2.10 | 2.52 | 3.51 | 3.85 | 2.30 | 3.85 | ||||||||||||||||||||||||||||||||||
Allow. for loan losses to nonaccrual loans retained (a)(c)(d) |
105 | 79 | 56 | 59 | 98 | 105 | 98 | ||||||||||||||||||||||||||||||||||
Nonaccrual loans to total period-end loans |
2.35 | 2.83 | 4.58 | 6.36 | 4.46 | 2.35 | 4.46 | ||||||||||||||||||||||||||||||||||
| (a) | Loans retained included credit portfolio loans, leveraged leases and other accrual loans, and excluded loans held-for-sale and loans at fair value. | |
| (b) | Adjusted assets, a non-GAAP financial measure, is presented to assist the reader in comparing IB’s asset and capital levels with those of other investment banks in the securities industry. For further discussion of adjusted assets, see page 44. | |
| (c) | Allowance for loan losses of $320 million, $377 million, $567 million, $1.1 billion and $603 million were held against these nonaccrual loans at September 30, 2011, June 30, 2011, March 31, 2011, December 31, 2010 and September 30, 2010, respectively. | |
| (d) | Loans held-for-sale and loans at fair value were excluded when calculating the allowance coverage ratio and net charge-off/(recovery) rate. |
Page 10
| JPMORGAN CHASE & CO. INVESTMENT BANK FINANCIAL HIGHLIGHTS, CONTINUED (in millions, except ratio and rankings data) |
|
| QUARTERLY TRENDS | NINE MONTHS ENDED SEPTEMBER 30, | |||||||||||||||||||||||||||||||||||||||
| 3Q11 Change | 2011 Change | |||||||||||||||||||||||||||||||||||||||
| 3Q11 | 2Q11 | 1Q11 | 4Q10 | 3Q10 | 2Q11 | 3Q10 | 2011 | 2010 | 2010 | |||||||||||||||||||||||||||||||
MARKET RISK — AVERAGE TRADING AND CREDIT |
||||||||||||||||||||||||||||||||||||||||
PORTFOLIO VAR - 95% CONFIDENCE LEVEL |
||||||||||||||||||||||||||||||||||||||||
Trading activities: |
||||||||||||||||||||||||||||||||||||||||
Fixed income |
$ | 48 | $ | 45 | $ | 49 | $ | 53 | $ | 72 | 7 | % | (33) | % | $ | 47 | $ | 68 | (31) | % | ||||||||||||||||||||
Foreign exchange |
10 | 9 | 11 | 10 | 9 | 11 | 11 | 10 | 11 | (9 | ) | |||||||||||||||||||||||||||||
Equities |
19 | 25 | 29 | 23 | 21 | (24 | ) | (10 | ) | 24 | 22 | 9 | ||||||||||||||||||||||||||||
Commodities and other |
15 | 16 | 13 | 14 | 13 | (6 | ) | 15 | 15 | 16 | (6 | ) | ||||||||||||||||||||||||||||
Diversification (a) |
(39 | ) | (37 | ) | (38 | ) | (38 | ) | (38 | ) | (5 | ) | (3 | ) | (38 | ) | (43 | ) | 12 | |||||||||||||||||||||
Total trading VaR (b) |
53 | 58 | 64 | 62 | 77 | (9 | ) | (31 | ) | 58 | 74 | (22 | ) | |||||||||||||||||||||||||||
Credit portfolio VaR (c) |
38 | 27 | 26 | 26 | 30 | 41 | 27 | 30 | 25 | 20 | ||||||||||||||||||||||||||||||
Diversification (a) |
(21 | ) | (8 | ) | (7 | ) | (10 | ) | (8 | ) | (163 | ) | (163 | ) | (11 | ) | (9 | ) | (22 | ) | ||||||||||||||||||||
Total trading and credit portfolio VaR |
$ | 70 | $ | 77 | $ | 83 | $ | 78 | $ | 99 | (9 | ) | (29 | ) | $ | 77 | $ | 90 | (14 | ) | ||||||||||||||||||||
| NINE MONTHS ENDED SEPTEMBER 30, 2011 |
FULL YEAR 2010 | |||||||||||||||
| MARKET SHARES AND RANKINGS (d) | Market Share | Rankings | Market Share | Rankings | ||||||||||||
Global investment banking fees (e) |
8.4 | % | #1 | 7.6 | % | #1 | ||||||||||
Debt, equity and equity-related |
||||||||||||||||
Global |
6.8 | 1 | 7.2 | 1 | ||||||||||||
U.S. |
11.2 | 1 | 11.1 | 1 | ||||||||||||
Syndicated loans |
||||||||||||||||
Global |
11.3 | 1 | 8.5 | 2 | ||||||||||||
U.S. |
21.6 | 1 | 19.1 | 2 | ||||||||||||
Long-term debt (f) |
||||||||||||||||
Global |
6.8 | 1 | 7.2 | 2 | ||||||||||||
U.S. |
11.2 | 1 | 10.9 | 2 | ||||||||||||
Equity and equity-related |
||||||||||||||||
Global (g) |
7.0 | 4 | 7.3 | 3 | ||||||||||||
U.S. |
12.3 | 1 | 13.1 | 2 | ||||||||||||
Announced M&A (h) |
||||||||||||||||
Global |
22.4 | 2 | 16.2 | 4 | ||||||||||||
U.S. |
34.0 | 1 | 22.2 | 3 | ||||||||||||
| (a) | Average value-at-risk (“ VaR”) was less than the sum of the VaR of the components described above, which is due to portfolio diversification. The diversification effect reflects the fact that the risks were not perfectly correlated. The risk of a portfolio of positions is therefore usually less than the sum of the risks of the positions themselves. | |
| (b) | Trading VaR includes substantially all trading activities in IB, including the credit spread sensitivities of certain mortgage products and syndicated lending facilities that the Firm intends to distribute; however, particular risk parameters of certain products are not fully captured, for example, correlation risk. Trading VaR does not include the debit valuation adjustments (“DVA”) taken on derivative and structured liabilities to reflect the credit quality of the Firm. | |
| (c) | Credit portfolio VaR includes the derivative credit valuation adjustments (“CVA”), hedges of the CVA and mark-to-market (“MTM”) hedges of the retained loan portfolio, which are all reported in principal transactions revenue. This VaR does not include the retained loan portfolio, which is not MTM. | |
| (d) | Source: Dealogic. Global Investment Banking fees reflects the ranking of fees and market share. Remainder of rankings reflects transaction volume rank and market share. | |
| (e) | Global IB fees exclude money market, short-term debt and shelf deals. | |
| (f) | Long-term debt tables include investment-grade, high-yield, supranationals, sovereigns, agencies, covered bonds, asset-backed securities and mortgage-backed securities; and exclude money market, short-term debt, and U.S. municipal securities. | |
| (g) | Equity and equity-related rankings include rights offerings and Chinese A-Shares. | |
| (h) | Global announced M&A is based on transaction value at announcement; all other rankings are based on transaction proceeds, with full credit to each book manager/equal if joint. Because of joint assignments, market share of all participants will add up to more than 100%. M&A for the nine months ended September 30, 2011 and full year 2010 reflects the removal of any withdrawn transactions. U.S. announced M&A represents any U.S. involvement ranking. |
Page 11
| JPMORGAN CHASE & CO. INVESTMENT BANK FINANCIAL HIGHLIGHTS, CONTINUED (in millions) |
|
| QUARTERLY TRENDS | NINE MONTHS ENDED SEPTEMBER 30, | |||||||||||||||||||||||||||||||||||||||
| 3Q11 Change | 2011 Change | |||||||||||||||||||||||||||||||||||||||
| 3Q11 | 2Q11 | 1Q11 | 4Q10 | 3Q10 | 2Q11 | 3Q10 | 2011 | 2010 | 2010 | |||||||||||||||||||||||||||||||
INTERNATIONAL METRICS |
||||||||||||||||||||||||||||||||||||||||
Total net revenue: (a) |
||||||||||||||||||||||||||||||||||||||||
Asia/Pacific |
$ | 948 | $ | 762 | $ | 1,122 | $ | 927 | $ | 993 | 24 | % | (5 | )% | $ | 2,832 | $ | 2,882 | (2 | )% | ||||||||||||||||||||
Latin America/Caribbean |
175 | 337 | 327 | 172 | 167 | (48 | ) | 5 | 839 | 725 | 16 | |||||||||||||||||||||||||||||
Europe/Middle East/Africa |
1,995 | 2,478 | 2,592 | 1,423 | 1,538 | (19 | ) | 30 | 7,065 | 5,957 | 19 | |||||||||||||||||||||||||||||
North America |
3,251 | 3,737 | 4,192 | 3,691 | 2,655 | (13 | ) | 22 | 11,180 | 10,440 | 7 | |||||||||||||||||||||||||||||
Total net revenue |
$ | 6,369 | $ | 7,314 | $ | 8,233 | $ | 6,213 | $ | 5,353 | (13 | ) | 19 | $ | 21,916 | $ | 20,004 | 10 | ||||||||||||||||||||||
Loans (period-end): (b) |
||||||||||||||||||||||||||||||||||||||||
Asia/Pacific |
$ | 6,892 | $ | 6,211 | $ | 5,472 | $ | 5,924 | $ | 5,595 | 11 | 23 | $ | 6,892 | $ | 5,595 | 23 | |||||||||||||||||||||||
Latin America/Caribbean |
3,222 | 2,633 | 2,190 | 2,200 | 1,545 | 22 | 109 | 3,222 | 1,545 | 109 | ||||||||||||||||||||||||||||||
Europe/Middle East/Africa |
15,361 | 15,370 | 14,059 | 13,961 | 12,781 | — | 20 | 15,361 | 12,781 | 20 | ||||||||||||||||||||||||||||||
North America |
32,688 | 31,893 | 30,991 | 31,060 | 31,378 | 2 | 4 | 32,688 | 31,378 | 4 | ||||||||||||||||||||||||||||||
Total loans |
$ | 58,163 | $ | 56,107 | $ | 52,712 | $ | 53,145 | $ | 51,299 | 4 | 13 | $ | 58,163 | $ | 51,299 | 13 | |||||||||||||||||||||||
| (a) | Regional revenues are based primarily on the domicile of the client and/or location of the trading desk. | |
| (b) | Includes retained loans based on the domicile of the customer. Excludes loans held-for-sale and loans at fair value. |
Page 12
| JPMORGAN CHASE & CO. RETAIL FINANCIAL SERVICES FINANCIAL HIGHLIGHTS (in millions, except ratio and headcount data) |
|
| QUARTERLY TRENDS | NINE MONTHS ENDED SEPTEMBER 30, | |||||||||||||||||||||||||||||||||||||||
| 3Q11 Change | 2011 Change | |||||||||||||||||||||||||||||||||||||||
| 3Q11 | 2Q11 | 1Q11 | 4Q10 | 3Q10 | 2Q11 | 3Q10 | 2011 | 2010 | 2010 | |||||||||||||||||||||||||||||||
INCOME STATEMENT |
||||||||||||||||||||||||||||||||||||||||
REVENUE |
||||||||||||||||||||||||||||||||||||||||
Lending- and deposit-related fees |
$ | 833 | $ | 813 | $ | 736 | $ | 728 | $ | 743 | 2 | % | 12 | % | $ | 2,382 | $ | 2,333 | 2 | % | ||||||||||||||||||||
Asset management, administration and commissions |
513 | 499 | 485 | 454 | 441 | 3 | 16 | 1,497 | 1,322 | 13 | ||||||||||||||||||||||||||||||
Mortgage fees and related income |
1,380 | 1,100 | (489 | ) | 1,609 | 705 | 25 | 96 | 1,991 | 2,246 | (11 | ) | ||||||||||||||||||||||||||||
Credit card income |
611 | 572 | 537 | 524 | 502 | 7 | 22 | 1,720 | 1,431 | 20 | ||||||||||||||||||||||||||||||
Other income |
136 | 131 | 111 | 128 | 143 | 4 | (5 | ) | 378 | 452 | (16 | ) | ||||||||||||||||||||||||||||
Noninterest revenue |
3,473 | 3,115 | 1,380 | 3,443 | 2,534 | 11 | 37 | 7,968 | 7,784 | 2 | ||||||||||||||||||||||||||||||
Net interest income |
4,062 | 4,027 | 4,086 | 4,256 | 4,280 | 1 | (5 | ) | 12,175 | 12,964 | (6 | ) | ||||||||||||||||||||||||||||
TOTAL NET REVENUE (a) |
7,535 | 7,142 | 5,466 | 7,699 | 6,814 | 6 | 11 | 20,143 | 20,748 | (3 | ) | |||||||||||||||||||||||||||||
Provision for credit losses |
1,027 | 994 | 1,199 | 2,418 | 1,397 | 3 | (26 | ) | 3,220 | 6,501 | (50 | ) | ||||||||||||||||||||||||||||
NONINTEREST EXPENSE |
||||||||||||||||||||||||||||||||||||||||
Compensation expense |
2,101 | 1,937 | 1,876 | 1,816 | 1,825 | 8 | 15 | 5,914 | 5,256 | 13 | ||||||||||||||||||||||||||||||
Noncompensation expense |
2,404 | 3,274 | 2,964 | 2,587 | 2,276 | (27 | ) | 6 | 8,642 | 6,548 | 32 | |||||||||||||||||||||||||||||
Amortization of intangibles |
60 | 60 | 60 | 68 | 69 | — | (13 | ) | 180 | 208 | (13 | ) | ||||||||||||||||||||||||||||
TOTAL NONINTEREST EXPENSE |
4,565 | 5,271 | 4,900 | 4,471 | 4,170 | (13 | ) | 9 | 14,736 | 12,012 | 23 | |||||||||||||||||||||||||||||
Income/(loss) before income tax expense/(benefit) |
1,943 | 877 | (633 | ) | 810 | 1,247 | 122 | 56 | 2,187 | 2,235 | (2 | ) | ||||||||||||||||||||||||||||
Income tax expense/(benefit) |
782 | 494 | (234 | ) | 351 | 531 | 58 | 47 | 1,042 | 966 | 8 | |||||||||||||||||||||||||||||
NET INCOME/(LOSS) |
$ | 1,161 | $ | 383 | $ | (399 | ) | $ | 459 | $ | 716 | 203 | 62 | $ | 1,145 | $ | 1,269 | (10 | ) | |||||||||||||||||||||
FINANCIAL RATIOS |
||||||||||||||||||||||||||||||||||||||||
ROE |
18 | % | 6 | % | (6) | % | 7 | % | 12 | % | 6 | % | 7 | % | ||||||||||||||||||||||||||
Overhead ratio |
61 | 74 | 90 | 58 | 61 | 73 | 58 | |||||||||||||||||||||||||||||||||
Overhead ratio excluding core deposit intangibles (b) |
60 | 73 | 89 | 57 | 60 | 72 | 57 | |||||||||||||||||||||||||||||||||
SELECTED BALANCE SHEET DATA (period-end) |
||||||||||||||||||||||||||||||||||||||||
Assets |
$ | 276,799 | $ | 283,753 | $ | 289,336 | $ | 299,950 | $ | 300,913 | (2 | ) | (8 | ) | $ | 276,799 | $ | 300,913 | (8 | ) | ||||||||||||||||||||
Loans: |
||||||||||||||||||||||||||||||||||||||||
Loans retained |
235,572 | 241,127 | 247,128 | 253,904 | 260,647 | (2 | ) | (10 | ) | 235,572 | 260,647 | (10 | ) | |||||||||||||||||||||||||||
Loans held-for-sale and loans at fair value (c) |
13,153 | 13,558 | 12,234 | 14,863 | 13,032 | (3 | ) | 1 | 13,153 | 13,032 | 1 | |||||||||||||||||||||||||||||
Total loans |
248,725 | 254,685 | 259,362 | 268,767 | 273,679 | (2 | ) | (9 | ) | 248,725 | 273,679 | (9 | ) | |||||||||||||||||||||||||||
Deposits |
388,735 | 378,371 | 379,605 | 369,925 | 363,295 | 3 | 7 | 388,735 | 363,295 | 7 | ||||||||||||||||||||||||||||||
Equity |
25,000 | 25,000 | 25,000 | 24,600 | 24,600 | — | 2 | 25,000 | 24,600 | 2 | ||||||||||||||||||||||||||||||
SELECTED BALANCE SHEET DATA (average) |
||||||||||||||||||||||||||||||||||||||||
Assets |
283,443 | 287,235 | 297,938 | 307,040 | 309,523 | (1 | ) | (8 | ) | 289,486 | 316,407 | (9 | ) | |||||||||||||||||||||||||||
Loans: |
||||||||||||||||||||||||||||||||||||||||
Loans retained |
238,273 | 244,030 | 250,443 | 257,500 | 264,467 | (2 | ) | (10 | ) | 244,204 | 272,744 | (10 | ) | |||||||||||||||||||||||||||
Loans held-for-sale and loans at fair value (c) |
16,608 | 14,613 | 17,519 | 18,877 | 15,571 | 14 | 7 | 16,243 | 14,222 | 14 | ||||||||||||||||||||||||||||||
Total loans |
254,881 | 258,643 | 267,962 | 276,377 | 280,038 | (1 | ) | (9 | ) | 260,447 | 286,966 | (9 | ) | |||||||||||||||||||||||||||
Deposits |
382,202 | 378,932 | 371,787 | 367,032 | 361,668 | 1 | 6 | 377,678 | 359,669 | 5 | ||||||||||||||||||||||||||||||
Equity |
25,000 | 25,000 | 25,000 | 24,600 | 24,600 | — | 2 | 25,000 | 24,600 | 2 | ||||||||||||||||||||||||||||||
Headcount |
128,992 | 122,728 | 118,547 | 116,882 | 114,440 | 5 | 13 | 128,992 | 114,440 | 13 | ||||||||||||||||||||||||||||||
| (a) | Total net revenue included tax-equivalent adjustments associated with tax-exempt loans to municipalities and other qualified entities of $2 million, $1 million, $2 million, zero and $2 million for the three months ended September 30, 2011, June 30, 2011, March 31, 2011, December 31, 2010 and September 30, 2010, respectively, and $5 million and $8 million for the nine months ended September 30, 2011 and 2010, respectively. | |
| (b) | Retail Financial Services uses the overhead ratio (excluding the amortization of core deposit intangibles (“CDI”)), a non-GAAP financial measure, to evaluate the underlying expense trends of the business. Including CDI amortization expense in the overhead ratio calculation would result in a higher overhead ratio in the earlier years and a lower overhead ratio in later years; this method would therefore result in an improving overhead ratio over time, all things remaining equal. This non-GAAP ratio excludes Consumer & Business Banking’s CDI amortization expense related to prior business combination transactions of $60 million, $60 million, $60 million, $68 million and $69 million for the three months ended September 30, 2011, June 30, 2011, March 31, 2011, December 31, 2010 and September 30, 2010, respectively, and $180 million and $208 million for the nine months ended September 30, 2011 and 2010, respectively. | |
| (c) | Loans at fair value consist of prime mortgages originated with the intent to sell that are accounted for at fair value and classified as trading assets on the Consolidated Balance Sheets. These loans totaled $13.0 billion, $13.3 billion, $12.0 billion, $14.7 billion and $12.6 billion at September 30, 2011, June 30, 2011, March 31, 2011, December 31, 2010 and September 30, 2010, respectively. Average balances of these loans totaled $16.5 billion, $14.5 billion, $17.4 billion, $18.7 billion and $15.3 billion for the three months ended September 30, 2011, June 30, 2011, March 31, 2011, December 31, 2010 and September 30, 2010, respectively, and $16.1 billion and $14.0 billion for the nine months ended September 30, 2011 and 2010, respectively. |
Page 13
| JPMORGAN CHASE & CO. RETAIL FINANCIAL SERVICES FINANCIAL HIGHLIGHTS, CONTINUED (in millions, except ratio data) |
|
| QUARTERLY TRENDS | NINE MONTHS ENDED SEPTEMBER 30, | |||||||||||||||||||||||||||||||||||||||
| 3Q11 Change | 2011 Change | |||||||||||||||||||||||||||||||||||||||
| 3Q11 | 2Q11 | 1Q11 | 4Q10 | 3Q10 | 2Q11 | 3Q10 | 2011 | 2010 | 2010 | |||||||||||||||||||||||||||||||
CREDIT DATA AND QUALITY STATISTICS |
||||||||||||||||||||||||||||||||||||||||
Net charge-offs |
$ | 1,027 | $ | 1,069 | $ | 1,199 | $ | 1,970 | $ | 1,397 | (4) | % | (26) | % | $ | 3,295 | $ | 5,251 | (37) | % | ||||||||||||||||||||
Nonaccrual loans: |
||||||||||||||||||||||||||||||||||||||||
Nonaccrual loans retained |
7,579 | 8,088 | 8,278 | 8,568 | 9,601 | (6 | ) | (21 | ) | 7,579 | 9,601 | (21 | ) | |||||||||||||||||||||||||||
Nonaccrual loans held-for-sale and loans
at fair value |
132 | 142 | 150 | 145 | 166 | (7 | ) | (20 | ) | 132 | 166 | (20 | ) | |||||||||||||||||||||||||||
Total nonaccrual loans (a)(b)(c) |
7,711 | 8,230 | 8,428 | 8,713 | 9,767 | (6 | ) | (21 | ) | 7,711 | 9,767 | (21 | ) | |||||||||||||||||||||||||||
Nonperforming assets (a)(b)(c) |
8,576 | 9,175 | 9,632 | 9,999 | 11,155 | (7 | ) | (23 | ) | 8,576 | 11,155 | (23 | ) | |||||||||||||||||||||||||||
Allowance for loan losses |
15,479 | 15,479 | 15,554 | 15,554 | 15,106 | — | 2 | 15,479 | 15,106 | 2 | ||||||||||||||||||||||||||||||
Net charge-off rate (d) |
1.71 | % | 1.76 | % | 1.94 | % | 3.04 | % | 2.10 | % | 1.80 | % | 2.57 | % | ||||||||||||||||||||||||||
Net charge-off rate excluding purchased credit-impaired |
||||||||||||||||||||||||||||||||||||||||
(“PCI”) loans (d)(e) |
2.39 | 2.46 | 2.72 | 4.25 | 2.94 | 2.53 | 3.61 | |||||||||||||||||||||||||||||||||
Allowance for loan losses to ending loans retained (d) |
6.57 | 6.42 | 6.29 | 6.13 | 5.80 | 6.57 | 5.80 | |||||||||||||||||||||||||||||||||
Allowance
for loan losses to ending loans retained excluding PCI loans (d)(e) |
6.26 | 6.12 | 6.02 | 5.86 | 6.61 | 6.26 | 6.61 | |||||||||||||||||||||||||||||||||
Allowance
for loan losses to nonaccrual loans retained (a)(d)(e) |
139 | 130 | 128 | 124 | 128 | 139 | 128 | |||||||||||||||||||||||||||||||||
Nonaccrual loans to total loans |
3.10 | 3.23 | 3.25 | 3.24 | 3.57 | 3.10 | 3.57 | |||||||||||||||||||||||||||||||||
Nonaccrual loans to total loans
excluding PCI loans (a) |
4.25 | 4.43 | 4.47 | 4.45 | 4.91 | 4.25 | 4.91 | |||||||||||||||||||||||||||||||||
| (a) | Excludes PCI loans that were acquired as part of the Washington Mutual transaction, which are accounted for on a pool basis. Since each pool is accounted for as a single asset with a single composite interest rate and an aggregate expectation of cash flows, the past-due status of the pools, or that of the individual loans within the pools, is not meaningful. Because the Firm is recognizing interest income on each pool of loans, they are all considered to be performing. | |
| (b) | Certain of these loans are classified as trading assets on the Consolidated Balance Sheets. | |
| (c) | At September 30, 2011, June 30, 2011, March 31, 2011, December 31, 2010 and September 30, 2010, nonperforming assets excluded: (1) mortgage loans insured by U.S. government agencies of $9.5 billion, $9.1 billion, $8.8 billion, $9.4 billion and $9.2 billion, respectively, that are 90 or more days past due; and (2) real estate owned insured by U.S. government agencies of $2.4 billion, $2.4 billion, $2.3 billion, $1.9 billion and $1.7 billion, respectively. These amounts are excluded as reimbursement of insured amounts is proceeding normally. | |
| (d) | Loans held-for-sale and loans accounted for at fair value were excluded when calculating the allowance coverage ratio and the net charge-off rate. | |
| (e) | Excludes the impact of PCI loans that were acquired as part of the Washington Mutual transaction. These loans were accounted for at fair value on the acquisition date, which incorporated management’s estimate, as of that date, of credit losses over the remaining life of the portfolio. An allowance for loan losses of $4.9 billion, $4.9 billion, $4.9 billion, $4.9 billion and $2.8 billion was recorded for these loans at September 30, 2011, June 30, 2011, March 31, 2011, December 31, 2010 and September 30, 2010, respectively, which was also excluded from the applicable ratios. To date, no charge-offs have been recorded for these loans. |
Page 14
| JPMORGAN CHASE & CO. RETAIL FINANCIAL SERVICES FINANCIAL HIGHLIGHTS, CONTINUED (in millions, except ratio data and where otherwise noted) |
|
| QUARTERLY TRENDS | NINE MONTHS ENDED SEPTEMBER 30, | |||||||||||||||||||||||||||||||||||||||
| 3Q11 Change | 2011 Change | |||||||||||||||||||||||||||||||||||||||
| 3Q11 | 2Q11 | 1Q11 | 4Q10 | 3Q10 | 2Q11 | 3Q10 | 2011 | 2010 | 2010 | |||||||||||||||||||||||||||||||
CONSUMER & BUSINESS BANKING |
||||||||||||||||||||||||||||||||||||||||
Noninterest revenue |
$ | 1,952 | $ | 1,889 | $ | 1,757 | $ | 1,716 | $ | 1,692 | 3 | % | 15 | % | $ | 5,598 | $ | 5,128 | 9 | % | ||||||||||||||||||||
Net interest income |
2,730 | 2,706 | 2,659 | 2,693 | 2,744 | 1 | (1 | ) | 8,095 | 8,191 | (1 | ) | ||||||||||||||||||||||||||||
Total net revenue |
4,682 | 4,595 | 4,416 | 4,409 | 4,436 | 2 | 6 | 13,693 | 13,319 | 3 | ||||||||||||||||||||||||||||||
Provision for credit losses |
126 | 42 | 119 | 69 | 173 | 200 | (27 | ) | 287 | 561 | (49 | ) | ||||||||||||||||||||||||||||
Noninterest expense |
2,842 | 2,713 | 2,799 | 2,676 | 2,798 | 5 | 2 | 8,354 | 8,041 | 4 | ||||||||||||||||||||||||||||||
Income before income tax expense |
1,714 | 1,840 | 1,498 | 1,664 | 1,465 | (7 | ) | 17 | 5,052 | 4,717 | 7 | |||||||||||||||||||||||||||||
Net income |
$ | 1,023 | $ | 1,098 | $ | 893 | $ | 952 | $ | 839 | (7 | ) | 22 | $ | 3,014 | $ | 2,700 | 12 | ||||||||||||||||||||||
Overhead ratio |
61 | % | 59 | % | 63 | % | 61 | % | 63 | % | 61 | % | 60 | % | ||||||||||||||||||||||||||
Overhead
ratio excluding core deposit
intangibles (a) |
59 | 58 | 62 | 59 | 62 | 60 | 59 | |||||||||||||||||||||||||||||||||
BUSINESS METRICS
(in billions, except where otherwise noted) |
||||||||||||||||||||||||||||||||||||||||
Business banking origination volume (in millions) |
$ | 1,440 | $ | 1,573 | $ | 1,425 | $ | 1,435 | $ | 1,126 | (8 | ) | 28 | $ | 4,438 | $ | 3,253 | 36 | ||||||||||||||||||||||
End-of-period loans |
17.3 | 17.1 | 17.0 | 16.8 | 16.6 | 1 | 4 | 17.3 | 16.6 | 4 | ||||||||||||||||||||||||||||||
End-of-period deposits: |
||||||||||||||||||||||||||||||||||||||||
Checking |
142.1 | 136.3 | 137.5 | 131.7 | 124.2 | 4 | 14 | 142.1 | 124.2 | 14 | ||||||||||||||||||||||||||||||
Savings |
186.7 | 182.1 | 180.3 | 170.6 | 166.4 | 3 | 12 | 186.7 | 166.4 | 12 | ||||||||||||||||||||||||||||||
Time and other |
39.0 | 42.0 | 44.0 | 46.0 | 48.9 | (7 | ) | (20 | ) | 39.0 | 48.9 | (20 | ) | |||||||||||||||||||||||||||
Total end-of-period deposits |
367.8 | 360.4 | 361.8 | 348.3 | 339.5 | 2 | 8 | 367.8 | 339.5 | 8 | ||||||||||||||||||||||||||||||
Average loans |
17.2 | 17.1 | 16.9 | 16.6 | 16.6 | 1 | 4 | 17.0 | 17.0 | — | ||||||||||||||||||||||||||||||
Average deposits: |
||||||||||||||||||||||||||||||||||||||||
Checking |
137.0 | 136.6 | 132.0 | 126.6 | 123.5 | — | 11 | 135.2 | 122.4 | 10 | ||||||||||||||||||||||||||||||
Savings |
184.6 | 180.9 | 175.1 | 168.7 | 166.2 | 2 | 11 | 180.2 | 165.3 | 9 | ||||||||||||||||||||||||||||||
Time and other |
40.6 | 43.0 | 45.0 | 47.5 | 49.9 | (6 | ) | (19 | ) | 42.9 | 52.4 | (18 | ) | |||||||||||||||||||||||||||
Total average deposits |
362.2 | 360.5 | 352.1 | 342.8 | 339.6 | — | 7 | 358.3 | 340.1 | 5 | ||||||||||||||||||||||||||||||
Deposit margin |
2.82 | % | 2.83 | % | 2.88 | % | 2.96 | % | 3.04 | % | 2.85 | % | 3.01 | % | ||||||||||||||||||||||||||
Average assets |
$ | 30.1 | $ | 29.0 | $ | 29.4 | $ | 29.1 | $ | 28.5 | 4 | 6 | $ | 29.5 | $ | 29.4 | — | |||||||||||||||||||||||
CREDIT DATA AND QUALITY STATISTICS |
||||||||||||||||||||||||||||||||||||||||
Net charge-offs |
126 | 117 | 119 | 169 | 173 | 8 | (27 | ) | 362 | 561 | (35 | ) | ||||||||||||||||||||||||||||
Net charge-off rate |
2.91 | % | 2.74 | % | 2.86 | % | 4.04 | % | 4.13 | % | 2.85 | % | 4.41 | % | ||||||||||||||||||||||||||
Nonperforming assets |
$ | 773 | $ | 784 | $ | 822 | $ | 846 | $ | 913 | (1 | ) | (15 | ) | $ | 773 | $ | 913 | (15 | ) | ||||||||||||||||||||
RETAIL BRANCH BUSINESS METRICS |
||||||||||||||||||||||||||||||||||||||||
Investment sales volume |
5,102 | 6,334 | 6,584 | 6,069 | 5,798 | (19 | ) | (12 | ) | 18,020 | 17,510 | 3 | ||||||||||||||||||||||||||||
Client investment assets |
132,255 | 140,285 | 138,150 | 133,114 | 127,743 | (6 | ) | 4 | 132,255 | 127,743 | 4 | |||||||||||||||||||||||||||||
% managed accounts |
23 | % | 23 | % | 22 | % | 20 | % | 18 | % | 23 | % | 18 | % | ||||||||||||||||||||||||||
Number of: |
||||||||||||||||||||||||||||||||||||||||
Branches |
5,396 | 5,340 | 5,292 | 5,268 | 5,192 | 1 | 4 | 5,396 | 5,192 | 4 | ||||||||||||||||||||||||||||||
Chase Private Client branch locations |
139 | 16 | 16 | 16 | 16 | NM | NM | 139 | 16 | NM | ||||||||||||||||||||||||||||||
ATMs |
16,708 | 16,443 | 16,265 | 16,145 | 15,815 | 2 | 6 | 16,708 | 15,815 | 6 | ||||||||||||||||||||||||||||||
Personal bankers |
24,205 | 23,308 | 21,875 | 21,715 | 21,438 | 4 | 13 | 24,205 | 21,438 | 13 | ||||||||||||||||||||||||||||||
Sales specialists |
7,891 | 7,630 | 7,336 | 7,196 | 7,123 | 3 | 11 | 7,891 | 7,123 | 11 | ||||||||||||||||||||||||||||||
Active online customers (in thousands) |
18,372 | 18,085 | 18,318 | 17,744 | 17,167 | 2 | 7 | 18,372 | 17,167 | 7 | ||||||||||||||||||||||||||||||
Active mobile customers (in thousands) |
7,266 | 6,608 | 6,048 | 5,354 | 4,600 | 10 | 58 | 7,266 | 4,600 | 58 | ||||||||||||||||||||||||||||||
Chase Private Clients |
11,711 | 5,807 | 4,829 | 4,242 | 3,890 | 102 | 201 | 11,711 | 3,890 | 201 | ||||||||||||||||||||||||||||||
Checking accounts (in thousands) |
26,541 | 26,266 | 26,622 | 27,252 | 27,014 | 1 | (2 | ) | 26,541 | 27,014 | (2 | ) | ||||||||||||||||||||||||||||
| (a) | Consumer & Business Banking uses the overhead ratio (excluding the amortization of CDI), a non-GAAP financial measure, to evaluate the underlying expense trends of the business. Including CDI amortization expense in the overhead ratio calculation would result in a higher overhead ratio in the earlier years and a lower overhead ratio in later years; this method would therefore result in an improving overhead ratio over time, all things remaining equal. This non-GAAP ratio excludes Consumer & Business Banking’s CDI amortization expense related to prior business combination transactions of $60 million, $60 million, $60 million, $68 million and $69 million for the three months ended September 30, 2011, June 30, 2011, March 31, 2011, December 31, 2010 and September 30, 2010, respectively, and $180 million and $208 million for the nine months ended September 30, 2011 and 2010, respectively. |
Page 15
| JPMORGAN CHASE & CO. RETAIL FINANCIAL SERVICES FINANCIAL HIGHLIGHTS, CONTINUED (in millions, except ratio data and where otherwise noted) |
|
| QUARTERLY TRENDS | NINE MONTHS ENDED SEPTEMBER 30, |
|||||||||||||||||||||||||||||||||||||||
| 3Q11 Change | 2011 Change | |||||||||||||||||||||||||||||||||||||||
| 3Q11 | 2Q11 | 1Q11 | 4Q10 | 3Q10 | 2Q11 | 3Q10 | 2011 | 2010 | 2010 | |||||||||||||||||||||||||||||||
MORTGAGE PRODUCTION AND SERVICING |
||||||||||||||||||||||||||||||||||||||||
Mortgage fees and related income |
$ | 1,380 | $ | 1,100 | $ | (489 | ) | $ | 1,609 | $ | 705 | 25 | % | 96 | % | $ | 1,991 | $ | 2,246 | (11) | % | |||||||||||||||||||
Other noninterest revenue |
118 | 106 | 104 | 108 | 116 | 11 | 2 | 328 | 305 | 8 | ||||||||||||||||||||||||||||||
Net interest income |
204 | 124 | 271 | 244 | 232 | 65 | (12 | ) | 599 | 660 | (9 | ) | ||||||||||||||||||||||||||||
Total net revenue |
1,702 | 1,330 | (114 | ) | 1,961 | 1,053 | 28 | 62 | 2,918 | 3,211 | (9 | ) | ||||||||||||||||||||||||||||
Provision for credit losses |
2 | (2 | ) | 4 | 12 | 27 | NM | (93 | ) | 4 | 46 | (91 | ) | |||||||||||||||||||||||||||
Noninterest expense |
1,360 | 2,187 | 1,746 | 1,382 | 982 | (38 | ) | 38 | 5,293 | 2,757 | 92 | |||||||||||||||||||||||||||||
Income/(loss) before income tax expense/(benefit) |
340 | (855 | ) | (1,864 | ) | 567 | 44 | NM | NM | (2,379 | ) | 408 | NM | |||||||||||||||||||||||||||
Net income/(loss) |
$ | 205 | $ | (649 | ) | $ | (1,130 | ) | $ | 330 | $ | 25 | NM | NM | $ | (1,574 | ) | $ | 239 | NM | ||||||||||||||||||||
Overhead ratio |
80 | % | 164 | % | NM | % | 70 | % | 93 | % | 181 | % | 86 | % | ||||||||||||||||||||||||||
FUNCTIONAL RESULTS |
||||||||||||||||||||||||||||||||||||||||
Production |
||||||||||||||||||||||||||||||||||||||||
Production-related revenue, excl. repurchase losses |
$ | 1,304 | $ | 966 | $ | 897 | $ | 1,338 | $ | 1,448 | 35 | (10 | ) | $ | 3,167 | $ | 2,971 | 7 | ||||||||||||||||||||||
Production expense |
497 | 457 | 424 | 436 | 434 | 9 | 15 | 1,378 | 1,177 | 17 | ||||||||||||||||||||||||||||||
Income, excluding repurchase losses |
807 | 509 | 473 | 902 | 1,014 | 59 | (20 | ) | 1,789 | 1,794 | — | |||||||||||||||||||||||||||||
Repurchase losses |
(314 | ) | (223 | ) | (420 | ) | (349 | ) | (1,464 | ) | (41 | ) | 79 | (957 | ) | (2,563 | ) | 63 | ||||||||||||||||||||||
Income/(loss) before income tax expense/(benefit) |
493 | 286 | 53 | 553 | (450 | ) | 72 | NM | 832 | (769 | ) | NM | ||||||||||||||||||||||||||||
Servicing |
||||||||||||||||||||||||||||||||||||||||
Servicing-related revenue |
1,154 | 1,040 | 1,208 | 1,237 | 1,282 | 11 | (10 | ) | 3,402 | 3,771 | (10 | ) | ||||||||||||||||||||||||||||
MSR asset amortization |
(457 | ) | (478 | ) | (563 | ) | (555 | ) | (604 | ) | 4 | 24 | (1,498 | ) | (1,829 | ) | 18 | |||||||||||||||||||||||
Servicing expense |
866 | 1,728 | 1,326 | 958 | 574 | (50 | ) | 51 | 3,920 | 1,626 | ||||||||||||||||||||||||||||||
Income/(loss), excluding MSR risk management |
(169 | ) | (1,166 | ) | (681 | ) | (276 | ) | 104 | 86 | NM | (2,016 | ) | 316 | NM | |||||||||||||||||||||||||
MSR risk management (a) |
16 | 25 | (1,236 | ) | 290 | 390 | (36 | ) | (96 | ) | (1,195 | ) | 861 | NM | ||||||||||||||||||||||||||
Income/(loss) before income tax expense/(benefit) |
(153 | ) | (1,141 | ) | (1,917 | ) | 14 | 494 | 87 | NM | (3,211 | ) | 1,177 | NM | ||||||||||||||||||||||||||
Net Income/(loss) |
$ | 205 | $ | (649 | ) | $ | (1,130 | ) | $ | 330 | $ | 25 | NM | NM | $ | (1,574 | ) | $ | 239 | NM | ||||||||||||||||||||
SELECTED BALANCE SHEET DATA (in billions) |
||||||||||||||||||||||||||||||||||||||||
End-of-period loans: |
||||||||||||||||||||||||||||||||||||||||
Prime mortgage, including option ARMs (b)(c) |
$ | 14.8 | $ | 14.3 | $ | 14.1 | $ | 14.2 | $ | 13.8 | 3 | 7 | $ | 14.8 | $ | 13.8 | 7 | |||||||||||||||||||||||
Loans held-for-sale and loans at fair value (d) |
13.2 | 13.6 | 12.2 | 14.9 | 13.0 | (3 | ) | 2 | 13.2 | 13.0 | 2 | |||||||||||||||||||||||||||||
Average loans: |
||||||||||||||||||||||||||||||||||||||||
Prime mortgage, including option ARMs (b)(e) |
14.4 | 14.1 | 14.0 | 13.9 | 13.6 | 2 | 6 | 14.2 | 13.3 | 7 | ||||||||||||||||||||||||||||||
Loans held-for-sale and loans at fair value (d) |
16.6 | 14.6 | 17.5 | 18.9 | 15.6 | 14 | 6 | 16.2 | 14.2 | 14 | ||||||||||||||||||||||||||||||
Average assets |
59.7 | 58.1 | 61.4 | 62.7 | 58.5 | 3 | 2 | 59.7 | 56.1 | 6 | ||||||||||||||||||||||||||||||
Repurchase reserve (ending) |
3.2 | 3.2 | 3.2 | 3.0 | 3.0 | — | 7 | 3.2 | 3.0 | 7 | ||||||||||||||||||||||||||||||
CREDIT DATA AND QUALITY STATISTICS |
||||||||||||||||||||||||||||||||||||||||
Net charge-offs/(recoveries): |
||||||||||||||||||||||||||||||||||||||||
Prime mortgage, including option ARMs |
2 | (2 | ) | 4 | 12 | 10 | NM | (80 | ) | 4 | 29 | (86 | ) | |||||||||||||||||||||||||||
Net charge-off/(recovery) rate: |
||||||||||||||||||||||||||||||||||||||||
Prime mortgage, including option ARMs (e) |
0.06 | % | (0.06) | % | 0.12 | % | 0.35 | % | 0.30 | % | 0.04 | % | 0.30 | % | ||||||||||||||||||||||||||
30+ day delinquency rate (c)(f) |
3.35 | 3.30 | 3.21 | 3.44 | 3.40 | 3.35 | 3.40 | |||||||||||||||||||||||||||||||||
Nonperforming assets (g) |
$ | 691 | $ | 662 | $ | 658 | $ | 729 | $ | 786 | 4 | (12 | ) | $ | 691 | $ | 786 | (12 | ) | |||||||||||||||||||||
| (a) | MSR risk management predominantly includes (a) changes in the MSR asset fair value due to changes in market interest rates and other modeled inputs and assumptions, and (b) changes in the value of the derivatives used to hedge the MSR asset. For the nine months ended September 30, 2011, the Firm recognized a loss of $6.3 billion due to a decrease in the fair value of the MSR asset, which included $1.1 billion related to revised cost to service assumptions incorporated in the MSR valuation in the first quarter of 2011. The remaining loss of $5.2 billion is predominantly the result of a decrease in interest rates. Offsetting this loss, the Firm recognized a $5.1 billion gain on the derivatives used to hedge the MSR asset during the nine months ended September 30, 2011. | |
| (b) | Predominantly represents prime loans repurchased from Government National Mortgage Association (“Ginnie Mae”) pools, which are insured by U.S. government agencies. | |
| (c) | End-of-period loans owned includes loans held-for-sale of $131 million, $221 million, $188 million, $154 million and $428 million at September 30, 2011, June 30, 2011, March 31, 2011, December 31, 2010 and September 30, 2010, respectively. No allowance for loan losses was recorded for these loans. These amounts are excluded when calculating the 30+ day delinquency rate. | |
| (d) | Loans at fair value consist of prime mortgages originated with the intent to sell that are accounted for at fair value and classified as trading assets on the Consolidated Balance Sheets. These loans totaled $13.0 billion, $13.3 billion, $12.0 billion, $14.7 billion and $12.6 billion at September 30, 2011, June 30, 2011, March 31, 2011, December 31, 2010 and September 30, 2010, respectively. Average balances of these loans totaled $16.5 billion, $14.5 billion, $17.4 billion, $18.7 billion and $15.3 billion for the three months ended September 30, 2011, June 30, 2011, March 31, 2011, December 31, 2010 and September 30, 2010, respectively, and $16.1 billion and $14.0 billion for the nine months ended September 30, 2011 and 2010, respectively. | |
| (e) | Average loans owned includes loans held-for-sale of $108 million, $76 million, $133 million, $185 million and $226 million for the three months ended September 30, 2011, June 30, 2011, March 31, 2011, December 31, 2010 and September 30, 2010, respectively, and $105 million and $210 million for the nine months ended September 30, 2011 and 2010. No allowance for loan losses was recorded for these loans. These amounts are excluded when calculating the net charge-off rate. | |
| (f) | Excludes mortgage loans insured by U.S. government agencies of $10.5 billion, $10.1 billion, $9.5 billion, $10.3 billion and $10.2 billion at September 30, 2011, June 30, 2011, March 31, 2011, December 31, 2010 and September 30, 2010, respectively, that are 30 or more days past due. These amounts are excluded as reimbursement of insured amounts is proceeding normally. | |
| (g) | At September 30, 2011, June 30, 2011, March 31, 2011, December 31, 2010 and September 30, 2010, nonperforming assets excluded: (1) mortgage loans insured by U.S. government agencies of $9.5 billion, $9.1 billion, $8.8 billion, $9.4 billion and $9.2 billion, respectively, that are 90 or more days past due; and (2) real estate owned insured by U.S. government agencies of $2.4 billion, $2.4 billion, $2.3 billion, $1.9 billion and $1.7 billion, respectively. These amounts are excluded as reimbursement of insured amounts is proceeding normally. |
Page 16
| JPMORGAN CHASE & CO. RETAIL FINANCIAL SERVICES FINANCIAL HIGHLIGHTS, CONTINUED (in billions, except ratio data) |
|
| QUARTERLY TRENDS | NINE MONTHS ENDED SEPTEMBER 30, |
|||||||||||||||||||||||||||||||||||||||
| 3Q11 Change | 2011 Change | |||||||||||||||||||||||||||||||||||||||
| 3Q11 | 2Q11 | 1Q11 | 4Q10 | 3Q10 | 2Q11 | 3Q10 | 2011 | 2010 | 2010 | |||||||||||||||||||||||||||||||
MORTGAGE PRODUCTION AND SERVICING
(continued) |
||||||||||||||||||||||||||||||||||||||||
BUSINESS METRICS |
||||||||||||||||||||||||||||||||||||||||
Origination volume by channel |
||||||||||||||||||||||||||||||||||||||||
Retail |
$ | 22.4 | $ | 20.7 | $ | 21.0 | $ | 22.9 | $ | 19.2 | 8 | % | 17 | % | $ | 64.1 | $ | 45.9 | 40 | % | ||||||||||||||||||||
Wholesale (a) |
0.1 | 0.1 | 0.2 | 0.3 | 0.2 | — | (50 | ) | 0.4 | 1.0 | (60 | ) | ||||||||||||||||||||||||||||
Correspondent (a) |
13.4 | 10.3 | 13.5 | 25.5 | 19.1 | 30 | (30 | ) | 37.2 | 49.8 | (25 | ) | ||||||||||||||||||||||||||||
CNT (negotiated transactions) |
0.9 | 2.9 | 1.5 | 2.1 | 2.4 | (69 | ) | (63 | ) | 5.3 | 8.1 | (35 | ) | |||||||||||||||||||||||||||
Total origination volume |
36.8 | 34.0 | 36.2 | 50.8 | 40.9 | 8 | (10 | ) | 107.0 | 104.8 | 2 | |||||||||||||||||||||||||||||
Application volume by channel |
||||||||||||||||||||||||||||||||||||||||
Retail |
37.7 | 33.6 | 31.3 | 32.4 | 34.6 | 12 | 9 | 102.6 | 82.7 | 24 | ||||||||||||||||||||||||||||||
Wholesale (a) |
0.2 | 0.3 | 0.3 | 0.4 | 0.6 | (33 | ) | (67 | ) | 0.8 | 2.0 | (60 | ) | |||||||||||||||||||||||||||
Correspondent (a) |
20.2 | 14.9 | 13.6 | 24.9 | 30.7 | 36 | (34 | ) | 48.7 | 72.4 | (33 | ) | ||||||||||||||||||||||||||||
Total application volume |
58.1 | 48.8 | 45.2 | 57.7 | 65.9 | 19 | (12 | ) | 152.1 | 157.1 | (3 | ) | ||||||||||||||||||||||||||||
Third-party mortgage loans serviced (ending) |
924.5 | 940.8 | 955.0 | 967.5 | 1,012.7 | (2 | ) | (9 | ) | 924.5 | 1,012.7 | (9 | ) | |||||||||||||||||||||||||||
Third-party mortgage loans serviced (average) |
931.4 | 947.0 | 958.7 | 981.7 | 1,028.6 | (2 | ) | (9 | ) | 945.7 | 1,056.3 | (10 | ) | |||||||||||||||||||||||||||
MSR net carrying value (ending) (b) |
7.8 | 12.2 | 13.1 | 13.6 | 10.3 | (36 | ) | (24 | ) | 7.8 | 10.3 | (24 | ) | |||||||||||||||||||||||||||
Ratio of MSR net carrying value (ending) to third-party
mortgage loans serviced (ending) |
0.84 | % | 1.30 | % | 1.37 | % | 1.41 | % | 1.02 | % | 0.84 | % | 1.02 | % | ||||||||||||||||||||||||||
Ratio of annualized loan servicing revenue to third-party
mortgage loans serviced (average) |
0.44 | 0.43 | 0.45 | 0.46 | 0.44 | 0.44 | 0.44 | |||||||||||||||||||||||||||||||||
MSR revenue multiple (c) |
1.91x | 3.02x | 3.04x | 3.07x | 2.32x | 1.91x | 2.32x | |||||||||||||||||||||||||||||||||
| (a) | Includes rural housing loans sourced through brokers and correspondents, which are underwritten under Rural Housing Authority. | |
| (b) | The fair value of the MSR asset decreased $5.8 billion during the nine months ended September 30, 2011, which included $1.1 billion related to revised cost to service assumptions incorporated in the MSR valuation in the first quarter of 2011. The remaining $4.7 billion decline in the MSR fair value represents a $5.2 billion loss, predominantly due to a decrease in interest rates, partially offset by new capitalization, net of amortization. The $5.2 billion loss was offset by $5.1 billion of gains on the derivatives used to hedge the MSR asset; these derivatives are recorded separately from the MSR asset. | |
| (c) | Represents the ratio of MSR net carrying value (ending) to third-party mortgage loans serviced (ending) divided by the ratio of annualized loan servicing revenue to third-party mortgage loans serviced (average). |
Page 17
| JPMORGAN CHASE & CO. RETAIL FINANCIAL SERVICES FINANCIAL HIGHLIGHTS, CONTINUED (in millions, except ratio data and where otherwise noted) |
|
| QUARTERLY TRENDS | NINE
MONTHS ENDED SEPTEMBER 30, |
||||||||||||||||||||||||||||||||||||||||
| 3Q11 Change | 2011 Change | ||||||||||||||||||||||||||||||||||||||||
| 3Q11 | 2Q11 | 1Q11 | 4Q10 | 3Q10 | 2Q11 | 3Q10 | 2011 | 2010 | 2010 | ||||||||||||||||||||||||||||||||
REAL ESTATE PORTFOLIOS |
|||||||||||||||||||||||||||||||||||||||||
Noninterest revenue |
$ | 23 | $ | 20 | $ | 8 | $ | 10 | $ | 21 | 15 | % | 10 | % | $ | 51 | $ | 105 | (51) | % | |||||||||||||||||||||
Net interest income |
1,128 | 1,197 | 1,156 | 1,319 | 1,304 | (6 | ) | (13 | ) | 3,481 | 4,113 | (15 | ) | ||||||||||||||||||||||||||||
Total net revenue |
1,151 | 1,217 | 1,164 | 1,329 | 1,325 | (5 | ) | (13 | ) | 3,532 | 4,218 | (16 | ) | ||||||||||||||||||||||||||||
Provision for credit losses |
899 | 954 | 1,076 | 2,337 | 1,197 | (6 | ) | (25 | ) | 2,929 | 5,894 | (50 | ) | ||||||||||||||||||||||||||||
Noninterest expense |
363 | 371 | 355 | 413 | 390 | (2 | ) | (7 | ) | 1,089 | 1,214 | (10 | ) | ||||||||||||||||||||||||||||
Income/(loss) before income tax expense/(benefit) |
(111 | ) | (108 | ) | (267 | ) | (1,421 | ) | (262 | ) | (3 | ) | 58 | (486 | ) | (2,890 | ) | 83 | |||||||||||||||||||||||
Net income/(loss) |
$ | (67 | ) | $ | (66 | ) | $ | (162 | ) | $ | (823 | ) | $ | (148 | ) | (2 | ) | 55 | $ | (295 | ) | $ | (1,670 | ) | 82 | ||||||||||||||||
Overhead ratio |
32 | % | 30 | % | 30 | % | 31 | % | 29 | % | 31 | % | 29 | % | |||||||||||||||||||||||||||
BUSINESS METRICS (in billions) |
|||||||||||||||||||||||||||||||||||||||||
LOANS EXCLUDING PCI LOANS (a) |
|||||||||||||||||||||||||||||||||||||||||
End-of-period loans owned: |
|||||||||||||||||||||||||||||||||||||||||
Home equity |
$ | 80.3 | $ | 82.7 | $ | 85.3 | $ | 88.4 | $ | 91.7 | (3 | ) | (12 | ) | $ | 80.3 | $ | 91.7 | (12 | ) | |||||||||||||||||||||
Prime mortgage, including option ARMs |
45.5 | 47.0 | 48.5 | 49.8 | 51.3 | (3 | ) | (11 | ) | 45.5 | 51.3 | (11 | ) | ||||||||||||||||||||||||||||
Subprime mortgage |
10.0 | 10.4 | 10.8 | 11.3 | 12.0 | (4 | ) | (17 | ) | 10.0 | 12.0 | (17 | ) | ||||||||||||||||||||||||||||
Other |
0.7 | 0.8 | 0.8 | 0.8 | 0.9 | (13 | ) | (22 | ) | 0.7 | 0.9 | (22 | ) | ||||||||||||||||||||||||||||
Total end-of-period loans owned |
$ | 136.5 | $ | 140.9 | $ | 145.4 | $ | 150.3 | $ | 155.9 | (3 | ) | (12 | ) | $ | 136.5 | $ | 155.9 | (12 | ) | |||||||||||||||||||||
Average loans owned: |
|||||||||||||||||||||||||||||||||||||||||
Home equity |
$ | 81.6 | $ | 84.0 | $ | 86.9 | $ | 90.2 | $ | 93.3 | (3 | ) | (13 | ) | $ | 84.1 | $ | 96.4 | (13 | ) | |||||||||||||||||||||
Prime mortgage, including option ARMs |
46.2 | 47.6 | 49.3 | 50.7 | 52.2 | (3 | ) | (11 | ) | 47.7 | 54.3 | (12 | ) | ||||||||||||||||||||||||||||
Subprime mortgage |
10.3 | 10.7 | 11.1 | 11.8 | 12.3 | (4 | ) | (16 | ) | 10.7 | 13.0 | (18 | ) | ||||||||||||||||||||||||||||
Other |
0.7 | 0.8 | 0.8 | 0.9 | 1.0 | (13 | ) | (30 | ) | 0.8 | 1.0 | (20 | ) | ||||||||||||||||||||||||||||
Total average loans owned |
$ | 138.8 | $ | 143.1 | $ | 148.1 | $ | 153.6 | $ | 158.8 | (3 | ) | (13 | ) | $ | 143.3 | $ | 164.7 | (13 | ) | |||||||||||||||||||||
PCI LOANS (a) |
|||||||||||||||||||||||||||||||||||||||||
End-of-period loans owned: |
|||||||||||||||||||||||||||||||||||||||||
Home equity |
$ | 23.1 | $ | 23.5 | $ | 24.0 | $ | 24.5 | $ | 25.0 | (2 | ) | (8 | ) | $ | 23.1 | $ | 25.0 | (8 | ) | |||||||||||||||||||||
Prime mortgage |
15.6 | 16.2 | 16.7 | 17.3 | 17.9 | (4 | ) | (13 | ) | 15.6 | 17.9 | (13 | ) | ||||||||||||||||||||||||||||
Subprime mortgage |
5.1 | 5.2 | 5.3 | 5.4 | 5.5 | (2 | ) | (7 | ) | 5.1 | 5.5 | (7 | ) | ||||||||||||||||||||||||||||
Option ARMs |
23.3 | 24.1 | 24.8 | 25.6 | 26.4 | (3 | ) | (12 | ) | 23.3 | 26.4 | (12 | ) | ||||||||||||||||||||||||||||
Total end-of-period loans owned |
$ | 67.1 | $ | 69.0 | $ | 70.8 | $ | 72.8 | $ | 74.8 | (3 | ) | (10 | ) | $ | 67.1 | $ | 74.8 | (10 | ) | |||||||||||||||||||||
Average loans owned: |
|||||||||||||||||||||||||||||||||||||||||
Home equity |
$ | 23.3 | $ | 23.7 | $ | 24.2 | $ | 24.7 | $ | 25.2 | (2 | ) | (8 | ) | $ | 23.7 | $ | 25.7 | (8 | ) | |||||||||||||||||||||
Prime mortgage |
15.9 | 16.5 | 17.0 | 17.6 | 18.2 | (4 | ) | (13 | ) | 16.5 | 18.8 | (12 | ) | ||||||||||||||||||||||||||||
Subprime mortgage |
5.1 | 5.2 | 5.3 | 5.4 | 5.6 | (2 | ) | (9 | ) | 5.2 | 5.8 | (10 | ) | ||||||||||||||||||||||||||||
Option ARMs |
23.7 | 24.4 | 25.1 | 25.9 | 26.7 | (3 | ) | (11 | ) | 24.4 | 27.7 | (12 | ) | ||||||||||||||||||||||||||||
Total average loans owned |
$ | 68.0 | $ | 69.8 | $ | 71.6 | $ | 73.6 | $ | 75.7 | (3 | ) | (10 | ) | $ | 69.8 | $ | 78.0 | (11 | ) | |||||||||||||||||||||
TOTAL REAL ESTATE PORTFOLIOS |
|||||||||||||||||||||||||||||||||||||||||
End-of-period loans owned: |
|||||||||||||||||||||||||||||||||||||||||
Home equity |
$ | 103.4 | $ | 106.2 | $ | 109.3 | $ | 112.9 | $ | 116.7 | (3 | ) | (11 | ) | $ | 103.4 | $ | 116.7 | (11 | ) | |||||||||||||||||||||
Prime mortgage, including option ARMs |
84.4 | 87.3 | 90.0 | 92.7 | 95.6 | (3 | ) | (12 | ) | 84.4 | 95.6 | (12 | ) | ||||||||||||||||||||||||||||
Subprime mortgage |
15.1 | 15.6 | 16.1 | 16.7 | 17.5 | (3 | ) | (14 | ) | 15.1 | 17.5 | (14 | ) | ||||||||||||||||||||||||||||
Other |
0.7 | 0.8 | 0.8 | 0.8 | 0.9 | (13 | ) | (22 | ) | 0.7 | 0.9 | (22 | ) | ||||||||||||||||||||||||||||
Total end-of-period loans owned |
$ | 203.6 | $ | 209.9 | $ | 216.2 | $ | 223.1 | $ | 230.7 | (3 | ) | (12 | ) | $ | 203.6 | $ | 230.7 | (12 | ) | |||||||||||||||||||||
Average loans owned: |
|||||||||||||||||||||||||||||||||||||||||
Home equity |
$ | 104.9 | $ | 107.7 | $ | 111.1 | $ | 114.9 | $ | 118.5 | (3 | ) | (11 | ) | $ | 107.8 | $ | 122.1 | (12 | ) | |||||||||||||||||||||
Prime mortgage, including option ARMs |
85.8 | 88.5 | 91.4 | 94.2 | 97.1 | (3 | ) | (12 | ) | 88.6 | 100.8 | (12 | ) | ||||||||||||||||||||||||||||
Subprime mortgage |
15.4 | 15.9 | 16.4 | 17.2 | 17.9 | (3 | ) | (14 | ) | 15.9 | 18.8 | (15 | ) | ||||||||||||||||||||||||||||
Other |
0.7 | 0.8 | 0.8 | 0.9 | 1.0 | (13 | ) | (30 | ) | 0.8 | 1.0 | (20 | ) | ||||||||||||||||||||||||||||
Total average loans owned |
$ | 206.8 | $ | 212.9 | $ | 219.7 | $ | 227.2 | $ | 234.5 | (3 | ) | (12 | ) | $ | 213.1 | $ | 242.7 | (12 | ) | |||||||||||||||||||||
Average assets |
193.7 | 200.1 | 207.2 | 215.3 | 222.5 | (3 | ) | (13 | ) | 200.3 | 230.9 | (13 | ) | ||||||||||||||||||||||||||||
Home equity origination volume |
0.3 | 0.3 | 0.2 | 0.3 | 0.3 | — | — | 0.8 | 0.9 | (11 | ) | ||||||||||||||||||||||||||||||
| (a) | PCI loans represent loans acquired in the Washington Mutual transaction for which a deterioration in credit quality occurred between the origination date and JPMorgan Chase’s acquisition date. These loans were initially recorded at fair value and accrete interest income over the estimated lives of the loans as long as cash flows are reasonably estimable, even if the underlying loans are contractually past due. |
Page 18
| JPMORGAN CHASE & CO. RETAIL FINANCIAL SERVICES FINANCIAL HIGHLIGHTS, CONTINUED (in millions, except ratio data) |
|
| QUARTERLY TRENDS | NINE MONTHS ENDED SEPTEMBER 30, | |||||||||||||||||||||||||||||||||||||||
| 3Q11 Change | 2011 Change | |||||||||||||||||||||||||||||||||||||||
| 3Q11 | 2Q11 | 1Q11 | 4Q10 | 3Q10 | 2Q11 | 3Q10 | 2011 | 2010 | 2010 | |||||||||||||||||||||||||||||||
REAL ESTATE PORTFOLIOS (continued) |
||||||||||||||||||||||||||||||||||||||||
CREDIT DATA AND QUALITY STATISTICS |
||||||||||||||||||||||||||||||||||||||||
Net charge-offs excluding PCI loans (a)(b) |
||||||||||||||||||||||||||||||||||||||||
Home equity |
$ | 581 | $ | 592 | $ | 720 | $ | 792 | $ | 730 | (2 | )% | (20 | )% | $ | 1,893 | $ | 2,652 | (29) | % | ||||||||||||||||||||
Prime mortgage, including option ARMs |
172 | 198 | 161 | 558 | 266 | (13 | ) | (35 | ) | 531 | 1,015 | (48 | ) | |||||||||||||||||||||||||||
Subprime mortgage |
141 | 156 | 186 | 429 | 206 | (10 | ) | (32 | ) | 483 | 945 | (49 | ) | |||||||||||||||||||||||||||
Other |
5 | 8 | 9 | 10 | 12 | (38 | ) | (58 | ) | 22 | 49 | (55 | ) | |||||||||||||||||||||||||||
Total net charge-offs |
$ | 899 | $ | 954 | $ | 1,076 | $ | 1,789 | $ | 1,214 | (6 | ) | (26 | ) | $ | 2,929 | $ | 4,661 | (37 | ) | ||||||||||||||||||||
Net charge-off rate excluding PCI loans (a)(b) |
||||||||||||||||||||||||||||||||||||||||
Home equity |
2.82 | % | 2.83 | % | 3.36 | % | 3.48 | % | 3.10 | % | 3.01 | % | 3.68 | % | ||||||||||||||||||||||||||
Prime mortgage, including option ARMs |
1.48 | 1.67 | 1.32 | 4.37 | 2.02 | 1.49 | 2.50 | |||||||||||||||||||||||||||||||||
Subprime mortgage |
5.43 | 5.85 | 6.80 | 14.42 | 6.64 | 6.04 | 9.72 | |||||||||||||||||||||||||||||||||
Other |
2.83 | 4.01 | 4.56 | 4.41 | 4.76 | 3.68 | 6.55 | |||||||||||||||||||||||||||||||||
Total net charge-off rate excluding PCI loans |
2.57 | 2.67 | 2.95 | 4.62 | 3.03 | 2.73 | 3.78 | |||||||||||||||||||||||||||||||||
Net charge-off rate — reported |
||||||||||||||||||||||||||||||||||||||||
Home equity |
2.20 | % | 2.20 | % | 2.63 | % | 2.73 | % | 2.44 | % | 2.35 | % | 2.90 | % | ||||||||||||||||||||||||||
Prime mortgage, including option ARMs |
0.80 | 0.90 | 0.71 | 2.35 | 1.09 | 0.80 | 1.35 | |||||||||||||||||||||||||||||||||
Subprime mortgage |
3.63 | 3.94 | 4.60 | 9.90 | 4.57 | 4.06 | 6.72 | |||||||||||||||||||||||||||||||||
Other |
2.83 | 4.01 | 4.56 | 4.41 | 4.76 | 3.68 | 6.55 | |||||||||||||||||||||||||||||||||
Total net charge-off rate — reported |
1.72 | 1.80 | 1.99 | 3.12 | 2.05 | 1.84 | 2.57 | |||||||||||||||||||||||||||||||||
30+ day delinquency rate excluding PCI loans (c) |
5.80 | % | 5.98 | % | 6.22 | % | 6.45 | % | 6.77 | % | 5.80 | % | 6.77 | % | ||||||||||||||||||||||||||
Allowance for loan losses |
$ | 14,659 | $ | 14,659 | $ | 14,659 | $ | 14,659 | $ | 14,111 | — | 4 | $ | 14,659 | $ | 14,111 | 4 | |||||||||||||||||||||||
Nonperforming assets (d) |
7,112 | 7,729 | 8,152 | 8,424 | 9,456 | (8 | ) | (25 | ) | 7,112 | 9,456 | (25 | ) | |||||||||||||||||||||||||||
Allowance for loan losses to ending loans retained |
7.20 | % | 6.98 | % | 6.78 | % | 6.57 | % | 6.12 | % | 7.20 | % | 6.12 | % | ||||||||||||||||||||||||||
Allowance for loan losses to ending loans retained
excluding PCI loans (a) |
7.12 | 6.90 | 6.68 | 6.47 | 7.25 | 7.12 | 7.25 | |||||||||||||||||||||||||||||||||
| (a) | Excludes the impact of PCI loans that were acquired as part of the Washington Mutual transaction. These loans were accounted for at fair value on the acquisition date, which incorporated management’s estimate, as of that date, of credit losses over the remaining life of the portfolio. An allowance for loan losses of $4.9 billion, $4.9 billion, $4.9 billion, $4.9 billion and $2.8 billion was recorded for these loans at September 30, 2011, June 30, 2011, March 31, 2011, December 31, 2010 and September 30, 2010, respectively, which was also excluded from the applicable ratios. To date, no charge-offs have been recorded for these loans. | |
| (b) | Net charge-offs and net charge-off rates for the fourth quarter of 2010 include the effect of $632 million of charge-offs related to an adjustment of the estimated net realizable value of the collateral underlying delinquent residential home loans. Excluding this adjustment, net charge-offs for the fourth quarter of 2010 were $725 million, $240 million and $182 million for the home equity, prime mortgage including option ARMs and subprime mortgage portfolios, respectively. Net charge-off rates excluding this adjustment and excluding PCI loans were 3.19%, 1.88% and 6.12% for the home equity, prime mortgage including option ARMs and subprime mortgage portfolios, respectively. | |
| (c) | The delinquency rate for PCI loans was 24.44%, 26.20%, 27.36%, 28.20% and 28.07% at September 30, 2011, June 30, 2011, March 31, 2011, December 31, 2010 and September 30, 2010, respectively. | |
| (d) | Excludes PCI loans that were acquired as part of the Washington Mutual transaction, which are accounted for on a pool basis. Since each pool is accounted for as a single asset with a single composite interest rate and an aggregate expectation of cash flows, the past-due status of the pools, or that of the individual loans within the pools, is not meaningful. Because the Firm is recognizing interest income on each pool of loans, they are all considered to be performing. |
Page 19
| JPMORGAN CHASE & CO. CARD SERVICES & AUTO FINANCIAL HIGHLIGHTS (in millions, except ratio data and headcount) |
|
| QUARTERLY TRENDS | NINE MONTHS ENDED SEPTEMBER 30, | |||||||||||||||||||||||||||||||||||||||
| 3Q11 Change | 2011 Change | |||||||||||||||||||||||||||||||||||||||
| 3Q11 | 2Q11 | 1Q11 | 4Q10 | 3Q10 | 2Q11 | 3Q10 | 2011 | 2010 | 2010 | |||||||||||||||||||||||||||||||
INCOME STATEMENT (a) |
||||||||||||||||||||||||||||||||||||||||
REVENUE |
||||||||||||||||||||||||||||||||||||||||
Credit card income |
$ | 1,053 | $ | 1,123 | $ | 898 | $ | 928 | $ | 864 | (6 | )% | 22 | % | $ | 3,074 | $ | 2,586 | 19 | % | ||||||||||||||||||||
All other income |
201 | 183 | 149 | 177 | 196 | 10 | 3 | 533 | 587 | (9 | ) | |||||||||||||||||||||||||||||
Noninterest revenue (b) |
1,254 | 1,306 | 1,047 | 1,105 | 1,060 | (4 | ) | 18 | 3,607 | 3,173 | 14 | |||||||||||||||||||||||||||||
Net interest income |
3,521 | 3,455 | 3,744 | 3,967 | 4,025 | 2 | (13 | ) | 10,720 | 12,227 | (12 | ) | ||||||||||||||||||||||||||||
TOTAL NET REVENUE (c) |
4,775 | 4,761 | 4,791 | 5,072 | 5,085 | — | (6 | ) | 14,327 | 15,400 | (7 | ) | ||||||||||||||||||||||||||||
Provision for credit losses |
1,264 | 944 | 353 | 709 | 1,784 | 34 | (29 | ) | 2,561 | 7,861 | (67 | ) | ||||||||||||||||||||||||||||
NONINTEREST EXPENSE |
||||||||||||||||||||||||||||||||||||||||
Compensation expense |
459 | 448 | 459 | 407 | 406 | 2 | 13 | 1,366 | 1,244 | 10 | ||||||||||||||||||||||||||||||
Noncompensation expense |
1,560 | 1,436 | 1,352 | 1,346 | 1,280 | 9 | 22 | 4,348 | 3,714 | 17 | ||||||||||||||||||||||||||||||
Amortization of intangibles |
96 | 104 | 106 | 114 | 106 | (8 | ) | (9 | ) | 306 | 353 | (13 | ) | |||||||||||||||||||||||||||
TOTAL NONINTEREST EXPENSE (d) |
2,115 | 1,988 | 1,917 | 1,867 | 1,792 | 6 | 18 | 6,020 | 5,311 | 13 | ||||||||||||||||||||||||||||||
Income before income tax expense |
1,396 | 1,829 | 2,521 | 2,496 | 1,509 | (24 | ) | (7 | ) | 5,746 | 2,228 | 158 | ||||||||||||||||||||||||||||
Income tax expense |
547 | 719 | 987 | 948 | 583 | (24 | ) | (6 | ) | 2,253 | 904 | 149 | ||||||||||||||||||||||||||||
NET INCOME |
$ | 849 | $ | 1,110 | $ | 1,534 | $ | 1,548 | $ | 926 | (24 | ) | (8 | ) | $ | 3,493 | $ | 1,324 | 164 | |||||||||||||||||||||
FINANCIAL RATIOS (a) |
||||||||||||||||||||||||||||||||||||||||
ROE |
21 | % | 28 | % | 39 | % | 33 | % | 20 | % | 29 | % | 10 | % | ||||||||||||||||||||||||||
Overhead ratio |
44 | 42 | 40 | 37 | 35 | 42 | 34 | |||||||||||||||||||||||||||||||||
SELECTED BALANCE SHEET DATA (period-end) (a) |
||||||||||||||||||||||||||||||||||||||||
Loans: |
||||||||||||||||||||||||||||||||||||||||
Credit Card |
$ | 127,135 | $ | 125,523 | $ | 128,803 | $ | 137,676 | $ | 136,436 | 1 | (7 | ) | $ | 127,135 | $ | 136,436 | (7 | ) | |||||||||||||||||||||
Auto |
46,659 | 46,796 | 47,411 | 48,367 | 48,186 | — | (3 | ) | 46,659 | 48,186 | (3 | ) | ||||||||||||||||||||||||||||
Student |
13,751 | 14,003 | 14,288 | 14,454 | 14,687 | (2 | ) | (6 | ) | 13,751 | 14,687 | (6 | ) | |||||||||||||||||||||||||||
Total loans (e) |
187,545 | 186,322 | 190,502 | 200,497 | 199,309 | 1 | (6 | ) | 187,545 | 199,309 | (6 | ) | ||||||||||||||||||||||||||||
Equity |
16,000 | 16,000 | 16,000 | 18,400 | 18,400 | — | (13 | ) | 16,000 | 18,400 | (13 | ) | ||||||||||||||||||||||||||||
SELECTED BALANCE SHEET DATA (average) (a) |
||||||||||||||||||||||||||||||||||||||||
Total assets |
$ | 199,974 | $ | 198,044 | $ | 204,441 | $ | 205,286 | $ | 207,474 | 1 | (4 | ) | $ | 200,803 | $ | 215,653 | (7 | ) | |||||||||||||||||||||
Loans: |
||||||||||||||||||||||||||||||||||||||||
Credit Card |
126,536 | 125,038 | 132,537 | 135,585 | 140,059 | 1 | (10 | ) | 128,015 | 147,326 | (13 | ) | ||||||||||||||||||||||||||||
Auto |
46,549 | 46,966 | 47,690 | 48,347 | 47,726 | (1 | ) | (2 | ) | 47,064 | 47,353 | (1 | ) | |||||||||||||||||||||||||||
Student |
13,865 | 14,135 | 14,410 | 14,566 | 14,824 | (2 | ) | (6 | ) | 14,135 | 16,410 | (14 | ) | |||||||||||||||||||||||||||
Total loans (f) |
186,950 | 186,139 | 194,637 | 198,498 | 202,609 | — | (8 | ) | 189,214 | 211,089 | (10 | ) | ||||||||||||||||||||||||||||
Equity |
16,000 | 16,000 | 16,000 | 18,400 | 18,400 | — | (13 | ) | 16,000 | 18,400 | (13 | ) | ||||||||||||||||||||||||||||
Headcount (g) |
27,554 | 26,874 | 26,777 | 25,733 | 26,382 | 3 | 4 | 27,554 | 26,382 | 4 | ||||||||||||||||||||||||||||||
| (a) | Effective January 1, 2011, the commercial card business that was previously in TSS was transferred to Card. There is no material impact on the financial data; prior-year periods were not revised. | |
| (b) | Includes commercial card noninterest revenue of $76 million, $75 million and $72 million for the three months ended September 30, 2011, June 30, 2011 and March 31, 2011, respectively, and $223 million for the nine months ended September 30, 2011. | |
| (c) | Total net revenue included tax-equivalent adjustments associated with tax-exempt loans to certain qualified entities of $1 million, $1 million, $1 million and $2 million for the three months ended June 30, 2011, March 31, 2011, December 31, 2010 and September 30, 2010, respectively, and $2 million and $6 million for the nine months ended September 30, 2011 and 2010, respectively. | |
| (d) | Includes commercial card noninterest expense of $76 million, $69 million and $75 million for the three months ended September 30, 2011, June 30, 2011 and March 31, 2011, respectively, and $220 million for the nine months ended September 30, 2011. | |
| (e) | Total period-end loans include loans held-for-sale of $94 million, $4.0 billion, $2.2 billion and $39 million at September 30, 2011, March 31, 2011, December 31, 2010 and September 30, 2010, respectively. | |
| (f) | Total average loans include loans held-for-sale of $1 million, $276 million, $3.0 billion, $593 million and $112 million for the three months ended September 30, 2011, June 30, 2011, March 31, 2011, December 31, 2010 and September 30, 2010, respectively, and $1.1 billion and $1.5 billion for the nine months ended September 30, 2011 and 2010, respectively. | |
| (g) | Headcount includes 1,274 employees related to the transfer of the commercial card business from TSS to Card in the first quarter of 2011. |
Page 20
| JPMORGAN CHASE & CO. CARD SERVICES & AUTO FINANCIAL HIGHLIGHTS, CONTINUED (in millions, except ratio data and where otherwise noted) |
|
| QUARTERLY TRENDS | NINE MONTHS ENDED SEPTEMBER 30, | |||||||||||||||||||||||||||||||||||||||
| 3Q11 Change | 2011 Change | |||||||||||||||||||||||||||||||||||||||
| 3Q11 | 2Q11 | 1Q11 | 4Q10 | 3Q10 | 2Q11 | 3Q10 | 2011 | 2010 | 2010 | |||||||||||||||||||||||||||||||
CREDIT DATA AND QUALITY STATISTICS (a) |
||||||||||||||||||||||||||||||||||||||||
Net charge-offs: |
||||||||||||||||||||||||||||||||||||||||
Credit Card |
$ | 1,499 | $ | 1,810 | $ | 2,226 | $ | 2,671 | $ | 3,133 | (17 | )% | (52 | )% | $ | 5,535 | $ | 11,366 | (51 | )% | ||||||||||||||||||||
Auto |
42 | 19 | 47 | 71 | 67 | 121 | (37 | ) | 108 | 227 | (52 | ) | ||||||||||||||||||||||||||||
Student |
93 | 135 | 80 | 118 | 84 | (31 | ) | 11 | 308 | 269 | 14 | |||||||||||||||||||||||||||||
Total net charge-offs |
1,634 | 1,964 | 2,353 | 2,860 | 3,284 | (17 | ) | (50 | ) | 5,951 | 11,862 | (50 | ) | |||||||||||||||||||||||||||
Net charge-off rate: |
||||||||||||||||||||||||||||||||||||||||
Credit Card (b) |
4.70 | % | 5.82 | % | 6.97 | % | 7.85 | % | 8.87 | % | 5.83 | % | 10.31 | % | ||||||||||||||||||||||||||
Auto |
0.36 | 0.16 | 0.40 | 0.58 | 0.56 | 0.31 | 0.64 | |||||||||||||||||||||||||||||||||
Student (c) |
2.66 | 3.83 | 2.25 | 3.22 | 2.27 | 2.91 | 2.41 | |||||||||||||||||||||||||||||||||
Total net charge-off rate |
3.47 | 4.24 | 4.98 | 5.73 | 6.43 | 4.23 | 7.57 | |||||||||||||||||||||||||||||||||
Delinquency rates |
||||||||||||||||||||||||||||||||||||||||
30+ day delinquency rate: |
||||||||||||||||||||||||||||||||||||||||
Credit Card (d) |
2.90 | 2.98 | 3.57 | 4.14 | 4.57 | 2.90 | 4.57 | |||||||||||||||||||||||||||||||||
Auto |
1.01 | 0.98 | 0.97 | 1.22 | 0.97 | 1.01 | 0.97 | |||||||||||||||||||||||||||||||||
Student (e)(f) |
1.93 | 1.70 | 2.01 | 1.53 | 1.77 | 1.93 | 1.77 | |||||||||||||||||||||||||||||||||
Total 30+ day delinquency rate |
2.36 | 2.38 | 2.79 | 3.23 | 3.49 | 2.36 | 3.49 | |||||||||||||||||||||||||||||||||
90+ day delinquency rate — Credit Card (d) |
1.43 | 1.55 | 1.93 | 2.25 | 2.41 | 1.43 | 2.41 | |||||||||||||||||||||||||||||||||
Nonperforming assets (g) |
$ | 232 | $ | 233 | $ | 275 | $ | 269 | $ | 268 | — | (13 | ) | $ | 232 | $ | 268 | (13 | ) | |||||||||||||||||||||
Allowance for loan losses: |
||||||||||||||||||||||||||||||||||||||||
Credit Card |
7,528 | 8,042 | 9,041 | 11,034 | 13,029 | (6 | ) | (42 | ) | 7,528 | 13,029 | (42 | ) | |||||||||||||||||||||||||||
Auto and Student |
1,009 | 879 | 899 | 899 | 1,048 | 15 | (4 | ) | 1,009 | 1,048 | (4 | ) | ||||||||||||||||||||||||||||
Total allowance for loan losses |
8,537 | 8,921 | 9,940 | 11,933 | 14,077 | (4 | ) | (39 | ) | 8,537 | 14,077 | (39 | ) | |||||||||||||||||||||||||||
Allowance for loan losses to period-end loans: |
||||||||||||||||||||||||||||||||||||||||
Credit Card (d) |
5.93 | % | 6.41 | % | 7.24 | % | 8.14 | % | 9.55 | % | 5.93 | % | 9.55 | % | ||||||||||||||||||||||||||
Auto and Student (e) |
1.67 | 1.45 | 1.46 | 1.43 | 1.67 | 1.67 | 1.67 | |||||||||||||||||||||||||||||||||
Total allowance for loan losses
to period-end loans |
4.55 | 4.79 | 5.33 | 6.02 | 7.06 | 4.55 | 7.06 | |||||||||||||||||||||||||||||||||
BUSINESS METRICS |
||||||||||||||||||||||||||||||||||||||||
Credit Card, excluding Commercial Card (a) |
||||||||||||||||||||||||||||||||||||||||
Sales volume (in billions) |
$ | 87.3 | $ | 85.5 | $ | 77.5 | $ | 85.9 | $ | 79.6 | 2 | 10 | $ | 250.3 | $ | 227.1 | 10 | |||||||||||||||||||||||
New accounts opened |
2.0 | 2.0 | 2.6 | 3.4 | 2.7 | — | (26 | ) | 6.6 | 7.9 | (16 | ) | ||||||||||||||||||||||||||||
Open accounts |
64.3 | 65.4 | (h) | 91.9 | 90.7 | 89.0 | (2 | ) | (28 | ) | 64.3 | 89.0 | (28 | ) | ||||||||||||||||||||||||||
Merchant Services |
||||||||||||||||||||||||||||||||||||||||
Bank card volume (in billions) |
$ | 138.1 | $ | 137.3 | $ | 125.7 | $ | 127.2 | $ | 117.0 | 1 | 18 | $ | 401.1 | $ | 342.1 | 17 | |||||||||||||||||||||||
Total transactions (in billions) |
6.1 | 5.9 | 5.6 | 5.6 | 5.2 | 3 | 17 | 17.6 | 14.9 | 18 | ||||||||||||||||||||||||||||||
Auto and Student |
||||||||||||||||||||||||||||||||||||||||
Origination volume (in billions) |
||||||||||||||||||||||||||||||||||||||||
Auto |
$ | 5.9 | $ | 5.4 | $ | 4.8 | $ | 4.8 | $ | 6.1 | 9 | (3 | ) | $ | 16.1 | $ | 18.2 | (12 | ) | |||||||||||||||||||||
Student |
0.1 | — | 0.1 | — | 0.2 | NM | (50 | ) | 0.2 | 1.9 | (89 | ) | ||||||||||||||||||||||||||||
| (a) | Effective January 1, 2011, the commercial card business that was previously in TSS was transferred to Card. There is no material impact on the financial data; prior-year periods were not revised. The commercial card portfolio is excluded from business metrics and supplemental information where noted. | |
| (b) | Average loans include loans held-for-sale of $1 million, $276 million, $3.0 billion and $586 million for the three months ended September 30, 2011, June 30, 2011, March 31, 2011 and December 31, 2010, respectively, and $1.1 billion for the nine months ended September 30, 2011. These amounts are excluded when calculating the net charge-off rate. | |
| (c) | Average loans included loans held-for-sale of $7 million and $112 million for the three months ended December 31, 2010 and September 30, 2010, respectively, and $1.5 billion for the nine months ended September 30, 2010. These amounts are excluded when calculating the net charge-off rate. | |
| (d) | Period-end loans include loans held-for-sale of $94 million, $4.0 billion and $2.2 billion at September 30, 2011, March 31, 2011 and December 31, 2010, respectively. No allowance for loan losses was recorded for these loans. Loans held-for-sale are excluded when calculating the allowance for loan losses to period-end loans and delinquency rates. | |
| (e) | Period-end loans included loans held-for-sale of $39 million at September 30, 2010. This amount is excluded when calculating the allowance for loan losses to period-end loans and the 30+ day delinquency rate. | |
| (f) | Excludes student loans insured by U.S. government agencies under the Federal Family Education Loan Program (“FFELP”) of $995 million, $968 million, $1.0 billion, $1.1 billion and $1.0 billion at September 30, 2011, June 30, 2011, March 31, 2011, December 31, 2010 and September 30, 2010, respectively, that are 30 or more days past due. These amounts are excluded as reimbursement of insured amounts is proceeding normally. | |
| (g) | Nonperforming assets exclude student loans insured by U.S. government agencies under the FFELP of $567 million, $558 million, $615 million, $625 million and $572 million at September 30, 2011, June 30, 2011, March 31, 2011, December 31, 2010 and September 30, 2010, respectively, that are 90 or more days past due. These amounts are excluded as reimbursement of insured amounts is proceeding normally. | |
| (h) | Reflects the impact of portfolio sales in the second quarter of 2011. |
Page 21
| JPMORGAN CHASE & CO. CARD SERVICES & AUTO FINANCIAL HIGHLIGHTS, CONTINUED (in millions, except ratio data) |
|
| QUARTERLY TRENDS | NINE MONTHS ENDED SEPTEMBER 30, | |||||||||||||||||||||||||||||||||||||||
| 3Q11 Change | 2011 Change | |||||||||||||||||||||||||||||||||||||||
| 3Q11 | 2Q11 | 1Q11 | 4Q10 | 3Q10 | 2Q11 | 3Q10 | 2011 | 2010 | 2010 | |||||||||||||||||||||||||||||||
SUPPLEMENTAL INFORMATION (a)(b) |
||||||||||||||||||||||||||||||||||||||||
Card Services, excluding Washington
Mutual portfolio |
||||||||||||||||||||||||||||||||||||||||
Loans (period-end) |
$ | 115,766 | $ | 113,766 | $ | 116,395 | $ | 123,943 | $ | 121,932 | 2 | % | (5 | )% | $ | 115,766 | $ | 121,932 | (5 | )% | ||||||||||||||||||||
Average loans |
114,940 | 112,984 | 119,411 | 121,493 | 124,933 | 2 | (8 | ) | 115,762 | 130,610 | (11 | ) | ||||||||||||||||||||||||||||
Net interest income (c) |
8.61 | % | 8.60 | % | 9.09 | % | 9.16 | % | 8.98 | % | 8.77 | % | 8.77 | % | ||||||||||||||||||||||||||
Net revenue (c) |
11.73 | 12.01 | 11.57 | 11.78 | 11.33 | 11.77 | 11.04 | |||||||||||||||||||||||||||||||||
Risk adjusted margin (c)(d) |
8.93 | 8.71 | 10.28 | 10.26 | 6.76 | 9.32 | 4.41 | |||||||||||||||||||||||||||||||||
Net charge-off rate (e) |
4.29 | 5.22 | 6.13 | 7.08 | 8.06 | 5.22 | 9.24 | |||||||||||||||||||||||||||||||||
30+ day delinquency rate (f) |
2.62 | 2.71 | 3.22 | 3.66 | 4.13 | 2.62 | 4.13 | |||||||||||||||||||||||||||||||||
90+ day delinquency rate (f) |
1.28 | 1.41 | 1.71 | 1.98 | 2.16 | 1.28 | 2.16 | |||||||||||||||||||||||||||||||||
Card Services, excluding Washington
Mutual and commercial card portfolios |
||||||||||||||||||||||||||||||||||||||||
Loans (period-end) |
$ | 114,207 | $ | 112,366 | $ | 115,016 | $ | 123,943 | $ | 121,932 | 2 | (6 | ) | $ | 114,207 | $ | 121,932 | (6 | ) | |||||||||||||||||||||
Average loans |
113,541 | 111,641 | 118,145 | 121,493 | 124,933 | 2 | (9 | ) | 114,425 | 130,610 | (12 | ) | ||||||||||||||||||||||||||||
Net interest income (c) |
8.79 | % | 8.77 | % | 9.25 | % | 9.16 | % | 8.98 | % | 8.94 | % | 8.77 | % | ||||||||||||||||||||||||||
Net revenue (c) |
11.68 | 11.95 | 11.51 | 11.78 | 11.33 | 11.71 | 11.04 | |||||||||||||||||||||||||||||||||
Risk adjusted margin (c)(d) |
8.84 | 8.61 | 10.21 | 10.26 | 6.76 | 9.23 | 4.41 | |||||||||||||||||||||||||||||||||
Net charge-off rate (e) |
4.34 | 5.28 | 6.20 | 7.08 | 8.06 | 5.28 | 9.24 | |||||||||||||||||||||||||||||||||
30+ day delinquency rate (f) |
2.64 | 2.73 | 3.25 | 3.66 | 4.13 | 2.64 | 4.13 | |||||||||||||||||||||||||||||||||
90+ day delinquency rate (f) |
1.30 | 1.42 | 1.73 | 1.98 | 2.16 | 1.30 | 2.16 | |||||||||||||||||||||||||||||||||
| (a) | Effective January 1, 2011, the commercial card business that was previously in TSS was transferred to Card. There is no material impact on the financial data; prior-year periods were not revised. The commercial card portfolio is excluded from business metrics and supplemental information where noted. | |
| (b) | Supplemental information is provided for Card Services, excluding Washington Mutual and commercial card portfolios and including loans held-for-sale, which are non-GAAP financial measures, to provide more meaningful measures that enable comparability with prior periods. | |
| (c) | As a percentage of average loans. | |
| (d) | Represents total net revenue less provision for credit losses. | |
| (e) | Average loans include loans held-for-sale of $1 million, $276 million, $3.0 billion and $586 million for the three months ended September 30, 2011, June 30, 2011, March 31, 2011 and December 31, 2010, respectively, and $1.1 billion for the nine months ended September 30, 2011. These amounts are included when calculating the net charge-off rate. | |
| (f) | Period-end loans include loans held-for-sale of $94 million, $4.0 billion and $2.2 billion at September 30, 2011, March 31, 2011 and December 31, 2010, respectively. These amounts are included when calculating the delinquency rates. |
Page 22
| JPMORGAN CHASE & CO. COMMERCIAL BANKING FINANCIAL HIGHLIGHTS (in millions, except ratio data) |
|
| QUARTERLY TRENDS | NINE MONTHS ENDED SEPTEMBER 30, | |||||||||||||||||||||||||||||||||||||||
| 3Q11 Change | 2011 Change | |||||||||||||||||||||||||||||||||||||||
| 3Q11 | 2Q11 | 1Q11 | 4Q10 | 3Q10 | 2Q11 | 3Q10 | 2011 | 2010 | 2010 | |||||||||||||||||||||||||||||||
INCOME STATEMENT |
||||||||||||||||||||||||||||||||||||||||
REVENUE |
||||||||||||||||||||||||||||||||||||||||
Lending- and deposit-related fees |
$ | 269 | $ | 281 | $ | 264 | $ | 273 | $ | 269 | (4) | % | — | % | $ | 814 | $ | 826 | (1) | % | ||||||||||||||||||||
Asset management, administration and commissions |
35 | 34 | 35 | 35 | 36 | 3 | (3 | ) | 104 | 109 | (5 | ) | ||||||||||||||||||||||||||||
All other income (a) |
220 | 283 | 203 | 299 | 242 | (22 | ) | (9 | ) | 706 | 658 | 7 | ||||||||||||||||||||||||||||
Noninterest revenue |
524 | 598 | 502 | 607 | 547 | (12 | ) | (4 | ) | 1,624 | 1,593 | 2 | ||||||||||||||||||||||||||||
Net interest income |
1,064 | 1,029 | 1,014 | 1,004 | 980 | 3 | 9 | 3,107 | 2,836 | 10 | ||||||||||||||||||||||||||||||
TOTAL NET REVENUE (b) |
1,588 | 1,627 | 1,516 | 1,611 | 1,527 | (2 | ) | 4 | 4,731 | 4,429 | 7 | |||||||||||||||||||||||||||||
Provision for credit losses |
67 | 54 | 47 | 152 | 166 | 24 | (60 | ) | 168 | 145 | 16 | |||||||||||||||||||||||||||||
NONINTEREST EXPENSE |
||||||||||||||||||||||||||||||||||||||||
Compensation expense |
229 | 219 | 223 | 208 | 210 | 5 | 9 | 671 | 612 | 10 | ||||||||||||||||||||||||||||||
Noncompensation expense |
337 | 336 | 332 | 342 | 341 | — | (1 | ) | 1,005 | 1,002 | — | |||||||||||||||||||||||||||||
Amortization of intangibles |
7 | 8 | 8 | 8 | 9 | (13 | ) | (22 | ) | 23 | 27 | (15 | ) | |||||||||||||||||||||||||||
TOTAL NONINTEREST EXPENSE |
573 | 563 | 563 | 558 | 560 | 2 | 2 | 1,699 | 1,641 | 4 | ||||||||||||||||||||||||||||||
Income before income tax expense |
948 | 1,010 | 906 | 901 | 801 | (6 | ) | 18 | 2,864 | 2,643 | 8 | |||||||||||||||||||||||||||||
Income tax expense |
377 | 403 | 360 | 371 | 330 | (6 | ) | 14 | 1,140 | 1,089 | 5 | |||||||||||||||||||||||||||||
NET INCOME |
$ | 571 | $ | 607 | $ | 546 | $ | 530 | $ | 471 | (6 | ) | 21 | $ | 1,724 | $ | 1,554 | 11 | ||||||||||||||||||||||
Revenue by product: |
||||||||||||||||||||||||||||||||||||||||
Lending (c) |
$ | 857 | $ | 880 | $ | 837 | $ | 749 | $ | 693 | (3 | ) | 24 | $ | 2,574 | $ | 2,000 | 29 | ||||||||||||||||||||||
Treasury services (c) |
572 | 556 | 542 | 659 | 670 | 3 | (15 | ) | 1,670 | 1,973 | (15 | ) | ||||||||||||||||||||||||||||
Investment banking |
116 | 152 | 110 | 126 | 120 | (24 | ) | (3 | ) | 378 | 340 | 11 | ||||||||||||||||||||||||||||
Other |
43 | 39 | 27 | 77 | 44 | 10 | (2 | ) | 109 | 116 | (6 | ) | ||||||||||||||||||||||||||||
Total Commercial Banking revenue |
$ | 1,588 | $ | 1,627 | $ | 1,516 | $ | 1,611 | $ | 1,527 | (2 | ) | 4 | $ | 4,731 | $ | 4,429 | 7 | ||||||||||||||||||||||
IB revenue, gross (d) |
$ | 320 | $ | 442 | $ | 309 | $ | 347 | $ | 344 | (28 | ) | (7 | ) | $ | 1,071 | $ | 988 | 8 | |||||||||||||||||||||
Revenue by client segment: |
||||||||||||||||||||||||||||||||||||||||
Middle Market Banking |
$ | 791 | $ | 789 | $ | 755 | $ | 781 | $ | 766 | — | 3 | $ | 2,335 | $ | 2,279 | 2 | |||||||||||||||||||||||
Commercial Term Lending |
297 | 286 | 286 | 301 | 256 | 4 | 16 | 869 | 722 | 20 | ||||||||||||||||||||||||||||||
Corporate Client Banking (e) |
306 | 339 | 290 | 302 | 304 | (10 | ) | 1 | 935 | 852 | 10 | |||||||||||||||||||||||||||||
Real Estate Banking |
104 | 109 | 88 | 117 | 118 | (5 | ) | (12 | ) | 301 | 343 | (12 | ) | |||||||||||||||||||||||||||
Other |
90 | 104 | 97 | 110 | 83 | (13 | ) | 8 | 291 | 233 | 25 | |||||||||||||||||||||||||||||
Total Commercial Banking revenue |
$ | 1,588 | $ | 1,627 | $ | 1,516 | $ | 1,611 | $ | 1,527 | (2 | ) | 4 | $ | 4,731 | $ | 4,429 | 7 | ||||||||||||||||||||||
FINANCIAL RATIOS |
||||||||||||||||||||||||||||||||||||||||
ROE |
28 | % | 30 | % | 28 | % | 26 | % | 23 | % | 29 | % | 26 | % | ||||||||||||||||||||||||||
Overhead ratio |
36 | 35 | 37 | 35 | 37 | 36 | 37 | |||||||||||||||||||||||||||||||||
| (a) | Commercial Banking (“CB”) client revenue from investment banking products and commercial card transactions is included in all other income. | |
| (b) | Total net revenue included tax-equivalent adjustments from income tax credits related to equity investments in designated community development entities that provide loans to qualified businesses in low-income communities as well as tax-exempt income from municipal bond activity of $90 million, $67 million, $65 million, $85 million and $59 million for the three months ended September 30, 2011, June 30, 2011, March 31, 2011, December 31, 2010 and September 30, 2010, respectively, and $222 million and $153 million for the nine months ended September 30, 2011 and 2010, respectively. | |
| (c) | Effective January 1, 2011, product revenue from commercial card and standby letters of credit transactions is included in lending. For the quarters ending September 30, 2011, June 30, 2011 and March 31, 2011, the impact of the change was $109 million, $114 million and $107 million, respectively, and $330 million for the nine months ended September 30, 2011. In prior-year quarters, it was reported in treasury services. | |
| (d) | Represents the total revenue related to investment banking products sold to CB clients. | |
| (e) | Corporate Client Banking was known as Mid-Corporate Banking prior to January 1, 2011. |
Page 23
| JPMORGAN CHASE & CO. COMMERCIAL BANKING FINANCIAL HIGHLIGHTS, CONTINUED (in millions, except headcount and ratio data) |
|
| QUARTERLY TRENDS | NINE MONTHS ENDED SEPTEMBER 30, | |||||||||||||||||||||||||||||||||||||||
| 3Q11 Change | 2011 Change | |||||||||||||||||||||||||||||||||||||||
| 3Q11 | 2Q11 | 1Q11 | 4Q10 | 3Q10 | 2Q11 | 3Q10 | 2011 | 2010 | 2010 | |||||||||||||||||||||||||||||||
SELECTED BALANCE SHEET DATA (period-end) |
||||||||||||||||||||||||||||||||||||||||
Loans: |
||||||||||||||||||||||||||||||||||||||||
Loans retained |
$ | 106,834 | $ | 102,122 | $ | 99,334 | $ | 97,900 | $ | 97,738 | 5 | % | 9 | % | $ | 106,834 | $ | 97,738 | 9 | % | ||||||||||||||||||||
Loans held-for-sale and loans at fair value |
584 | 557 | 835 | 1,018 | 399 | 5 | 46 | 584 | 399 | 46 | ||||||||||||||||||||||||||||||
Total loans |
107,418 | 102,679 | 100,169 | 98,918 | 98,137 | 5 | 9 | 107,418 | 98,137 | 9 | ||||||||||||||||||||||||||||||
Equity |
8,000 | 8,000 | 8,000 | 8,000 | 8,000 | — | — | 8,000 | 8,000 | — | ||||||||||||||||||||||||||||||
SELECTED BALANCE SHEET DATA (average) |
||||||||||||||||||||||||||||||||||||||||
Total assets |
$ | 145,195 | $ | 143,560 | $ | 140,400 | $ | 138,041 | $ | 130,237 | 1 | 11 | $ | 143,069 | $ | 132,176 | 8 | |||||||||||||||||||||||
Loans: |
||||||||||||||||||||||||||||||||||||||||
Loans retained |
104,705 | 100,857 | 98,829 | 97,823 | 96,657 | 4 | 8 | 101,485 | 96,166 | 6 | ||||||||||||||||||||||||||||||
Loans held-for-sale and loans at fair value |
632 | 1,015 | 756 | 612 | 384 | (38 | ) | 65 | 801 | 358 | 124 | |||||||||||||||||||||||||||||
Total loans |
105,337 | 101,872 | 99,585 | 98,435 | 97,041 | 3 | 9 | 102,286 | 96,524 | 6 | ||||||||||||||||||||||||||||||
Liability balances |
180,275 | 162,769 | 156,200 | 147,534 | 137,853 | 11 | 31 | 166,503 | 135,939 | 22 | ||||||||||||||||||||||||||||||
Equity |
8,000 | 8,000 | 8,000 | 8,000 | 8,000 | — | — | 8,000 | 8,000 | — | ||||||||||||||||||||||||||||||
Average loans by client segment: |
||||||||||||||||||||||||||||||||||||||||
Middle Market Banking |
$ | 41,540 | $ | 40,012 | $ | 38,207 | $ | 36,561 | $ | 35,299 | 4 | 18 | $ | 39,932 | 34,552 | 16 | ||||||||||||||||||||||||
Commercial Term Lending |
38,198 | 37,729 | 37,810 | 38,358 | 37,509 | 1 | 2 | 37,914 | 36,513 | 4 | ||||||||||||||||||||||||||||||
Corporate Client Banking (a) |
14,373 | 13,062 | 12,374 | 11,771 | 11,807 | 10 | 22 | 13,277 | 11,978 | 11 | ||||||||||||||||||||||||||||||
Real Estate Banking |
7,465 | 7,467 | 7,607 | 8,169 | 8,983 | — | (17 | ) | 7,512 | 9,740 | (23 | ) | ||||||||||||||||||||||||||||
Other |
3,761 | 3,602 | 3,587 | 3,576 | 3,443 | 4 | 9 | 3,651 | 3,741 | (2 | ) | |||||||||||||||||||||||||||||
Total Commercial Banking loans |
$ | 105,337 | $ | 101,872 | $ | 99,585 | $ | 98,435 | $ | 97,041 | 3 | 9 | $ | 102,286 | $ | 96,524 | 6 | |||||||||||||||||||||||
Headcount |
5,417 | 5,140 | 4,941 | 4,881 | 4,805 | 5 | 13 | 5,417 | 4,805 | 13 | ||||||||||||||||||||||||||||||
CREDIT DATA AND QUALITY STATISTICS |
||||||||||||||||||||||||||||||||||||||||
Net charge-offs |
$ | 17 | $ | 40 | $ | 31 | $ | 286 | $ | 218 | (58 | ) | (92 | ) | $ | 88 | $ | 623 | (86 | ) | ||||||||||||||||||||
Nonperforming assets: |
||||||||||||||||||||||||||||||||||||||||
Nonaccrual loans: |
||||||||||||||||||||||||||||||||||||||||
Nonaccrual loans retained (b) |
1,417 | 1,613 | 1,925 | 1,964 | 2,898 | (12 | ) | (51 | ) | 1,417 | 2,898 | (51 | ) | |||||||||||||||||||||||||||
Nonaccrual loans held-for-sale and loans at fair value |
26 | 21 | 30 | 36 | 48 | 24 | (46 | ) | 26 | 48 | (46 | ) | ||||||||||||||||||||||||||||
Total nonaccrual loans |
1,443 | 1,634 | 1,955 | 2,000 | 2,946 | (12 | ) | (51 | ) | 1,443 | 2,946 | (51 | ) | |||||||||||||||||||||||||||
Assets acquired in loan satisfactions |
168 | 197 | 179 | 197 | 281 | (15 | ) | (40 | ) | 168 | 281 | (40 | ) | |||||||||||||||||||||||||||
Total nonperforming assets |
1,611 | 1,831 | 2,134 | 2,197 | 3,227 | (12 | ) | (50 | ) | 1,611 | 3,227 | (50 | ) | |||||||||||||||||||||||||||
Allowance for credit losses: |
||||||||||||||||||||||||||||||||||||||||
Allowance for loan losses |
2,671 | 2,614 | 2,577 | 2,552 | 2,661 | 2 | — | 2,671 | 2,661 | — | ||||||||||||||||||||||||||||||
Allowance for lending-related commitments |
181 | 187 | 206 | 209 | 241 | (3 | ) | (25 | ) | 181 | 241 | (25 | ) | |||||||||||||||||||||||||||
Total allowance for credit losses |
2,852 | 2,801 | 2,783 | 2,761 | 2,902 | 2 | (2 | ) | 2,852 | 2,902 | (2 | ) | ||||||||||||||||||||||||||||
Net charge-off rate (c) |
0.06 | % | 0.16 | % | 0.13 | % | 1.16 | % | 0.89 | % | 0.12 | % | 0.87 | % | ||||||||||||||||||||||||||
Allowance for loan losses to period-end loans retained (c) |
2.50 | 2.56 | 2.59 | 2.61 | 2.72 | 2.50 | 2.72 | |||||||||||||||||||||||||||||||||
Allowance for loan losses to nonaccrual loans retained (b)(c) |
188 | 162 | 134 | 130 | 92 | 188 | 92 | |||||||||||||||||||||||||||||||||
Nonaccrual loans to total period-end loans |
1.34 | 1.59 | 1.95 | 2.02 | 3.00 | 1.34 | 3.00 | |||||||||||||||||||||||||||||||||
| (a) | Corporate Client Banking was known as Mid-Corporate Banking prior to January 1, 2011. | |
| (b) | Allowance for loan losses of $257 million, $289 million, $360 million, $340 million and $535 million was held against nonaccrual loans retained at September 30, 2011, June 30, 2011, March 31, 2011, December 31, 2010 and September 30, 2010, respectively. | |
| (c) | Loans held-for-sale and loans at fair value were excluded when calculating the allowance coverage ratios and net charge-off rate. |
Page 24
| JPMORGAN CHASE & CO. TREASURY & SECURITIES SERVICES FINANCIAL HIGHLIGHTS (in millions, except ratio and headcount data) |
|
| QUARTERLY TRENDS | NINE MONTHS ENDED SEPTEMBER 30, | |||||||||||||||||||||||||||||||||||||||
| 3Q11 Change | 2011 Change | |||||||||||||||||||||||||||||||||||||||
| 3Q11 | 2Q11 | 1Q11 | 4Q10 | 3Q10 | 2Q11 | 3Q10 | 2011 | 2010 | 2010 | |||||||||||||||||||||||||||||||
INCOME STATEMENT |
||||||||||||||||||||||||||||||||||||||||
REVENUE |
||||||||||||||||||||||||||||||||||||||||
Lending- and deposit-related fees |
$ | 310 | $ | 314 | $ | 303 | $ | 314 | $ | 318 | (1) | % | (3) | % | $ | 927 | $ | 942 | (2 | )% | ||||||||||||||||||||
Asset management, administration and commissions |
656 | 726 | 695 | 689 | 644 | (10 | ) | 2 | 2,077 | 2,008 | 3 | |||||||||||||||||||||||||||||
All other income |
141 | 143 | 139 | 209 | 210 | (1 | ) | (33 | ) | 423 | 595 | (29 | ) | |||||||||||||||||||||||||||
Noninterest revenue |
1,107 | 1,183 | 1,137 | 1,212 | 1,172 | (6 | ) | (6 | ) | 3,427 | 3,545 | (3 | ) | |||||||||||||||||||||||||||
Net interest income |
801 | 749 | 703 | 701 | 659 | 7 | 22 | 2,253 | 1,923 | 17 | ||||||||||||||||||||||||||||||
TOTAL NET REVENUE |
1,908 | 1,932 | 1,840 | 1,913 | 1,831 | (1 | ) | 4 | 5,680 | 5,468 | 4 | |||||||||||||||||||||||||||||
Provision for credit losses |
(20 | ) | (2 | ) | 4 | 10 | (2 | ) | NM | NM | (18 | ) | (57 | ) | 68 | |||||||||||||||||||||||||
Credit allocation income/(expense) (a) |
9 | 32 | 27 | (30 | ) | (31 | ) | (72 | ) | NM | 68 | (91 | ) | NM | ||||||||||||||||||||||||||
NONINTEREST EXPENSE |
||||||||||||||||||||||||||||||||||||||||
Compensation expense |
718 | 719 | 715 | 679 | 701 | — | 2 | 2,152 | 2,055 | 5 | ||||||||||||||||||||||||||||||
Noncompensation expense |
728 | 719 | 647 | 763 | 693 | 1 | 5 | 2,094 | 2,027 | 3 | ||||||||||||||||||||||||||||||
Amortization of intangibles |
24 | 15 | 15 | 28 | 16 | 60 | 50 | 54 | 52 | 4 | ||||||||||||||||||||||||||||||
TOTAL NONINTEREST EXPENSE |
1,470 | 1,453 | 1,377 | 1,470 | 1,410 | 1 | 4 | 4,300 | 4,134 | 4 | ||||||||||||||||||||||||||||||
Income before income tax expense |
467 | 513 | 486 | 403 | 392 | (9 | ) | 19 | 1,466 | 1,300 | 13 | |||||||||||||||||||||||||||||
Income tax expense |
162 | 180 | 170 | 146 | 141 | (10 | ) | 15 | 512 | 478 | 7 | |||||||||||||||||||||||||||||
NET INCOME |
$ | 305 | $ | 333 | $ | 316 | $ | 257 | $ | 251 | (8 | ) | 22 | $ | 954 | $ | 822 | 16 | ||||||||||||||||||||||
REVENUE BY BUSINESS |
||||||||||||||||||||||||||||||||||||||||
Treasury Services |
$ | 969 | $ | 930 | $ | 891 | $ | 953 | $ | 937 | 4 | 3 | $ | 2,790 | $ | 2,745 | 2 | |||||||||||||||||||||||
Worldwide Securities Services |
939 | 1,002 | 949 | 960 | 894 | (6 | ) | 5 | 2,890 | 2,723 | 6 | |||||||||||||||||||||||||||||
TOTAL NET REVENUE |
$ | 1,908 | $ | 1,932 | $ | 1,840 | $ | 1,913 | $ | 1,831 | (1 | ) | 4 | $ | 5,680 | $ | 5,468 | 4 | ||||||||||||||||||||||
REVENUE BY GEOGRAPHIC REGION (b) |
||||||||||||||||||||||||||||||||||||||||
Asia/Pacific |
$ | 321 | $ | 299 | $ | 276 | $ | 270 | $ | 256 | 7 | 25 | $ | 896 | $ | 708 | 27 | |||||||||||||||||||||||
Latin America/Caribbean |
61 | 80 | 76 | 91 | 50 | (24 | ) | 22 | 217 | 166 | 31 | |||||||||||||||||||||||||||||
Europe/Middle East/Africa |
648 | 691 | 630 | 624 | 579 | (6 | ) | 12 | 1,969 | 1,765 | 12 | |||||||||||||||||||||||||||||
North America |
878 | 862 | 858 | 928 | 946 | 2 | (7 | ) | 2,598 | 2,829 | (8 | ) | ||||||||||||||||||||||||||||
TOTAL NET REVENUE |
$ | 1,908 | $ | 1,932 | $ | 1,840 | $ | 1,913 | $ | 1,831 | (1 | ) | 4 | $ | 5,680 | $ | 5,468 | 4 | ||||||||||||||||||||||
FINANCIAL RATIOS |
||||||||||||||||||||||||||||||||||||||||
ROE |
17 | % | 19 | % | 18 | % | 16 | % | 15 | % | 18 | % | 17 | % | ||||||||||||||||||||||||||
Overhead ratio |
77 | 75 | 75 | 77 | 77 | 76 | 76 | |||||||||||||||||||||||||||||||||
Pretax margin ratio |
24 | 27 | 26 | 21 | 21 | 26 | 24 | |||||||||||||||||||||||||||||||||
SELECTED
BALANCE SHEET DATA (period-end) |
||||||||||||||||||||||||||||||||||||||||
Loans (c) |
$ | 36,389 | $ | 34,034 | $ | 31,020 | $ | 27,168 | $ | 26,899 | 7 | 35 | $ | 36,389 | $ | 26,899 | 35 | |||||||||||||||||||||||
Equity |
7,000 | 7,000 | 7,000 | 6,500 | 6,500 | — | 8 | 7,000 | 6,500 | 8 | ||||||||||||||||||||||||||||||
TRADE
FINANCE LOANS BY
GEOGRAPHIC REGION (period-end) (b) |
||||||||||||||||||||||||||||||||||||||||
Asia/Pacific |
$ | 16,918 | $ | 15,736 | $ | 14,607 | $ | 11,834 | $ | 10,238 | 8 | 65 | $ | 16,918 | $ | 10,238 | 65 | |||||||||||||||||||||||
Latin America/Caribbean |
5,228 | 4,553 | 4,014 | 3,628 | 3,357 | 15 | 56 | 5,228 | 3,357 | 56 | ||||||||||||||||||||||||||||||
Europe/Middle East/Africa |
6,853 | 6,184 | 5,794 | 4,874 | 3,391 | 11 | 102 | 6,853 | 3,391 | 102 | ||||||||||||||||||||||||||||||
North America |
1,105 | 1,000 | 1,084 | 820 | 820 | 11 | 35 | 1,105 | 820 | 35 | ||||||||||||||||||||||||||||||
TOTAL TRADE FINANCE LOANS |
$ | 30,104 | $ | 27,473 | $ | 25,499 | $ | 21,156 | $ | 17,806 | 10 | 69 | $ | 30,104 | $ | 17,806 | 69 | |||||||||||||||||||||||
SELECTED BALANCE SHEET DATA (average) |
||||||||||||||||||||||||||||||||||||||||
Total assets |
$ | 60,141 | $ | 52,688 | $ | 47,873 | $ | 46,301 | $ | 42,445 | 14 | 42 | $ | 53,612 | $ | 41,211 | 30 | |||||||||||||||||||||||
Loans (c) |
35,303 | 33,069 | 29,290 | 26,941 | 24,337 | 7 | 45 | 32,576 | 22,035 | 48 | ||||||||||||||||||||||||||||||
Liability balances |
341,107 | 302,858 | 265,720 | 256,661 | 242,517 | 13 | 41 | 303,504 | 245,684 | 24 | ||||||||||||||||||||||||||||||
Equity |
7,000 | 7,000 | 7,000 | 6,500 | 6,500 | — | 8 | 7,000 | 6,500 | 8 | ||||||||||||||||||||||||||||||
Headcount |
28,157 | 28,230 | 28,040 | 29,073 | 28,544 | — | (1 | ) | 28,157 | 28,544 | (1 | ) | ||||||||||||||||||||||||||||
| (a) | IB manages traditional credit exposures related to GCB on behalf of IB and TSS. Effective January 1, 2011, IB and TSS share the economics related to the Firm’s GCB clients. Included within this allocation are net revenues, provision for credit losses, as well as expenses. The prior-year periods reflected a reimbursement to IB for a portion of the total costs of managing the credit portfolio. IB recognizes this credit allocation as a component of all other income. | |
| (b) | Revenue and trade finance loans are based on TSS management’s view of the domicile of clients. | |
| (c) | Loan balances include trade finance loans, wholesale overdrafts and commercial card. Effective January 1, 2011, the commercial card loan business (of approximately $1.2 billion) that was previously in TSS was transferred to Card. There is no material impact on the financial data; prior-year periods were not revised. |
Page 25
| JPMORGAN CHASE & CO. TREASURY & SECURITIES SERVICES FINANCIAL HIGHLIGHTS, CONTINUED (in millions, except ratio data and where otherwise noted) |
|
TSS firmwide metrics include revenue recorded in the CB, Consumer & Business Banking and Asset
Management (“AM”) lines of business and excludes FX revenue recorded in IB for TSS-related FX
activity. In order to capture the firmwide impact of Treasury Services (“TS”) and TSS products and
revenue, management reviews firmwide metrics such as liability balances, revenue and overhead
ratios in assessing financial performance of TSS. Firmwide metrics are necessary in order to
understand the aggregate TSS business.
| QUARTERLY TRENDS | NINE MONTHS ENDED SEPTEMBER 30, | ||||||||||||||||||||||||||||||||||||||||
| 3Q11 Change | 2011 Change | ||||||||||||||||||||||||||||||||||||||||
| 3Q11 | 2Q11 | 1Q11 | 4Q10 | 3Q10 | 2Q11 | 3Q10 | 2011 | 2010 | 2010 | ||||||||||||||||||||||||||||||||
TSS FIRMWIDE DISCLOSURES |
|||||||||||||||||||||||||||||||||||||||||
TS revenue — reported |
$ | 969 | $ | 930 | $ | 891 | $ | 953 | $ | 937 | 4 | % | 3 | % | $ | 2,790 | $ | 2,745 | 2 | % | |||||||||||||||||||||
TS revenue reported in CB (a) |
572 | 556 | 542 | 659 | 670 | 3 | (15 | ) | 1,670 | 1,973 | (15 | ) | |||||||||||||||||||||||||||||
TS revenue reported in other lines of business |
68 | 65 | 63 | 65 | 64 | 5 | 6 | 196 | 182 | 8 | |||||||||||||||||||||||||||||||
TS firmwide revenue (b) |
1,609 | 1,551 | 1,496 | 1,677 | 1,671 | 4 | (4 | ) | 4,656 | 4,900 | (5 | ) | |||||||||||||||||||||||||||||
Worldwide Securities Services revenue |
939 | 1,002 | 949 | 960 | 894 | (6 | ) | 5 | 2,890 | 2,723 | 6 | ||||||||||||||||||||||||||||||
TSS firmwide revenue (b) |
$ | 2,548 | $ | 2,553 | $ | 2,445 | $ | 2,637 | $ | 2,565 | — | (1 | ) | $ | 7,546 | $ | 7,623 | (1 | ) | ||||||||||||||||||||||
TS firmwide liability balances (average) (c) |
$ | 414,485 | $ | 375,432 | $ | 339,240 | $ | 320,745 | $ | 302,921 | 10 | 37 | $ | 376,661 | $ | 303,742 | 24 | ||||||||||||||||||||||||
TSS firmwide liability balances (average) (c) |
521,383 | 465,627 | 421,920 | 404,195 | 380,370 | 12 | 37 | 470,008 | 381,623 | 23 | |||||||||||||||||||||||||||||||
TSS FIRMWIDE FINANCIAL RATIOS |
|||||||||||||||||||||||||||||||||||||||||
TS firmwide overhead ratio (a)(d) |
56 | % | 59 | % | 56 | % | 54 | % | 55 | % | 57 | % | 55 | % | |||||||||||||||||||||||||||
TSS firmwide overhead ratio (a)(d) |
67 | 67 | 67 | 66 | 65 | 67 | 65 | ||||||||||||||||||||||||||||||||||
FIRMWIDE BUSINESS METRICS |
|||||||||||||||||||||||||||||||||||||||||
Assets under custody (in billions) |
$ | 16,250 | $ | 16,945 | $ | 16,619 | $ | 16,120 | $ | 15,863 | (4 | ) | 2 | $ | 16,250 | $ | 15,863 | 2 | |||||||||||||||||||||||
Number of: |
|||||||||||||||||||||||||||||||||||||||||
U.S.$ ACH transactions originated |
972 | 959 | 992 | 995 | 978 | 1 | (1 | ) | 2,923 | 2,897 | 1 | ||||||||||||||||||||||||||||||
Total U.S.$ clearing volume (in thousands) |
33,117 | 32,274 | 30,971 | 32,144 | 30,779 | 3 | 8 | 96,362 | 89,979 | 7 | |||||||||||||||||||||||||||||||
International electronic funds transfer volume
(in thousands) (e) |
62,718 | 63,208 | 60,942 | 60,882 | 57,333 | (1 | ) | 9 | 186,868 | 171,571 | 9 | ||||||||||||||||||||||||||||||
Wholesale check volume |
601 | 608 | 532 | 525 | 531 | (1 | ) | 13 | 1,741 | 1,535 | 13 | ||||||||||||||||||||||||||||||
Wholesale cards issued (in thousands) (f) |
24,288 | 23,746 | 23,170 | 29,785 | 28,404 | 2 | (14 | ) | 24,288 | 28,404 | (14 | ) | |||||||||||||||||||||||||||||
CREDIT DATA AND QUALITY STATISTICS |
|||||||||||||||||||||||||||||||||||||||||
Net charge-offs |
$ | — | $ | — | $ | — | $ | — | $ | 1 | — | NM | $ | — | $ | 1 | NM | ||||||||||||||||||||||||
Nonaccrual loans |
3 | 3 | 11 | 12 | 14 | — | (79 | ) | 3 | 14 | (79 | ) | |||||||||||||||||||||||||||||
Allowance for credit losses: |
|||||||||||||||||||||||||||||||||||||||||
Allowance for loan losses |
49 | 74 | 69 | 65 | 54 | (34 | ) | (9 | ) | 49 | 54 | (9 | ) | ||||||||||||||||||||||||||||
Allowance for lending-related commitments |
46 | 41 | 48 | 51 | 52 | 12 | (12 | ) | 46 | 52 | (12 | ) | |||||||||||||||||||||||||||||
Total allowance for credit losses |
95 | 115 | 117 | 116 | 106 | (17 | ) | (10 | ) | 95 | 106 | (10 | ) | ||||||||||||||||||||||||||||
Net charge-off rate |
— | % | — | % | — | % | — | % | 0.02 | % | — | % | 0.01 | % | |||||||||||||||||||||||||||
Allowance for loan losses to period-end loans |
0.14 | 0.22 | 0.22 | 0.24 | 0.20 | 0.14 | 0.20 | ||||||||||||||||||||||||||||||||||
Allowance for loan losses to nonaccrual loans |
NM | NM | NM | NM | 386 | NM | 386 | ||||||||||||||||||||||||||||||||||
Nonaccrual loans to period-end loans |
0.01 | 0.01 | 0.04 | 0.04 | 0.05 | 0.01 | 0.05 | ||||||||||||||||||||||||||||||||||
| (a) | Effective January 1, 2011, certain CB revenues were excluded in the TS firmwide metrics; they are instead directly captured within CB’s lending revenue by product. For the three months ended September 30, 2011, June 30, 2011 and March 31, 2011, the impact of this change was $109 million, $114 million and $107 million, respectively, and $330 million for the nine months ended September 30, 2011. In prior-year periods, these revenues were included in CB’s treasury services revenue by product. | |
| (b) | TSS firmwide revenue includes foreign exchange (“FX”) revenue recorded in TSS and FX revenue associated with TSS customers who are FX customers of IB. However, some of the FX revenue associated with TSS customers who are FX customers of IB is not included in TS and TSS firmwide revenue. The total FX revenue generated was $179 million, $165 million, $160 million, $181 million and $143 million for the three months ended September 30, 2011, June 30, 2011, March 31, 2011, December 31, 2010 and September 30, 2010, respectively, and $504 million and $455 million for the nine months ended September 30, 2011 and 2010, respectively. | |
| (c) | Firmwide liability balances include liability balances recorded in CB. | |
| (d) | Overhead ratios have been calculated based on firmwide revenue and TSS and TS expense, respectively, including those allocated to certain other lines of business. FX revenue and expense recorded in IB for TSS-related FX activity are not included in this ratio. | |
| (e) | International electronic funds transfer includes non-U.S. dollar Automated Clearing House (“ACH”) and clearing volume. | |
| (f) | Wholesale cards issued and outstanding include U.S. domestic commercial, stored value, prepaid and government electronic benefit card products. Effective January 1, 2011, the commercial card portfolio was transferred from TSS to Card. |
Page 26
| JPMORGAN CHASE & CO. ASSET MANAGEMENT FINANCIAL HIGHLIGHTS (in millions, except ratio and headcount data) |
|
| QUARTERLY TRENDS | NINE MONTHS ENDED SEPTEMBER 30, | |||||||||||||||||||||||||||||||||||||||
| 3Q11 Change | 2011 Change | |||||||||||||||||||||||||||||||||||||||
| 3Q11 | 2Q11 | 1Q11 | 4Q10 | 3Q10 | 2Q11 | 3Q10 | 2011 | 2010 | 2010 | |||||||||||||||||||||||||||||||
INCOME STATEMENT |
||||||||||||||||||||||||||||||||||||||||
REVENUE |
||||||||||||||||||||||||||||||||||||||||
Asset management, administration and commissions |
$ | 1,617 | $ | 1,818 | $ | 1,707 | $ | 1,846 | $ | 1,498 | (11) | % | 8 | % | $ | 5,142 | $ | 4,528 | 14 | % | ||||||||||||||||||||
All other income |
281 | 321 | 313 | 386 | 282 | (12 | ) | — | 915 | 725 | 26 | |||||||||||||||||||||||||||||
Noninterest revenue |
1,898 | 2,139 | 2,020 | 2,232 | 1,780 | (11 | ) | 7 | 6,057 | 5,253 | 15 | |||||||||||||||||||||||||||||
Net interest income |
418 | 398 | 386 | 381 | 392 | 5 | 7 | 1,202 | 1,118 | 8 | ||||||||||||||||||||||||||||||
TOTAL NET REVENUE |
2,316 | 2,537 | 2,406 | 2,613 | 2,172 | (9 | ) | 7 | 7,259 | 6,371 | 14 | |||||||||||||||||||||||||||||
Provision for credit losses |
26 | 12 | 5 | 23 | 23 | 117 | 13 | 43 | 63 | (32 | ) | |||||||||||||||||||||||||||||
NONINTEREST EXPENSE |
||||||||||||||||||||||||||||||||||||||||
Compensation expense |
999 | 1,068 | 1,039 | 1,078 | 914 | (6 | ) | 9 | 3,106 | 2,685 | 16 | |||||||||||||||||||||||||||||
Noncompensation expense |
775 | 704 | 599 | 679 | 557 | 10 | 39 | 2,078 | 1,598 | 30 | ||||||||||||||||||||||||||||||
Amortization of intangibles |
22 | 22 | 22 | 20 | 17 | — | 29 | 66 | 52 | 27 | ||||||||||||||||||||||||||||||
TOTAL NONINTEREST EXPENSE |
1,796 | 1,794 | 1,660 | 1,777 | 1,488 | — | 21 | 5,250 | 4,335 | 21 | ||||||||||||||||||||||||||||||
Income before income tax expense |
494 | 731 | 741 | 813 | 661 | (32 | ) | (25 | ) | 1,966 | 1,973 | — | ||||||||||||||||||||||||||||
Income tax expense |
109 | 292 | 275 | 306 | 241 | (63 | ) | (55 | ) | 676 | 770 | (12 | ) | |||||||||||||||||||||||||||
NET INCOME |
$ | 385 | $ | 439 | $ | 466 | $ | 507 | $ | 420 | (12 | ) | (8 | ) | $ | 1,290 | $ | 1,203 | 7 | |||||||||||||||||||||
REVENUE BY CLIENT SEGMENT |
||||||||||||||||||||||||||||||||||||||||
Private Banking |
$ | 1,298 | $ | 1,289 | $ | 1,317 | $ | 1,376 | $ | 1,181 | 1 | 10 | $ | 3,904 | $ | 3,484 | 12 | |||||||||||||||||||||||
Institutional |
455 | 704 | 549 | 675 | 506 | (35 | ) | (10 | ) | 1,708 | 1,505 | 13 | ||||||||||||||||||||||||||||
Retail |
563 | 544 | 540 | 562 | 485 | 3 | 16 | 1,647 | 1,382 | 19 | ||||||||||||||||||||||||||||||
TOTAL NET REVENUE |
$ | 2,316 | $ | 2,537 | $ | 2,406 | $ | 2,613 | $ | 2,172 | (9 | ) | 7 | $ | 7,259 | $ | 6,371 | 14 | ||||||||||||||||||||||
FINANCIAL RATIOS |
||||||||||||||||||||||||||||||||||||||||
ROE |
24 | % | 27 | % | 29 | % | 31 | % | 26 | % | 27 | % | 25 | % | ||||||||||||||||||||||||||
Overhead ratio |
78 | 71 | 69 | 68 | 69 | 72 | 68 | |||||||||||||||||||||||||||||||||
Pretax margin ratio |
21 | 29 | 31 | 31 | 30 | 27 | 31 | |||||||||||||||||||||||||||||||||
SELECTED BALANCE SHEET DATA (period-end) |
||||||||||||||||||||||||||||||||||||||||
Loans |
$ | 54,178 | $ | 51,747 | $ | 46,454 | $ | 44,084 | $ | 41,408 | 5 | 31 | $ | 54,178 | $ | 41,408 | 31 | |||||||||||||||||||||||
Equity |
6,500 | 6,500 | 6,500 | 6,500 | 6,500 | — | — | 6,500 | 6,500 | — | ||||||||||||||||||||||||||||||
SELECTED BALANCE SHEET DATA (average) |
||||||||||||||||||||||||||||||||||||||||
Total assets |
$ | 78,669 | $ | 74,206 | $ | 68,918 | $ | 69,290 | $ | 64,911 | 6 | 21 | $ | 73,967 | $ | 63,629 | 16 | |||||||||||||||||||||||
Loans |
52,652 | 48,837 | 44,948 | 42,296 | 39,417 | 8 | 34 | 48,840 | 37,819 | 29 | ||||||||||||||||||||||||||||||
Deposits |
111,090 | 97,509 | 95,250 | 89,314 | 87,841 | 14 | 26 | 101,341 | 85,012 | 19 | ||||||||||||||||||||||||||||||
Equity |
6,500 | 6,500 | 6,500 | 6,500 | 6,500 | — | — | 6,500 | 6,500 | — | ||||||||||||||||||||||||||||||
Headcount |
18,084 | 17,963 | 17,203 | 16,918 | 16,510 | 1 | 10 | 18,084 | 16,510 | 10 | ||||||||||||||||||||||||||||||
Page 27
| JPMORGAN CHASE & CO. ASSET MANAGEMENT FINANCIAL HIGHLIGHTS, CONTINUED (in millions, except ratio data and where otherwise noted) |
|
| QUARTERLY TRENDS | NINE MONTHS ENDED SEPTEMBER 30, | |||||||||||||||||||||||||||||||||||||||
| 3Q11 Change | 2011 Change | |||||||||||||||||||||||||||||||||||||||
| 3Q11 | 2Q11 | 1Q11 | 4Q10 | 3Q10 | 2Q11 | 3Q10 | 2011 | 2010 | 2010 | |||||||||||||||||||||||||||||||
BUSINESS METRICS |
||||||||||||||||||||||||||||||||||||||||
Number of: |
||||||||||||||||||||||||||||||||||||||||
Client advisors (a) |
2,418 | 2,282 | 2,288 | 2,281 | 2,244 | 6 | % | 8 | % | 2,418 | 2,244 | 8 | % | |||||||||||||||||||||||||||
Retirement planning services participants (in thousands) |
1,755 | 1,613 | 1,604 | 1,580 | 1,665 | 9 | 5 | 1,755 | 1,665 | 5 | ||||||||||||||||||||||||||||||
JPMorgan Securities brokers (a) |
446 | 437 | 431 | 415 | 419 | 2 | 6 | 446 | 419 | 6 | ||||||||||||||||||||||||||||||
% of customer assets in 4 & 5 Star Funds (b) |
47 | % | 50 | % | 46 | % | 49 | % | 42 | % | (6 | ) | 12 | 47 | % | 42 | % | 12 | ||||||||||||||||||||||
% of AUM in 1st and 2nd quartiles: (c) |
||||||||||||||||||||||||||||||||||||||||
1 year |
49 | 56 | 57 | 67 | 67 | (13 | ) | (27 | ) | 49 | 67 | (27 | ) | |||||||||||||||||||||||||||
3 years |
73 | 71 | 70 | 72 | 65 | 3 | 12 | 73 | 65 | 12 | ||||||||||||||||||||||||||||||
5 years |
77 | 76 | 77 | 80 | 74 | 1 | 4 | 77 | 74 | 4 | ||||||||||||||||||||||||||||||
CREDIT DATA AND QUALITY STATISTICS |
||||||||||||||||||||||||||||||||||||||||
Net charge-offs |
$ | — | $ | 33 | $ | 11 | $ | 8 | $ | 13 | NM | NM | $ | 44 | $ | 68 | (35 | ) | ||||||||||||||||||||||
Nonaccrual loans |
311 | 252 | 254 | 375 | 294 | 23 | 6 | 311 | 294 | 6 | ||||||||||||||||||||||||||||||
Allowance for credit losses: |
||||||||||||||||||||||||||||||||||||||||
Allowance for loan losses |
240 | 222 | 257 | 267 | 257 | 8 | (7 | ) | 240 | 257 | (7 | ) | ||||||||||||||||||||||||||||
Allowance for lending-related commitments |
9 | 9 | 4 | 4 | 3 | — | 200 | 9 | 3 | 200 | ||||||||||||||||||||||||||||||
Total allowance for credit losses |
249 | 231 | 261 | 271 | 260 | 8 | (4 | ) | 249 | 260 | (4 | ) | ||||||||||||||||||||||||||||
Net charge-off rate |
— | % | 0.27 | % | 0.10 | % | 0.08 | % | 0.13 | % | 0.12 | % | 0.24 | % | ||||||||||||||||||||||||||
Allowance for loan losses to period-end loans |
0.44 | 0.43 | 0.55 | 0.61 | 0.62 | 0.44 | 0.62 | |||||||||||||||||||||||||||||||||
Allowance for loan losses to nonaccrual loans |
77 | 88 | 101 | 71 | 87 | 77 | 87 | |||||||||||||||||||||||||||||||||
Nonaccrual loans to period-end loans |
0.57 | 0.49 | 0.55 | 0.85 | 0.71 | 0.57 | 0.71 | |||||||||||||||||||||||||||||||||
| (a) | Effective January 1, 2011, the methodology used to determine client advisors was revised, and the prior-year periods have been revised. | |
| (b) | Derived from Morningstar for the U.S., the U.K., Luxembourg, France, Hong Kong and Taiwan; and Nomura for Japan. | |
| (c) | Quartile ranking sourced from: Lipper for the U.S. and Taiwan; Morningstar for the U.K., Luxembourg, France and Hong Kong; and Nomura for Japan. |
Page 28
| JPMORGAN CHASE & CO. ASSET MANAGEMENT FINANCIAL HIGHLIGHTS, CONTINUED (in billions) |
|
| September 30, 2011 | ||||||||||||||||||||||||||||
| Change | ||||||||||||||||||||||||||||
| Sep 30 | Jun 30 | Mar 31 | Dec 31 | Sep 30 | Jun 30 | Sep 30 | ||||||||||||||||||||||
| 2011 | 2011 | 2011 | 2010 | 2010 | 2011 | 2010 | ||||||||||||||||||||||
ASSETS UNDER SUPERVISION (a) |
||||||||||||||||||||||||||||
Assets by asset class |
||||||||||||||||||||||||||||
Liquidity |
$ | 464 | $ | 476 | $ | 490 | $ | 497 | $ | 521 | (3) | % | (11 | )% | ||||||||||||||
Fixed income |
321 | 319 | 305 | 289 | 277 | 1 | 16 | |||||||||||||||||||||
Equities and multi-asset |
356 | 430 | 421 | 404 | 362 | (17 | ) | (2 | ) | |||||||||||||||||||
Alternatives |
113 | 117 | 114 | 108 | 97 | (3 | ) | 16 | ||||||||||||||||||||
TOTAL ASSETS UNDER MANAGEMENT |
1,254 | 1,342 | 1,330 | 1,298 | 1,257 | (7 | ) | — | ||||||||||||||||||||
Custody/brokerage/administration/deposits |
552 | 582 | 578 | 542 | 513 | (5 | ) | 8 | ||||||||||||||||||||
TOTAL ASSETS UNDER SUPERVISION |
$ | 1,806 | $ | 1,924 | $ | 1,908 | $ | 1,840 | $ | 1,770 | (6 | ) | 2 | |||||||||||||||
Assets by client segment |
||||||||||||||||||||||||||||
Private Banking |
$ | 276 | $ | 291 | $ | 293 | $ | 284 | $ | 276 | (5 | ) | — | |||||||||||||||
Institutional (b) |
673 | 708 | 711 | 703 | 696 | (5 | ) | (3 | ) | |||||||||||||||||||
Retail (b) |
305 | 343 | 326 | 311 | 285 | (11 | ) | 7 | ||||||||||||||||||||
TOTAL ASSETS UNDER MANAGEMENT |
$ | 1,254 | $ | 1,342 | $ | 1,330 | $ | 1,298 | $ | 1,257 | (7 | ) | — | |||||||||||||||
Private Banking |
$ | 738 | $ | 776 | $ | 773 | $ | 731 | $ | 698 | (5 | ) | 6 | |||||||||||||||
Institutional (b) |
674 | 709 | 713 | 703 | 697 | (5 | ) | (3 | ) | |||||||||||||||||||
Retail (b) |
394 | 439 | 422 | 406 | 375 | (10 | ) | 5 | ||||||||||||||||||||
TOTAL ASSETS UNDER SUPERVISION |
$ | 1,806 | $ | 1,924 | $ | 1,908 | $ | 1,840 | $ | 1,770 | (6 | ) | 2 | |||||||||||||||
Mutual fund assets by asset class |
||||||||||||||||||||||||||||
Liquidity |
$ | 409 | $ | 421 | $ | 436 | $ | 446 | $ | 466 | (3 | ) | (12 | ) | ||||||||||||||
Fixed income |
101 | 105 | 99 | 92 | 88 | (4 | ) | 15 | ||||||||||||||||||||
Equities and multi-asset |
139 | 176 | 173 | 169 | 151 | (21 | ) | (8 | ) | |||||||||||||||||||
Alternatives |
8 | 9 | 8 | 7 | 7 | (11 | ) | 14 | ||||||||||||||||||||
TOTAL MUTUAL FUND ASSETS |
$ | 657 | $ | 711 | $ | 716 | $ | 714 | $ | 712 | (8 | ) | (8 | ) | ||||||||||||||
| (a) | Excludes assets under management of American Century Companies, Inc. in which the Firm sold its ownership interest on August 31, 2011. The Firm previously had an ownership interest of 40% at June 30, 2011 and March 31, 2011 and 41% at December 31, 2010 and September 30, 2010. | |
| (b) | In the second quarter of 2011, the client hierarchy used to determine asset classification was revised, and the prior-year periods have been revised. |
Page 29
| JPMORGAN CHASE & CO. ASSET MANAGEMENT FINANCIAL HIGHLIGHTS, CONTINUED (in billions) |
|
| NINE MONTHS ENDED | ||||||||||||||||||||||||||||
| SEPTEMBER 30, | ||||||||||||||||||||||||||||
| 3Q11 | 2Q11 | 1Q11 | 4Q10 | 3Q10 | 2011 | 2010 | ||||||||||||||||||||||
ASSETS UNDER SUPERVISION (continued) |
||||||||||||||||||||||||||||
Assets under management rollforward |
||||||||||||||||||||||||||||
Beginning balance |
$ | 1,342 | $ | 1,330 | $ | 1,298 | $ | 1,257 | $ | 1,161 | $ | 1,298 | $ | 1,249 | ||||||||||||||
Net asset flows: |
||||||||||||||||||||||||||||
Liquidity |
(10 | ) | (16 | ) | (9 | ) | (25 | ) | 27 | (35 | ) | (64 | ) | |||||||||||||||
Fixed income |
3 | 12 | 16 | 10 | 12 | 31 | 40 | |||||||||||||||||||||
Equities, multi-asset and alternatives |
(1 | ) | 7 | 11 | 13 | (1 | ) | 17 | 6 | |||||||||||||||||||
Market/performance/other impacts |
(80 | ) | 9 | 14 | 43 | 58 | (57 | ) | 26 | |||||||||||||||||||
Ending balance |
$ | 1,254 | $ | 1,342 | $ | 1,330 | $ | 1,298 | $ | 1,257 | $ | 1,254 | $ | 1,257 | ||||||||||||||
Assets under supervision rollforward |
||||||||||||||||||||||||||||
Beginning balance |
$ | 1,924 | $ | 1,908 | $ | 1,840 | $ | 1,770 | $ | 1,640 | $ | 1,840 | $ | 1,701 | ||||||||||||||
Net asset flows |
11 | 12 | 31 | 1 | 41 | 54 | 27 | |||||||||||||||||||||
Market/performance/other impacts |
(129 | ) | 4 | 37 | 69 | 89 | (88 | ) | 42 | |||||||||||||||||||
Ending balance |
$ | 1,806 | $ | 1,924 | $ | 1,908 | $ | 1,840 | $ | 1,770 | $ | 1,806 | $ | 1,770 | ||||||||||||||
Page 30
| JPMORGAN CHASE & CO. ASSET MANAGEMENT FINANCIAL HIGHLIGHTS, CONTINUED (in billions, except where otherwise noted) |
|
| QUARTERLY TRENDS | NINE MONTHS ENDED SEPTEMBER 30, | |||||||||||||||||||||||||||||||||||||||
| 3Q11 Change | 2011 Change | |||||||||||||||||||||||||||||||||||||||
| 3Q11 | 2Q11 | 1Q11 | 4Q10 | 3Q10 | 2Q11 | 3Q10 | 2011 | 2010 | 2010 | |||||||||||||||||||||||||||||||
INTERNATIONAL METRICS |
||||||||||||||||||||||||||||||||||||||||
Total net revenue: (in millions) (a) |
||||||||||||||||||||||||||||||||||||||||
Asia/Pacific |
$ | 248 | $ | 257 | $ | 246 | $ | 263 | $ | 226 | (4) | % | 10 | % | $ | 751 | $ | 662 | 13 | % | ||||||||||||||||||||
Latin America/Caribbean |
168 | 251 | 165 | 168 | 125 | (33 | ) | 34 | 584 | 373 | 57 | |||||||||||||||||||||||||||||
Europe/Middle East/Africa |
395 | 478 | 439 | 481 | 395 | (17 | ) | — | 1,312 | 1,161 | 13 | |||||||||||||||||||||||||||||
North America |
1,505 | 1,551 | 1,556 | 1,701 | 1,426 | (3 | ) | 6 | 4,612 | 4,175 | 10 | |||||||||||||||||||||||||||||
Total net revenue |
$ | 2,316 | $ | 2,537 | $ | 2,406 | $ | 2,613 | $ | 2,172 | (9 | ) | 7 | $ | 7,259 | $ | 6,371 | 14 | ||||||||||||||||||||||
Assets under management: |
||||||||||||||||||||||||||||||||||||||||
Asia/Pacific |
$ | 104 | $ | 119 | $ | 115 | $ | 111 | $ | 107 | (13 | ) | (3 | ) | $ | 104 | $ | 107 | (3 | ) | ||||||||||||||||||||
Latin America/Caribbean |
32 | 37 | 35 | 35 | 27 | (14 | ) | 19 | 32 | 27 | 19 | |||||||||||||||||||||||||||||
Europe/Middle East/Africa |
255 | 298 | 300 | 282 | 258 | (14 | ) | (1 | ) | 255 | 258 | (1 | ) | |||||||||||||||||||||||||||
North America |
863 | 888 | 880 | 870 | 865 | (3 | ) | — | 863 | 865 | — | |||||||||||||||||||||||||||||
Total assets under management |
$ | 1,254 | $ | 1,342 | $ | 1,330 | $ | 1,298 | $ | 1,257 | (7 | ) | — | $ | 1,254 | $ | 1,257 | — | ||||||||||||||||||||||
Assets under supervision: |
||||||||||||||||||||||||||||||||||||||||
Asia/Pacific |
$ | 140 | $ | 161 | $ | 155 | $ | 147 | $ | 139 | (13 | ) | 1 | $ | 140 | $ | 139 | 1 | ||||||||||||||||||||||
Latin America/Caribbean |
87 | 94 | 88 | 84 | 74 | (7 | ) | 18 | 87 | 74 | 18 | |||||||||||||||||||||||||||||
Europe/Middle East/Africa |
306 | 353 | 353 | 331 | 307 | (13 | ) | — | 306 | 307 | — | |||||||||||||||||||||||||||||
North America |
1,273 | 1,316 | 1,312 | 1,278 | 1,250 | (3 | ) | 2 | 1,273 | 1,250 | 2 | |||||||||||||||||||||||||||||
Total assets under supervision |
$ | 1,806 | $ | 1,924 | $ | 1,908 | $ | 1,840 | $ | 1,770 | (6 | ) | 2 | $ | 1,806 | $ | 1,770 | 2 | ||||||||||||||||||||||
| (a) | Regional revenue is based on the domicile of clients. |
Page 31
| JPMORGAN CHASE & CO. CORPORATE/PRIVATE EQUITY FINANCIAL HIGHLIGHTS (in millions, except headcount data) |
|
| QUARTERLY TRENDS | NINE MONTHS ENDED SEPTEMBER 30, | |||||||||||||||||||||||||||||||||||||||
| 3Q11 Change | 2011 Change | |||||||||||||||||||||||||||||||||||||||
| 3Q11 | 2Q11 | 1Q11 | 4Q10 | 3Q10 | 2Q11 | 3Q10 | 2011 | 2010 | 2010 | |||||||||||||||||||||||||||||||
INCOME STATEMENT |
||||||||||||||||||||||||||||||||||||||||
REVENUE |
||||||||||||||||||||||||||||||||||||||||
Principal transactions |
$ | (933 | ) | $ | 745 | $ | 1,298 | $ | 587 | $ | 1,143 | NM | % | NM | % | $ | 1,110 | $ | 1,621 | (32 | )% | |||||||||||||||||||
Securities gains |
607 | 837 | 102 | 1,199 | 99 | (27 | ) | NM | 1,546 | 1,699 | (9 | ) | ||||||||||||||||||||||||||||
All other income |
186 | 265 | 78 | (24 | ) | (29 | ) | (30 | ) | NM | 529 | 277 | 91 | |||||||||||||||||||||||||||
Noninterest revenue |
(140 | ) | 1,847 | 1,478 | 1,762 | 1,213 | NM | NM | 3,185 | 3,597 | (11 | ) | ||||||||||||||||||||||||||||
Net interest income |
8 | 218 | 34 | (131 | ) | 371 | (96 | ) | (98 | ) | 260 | 2,194 | (88 | ) | ||||||||||||||||||||||||||
TOTAL NET REVENUE (a) |
(132 | ) | 2,065 | 1,512 | 1,631 | 1,584 | NM | NM | 3,445 | 5,791 | (41 | ) | ||||||||||||||||||||||||||||
Provision for credit losses |
(7 | ) | (9 | ) | (10 | ) | 2 | (3 | ) | 22 | (133 | ) | (26 | ) | 12 | NM | ||||||||||||||||||||||||
NONINTEREST EXPENSE |
||||||||||||||||||||||||||||||||||||||||
Compensation expense |
552 | 614 | 657 | 538 | 574 | (10 | ) | (4 | ) | 1,823 | 1,819 | — | ||||||||||||||||||||||||||||
Noncompensation expense (b) |
1,995 | 2,097 | 1,143 | 2,352 | 1,927 | (5 | ) | 4 | 5,235 | 6,436 | (19 | ) | ||||||||||||||||||||||||||||
Subtotal |
2,547 | 2,711 | 1,800 | 2,890 | 2,501 | (6 | ) | 2 | 7,058 | 8,255 | (15 | ) | ||||||||||||||||||||||||||||
Net expense allocated to other businesses |
(1,331 | ) | (1,270 | ) | (1,238 | ) | (1,191 | ) | (1,227 | ) | (5 | ) | (8 | ) | (3,839 | ) | (3,599 | ) | (7 | ) | ||||||||||||||||||||
TOTAL NONINTEREST EXPENSE |
1,216 | 1,441 | 562 | 1,699 | 1,274 | (16 | ) | (5 | ) | 3,219 | 4,656 | (31 | ) | |||||||||||||||||||||||||||
Income/(loss) before income tax expense/(benefit) |
(1,341 | ) | 633 | 960 | (70 | ) | 313 | NM | NM | 252 | 1,123 | (78 | ) | |||||||||||||||||||||||||||
Income tax expense/(benefit) (c) |
(696 | ) | 131 | 238 | (99 | ) | (35 | ) | NM | NM | (327 | ) | (106 | ) | (208 | ) | ||||||||||||||||||||||||
NET INCOME/(LOSS) |
$ | (645 | ) | $ | 502 | $ | 722 | $ | 29 | $ | 348 | NM | NM | $ | 579 | $ | 1,229 | (53 | ) | |||||||||||||||||||||
MEMO: |
||||||||||||||||||||||||||||||||||||||||
TOTAL NET REVENUE |
||||||||||||||||||||||||||||||||||||||||
Private equity |
$ | (546 | ) | $ | 796 | $ | 699 | $ | 355 | $ | 721 | NM | NM | $ | 949 | $ | 884 | 7 | ||||||||||||||||||||||
Corporate |
414 | 1,269 | 813 | 1,276 | 863 | (67 | ) | (52 | ) | 2,496 | 4,907 | (49 | ) | |||||||||||||||||||||||||||
TOTAL NET REVENUE |
$ | (132 | ) | $ | 2,065 | $ | 1,512 | $ | 1,631 | $ | 1,584 | NM | NM | $ | 3,445 | $ | 5,791 | (41 | ) | |||||||||||||||||||||
NET INCOME/(LOSS) |
||||||||||||||||||||||||||||||||||||||||
Private equity |
$ | (347 | ) | $ | 444 | $ | 383 | $ | 178 | $ | 344 | NM | NM | $ | 480 | $ | 410 | 17 | ||||||||||||||||||||||
Corporate |
(298 | ) | 58 | 339 | (149 | ) | 4 | NM | NM | 99 | 819 | (88 | ) | |||||||||||||||||||||||||||
TOTAL NET INCOME/(LOSS) |
$ | (645 | ) | $ | 502 | $ | 722 | $ | 29 | $ | 348 | NM | NM | $ | 579 | $ | 1,229 | (53 | ) | |||||||||||||||||||||
Headcount |
21,844 | 21,444 | 20,927 | 20,030 | 19,756 | 2 | 11 | 21,844 | 19,756 | 11 | ||||||||||||||||||||||||||||||
| (a) | Total net revenue included tax-equivalent adjustments, predominantly due to tax-exempt income from municipal bond investments of $73 million, $69 million, $64 million, $63 million and $58 million for the three months ended September 30, 2011, June 30, 2011, March 31, 2011, December 31, 2010 and September 30, 2010, respectively, and $206 million and $163 million for the nine months ended September 30, 2011 and 2010, respectively, | |
| (b) | Includes litigation expense of $1.0 billion, $1.3 billion, $0.4 billion, $1.5 billion and $1.3 billion for the three months ended September 30, 2011, June 30, 2011, March 31, 2011, December 31, 2010 and September 30, 2010, respectively, and $2.6 billion and $4.3 billion for the nine months ended September 30, 2011 and 2010, respectively. | |
| (c) | Income tax expense/(benefit) in the third quarter of 2010 includes tax benefits recognized upon the resolution of tax audits. |
Page 32
| JPMORGAN CHASE & CO. CORPORATE/PRIVATE EQUITY FINANCIAL HIGHLIGHTS, CONTINUED (in millions) |
|
| QUARTERLY TRENDS | NINE MONTHS ENDED SEPTEMBER 30, | |||||||||||||||||||||||||||||||||||||||
| 3Q11 Change | 2011 Change | |||||||||||||||||||||||||||||||||||||||
| 3Q11 | 2Q11 | 1Q11 | 4Q10 | 3Q10 | 2Q11 | 3Q10 | 2011 | 2010 | 2010 | |||||||||||||||||||||||||||||||
SUPPLEMENTAL INFORMATION |
||||||||||||||||||||||||||||||||||||||||
TREASURY and CHIEF INVESTMENT OFFICE (“CIO”) |
||||||||||||||||||||||||||||||||||||||||
Securities gains (a) |
$ | 459 | $ | 837 | $ | 102 | $ | 1,199 | $ | 99 | (45) | % | 364 | % | $ | 1,398 | $ | 1,698 | (18) | % | ||||||||||||||||||||
Investment securities portfolio (average) |
324,596 | 335,543 | 313,319 | 322,218 | 321,428 | (3 | ) | 1 | 324,527 | 324,163 | — | |||||||||||||||||||||||||||||
Investment securities portfolio (ending) |
330,800 | 318,237 | 328,013 | 310,801 | 334,140 | 4 | (1 | ) | 330,800 | 334,140 | (1 | ) | ||||||||||||||||||||||||||||
Mortgage loans (average) |
13,748 | 12,731 | 11,418 | 10,117 | 9,174 | 8 | 50 | 12,641 | 8,629 | 46 | ||||||||||||||||||||||||||||||
Mortgage loans (ending) |
14,226 | 13,243 | 12,171 | 10,739 | 9,550 | 7 | 49 | 14,226 | 9,550 | 49 | ||||||||||||||||||||||||||||||
PRIVATE EQUITY |
||||||||||||||||||||||||||||||||||||||||
Private equity gains/(losses) |
||||||||||||||||||||||||||||||||||||||||
Direct investments |
||||||||||||||||||||||||||||||||||||||||
Realized gains |
$ | 394 | $ | 1,219 | $ | 171 | $ | 1,039 | $ | 179 | (68 | ) | 120 | $ | 1,784 | $ | 370 | 382 | ||||||||||||||||||||||
Unrealized gains/(losses) (b) |
(827 | ) | (726 | ) | 370 | (781 | ) | 561 | (14 | ) | NM | (1,183 | ) | 479 | NM | |||||||||||||||||||||||||
Total direct investments |
(433 | ) | 493 | 541 | 258 | 740 | NM | NM | 601 | 849 | (29 | ) | ||||||||||||||||||||||||||||
Third-party fund investments |
(7 | ) | 323 | 186 | 129 | 10 | NM | NM | 502 | 112 | 348 | |||||||||||||||||||||||||||||
Total private equity gains/(losses) (c) |
$ | (440 | ) | $ | 816 | $ | 727 | $ | 387 | $ | 750 | NM | NM | $ | 1,103 | $ | 961 | 15 | ||||||||||||||||||||||
Private equity portfolio information |
||||||||||||||||||||||||||||||||||||||||
Direct investments |
||||||||||||||||||||||||||||||||||||||||
Publicly-held securities |
||||||||||||||||||||||||||||||||||||||||
Carrying value |
$ | 709 | $ | 670 | $ | 731 | $ | 875 | $ | 1,152 | 6 | (38 | ) | |||||||||||||||||||||||||||
Cost |
779 | 595 | 649 | 732 | 985 | 31 | (21 | ) | ||||||||||||||||||||||||||||||||
Quoted public value |
778 | 721 | 785 | 935 | 1,249 | 8 | (38 | ) | ||||||||||||||||||||||||||||||||
Privately-held direct securities |
||||||||||||||||||||||||||||||||||||||||
Carrying value |
4,322 | 5,680 | 7,212 | 5,882 | 6,388 | (24 | ) | (32 | ) | |||||||||||||||||||||||||||||||
Cost |
6,556 | 6,891 | 7,731 | 6,887 | 6,646 | (5 | ) | (1 | ) | |||||||||||||||||||||||||||||||
Third-party fund investments (d) |
||||||||||||||||||||||||||||||||||||||||
Carrying value |
2,399 | 2,481 | 2,179 | 1,980 | 1,814 | (3 | ) | 32 | ||||||||||||||||||||||||||||||||
Cost |
2,454 | 2,464 | 2,461 | 2,404 | 2,356 | — | 4 | |||||||||||||||||||||||||||||||||
Total private equity portfolio |
||||||||||||||||||||||||||||||||||||||||
Carrying value |
$ | 7,430 | $ | 8,831 | $ | 10,122 | $ | 8,737 | $ | 9,354 | (16 | ) | (21 | ) | ||||||||||||||||||||||||||
Cost |
9,789 | 9,950 | 10,841 | 10,023 | 9,987 | (2 | ) | (2 | ) | |||||||||||||||||||||||||||||||
| (a) | Reflects repositioning of the Corporate investment securities portfolio. | |
| (b) | Unrealized gains/(losses) contain reversals of unrealized gains and losses that were recognized in prior periods and have now been realized. | |
| (c) | Included in principal transactions revenue in the Consolidated Statements of Income. | |
| (d) | Unfunded commitments to third-party private equity funds were $853 million, $876 million, $943 million, $1.0 billion and $1.1 billion at September 30, 2011, June 30, 2011, March 31, 2011, December 31, 2010 and September 30, 2010, respectively. |
Page 33
| JPMORGAN CHASE & CO. CREDIT-RELATED INFORMATION (in millions) |
|
| September 30, 2011 | ||||||||||||||||||||||||||||
| Change | ||||||||||||||||||||||||||||
| Sep 30 | Jun 30 | Mar 31 | Dec 31 | Sep 30 | Jun 30 | Sep 30 | ||||||||||||||||||||||
| 2011 | 2011 | 2011 | 2010 | 2010 | 2011 | 2010 | ||||||||||||||||||||||
CREDIT EXPOSURE |
||||||||||||||||||||||||||||
Wholesale |
||||||||||||||||||||||||||||
Loans retained |
$ | 255,799 | $ | 244,224 | $ | 229,648 | $ | 222,510 | $ | 217,582 | 5 | % | 18 | % | ||||||||||||||
Loans held-for-sale and loans at fair value |
3,684 | 4,599 | 6,359 | 5,123 | 3,015 | (20 | ) | 22 | ||||||||||||||||||||
Total wholesale loans (a)(b) |
259,483 | 248,823 | 236,007 | 227,633 | 220,597 | 4 | 18 | |||||||||||||||||||||
Consumer, excluding credit card |
||||||||||||||||||||||||||||
Loans, excluding PCI loans and held-for sale loans |
||||||||||||||||||||||||||||
Home equity |
80,278 | 82,751 | 85,253 | 88,385 | 91,728 | (3 | ) | (12 | ) | |||||||||||||||||||
Prime mortgage, including option ARMs |
74,230 | 74,276 | 74,682 | 74,539 | 74,205 | — | — | |||||||||||||||||||||
Subprime mortgage |
10,045 | 10,441 | 10,841 | 11,287 | 12,009 | (4 | ) | (16 | ) | |||||||||||||||||||
Auto |
46,659 | 46,796 | 47,411 | 48,367 | 48,186 | — | (3 | ) | ||||||||||||||||||||
Business banking |
17,272 | 17,141 | 16,957 | 16,812 | 16,568 | 1 | 4 | |||||||||||||||||||||
Student and other |
14,492 | 14,770 | 15,089 | 15,311 | 15,583 | (2 | ) | (7 | ) | |||||||||||||||||||
Total loans, excluding PCI loans and loans held-for-sale |
242,976 | 246,175 | 250,233 | 254,701 | 258,279 | (1 | ) | (6 | ) | |||||||||||||||||||
Loans — PCI: (c) |
||||||||||||||||||||||||||||
Home equity |
23,105 | 23,535 | 23,973 | 24,459 | 24,982 | (2 | ) | (8 | ) | |||||||||||||||||||
Prime mortgage |
15,626 | 16,200 | 16,725 | 17,322 | 17,904 | (4 | ) | (13 | ) | |||||||||||||||||||
Subprime mortgage |
5,072 | 5,187 | 5,276 | 5,398 | 5,496 | (2 | ) | (8 | ) | |||||||||||||||||||
Option ARMs |
23,325 | 24,072 | 24,791 | 25,584 | 26,370 | (3 | ) | (12 | ) | |||||||||||||||||||
Total loans — PCI |
67,128 | 68,994 | 70,765 | 72,763 | 74,752 | (3 | ) | (10 | ) | |||||||||||||||||||
Total loans — retained |
310,104 | 315,169 | 320,998 | 327,464 | 333,031 | (2 | ) | (7 | ) | |||||||||||||||||||
Loans held-for-sale (d) |
131 | 221 | 188 | 154 | 467 | (41 | ) | (72 | ) | |||||||||||||||||||
Total consumer, excluding credit card loans |
310,235 | 315,390 | 321,186 | 327,618 | 333,498 | (2 | ) | (7 | ) | |||||||||||||||||||
Credit card |
||||||||||||||||||||||||||||
Loans retained |
127,041 | 125,523 | 124,791 | 135,524 | 136,436 | 1 | (7 | ) | ||||||||||||||||||||
Loans held-for-sale |
94 | — | 4,012 | 2,152 | — | NM | NM | |||||||||||||||||||||
Total credit card (b) |
127,135 | 125,523 | 128,803 | 137,676 | 136,436 | 1 | (7 | ) | ||||||||||||||||||||
Total consumer loans (e) |
437,370 | 440,913 | 449,989 | 465,294 | 469,934 | (1 | ) | (7 | ) | |||||||||||||||||||
Total loans |
696,853 | 689,736 | 685,996 | 692,927 | 690,531 | 1 | 1 | |||||||||||||||||||||
Derivative receivables |
108,853 | 77,383 | 78,744 | 80,481 | 97,293 | 41 | 12 | |||||||||||||||||||||
Receivables from customers and interests in
purchased receivables (f) |
25,719 | 32,678 | 38,230 | 32,932 | 26,025 | (21 | ) | (1 | ) | |||||||||||||||||||
Total credit-related assets |
134,572 | 110,061 | 116,974 | 113,413 | 123,318 | 22 | 9 | |||||||||||||||||||||
Wholesale lending-related commitments |
379,682 | 365,689 | 355,561 | 346,079 | 338,612 | 4 | 12 | |||||||||||||||||||||
Total |
$ | 1,211,107 | $ | 1,165,486 | $ | 1,158,531 | $ | 1,152,419 | $ | 1,152,461 | 4 | 5 | ||||||||||||||||
Memo: Total by category |
||||||||||||||||||||||||||||
Total wholesale exposure (g) |
$ | 773,633 | $ | 724,573 | $ | 708,542 | $ | 687,125 | $ | 682,527 | 7 | 13 | ||||||||||||||||
Total consumer loans (h) |
437,474 | 440,913 | 449,989 | 465,294 | 469,934 | (1 | ) | (7 | ) | |||||||||||||||||||
Total |
$ | 1,211,107 | $ | 1,165,486 | $ | 1,158,531 | $ | 1,152,419 | $ | 1,152,461 | 4 | 5 | ||||||||||||||||
| (a) | Includes IB, CB, TSS, AM and Corporate/Private Equity. | |
| (b) | Effective January 1, 2011, the commercial card business that was previously in TSS was transferred to Card. There is no material impact on the financial data; prior-year periods were not revised. | |
| (c) | PCI loans represent loans acquired in the Washington Mutual transaction for which a deterioration in credit quality occurred between the origination date and JPMorgan Chase’s acquisition date. These loans were initially recorded at fair value and accrete interest income over the estimated lives of the underlying loans as long as cash flows are reasonably estimable, even if the underlying loans are contractually past due. | |
| (d) | Included prime mortgages of $131 million, $221 million, $188 million, $154 million and $428 million at September 30, 2011, June 30, 2011, March 31, 2011, December 31, 2010 and September 30, 2010, respectively, and student loans of $39 million at September 30, 2010. | |
| (e) | Includes RFS, Card and residential real estate loans reported in Corporate/Private Equity. | |
| (f) | Receivables from customers represent primarily margin loans to prime and retail brokerage customers, which are included in accrued interest and accounts receivable on the Consolidated Balance Sheets. | |
| (g) | Primarily represents total wholesale loans, wholesale lending-related commitments, derivative receivables and receivables from customers. | |
| (h) | Represents total consumer loans and excludes consumer lending-related commitments. |
Page 34
| JPMORGAN CHASE & CO. CREDIT-RELATED INFORMATION, CONTINUED (in millions, except ratio data) |
|
| September 30, 2011 | ||||||||||||||||||||||||||||
| Change | ||||||||||||||||||||||||||||
| Sep 30 | Jun 30 | Mar 31 | Dec 31 | Sep 30 | Jun 30 | Sep 30 | ||||||||||||||||||||||
| 2011 | 2011 | 2011 | 2010 | 2010 | 2011 | 2010 | ||||||||||||||||||||||
NONPERFORMING ASSETS AND RATIOS |
||||||||||||||||||||||||||||
Wholesale |
||||||||||||||||||||||||||||
Loans retained |
$ | 3,011 | $ | 3,362 | $ | 4,578 | $ | 5,510 | $ | 5,231 | (10) | % | (42 | )% | ||||||||||||||
Loans held-for-sale and loans at fair value |
176 | 214 | 289 | 496 | 409 | (18 | ) | (57 | ) | |||||||||||||||||||
Total wholesale loans |
3,187 | 3,576 | 4,867 | 6,006 | 5,640 | (11 | ) | (43 | ) | |||||||||||||||||||
Consumer, excluding credit card |
||||||||||||||||||||||||||||
Home equity |
1,290 | 1,308 | 1,263 | 1,263 | 1,251 | (1 | ) | 3 | ||||||||||||||||||||
Prime mortgage, including option ARMs |
3,656 | 4,024 | 4,166 | 4,320 | 4,857 | (9 | ) | (25 | ) | |||||||||||||||||||
Subprime mortgage |
1,932 | 2,058 | 2,106 | 2,210 | 2,649 | (6 | ) | (27 | ) | |||||||||||||||||||
Auto |
114 | 111 | 120 | 141 | 145 | 3 | (21 | ) | ||||||||||||||||||||
Business banking |
756 | 770 | 810 | 832 | 895 | (2 | ) | (16 | ) | |||||||||||||||||||
Student and other |
68 | 79 | 107 | 67 | 64 | (14 | ) | 6 | ||||||||||||||||||||
Total consumer, excluding credit card |
7,816 | 8,350 | 8,572 | 8,833 | 9,861 | (6 | ) | (21 | ) | |||||||||||||||||||
Total credit card |
2 | 2 | 2 | 2 | 2 | — | — | |||||||||||||||||||||
Total consumer nonaccrual loans (a)(b) |
7,818 | 8,352 | 8,574 | 8,835 | 9,863 | (6 | ) | (21 | ) | |||||||||||||||||||
Total nonaccrual loans |
11,005 | 11,928 | 13,441 | 14,841 | 15,503 | (8 | ) | (29 | ) | |||||||||||||||||||
Derivative receivables |
11 | 22 | 21 | 34 | 255 | (50 | ) | (96 | ) | |||||||||||||||||||
Assets acquired in loan satisfactions |
1,178 | 1,290 | 1,524 | 1,682 | 1,898 | (9 | ) | (38 | ) | |||||||||||||||||||
Total nonperforming assets (a) |
12,194 | 13,240 | 14,986 | 16,557 | 17,656 | (8 | ) | (31 | ) | |||||||||||||||||||
Wholesale lending-related commitments (c) |
705 | 793 | 895 | 1,005 | 1,344 | (11 | ) | (48 | ) | |||||||||||||||||||
Total (a) |
$ | 12,899 | $ | 14,033 | $ | 15,881 | $ | 17,562 | $ | 19,000 | (8 | ) | (32 | ) | ||||||||||||||
Total nonaccrual loans to total loans |
1.58 | % | 1.73 | % | 1.96 | % | 2.14 | % | 2.25 | % | ||||||||||||||||||
Total wholesale nonaccrual loans to total wholesale loans |
1.23 | 1.44 | 2.06 | 2.64 | 2.56 | |||||||||||||||||||||||
Total consumer, excluding credit card nonaccrual loans to total consumer, excluding credit card loans |
2.52 | 2.65 | 2.67 | 2.70 | 2.96 | |||||||||||||||||||||||
NONPERFORMING ASSETS BY LOB |
||||||||||||||||||||||||||||
Investment Bank |
$ | 1,508 | $ | 1,788 | $ | 2,741 | $ | 3,770 | $ | 2,789 | (16 | ) | (46 | ) | ||||||||||||||
Retail Financial Services (b) |
8,444 | 9,033 | 9,482 | 9,854 | 10,989 | (7 | ) | (23 | ) | |||||||||||||||||||
Card Services & Auto |
232 | 233 | 275 | 269 | 268 | — | (13 | ) | ||||||||||||||||||||
Commercial Banking |
1,611 | 1,831 | 2,134 | 2,197 | 3,227 | (12 | ) | (50 | ) | |||||||||||||||||||
Treasury & Securities Services |
3 | 3 | 11 | 12 | 14 | — | (79 | ) | ||||||||||||||||||||
Asset Management |
322 | 264 | 263 | 382 | 299 | 22 | 8 | |||||||||||||||||||||
Corporate/Private Equity (d) |
74 | 88 | 80 | 73 | 70 | (16 | ) | 6 | ||||||||||||||||||||
TOTAL |
$ | 12,194 | $ | 13,240 | $ | 14,986 | $ | 16,557 | $ | 17,656 | (8 | ) | (31 | ) | ||||||||||||||
| (a) | At September 30, 2011, June 30, 2011, March 31, 2011, December 31, 2010 and September 30, 2010, nonperforming assets excluded: (1) mortgage loans insured by U.S. government agencies of $9.5 billion, $9.1 billion, $8.8 billion, $9.4 billion and $9.2 billion, respectively, that are 90 or more days past due; (2) real estate owned insured by U.S. government agencies of $2.4 billion, $2.4 billion, $2.3 billion, $1.9 billion and $1.7 billion, respectively; and (3) student loans insured by U.S. government agencies under the FFELP of $567 million, $558 million, $615 million, $625 million and $572 million, respectively, that are 90 or more days past due. These amounts are excluded as reimbursement of insured amounts is proceeding normally. In addition, the Firm’s policy is generally to exempt credit card loans from being placed on nonaccrual status as permitted by regulatory guidance issued by the Federal Financial Institutions Examination Council (“FFIEC”). Credit card loans are charged off by the end of the month in which the account becomes 180 days past due or within 60 days from receiving notification about a specified event (e.g., bankruptcy of the borrower), whichever is earlier. | |
| (b) | Excludes PCI loans acquired as part of the Washington Mutual transaction, which are accounted for on a pool basis. Since each pool is accounted for as a single asset with a single composite interest rate and an aggregate expectation of cash flows, the past-due status of the pools, or that of the individual loans within the pools, is not meaningful. Because the Firm is recognizing interest income on each pool of loans, they are all considered to be performing. Also excludes loans held-for-sale and loans at fair value. | |
| (c) | The amounts in nonperforming represent unfunded commitments that are risk rated as nonaccrual. | |
| (d) | Predominantly relates to retained prime mortgage loans. |
Page 35
| JPMORGAN CHASE & CO. CREDIT-RELATED INFORMATION, CONTINUED (in millions, except ratio data) |
|
| QUARTERLY TRENDS | NINE MONTHS ENDED SEPTEMBER 30, | |||||||||||||||||||||||||||||||||||||||
| 3Q11 Change | 2011 Change | |||||||||||||||||||||||||||||||||||||||
| 3Q11 | 2Q11 | 1Q11 | 4Q10 | 3Q10 | 2Q11 | 3Q10 | 2011 | 2010 | 2010 | |||||||||||||||||||||||||||||||
GROSS CHARGE-OFFS |
||||||||||||||||||||||||||||||||||||||||
Wholesale loans |
$ | 98 | $ | 134 | $ | 253 | $ | 414 | $ | 297 | (27) | % | (67) | % | $ | 485 | $ | 1,575 | (69 | )% | ||||||||||||||||||||
Consumer loans, excluding credit card |
1,292 | 1,357 | 1,460 | 2,277 | 1,677 | (5 | ) | (23 | ) | 4,109 | 6,106 | (33 | ) | |||||||||||||||||||||||||||
Credit card loans |
1,765 | 2,131 | 2,631 | 2,980 | 3,485 | (17 | ) | (49 | ) | 6,527 | 12,430 | (47 | ) | |||||||||||||||||||||||||||
Total loans |
$ | 3,155 | $ | 3,622 | $ | 4,344 | $ | 5,671 | $ | 5,459 | (13 | ) | (42 | ) | $ | 11,121 | $ | 20,111 | (45 | ) | ||||||||||||||||||||
GROSS RECOVERIES |
||||||||||||||||||||||||||||||||||||||||
Wholesale loans |
$ | 249 | $ | 54 | $ | 88 | $ | 143 | $ | 31 | 361 | NM | $ | 391 | $ | 119 | 229 | |||||||||||||||||||||||
Consumer loans, excluding credit card |
133 | 144 | 131 | 115 | 131 | (8 | ) | 2 | 408 | 359 | 14 | |||||||||||||||||||||||||||||
Credit card loans |
266 | 321 | 405 | 309 | 352 | (17 | ) | (24 | ) | 992 | 1,064 | (7 | ) | |||||||||||||||||||||||||||
Total loans |
$ | 648 | $ | 519 | $ | 624 | $ | 567 | $ | 514 | 25 | 26 | $ | 1,791 | $ | 1,542 | 16 | |||||||||||||||||||||||
NET CHARGE-OFFS/(RECOVERIES) |
||||||||||||||||||||||||||||||||||||||||
Wholesale loans |
$ | (151 | ) | $ | 80 | $ | 165 | $ | 271 | $ | 266 | NM | NM | $ | 94 | $ | 1,456 | (94 | ) | |||||||||||||||||||||
Consumer loans, excluding credit card |
1,159 | 1,213 | 1,329 | 2,162 | (b) | 1,546 | (4 | ) | (25 | ) | 3,701 | 5,747 | (36 | ) | ||||||||||||||||||||||||||
Credit card loans |
1,499 | 1,810 | 2,226 | 2,671 | 3,133 | (17 | ) | (52 | ) | 5,535 | 11,366 | (51 | ) | |||||||||||||||||||||||||||
Total loans |
$ | 2,507 | $ | 3,103 | $ | 3,720 | $ | 5,104 | (b) | $ | 4,945 | (19 | ) | (49 | ) | $ | 9,330 | $ | 18,569 | (50 | ) | |||||||||||||||||||
NET CHARGE-OFF RATES |
||||||||||||||||||||||||||||||||||||||||
Wholesale retained loans |
(0.24) | % | 0.14 | % | 0.30 | % | 0.49 | % | 0.49 | % | 0.05 | % | 0.92 | % | ||||||||||||||||||||||||||
Consumer retained loans, excluding credit card |
1.47 | 1.53 | 1.66 | 2.60 | (b) | 1.83 | 1.56 | 2.24 | ||||||||||||||||||||||||||||||||
Credit card retained loans |
4.70 | 5.82 | 6.97 | 7.85 | 8.87 | 5.83 | 10.31 | |||||||||||||||||||||||||||||||||
Total retained loans |
1.44 | 1.83 | 2.22 | 2.95 | (b) | 2.84 | 1.83 | 3.53 | ||||||||||||||||||||||||||||||||
Consumer retained loans, excluding credit card and |
||||||||||||||||||||||||||||||||||||||||
PCI loans (a) |
1.88 | 1.96 | 2.14 | 3.34 | (b) | 2.36 | 1.99 | 2.89 | ||||||||||||||||||||||||||||||||
Consumer retained loans, excluding PCI loans (a) |
2.84 | 3.25 | 3.77 | 4.89 | 4.64 | 3.29 | 5.54 | |||||||||||||||||||||||||||||||||
Total retained loans, excluding PCI loans (a) |
1.60 | 2.04 | 2.48 | 3.31 | (b) | 3.19 | 2.03 | 3.98 | ||||||||||||||||||||||||||||||||
Memo: Average Retained Loans |
||||||||||||||||||||||||||||||||||||||||
Wholesale loans |
$ | 250,145 | $ | 237,511 | $ | 226,544 | $ | 219,750 | $ | 213,979 | 5 | 17 | $ | 238,153 | $ | 211,540 | 13 | |||||||||||||||||||||||
Consumer retained loans, excluding credit card |
312,341 | 317,862 | 323,961 | 330,524 | 336,078 | (2 | ) | (7 | ) | 318,012 | 343,639 | (7 | ) | |||||||||||||||||||||||||||
Credit card retained loans |
126,535 | 124,762 | 129,535 | 134,999 | 140,059 | 1 | (10 | ) | 126,933 | 147,326 | (14 | ) | ||||||||||||||||||||||||||||
Total average retained loans |
$ | 689,021 | $ | 680,135 | $ | 680,040 | $ | 685,273 | $ | 690,116 | 1 | — | $ | 683,098 | $ | 702,505 | (3 | ) | ||||||||||||||||||||||
Consumer retained loans, excluding credit card and
PCI loans (a) |
$ | 244,337 | $ | 248,028 | $ | 252,403 | $ | 256,884 | $ | 260,394 | (1 | ) | (6 | ) | $ | 248,226 | $ | 265,678 | (7 | ) | ||||||||||||||||||||
Consumer retained loans, excluding PCI loans (a) |
370,872 | 372,790 | 381,938 | 391,883 | 400,453 | (1 | ) | (7 | ) | 375,159 | 413,004 | (9 | ) | |||||||||||||||||||||||||||
Total retained loans, excluding PCI loans (a) |
620,974 | 610,246 | 608,432 | 611,572 | 614,346 | 2 | 1 | 613,263 | 624,442 | (2 | ) | |||||||||||||||||||||||||||||
| (a) | Charge-offs are not recorded on PCI loans until actual losses exceed estimated losses that were recorded as purchase accounting adjustments at the time of acquisition. To date, no charge-offs have been recorded for these loans. | |
| (b) | Net charge-offs and net charge-off rates for the fourth quarter of 2010 include the effect of $632 million of charge-offs related to an adjustment of the estimated net realizable value of the collateral underlying delinquent residential home loans. Excluding this adjustment, net charge-offs for the fourth quarter of 2010 were $1.5 billion for total consumer, excluding credit card loans, and $4.5 billion for total loans. Net charge-off rates excluding this adjustment were 1.84% for total consumer, excluding credit card, 2.59% for total retained loans, 2.36% for total consumer, excluding credit card and PCI loans, and 2.90% for total retained loans, excluding PCI loans. |
Page 36
| JPMORGAN CHASE & CO. CREDIT-RELATED INFORMATION, CONTINUED (in millions) |
|
| QUARTERLY TRENDS | NINE MONTHS ENDED SEPTEMBER 30, | |||||||||||||||||||||||||||||||||||||||
| 3Q11 Change | 2011 Change | |||||||||||||||||||||||||||||||||||||||
| 3Q11 | 2Q11 | 1Q11 | 4Q10 | 3Q10 | 2Q11 | 3Q10 | 2011 | 2010 | 2010 | |||||||||||||||||||||||||||||||
SUMMARY OF CHANGES IN THE ALLOWANCES
|
||||||||||||||||||||||||||||||||||||||||
ALLOWANCE FOR LOAN LOSSES |
||||||||||||||||||||||||||||||||||||||||
Beginning balance |
$ | 28,520 | $ | 29,750 | $ | 32,266 | $ | 34,161 | $ | 35,836 | (4) | % | (20) | % | $ | 32,266 | $ | 31,602 | 2 | % | ||||||||||||||||||||
Cumulative effect of change in accounting principles (a) |
— | — | — | — | — | — | — | — | 7,494 | NM | ||||||||||||||||||||||||||||||
Net charge-offs |
2,507 | 3,103 | 3,720 | 5,104 | 4,945 | (19 | ) | (49 | ) | 9,330 | 18,569 | (50 | ) | |||||||||||||||||||||||||||
Provision for loan losses |
2,351 | 1,872 | 1,196 | 3,207 | 3,244 | 26 | (28 | ) | 5,419 | 13,615 | (60 | ) | ||||||||||||||||||||||||||||
Other |
(14 | ) | 1 | 8 | 2 | 26 | NM | NM | (5 | ) | 19 | NM | ||||||||||||||||||||||||||||
Ending balance |
$ | 28,350 | $ | 28,520 | $ | 29,750 | $ | 32,266 | $ | 34,161 | (1 | ) | (17 | ) | $ | 28,350 | $ | 34,161 | (17 | ) | ||||||||||||||||||||
ALLOWANCE FOR LENDING-RELATED COMMITMENTS |
||||||||||||||||||||||||||||||||||||||||
Beginning balance |
$ | 626 | $ | 688 | $ | 717 | $ | 873 | $ | 912 | (9 | ) | (31 | ) | $ | 717 | $ | 939 | (24 | ) | ||||||||||||||||||||
Cumulative effect of change in accounting principles (a) |
— | — | — | — | — | — | — | — | (18 | ) | NM | |||||||||||||||||||||||||||||
Provision for lending-related commitments |
60 | (62 | ) | (27 | ) | (164 | ) | (21 | ) | NM | NM | (29 | ) | (19 | ) | (53 | ) | |||||||||||||||||||||||
Other |
— | — | (2 | ) | 8 | (18 | ) | — | NM | (2 | ) | (29 | ) | 93 | ||||||||||||||||||||||||||
Ending balance |
$ | 686 | $ | 626 | $ | 688 | $ | 717 | $ | 873 | 10 | (21 | ) | $ | 686 | $ | 873 | (21 | ) | |||||||||||||||||||||
ALLOWANCE FOR LOAN LOSSES BY LOB |
||||||||||||||||||||||||||||||||||||||||
Investment Bank (a) |
$ | 1,337 | $ | 1,178 | $ | 1,330 | $ | 1,863 | $ | 1,976 | 13 | (32 | ) | |||||||||||||||||||||||||||
Retail Financial Services (a) |
15,479 | 15,479 | 15,554 | 15,554 | 15,106 | — | 2 | |||||||||||||||||||||||||||||||||
Card Services & Auto (a) |
8,537 | 8,921 | 9,940 | 11,933 | 14,077 | (4 | ) | (39 | ) | |||||||||||||||||||||||||||||||
Commercial Banking |
2,671 | 2,614 | 2,577 | 2,552 | 2,661 | 2 | — | |||||||||||||||||||||||||||||||||
Treasury & Securities Services |
49 | 74 | 69 | 65 | 54 | (34 | ) | (9 | ) | |||||||||||||||||||||||||||||||
Asset Management |
240 | 222 | 257 | 267 | 257 | 8 | (7 | ) | ||||||||||||||||||||||||||||||||
Corporate/Private Equity |
37 | 32 | 23 | 32 | 30 | 16 | 23 | |||||||||||||||||||||||||||||||||
Total |
$ | 28,350 | $ | 28,520 | $ | 29,750 | $ | 32,266 | $ | 34,161 | (1 | ) | (17 | ) | ||||||||||||||||||||||||||
| (a) | Effective January 1, 2010, the Firm adopted accounting guidance related to VIEs. Upon the adoption of the guidance, the Firm consolidated its Firm-sponsored credit card securitization trusts, its Firm-administered multi-seller conduits and certain other consumer loan securitization entities, primarily mortgage-related. As a result of the consolidation, $7.5 billion of allowance for loan losses were recorded on balance sheet with the consolidation of these entities. |
Page 37
| JPMORGAN CHASE & CO. CREDIT-RELATED INFORMATION, CONTINUED (in millions, except ratio data) |
|
| QUARTERLY TRENDS | ||||||||||||||||||||||||||||
| 3Q11 Change | ||||||||||||||||||||||||||||
| 3Q11 | 2Q11 | 1Q11 | 4Q10 | 3Q10 | 2Q11 | 3Q10 | ||||||||||||||||||||||
ALLOWANCE COMPONENTS AND RATIOS
|
||||||||||||||||||||||||||||
ALLOWANCE FOR LOAN LOSSES
|
||||||||||||||||||||||||||||
Wholesale |
||||||||||||||||||||||||||||
Asset-specific |
$ | 670 | $ | 749 | $ | 1,030 | $ | 1,574 | $ | 1,246 | (11) | % | (46) | % | ||||||||||||||
Formula-based |
3,632 | 3,342 | 3,204 | 3,187 | 3,717 | 9 | (2 | ) | ||||||||||||||||||||
Total wholesale |
4,302 | 4,091 | 4,234 | 4,761 | 4,963 | 5 | (13 | ) | ||||||||||||||||||||
Consumer, excluding credit card |
||||||||||||||||||||||||||||
Asset-specific (a) |
1,016 | 1,049 | 1,067 | 1,075 | 1,088 | (3 | ) | (7 | ) | |||||||||||||||||||
Formula-based |
10,563 | 10,397 | 10,467 | 10,455 | 12,270 | 2 | (14 | ) | ||||||||||||||||||||
PCI |
4,941 | 4,941 | 4,941 | 4,941 | 2,811 | — | 76 | |||||||||||||||||||||
Total consumer, excluding credit card |
16,520 | 16,387 | 16,475 | 16,471 | 16,169 | 1 | 2 | |||||||||||||||||||||
Credit card |
||||||||||||||||||||||||||||
Asset-specific (b) |
3,052 | 3,451 | 3,819 | 4,069 | 4,573 | (12 | ) | (33 | ) | |||||||||||||||||||
Formula-based (b) |
4,476 | 4,591 | 5,222 | 6,965 | 8,456 | (3 | ) | (47 | ) | |||||||||||||||||||
Total credit card |
7,528 | 8,042 | 9,041 | 11,034 | 13,029 | (6 | ) | (42 | ) | |||||||||||||||||||
Total consumer |
24,048 | 24,429 | 25,516 | 27,505 | 29,198 | (2 | ) | (18 | ) | |||||||||||||||||||
Total allowance for loan losses |
28,350 | 28,520 | 29,750 | 32,266 | 34,161 | (1 | ) | (17 | ) | |||||||||||||||||||
Allowance for lending-related commitments |
686 | 626 | 688 | 717 | 873 | 10 | (21 | ) | ||||||||||||||||||||
Total allowance for credit losses |
$ | 29,036 | $ | 29,146 | $ | 30,438 | $ | 32,983 | $ | 35,034 | — | (17 | ) | |||||||||||||||
CREDIT RATIOS |
||||||||||||||||||||||||||||
Wholesale allowance to total wholesale retained loans |
1.68 | % | 1.68 | % | 1.84 | % | 2.14 | % | 2.28 | % | ||||||||||||||||||
Consumer, excluding credit card allowance, to total
consumer, excluding credit card retained loans |
5.33 | 5.20 | 5.13 | 5.03 | 4.86 | |||||||||||||||||||||||
Credit card allowance to total credit card retained loans |
5.93 | 6.41 | 7.24 | 8.14 | 9.55 | |||||||||||||||||||||||
Allowance to total retained loans |
4.09 | 4.16 | 4.40 | 4.71 | 4.97 | |||||||||||||||||||||||
Consumer, excluding credit card allowance, to consumer,
excluding credit card retained nonaccrual loans (c) |
211 | 196 | 192 | 186 | 164 | |||||||||||||||||||||||
Allowance, excluding credit card allowance, to retained non-
accrual loans, excluding credit card nonaccrual loans (c) |
192 | 175 | 157 | 148 | 140 | |||||||||||||||||||||||
Allowance to total retained nonaccrual loans |
262 | 243 | 226 | 225 | 226 | |||||||||||||||||||||||
CREDIT RATIOS, excluding PCI loans (d) |
||||||||||||||||||||||||||||
Consumer, excluding credit card allowance, to total
consumer, excluding credit card retained loans |
4.77 | 4.65 | 4.61 | 4.53 | 5.17 | |||||||||||||||||||||||
Allowance to total retained loans |
3.74 | 3.83 | 4.10 | 4.46 | 5.12 | |||||||||||||||||||||||
Consumer, excluding credit card allowance, to consumer,
excluding credit card retained nonaccrual loans (c) |
148 | 137 | 135 | 131 | 135 | |||||||||||||||||||||||
Allowance, excluding credit card allowance, to retained non-
accrual loans, excluding credit card nonaccrual loans (c) |
147 | 133 | 120 | 114 | 121 | |||||||||||||||||||||||
Allowance to total retained nonaccrual loans |
216 | 201 | 189 | 190 | 208 | |||||||||||||||||||||||
| (a) | The asset-specific consumer, excluding credit card allowance for loan losses, includes troubled debt restructuring reserves of $930 million, $962 million, $970 million, $985 million and $980 million at September 30, 2011, June 30, 2011, March 31, 2011, December 31, 2010 and September 30, 2010, respectively. | |
| (b) | At December 31, 2010, the Firm’s allowance for loan losses on all impaired credit card loans was reclassified to the asset-specific allowance. This reclassification had no incremental impact on the Firm’s allowance for loan losses. Prior periods have been revised to reflect the current presentation. | |
| (c) | The Firm’s policy is generally to exempt credit card loans from being placed on nonaccrual status as permitted by regulatory guidance. Under guidance issued by the FFIEC, credit card loans are charged off by the end of the month in which the account becomes 180 days past due or within 60 days from receiving notification about a specified event (e.g., bankruptcy of the borrower), whichever is earlier. | |
| (d) | Excludes the impact of PCI loans that were acquired as part of the Washington Mutual transaction. |
Page 38
| JPMORGAN CHASE & CO. CREDIT-RELATED INFORMATION, CONTINUED PROVISION FOR CREDIT LOSSES |
|
|
| (in millions) |
| QUARTERLY TRENDS | NINE MONTHS ENDED SEPTEMBER 30, | |||||||||||||||||||||||||||||||||||||||
| 3Q11 Change | 2011 Change | |||||||||||||||||||||||||||||||||||||||
| 3Q11 | 2Q11 | 1Q11 | 4Q10 | 3Q10 | 2Q11 | 3Q10 | 2011 | 2010 | 2010 | |||||||||||||||||||||||||||||||
BY LINE OF BUSINESS
|
||||||||||||||||||||||||||||||||||||||||
Provision for loan losses |
||||||||||||||||||||||||||||||||||||||||
Investment Bank |
$ | (7 | ) | $ | (142 | ) | $ | (409 | ) | $ | (140 | ) | $ | (158 | ) | 95 | % | 96 | % | $ | (558 | ) | $ | (1,053 | ) | 47 | % | |||||||||||||
Retail Financial Services |
1,027 | 994 | 1,199 | 2,418 | 1,397 | 3 | (26 | ) | 3,220 | 6,501 | (50 | ) | ||||||||||||||||||||||||||||
Card Services & Auto |
1,264 | 944 | 353 | 710 | 1,787 | 34 | (29 | ) | 2,561 | 7,866 | (67 | ) | ||||||||||||||||||||||||||||
Commercial Banking |
73 | 73 | 51 | 184 | 192 | — | (62 | ) | 197 | 253 | (22 | ) | ||||||||||||||||||||||||||||
Treasury & Securities Services |
(25 | ) | 5 | 7 | 11 | 6 | NM | NM | (13 | ) | (33 | ) | 61 | |||||||||||||||||||||||||||
Asset Management |
26 | 7 | 5 | 22 | 23 | 271 | 13 | 38 | 69 | (45 | ) | |||||||||||||||||||||||||||||
Corporate/Private Equity |
(7 | ) | (9 | ) | (10 | ) | 2 | (3 | ) | 22 | (133 | ) | (26 | ) | 12 | NM | ||||||||||||||||||||||||
Total provision for loan losses |
$ | 2,351 | $ | 1,872 | $ | 1,196 | $ | 3,207 | $ | 3,244 | 26 | (28 | ) | $ | 5,419 | $ | 13,615 | (60 | ) | |||||||||||||||||||||
Provision for lending-related commitments |
||||||||||||||||||||||||||||||||||||||||
Investment Bank |
$ | 61 | $ | (41 | ) | $ | (20 | ) | $ | (131 | ) | $ | 16 | NM | 281 | $ | — | $ | 124 | NM | ||||||||||||||||||||
Retail Financial Services |
— | — | — | — | — | — | — | — | — | — | ||||||||||||||||||||||||||||||
Card Services & Auto |
— | — | — | (1 | ) | (3 | ) | — | NM | — | (5 | ) | NM | |||||||||||||||||||||||||||
Commercial Banking |
(6 | ) | (19 | ) | (4 | ) | (32 | ) | (26 | ) | 68 | 77 | (29 | ) | (108 | ) | 73 | |||||||||||||||||||||||
Treasury & Securities Services |
5 | (7 | ) | (3 | ) | (1 | ) | (8 | ) | NM | NM | (5 | ) | (24 | ) | 79 | ||||||||||||||||||||||||
Asset Management |
— | 5 | — | 1 | — | NM | — | 5 | (6 | ) | NM | |||||||||||||||||||||||||||||
Corporate/Private Equity |
— | — | — | — | — | — | — | — | — | — | ||||||||||||||||||||||||||||||
Total provision for lending-related commitments |
$ | 60 | $ | (62 | ) | $ | (27 | ) | $ | (164 | ) | $ | (21 | ) | NM | NM | $ | (29 | ) | $ | (19 | ) | (53 | ) | ||||||||||||||||
Provision for credit losses |
||||||||||||||||||||||||||||||||||||||||
Investment Bank |
$ | 54 | $ | (183 | ) | $ | (429 | ) | $ | (271 | ) | $ | (142 | ) | NM | NM | $ | (558 | ) | $ | (929 | ) | 40 | |||||||||||||||||
Retail Financial Services |
1,027 | 994 | 1,199 | 2,418 | 1,397 | 3 | (26 | ) | 3,220 | 6,501 | (50 | ) | ||||||||||||||||||||||||||||
Card Services & Auto |
1,264 | 944 | 353 | 709 | 1,784 | 34 | (29 | ) | 2,561 | 7,861 | (67 | ) | ||||||||||||||||||||||||||||
Commercial Banking |
67 | 54 | 47 | 152 | 166 | 24 | (60 | ) | 168 | 145 | 16 | |||||||||||||||||||||||||||||
Treasury & Securities Services |
(20 | ) | (2 | ) | 4 | 10 | (2 | ) | NM | NM | (18 | ) | (57 | ) | 68 | |||||||||||||||||||||||||
Asset Management |
26 | 12 | 5 | 23 | 23 | 117 | 13 | 43 | 63 | (32 | ) | |||||||||||||||||||||||||||||
Corporate/Private Equity |
(7 | ) | (9 | ) | (10 | ) | 2 | (3 | ) | 22 | (133 | ) | (26 | ) | 12 | NM | ||||||||||||||||||||||||
Total provision for credit losses |
$ | 2,411 | $ | 1,810 | $ | 1,169 | $ | 3,043 | $ | 3,223 | 33 | (25 | ) | $ | 5,390 | $ | 13,596 | (60 | ) | |||||||||||||||||||||
BY PORTFOLIO SEGMENT |
||||||||||||||||||||||||||||||||||||||||
Provision for loan losses |
||||||||||||||||||||||||||||||||||||||||
Wholesale |
$ | 67 | $ | (55 | ) | $ | (359 | ) | $ | 77 | $ | 62 | NM | 8 | $ | (347 | ) | $ | (750 | ) | 54 | |||||||||||||||||||
Consumer, excluding credit card |
1,285 | 1,117 | 1,329 | 2,459 | 1,549 | 15 | (17 | ) | 3,731 | 6,999 | (47 | ) | ||||||||||||||||||||||||||||
Credit card |
999 | 810 | 226 | 671 | 1,633 | 23 | (39 | ) | 2,035 | 7,366 | (72 | ) | ||||||||||||||||||||||||||||
Total provision for loan losses |
$ | 2,351 | $ | 1,872 | $ | 1,196 | $ | 3,207 | $ | 3,244 | 26 | (28 | ) | $ | 5,419 | $ | 13,615 | (60 | ) | |||||||||||||||||||||
Provision for lending-related commitments |
||||||||||||||||||||||||||||||||||||||||
Wholesale |
$ | 60 | $ | (62 | ) | $ | (27 | ) | $ | (163 | ) | $ | (18 | ) | NM | NM | $ | (29 | ) | $ | (14 | ) | (107 | ) | ||||||||||||||||
Consumer, excluding credit card |
— | — | — | (1 | ) | (3 | ) | — | NM | — | (5 | ) | NM | |||||||||||||||||||||||||||
Credit card |
— | — | — | — | — | — | — | — | — | — | ||||||||||||||||||||||||||||||
Total provision for lending-related commitments |
$ | 60 | $ | (62 | ) | $ | (27 | ) | $ | (164 | ) | $ | (21 | ) | NM | NM | $ | (29 | ) | $ | (19 | ) | (53 | ) | ||||||||||||||||
Provision for credit losses |
||||||||||||||||||||||||||||||||||||||||
Wholesale |
$ | 127 | $ | (117 | ) | $ | (386 | ) | $ | (86 | ) | $ | 44 | NM | 189 | $ | (376 | ) | $ | (764 | ) | 51 | ||||||||||||||||||
Consumer, excluding credit card |
1,285 | 1,117 | 1,329 | 2,458 | 1,546 | 15 | (17 | ) | 3,731 | 6,994 | (47 | ) | ||||||||||||||||||||||||||||
Credit card |
999 | 810 | 226 | 671 | 1,633 | 23 | (39 | ) | 2,035 | 7,366 | (72 | ) | ||||||||||||||||||||||||||||
Total provision for credit losses |
$ | 2,411 | $ | 1,810 | $ | 1,169 | $ | 3,043 | $ | 3,223 | 33 | (25 | ) | $ | 5,390 | $ | 13,596 | (60 | ) | |||||||||||||||||||||
Page 39
| JPMORGAN CHASE & CO. MARKET RISK-RELATED INFORMATION (in millions) |
|
| QUARTERLY TRENDS | NINE MONTHS ENDED SEPTEMBER 30, | |||||||||||||||||||||||||||||||||||||||
| 3Q11 Change | 2011 Change | |||||||||||||||||||||||||||||||||||||||
| 3Q11 | 2Q11 | 1Q11 | 4Q10 | 3Q10 | 2Q11 | 3Q10 | 2011 | 2010 | 2010 | |||||||||||||||||||||||||||||||
95% CONFIDENCE LEVEL- AVERAGE IB TRADING VAR,
CREDIT PORTFOLIO VAR AND OTHER VAR |
||||||||||||||||||||||||||||||||||||||||
IB VaR by risk type: |
||||||||||||||||||||||||||||||||||||||||
Fixed income |
$ | 48 | $ | 45 | $ | 49 | $ | 53 | $ | 72 | 7 | % | (33) | % | $ | 47 | $ | 68 | (31) | % | ||||||||||||||||||||
Foreign exchange |
10 | 9 | 11 | 10 | 9 | 11 | 11 | 10 | 11 | (9 | ) | |||||||||||||||||||||||||||||
Equities |
19 | 25 | 29 | 23 | 21 | (24 | ) | (10 | ) | 24 | 22 | 9 | ||||||||||||||||||||||||||||
Commodities and other |
15 | 16 | 13 | 14 | 13 | (6 | ) | 15 | 15 | 16 | (6 | ) | ||||||||||||||||||||||||||||
Diversification benefit to IB trading VaR (a) |
(39 | ) | (37 | ) | (38 | ) | (38 | ) | (38 | ) | (5 | ) | (3 | ) | (38 | ) | (43 | ) | 12 | |||||||||||||||||||||
IB trading VaR (b) |
53 | 58 | 64 | 62 | 77 | (9 | ) | (31 | ) | 58 | 74 | (22 | ) | |||||||||||||||||||||||||||
Credit portfolio VaR (c) |
38 | 27 | 26 | 26 | 30 | 41 | 27 | 30 | 25 | 20 | ||||||||||||||||||||||||||||||
Diversification benefit to IB trading and credit portfolio VaR (a) |
(21 | ) | (8 | ) | (7 | ) | (10 | ) | (8 | ) | (163 | ) | (163 | ) | (11 | ) | (9 | ) | (22 | ) | ||||||||||||||||||||
Total IB trading and credit portfolio VaR |
70 | 77 | 83 | 78 | 99 | (9 | ) | (29 | ) | 77 | 90 | (14 | ) | |||||||||||||||||||||||||||
Mortgage Production and Servicing VaR (d) |
40 | 20 | 16 | 17 | 24 | 100 | 67 | 25 | 24 | 4 | ||||||||||||||||||||||||||||||
Chief Investment Office VaR (e) |
48 | 51 | 60 | 49 | 53 | (6 | ) | (9 | ) | 53 | 65 | (18 | ) | |||||||||||||||||||||||||||
Diversification benefit to total other VaR (a) |
(15 | ) | (10 | ) | (14 | ) | (10 | ) | (15 | ) | (50 | ) | — | (13 | ) | (14 | ) | 7 | ||||||||||||||||||||||
Total other VaR |
73 | 61 | 62 | 56 | 62 | 20 | 18 | 65 | 75 | (13 | ) | |||||||||||||||||||||||||||||
Diversification benefit to total IB and other VaR (a) |
(35 | ) | (44 | ) | (57 | ) | (39 | ) | (52 | ) | 20 | 33 | (45 | ) | (66 | ) | 32 | |||||||||||||||||||||||
Total IB and other VaR (f) |
$ | 108 | $ | 94 | $ | 88 | $ | 95 | $ | 109 | 15 | (1 | ) | $ | 97 | $ | 99 | (2 | ) | |||||||||||||||||||||
| (a) | Average VaR was less than the sum of the VaR of the components described above, which is due to portfolio diversification. The diversification effect reflects the fact that the risks were not perfectly correlated. The risk of a portfolio of positions is therefore usually less than the sum of the risks of the positions themselves. | |
| (b) | IB trading VaR includes substantially all trading activities in IB, including the credit spread sensitivity of certain mortgage products and syndicated lending facilities that the Firm intends to distribute; however, particular risk parameters of certain products are not fully captured, for example, correlation risk. IB trading VaR does not include the DVA taken on derivative and structured liabilities to reflect the credit quality of the Firm. | |
| (c) | Credit portfolio VaR includes the derivative CVA, hedges of the CVA and MTM hedges of the retained loan portfolio, which are all reported in principal transactions revenue. This VaR does not include the retained loan portfolio, which is not MTM. | |
| (d) | Mortgage Production and Servicing VaR includes the Firm’s mortgage pipeline and warehouse, MSR and all related hedges. | |
| (e) | CIO VaR includes positions, primarily in debt securities and credit products, used to manage structural risk and other risks, including interest rate, credit and mortgage risks arising from the Firm’s ongoing business activities. | |
| (f) | Total IB and other VaR excludes the retained credit portfolio, which is not marked to market (but it does include hedges of those positions), and certain nontrading activity, such as principal investing (e.g., mezzanine financing, tax-oriented investments, etc.), and certain securities and investments held by Corporate/Private Equity, including private equity investments, capital management positions and longer-term corporate investments managed by the CIO. |
Page 40
| JPMORGAN CHASE & CO. CAPITAL AND OTHER SELECTED BALANCE SHEET ITEMS (in millions, except ratio data) |
|
| September 30, 2011 | |||||||||||||||||||||||||||||||||||||||||
| Change | NINE MONTHS ENDED SEPTEMBER 30, | ||||||||||||||||||||||||||||||||||||||||
| Sep 30 | Jun 30 | Mar 31 | Dec 31 | Sep 30 | Jun 30 | Sep 30 | 2011 Change | ||||||||||||||||||||||||||||||||||
| 2011 | 2011 | 2011 | 2010 | 2010 | 2011 | 2010 | 2011 | 2010 | 2010 | ||||||||||||||||||||||||||||||||
CAPITAL |
|||||||||||||||||||||||||||||||||||||||||
Tier 1 capital |
$ | 147,823 | (e) | $ | 148,880 | $ | 147,234 | $ | 142,450 | $ | 139,381 | (1 | )% | 6 | % | ||||||||||||||||||||||||||
Total capital |
186,547 | (e) | 187,899 | 186,417 | 182,216 | 180,740 | (1 | ) | 3 | ||||||||||||||||||||||||||||||||
Tier 1 common capital (a) |
120,234 | (e) | 121,209 | 119,598 | 114,763 | 110,842 | (1 | ) | 8 | ||||||||||||||||||||||||||||||||
Risk-weighted assets |
1,220,554 | (e) | 1,198,711 | 1,192,536 | 1,174,978 | 1,170,158 | 2 | 4 | |||||||||||||||||||||||||||||||||
Adjusted average assets (b) |
2,168,678 | (e) | 2,129,510 | 2,041,153 | 2,024,515 | 1,975,479 | 2 | 10 | |||||||||||||||||||||||||||||||||
Tier 1 capital ratio |
12.1 | (e)% | 12.4 | % | 12.3 | % | 12.1 | % | 11.9 | % | |||||||||||||||||||||||||||||||
Total capital ratio |
15.3 | (e) | 15.7 | 15.6 | 15.5 | 15.4 | |||||||||||||||||||||||||||||||||||
Tier 1 common capital ratio (a) |
9.9 | (e) | 10.1 | 10.0 | 9.8 | 9.5 | |||||||||||||||||||||||||||||||||||
Tier 1 leverage ratio |
6.8 | (e) | 7.0 | 7.2 | 7.0 | 7.1 | |||||||||||||||||||||||||||||||||||
TANGIBLE COMMON EQUITY (period-end) (c) |
|||||||||||||||||||||||||||||||||||||||||
Common stockholders’ equity |
$ | 174,487 | $ | 175,079 | $ | 172,798 | $ | 168,306 | $ | 166,030 | — | 5 | |||||||||||||||||||||||||||||
Less: Goodwill |
48,180 | 48,882 | 48,856 | 48,854 | 48,736 | (1 | ) | (1 | ) | ||||||||||||||||||||||||||||||||
Less: Other intangible assets |
3,396 | 3,679 | 3,857 | 4,039 | 3,982 | (8 | ) | (15 | ) | ||||||||||||||||||||||||||||||||
Add: Deferred tax liabilities (d) |
2,645 | 2,632 | 2,603 | 2,586 | 2,656 | — | — | ||||||||||||||||||||||||||||||||||
Total tangible common equity |
$ | 125,556 | $ | 125,150 | $ | 122,688 | $ | 117,999 | $ | 115,968 | — | 8 | |||||||||||||||||||||||||||||
TANGIBLE COMMON EQUITY (average) (c) |
|||||||||||||||||||||||||||||||||||||||||
Common stockholders’ equity |
$ | 174,454 | $ | 174,077 | $ | 169,415 | $ | 166,812 | $ | 163,962 | — | 6 | $ | 172,667 | $ | 159,737 | 8 | % | |||||||||||||||||||||||
Less: Goodwill |
48,631 | 48,834 | 48,846 | 48,831 | 48,745 | — | — | 48,770 | 48,546 | — | |||||||||||||||||||||||||||||||
Less: Other intangible assets |
3,545 | 3,738 | 3,928 | 4,054 | 4,094 | (5 | ) | (13 | ) | 3,736 | 4,221 | (11 | ) | ||||||||||||||||||||||||||||
Add: Deferred tax liabilities (d) |
2,639 | 2,618 | 2,595 | 2,621 | 2,620 | 1 | 1 | 2,617 | 2,575 | 2 | |||||||||||||||||||||||||||||||
Total tangible common equity |
$ | 124,917 | $ | 124,123 | $ | 119,236 | $ | 116,548 | $ | 113,743 | 1 | 10 | $ | 122,778 | $ | 109,545 | 12 | ||||||||||||||||||||||||
INTANGIBLE ASSETS (period-end) |
|||||||||||||||||||||||||||||||||||||||||
Goodwill |
$ | 48,180 | $ | 48,882 | $ | 48,856 | $ | 48,854 | $ | 48,736 | (1 | ) | (1 | ) | |||||||||||||||||||||||||||
Mortgage servicing rights |
7,833 | 12,243 | 13,093 | 13,649 | 10,305 | (36 | ) | (24 | ) | ||||||||||||||||||||||||||||||||
Purchased credit card relationships |
668 | 744 | 820 | 897 | 974 | (10 | ) | (31 | ) | ||||||||||||||||||||||||||||||||
All other intangibles |
2,728 | 2,935 | 3,037 | 3,142 | 3,008 | (7 | ) | (9 | ) | ||||||||||||||||||||||||||||||||
Total intangibles |
$ | 59,409 | $ | 64,804 | $ | 65,806 | $ | 66,542 | $ | 63,023 | (8 | ) | (6 | ) | |||||||||||||||||||||||||||
DEPOSITS (period-end) |
|||||||||||||||||||||||||||||||||||||||||
U.S. offices: |
|||||||||||||||||||||||||||||||||||||||||
Noninterest-bearing |
$ | 323,058 | $ | 287,654 | $ | 244,136 | $ | 228,555 | $ | 219,302 | 12 | 47 | |||||||||||||||||||||||||||||
Interest-bearing |
484,640 | 469,618 | 468,654 | 455,237 | 435,405 | 3 | 11 | ||||||||||||||||||||||||||||||||||
Non-U.S. offices: |
|||||||||||||||||||||||||||||||||||||||||
Noninterest-bearing |
14,724 | 13,422 | 11,644 | 10,917 | 10,646 | 10 | 38 | ||||||||||||||||||||||||||||||||||
Interest-bearing |
270,286 | 277,991 | 271,395 | 235,660 | 237,785 | (3 | ) | 14 | |||||||||||||||||||||||||||||||||
Total deposits |
$ | 1,092,708 | $ | 1,048,685 | $ | 995,829 | $ | 930,369 | $ | 903,138 | 4 | 21 | |||||||||||||||||||||||||||||
| (a) | The Firm uses Tier 1 common capital along with the other capital measures to assess and monitor its capital position. The Tier 1 common capital ratio, a non-GAAP financial measure, is Tier 1 common capital divided by risk-weighted assets. For further discussion of Tier 1 common capital ratio, see page 44. | |
| (b) | Adjusted average assets, for purposes of calculating the leverage ratio, include total quarterly average assets adjusted for unrealized gains/(losses) on securities, less deductions for disallowed goodwill and other intangible assets, investments in certain subsidiaries, and the total adjusted carrying value of nonfinancial equity investments that are subject to deductions from Tier 1 capital. | |
| (c) | ROTCE, a non-GAAP financial ratio, measures the Firm’s earnings as a percentage of tangible common equity. In management’s view, these measures are meaningful to the Firm, as well as analysts and investors in assessing the Firm’s use of equity and in facilitating comparisons with competitors. For further discussion, see page 44. | |
| (d) | Represents deferred tax liabilities related to tax-deductible goodwill and to identifiable intangibles created in non-taxable transactions, which are netted against goodwill and other intangibles when calculating TCE. | |
| (e) | Estimated. |
Page 41
| JPMORGAN CHASE & CO. MORTGAGE LOAN REPURCHASE LIABILITY (in millions) |
|
| QUARTERLY TRENDS | NINE MONTHS ENDED SEPTEMBER 30, | |||||||||||||||||||||||||||||||||||||||
| 3Q11 Change | 2011 Change | |||||||||||||||||||||||||||||||||||||||
| 3Q11 | 2Q11 | 1Q11 | 4Q10 | 3Q10 | 2Q11 | 3Q10 | 2011 | 2010 | 2010 | |||||||||||||||||||||||||||||||
MORTGAGE
LOAN REPURCHASE LIABILITY (a) |
||||||||||||||||||||||||||||||||||||||||
Summary of changes in mortgage repurchase liability: |
||||||||||||||||||||||||||||||||||||||||
Repurchase liability at beginning of period |
$ | 3,631 | $ | 3,474 | $ | 3,285 | $ | 3,307 | $ | 2,332 | 5 | % | 56 | % | $ | 3,285 | $ | 1,705 | 93 | % | ||||||||||||||||||||
Realized losses (b) |
(329 | ) | (241 | ) | (231 | ) | (371 | ) | (489 | ) | (37 | ) | 33 | (801 | ) | (1,052 | ) | 24 | ||||||||||||||||||||||
Provision for repurchase losses |
314 | 398 | 420 | 349 | 1,464 | (21 | ) | (79 | ) | 1,132 | 2,654 | (57 | ) | |||||||||||||||||||||||||||
Repurchase liability at end of period |
$ | 3,616 | $ | 3,631 | $ | 3,474 | $ | 3,285 | $ | 3,307 | — | 9 | $ | 3,616 | $ | 3,307 | 9 | |||||||||||||||||||||||
Outstanding repurchase demands and unresolved mortgage
insurance rescission notices by counterparty type: (c)(d) |
||||||||||||||||||||||||||||||||||||||||
GSEs and other |
$ | 2,133 | $ | 1,826 | $ | 1,321 | $ | 1,251 | $ | 1,333 | 17 | 60 | $ | 2,133 | $ | 1,333 | 60 | |||||||||||||||||||||||
Mortgage insurers |
1,112 | 1,093 | 1,240 | 1,121 | 1,007 | 2 | 10 | 1,112 | 1,007 | 10 | ||||||||||||||||||||||||||||||
Overlapping population (e) |
(155 | ) | (145 | ) | (127 | ) | (104 | ) | (109 | ) | (7 | ) | (42 | ) | (155 | ) | (109 | ) | (42 | ) | ||||||||||||||||||||
Total |
$ | 3,090 | $ | 2,774 | $ | 2,434 | $ | 2,268 | $ | 2,231 | 11 | 39 | $ | 3,090 | $ | 2,231 | 39 | |||||||||||||||||||||||
Quarterly mortgage repurchase demands received by loan
origination vintage: (c)(d) |
||||||||||||||||||||||||||||||||||||||||
Pre-2005 |
$ | 34 | $ | 32 | $ | 15 | $ | 39 | $ | 31 | 6 | 10 | $ | 81 | $ | 85 | (5 | ) | ||||||||||||||||||||||
2005 |
200 | 57 | 45 | 73 | 67 | 251 | 199 | 302 | 218 | 39 | ||||||||||||||||||||||||||||||
2006 |
232 | 363 | 158 | 198 | 213 | (36 | ) | 9 | 753 | 752 | — | |||||||||||||||||||||||||||||
2007 |
602 | 510 | 381 | 539 | 537 | 18 | 12 | 1,493 | 1,506 | (1 | ) | |||||||||||||||||||||||||||||
2008 |
323 | 301 | 249 | 254 | 191 | 7 | 69 | 873 | 475 | 84 | ||||||||||||||||||||||||||||||
Post-2008 |
153 | 89 | 94 | 65 | 46 | 72 | 233 | 336 | 119 | 182 | ||||||||||||||||||||||||||||||
Total |
$ | 1,544 | $ | 1,352 | $ | 942 | $ | 1,168 | $ | 1,085 | 14 | 42 | $ | 3,838 | $ | 3,155 | 22 | |||||||||||||||||||||||
| (a) | For further details regarding the Firm’s mortgage repurchase liability, see Mortgage repurchase liability on pages 53-56 and Note 21, on pages 167-170, of JPMorgan Chase’s second quarter Form 10-Q. | |
| (b) | Includes principal losses and accrued interest on repurchased loans, “make-whole” settlements, settlements with claimants, and certain related expense. Make-whole settlements were $162 million, $126 million, $115 million, $152 million and $225 million for the three months ended September 30, 2011, June 30, 2011, March 31, 2011, December 31, 2010 and September 30, 2010, respectively, and $403 million and $480 million for the nine months ended September 30, 2011 and 2010, respectively. | |
| (c) | In the second quarter of 2011, prior periods were revised to include repurchase demands and mortgage insurance rescission notices related to certain loans sold or deposited into private-label securitizations. The Firm’s outstanding repurchase demands are predominantly from the GSEs. | |
| (d) | Excludes amounts related to Washington Mutual. | |
| (e) | Because the GSEs may make repurchase demands based on mortgage insurance rescission notices that remain unresolved, certain loans may be subject to both an unresolved mortgage insurance rescission notice and an unresolved repurchase demand. |
Page 42
| JPMORGAN CHASE & CO. PER SHARE-RELATED INFORMATION (in millions, except per share and ratio data) |
|
| QUARTERLY TRENDS | NINE MONTHS ENDED SEPTEMBER 30, | |||||||||||||||||||||||||||||||||||||||
| 3Q11 Change | 2011 Change | |||||||||||||||||||||||||||||||||||||||
| 3Q11 | 2Q11 | 1Q11 | 4Q10 | 3Q10 | 2Q11 | 3Q10 | 2011 | 2010 | 2010 | |||||||||||||||||||||||||||||||
EARNINGS PER SHARE DATA |
||||||||||||||||||||||||||||||||||||||||
Basic earnings per share: |
||||||||||||||||||||||||||||||||||||||||
Net income |
$ | 4,262 | $ | 5,431 | $ | 5,555 | $ | 4,831 | $ | 4,418 | (22) | % | (4) | % | $ | 15,248 | $ | 12,539 | 22 | % | ||||||||||||||||||||
Less: Preferred stock dividends |
157 | 158 | 157 | 157 | 160 | (1 | ) | (2 | ) | 472 | 485 | (3 | ) | |||||||||||||||||||||||||||
Net income applicable to common equity |
4,105 | 5,273 | 5,398 | 4,674 | 4,258 | (22 | ) | (4 | ) | 14,776 | 12,054 | 23 | ||||||||||||||||||||||||||||
Less: Dividends and undistributed earnings allocated to
participating securities |
169 | 206 | 262 | 262 | 239 | (18 | ) | (29 | ) | 635 | 701 | (9 | ) | |||||||||||||||||||||||||||
Net income applicable to common stockholders |
$ | 3,936 | $ | 5,067 | $ | 5,136 | $ | 4,412 | $ | 4,019 | (22 | ) | (2 | ) | $ | 14,141 | $ | 11,353 | 25 | |||||||||||||||||||||
Total weighted-average basic shares outstanding |
3,859.6 | 3,958.4 | 3,981.6 | 3,917.0 | 3,954.3 | (2 | ) | (2 | ) | 3,933.2 | 3,969.4 | (1 | ) | |||||||||||||||||||||||||||
Net income per share |
$ | 1.02 | $ | 1.28 | $ | 1.29 | $ | 1.13 | $ | 1.02 | (20 | ) | — | $ | 3.60 | $ | 2.86 | 26 | ||||||||||||||||||||||
Diluted earnings per share: |
||||||||||||||||||||||||||||||||||||||||
Net income applicable to common stockholders |
$ | 3,936 | $ | 5,067 | $ | 5,136 | $ | 4,412 | $ | 4,019 | (22 | ) | (2 | ) | $ | 14,141 | $ | 11,353 | 25 | |||||||||||||||||||||
Total weighted-average basic shares outstanding |
3,859.6 | 3,958.4 | 3,981.6 | 3,917.0 | 3,954.3 | (2 | ) | (2 | ) | 3,933.2 | 3,969.4 | (1 | ) | |||||||||||||||||||||||||||
Add: Employee stock options, SARs and warrants (a) |
12.6 | 24.8 | 32.5 | 18.2 | 17.6 | (49 | ) | (28 | ) | 23.3 | 21.3 | 9 | ||||||||||||||||||||||||||||
Total weighted-average diluted shares outstanding (b) |
3,872.2 | 3,983.2 | 4,014.1 | 3,935.2 | 3,971.9 | (3 | ) | (3 | ) | 3,956.5 | 3,990.7 | (1 | ) | |||||||||||||||||||||||||||
Net income per share |
$ | 1.02 | $ | 1.27 | $ | 1.28 | $ | 1.12 | $ | 1.01 | (20 | ) | 1 | $ | 3.57 | $ | 2.84 | 26 | ||||||||||||||||||||||
COMMON SHARES OUTSTANDING |
||||||||||||||||||||||||||||||||||||||||
Common shares — at period end |
3,798.9 | 3,910.2 | 3,986.6 | 3,910.3 | 3,925.8 | (3 | ) | (3 | ) | 3,798.9 | 3,925.8 | (3 | ) | |||||||||||||||||||||||||||
Cash dividends declared per share |
$ | 0.25 | $ | 0.25 | $ | 0.25 | (f) | $ | 0.05 | $ | 0.05 | — | 400 | $ | 0.75 | $ | 0.15 | 400 | ||||||||||||||||||||||
Book value per share |
45.93 | 44.77 | 43.34 | 43.04 | 42.29 | 3 | 9 | 45.93 | 42.29 | 9 | ||||||||||||||||||||||||||||||
Dividend payout ratio |
24 | % | 19 | % | 20 | % | 4 | % | 5 | % | 21 | % | 5 | % | ||||||||||||||||||||||||||
SHARE PRICE (c) |
||||||||||||||||||||||||||||||||||||||||
High |
$ | 42.55 | $ | 47.80 | $ | 48.36 | $ | 43.12 | $ | 41.70 | (11 | ) | 2 | $ | 48.36 | $ | 48.20 | — | ||||||||||||||||||||||
Low |
28.53 | 39.24 | 42.65 | 36.21 | 35.16 | (27 | ) | (19 | ) | 28.53 | 35.16 | (19 | ) | |||||||||||||||||||||||||||
Close |
30.12 | 40.94 | 46.10 | 42.42 | 38.06 | (26 | ) | (21 | ) | 30.12 | 38.06 | (21 | ) | |||||||||||||||||||||||||||
Market capitalization |
114,422 | 160,083 | 183,783 | 165,875 | 149,418 | (29 | ) | (23 | ) | 114,422 | 149,418 | (23 | ) | |||||||||||||||||||||||||||
COMMON EQUITY REPURCHASE PROGRAM (d) |
||||||||||||||||||||||||||||||||||||||||
Aggregate common equity repurchased |
$ | 4,424.9 | (e) | $ | 3,479.8 | $ | 95.0 | $ | 685.2 | $ | 2,178.1 | 27 | 103 | $ | 7,999.7 | (e) | $ | 2,313.4 | 246 | |||||||||||||||||||||
Common equity repurchased |
127.4 | (e) | 80.3 | 2.1 | 17.9 | 56.5 | 59 | 125 | 209.8 | (e) | 60.0 | 250 | ||||||||||||||||||||||||||||
Average purchase price |
$ | 34.72 | (e) | $ | 43.33 | $ | 45.66 | $ | 38.37 | $ | 38.52 | (20 | ) | (10 | ) | $ | 38.12 | (e) | $ | 38.53 | (1 | ) | ||||||||||||||||||
| (a) | Excluded from the computation of diluted EPS (due to the antidilutive effect) were options issued under employee benefit plans and the warrants originally issued in 2008 under the U.S. Treasury’s Capital Purchase Program to purchase shares of the Firm’s common stock. The aggregate number of shares issuable upon the exercise of such options and warrants was 197 million, 53 million, 85 million, 233 million and 236 million, for the three months ended September 30, 2011, June 30, 2011, March 31, 2011, December 31, 2010 and September 30, 2010, respectively, and 112 million and 233 million for the nine months ended September 30, 2011 and 2010, respectively. | |
| (b) | Participating securities were included in the calculation of diluted EPS using the two-class method, as this computation was more dilutive than the calculation using the treasury stock method. | |
| (c) | Share prices shown for JPMorgan Chase’s common stock are from the New York Stock Exchange. JPMorgan Chase’s common stock is also listed and traded on the London Stock Exchange and the Tokyo Stock Exchange. | |
| (d) | On March 18, 2011, the Board of Directors authorized the repurchase of up to $15.0 billion of the Firm’s common equity, of which up to $8.0 billion of common equity repurchases is approved for 2011. The authorization commenced on March 22, 2011, and replaced the Firm’s previous $10.0 billion repurchase program. Management and the Board will continue to assess and make decisions regarding alternatives for deploying capital, as appropriate, over the course of the year. Any planned future dividend increases over the current level, or planned use of the equity repurchase program over the repurchases authorized for 2011, will be reviewed by the Firm with the banking regulators before taking action. | |
| (e) | Includes impact of aggregate repurchases of 10.2 million warrants during the three months ended September 30, 2011. | |
| (f) | On March 18, 2011, the Board of Directors increased the Firm’s quarterly common stock dividend from $0.05 to $0.25 per share. |
Page 43
| JPMORGAN CHASE & CO. NON-GAAP FINANCIAL MEASURES |
|
The following are several of the non-GAAP measures that the Firm uses for various reasons,
including: (i) to allow management to assess the comparability of revenue arising from both taxable
and tax-exempt sources, (ii) to assess and compare the quality and composition of the Firm’s
capital with the capital of other financial services companies, and (iii) more generally, to
provide a more meaningful measure of certain metrics that enables comparability with prior periods,
as well as with competitors.
| (a) | In addition to analyzing the Firm’s results on a reported basis, management reviews the Firm’s results and the results of the lines of business on a “managed” basis, which is a non-GAAP financial measure. The Firm’s definition of managed basis starts with the reported U.S. GAAP results and includes certain reclassifications to present total net revenue for the Firm (and each of the business segments) on a FTE basis. Accordingly, revenue from tax-exempt securities and investments that receive tax credits is presented in the managed results on a basis comparable to taxable securities and investments. This non-GAAP financial measure allows management to assess the comparability of revenue arising from both taxable and tax-exempt sources. The corresponding income tax impact related to tax-exempt items is recorded within income tax expense. These adjustments have no impact on net income as reported by the Firm as a whole or by the lines of business. |
| (b) | The ratio for the allowance for loan losses to end-of-period loans excludes the following: loans accounted for at fair value and loans held-for-sale; purchased credit-impaired (“PCI”) loans; and the allowance for loan losses related to PCI loans. Additionally, Real Estate Portfolios net charge-off rates exclude the impact of PCI loans. |
| (c) | Tangible common equity (“TCE”), a non-GAAP financial measure, represents common stockholders’ equity (i.e., total stockholders’ equity less preferred stock) less goodwill and identifiable intangible assets (other than MSRs), net of related deferred tax liabilities. ROTCE, a non-GAAP financial ratio, measures the Firm’s earnings as a percentage of TCE. In management’s view, these measures are meaningful to the Firm, as well as analysts and investors in assessing the Firm’s use of equity, and in facilitating comparisons with competitors. |
| (d) | Tier 1 common capital ratio is Tier 1 common capital divided by risk-weighted assets. Tier 1 Common Capital (“Tier 1 Common”) is defined as Tier 1 capital less elements of capital not in the form of common equity – such as perpetual preferred stock, noncontrolling interests in subsidiaries and trust preferred capital debt securities. Tier 1 Common, a non-GAAP financial measure, is used by banking regulators, investors and analysts to assess and compare the quality and composition of the Firm’s capital with the capital of other financial services companies. The Firm uses Tier 1 Common along with other capital measures to assess and monitor its capital position. |
| (e) | TSS Firmwide revenue includes certain TSS product revenue and liability balances reported in other lines of business, mainly CB, RFS and AM, related to customers who are also customers of those lines of business. |
| (f) | Retail Financial Services uses the overhead ratio (excluding the amortization of core deposit intangibles (“CDI”)), a non-GAAP financial measure, to evaluate the underlying expense trends of the business. Including CDI amortization expense in the overhead ratio calculation would result in a higher overhead ratio in the earlier years and a lower overhead ratio in later years. This method would therefore result in an improving overhead ratio over time, all things remaining equal. The non-GAAP ratio excludes Consumer & Business Banking’s CDI amortization expense related to prior business combination transactions. |
| (g) | Adjusted assets, a non-GAAP financial measure, equals total assets minus: (1) securities purchased under resale agreements and securities borrowed less securities sold, not yet purchased; (2) assets of consolidated VIEs; (3) cash and securities segregated and on deposit for regulatory and other purposes; (4) goodwill and intangibles; and (5) securities received as collateral. The amount of adjusted assets is presented to assist the reader in comparing IB’s asset and capital levels with those of other investment banks in the securities industry. Asset-to-equity leverage ratios are commonly used as one measure to assess a company’s capital adequacy. IB believes an adjusted asset amount that excludes the assets discussed above, which were considered to have a low risk profile, provides a more meaningful measure of balance sheet leverage in the securities industry. |
Page 44
| JPMORGAN CHASE & CO. GLOSSARY OF TERMS |
|
ACH: Automated Clearing House.
Allowance for loan losses to total loans: Represents period-end allowance for loan losses divided
by retained loans.
Beneficial interests issued by consolidated VIEs: Represents the interest of third-party holders
of debt/equity securities, or other obligations, issued by VIEs that JPMorgan Chase consolidates.
The underlying obligations of the VIEs consist of short-term borrowings, commercial paper and
long-term debt. The related assets consist of trading assets, available-for-sale securities, loans
and other assets.
Contractual credit card charge-off: In accordance with the Federal Financial Institutions
Examination Council policy, credit card loans are charged off by the end of the month in which the
account becomes 180 days past due or within 60 days from receiving notification about a specific
event (e.g., bankruptcy of the borrower), whichever is earlier.
Corporate/Private Equity: Includes Private Equity, Treasury and Chief Investment Office, and
Corporate Other, which includes other centrally managed expense and discontinued operations.
Global Corporate Bank: TSS and IB formed a joint venture to create the Firm’s Global Corporate
Bank. With a team of bankers, the Global Corporate Bank serves multinational clients by providing
them access to TSS products and services and certain IB products, including derivatives, foreign
exchange and debt. The cost of this effort and the credit that the Firm extends to these clients is
shared between TSS and IB.
Interests in purchased receivables: Represents an ownership interest in cash flows of an underlying
pool of receivables transferred by a third-party seller into a bankruptcy-remote entity, generally
a trust.
Managed basis: A non-GAAP presentation of financial results that includes reclassifications to
present revenue on a fully taxable-equivalent basis. Management uses this non-GAAP financial
measure at the segment level, because it believes this provides information to enable investors to
understand the underlying operational performance and trends of the particular business segment and
facilitates a comparison of the business segment with the performance of competitors.
Mark-to-market exposure: A measure, at a point in time, of the value of a derivative or foreign
exchange contract in the open market. When the MTM value is positive, it indicates the counterparty
owes JPMorgan Chase and, therefore, creates credit risk for the Firm. When the MTM value is
negative, JPMorgan Chase owes the counterparty; in this situation, the Firm has liquidity risk.
MSR risk management revenue: Includes changes in the fair value of the MSR asset due to
market-based inputs, such as interest rates and volatility, as well as updates to assumptions used
in the MSR valuation model; and derivative valuation adjustments and other, which represents
changes in the fair value of derivative instruments used to offset the impact of changes in the
market-based inputs to the MSR valuation model.
NA: Data is not applicable or available for the period presented.
Net charge-off rate: Represents net charge-offs (annualized) divided by average retained loans for
the reporting period.
Net yield on interest-earning assets: The average rate for interest-earning assets less the
average rate paid for all sources of funds.
NM: Not meaningful.
Overhead ratio: Noninterest expense as a percentage of total net revenue.
Participating securities: Represents unvested stock-based compensation awards containing
nonforfeitable rights to dividends or dividend equivalents (collectively, “dividends”), which are
included in the earnings per share calculation using the two-class method. JPMorgan Chase grants
restricted stock and RSUs to certain employees under its stock-based compensation programs, which
entitle the recipients to receive nonforfeitable dividends during the vesting period on a basis
equivalent to the dividends paid to holders of common stock. These unvested awards meet the
definition of participating securities. Under the two-class method, all earnings (distributed and
undistributed) are allocated to each class of common stock and participating securities, based on
their respective rights to receive dividends.
Pre-provision profit: Pre-provision profit is total net revenue less noninterest expense. The Firm
believes that this financial measure is useful in assessing the ability of a lending institution to
generate income in excess of its provision for credit losses.
Page 45
| JPMORGAN CHASE & CO. GLOSSARY OF TERMS |
|
Pretax margin: Represents income before income tax expense divided by total net revenue, which
is, in management’s view, a comprehensive measure of pretax performance derived by measuring
earnings after all costs are taken into consideration. It is, therefore, another basis that
management uses to evaluate the performance of TSS and AM against the performance of their
respective competitors.
Principal transactions: Realized and unrealized gains and losses from trading activities (including
physical commodities inventories that are accounted for at the lower of cost or fair value) and
changes in fair value associated with financial instruments held predominantly by IB for which the
fair value option was elected. Principal transactions revenue also includes private equity gains
and losses.
Purchased credit-impaired (“PCI”) loans: Acquired loans deemed to be credit-impaired under the
Financial Accounting Standards Board guidance for PCI loans. The guidance allows purchasers to
aggregate credit-impaired loans acquired in the same fiscal quarter into one or more pools,
provided that the loans have common risk characteristics (e.g., FICO score, geographic location). A
pool is then accounted for as a single asset with a single composite interest rate and an aggregate
expectation of cash flows. Wholesale loans are determined to be credit-impaired if they meet the
definition of an impaired loan under U.S. GAAP at the acquisition date. Consumer loans are
determined to be credit-impaired based on specific risk characteristics of the loan, including
product type, LTV ratios, FICO scores, and past due status.
Receivables from customers: Primarily represents margin loans to prime and retail brokerage
customers which are included in accrued interest and accounts receivable on the Consolidated
Balance Sheets for the wholesale lines of business.
Reported basis: Financial statements prepared under U.S. GAAP, which excludes the impact of
taxable-equivalent adjustments.
Retained loans: Loans that are held-for-investment excluding loans held-for-sale and loans at fair
value.
Risk-weighted assets (“RWA”): Risk-weighted assets consist of on- and off-balance sheet assets that
are assigned to one of several broad risk categories and weighted by factors representing their
risk and potential for default. On-balance sheet assets are risk-weighted based on the perceived
credit risk associated with the obligor or counterparty, the nature of any collateral, and the
guarantor, if any. Off-balance sheet assets such as lending-related commitments, guarantees,
derivatives and other applicable off-balance sheet positions are risk-weighted by multiplying the
contractual amount by the appropriate credit conversion factor to determine the on-balance sheet
credit equivalent amount, which is then risk-weighted based on the same factors used for on-balance
sheet assets. Risk-weighted assets also incorporate a measure for the market risk related to
applicable trading assets-debt and equity instruments, and foreign exchange and commodity
derivatives. The resulting risk-weighted values for each of the risk categories are then aggregated
to determine total risk-weighted assets.
Taxable-equivalent basis: Total net revenue for each of the business segments and the Firm is
presented on a tax-equivalent basis. Accordingly, revenue from tax-exempt securities and
investments that receive tax credits is presented in the managed results on a basis comparable to
fully taxable securities and investments. This non-GAAP financial measure allows management to
assess the comparability of revenue arising from both taxable and tax-exempt sources. The
corresponding income tax impact related to these items is recorded within income tax expense.
Troubled debt restructuring (“TDR”): Occurs when the Firm modifies the original terms of a loan
agreement by granting a concession to a borrower that is experiencing financial difficulty.
U.S. GAAP: Accounting principles generally accepted in the United States of America.
Value-at-risk (“VaR”): A measure of the dollar amount of potential loss from adverse market moves
in an ordinary market environment.
Washington Mutual transaction: On September 25, 2008, JPMorgan Chase acquired the banking
operations of Washington Mutual Bank (“Washington Mutual”) from the FDIC. For additional
information, see Note 2 on pages 166-170 of JPMorgan Chase’s 2010 Annual Report.
Page 46
| JPMORGAN CHASE & CO. GLOSSARY OF TERMS |
|
INVESTMENT BANK (IB)
IB’s revenue comprises the following:
Investment banking fees include advisory, equity underwriting, bond underwriting and loan
syndication fees.
Fixed income markets primarily include revenue related to market-making across global fixed income
markets, including foreign exchange, interest rate, credit and commodities markets.
Equities markets primarily include revenue related to market-making across global equity products,
including cash instruments, derivatives, convertibles and Prime Services.
Credit portfolio revenue includes net interest income, fees and loan sale activity, as well as
gains or losses on securities received as part of a loan restructuring, for IB’s credit portfolio.
Credit portfolio revenue also includes the results of risk management related to the Firm’s lending
and derivative activities.
RETAIL FINANCIAL SERVICES (RFS)
Description of selected business metrics within Consumer & Business Banking:
Client investment managed accounts – Assets actively
managed by Chase Wealth Management on behalf of clients. The
percentage of managed accounts is calculated by dividing managed
account assets by total client investment assets.
Active mobile customers – Retail banking users of all mobile platforms, which include: SMS text,
Mobile Browser, iPhone, iPad and Android, who have been active in the past 90 days.
Personal bankers – Retail branch office personnel who acquire, retain and expand new and existing
customer relationships by assessing customer needs and recommending and selling appropriate banking
products and services.
Sales specialists – Retail branch office personnel who specialize in the marketing of a single
product, including mortgages, investments, and business banking, by partnering with the personal
bankers.
Mortgage Production and Servicing revenue comprises the following:
Net production revenue includes net gains or losses on originations and sales of prime and subprime
mortgage loans, other production-related fees and losses related to the repurchase of
previously-sold loans.
Net mortgage servicing revenue includes the following components:
| a) | Operating revenue comprises: |
| • | All gross income earned from servicing third-party mortgage loans, including stated service fees, excess service fees, late fees and other ancillary fees; and |
| • | Modeled servicing portfolio runoff (or time decay). |
| (see next column for continuation) |
RFS (continued)
| b) | Risk management comprises: |
| • | Changes in the fair value of the MSR asset due to market-based inputs, such as interest rates and volatility, as well as updates to assumptions used in the MSR valuation model; and |
| • | Derivative valuation adjustments and other, which represents changes in the fair value of derivative instruments used to offset the impact of changes in the market-based inputs to the MSR valuation model. |
Mortgage origination channels comprise the following:
Retail – Borrowers who are buying or refinancing a home through direct contact with a mortgage
banker employed by the Firm using a branch office, the Internet or by phone. Borrowers are
frequently referred to a mortgage banker by a banker in a Chase branch, real estate brokers, home
builders or other third parties.
Wholesale – A third-party mortgage broker refers loan applications to a mortgage banker at the
Firm. Brokers are independent loan originators that specialize in finding and counseling borrowers
but do not provide funding for loans. The Firm exited the broker channel during 2008.
Correspondent – Banks, thrifts, other mortgage banks and other financial institutions that sell
closed loans to the Firm.
Correspondent negotiated transactions (“CNTs”) – These transactions occur when mid- to large-sized
mortgage lenders, banks and bank-owned mortgage companies sell servicing to the Firm on an
as-originated basis, and exclude purchased bulk servicing transactions. These transactions
supplement traditional production channels and provide growth opportunities in the servicing
portfolio in stable and periods of rising interest rates.
Deposit margin: Represents deposit-related net interest income expressed as a percentage of average
deposits.
CARD SERVICES & AUTO (Card)
Description
of selected business metrics within Card:
Sales volume – Dollar amount of cardmember purchases, net of returns.
Open accounts – Cardmember accounts with charging privileges.
Merchant Services business – A business that processes bank card transactions for merchants.
Bank card volume – Dollar amount of transactions processed for merchants.
Total transactions – Number of transactions and authorizations processed for merchants.
Auto Origination volume – Dollar amount of loans and leases originated.
Commercial Card provides a wide range of payment services to corporate and public sector clients
worldwide through the commercial card products. Services include procurement, corporate travel and
entertainment, expense management services, and Business-to-Business payment solutions.
Page 47
| JPMORGAN CHASE & CO. GLOSSARY OF TERMS |
|
COMMERCIAL BANKING (CB)
CB Client Segments:
| 1. | Middle Market Banking covers corporate, municipal, financial institution and not-for-profit clients, with annual revenue generally ranging between $10 million and $500 million. |
| 2. | Corporate Client Banking covers clients with annual revenue generally ranging between $500 million and $2 billion and focuses on clients that have broader investment banking needs. |
| 3. | Commercial Term Lending primarily provides term financing to real estate investors/owners for multi-family properties as well as financing office, retail and industrial properties. |
| 4. | Real Estate Banking provides full-service banking to investors and developers of institutional-grade real estate properties. |
| 5. | Other primarily includes lending and investment activity within the Community Development Banking and Chase Capital segments. |
CB Revenue:
| 1. | Lending includes a variety of financing alternatives, which are primarily provided on a basis secured by receivables, inventory, equipment, real estate or other assets. Products include term loans, revolving lines of credit, bridge financing, asset-based structures, leases, commercial card products and standby letters of credit. |
| 2. | Treasury services includes a broad range of products and services enabling clients to transfer, invest and manage the receipt and disbursement of funds, while providing the related information reporting. These products and services include U.S. dollar and multi-currency clearing, ACH, lockbox, disbursement and reconciliation services, check deposits, other check and currency-related services, trade finance and logistics solutions, deposit products, sweeps and money market mutual funds. |
| 3. | Investment banking products provide clients with sophisticated capital-raising alternatives, as well as balance sheet and risk management tools through loan syndications, investment-grade debt, asset-backed securities, private placements, high-yield bonds, equity underwriting, advisory, interest rate derivatives, foreign exchange hedges and securities sales. |
| 4. | Other product revenue primarily includes tax-equivalent adjustments generated from Community Development Banking segment activity and certain income derived from principal transactions. |
Description of selected business metrics within CB:
| 1. | Liability balances include deposits, as well as deposits that are swept to on-balance sheet liabilities (e.g., commercial paper, federal funds purchased, time deposits and securities loaned or sold under repurchase agreements) as part of customer cash management programs. |
| 2. | IB revenue, gross represents total revenue related to investment banking products sold to CB clients. |
TREASURY & SECURITIES SERVICES (TSS)
Treasury & Securities Services firmwide metrics include certain TSS product revenue and liability
balances reported in other lines of business related to customers who are also customers of those
other lines of business. In order to capture the firmwide impact of Treasury Services and TSS
products and revenue, management reviews firmwide metrics such as liability balances, revenue and
overhead ratios in assessing financial performance for TSS. Firmwide metrics are necessary, in
management’s view, in order to understand the aggregate TSS business.
Description of a business metric within TSS:
| 1. | Liability balances include deposits, as well as deposits that are swept to on-balance sheet liabilities (e.g., commercial paper, federal funds purchased, time deposits and securities loaned or sold under repurchase agreements) as part of customer cash management programs. |
ASSET MANAGEMENT (AM)
Assets under management – Represent assets actively managed by AM on behalf of Private Banking,
Institutional, and Retail clients. Includes “committed capital not called”, on which AM earns fees.
Excludes assets managed by American Century Companies, Inc. in which the Firm sold its minority
ownership interest on August 31, 2011.
Assets under supervision – Represents assets under management, as well as custody, brokerage,
administration and deposit accounts.
Multi-asset – Any fund or account that allocates assets under management to more than one asset
class (e.g., long-term fixed income, equity, cash, real assets, private equity or hedge funds).
Alternative assets – The following types of assets constitute alternative investments – hedge
funds, currency, real estate and private equity.
AM’s client segments comprise the following:
Institutional brings comprehensive global investment services – including asset management,
pension analytics, asset/liability management and active risk budgeting strategies – to corporate
and public institutions, endowments, foundations, not-for-profit organizations and governments
worldwide.
Retail provides worldwide investment management services and retirement planning and administration
through third-party and direct distribution of a full range of investment vehicles.
Private Banking offers investment advice and wealth management services to high- and
ultra-high-net-worth individuals, families, money managers, business owners and small corporations
worldwide, including investment management, capital markets and risk management, tax and estate
planning, banking, capital raising and specialty-wealth advisory services.
Page 48
| JPMORGAN CHASE & CO. Revised Financial Disclosure |
|
Commencing July 1, 2011, the Firm’s business segments have been reorganized as follows:
| • | Auto and Student Lending transferred from the current Retail Financial Services reportable/operating segment and is now reported with Card Services & Auto in a single reportable/operating segment. | ||
| • | Retail Financial Services continues as a reportable/operating segment, organized in two components: Consumer & Business Banking (formerly Retail Banking) and Mortgage Banking (including Mortgage Production and Servicing, and Real Estate Portfolios). |
All prior period disclosures were revised to conform with the current period presentation.
The chart below provides a mapping of the Firm’s prior reporting to the current presentation.
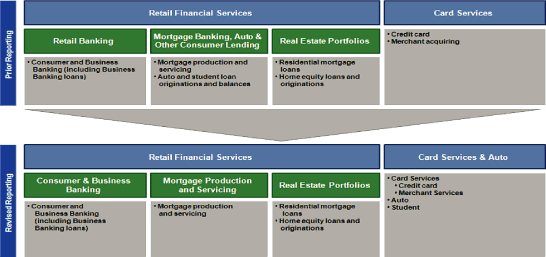
Page 49