Attached files
| file | filename |
|---|---|
| 8-K - 8-K - CubeSmart | a11-27875_18k.htm |
Exhibit 99.1
|
|
Analyst Update & Philadelphia Property Tour October 2011 |
|
|
Contents Operating Fundamentals 3 Investment Activity 6 Balance Sheet Summary 12 Callowhill Street Property Tour 14 Page 2 |
|
|
Operating Fundamentals 3 |
|
|
Operating Fundamentals Update Strong Operating Environment Occupancy gains accelerate Rental rates for new customers increase Rate increases to existing tenants remain robust Dollar amount of discounts per rental declines 4 |
|
|
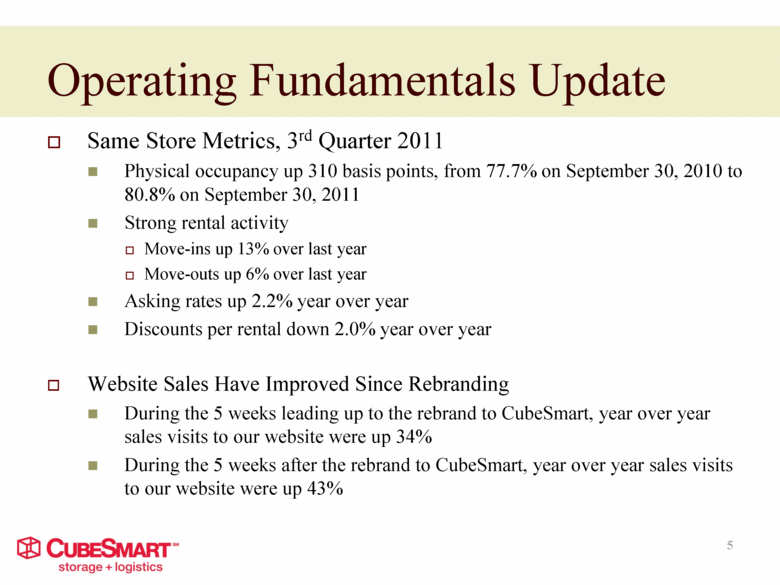
Operating Fundamentals Update Same Store Metrics, 3rd Quarter 2011 Physical occupancy up 310 basis points, from 77.7% on September 30, 2010 to 80.8% on September 30, 2011 Strong rental activity Move-ins up 13% over last year Move-outs up 6% over last year Asking rates up 2.2% year over year Discounts per rental down 2.0% year over year Website Sales Have Improved Since Rebranding During the 5 weeks leading up to the rebrand to CubeSmart, year over year sales visits to our website were up 34% During the 5 weeks after the rebrand to CubeSmart, year over year sales visits to our website were up 43% 5 |
|
|
Investment Activity 6 |
|
|
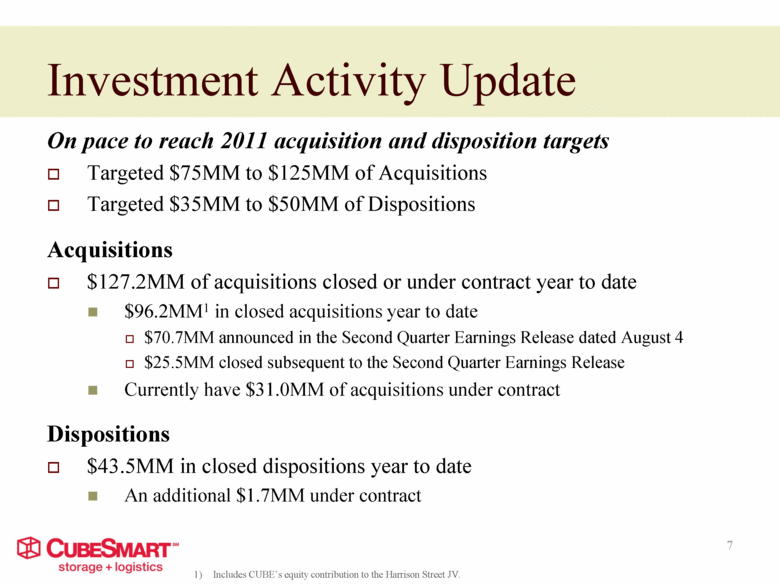
Investment Activity Update Includes CUBE’s equity contribution to the Harrison Street JV. On pace to reach 2011 acquisition and disposition targets Targeted $75MM to $125MM of Acquisitions Targeted $35MM to $50MM of Dispositions Acquisitions $127.2MM of acquisitions closed or under contract year to date $96.2MM1 in closed acquisitions year to date $70.7MM announced in the Second Quarter Earnings Release dated August 4 $25.5MM closed subsequent to the Second Quarter Earnings Release Currently have $31.0MM of acquisitions under contract Dispositions $43.5MM in closed dispositions year to date An additional $1.7MM under contract 7 (1) |
|
|
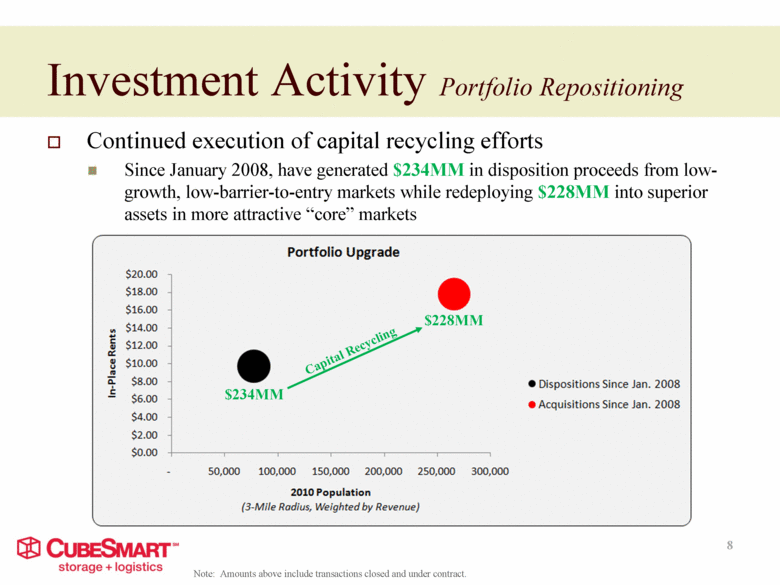
Investment Activity Portfolio Repositioning Continued execution of capital recycling efforts Since January 2008, have generated $234MM in disposition proceeds from low-growth, low-barrier-to-entry markets while redeploying $228MM into superior assets in more attractive “core” markets $234MM $228MM Capital Recycling Note: Amounts above include transactions closed and under contract. 8 |
|
|
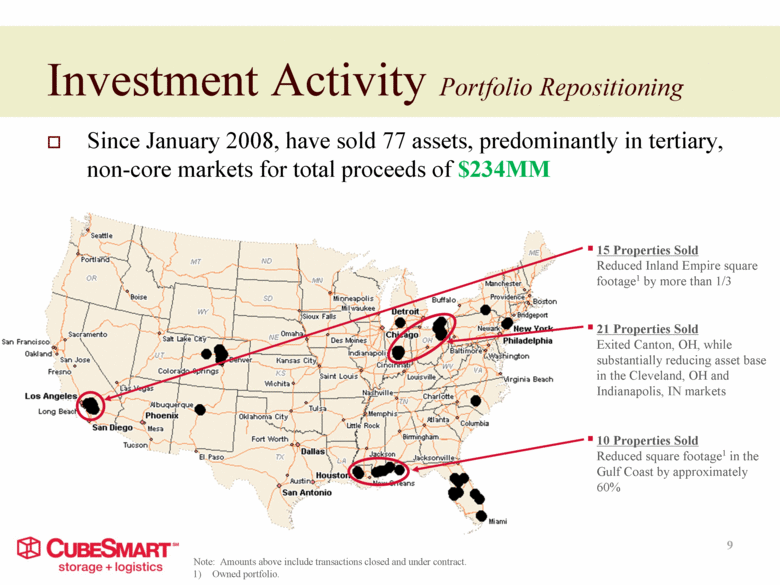
Owned portfolio. Since January 2008, have sold 77 assets, predominantly in tertiary, non-core markets for total proceeds of $234MM 15 Properties Sold Reduced Inland Empire square footage1 by more than 1/3 21 Properties Sold Exited Canton, OH, while substantially reducing asset base in the Cleveland, OH and Indianapolis, IN markets 10 Properties Sold Reduced square footage1 in the Gulf Coast by approximately 60% Investment Activity Portfolio Repositioning 9 Note: Amounts above include transactions closed and under contract. |
|
|
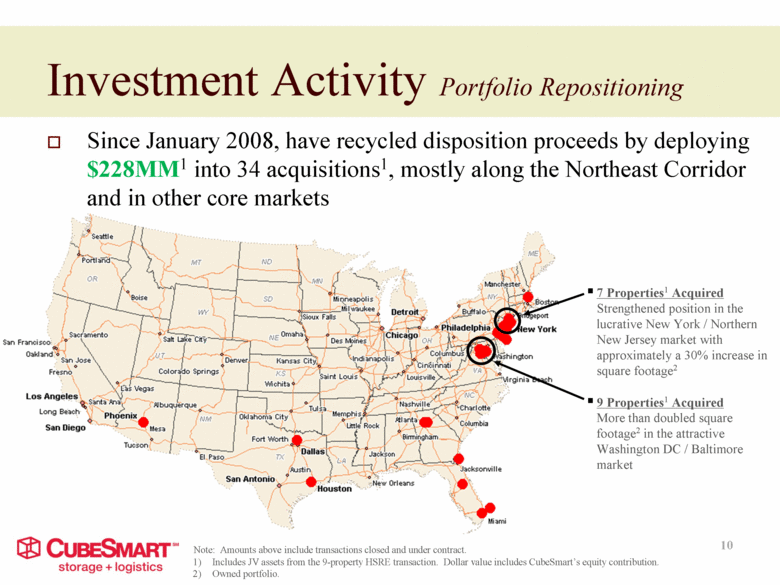
Since January 2008, have recycled disposition proceeds by deploying $228MM1 into 34 acquisitions1, mostly along the Northeast Corridor and in other core markets 7 Properties1 Acquired Strengthened position in the lucrative New York / Northern New Jersey market with approximately a 30% increase in square footage2 9 Properties1 Acquired More than doubled square footage2 in the attractive Washington DC / Baltimore market Includes JV assets from the 9-property HSRE transaction. Dollar value includes CubeSmart’s equity contribution. Owned portfolio. Investment Activity Portfolio Repositioning 10 Note: Amounts above include transactions closed and under contract. |
|
|
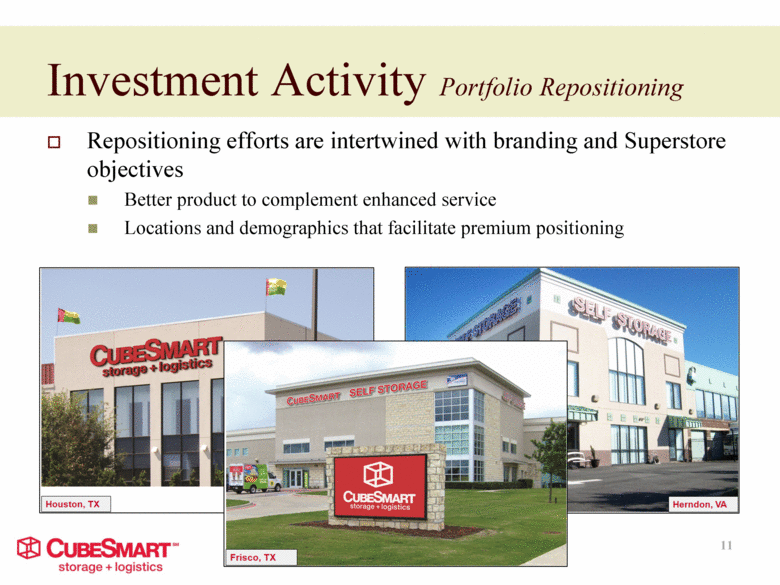
Repositioning efforts are intertwined with branding and Superstore objectives Better product to complement enhanced service Locations and demographics that facilitate premium positioning Investment Activity Portfolio Repositioning 11 |
|
|
Balance Sheet Summary 12 |
|
|
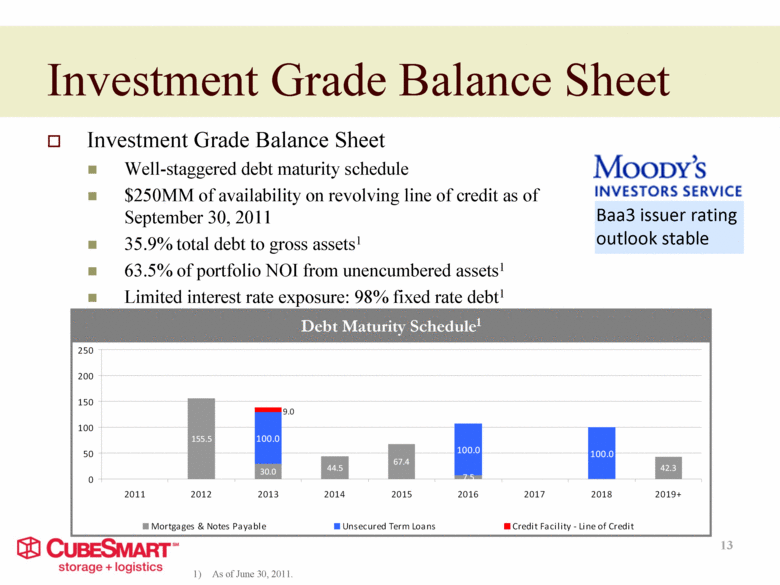
Investment Grade Balance Sheet Well-staggered debt maturity schedule $250MM of availability on revolving line of credit as of September 30, 2011 35.9% total debt to gross assets1 63.5% of portfolio NOI from unencumbered assets1 Limited interest rate exposure: 98% fixed rate debt1 Investment Grade Balance Sheet Debt Maturity Schedule1 Baa3 issuer rating outlook stable 13 As of June 30, 2011. 155.5 30.0 44.5 67.4 7.5 42.3 100.0 100.0 100.0 9.0 0 50 100 150 200 250 2011 2012 2013 2014 2015 2016 2017 2018 2019+ Mortgages & Notes Payable Unsecured Term Loans Credit Facility - Line of Credit (1) |
|
|
Callowhill Street Property Tour 14 |
|
|
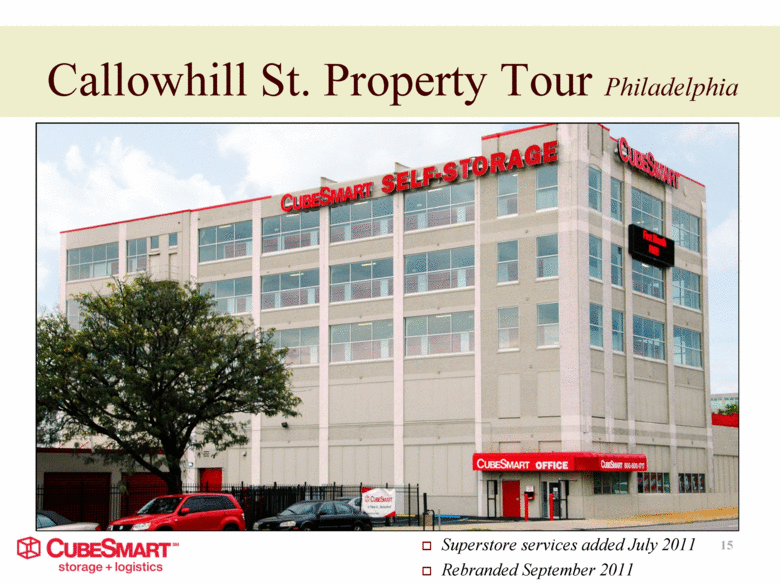
Superstore services added July 2011 Rebranded September 2011 Callowhill St. Property Tour Philadelphia 15 |
|
|
Store offers full suite of services designed to appeal to both the residential and the commercial customer Innovative office re-design features touch screen technology for an interactive customer experience Superstore Focal Wall actively engages customers while presenting traditional self-storage offerings and value-added services Callowhill St. Property Tour Philadelphia 16 |
|
|
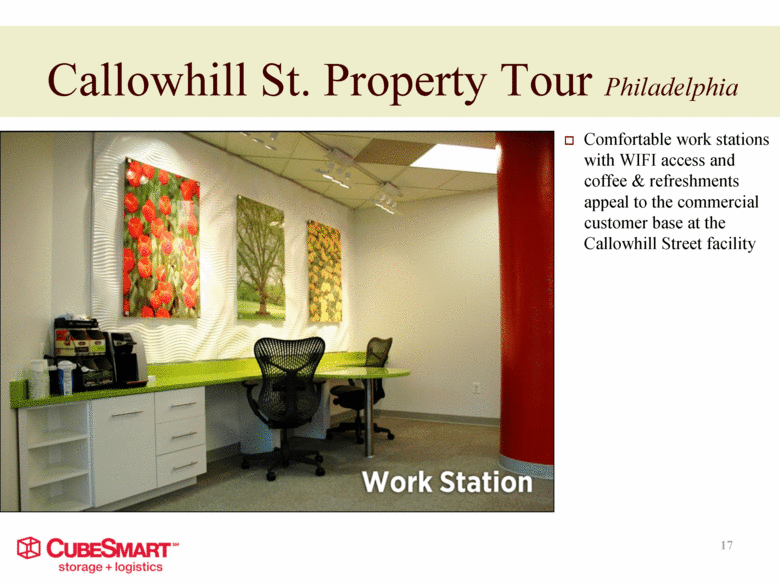
Comfortable work stations with WIFI access and coffee & refreshments appeal to the commercial customer base at the Callowhill Street facility Callowhill St. Property Tour Philadelphia 17 |
|
|
Operational improvement Gained 410 basis points of physical occupancy year over year 92.2% occupied on 9/30/11 vs. 88.1% on 9/30/10 Asking rents increased 5.1% year over year Year to date, Net Rental Income increased 12.4% CubeSmart facility located in Philadelphia’s Center City Converted to a Superstore in July 2011 Rebranded CubeSmart in September 2011 Callowhill St. Property Tour Philadelphia 18 |

