Attached files
| file | filename |
|---|---|
| EX-23.2 - CONSENT OF BDO USA, LLP - New Source Energy Corp | d218427dex232.htm |
| EX-99.1 - REPORT OF RALPH E. DAVIS ASSOCIATES, INC. - New Source Energy Corp | d218427dex991.htm |
| EX-23.3 - CONSENT OF RALPH E. DAVIS ASSOCIATES, INC. - New Source Energy Corp | d218427dex233.htm |
Table of Contents
Index to Financial Statements
As filed with the Securities and Exchange Commission on October 11, 2011
Registration No. 333-176548
UNITED STATES
SECURITIES AND EXCHANGE COMMISSION
Washington, D.C. 20549
Amendment No. 1
to
Form S-1
REGISTRATION STATEMENT
UNDER
THE SECURITIES ACT OF 1933
New Source Energy Corporation
(Exact name of registrant as specified in its charter)
| Delaware |
1311 |
45-2735455 | ||
| (State or other jurisdiction of incorporation or organization) |
(Primary Standard Industrial Classification Code Number) |
(I.R.S. Employer Identification No.) |
914 North Broadway, Suite 230
Oklahoma City, Oklahoma 73102
(405) 272-3028
(Address, including zip code, and telephone number, including area code, of registrant’s principal executive offices)
Kristian B. Kos President and Chief Executive Officer
New Source Energy Corporation
914 North Broadway, Suite 230
Oklahoma City, Oklahoma 73102
(405) 272-3028 (Name, address, including zip code, and telephone number, including area code, of agent for service)
Copies to:
| Roger A. Stong James W. Larimore Crowe & Dunlevy, A Professional Corporation
20 North Broadway, Suite 1800 Oklahoma City, Oklahoma 73102 (405) 235-7700 |
Edward S. Best Dallas Parker Mayer Brown LLP Houston, Texas 77002 |
Approximate date of commencement of proposed sale to the public: As soon as practicable after the effective date of this registration statement.
If any of the securities being registered on this Form are to be offered on a delayed or continuous basis pursuant to Rule 415 under the Securities Act of 1933 check the following box: ¨
If this Form is filed to register additional securities for an offering pursuant to Rule 462(b) under the Securities Act, please check the following box and list the Securities Act registration statement number of the earlier effective registration statement for the same offering. ¨
If this Form is a post-effective amendment filed pursuant to Rule 462(c) under the Securities Act, check the following box and list the Securities Act registration statement number of the earlier effective registration statement for the same offering. ¨
If this Form is a post-effective amendment filed pursuant to Rule 462(d) under the Securities Act, check the following box and list the Securities Act registration statement number of the earlier effective registration statement for the same offering. ¨
Indicate by check mark whether the registrant is a large accelerated filer, an accelerated filer, a non-accelerated filer, or a smaller reporting company. See the definitions of “large accelerated filer,” “accelerated filer” and “smaller reporting company” in Rule 12b-2 of the Exchange Act. (Check one):
| Large accelerated filer ¨ | Accelerated filer ¨ | Non–accelerated filer x | Smaller reporting company ¨ | |||
| (Do not check if a smaller reporting company) |
CALCULATION OF REGISTRATION FEE
|
| ||||
| Title of Each Class of Securities to be Registered |
Proposed Maximum Aggregate Offering Price (1) |
Amount of Registration Fee (2)(3) | ||
| Common Stock, par value $0.001 per share |
$100,000,000 | $11,610 | ||
|
| ||||
|
| ||||
| (1) | Estimated solely for the purpose of calculating the registration fee pursuant to Rule 457(o) under the Securities Act of 1933. |
| (2) | Calculated pursuant to Rule 457(o) under the Securities Act of 1933. |
| (3) | A registration fee of $11,610 was paid previously based on an estimate of the aggregate offering price. |
The registrant hereby amends this registration statement on such date or dates as may be necessary to delay its effective date until the registrant shall file a further amendment which specifically states that this registration statement shall thereafter become effective in accordance with Section 8(a) of the Securities Act of 1933 or until the registration statement shall become effective on such date as the Commission acting pursuant to said Section 8(a), may determine.
Table of Contents
Index to Financial Statements
The information in this prospectus is not complete and may be changed. We may not sell these securities until the registration statement filed with the Securities and Exchange Commission is effective. This prospectus is not an offer to sell these securities and we are not soliciting an offer to buy these securities in any state where the offer or sale is not permitted.
| Prospectus | Subject to Completion, dated October 11, 2011 |
Shares
Common Stock

New Source Energy Corporation
New Source Energy Corporation is offering shares of its common stock. This is our initial public offering and no public market currently exists for our shares. We anticipate that the initial public offering price of our common stock will be between $ and $ per share.
We intend to apply to list our common stock on the New York Stock Exchange under the symbol “NSE.”
Investing in our common stock involves a high degree of risk. See “Risk Factors” beginning on page 15 of this prospectus for a discussion of certain risks that you should consider before investing.
| Per Share | Total | |||||||
| Public offering price |
$ | $ | ||||||
| Underwriting discount and commissions |
$ | $ | ||||||
| Net proceeds to us, before expenses |
$ | $ | ||||||
We have granted the underwriters an option to purchase up to an additional shares from us at the initial public offering price, less underwriting discount and commissions, within 30 days after the date of this offering to cover over-allotments, if any.
The underwriters expect to deliver the shares of common stock to purchasers on , 2011.
Neither the Securities and Exchange Commission nor any state securities commission has approved or disapproved of these securities, or determined if this prospectus is truthful or complete. Any representation to the contrary is a criminal offense.
BMO Capital Markets KeyBanc Capital Markets
The date of this prospectus is , 2011
Table of Contents
Index to Financial Statements

|
|
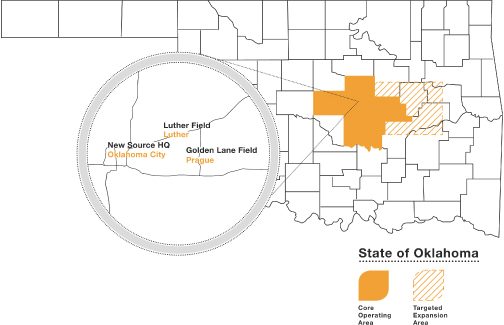
Our core operating area is east-central Oklahoma. We expect to acquire additional properties in and around our core operating area to take advantage of our knowledge, experience, and access to existing infrastructure in the area. We target conventional resource plays in our area of concentration, focusing on the large area of hydrocarbons and water that exists below the free oil zone.
Table of Contents
Index to Financial Statements
| 1 | ||||
| 15 | ||||
| 37 | ||||
| 40 | ||||
| 40 | ||||
| 41 | ||||
| 42 | ||||
| 43 | ||||
| 46 | ||||
| MANAGEMENT’S DISCUSSION AND ANALYSIS OF FINANCIAL CONDITION AND RESULTS OF OPERATIONS |
53 | |||
| 68 | ||||
| 90 | ||||
| 94 | ||||
| 104 | ||||
| 107 | ||||
| 108 | ||||
| 110 | ||||
| MATERIAL U.S. FEDERAL INCOME TAX CONSIDERATIONS TO NON-U.S. HOLDERS |
112 | |||
| 115 | ||||
| 118 | ||||
| 118 | ||||
| 118 | ||||
| 119 |
You should rely only on the information contained in this prospectus and any free writing prospectus prepared by or on behalf of us or to which we have referred you. We have not authorized anyone to provide you with information different from that contained in this prospectus and any free writing prospectus. We are offering to sell shares of common stock and seeking offers to buy shares of common stock only in jurisdictions where offers and sales are permitted. The information in this prospectus is accurate only as of the date of this prospectus, regardless of the time of delivery of this prospectus or any sale of the common stock.
Until , 2011 (the 25th day after the date of this prospectus), all dealers that buy, sell or trade our common stock, whether or not participating in this offering, may be required to deliver a prospectus. This requirement is in addition to the dealers’ obligation to deliver a prospectus when acting as underwriters and with respect to their unsold allotments or subscriptions.
Industry and Market Data
The market data and certain other statistical information used throughout this prospectus are based on independent industry publications, government publications or other published independent sources. Some data is also based on our good faith estimates. Although we believe these third-party sources and estimates are reliable and that the information is accurate and complete, we have not independently verified the third-party information and actual data may differ materially from our estimates.
i
Table of Contents
Index to Financial Statements
This summary provides a brief overview of information contained elsewhere in this prospectus. Because it is abbreviated, this summary does not contain all of the information that you should consider before investing in our common stock. You should read the entire prospectus carefully before making an investment decision, including the information presented under the headings “Risk Factors,” “Cautionary Note Regarding Forward-Looking Statements” and “Management’s Discussion and Analysis of Financial Condition and Results of Operations” and the historical financial statements and unaudited pro forma financial information and related notes thereto included elsewhere in this prospectus. Unless otherwise indicated, information presented in this prospectus assumes that the underwriters’ option to purchase additional shares of our common stock is not exercised. We have provided definitions for certain oil and natural gas terms used in this prospectus under the heading “Glossary of Certain Industry Terms.” In this prospectus, unless the context otherwise requires, the terms “we,” “us,” “our,” and the “company” refer to New Source Energy Corporation.
Unless otherwise stated or the context otherwise requires, all financial, reserve and operations data presented in this prospectus reflect only the portion of our oil and natural gas assets acquired from Scintilla, LLC (“Scintilla”) on August 12, 2011 (the “Scintilla Assets”) and do not reflect the portion of our oil and natural gas assets acquired from certain other parties on August 12, 2011 (the “Other Contributed Assets”). We refer to the Scintilla Assets and the Other Contributed Assets together as the “Acquired Assets.” For further discussion of the accounting treatment of the Acquired Assets, see “Management’s Discussion and Analysis of Financial Condition and Results of Operations—Overview and Basis of Presentation.” For further discussion of our presentation of reserve and operations data, see “Summary Reserve and Operations Data.”
NEW SOURCE ENERGY CORPORATION
We are an independent energy company engaged in the development and production of onshore oil and liquids-rich natural gas projects in the United States. Our primary business strategy is to utilize specialized processes and low cost access to existing infrastructure to consistently and economically develop and produce hydrocarbons from known reservoirs previously deemed not prospective by others. See “Business—Specialized Processes” and “—Our Principal Business Relationships—Low Cost Access.” Our current properties consist of non-operated working interests in the Misener-Hunton (the “Hunton”) formation, a conventional resource reservoir in east-central Oklahoma. This formation has a 90-year history of exploration and development and thousands of wellbore penetrations that have led to more accurate geologic mapping. We believe our position as non-operator and our strategic relationship with our contract operator, New Dominion, LLC (“New Dominion” or our “contract operator”), allow us to significantly reduce our fixed operating expenses by maintaining a limited in-house employee base aside from our management team. We are committed to pursuing conventional resource plays in proximity to our existing asset base that are similar in profile and that carry what we believe is minimal exploration risk. As of December 31, 2010, the estimated proved reserves on our properties were approximately 19.0 MMBoe, of which approximately 47% were classified as proved developed reserves and approximately 60% of which were comprised of oil or natural gas liquids. Average net daily production from our properties during the six months ended June 30, 2011 was 2,504 Boe/d. Based on net production from our properties for the twelve-month period ending December 31, 2010, the total proved reserves of our properties had a reserve to production ratio of 21.6 years.
We were formed on July 12, 2011, to acquire and develop oil and natural gas properties. On August 12, 2011, we acquired the Acquired Assets in exchange for 21.2 million shares of our common stock and $60.0 million in cash. At the time of our acquisition of the Acquired Assets, we became a party to agreements by which New Dominion will continue as the contract operator of these properties. Both Scintilla and New Dominion are owned and controlled by our principal stockholder, chairman and senior geologist, David J. Chernicky. Scintilla has served as Mr. Chernicky’s holding company for his working interests, while New Dominion has acted as the operator of those assets and related infrastructure. New Dominion has operated the Acquired Assets for 12 years,
1
Table of Contents
Index to Financial Statements
completing and economically producing from more than 98% of all wells it has drilled in the Hunton formation using the same specialized processes that will be utilized in the development of our properties. As a result of our strategic relationship with Scintilla and New Dominion, we will benefit from the operational efficiencies in these specialized processes to maintain our low average finding, developing and operating costs.
Under our agreements with Scintilla and New Dominion, we have a right of first refusal to acquire all future oil and natural gas projects they pursue for 25 years, until August 12, 2036. As of June 30, 2011, excluding the Acquired Assets, Scintilla and New Dominion collectively held 121,380 gross (70,422 net) acres of leasehold in other formations above and below the Hunton formation that we believe have reservoir profiles similar to our properties. Pursuant to our right of first refusal agreement, we have the right to acquire oil and natural gas projects from New Dominion and Scintilla at and after the point in time such properties are determined to have proved reserves of oil and natural gas. We believe our strategic partnership with New Dominion and Scintilla and the common ownership of Mr. Chernicky in New Dominion, Scintilla and our company enhance our ability to grow our production and expand our proved reserve base over time. In addition, this relationship provides us with significant control over the rate of development of our long-lived, low cost asset base as compared to other traditional non-operators. It also provides us access to personnel with extensive technical expertise and industry relationships and perpetual access to existing infrastructure at what we believe are favorable rates. See “Business—Material Definitive Agreements” and “Certain Relationships and Related Party Transactions.”
Our properties are located in east-central Oklahoma and consist of mature, legacy oil and natural gas reservoirs. We believe that, through application of specialized processes, our properties are low risk due to predictable production profiles, low decline rates, long reserve lives and modest capital requirements. Our properties consist of non-operated working interests in producing and undeveloped leasehold acreage and in identified producing wells with an average working interest of 60% in our properties within the Luther field and a working interest ranging from 20% to 88% (39% weighted average) in our properties within the Golden Lane field. As of August 12, 2011, we held 32,780 gross (19,604 net) acres in the Luther field and 88,600 gross (34,669 net) acres in the Golden Lane field. Ralph E. Davis Associates, Inc., our independent reserve engineers, estimated the net proved reserves on our properties to be approximately 19.0 MMBoe as of December 31, 2010, 60% of which were classified as oil and natural gas liquids and 40% of which were classified as natural gas. The average net daily production rate from our properties during the six months ended June 30, 2011 was 2,504 Boe/d.
| Estimated Proved Reserves at December 31, 2010 (1) |
Production for the Six Months Ended June 30, 2011 |
Projected 2011 Capital Expenditures (MM) |
Proved Undeveloped Drilling Locations as of December 31, 2010 |
|||||||||||||||||||||||||||||||||||||
| Field |
Total Proved (MBoe) |
Percent of Total |
Percent Proved Developed |
Percent Oil and Liquids |
PV-10 (MM)(2) |
Average Net Daily Production (Boe/d) |
Percent of Total |
|||||||||||||||||||||||||||||||||
| Gross | Net | |||||||||||||||||||||||||||||||||||||||
| Golden Lane |
11,733 | 61.9 | % | 66.8 | % | 68.2 | % | $ | 130.8 | 2,306 | 92.1 | % | $ | 21.8 | 54 | 18.9 | ||||||||||||||||||||||||
| Luther |
7,220 | 38.1 | % | 13.9 | % | 46.3 | % | $ | 69.9 | 198 | 7.9 | % | $ | 4.5 | 40 | 20.0 | ||||||||||||||||||||||||
|
|
|
|
|
|
|
|
|
|
|
|
|
|
|
|
|
|||||||||||||||||||||||||
| Total |
18,953 | 100.0 | % | 46.6 | % | 59.8 | % | $ | 200.7 | 2,504 | 100.0 | % | $ | 26.3 | 94 | 38.9 | ||||||||||||||||||||||||
| (1) | Proved reserves were calculated using prices equal to the twelve-month unweighted arithmetic average of the first-day-of-the-month price for each of the preceding twelve months, which were $79.53 per Bbl of crude oil and $4.39 per Mcf of natural gas. Adjustments were made for location and the grade of the underlying resource, which resulted in an average decrease of $4.00 per Bbl of crude oil and an average decrease of $0.24 per Mcf of natural gas. |
| (2) | PV-10 is a non-GAAP financial measure and represents the present value of estimated future cash inflows from proved oil and natural gas reserves, less future development and production costs, discounted at 10% per annum to reflect timing of future cash flows and using the twelve-month unweighted arithmetic average of the first-day-of-the-month price for each of the preceding twelve months. PV-10 typically differs from the Standardized Measure of Discounted Future Net |
2
Table of Contents
Index to Financial Statements
| Cash Flows (“Standardized Measure”) because it does not include the effects of income tax. However, the Scintilla Assets’ PV-10 and Standardized Measure are equivalent because as of all dates presented the Scintilla Assets were held by a limited liability company not subject to entity-level taxation. Neither PV-10 nor Standardized Measure represents an estimate of fair market value of our natural gas and crude oil properties. PV-10 is used by the industry and by our management as an arbitrary reserve asset value measure to compare against past reserve bases and the reserve bases of other business entities that are not dependent on the taxpaying status of the entity. |
The following table provides an illustration of our historical Standardized Measure, adjusted for the effects of estimated income taxes:
| As of December 31, | ||||||||||||
| 2008 | 2009 | 2010 | ||||||||||
| (In thousands) | ||||||||||||
| Historical Standardized Measure |
$ | 108,794 | $ | 147,038 | $ | 200,735 | ||||||
| Estimated income taxes(a) |
42,321 | 57,198 | 78,086 | |||||||||
|
|
|
|
|
|
|
|||||||
| Standardized Measure, adjusted for the effects of estimated income taxes |
$ | 66,473 | $ | 89,840 | $ | 122,649 | ||||||
|
|
|
|
|
|
|
|||||||
| (a) | Scintilla, which owned the Scintilla Assets before they were contributed to us, was a partnership for federal income tax purposes and, therefore, was not subject to entity-level taxation. Historically, federal or state income taxes have been passed through to the member owners of Scintilla. However, as a corporation, we are subject to U.S. federal and state income taxes. The estimated taxes shown above illustrate the effect of income taxes on net revenues as of December 31, 2008, 2009 and 2010, assuming we had been subject to corporate-level income tax and further assuming an estimated statutory combined 38.9% federal and state income tax rate. |
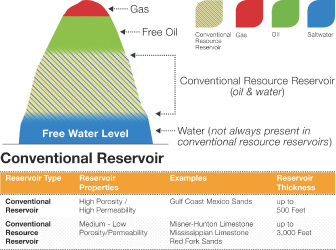
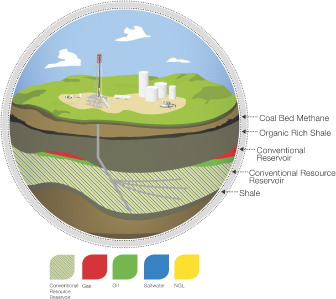
We use the term “conventional resource play” to refer to high water saturation (35 – 99%) hydrocarbon reservoirs that typically have been deemed not prospective by others. Conventional resource plays are usually located around and below conventional reservoirs, although they can exist independently. These reservoirs tend to be continuous hydrocarbon zones existing over a contiguous and potentially large geographical area. Conventional resource plays exhibit low exploration risk with consistent results and predictable estimated ultimate recovery (“EUR”). With the implementation of specialized processes, we believe we have the ability to economically develop these large-scale reservoirs.
The Hunton formation is our primary conventional resource play in east-central Oklahoma. We intend to continue to develop our Golden Lane and Luther fields in this formation where we maintain interests in approximately 249 gross (102.9 net) producing wells. Our acreage position had 94 gross (38.9 net) proved undeveloped (PUD) locations as of December 31, 2010. Our contract operator is currently using two rigs to drill on our properties, which may be increased up to eight over the next twelve months. Our contract operator has completed an average of 25 gross wells per year on our acquired properties over the past six years.
Our 25-year right of first refusal agreement includes, among other potential opportunities, existing rights to produce approximately 70,422 net acres of prospective conventional resource reservoir formations located above and below the Hunton formation, such as the Cleveland, Red Fork, Caney, Mississippian and Arbuckle. These reservoirs have current production and are in the process of being proved up by our contract operator, pending third-party evaluation. We also have identified similar conventional resource play leaseholds held by third parties in and around our primary acreage in east-central Oklahoma that we will attempt to acquire to increase our proved reserves and drilling inventory.
Our method of hydrocarbon recovery relies upon exploiting the reservoir through development, rather than exploration. Our technical team, in conjunction with our contract operator, has geologic and engineering expertise in horizontal well design, submersible pump placement, fluid and hydrocarbon separation and saltwater
3
Table of Contents
Index to Financial Statements
disposal. We believe this experience helps us obtain production efficiencies utilizing methodologies that provide a predictable ultimate recovery of hydrocarbons. In developing new reserves in conventional resource plays, we employ, in conjunction with our contract operator, the following six essential components:
| • | proper geologic assessment of the reservoir, which is facilitated by data from numerous existing well penetrations; |
| • | a well-trained and knowledgeable technical team to maintain efficient production; |
| • | strategic placement of wells to maximize the benefit of wells working in concert to create the appropriate draw down in reservoir pressure; |
| • | an economic high volume saltwater transportation and disposal system; |
| • | abundant and economic high current three-phase electrical power; and |
| • | a high volume liquids-rich gas gathering and processing system. |
Business Strategy
Our objective is to increase stockholder value by increasing reserves, production and cash flows at an attractive return on capital. We intend to accomplish these objectives by executing on the following key strategies:
| • | Focus on Conventional Oil and Liquids-Rich Resource Plays. We are focused on developing and converting conventional oil and liquids-rich resource plays into cost-efficient development projects. This strategy enables us to leverage our expertise in economically producing reserves that previously have been deemed not prospective by others. |
| • | Accelerate Development of Existing Low Cost Proved Inventory. In the near term, we intend to work with our contract operator to accelerate the drilling of our low risk, long lived PUD inventory to maximize the value of our resource potential using existing infrastructure. |
| • | Maintain Our Low Cost Operating Structure. We are focused on continuous improvement of our operating measures. We believe that the size and concentration of our acreage within our project areas provide us with the opportunity to continue to capture economies of scale, including the ability to use existing infrastructure that is contracted at attractive rates. In addition, we, along with our contract operator, attempt to reduce the drilling, completion and infrastructure costs associated with the development of our properties by drilling multiple wells from a single pad site. |
| • | Leverage Strategic Relationships with New Dominion and Scintilla. We intend to maximize the benefits of our relationships with New Dominion and Scintilla to help control our costs, access existing infrastructure at what we believe are favorable rates, reduce exploration risk, and maintain flexibility to determine where and when to deploy our capital. |
| • | Pursue Accretive Acquisitions. We intend to pursue bolt-on acquisitions of properties complementary to our core acreage, including properties subject to our right of first refusal agreement, when we determine such properties carry minimal or no exploration risk. We will pursue additional acquisition opportunities when we believe we possess a strategic or technical advantage due to our existing liquidity, operational experience and access to infrastructure. |
Competitive Strengths
We will rely upon the following combination of strengths to implement our strategies:
| • | Management Team with Proven Ability to Develop Conventional Resource Plays. Our senior management team averages over 25 years of industry experience, including our senior geologist, |
4
Table of Contents
Index to Financial Statements
| David J. Chernicky, who has over 28 years of experience in producing oil and natural gas from conventional resource plays in the area of our core assets. Our management team has developed specialized processes that allow us to develop assets that historically have been deemed not prospective by others. |
| • | Strategic Relationship with Related Parties. Our relationship with Scintilla and New Dominion provides us with access to saltwater disposal and other key infrastructure, drilling rigs, completion services, oilfield equipment and oilfield services at what we believe are favorable rates. In addition, the right of first refusal we hold from Scintilla and New Dominion provides us with an exclusive option to acquire additional assets meeting our reservoir criteria after they have been proved up through the efforts of Scintilla and our contract operator. Our contract operator has a strong track record, completing and economically producing from more than 98% of all wells it has drilled in the Hunton formation since beginning to develop the play in 1999. |
| • | Large, Multi-Year Drilling Inventory with Predictable Results. As of December 31, 2010, there were 94 gross (38.9 net) PUD locations targeting the Hunton formation on our properties. With a large portion of our leasehold held by production and the strategic relationship with our contract operator, we have the ability to influence the timing of our drilling projects. Our reserves have significant production history and predictable decline rates. |
| • | Long-Lived Reserves with High and Increasing Liquids Yield. The average productive life of our wells producing from the Hunton formation (on 640-acre spacing) is 18.5 years. The initial average Btu content of natural gas produced from this formation is approximately 1100 Btu per Mcf, increases at an average of 5% per year and, based on past experience, can ultimately reach approximately 2100 Btu per Mcf. |
| • | Competitive Cost Structure. Our position as non-operator and ability to leverage our strategic relationships allow us to mitigate significant fixed operating expenses by maintaining a limited in-house employee base apart from our management team. Our focus on conventional resource plays utilizing our specialized processes has resulted in average all-in finding and development costs, including revisions, on our properties of $5.77 per Boe over the three-year period ending December 31, 2010. Production costs on our properties averaged $13.12 per Boe over the six-month period ending June 30, 2011. |
| • | Forced Pooling. Oklahoma law allows a working interest owner to commence a “forced pooling” action pursuant to the rules of the Oklahoma Corporation Commission. Such an action, which is very common in Oklahoma, allows the working interest owner to compel the pooling of acreage in the subject spacing unit for the purposes of causing a well or wells to be drilled. Assuming a successful application for a forced pooling order, these provisions will allow us to develop our properties without the risk of another interest owner preventing such development. |
| • | Accessible Centralized Core Geographic Area. All of our existing acreage, as well as many potential opportunities we have identified for future growth, are within a 150-mile radius of our corporate headquarters in Oklahoma City, Oklahoma. This allows us to utilize and extend existing infrastructure at a reduced cost. |
| • | Financial Flexibility. Existing internal cash flow generation allows us to continue the current rate of development of our properties. Pro forma for this offering, we will have minimal indebtedness and $ million of total liquidity, including availability under our credit facility and cash on hand, that will allow us to accelerate growth, make strategic acquisitions and develop additional reservoirs. |
Initial Acquisition of Assets and Related Transactions
On August 12, 2011, we entered into a four-year, $150.0 million credit agreement with a syndicate of banks led by Bank of Montreal providing for a senior secured revolving credit facility with an initial borrowing base of $72.5 million and with a $5.0 million subfacility for standby letters of credit. For a description of the material
5
Table of Contents
Index to Financial Statements
terms of our credit facility, see “Management’s Discussion and Analysis of Financial Condition and Results of Operations—Credit Facility.”
On the same date, pursuant to two contribution agreements, one of which was with Scintilla, an entity controlled by our chairman and senior geologist, David J. Chernicky, we acquired the Acquired Assets, which consist of (i) a working interest ranging from 20% to 88% (39% weighted average) in certain oil and natural gas leases and wells located in the Golden Lane field and producing from the Hunton formation (the “Golden Lane Assets”), and (ii) an approximate 60% working interest in certain oil and natural gas leases and wells located in the Luther field and producing from the Hunton formation (the “Luther Assets”). We issued 20.0 million shares of our common stock and paid a total of $60.0 million in cash, which we borrowed under our credit facility, to Scintilla for the Scintilla Assets. Scintilla immediately transferred the common stock received by it to the David J. Chernicky Trust. In exchange for the Other Contributed Assets, we issued an additional 1.2 million shares of our common stock. Since the Other Contributed Assets were not considered significant acquisitions and were acquired from parties not under common control with us, the Other Contributed Assets are not included in our historical and pro forma financial statements. For further discussion of the accounting treatment of the Acquired Assets, see “Management’s Discussion and Analysis of Financial Condition and Results of Operations—Overview and Basis of Presentation.”
We also entered into a registration rights agreement with the parties contributing the Acquired Assets with customary provisions requiring us to register the shares of our common stock issued in connection with the contribution transactions. All of the contributing parties, including the David J. Chernicky Trust as successor in interest of Scintilla, will be subject to lock-up agreements generally precluding their sale of shares of our common stock for 180 days from the date of this prospectus. See “Underwriting.”
Under agreements entered into in connection with the contribution of assets, we obtained a right of first refusal from Scintilla and New Dominion for a 25-year period to acquire up to 90% of their combined interest in oil and natural gas projects determined to have proved reserves.
We also entered into a new joint operating agreement related to the Luther Assets and became a party to an existing participation agreement related to the Golden Lane Assets pursuant to which New Dominion will serve as the contract operator of these properties. We and the other parties to these agreements have access to New Dominion’s existing infrastructure, particularly saltwater disposal pipelines and wells and electricity, at what we believe are favorable rates.
For further discussion of these and other transactions, see “Business—Material Definitive Agreements” and “Certain Relationships and Related Party Transactions.”
Private Placement of Common Stock
On August 12, 2011, we completed a private placement of 157,500 shares of our common stock at a price of $10.00 per share, solely to accredited investors, raising gross proceeds of approximately $1.6 million. While our existing cash flow is sufficient to maintain our current rate of development, we completed this private placement to provide us with additional financial flexibility pending the completion of this offering.
Summary Risk Factors
Investing in our common stock involves risks that include the speculative nature of oil and natural gas development, competition, volatile oil and natural gas prices and other material factors. In particular, the following considerations may offset our competitive strengths or have a negative effect on activities on our
6
Table of Contents
Index to Financial Statements
properties and our ability to execute our business strategies, which could cause a decrease in the price of our common stock and result in a loss of all or a portion of your investment:
| • | A decline in oil and natural gas prices may adversely affect our business, financial condition or results of operations and our ability to meet our capital expenditure obligations and financial commitments. |
| • | Our future revenues are dependent on our ability to successfully replace our proved producing reserves. |
| • | We do not currently operate any of our properties, and therefore, we will not be able to control the timing of exploration or development efforts, associated costs, or the rate of production of our assets. |
| • | Our agreements with our contract operator contain terms that may be disadvantageous to us. |
| • | We rely on our strategic relationships to access infrastructure that is critical to the development of our assets. Adequate infrastructure may not be available at an economic rate. |
| • | Our identified drilling locations are scheduled to be developed over several years, making them susceptible to uncertainties that could materially alter the occurrence or timing of their drilling. |
| • | Our estimated proved reserves are based on many assumptions that may turn out to be inaccurate. Any significant inaccuracies in these reserve estimates or underlying assumptions will materially affect the quantities and present value of our reserves. |
| • | The present value of future net revenues from our proved reserves will not necessarily be the same as the current market value of our estimated oil and natural gas reserves. |
| • | Our development and acquisition projects require substantial capital expenditures. We may be unable to obtain needed capital or financing on satisfactory terms, which could lead to a decline in our oil and natural gas reserves. |
| • | We expect to be a “controlled company” within the meaning of the NYSE rules and, if applicable, would qualify for and may rely on exemptions from certain corporate governance requirements. |
For a discussion of these risks and other considerations that could negatively affect us, including risks related to this offering and our common stock, see “Risk Factors” beginning on page 16 and “Cautionary Note Regarding Forward-Looking Statements.”
Principal Stockholders
As a result of the transaction by which we acquired the Scintilla Assets, the David J. Chernicky Trust became our principal stockholder. Following the completion of this offering, we expect that the David J. Chernicky Trust will own approximately % of the outstanding shares of our common stock.
Corporate Information
Our principal executive offices are located at 914 N. Broadway, Suite 230, Oklahoma City, Oklahoma 73102, and our telephone number at that address is (405) 272-3028. Our website is www.newsource.com. Information on our website or any other website is not incorporated by reference herein and does not constitute a part of this prospectus.
7
Table of Contents
Index to Financial Statements
THE OFFERING
| Common stock offered by us |
Shares |
| Common stock to be outstanding after this offering |
Shares |
| Over-allotment option |
Shares |
| Use of proceeds |
We expect to receive approximately $ million of net proceeds from the sale of the common stock offered by us, based upon the assumed initial public offering price of $ per share (the midpoint of the price range set forth on the cover page of this prospectus), after deducting underwriting discounts and estimated offering expenses. Each $1.00 increase (decrease) in the public offering price will increase (decrease) our expected net proceeds by approximately $ million. We intend to use a portion of the net proceeds from this offering to repay all outstanding indebtedness under our credit facility, which as of , 2011, was approximately $ million. At the option of certain of our executive officers, we may withhold shares of their common stock to satisfy the withholding tax obligations of the executives incurred upon the vesting of such stock, and a portion of the net proceeds from this offering may be used to pay this withholding tax. The remaining proceeds will be used to fund our development program, to fund acquisitions and for general corporate purposes. See “Use of Proceeds.” |
| Dividend policy |
We do not intend to pay any cash dividends on our common stock for the foreseeable future. Instead, we intend to retain any earnings for use in the operation of our business and to fund future growth. In addition, our credit facility prohibits us from paying cash dividends. See “Dividend Policy.” |
| Proposed New York Stock Exchange listing |
We intend to apply to list shares of our common stock on the New York Stock Exchange (the “NYSE”) under the symbol “NSE.” |
| Risk factors |
You should carefully read and consider the information beginning on page 16 of this prospectus set forth under the heading “Risk Factors” and all other information set forth in this prospectus before deciding to invest in our common stock. |
| Conflict of interest |
Certain of the underwriters or their affiliates currently hold outstanding indebtedness under our credit facility. Because BMO Capital Markets Corp. and its affiliates, and KeyBanc Capital Markets Inc. and its affiliates, will receive, in the aggregate, more than 5% of the net proceeds from this offering as a result of the repayment of such indebtedness from the proceeds of this offering, this offering is being made in compliance with Rule 5121 of the Financial Industry Regulatory Authority (“FINRA”). FINRA Rule 5121 requires that a “qualified independent underwriter” participate in the preparation of the registration statement of which this prospectus forms a part and exercise the usual standards of due diligence with respect thereto. has |
8
Table of Contents
Index to Financial Statements
| assumed the responsibilities of acting as the qualified independent underwriter in this offering. No underwriter having a conflict of interest under FINRA Rule 5121 will confirm sales to any account over which the underwriter exercises discretionary authority without the specific written approval of the accountholder. See “Underwriting.” |
Unless specifically stated otherwise, all information in this prospectus assumes no exercise of the over-allotment option.
9
Table of Contents
Index to Financial Statements
SUMMARY HISTORICAL AND PRO FORMA FINANCIAL DATA
The following tables set forth summary financial data relating to the Scintilla Assets on a historical basis and pro forma to give effect to the acquisition of the Scintilla Assets as of and for the periods indicated. Since the Other Contributed Assets were not considered significant and were acquired from parties not under common control with us, they are not included in our historical and pro forma financial statements. For further discussion of the accounting treatment of the Acquired Assets, see “Management’s Discussion and Analysis of Financial Condition and Results of Operations—Overview and Basis of Presentation.”
The summary historical financial data of the Scintilla Assets as of December 31, 2009 and 2010 and for each of the years ended December 31, 2008, 2009 and 2010 are derived from the audited historical carve-out financial statements of the Scintilla Assets included elsewhere in this prospectus. The summary historical financial data of the Scintilla Assets as of December 31, 2008 are derived from the unaudited historical carve-out financial statements of the Scintilla Assets, which are not included in this prospectus. The summary historical financial data of the Scintilla Assets as of June 30, 2011 and for the six months ended June 30, 2010 and 2011 are derived from the unaudited historical carve-out financial statements of the Scintilla Assets included elsewhere in this prospectus. In management’s opinion, these financial statements include all adjustments necessary for the fair presentation of financial condition as of such dates and results of operations for such periods.
The summary unaudited pro forma financial data give effect to the entry into the $150.0 million credit agreement, the private placement for approximately $1.6 million, the change in tax status and the acquisition of the Scintilla Assets, all of which occurred on August 12, 2011, as well as this offering and the use of proceeds and the associated vesting of restricted common stock granted to management as described in this prospectus. For purposes of preparing the unaudited pro forma financial data, these events are assumed to have occurred on January 1, 2010 for the statement of operations data and as of June 30, 2011 for the balance sheet data. The summary unaudited pro forma financial data are presented for illustrative purposes only and should not be read for any other purpose. You should not rely on this information as being indicative of the historical results that would have been achieved by us or the future results that we will achieve.
The summary historical and pro forma financial data reflect allocated overhead from our predecessor in interest and do not reflect any estimate of additional overhead that we may incur as a separate company. We expect to incur additional annual costs associated with our compliance and disclosure obligations as a public company and to incur significant non-cash compensation expense in the financial quarter in which this offering occurs upon the vesting of restricted common stock granted to management as part of our formation, and our overhead costs could be materially different.
10
Table of Contents
Index to Financial Statements
The summary historical and pro forma financial data should be read in conjunction with “Management’s Discussion and Analysis of Financial Condition and Results of Operations,” “Selected Historical Financial Data,” “Unaudited Pro Forma Financial Data” and the historical carve-out financial statements of the Scintilla Assets and the notes to those financial statements included elsewhere in this prospectus. The financial information included in this prospectus may not be indicative of our future results of operations, financial position and cash flows.
| Year Ended December 31, |
Pro Forma Year Ended December 31, |
Six Months Ended June 30, |
Pro Forma Six Months Ended June 30, |
|||||||||||||||||||||||||
| 2008 | 2009 | 2010 | 2010 | 2010 | 2011 | 2011 | ||||||||||||||||||||||
| (unaudited) | (unaudited) |
(unaudited) | (unaudited) | |||||||||||||||||||||||||
| (In thousands, except per share amounts) | ||||||||||||||||||||||||||||
| Statement of Operations Data |
||||||||||||||||||||||||||||
| Revenues: |
||||||||||||||||||||||||||||
| Oil sales |
$ | 5,753 | $ | 4,389 | $ | 5,336 | $ | 5,336 | $ | 2,814 | $ | 2,331 | $ | 2,331 | ||||||||||||||
| Natural gas liquids and natural gas sales |
53,150 | 26,668 | 36,388 | 36,388 | 18,086 | 22,020 | 22,020 | |||||||||||||||||||||
|
|
|
|
|
|
|
|
|
|
|
|
|
|
|
|||||||||||||||
| Total revenues |
58,903 | 31,057 | 41,724 | 41,724 | 20,900 | 24,351 | 24,351 | |||||||||||||||||||||
|
|
|
|
|
|
|
|
|
|
|
|
|
|
|
|||||||||||||||
| Operating costs and expenses: |
||||||||||||||||||||||||||||
| Oil and natural gas production expenses |
13,711 | 9,368 | 11,069 | 11,069 | 5,194 | 5,945 | 5,945 | |||||||||||||||||||||
| General and administrative |
460 | 578 | 670 | 670 | 326 | 784 | 784 | |||||||||||||||||||||
| Depreciation, depletion, and amortization |
11,611 | 10,529 | 11,371 | 11,371 | 5,615 | 5,253 | 5,253 | |||||||||||||||||||||
| Accretion expense |
34 | 44 | 51 | 51 | 25 | 29 | 29 | |||||||||||||||||||||
|
|
|
|
|
|
|
|
|
|
|
|
|
|
|
|||||||||||||||
| Total operating costs and expenses |
25,816 | 20,519 | 23,161 | 23,161 | 11,160 | 12,011 | 12,011 | |||||||||||||||||||||
|
|
|
|
|
|
|
|
|
|
|
|
|
|
|
|||||||||||||||
| Operating income |
33,087 | 10,538 | 18,563 | 18,563 | 9,740 | 12,340 | 12,340 | |||||||||||||||||||||
| Other income (expense): |
||||||||||||||||||||||||||||
| Interest expense |
(2,536 | ) | (1,943 | ) | (2,648 | ) | (984 | ) | (1,314 | ) | (1,444 | ) | (492 | ) | ||||||||||||||
| Realized and unrealized gains (losses) from derivatives |
(352 | ) | — | (574 | ) | (574 | ) | 2,438 | (2,758 | ) | (2,758 | ) | ||||||||||||||||
|
|
|
|
|
|
|
|
|
|
|
|
|
|
|
|||||||||||||||
| Income before income tax expense |
30,199 | 8,595 | 15,341 | 17,005 | 10,864 | 8,138 | 9,090 | |||||||||||||||||||||
| Income tax expense |
— | — | — | 6,020 | — | — | 3,222 | |||||||||||||||||||||
|
|
|
|
|
|
|
|
|
|
|
|
|
|
|
|||||||||||||||
| Net income |
$ | 30,199 | $ | 8,595 | $ | 15,341 | $ | 10,985 | $ | 10,864 | $ | 8,138 | $ | 5,868 | ||||||||||||||
|
|
|
|
|
|
|
|
|
|
|
|
|
|
|
|||||||||||||||
| Net income per common share (1) |
||||||||||||||||||||||||||||
| Basic and diluted |
$ | $ | ||||||||||||||||||||||||||
|
|
|
|
|
|||||||||||||||||||||||||
| Weighted average shares outstanding |
||||||||||||||||||||||||||||
| Basic and diluted |
||||||||||||||||||||||||||||
|
|
|
|
|
|||||||||||||||||||||||||
| (1) | Scintilla, which owned the Scintilla Assets before they were contributed to us on August 12, 2011, was a limited liability company with ownership interests represented by units rather than shares. |
11
Table of Contents
Index to Financial Statements
| As of December 31, | As
of June 30, 2011 |
Pro Forma As of June 30, 2011 |
||||||||||||||||||
| 2008 | 2009 | 2010 | ||||||||||||||||||
| (unaudited) | (unaudited) | (unaudited) | ||||||||||||||||||
| (In thousands) | ||||||||||||||||||||
| Balance Sheet Data: |
||||||||||||||||||||
| Cash and cash equivalents |
$ | — | $ | — | $ | — | $ | — | $ | |||||||||||
| Oil and natural gas sales receivables—related parties |
4,401 | 6,537 | 6,444 | 6,755 | 6,755 | |||||||||||||||
| Other current assets |
— | — | 994 | 632 | 632 | |||||||||||||||
| Total oil and natural gas properties, net |
80,524 | 92,406 | 108,705 | 118,977 | 118,977 | |||||||||||||||
| Other assets |
49 | — | 1,453 | 1,661 | 2,806 | |||||||||||||||
|
|
|
|
|
|
|
|
|
|
|
|||||||||||
| Total assets |
$ | 84,974 | $ | 98,943 | $ | 117,596 | $ | 128,025 | $ | |||||||||||
|
|
|
|
|
|
|
|
|
|
|
|||||||||||
| Current liabilities |
$ | 3,441 | $ | 2,871 | $ | 6,009 | $ | 5,439 | $ | 5,439 | ||||||||||
| Long-term debt |
60,000 | 60,000 | 60,000 | 60,000 | ||||||||||||||||
| Deferred tax liability |
— | — | — | — | 18,020 | |||||||||||||||
| Other long-term liabilities |
685 | 837 | 2,175 | 2,792 | 2,792 | |||||||||||||||
| Total parent net investment/stockholders’ equity |
20,848 | 35,235 | 49,412 | 59,794 | ||||||||||||||||
|
|
|
|
|
|
|
|
|
|
|
|||||||||||
| Total liabilities and parent net investment/stockholders’ equity |
$ | 84,974 | $ | 98,943 | $ | 117,596 | $ | 128,025 | $ | |||||||||||
|
|
|
|
|
|
|
|
|
|
|
|||||||||||
| Year Ended December 31, | Six Months Ended June 30, |
|||||||||||||||||||
| 2008 | 2009 | 2010 | 2010 | 2011 | ||||||||||||||||
| (unaudited) | (unaudited) | |||||||||||||||||||
| (In thousands) | ||||||||||||||||||||
| Other Financial Data: |
||||||||||||||||||||
| Net cash provided by operating activities |
$ | 45,949 | $ | 17,042 | $ | 28,674 | $ | 15,363 | $ | 15,034 | ||||||||||
| Net cash used in investing activities |
$ | (25,094 | ) | $ | (22,834 | ) | $ | (26,074 | ) | $ | (8,392 | ) | $ | (16,734 | ) | |||||
| Net cash provided by (used in) financing activities |
$ | (20,855 | ) | $ | 5,792 | $ | (2,600 | ) | $ | (6,971 | ) | $ | 1,700 | |||||||
Non-GAAP Financial Measure and Reconciliation
Adjusted EBITDAX
Adjusted EBITDAX is a supplemental non-GAAP financial measure that is used by management and external users of our financial statements, such as industry analysts, investors, lenders and rating agencies, and is not a measure of net income or cash flows as determined by United States generally accepted accounting principles, or GAAP.
We define Adjusted EBITDAX as earnings before interest expense, income taxes, depreciation, depletion and amortization, accretion expense and unrealized derivative gains and losses.
Our management believes Adjusted EBITDAX is useful because it allows us to more effectively evaluate our operating performance and compare the results of our operations from period to period without regard to our financing methods or capital structure. We exclude the items listed above from net income in arriving at Adjusted EBITDAX because these amounts can vary substantially from company to company within our industry depending upon accounting methods and book values of assets, capital structures and the method by which the assets were acquired. Adjusted EBITDAX should not be considered as an alternative to, or more meaningful than, net income or cash flows from operating activities as determined in accordance with GAAP or as an indicator of our operating performance or liquidity. Certain items excluded from Adjusted EBITDAX are
12
Table of Contents
Index to Financial Statements
significant components in understanding and assessing a company’s financial performance, such as a company’s cost of capital and tax structure, as well as the historic costs of depreciable assets, none of which are components of Adjusted EBITDAX. Our computations of Adjusted EBITDAX may not be comparable to other similarly titled measures of other companies. We believe that Adjusted EBITDAX is a widely followed measure of operating performance and may also be used by investors to measure our ability to meet debt service requirements.
The following tables present a reconciliation of the non-GAAP financial measure of Adjusted EBITDAX to the GAAP financial measures of net income and net cash provided by operating activities, respectively.
| Year Ended December, 31 | Six Months Ended June 30, |
|||||||||||||||||||
| 2008 | 2009 | 2010 | 2010 | 2011 | ||||||||||||||||
| (unaudited) | (unaudited) | |||||||||||||||||||
| (In thousands) | ||||||||||||||||||||
| Adjusted EBITDAX Reconciliation to Net Income: |
||||||||||||||||||||
| Net income |
$ | 30,199 | $ | 8,595 | $ | 15,341 | $ | 10,864 | $ | 8,138 | ||||||||||
| Unrealized (gain) loss on derivative instruments |
62 | — | 1,429 | (2,027 | ) | 1,819 | ||||||||||||||
| Accretion expense |
34 | 44 | 51 | 25 | 29 | |||||||||||||||
| Interest expense |
2,536 | 1,943 | 2,648 | 1,314 | 1,444 | |||||||||||||||
| Depreciation, depletion and amortization |
11,611 | 10,529 | 11,371 | 5,615 | 5,253 | |||||||||||||||
|
|
|
|
|
|
|
|
|
|
|
|||||||||||
| Adjusted EBITDAX |
$ | 44,442 | $ | 21,111 | $ | 30,840 | $ | 15,791 | $ | 16,683 | ||||||||||
|
|
|
|
|
|
|
|
|
|
|
|||||||||||
| Adjusted EBITDAX Reconciliation to Net Cash Provided By Operating Activities: |
||||||||||||||||||||
| Net cash provided by operating activities |
$ | 45,949 | $ | 17,042 | $ | 28,674 | $ | 15,363 | $ | 15,034 | ||||||||||
| Cash interest expense |
2,485 | 1,894 | 2,262 | 1,167 | 1,205 | |||||||||||||||
| Changes in operating assets and liabilities |
(3,992 | ) | 2,175 | (96 | ) | (739 | ) | 444 | ||||||||||||
|
|
|
|
|
|
|
|
|
|
|
|||||||||||
| Adjusted EBITDAX |
$ | 44,442 | $ | 21,111 | $ | 30,840 | $ | 15,791 | $ | 16,683 | ||||||||||
|
|
|
|
|
|
|
|
|
|
|
|||||||||||
13
Table of Contents
Index to Financial Statements
SUMMARY RESERVE AND OPERATIONS DATA
The following tables present summary information regarding the estimated net proved oil and natural gas reserves and the historical operating data relating to the Scintilla Assets. The estimates of net proved reserves at December 31, 2010 are based on the December 31, 2010 reserve report prepared by Ralph E. Davis Associates, Inc., our independent reserve engineers.
For additional information regarding our reserves, please see “Business—Our Operations” and the unaudited supplementary information of the Scintilla Assets included elsewhere in this prospectus.
| Reserves | ||||||||||||||||
| As of December 31, 2010 | ||||||||||||||||
| Reserves Category(1) |
Crude Oil (MBbls) |
Natural Gas (MMcf) |
Natural Gas Liquids (MBbls) |
Total (MBoe)(2) |
||||||||||||
| Proved developed: |
176 | 16,579 | 5,901 | 8,840 | ||||||||||||
| Proved undeveloped: |
146 | 29,086 | 5,119 | 10,113 | ||||||||||||
|
|
|
|
|
|
|
|
|
|||||||||
| Total proved |
322 | 45,665 | 11,020 | 18,953 | ||||||||||||
| (1) | All reserves are located within the United States. |
| (2) | Determined using the ratio of 6 Mcf of natural gas being equivalent to one Bbl of crude oil. |
| Year Ended December 31, |
Six Months Ended June 30, |
|||||||||||||||||||
| 2008 | 2009 | 2010 | 2010 | 2011 | ||||||||||||||||
| Net Sales Data: |
||||||||||||||||||||
| Crude oil (Bbls) |
58,784 | 74,908 | 70,422 | 37,627 | 24,331 | |||||||||||||||
| Natural gas liquids and natural gas (Boe) |
885,940 | 836,842 | 807,070 | 400,628 | 428,870 | |||||||||||||||
|
|
|
|
|
|
|
|
|
|
|
|||||||||||
| Total crude oil equivalent (Boe)(1) |
944,724 | 911,750 | 877,492 | 438,255 | 453,201 | |||||||||||||||
| Average daily volumes (Boe/day) |
2,581 | 2,498 | 2,404 | 2,421 | 2,504 | |||||||||||||||
| Average Sales Price (Excluding Derivatives): |
||||||||||||||||||||
| Crude oil (per Bbl) |
$ | 97.87 | $ | 58.59 | $ | 75.77 | $ | 74.79 | $ | 95.80 | ||||||||||
| Natural gas liquids and natural gas (per Boe) |
59.99 | 31.87 | 45.09 | 45.14 | 51.34 | |||||||||||||||
| Average equivalent price (per Boe) |
62.35 | 34.06 | 47.55 | 47.69 | 53.73 | |||||||||||||||
| Expenses (per Boe): |
||||||||||||||||||||
| Lease operating expenses |
$ | 5.83 | $ | 5.55 | $ | 6.33 | $ | 5.62 | $ | 6.45 | ||||||||||
| Workover |
5.41 | 3.39 | 2.90 | 2.88 | 3.94 | |||||||||||||||
| Production taxes |
3.27 | 1.33 | 3.38 | 3.35 | 2.73 | |||||||||||||||
| General and administrative |
0.49 | 0.63 | 0.76 | 0.74 | 1.73 | |||||||||||||||
| Depreciation, depletion and amortization |
12.29 | 11.55 | 12.96 | 12.81 | 11.59 | |||||||||||||||
| (1) | Determined using the ratio of 6 Mcf gas to 1 Bbl of crude oil |
14
Table of Contents
Index to Financial Statements
An investment in our common stock involves risks. You should carefully consider the risks described below before investing in our common stock. The risks and uncertainties described below are not the only ones we may face. The following risks, together with additional risks and uncertainties not currently known to us or that we may currently deem immaterial, could impair our financial position and results of operations.
Risks Related to the Oil and Natural Gas Industry and Our Business
A decline in oil and natural gas prices may adversely affect our business, financial condition or results of operations and our ability to meet our capital expenditure obligations and financial commitments.
The price we receive for our oil and natural gas heavily influences our revenue, profitability, access to capital and future rate of growth. Oil and natural gas are commodities and, therefore, their prices are subject to wide fluctuations in response to relatively minor changes in supply and demand. Historically, the markets for oil and natural gas have been volatile. These markets will likely continue to be volatile in the future. The prices we receive for our production, and the levels of our production, depend on numerous factors beyond our control. These factors include the following:
| • | worldwide and regional economic and political conditions impacting the global supply and demand for oil and natural gas; |
| • | the price and quantity of imports of foreign oil and natural gas; |
| • | the level of global oil and natural gas exploration and production; |
| • | the level of global oil and natural gas inventories; |
| • | localized supply and demand fundamentals and transportation availability; |
| • | weather conditions and natural disasters; |
| • | domestic and foreign governmental regulations; |
| • | speculation as to the future price of oil and the speculative trading of oil and natural gas futures contracts; |
| • | price and availability of competitors’ supplies of oil and natural gas; |
| • | the actions of the Organization of Petroleum Exporting Countries, or OPEC; |
| • | technological advances affecting energy consumption; and |
| • | the price and availability of alternative fuels. |
Further, oil prices and natural gas prices do not necessarily fluctuate in direct relationship to each other. Because approximately 60% of our estimated proved reserves as of December 31, 2010 were oil and natural gas liquids reserves, our financial results are more sensitive to movements in oil prices. The price of oil has been extremely volatile, and we expect this volatility to continue. During the year ended December 31, 2010, the daily NYMEX West Texas Intermediate oil spot price ranged from a high of $91.49 per Bbl to a low of $65.96 per Bbl, and the NYMEX natural gas Henry Hub spot price ranged from a high of $7.51 to a low of $3.18 per MMBtu.
Substantially all of our oil production is sold to purchasers under short-term (less than twelve months) contracts at market based prices. Lower oil and natural gas prices will reduce our cash flows, borrowing ability and the present value of our reserves. Lower prices may also reduce the amount of oil and natural gas that we can produce economically and may affect our proved reserves.
15
Table of Contents
Index to Financial Statements
Our future revenues are dependent on our ability to successfully replace our proved producing reserves.
In general, production from oil and natural gas properties declines as reserves are depleted, with the rate of decline depending on reservoir characteristics. Our current proved reserves will decline as reserves are produced and, therefore, our level of production and cash flows will be affected adversely unless we participate in successful development activities or acquire properties containing proved reserves. Thus, our future oil and natural gas production and, therefore, our cash flow and income are highly dependent upon the level of success we, in conjunction with our contract operator, have in finding or acquiring additional reserves. However, we cannot assure you that our future activities will result in any specific amount of additional proved reserves or that our contract operator will be able to drill productive wells at acceptable costs.
Oil and natural gas development activities involve numerous risks, including the risk that no commercially productive oil or gas reservoirs will be produced. In addition, the future cost and timing of drilling, completing and producing wells is often uncertain. Furthermore, drilling operations may be curtailed, delayed or canceled as a result of a variety of factors, including:
| • | lack of acceptable prospective acreage; |
| • | inadequate capital resources; |
| • | reductions in oil and natural gas prices; |
| • | unexpected drilling conditions, including pressure or irregularities in formations and equipment failures or accidents; |
| • | adverse weather conditions, such as tornados, blizzards and ice storms; |
| • | unavailability or high cost of drilling rigs, equipment or labor; |
| • | title problems; |
| • | compliance with governmental regulations; |
| • | delays imposed by or resulting from compliance with regulatory requirements; and |
| • | mechanical difficulties. |
According to estimates included in our December 31, 2010 proved reserve report, if on January 1, 2011 drilling and development on the Scintilla Assets had ceased, including recompletions and workovers, then our proved developed producing reserves base would decline at an annual effective rate of 17% over 10 years. If we fail to replace reserves, our level of production and cash flows will be affected adversely. Our total proved reserves will decline as reserves are produced unless our contract operator conducts other successful exploration and development activities or we acquire properties containing proved reserves, or both.
We do not currently operate any of our drilling locations, and therefore, we will not be able to control the timing of exploration or development efforts, associated costs, or the rate of production of our assets.
We do not currently operate any of our properties and do not have plans to develop the capacity to operate any of our properties. As a non-operated working interest owner, we are dependent on our contract operator to develop our properties. Our ability to achieve targeted returns on capital in drilling or acquisition activities and to achieve production growth rates will be materially affected by decisions made by our contract operator over which we have little or no control. Such decisions include:
| • | the timing and amount of capital expenditures; |
| • | the timing of initiating the drilling and recompleting of wells; |
| • | the extent of operating costs; |
| • | selection of technology and drilling and completion methods; and |
16
Table of Contents
Index to Financial Statements
| • | the rate of production of reserves, if any. |
Our agreements with our contract operator contain terms that may be disadvantageous to us.
Our contractual arrangements with our operator contain negotiated terms that may depart from those typical in operating agreements, which grant the operator a high degree of control over the development of our properties. Such terms include the following:
| • | Our contract operator may, in its sole discretion, substitute one or more wells intended to be drilled with a new well or add additional wells. We are obligated to pay our proportionate share of any additional costs incurred. |
| • | If we decline to participate in a proposed new well, we will not be eligible to participate in certain additional wells in the drilling and spacing units adjacent to such proposed well. |
| • | We are obligated to pay to our contract operator a fee of $300,000 to $400,000, depending on the particular controlling agreement and subject to increase from time to time based on prevailing market conditions, for each new well for saltwater disposal costs, a fee per barrel of saltwater disposed and a proportionate share of the cost to maintain such disposal wells; however, we do not obtain any ownership rights in such disposal wells, pipelines or other infrastructure. |
| • | We are obligated to pay a proportionate share of the capital costs of oil, gas, water and electrical infrastructure; however, such infrastructure remains the property of our contract operator. |
| • | Our contract operator may increase certain of the fees and costs charged to us. |
| • | Certain costs charged to us are “turnkey” costs, which may be higher or lower than the actual costs incurred. |
| • | We may be liable for certain legacy liabilities related to the properties. |
| • | For our Golden Lane properties, our contract operator holds the sole right to propose new wells. |
| • | For all our acquired properties, we will acquire rights only to the Hunton formation in specified wells and undeveloped properties. We do not control the use of the wellbores of these wells for access to shallower or deeper formations, nor do we control the costs of such wells that might be allocated to us. |
| • | Our share of oil and gas production is committed to sale arrangements that we do not control and may not reflect market terms at any given time. |
| • | Our right to sell or commit our properties to other ventures is limited by rights held by our contract operator; we may be forced to sell our properties or be unable to sell our properties on terms that we choose. |
Our contract operator does not own a working interest in any of the properties it operates on our behalf. As a result, our contract operator may have interests in developing and operating our properties that differ from and may be contrary to our interests.
If our contract operator fails to perform its obligations under our agreements with it, becomes subject to bankruptcy proceedings or otherwise proves to be an undesirable operator, our business could be adversely affected.
The successful execution of our strategy depends on continued utilization of our contract operator’s oil and gas infrastructure and technical staff as the operator of our properties. Failure to continue this relationship through (i) the termination or expiration of the operating agreements, or the other arrangements with our contract operator and its affiliates or (ii) the bankruptcy or dissolution of our contract operator could have a material
17
Table of Contents
Index to Financial Statements
adverse effect on our operations and our financial results. In particular, if our contract operator becomes subject to bankruptcy proceedings, our contract operator or the bankruptcy trustee may be able to cancel one or more of our agreements with our contract operator on the basis that they are “executory contracts.” If this were to occur, we would be required either to renegotiate with our contract operator or its successor to continue to serve as the operator of our properties and provide us with access to the saltwater disposal and other infrastructure serving our existing properties or to select another operator and obtain access to similar infrastructure from other sources, any of which would most likely result in higher costs to us for such services and infrastructure. We may also lose our rights of first refusal from Scintilla and New Dominion if the agreement providing those rights is deemed to be an “executory contract” in any bankruptcy proceeding to which either of them is subject, which would require us to rely more directly on our and third parties’ efforts to locate additional oil and natural gas leasehold acquisition prospects. The loss of our right of first refusal also could result in increased competition for any of Scintilla and New Dominion’s existing leasehold that is made available for sale.
The strategic relationships upon which we expect to rely are subject to change, which could diminish our ability to conduct our operations.
Our ability to successfully acquire additional properties, to increase our reserves, to participate in drilling opportunities and to identify and enter into commercial arrangements with customers will depend on developing and maintaining close working relationships with our contract operator and its affiliates, our ability to select and evaluate suitable properties, and our and our contract operator’s ability to consummate transactions in a highly competitive environment. Our relationships with our contract operator and its affiliates are subject to change, and our inability to maintain close working relationships with these parties or continue to acquire suitable properties may impair our ability to execute our business plan.
We will record substantial compensation expense in the financial quarter in which this offering occurs and we may incur substantial additional compensation expense related to our future grants of stock compensation, which may have a material negative impact on our operating results for the foreseeable future.
As a result of outstanding stock-based compensation awards that vest upon consummation of this offering, we will report substantial non-cash compensation expense, which we estimate to be approximately $ million, in the quarter in which this offering is consummated. Certain of our executive officers may also require us to withhold shares of our common stock, which would otherwise be distributed to them, to satisfy their withholding tax obligations incurred as a result of such stock vesting upon the consummation of this offering and in the future. If our officers elect to exercise this option upon the consummation of this offering, we estimate that up to approximately $ million of the proceeds of this offering will be used to fund such withholding tax payments. In addition, our compensation expenses may increase in the future as compared to our historical expenses because of the costs associated with our existing and anticipated employee stock-based incentive plans. These additional expenses will adversely affect our net income. We cannot determine the actual amount of these new stock-related compensation and benefit expenses at this time because applicable accounting practices generally require that they be based on the fair market value of the options or shares of common stock at the date of the grant; however, we expect them to be significant. We will recognize expenses for restricted stock awards and stock options generally over the vesting period of awards made to recipients.
We are a new company. If we are unable to implement our business strategy or conduct our business as we currently expect, our operating results may be adversely affected.
As a recently organized company, we only recently commenced operations upon our acquisition of the Acquired Assets on August 12, 2011. Our management team has only recently been assembled, and as a result some members of our management do not have experience in the operation of our assets and business or with one another. If our management fails to develop a close working relationship or is unable to develop expertise in the operation of our business, we may not be able to execute our business strategy as planned, which could negatively impact our financial performance. Businesses such as ours, which are starting up or in their initial
18
Table of Contents
Index to Financial Statements
stages of development, present substantial business and financial risks and may suffer significant losses. In addition, as a new company we must establish operating procedures, implement new systems and complete other tasks necessary to conduct our intended business activities.
We have only recently acquired our properties and thus have no historical operations to audit.
As a newly formed entity we have no historical operations to audit, and accordingly the historical carve-out financial statements presented relate only to the Scintilla Assets and reflect Scintilla’s ownership as predecessor-in-interest rather than our ownership of such properties. We have relied on estimates and assumptions of management in allocating overhead, indebtedness, and similar items and the actual results may have materially differed under our management. Furthermore, we have relied on accounting information supplied to us by Scintilla for purposes of compiling the financial statements presented in this prospectus. We have accounted for our acquisition of the Scintilla Assets as a transfer of net assets between entities under common control under GAAP, meaning that we have recognized such properties on our books at Scintilla’s historical basis in such properties. The amount of the purchase consideration that we paid in excess of Scintilla’s basis in the net assets, if any, has been recognized as a reduction to stockholders’ equity.
Our success is dependent on the successful acquisition and development of leasehold and production from reserve rich properties.
We are in the initial stages of the acquisition of our portfolio of leasehold and other natural resource holdings. We intend to continue to supplement this portfolio with additional sites and leasehold. Our oil and gas properties and assets may not perform as we have projected, and any future acquisitions may prove to be unsuccessful. Additionally, our strategy will require that we have access to additional capital. There can be no assurance that we will be able to access the amount of capital necessary to implement our growth strategy on reasonable terms, if at all. Further, our ability to meet our growth and operational objectives may depend on the success of our acquisitions, and there is no assurance that the integration of future assets and leaseholds will be successful.
Properties that we acquire may not produce oil or natural gas as projected, and we may be unable to determine reserve potential, identify liabilities associated with the properties or obtain protection from sellers against them, which could cause us to incur losses.
Our principal growth strategy is to pursue selective acquisitions of producing and proved undeveloped properties in conventional resource reservoirs. If we choose to pursue an acquisition, we will perform a review of the target properties that we believe is consistent with industry practices. However, these reviews are inherently incomplete. Generally, it is not feasible to review in depth every individual property involved in each acquisition. Even a detailed review of records and properties may not necessarily reveal existing or potential problems, nor will it permit a buyer to become sufficiently familiar with the properties to assess fully their deficiencies and potential. We may not perform an inspection on every well, and environmental problems, such as groundwater contamination, are not necessarily observable even when an inspection is undertaken. Even when problems are identified, we may not be able to obtain effective contractual protection against all or part of those problems, and we may assume environmental and other risks and liabilities in connection with the acquired properties.
Our participation in drilling new wells could result in new liabilities, which could endanger our interests in our properties and assets.
There are risks associated with the drilling of oil and natural gas wells, including encountering unexpected formations or pressures, premature declines of reservoirs, blow-outs, craterings, sour gas releases, fires and spills, among others. The occurrence of any of these events could significantly reduce our revenues or cause substantial losses, impairing our future operating results. We may become subject to liability for pollution, blow-outs or other hazards. The payment of such liabilities could reduce the funds available to us or could, in an extreme case, result in a total loss of our properties and assets.
19
Table of Contents
Index to Financial Statements
All of our producing properties and interests are currently located in the Hunton formation in east-central Oklahoma, making us vulnerable to risks associated with operating in one primary geographic area.
All of our oil and gas assets and interests are currently in the Hunton formation in east-central Oklahoma. As a result, we may be disproportionately exposed to the impact of delays or interruptions of production from wells in which we have an interest that are caused by transportation capacity constraints, curtailment of production, availability of equipment, facilities, personnel or services, significant governmental regulation, natural disasters, adverse weather conditions, plant closures for scheduled maintenance or interruption of transportation of oil or natural gas produced from the wells in this area. In addition, the effect of fluctuations on supply and demand may become more pronounced within specific geographic oil and gas producing areas such as in Oklahoma, which may cause these conditions to occur with greater frequency or magnify the effect of these conditions. Due to the concentrated nature of our portfolio of properties, a number of our properties could experience any of the same conditions at the same time, resulting in a relatively greater impact on our results of operations than they might have on other companies that have a more diversified portfolio of properties. Such delays or interruptions could have a material adverse effect on our financial condition and results of operations.
We are subject to significant risks associated with the drilling and completion of wells in which we participate.
Issues that we face with respect to drilling by our contract operator include, but are not limited to, landing the well bore in the desired drilling zone, staying in the desired drilling zone while drilling horizontally through the formation, running casing the entire length of the well bore and being able to run tools and other equipment consistently through the horizontal well bore. Risks in completing our wells include, but are not limited to, being able to produce the formation, being able to run tools the entire length of the well bore during completion operations and successfully cleaning out the well bore. Any of these issues could result in increased costs to drill and complete a well.
Our reliance on specialized processes creates uncertainties that could adversely affect our results of operations and financial condition.
One of our business strategies is to commercially develop conventional resource reservoirs using specialized processes employed by our contract operator. One technique utilized is installing electric submersible pumps to depressurize the targeted hydrocarbon-bearing reservoir, allowing the gas to expand and push oil and natural gas out of the pores in which they are trapped, in order to increase the production of oil and natural gas. The additional production and reserves attributable to the use of these techniques is inherently difficult to predict. If these specialized processes do not allow for the extraction of oil and natural gas in the manner or to the extent that we anticipate, our future results of operations and financial condition could be materially adversely affected.
We will engage in transactions with related parties, which creates an increased risk of conflicting interests.
Our business plan largely is reliant on current and anticipated transactions with various related parties. The acquisition of the Acquired Assets was a transaction with related parties in which we issued a significant number of shares of our common stock and paid a significant amount of cash without us having acquired any independent valuation other than our reserve report. In approving the transaction, none of our directors was “disinterested” or “independent.” Furthermore, one of the related parties (our chairman, Mr. Chernicky), as a result of our acquisition of the Scintilla Assets and the issuance of shares of stock therefor, currently controls, and will continue to control after this offering, a majority of the outstanding shares of our common stock. Additionally, a significant component of our business plan and growth strategy is to acquire additional assets and properties from certain companies currently controlled by Mr. Chernicky and for whom Kristian B. Kos, our president and chief executive officer, has acted and has been compensated as a consultant. These related party transactions create the risk of conflicting interests.
20
Table of Contents
Index to Financial Statements
We depend on our key management personnel, and the loss of any of these individuals could adversely affect our business.
If we lose the services of our key management personnel (including Mr. Kos and Mr. Chernicky) or are unable to attract additional qualified personnel, our business, financial condition, results of operations, development efforts and ability to grow could suffer. We depend upon the knowledge, skill and experience of these individuals to assist us in improving the performance and reducing the risks associated with our participation in oil and natural gas development projects. In addition, the success of our business depends, to a significant extent, upon the abilities and continued efforts of our management.
Our key management personnel (including Mr. Kos and Mr. Chernicky) may terminate their employment with us at any time for any reason with little or no notice. Upon termination of their employment, such persons may engage in businesses that compete with us.
We rely on our strategic relationships to access infrastructure that is critical to the development of our assets. Adequate infrastructure may not be available at an economic rate.
Execution of our business strategy is dependent on the availability and capability of various infrastructure, including gas gathering and processing, saltwater disposal, and transportation. Future acquisitions may require us to expend significant capital to acquire, develop or access similar infrastructure. Such capital requirements may adversely impact our returns.
Our access to saltwater disposal infrastructure may not be sufficient to handle all saltwater produced, and environmental regulations may impact our ability to handle saltwater.
Our production is dependent on economically disposing of large amounts of saltwater utilizing our contract operator’s existing saltwater disposal infrastructure. Changing environmental regulations or the unexpected production of excessive saltwater could render such infrastructure insufficient and require additional capital expenditures.
Our ability to sell our production and/or receive market prices for our production may be adversely affected by lack of transportation, capacity constraints and interruptions.
The marketability of our production from our producing properties depends in part upon the availability, proximity and capacity of third-party refineries, natural gas gathering systems and processing facilities. We deliver crude oil and natural gas produced from these areas through transportation systems that we do not own. The lack of availability or capacity on these systems and facilities could reduce the price offered for our production or result in the shut-in of producing wells or the delay or discontinuance of development plans for properties.
A portion of our production may also be interrupted, or shut in, from time to time for numerous other reasons, including as a result of accidents, field labor issues or strikes, or our contract operator might voluntarily curtail production in response to market conditions. If a substantial amount of our production is interrupted at the same time, it could adversely affect our cash flow.
Our identified drilling locations are scheduled to be developed over several years, making them susceptible to uncertainties that could materially alter the occurrence or timing of their drilling.
Our contract operator has identified and scheduled drilling locations on our acreage over a multi-year period. The ability to drill and develop these locations depends on a number of factors, including the availability of capital, seasonal conditions, regulatory approvals, oil and natural gas prices, costs and drilling results. The final determination on whether to drill any of these drilling locations will be dependent upon the factors described elsewhere in this prospectus as well as, to some degree, the results of our contract operator’s drilling activities with respect to our proved drilling locations. Because of these uncertainties, we do not know if the
21
Table of Contents
Index to Financial Statements
identified drilling locations will be drilled within our expected time frame or will ever be drilled. As such, our actual drilling activities may be materially different from those presently identified, which could adversely affect our business, results of operations or financial condition.
Our estimated proved reserves are based on many assumptions that may turn out to be inaccurate. Any significant inaccuracies in these reserve estimates or underlying assumptions will materially affect the quantities and present value of our reserves.
Reserve engineering is a subjective process of estimating underground accumulations of oil and natural gas that cannot be measured in an exact manner. It requires interpretations of available technical data and many assumptions, including assumptions relating to current and future economic conditions and commodity prices. Any significant inaccuracies in these interpretations or assumptions could materially affect the estimated quantities and present value of reserves shown in this prospectus.
To prepare our estimates, we must project production rates and the timing of development expenditures. We must also analyze available geological, geophysical, production and engineering data, and the quality and reliability of this data can vary. The process also requires economic assumptions about matters such as oil and natural gas prices, drilling and operating expenses, capital expenditures, taxes and availability of funds. There are numerous uncertainties inherent in estimating quantities of proved reserves and in projecting future rates of production.
Actual future production, oil and natural gas prices, revenues, taxes, development expenditures, operating expenses and quantities of recoverable oil and natural gas reserves will vary from our estimates. Any significant variance could materially affect the estimated quantities and present value of reserves shown in this prospectus. In addition, we may adjust estimates of proved reserves to reflect production history, results of development, prevailing oil and natural gas prices and other factors, many of which are beyond our control.
The present value of future net revenues from our proved reserves will not necessarily be the same as the current market value of our estimated oil and natural gas reserves.
You should not assume that the present value of future net revenues from our proved reserves is the current market value of our estimated oil and natural gas reserves. For the year ended December 31, 2008, the estimated discounted future net revenues from our proved reserves were based on prices and costs in effect at year end in accordance with previous Securities and Exchange Commission (“SEC”) requirements. In accordance with SEC requirements for the years ended December 31, 2009 and 2010, we have based the estimated discounted future net revenues from our proved reserves on the unweighted arithmetic average of the first-day-of-the-month price for each of the preceding twelve months without giving effect to derivative transactions. Actual future net revenues from our oil and natural gas properties will be affected by factors such as:
| • | the actual prices we receive for oil and natural gas; |
| • | our actual development and production expenditures; |
| • | the amount and timing of actual production; and |
| • | changes in governmental regulations or taxation. |
The timing of both our production and our incurrence of expenses in connection with the development and production of oil and natural gas properties will affect the timing and amount of actual future net revenues from proved reserves, and thus their actual present value. In addition, the 10% discount factor we use when calculating discounted future net revenues may not be the most appropriate discount factor based on interest rates in effect from time to time and risks associated with us or the oil and natural gas industry in general.
Actual future prices and costs may differ materially from those used in the present value estimates included in this prospectus. If oil prices decline by $10.00 per Bbl, then our PV-10 as of December 31, 2010 would decrease by approximately $33.3 million. If natural gas prices decline by $1.00 per Mcf, then our PV-10 as of December 31, 2010 would decrease by approximately $27.8 million.
22
Table of Contents
Index to Financial Statements
Our development and acquisition projects require substantial capital expenditures. We may be unable to obtain needed capital or financing on satisfactory terms, which could lead to a decline in our oil and natural gas reserves.
Our working capital, together with cash generated from anticipated production, may not be sufficient to support our business plan of acquiring and holding working interests in various oil and gas assets. If we realize lower than expected cash from production, either due to lower than anticipated production levels or a decline in commodity prices from recent levels, we would need to curtail our development activities, acquisition activities, or both, or seek alternative sources of capital, including by means of entering into joint ventures with other exploration and production companies, sales of interests in certain of our properties or by undertaking additional financing activities (including through the issuance of equity or the incurrence of debt). If we are forced to make non-consent elections to proposed operations on our properties due to lack of capital, we would be subject to substantial penalties and other adverse consequences under the Golden Lane Participation Agreement or the Luther JOA (as described in “Management’s Discussion and Analysis of Financial Condition and Results of Operations — Material Definitive Agreements”) or other applicable joint operating agreements.
We may not be able to access the capital markets or otherwise secure such additional financing on reasonable terms or at all, and financing may not continue to be available to us under our existing or new financing arrangements. Our business strategy is reliant upon our ability to have access to a substantial amount of outside capital. The availability of these sources of capital will depend upon a number of factors, including general economic and financial market conditions, oil and natural gas prices and our market value and operating performance. If additional capital resources are unavailable, we may curtail our development and other activities or be forced to sell some of our assets on an untimely or unfavorable basis. Any such curtailment or sale could have a material adverse effect on our business, financial condition and results of operations.
Our cash flows from operations and access to capital are subject to a number of variables, including, among others:
| • | our proved reserves; |
| • | the volume of oil and natural gas we are able to produce and sell from existing wells; |
| • | the prices at which our oil and natural gas are sold; |
| • | our ability to acquire, locate and produce new reserves; and |
| • | the ability of our banks to lend. |
If our revenues or the borrowing base under our credit facility decrease as a result of lower oil or natural gas prices, operating difficulties, declines in reserves or for any other reason, we may have limited ability to obtain the capital necessary to sustain our operations at current levels. If additional capital is needed, we may not be able to obtain debt or equity financing.
Increased costs of capital could adversely affect our business.
Our business and operating results can be harmed by factors such as the availability, terms and cost of capital and increases in interest rates. Changes in any one or more of these factors could cause our cost of doing business to increase, limit our access to capital, limit our ability to pursue acquisition opportunities, reduce our cash flows available for drilling and place us at a competitive disadvantage. Continuing disruptions and volatility in the global financial markets may lead to an increase in interest rates or a contraction in credit availability impacting our ability to finance our operations. We require continued access to capital. A significant reduction in the availability of credit could materially and adversely affect our ability to achieve our planned growth and operating results.
23
Table of Contents
Index to Financial Statements
If oil and natural gas prices decrease, we may be required to take write-downs of the carrying values of our oil and natural gas properties.
We review our proved oil and natural gas properties for impairment whenever events and circumstances indicate that a decline in the recoverability of their carrying value may have occurred. Based on specific market factors and circumstances at the time of prospective impairment reviews, and the continuing evaluation of development plans, production data, economics and other factors, we may be required to write down the carrying value of our oil and natural gas properties, which may result in a decrease in the amount available under our credit facility. A write-down constitutes a non-cash charge to earnings. We may incur impairment charges in the future that could have a material adverse effect on our ability to borrow under our credit facility and our results of operations for the periods in which such charges are taken.
Operating hazards, natural disasters or other interruptions of our operations could result in potential liabilities, which may not be fully covered by our insurance policies.
The oil and natural gas business generally, and our operations, are subject to certain operating hazards such as:
| • | well blowouts; |
| • | cratering (catastrophic failure); |
| • | explosions; |
| • | uncontrollable flows of oil, natural gas or well fluids; |
| • | fires; |
| • | oil spills; |
| • | pollution; |
| • | releases of toxic gas, petroleum liquids or drilling fluids, into the environment; |
| • | hazards resulting from the presence of hydrogen sulfide (H2S) or other contaminants in natural gas we produce. |
H2S may be present at one of more of our properties at levels that would be hazardous in the event of an uncontrolled natural gas release or unprotected exposure. In addition, our operations are susceptible to damage from natural disasters such as flooding or tornados, which involve increased risks of personal injury, property damage and marketing interruptions. The occurrence of any one of these operating hazards may result in injury, loss of life, suspension of operations, environmental damage and remediation and/or governmental investigations and penalties. The payment of any of these liabilities could reduce, or even eliminate, our cash flow or could result in a loss of our properties.
Our insurance policies might be inadequate to cover our liabilities.
Insurance costs are expected to continue to increase over the next few years, and we may decrease coverage and retain more risk to mitigate future cost increases. If we incur substantial liability, and the damages are not covered by insurance or are in excess of policy limits, then our business, results of operations and financial condition may be materially adversely affected.
Competition in the oil and natural gas industry is intense, and many of our competitors have resources that are greater than we do.
We operate in a highly competitive environment for acquiring prospects and productive properties, marketing oil and natural gas and securing equipment and trained personnel. As a relatively small oil and natural gas company, many of our competitors are major and large independent oil and natural gas companies that
24
Table of Contents
Index to Financial Statements
possess and employ financial, technical and personnel resources substantially greater than ours. Those companies may be able to develop and acquire more prospects and productive properties than our financial or personnel resources permit and may be willing to pay premium prices that we cannot afford to match. Our ability to acquire additional prospects and develop reserves in the future will depend on our ability to evaluate and select suitable properties and consummate transactions in a highly competitive environment. Also, there is substantial competition for capital available for investment in the oil and natural gas industry. Larger competitors may be better able to withstand sustained periods of unsuccessful drilling and absorb the burden of changes in laws and regulations more easily than we can, which would adversely affect our competitive position. We may not be able to compete successfully in the future in acquiring prospective reserves, developing reserves, marketing hydrocarbons, attracting and retaining quality personnel or raising additional capital.
We may incur losses as a result of title deficiencies.
We will acquire working and revenue interests in oil and natural gas leasehold interests from third parties (some of which are related to us) or directly from the mineral fee owners. The existence of a material title deficiency can render a lease worthless and could adversely affect our results of operations and financial condition. Title insurance covering mineral leaseholds is not generally available and, in all instances, we forego the expense of retaining lawyers to examine the title to the mineral interest to be placed under lease or already placed under lease until the drilling block is assembled and ready to be drilled. As is customary in our industry, we rely upon the judgment of oil and natural gas lease brokers, in-house landmen or independent landmen who perform the field work in examining records in the appropriate governmental offices and abstract facilities before attempting to acquire or place under lease a specific mineral interest. We will not always perform curative work to correct deficiencies in the marketability of the title to us. Our contract operator generally will obtain title opinions for specific drilling locations prior to the commencement of drilling. In cases involving more serious title problems, the amount paid for affected oil and natural gas leases can be lost, and the target area can become undrillable. We may be subject to litigation from time to time as a result of title issues.
To the extent we enter into commodity derivative arrangements, they could result in financial losses or could reduce our earnings.
We expect to enter into financial hedge arrangements (i.e., commodity derivative agreements) in order to manage our commodity price risk and to provide a more predictable cash flow from operations. We do not intend to designate our derivative instruments as cash flow hedges for accounting purposes. The fair value of our derivative instruments will be marked to market at the end of each quarter, and the resulting unrealized gains or losses due to changes in the fair value of our derivative instruments will be recognized in current earnings. Accordingly, our earnings may fluctuate significantly as a result of changes in fair value of our derivative instruments.
Actual future production of our properties may be significantly higher or lower than we estimate at the time we enter into derivative contracts for such period. If the actual amount of production is higher than we estimated, we will have greater commodity price exposure than we intended. If the actual amount of production is lower than the notional amount that is subject to our derivative financial instruments, we might be forced to satisfy all or a portion of our derivative transactions without the benefit of the cash flow from our sale of the underlying physical commodity, resulting in a substantial diminution of our liquidity. As a result of these factors, to the extent we engage in hedging activities, such hedging activities may not be as effective as we intend in reducing the volatility of our cash flows.
Derivative instruments also expose us to the risk of financial loss in some circumstances, including when:
| • | production is less than the volume covered by the derivative instruments; |
| • | the counter-party to the derivative instrument defaults on its contract obligations; |
25
Table of Contents
Index to Financial Statements
| • | there is an increase in the differential between the underlying price in the derivative instrument and actual prices received; or |
| • | the steps we take to monitor our derivative financial instruments do not detect and prevent transactions that are inconsistent with our risk management strategies. |
In addition, depending on the type of derivative arrangements we enter into, the agreements could limit the benefit we would receive from increases in oil, natural gas or natural gas liquids prices. We cannot assure you that the commodity derivative contracts we have entered into, or will enter into, will adequately protect us from fluctuations in oil prices.
The recent adoption of derivatives legislation by the United States Congress could have an adverse effect on our ability to use derivative instruments to reduce the effect of commodity price, interest rate and other risks associated with our business.
The United States Congress recently adopted the Dodd-Frank Wall Street Reform and Consumer Protection Act, which includes comprehensive financial reform legislation that establishes federal oversight and regulation of the over-the-counter derivatives market and entities, such as us, that participate in that market. The new legislation was signed into law by the President on July 21, 2010 and requires the Commodities Futures Trading Commission (the “CFTC”) and the SEC to promulgate rules and regulations implementing the new legislation within 360 days from the date of enactment. The CFTC has also proposed regulations to set position limits for certain futures and option contracts in the major energy markets, although it is not possible at this time to predict whether or when the CFTC will adopt those rules or include comparable provisions in its rulemaking under the new legislation. The financial reform legislation may also require us to comply with margin requirements and with certain clearing and trade-execution requirements in connection with its derivative activities, although the application of those provisions to us is uncertain at this time. The financial reform legislation may also require the counterparties to our derivative instruments to spin off some of their derivatives activities to a separate entity, which may not be as creditworthy as the current counterparty. The new legislation and any new regulations could significantly increase the cost of derivative contracts (including through requirements to post collateral that could adversely affect our available liquidity), materially alter the terms of derivative contracts, reduce the availability of derivatives to protect against risks we encounter, reduce our ability to monetize or restructure existing derivative contracts, and increase our exposure to less creditworthy counterparties. If we reduce our use of derivatives as a result of the legislation and regulations, our results of operations may become more volatile and our cash flows may be less predictable, which could adversely affect our ability to plan for and fund capital expenditures. Finally, the legislation was intended, in part, to reduce the volatility of oil and natural gas prices, which some legislators attributed to speculative trading in derivatives and commodity instruments related to oil and natural gas. Our revenues could therefore be adversely affected if commodity prices decline as a consequence of the legislation and regulations. Any of these consequences could have a material adverse effect on us, our financial condition, and our results of operations.
Our production of oil and natural gas is sold to a limited number of customers and the credit default of one of these customers could have a temporary adverse effect on us.
Our revenues are generated under contracts with a limited number of customers. Our contract operator has previously sold all of the natural gas from the Acquired Assets to Scissortail Energy, LLC and DCP Midstream, LP and all of the oil from the Acquired Assets to Sunoco, Inc. and Enterprise Products Company. Our results of operations would be adversely affected as a result of non-performance by any of these customers. A non-payment default by one of these large customers could have an adverse effect on us, temporarily reducing our cash flow.
26
Table of Contents
Index to Financial Statements
Changes in the legal and regulatory environment governing the oil and natural gas industry, particularly changes in the current Oklahoma forced pooling system, could have a material adverse effect on our business.
Our business is subject to various forms of extensive government regulation, including laws and regulations concerning the location, spacing and permitting of the oil and natural gas wells our contract operator drills and the disposal of saltwater produced from such wells, among other matters. In particular, our business relies heavily on a methodology available in Oklahoma known as “forced pooling,” which refers to the ability of a holder of an oil and natural gas interest in a particular prospective drilling spacing unit to apply to the Oklahoma Corporation Commission for an order forcing all other holders of oil and natural gas interests in such area into a common pool for purposes of developing that drilling spacing unit. Changes in the legal and regulatory environment governing our industry, particularly any changes to Oklahoma forced pooling procedures that make forced pooling more difficult to accomplish, could result in increased compliance costs and adversely affect our business and results of our operations.
Certain federal income tax deductions currently available with respect to oil and natural gas exploration and development may be eliminated as a result of future legislation.
Among the changes contained in the President’s fiscal year 2012 budget proposal, released by the White House on February 14, 2011, is the elimination or deferral of certain key U.S. federal income tax deductions currently available to oil and gas exploration and production companies. Such changes include, but are not limited to, (i) the repeal of the percentage depletion allowance for oil and natural gas properties; (ii) the elimination of current deductions for intangible drilling and development costs; (iii) the elimination of the deduction for certain U.S. production activities; and (iv) an extension of the amortization period for certain geological and geophysical expenditures. Recently, members of the U.S. Congress have considered similar changes to the existing federal income tax laws that affect oil and natural gas exploration and production companies, which, if enacted, would negatively affect our financial condition and results of operations. The passage of any legislation as a result of the budget proposal or any other similar change in U.S. federal income tax law could eliminate or defer certain tax deductions within the industry that are currently available with respect to oil and natural gas exploration and development, and any such change could negatively affect our financial condition and results of operations.
Our operations are subject to health, safety, and environmental laws and regulations which may expose us to significant costs and liabilities.
Our oil and natural gas exploration, production and processing operations are subject to stringent and complex federal, state, and local laws and regulations governing health and safety aspects of our operation, the discharge of materials into the environment and the protection of the environment. These laws and regulations may impose on our operations numerous requirements, including the obligation to obtain a permit before conducting drilling or underground injection activities; restrictions on the types, quantities and concentration of materials that can be released into the environment; limitations or prohibitions of drilling activities on certain lands lying within wilderness, wetlands and other protected areas; specific health and safety criteria to protect workers; and the responsibility for cleaning up any pollution resulting from operations. Numerous governmental authorities such as the U.S. Environmental Protection Agency, or the EPA, and analogous state agencies have the power to enforce compliance with these laws and regulations and the permits issued under them, oftentimes requiring difficult and costly actions. These laws and regulations may result in the assessment of administrative, civil or criminal penalties for any violations; the imposition of investigatory or remedial obligations; the issuance of injunctions limiting or preventing some or all of our operations; and delays in granting permits and cancellation of leases.
There is an inherent risk of incurring significant environmental costs and liabilities in the performance of our operations, some of which may be material, due to our contract operator’s handling of petroleum hydrocarbons and wastes, emissions to air and water, the underground injection or other disposal of wastes and
27
Table of Contents
Index to Financial Statements
historical industry operations and waste disposal practices. Under certain environmental laws and regulations, we may be liable regardless of whether we were at fault for the full cost of removing or remediating contamination, even when multiple parties contributed to the release and the contaminants were released in compliance with all applicable laws. In addition, accidental spills or releases on our properties may expose us to significant costs or liabilities that could have a material adverse effect on our financial condition or results of operations. Aside from government agencies, the owners of properties where our wells are located, the operators of facilities where our petroleum hydrocarbons or wastes are taken for processing, reclamation or disposal and other private parties may be able to sue us to enforce compliance with environmental laws and regulations, collect penalties for violations or obtain damages for any related personal injury or property damage. Some of our properties are located near current or former third-party oil and natural gas operations or facilities, and there is a risk that contamination has migrated from those sites to ours. Changes in environmental laws and regulations occur frequently, and any changes that result in more stringent or costly material handling, emission, waste management or cleanup requirements could require us to make significant expenditures to attain and maintain compliance or may otherwise have a material adverse effect on our own results of operations, competitive position or financial condition. We may not be able to recover some or any of these costs from insurance.
Climate change laws and regulations restricting emissions of “greenhouse gases” could result in increased operating costs and reduced demand for the oil and natural gas that we produce, while the physical effects of climate change could disrupt our production and cause us to incur significant costs in preparing for or responding to those effects.
There is a growing belief that emissions of greenhouse gases (“GHGs”) may be linked to climate change. Climate change and the costs that may be associated with its impacts and the regulation of GHGs have the potential to affect our business in many ways, including negatively impacting the costs we incur in producing oil and natural gas and the demand for and consumption of oil and natural gas (due to change in both costs and weather patterns).
In December 2009, the EPA determined that atmospheric concentrations of carbon dioxide, methane, and certain other GHGs present an endangerment to public health and welfare because such gases are, according to the EPA, contributing to the warming of the earth’s atmosphere and other climatic changes. Consistent with its findings, the EPA has proposed or adopted various regulations under the Clean Air Act to address GHGs. Among other things, the EPA is limiting emissions of greenhouse gases from new cars and light duty trucks beginning with the 2012 model year. In addition, the EPA has published a final rule to address the permitting of GHG emissions from stationary sources under the Prevention of Significant Deterioration, or “PSD,” and Title V permitting programs, pursuant to which these permitting requirements have been “tailored” to apply to certain stationary sources of GHG emissions in a multi-step process, with the largest sources first subject to permitting. Facilities required to obtain PSD permits for their GHG emissions will be required to meet emissions limits that are based on the “best available control technology,” which will be established by the permitting agencies on a case-by-case basis. The EPA has also adopted regulations requiring the reporting of GHG emissions from specified large GHG emission sources in the United States, including certain oil and natural gas production facilities, which may include certain of our operations, beginning in 2012 for emissions occurring in 2011 and which may form the basis for further regulation. Many of the EPA’s GHG rules are subject to legal challenges, but have not been stayed pending judicial review. Depending on the outcome of such proceedings, such rules may be modified or rescinded or the EPA could develop new rules. The EPA’s GHG rules could adversely affect our operations and restrict or delay our ability to obtain air permits for new or modified facilities.
Moreover, Congress has from time to time considered adopting legislation to reduce emissions of GHGs or promote the use of renewable fuels. As an alternative, some proponents of GHG controls have advocated mandating a national “clean energy” standard. In 2011, President Obama encouraged Congress to adopt a goal of generating 80% of U.S. electricity from “clean energy” by 2035 with credit for renewable and nuclear power and partial credit for clean coal and “efficient natural gas.” Because of the lack of any comprehensive federal legislative program expressly addressing GHGs, there currently is a great deal of uncertainty as to how and when
28
Table of Contents
Index to Financial Statements
additional federal regulation of GHGs might take place and as to whether the EPA should continue with its existing regulations in the absence of more specific Congressional direction.
In the meantime, many states already have taken such measures, which have included renewable energy standards, development of GHG emission inventories and/or cap and trade programs. Cap and trade programs typically work by requiring major sources of emissions or major producers of fuels to acquire and surrender emission allowances, with the number of available allowances reduced each year until the overall GHG emission reduction goal is achieved. These allowances are expected to escalate significantly in cost over time. The adoption of legislation or regulatory programs to reduce emissions of GHGs could require us to incur increased operating costs, such as costs to purchase and operate emissions control systems, to acquire emissions allowances or comply with new regulatory or reporting requirements or to purchase electricity. If we are unable to recover or pass through a significant level of our costs related to complying with climate change regulatory requirements imposed on us, it could have a material adverse effect on our results of operations and financial condition. Any such legislation or regulatory programs could also increase the cost of consuming, and thereby reduce demand for, the oil and natural gas we produce. Consequently, legislation and regulatory programs to reduce emissions of GHGs could have an adverse effect on our business, financial condition and results of operations.
Finally, it should be noted that some scientists have concluded that increasing concentrations of GHGs in the earth’s atmosphere may produce climate changes that have significant physical effects, such as increased frequency and severity of storms and floods. If any such effects were to occur, they could have an adverse effect on our exploration and production operations. Significant physical effects of climate change could also have an indirect effect on our financing and operations by disrupting the transportation or process-related services provided by midstream companies, service companies or suppliers with whom we have a business relationship. Our insurance may not cover some or any of the damages, losses, or costs that may result from potential physical effects of climate change.
Risks Related to Our Indebtedness
Our debt covenants are extremely strict and may inhibit our ability to make certain investments, incur additional indebtedness, or engage in certain transactions. There can be no assurance that our operations will support the expenses associated with our debt.
Our credit facility includes certain covenants that, among other things, restrict:
| • | our investments, loans and advances and the paying of dividends and other restricted payments; |
| • | our incurrence of additional indebtedness; |
| • | the granting of liens, other than liens created pursuant to the credit facility and certain permitted liens; |
| • | mergers, consolidations and sales of all or substantial part of our business or properties; |
| • | transactions with affiliates; |
| • | the sale of assets; and |
| • | our capital expenditures. |
Our credit facility requires us to maintain certain financial ratios, such as leverage ratios. All of these restrictive covenants may restrict our ability to expand or pursue our business strategies. Our ability to comply with these and other provisions of our credit facility may be impacted by changes in economic or business conditions, results of operations or events beyond our control. The breach of any of these covenants could result in a default under our credit facility, in which case, depending on the actions taken by the lenders thereunder or their successors or assignees, such lenders could elect to declare all amounts borrowed under our credit facility, together with accrued interest, to be due and payable. If we were unable to repay such borrowings or interest, our lenders could proceed against their collateral. If the indebtedness under our credit facility were to be accelerated, our assets may not be sufficient to repay in full such indebtedness.
29
Table of Contents
Index to Financial Statements
The variable rate indebtedness in our credit facility subjects us to interest rate risk, which could cause our debt service obligations to increase significantly.
Our borrowings under our credit facility bear interest at rates that may vary, exposing us to interest rate risk. If such rates increase, our debt service obligations on the variable rate indebtedness would increase even though the amount borrowed remained the same, and our net income and cash available for servicing our indebtedness would decrease.
Availability under our credit facility is based on a borrowing base which is subject to redetermination by our lenders. If our borrowing base is reduced, we may be required to repay amounts outstanding under our credit facility.
Our ability to make payments due under our credit facility will depend upon our future operating performance, which is subject to general economic and competitive conditions and to financial, business and other factors, many of which we cannot control. In addition, our borrowing base is subject to semi-annual redetermination by our lenders based on valuation of our proved reserves and the lenders’ internal criteria. In the event the amount outstanding under our credit facility at any time exceeds the borrowing base at such time, we may be required to repay a portion of our outstanding borrowings on an accelerated basis. If we do not have sufficient funds on hand for repayment in such event, or to service our debt obligations generally, we may be required to seek a waiver or amendment from our lenders, refinance our credit facility, sell assets or sell additional securities. We may not be able to obtain such financing or complete such transactions on terms acceptable to us, or at all. In addition, our credit agreement may limit our ability to take certain of such actions. Failure to make the required repayment could result in a default under our credit facility. Our failure to generate sufficient funds to pay our debts or to undertake any of these actions successfully, or to comply with the covenants under our credit facility mentioned above, could materially adversely affect our business.
Our level of indebtedness may increase and reduce our financial flexibility.
As of , 2011, we had approximately $ million in outstanding debt. In the future, we may incur additional indebtedness to make future acquisitions or to develop our properties.
Our level of indebtedness could affect our operations in several ways, including the following:
| • | a significant portion of our cash flows could be used to service our indebtedness; |
| • | a high level of debt would increase our vulnerability to general adverse economic and industry conditions; |
| • | the covenants contained in the agreements governing our outstanding indebtedness could limit our ability to borrow additional funds, dispose of assets, pay dividends and make certain investments; |
| • | a high level of debt could place us at a competitive disadvantage compared to our competitors that are less leveraged and therefore, may be able to take advantage of opportunities that our indebtedness would prevent us from pursuing; |
| • | our debt covenants may also affect our flexibility in planning for, and reacting to, changes in the economy and in our industry; |
| • | a high level of debt may make it more likely that a reduction in the borrowing base of our credit facility following a periodic redetermination could require us to repay a portion of our then outstanding bank borrowings; and |
| • | a high level of debt may impair our ability to obtain additional financing in the future for working capital, capital expenditures, acquisitions, general corporate or other purposes. |
30
Table of Contents
Index to Financial Statements
A high level of indebtedness increases the risk that we may default on our debt obligations. Our ability to meet our debt obligations and to reduce our level of indebtedness depends on our future performance. General economic conditions, oil, natural gas and natural gas liquids prices, and financial, business and other factors affect our operations and our future performance. Many of these factors are beyond our control. We may not be able to generate sufficient cash flows to pay the interest on our debt and future working capital, borrowings or equity financing may not be available to pay or refinance such debt. Factors that will affect our ability to raise cash through an offering of our capital stock or a refinancing of our debt include financial market conditions, the value of our assets and our performance at the time we need capital.
Our obligations under our credit facility are secured at all times by substantially all of our assets.
Our indebtedness under our credit facility is secured by substantially all of our assets. Therefore, if we default on any of our obligations under the credit facility it could result in our lenders foreclosing on our assets or otherwise being entitled to revenues generated by and through our assets.
Risks Related to this Offering and our Common Stock
One of our stockholders will beneficially own or control a majority of our common stock, giving him a controlling influence over corporate transactions and other matters. His interests may conflict with yours, and the concentration of ownership of our common stock by such stockholder will limit the influence of public stockholders.
Upon completion of this offering, one of our stockholders, David J. Chernicky, will beneficially own, control or have substantial influence over approximately % of our outstanding common stock, and approximately % if the underwriters exercise their option to purchase additional shares in full. This stockholder has the ability to exert significant influence over our board of directors and its policies. This stockholder will be able to control or substantially influence the outcome of stockholder votes, including votes concerning the election of directors, the adoption or amendment of provisions in our certificate of incorporation or bylaws and possible mergers, corporate control contests and other significant corporate transactions. This concentration of ownership may have the effect of delaying, deterring or preventing a change in control, a merger, consolidation, takeover or other business combination. This concentration of ownership could also discourage a potential acquirer from making a tender offer or otherwise attempting to obtain control of us, which could in turn have an adverse effect on the market price of our common stock.
We expect to be a “controlled company” within the meaning of the NYSE rules and, if applicable, would qualify for and may rely on exemptions from certain corporate governance requirements.
One of our stockholders, our chairman David J. Chernicky, holds more than 50% of the voting power for the election of directors, and as such, we are a “controlled company” as that term is defined in Section 303A of the NYSE Listed Company Manual. Under the NYSE rules, a “controlled company” may elect not to comply with certain NYSE corporate governance requirements, including:
| • | the requirement that a majority of our board of directors consist of independent directors; |
| • | the requirement that our governance committee be composed entirely of independent directors with a written charter addressing the committee’s purpose and responsibilities; and |
| • | the requirement that our compensation committee be composed entirely of independent directors with a written charter addressing the committee’s purpose and responsibilities. |
These requirements will not apply to us as long as we remain a “controlled company.” Following this offering, we may utilize some or all of these exemptions. Accordingly, you may not have the same protections afforded to stockholders of companies that are subject to all of the corporate governance requirements of the NYSE. The significant ownership interest of Mr. Chernicky could adversely affect investors’ perceptions of our corporate governance.
31
Table of Contents
Index to Financial Statements
The initial public offering price of our common stock may not be indicative of the market price of our common stock after this offering. In addition, an active liquid trading market for our common stock may not develop and our stock price may be volatile.
Prior to this offering, our common stock was not traded on any market. An active and liquid trading market for our common stock may not develop or be maintained after this offering. Liquid and active trading markets usually result in less price volatility and more efficiency in carrying out investors’ purchase and sale orders. The market price of our common stock could vary significantly as a result of a number of factors, some of which are beyond our control. In the event of a drop in the market price of our common stock, you could lose a substantial part or all of your investment in our common stock. The initial public offering price will be negotiated between us and representatives of the underwriters, based on numerous factors which we discuss in the “Underwriting” section of this prospectus, and may not be indicative of the market price of our common stock after this offering. Consequently, you may not be able to sell shares of our common stock at prices equal to or greater than the price paid by you in the offering.
The following factors could affect our stock price:
| • | our operating and financial performance and drilling locations, including reserve estimates; |
| • | quarterly variations in the rate of growth of our financial indicators, such as net income per share, net income and revenues; |
| • | changes in revenue or earnings estimates or publication of reports by equity research analysts; |
| • | speculation in the press or investment community; |
| • | sales of our common stock by us or our stockholders, or the perception that such sales may occur; |
| • | general market conditions, including fluctuations in commodity prices; and |
| • | domestic and international economic, legal and regulatory factors unrelated to our performance. |
The stock markets in general have experienced extreme volatility that has often been unrelated to the operating performance of particular companies. These broad market fluctuations may adversely affect the trading price of our common stock.
Purchasers of common stock in this offering will experience immediate and substantial dilution of $ per share.
Based on an assumed initial public offering price of $ per share, purchasers of our common stock in this offering will experience an immediate and substantial dilution of $ per share in the pro forma as adjusted net tangible book value per share of common stock from the initial public offering price, and our pro forma as adjusted net tangible book value as of , 2011 after giving effect to this offering would be $ per share. See “Dilution” for a complete description of the calculation of pro forma net tangible book value.
As a result of the reporting and disclosure requirements of a public company under the Exchange Act, the NYSE rules and the requirements of the Sarbanes-Oxley Act of 2002, we will incur significant additional costs and expenses and compliance with these requirements will require a substantial amount of our management’s time.
As a public company with listed equity securities, we will be required to comply with applicable laws, regulations and requirements, certain corporate governance provisions of the Sarbanes-Oxley Act of 2002, related regulations of the SEC and the requirements of the NYSE with which we are not required to comply as a
32
Table of Contents
Index to Financial Statements
private company. Complying with these statutes, regulations and requirements will occupy a significant amount of time of our board of directors and management and will significantly increase our costs and expenses. We will need to:
| • | institute a more comprehensive compliance function; |
| • | design, establish, evaluate and maintain a system of internal controls over financial reporting in compliance with the requirements of Section 404 of the Sarbanes-Oxley Act of 2002 and the related rules and regulations of the SEC and the Public Company Accounting Oversight Board; |
| • | comply with rules promulgated by the NYSE; |
| • | prepare and distribute periodic public reports in compliance with our obligations under the federal securities laws; |
| • | establish new internal policies, such as those relating to disclosure controls and procedures and insider trading; and |
| • | involve and retain to a greater degree outside counsel, accountants and other professionals and consultants in the above activities. |
In addition, we also expect that being a public company subject to these rules and regulations will increase our cost to obtain director and officer liability insurance coverage and could also make it more difficult for us to attract and retain qualified members of our board of directors, particularly to serve on our audit committee, and qualified executive officers.
We will have significant obligations under the Exchange Act.
Because we will be a public company required to file reports under the Exchange Act, we will be subject to increased regulatory scrutiny and extensive and complex regulation. The SEC has the right to review the accuracy and completeness of our reports, press releases, and other public documents. In addition, we are subject to extensive requirements to institute and maintain financial accounting controls and for the accuracy and completeness of our books and records. Normally these activities are overseen by an audit committee consisting of qualified independent directors. None of the current members of our board of directors are considered “independent.” Consequently, the protections normally provided to stockholders by boards of directors comprised by a majority of persons considered “independent” directors are not available.
Indemnification of officers and directors may result in unanticipated expenses.
The Delaware General Corporation Law and our bylaws provide for the indemnification of our directors, officers, employees, and agents, under certain circumstances, against attorney’s fees and other expenses incurred by them in any litigation to which they become a party arising from their association with us or activities on our behalf. We also will bear the expenses of such litigation for any of our directors, officers, employees, or agents, upon such person’s promise to repay them if it is ultimately determined that any such person is not entitled to indemnification. This indemnification policy could result in substantial expenditures by us that we may be unable to recoup and could direct funds away from our business.
Acquisitions of interests that we may make from time to time pursuant to our rights of first refusal from certain related parties may require the retrospective restatement of our financial statements, which could delay our Exchange Act filings and otherwise adversely affect our financial position and the price of our common stock.
Pursuant to certain rights of first refusal we have obtained from Scintilla and New Dominion as part of the transactions pursuant to which we acquired our initial properties, we have the right, but not the obligation, to acquire up to 90% of Scintilla and New Dominion’s combined interest in oil and natural gas projects determined
33
Table of Contents
Index to Financial Statements
to have proved reserves for a 25-year period in exchange for a payment of fair value for our interest in such projects, determined at the time we elect to participate. Both Scintilla and New Dominion are controlled by David J. Chernicky, our principal stockholder, chairman and senior geologist. As such, so long as Mr. Chernicky continues to be our controlling stockholder, any acquisitions pursuant to this right of first refusal will represent a transfer of net assets between entities under common control for purposes of GAAP. The effect of this accounting treatment is that the amount we may pay in excess of Scintilla or New Dominion’s basis in the net assets acquired, if any, will be recognized as a reduction to stockholders’ equity. As such, any acquisitions of assets from these related parties where the acquisition cost is significantly in excess of their basis in those assets may significantly increase our debt to capitalization ratios, which could result in a default under our credit facility and adversely affect our financial position, liquidity and the price of our common stock. Furthermore, under applicable accounting guidance, following any acquisition of assets from one of these related parties we will be required to retrospectively restate the historical periods presented in our historical financial statements to reflect the combined historical results of our operations throughout the periods presented. This requirement could delay our ability to file timely the periodic reports we are required to file pursuant to the Exchange Act, which could have an adverse affect on the trading price of our common stock and its continued listing on a national securities exchange.
We do not intend to pay and we are currently prohibited by our credit facility from paying dividends on our common stock and, consequently, your only opportunity to achieve a return on your investment is if the price of our common stock appreciates and a market for our common stock develops.
We do not plan to declare dividends on shares of our common stock in the foreseeable future. Additionally, we are currently prohibited from making any cash dividends pursuant to the terms of our credit facility. Consequently, your only opportunity to achieve a return on your investment in our common stock will be if the market price of our common stock appreciates, which may not occur, and you sell your shares at a profit. There is no guarantee that the price of our common stock that will prevail in the market after this offering will ever exceed the price that you pay or that a market for our common stock will develop to enable you to sell your shares.
Future sales of our common stock in the public market could lower our stock price, and any additional capital raised by us through the sale of equity or convertible securities may dilute your ownership in us.
We may sell additional shares of common stock in subsequent public offerings. We may also issue additional shares of common stock or convertible securities. After the completion of this offering, we will have outstanding shares of common stock. This number includes shares that we are selling in this offering, which may be resold immediately in the public market. Following the completion of this offering, our current stockholders will own shares, or approximately % of our total outstanding shares. Many of our current stockholders are parties to a registration rights agreement with us. Pursuant to this agreement, subject to the terms of the lock-up agreement between our current stockholders and the underwriters described under the caption “Underwriting,” we have agreed to effect the registration of shares held by our current stockholders if they so request or if we conduct other offerings of our common stock. See “Certain Relationships and Related Party Transactions—Registration Rights Agreement.” In addition, as soon as practicable after this offering, we intend to file a registration statement with the SEC on Form S-8 providing for the registration of additional shares of our common stock issued or reserved for issuance under our long-term incentive plan. Subject to the satisfaction of vesting conditions and the expiration of lock-up agreements, shares registered under this registration statement on Form S-8 will be available for resale immediately in the public market without restriction.
We cannot predict the size of future issuances of our common stock or the effect, if any, that future issuances and sales of shares of our common stock will have on the market price of our common stock. Sales of substantial amounts of our common stock (including shares issued in connection with an acquisition), or the perception that such sales could occur, may adversely affect prevailing market prices of our common stock.
34
Table of Contents
Index to Financial Statements
The equity trading markets may be volatile, which could result in losses for our stockholders.
In recent years, the stock market has experienced extreme price and volume fluctuations. This volatility has had a significant effect on the market price of securities issued by many companies for reasons unrelated to their operating performance. The market price of our common stock could similarly be subject to wide fluctuations in response to a number of factors, most of which we cannot control, including:
| • | domestic and worldwide supplies and prices of, and demand for, oil and natural gas; |
| • | changes in environmental and other governmental regulations affecting the oil and natural gas industry; |
| • | variations in our quarterly results of operations or cash flows; and |
| • | changes in general conditions in the U.S. economy, financial markets or the oil and natural gas industry. |
The realization of any of these risks and other factors beyond our control could cause the market price of our common stock to decline significantly.
Our certificate of incorporation and bylaws contain, and Delaware law contains, provisions that may prevent, discourage or frustrate attempts to replace or remove our current management by our stockholders, even if such replacement or removal may be in our stockholders’ best interests.
Our certificate of incorporation and bylaws contain, and Delaware law contains, provisions that could enable our management to resist a takeover attempt. Such provisions:
| • | classify our board into three classes of directors, each of which is elected for staggered three-year terms, meaning only one-third of our directors are elected at any particular annual meeting of stockholders. Further, because of our classified board, our directors generally may be removed only for cause; |
| • | permit us to issue, without any further vote or action by the stockholders, shares of preferred stock in one or more series and, with respect to each such series, to fix the number of shares constituting the series and the designation of the series, the voting powers (if any) of the shares of the series, and the preferences and relative, participating, optional, and other special rights, if any, and any qualification, limitations or restrictions of the shares of such series; |
| • | require special meetings of the stockholders to be called by the chairman of the board, the chief executive officer, or by resolution of a majority of the board of directors; |
| • | require business at special meetings to be limited to the stated purpose or purposes of that meeting; |
| • | require that stockholders follow certain procedures, including advance notice procedures, to bring certain matters before an annual meeting or to nominate a director for election; and |
| • | permit directors to fill vacancies in our board of directors. |
These provisions could:
| • | discourage, delay or prevent a change in the control of our company or a change in our management, even if the change would be in the best interests of our stockholders; |
| • | adversely affect the voting power of holders of common stock; and |
| • | limit the price that investors might be willing to pay in the future for shares of our common stock. |
35
Table of Contents
Index to Financial Statements
The lack of a broker or dealer to create or maintain a market in our stock could adversely impact the price and liquidity of our securities.
We currently have no agreement with any broker or dealer to act as a market maker for our securities and there is no assurance that we will be successful in obtaining any market makers. Thus, no broker or dealer will have an incentive to make a market for our stock. The lack of a market maker for our securities could adversely influence the market for and price of our securities, as well as your ability to dispose of, or to obtain accurate information about, and/or quotations as to the price of, our securities.
We currently do not have active corporate governance policies or procedures and we have no independent directors.
We do not currently have: (i) any independent directors, (ii) a separately designated audit committee, (iii) a separately designated nominating committee, (iv) a separately designated compensation committee, or (v) any other corporate governance committee. Thus, our stockholders do not have the benefits or protections associated with corporate governance controls and other corporate oversight mechanisms overseen by independent directors.
36
Table of Contents
Index to Financial Statements
CAUTIONARY NOTE REGARDING FORWARD-LOOKING STATEMENTS
The information discussed in this prospectus includes “forward-looking statements.” These forward-looking statements are identified by their use of terms and phrases such as “may,” “expect,” “estimate,” “project,” “plan,” “believe,” “intend,” “achievable,” “anticipate,” “will,” “continue,” “potential,” “should,” “could,” and similar terms and phrases. All statements, other than statements of historical facts, included herein concerning, among other things, planned capital expenditures, potential increases in oil and natural gas production, the number of anticipated wells to be drilled after the date hereof, future cash flows and borrowings, pursuit of potential acquisition opportunities, our financial position, business strategy and other plans and objectives for future operations, are forward-looking statements. Although we believe that the expectations reflected in these forward-looking statements are reasonable, they do involve certain assumptions, risks and uncertainties. Our actual results could differ materially from those anticipated in these forward-looking statements as a result of certain factors, including, among others:
| • | our ability to replace oil and natural gas reserves; |
| • | declines or volatility in the prices we receive for our oil and natural gas; |
| • | our financial position; |
| • | our ability to generate sufficient cash flow and liquidity from operations, borrowings or other sources to enable us to pay our obligations and maintain our non-operated acreage positions; |
| • | future capital requirements and uncertainty of obtaining additional funding on terms acceptable to us; |
| • | there are significant interlocking relationships between us, Scintilla, and New Dominion, and there can be no assurance that these interlocking relationships may not result in conflicts of interest and other risks to decision-making actions by our officers and directors in the future; |
| • | although we believe that we paid a fair price for the Acquired Assets, we did not obtain any independent valuation of those properties other than the reserve report issued by Ralph E. Davis Associates, Inc., which provides information about reserves and discounted cash flow, but not valuation; |
| • | our ability to continue our working relationship with our contract operator and other related entities; |
| • | general economic conditions, whether internationally, nationally or in the regional and local market areas in which we do business; |
| • | economic downturns may adversely affect consumption of oil and natural gas by businesses and consumers; |
| • | the presence or recoverability of estimated oil and natural gas reserves and the actual future production rates and associated costs; |
| • | uncertainties associated with estimates of proved oil and natural gas reserves and, in particular, probable and possible resources; |
| • | the impact of environmental, health and safety, and other governmental regulations and of current or pending legislation; |
| • | environmental risks; |
| • | geographical concentration of our operations; |
| • | constraints imposed on our business and operations by our credit agreements and our ability to generate sufficient cash flows to repay our debt obligations; |
| • | availability of borrowings under our credit agreements; |
37
Table of Contents
Index to Financial Statements
| • | drilling and operating risks; |
| • | exploration and development risks; |
| • | competition in the oil and natural gas industry; |
| • | increases in the cost of drilling, completion and gas gathering or other costs of production and operations; |
| • | the inability of our contract operator to successfully drill wells on our properties that produce oil or natural gas in commercially viable quantities; |
| • | failure to meet the proposed drilling schedule on our properties; |
| • | adverse variations from estimates of reserves, production, production prices and expenditure requirements, and our inability to replace our reserves through exploration and development activities; |
| • | drilling operations and adverse weather and environmental conditions; |
| • | limited control over non-operated properties; |
| • | reliance on a limited number of customers; |
| • | management’s ability to execute our plans to meet our goals; |
| • | our ability to retain key members of our senior management and key technical employees; |
| • | conflicts of interest with regard to our directors; |
| • | access to adequate gathering systems and pipeline take-away capacity to execute our drilling program; |
| • | marketing and transportation constraints in the Hunton formation in east-central Oklahoma; |
| • | our ability to sell the oil and natural gas we produce at market prices; |
| • | costs associated with perfecting title for mineral rights in some of our properties; |
| • | title defects to our properties and inability to retain our leases; |
| • | federal, state, and tribal regulations and laws; |
| • | our current level of indebtedness and the effect of any increase in our level of indebtedness; |
| • | risks relating to potential acquisitions and the integration of significant acquisitions; |
| • | price volatility of oil and natural gas prices and the effect that lower prices may have on our net income and stockholders’ equity; |
| • | a decline in oil or natural gas production or oil or natural gas prices and the impact of general economic conditions on the demand for oil and natural gas and the availability of capital; |
| • | effect of seasonal factors; |
| • | lack of availability of drilling rigs, equipment, supplies, insurance, personnel and oilfield services; |
| • | further sales or issuances of common stock; |
| • | our common stock’s lack of any trading history; |
| • | costs of purchasing electricity and disposing of saltwater; |
| • | continued hostilities in the Middle East and other sustained military campaigns or acts of terrorism or sabotage; and |
| • | other economic, competitive, governmental, legislative, regulatory, geopolitical and technological factors that may negatively impact our businesses, operations or pricing. |
38
Table of Contents
Index to Financial Statements
Finally, our future results will depend upon various other risks and uncertainties, including, but not limited to, those detailed in “Risk Factors.” All forward-looking statements attributable to us or persons acting on our behalf are expressly qualified in their entirety by the cautionary statements in this paragraph and elsewhere in this prospectus and speak only as of the date of this prospectus. Other than as required under the securities laws, we do not assume a duty to update these forward-looking statements, whether as a result of new information, subsequent events or circumstances, changes in expectations or otherwise.
39
Table of Contents
Index to Financial Statements
We estimate that our net proceeds from the sale of common stock in this offering will be approximately $ million, assuming an initial public offering price of $ per share (the midpoint of the price range set forth on the cover page of this prospectus) and after deducting estimated expenses and underwriting discounts and commissions of approximately $ million. If the underwriters’ over-allotment option is exercised in full, we estimate that our net proceeds will be approximately $ million.
An increase or decrease in the initial public offering price of $1.00 per share of common stock would cause the net proceeds that we will receive from the offering, after deducting estimated expenses and underwriting discounts and commissions, to increase or decrease, as applicable, by approximately $ million.
We intend to use a portion of the net proceeds from this offering to repay all outstanding indebtedness under our credit facility, which as of , 2011 was approximately $ million. We do not currently have plans to borrow additional amounts under our credit facility. However, we may borrow from time to time to fund acquisitions or other capital needs. At the option of certain of our executive officers, we may withhold shares of their common stock to satisfy the withholding tax obligations of the executives incurred upon the vesting of such stock upon the consummation of this offering. Assuming an offering price of $ per share and an assumed combined state and federal tax rate of 30.5%, we estimate that up to approximately $ million of the proceeds of this offering may be used to fund such withholding tax payments.
The following table summarizes these and other planned uses for the proceeds of this offering:
| Purpose |
Amount of Proceeds | |||
| (in millions) | ||||
| Repayment of credit facility |
$ | |||
| Withholding tax obligations |
||||
| Drilling, completion, and infrastructure |
||||
| Leasehold acquisition |
||||
| Other acquisitions |
||||
| Miscellaneous (office equipment, IT infrastructure, personnel) |
||||
|
|
|
|||
| Total |
||||
|
|
|
|||
Our credit facility matures on August 12, 2015 and bears interest at a variable rate, which was approximately 3.685% per annum as of October 11, 2011. Our outstanding borrowings under our credit facility were incurred to fund the acquisition of the Acquired Assets and for general corporate purposes. See “Management’s Discussion and Analysis of Financial Condition and Results of Operations—Credit Facility.” Affiliates of certain of the underwriters are lenders under our credit facility and will receive a portion of the proceeds from this offering. Accordingly, this offering is being made in compliance with Rule 5121 of FINRA. See “Underwriting.”
We do not expect to declare or pay any cash dividends in the foreseeable future on our common stock. Our credit facility currently prohibits us from paying cash dividends on our common stock, and we may enter into debt arrangements in the future that also prohibit or restrict our ability to declare or pay cash dividends on our common stock.
40
Table of Contents
Index to Financial Statements
The following table sets forth cash and cash equivalents and capitalization:
(a) for the Scintilla Assets as of June 30, 2011; and
(b) pro forma for the effect of (i) our acquisition of the Scintilla Assets and the payment of consideration therefor, including the resulting change in income tax status of the Scintilla Assets and entry into our credit facility; (ii) the issuance of 157,500 shares of our common stock in a private placement in exchange for approximately $1.6 million in gross proceeds to us; (iii) the offering of shares of common stock pursuant to this offering, assuming an initial public offering price of $ per share (the midpoint of the price range set forth on the cover page of this prospectus) and the repayment of amounts borrowed under our credit facility; and (iv) the vesting of 1.2 million shares of restricted common stock held by members of our management.
You should read the following table in conjunction with “Use of Proceeds,” “Selected Historical Financial Data,” “Unaudited Pro Forma Financial Data,” “Management’s Discussion and Analysis of Financial Condition and Results of Operations” and the historical carve-out financial statements and unaudited pro forma financial information and the related notes thereto appearing elsewhere in this prospectus.
| June 30, 2011 | ||||||||
| Historical | Pro Forma | |||||||
| (In thousands) | ||||||||
| Cash and cash equivalents:(1) |
$ | — | $ | |||||
|
|
|
|
|
|||||
| Long-term debt: |
||||||||
| Credit facility(2) |
$ | 60,000 | $ | |||||
|
|
|
|
|
|||||
| Total long-term debt |
60,000 | |||||||
|
|
|
|
|
|||||
| Parent net investment/stockholders’ equity: |
||||||||
| Parent net investment |
59,794 | — | ||||||
| Preferred stock—$0.001 par value; 20,000,000 shares authorized, no shares issued and outstanding |
— | — | ||||||
| Common stock—$0.001 par value; 180,000,000 shares authorized, shares issued and outstanding pro forma(3) |
— | |||||||
| Additional paid-in capital |
— | |||||||
| Retained earnings |
— | |||||||
|
|
|
|
|
|||||
| Total parent net investment/stockholders’ equity |
59,794 | |||||||
|
|
|
|
|
|||||
| Total capitalization: |
$ | 119,794 | $ | |||||
|
|
|
|
|
|||||
| (1) | As of , 2011, our cash and cash equivalents were $ million. |
| (2) | Historical amounts include $60.0 million outstanding under the Scintilla credit facility. As of , 2011, there was $ million of indebtedness outstanding under our credit facility, which will be repaid using the net proceeds of this offering. |
| (3) | Does not include 1.2 million shares of our common stock issued in exchange for the Other Contributed Assets. |
41
Table of Contents
Index to Financial Statements
Purchasers of our common stock in this offering will experience immediate and substantial dilution in the net tangible book value per share of the common stock for accounting purposes.
Our net tangible book value as of , 2011 was approximately $ million, or $ per share of common stock. Pro forma net tangible book value per share is determined by dividing our pro forma tangible net worth (tangible assets less total liabilities) by the total number of shares of common stock that will be outstanding immediately prior to the closing of this offering. After giving effect to the sale of the shares in this offering and further assuming the receipt of the estimated net proceeds (after deducting underwriting discounts and anticipated expenses of this offering), our adjusted pro forma net tangible book value as of , 2011 would have been approximately $ million, or $ per share. This represents an immediate increase in the net tangible book value of $ per share to our existing stockholders and an immediate dilution (i.e., the difference between the offering price and the adjusted pro forma net tangible book value after this offering) to new investors purchasing shares in this offering of $ per share.
The following table illustrates the per share dilution to new investors purchasing shares in this offering:
| Assumed initial public offering price per share |
$ | |||
| Pro forma net tangible book value per share as of , 2011 |
$ | |||
| Increase per share attributable to new investors in this offering |
$ | |||
| As adjusted pro forma net tangible book value per share after giving effect to this offering |
$ | |||
| Dilution in pro forma net tangible book value per share to new investors in this offering |
$ |
The following table summarizes, on an adjusted pro forma basis as of , 2011, the total number of shares of common stock owned by existing stockholders and to be owned by new investors, the total consideration paid, and the average price per share paid by our existing stockholders and to be paid by new investors in this offering at $ , calculated before deduction of estimated underwriting discounts and commissions:
| Shares Acquired | Total Consideration | Average Price per Share |
||||||||||||||||||||
| Number | Percent | Amount | Percent | |||||||||||||||||||
| Existing stockholders |
% | $ | % | $ | % | |||||||||||||||||
| New investors |
||||||||||||||||||||||
| Total |
% | $ | % | $ | % | |||||||||||||||||
42
Table of Contents
Index to Financial Statements
SELECTED HISTORICAL FINANCIAL DATA
The following table sets forth the selected historical financial and other data of the Scintilla Assets, as of and for each of the years in the five-year period ended December 31, 2010 and as of and for each of the six-month periods ended June 30, 2010 and 2011. Since the Other Contributed Assets were not considered significant acquisitions and were acquired from parties not under common control with us, they are not included in our historical and unaudited pro forma financial statements. For further discussion of the accounting treatment of the Acquired Assets, see “Management’s Discussion and Analysis of Financial Condition and Results of Operations—Overview and Basis of Presentation.”
The selected historical financial data of the Scintilla Assets as of December 31, 2009 and 2010 and for each of the years ended December 31, 2008, 2009 and 2010 are derived from the audited historical carve-out financial statements of the Scintilla Assets included elsewhere in this prospectus. The selected historical financial data of the Scintilla Assets as of and for each of the years ended December 31, 2006 and 2007, and as of December 31, 2008 are derived from the unaudited historical carve-out financial statements of the Scintilla Assets, which are not included in this prospectus. The selected historical financial data of the Scintilla Assets as of June 30, 2011 and for the six months ended June 30, 2010 and 2011 are derived from the unaudited historical carve-out financial statements of the Scintilla Assets included elsewhere in this prospectus. In management’s opinion, these financial statements include all adjustments necessary for the fair presentation of financial condition as of such dates and the results of operations for such periods.
Our historical carve-out financial statements included in this prospectus may not necessarily reflect our financial position, results of operations, and cash flows as if we had operated as a stand-alone public company during all periods presented. The historical financial data reflect allocated overhead from our predecessor in interest and do not reflect any estimate of additional overhead that we may incur as a separate company. Following the completion of this offering, we expect to incur additional annual costs associated with our compliance and disclosure obligations as a public company and to incur significant non-cash compensation expense in the financial quarter in which this offering occurs upon the vesting of restricted common stock granted to management as part of our formation, and our overhead costs could be materially different. Accordingly, for this and other reasons, the historical results should not be relied upon as an indicator of our future performance.
For a detailed discussion of the selected historical financial information contained in the following table, please read “Management’s Discussion and Analysis of Financial Condition and Results of Operations.” The following table should also be read in conjunction with the historical carve-out financial statements of the Scintilla Assets and the accompanying notes thereto contained elsewhere in this prospectus.
43
Table of Contents
Index to Financial Statements
| Year Ended December 31, | Six Months Ended June 30, |
|||||||||||||||||||||||||||
| 2006 | 2007 | 2008 | 2009 | 2010 | 2010 | 2011 | ||||||||||||||||||||||
| (unaudited) | (unaudited) | (unaudited) |
(unaudited) | |||||||||||||||||||||||||
| (In thousands, except per share amounts) |
||||||||||||||||||||||||||||
| Statement of Operations Data |
||||||||||||||||||||||||||||
| Revenues: |
||||||||||||||||||||||||||||
| Oil sales |
$ | 3,284 | $ | 2,610 | $ | 5,753 | $ | 4,389 | $ | 5,336 | $ | 2,814 | $ | 2,331 | ||||||||||||||
| Natural gas liquids and natural gas sales |
34,660 | 45,820 | 53,150 | 26,668 | 36,388 | 18,086 | 22,020 | |||||||||||||||||||||
|
|
|
|
|
|
|
|
|
|
|
|
|
|
|
|||||||||||||||
| Total revenues |
37,944 | 48,430 | 58,903 | 31,057 | 41,724 | 20,900 | 24,351 | |||||||||||||||||||||
|
|
|
|
|
|
|
|
|
|
|
|
|
|
|
|||||||||||||||
| Operating costs and expenses: |
||||||||||||||||||||||||||||
| Oil and natural gas production expenses |
9,169 | 11,557 | 13,711 | 9,368 | 11,069 | 5,194 | 5,945 | |||||||||||||||||||||
| General and administrative |
379 | 415 | 460 | 578 | 670 | 326 | 784 | |||||||||||||||||||||
| Depreciation, depletion, and amortization |
10,294 | 11,782 | 11,611 | 10,529 | 11,371 | 5,615 | 5,253 | |||||||||||||||||||||
| Accretion expense |
25 | 29 | 34 | 44 | 51 | 25 | 29 | |||||||||||||||||||||
|
|
|
|
|
|
|
|
|
|
|
|
|
|
|
|||||||||||||||
| Total operating costs and expenses |
19,867 | 23,783 | 25,816 | 20,519 | 23,161 | 11,160 | 12,011 | |||||||||||||||||||||
|
|
|
|
|
|
|
|
|
|
|
|
|
|
|
|||||||||||||||
| Operating income |
18,077 | 24,647 | 33,087 | 10,538 | 18,563 | 9,740 | 12,340 | |||||||||||||||||||||
| Other income (expense): |
||||||||||||||||||||||||||||
| Interest expense |
(817 | ) | (743 | ) | (2,536 | ) | (1,943 | ) | (2,648 | ) | (1,314 | ) | (1,444 | ) | ||||||||||||||
| Realized and unrealized losses from derivatives |
— | — | (352 | ) | — | (574 | ) | 2,438 | (2,758 | ) | ||||||||||||||||||
|
|
|
|
|
|
|
|
|
|
|
|
|
|
|
|||||||||||||||
| Net income |
$ | 17,260 | $ | 23,904 | $ | 30,199 | $ | 8,595 | $ | 15,341 | $ | 10,864 | $ | 8,138 | ||||||||||||||
|
|
|
|
|
|
|
|
|
|
|
|
|
|
|
|||||||||||||||
| Year Ended December 31, | Six Months Ended June 30, |
|||||||||||||||||||||||||||
| 2006 | 2007 | 2008 | 2009 | 2010 | 2010 | 2011 | ||||||||||||||||||||||
| (unaudited) |
(unaudited) |
(unaudited) | (unaudited) | |||||||||||||||||||||||||
| (In thousands) |
||||||||||||||||||||||||||||
| Cash Flow Information: |
||||||||||||||||||||||||||||
| Net cash provided by operating activities |
$ | 28,223 | $ | 35,669 | $ | 45,949 | $ | 17,042 | $ | 28,674 | $ | 15,363 | $ | 15,034 | ||||||||||||||
| Net cash used in investing activities |
$ | (28,196 | ) | $ | (25,370 | ) | $ | (25,094 | ) | $ | (22,834 | ) | $ | (26,074 | ) | $ | (8,392 | ) | $ | (16,734 | ) | |||||||
| Net cash provided by (used in) financing activities |
$ | (27 | ) | $ | (10,299 | ) | $ | (20,855 | ) | $ | 5,792 | $ | (2,600 | ) | $ | (6,971 | ) | $ | 1,700 | |||||||||
44
Table of Contents
Index to Financial Statements
| As of December 31, | As of June 30, 2011 |
|||||||||||||||||||||||
| 2006 | 2007 | 2008 | 2009 | 2010 | ||||||||||||||||||||
| (unaudited) | (unaudited) | (unaudited) | (unaudited) | |||||||||||||||||||||
| (In thousands) |
||||||||||||||||||||||||
| Balance Sheet Data: |
||||||||||||||||||||||||
| Oil and natural gas sales receivables |
$ | 6,117 | $ | 8,228 | $ | 4,401 | $ | 6,537 | $ | 6,444 | $ | 6,755 | ||||||||||||
| Other current assets |
— | — | — | — | 994 | 632 | ||||||||||||||||||
| Total oil and natural gas properties, net |
54,905 | 68,548 | 80,524 | 92,406 | 108,705 | 118,977 | ||||||||||||||||||
| Other assets |
— | 163 | 49 | — | 1,453 | 1,661 | ||||||||||||||||||
|
|
|
|
|
|
|
|
|
|
|
|
|
|||||||||||||
| Total assets |
$ | 61,022 | $ | 76,939 | $ | 84,974 | $ | 98,943 | $ | 117,596 | $ | 128,025 | ||||||||||||
|
|
|
|
|
|
|
|
|
|
|
|
|
|||||||||||||
| Current liabilities |
$ | 2,730 | $ | 4,858 | $ | 3,441 | $ | 2,871 | $ | 6,009 | $ | 5,439 | ||||||||||||
| Long-term debt |
10,859 | 43,000 | 60,000 | 60,000 | 60,000 | 60,000 | ||||||||||||||||||
| Other long-term liabilities |
492 | 576 | 685 | 837 | 2,175 | 2,792 | ||||||||||||||||||
| Total parent net investment/stockholders’ equity |
46,941 | 28,505 | 20,848 | 35,235 | 49,412 | 59,794 | ||||||||||||||||||
|
|
|
|
|
|
|
|
|
|
|
|
|
|||||||||||||
| Total liabilities and parent net investment/stockholders’ equity |
$ | 61,022 | $ | 76,939 | $ | 84,974 | $ | 98,943 | $ | 117,596 | $ | 128,025 | ||||||||||||
|
|
|
|
|
|
|
|
|
|
|
|
|
|||||||||||||
45
Table of Contents
Index to Financial Statements
UNAUDITED PRO FORMA FINANCIAL DATA
The following financial information sets forth our unaudited pro forma and historical statements of operations for the year ended December 31, 2010 and for the six months ended June 30, 2011, and the unaudited pro forma and historical balance sheet at June 30, 2011. We derived the historical statements of operations and balance sheet from the following sources:
| • | the historical statement of operations of the Scintilla Assets for the year ended December 31, 2010 was derived from the audited historical carve-out financial statements of the Scintilla Assets included elsewhere in this prospectus; and |
| • | the historical statement of operations of the Scintilla Assets for the six months ended June 30, 2011 and the historical balance sheet as of June 30, 2011 were derived from the unaudited historical carve-out financial statements of the Scintilla Assets included elsewhere in this prospectus. |
Our unaudited pro forma financial statements were prepared on a basis consistent with that used in preparing the audited historical carve-out financial statements of the Scintilla Assets.
The unaudited pro forma balance sheet as of June 30, 2011 assumes that the following occurred on June 30, 2011:
| • | the completion of a private placement of 157,500 shares of common stock for $10.00 per share, raising gross proceeds of approximately $1.6 million; |
| • | the acquisition of the Scintilla Assets in exchange for 20.0 million shares of common stock and $60.0 million in cash, used by Scintilla to repay $60.0 million in debt; |
| • | the entrance into a four-year, $150.0 million credit facility, with an initial borrowing base of $72.5 million, of which $60.0 million was used to acquire the Scintilla Assets, and with a $5.0 million subfacility for standby letters of credit; |
| • | the change in tax status whereby the Scintilla Assets will be subject to federal and state income taxes; |
| • | the vesting of 1.2 million shares of restricted common stock held by members of management; and |
| • | the issuance by us to the public of shares of common stock and the use of the net proceeds from this offering as described under “Use of Proceeds.” |
The unaudited pro forma statements of operations for the year ended December 31, 2010 and for the six months ended June 30, 2011 assume that the following occurred on January 1, 2010:
| • | the acquisition of the Scintilla Assets in exchange for 20.0 million shares of common stock and $60.0 million in cash, used by Scintilla to repay $60.0 million in debt; |
| • | the entrance into a four-year, $150.0 million credit facility with an initial borrowing base of $72.5 million, of which $60.0 million was used to acquire the Scintilla Assets, and with a $5.0 million subfacility for standby letters of credit; |
| • | the change in tax status whereby the Scintilla Assets will be subject to federal and state income taxes; and |
| • | the issuance by us to the public of shares of common stock and the use of the net proceeds from this offering as described under “Use of Proceeds.” |
The historical and pro forma carve-out financial statements of the Scintilla Assets, and the notes to those financial statements, included in this prospectus may not necessarily reflect the financial position, results of operations, and cash flows of New Source as if it had operated as a stand-alone public company during all periods presented. Upon the completion of this offering, we expect to incur additional annual costs associated
46
Table of Contents
Index to Financial Statements
with our compliance and disclosure obligations as a public company and to incur significant non-cash compensation expense in the financial quarter in which this offering occurs upon the vesting of restricted common stock granted to management as part of our formation, and our overhead costs could be materially different. Accordingly, for this and other reasons, the historical and pro forma results should not be relied upon as an indicator of our future performance.
The unaudited pro forma financial data should be read in conjunction with “Use of Proceeds,” “Selected Historical Financial Data,” “Management’s Discussion and Analysis of Financial Condition and Results of Operations,” and the historical carve-out financial statements of the Scintilla Assets and the notes to those financial statements included elsewhere in this prospectus. The unaudited pro forma carve-out financial statements of the Scintilla Assets are for illustrative purposes only and are not intended to represent what our results of operations would be after giving effect to this offering or to indicate our results of operations for any future period. Therefore, investors should not place undue reliance on the unaudited pro forma financial data. The unaudited pro forma adjustments are based on available information and certain assumptions that we believe are reasonable and are described below in the accompanying notes.
47
Table of Contents
Index to Financial Statements
New Source Energy Corporation
Unaudited Pro Forma Condensed Balance Sheet
| As of June 30, 2011 | ||||||||||||||
| Historical | Pro Forma |
Pro Forma |
||||||||||||
| (In thousands) | ||||||||||||||
| Assets |
||||||||||||||
| Current assets: |
||||||||||||||
| Cash and cash equivalents |
$ | — | $ | 5(a) | $ | |||||||||
| 5(b) | ||||||||||||||
| 62,500 | 3 | |||||||||||||
| (2,500 | ) | 3(b) | ||||||||||||
| (60,000 | ) | 3 | ||||||||||||
| 5(c) | ||||||||||||||
| 1,575 | 1 | |||||||||||||
| Oil and natural gas sales receivables-related parties |
6,755 | — | 6,755 | |||||||||||
| Derivative assets |
632 | — | 632 | |||||||||||
|
|
|
|
|
|
|
|||||||||
| Total current assets |
7,387 | |||||||||||||
|
|
|
|
|
|
|
|||||||||
| Oil and natural gas properties, at cost, using full cost method: |
||||||||||||||
| Proved oil and natural gas properties |
194,280 | — | 194,280 | |||||||||||
| Accumulated depreciation, depletion, and amortization |
75,303 | — | 75,303 | |||||||||||
|
|
|
|
|
|
|
|||||||||
| Total oil and natural gas properties, net |
118,977 | — | 118,977 | |||||||||||
|
|
|
|
|
|
|
|||||||||
| Loan fees, net |
811 | (811 | ) | 3(a) | 2,500 | |||||||||
| 2,500 | 3(b) | |||||||||||||
| Deferred offering costs |
544 | (544 | ) | 5(b) | ||||||||||
| Derivative assets |
306 | — | 306 | |||||||||||
|
|
|
|
|
|
|
|||||||||
| Total assets |
$ | 128,025 | $ | $ | ||||||||||
|
|
|
|
|
|
|
|||||||||
| Liabilities and parent net investment/stockholders’ equity |
||||||||||||||
| Current liabilities: |
||||||||||||||
| Accounts payable—related party |
$ | 3,107 | $ | — | $ | 3,107 | ||||||||
| Derivative obligations |
2,332 | — | 2,332 | |||||||||||
|
|
|
|
|
|
|
|||||||||
| Total current liabilities |
5,439 | — | 5,439 | |||||||||||
| Credit facility—long-term portion |
60,000 | (60,000 | ) | 3 | ||||||||||
| — | 62,500 | 3 | ||||||||||||
| — | 5(c) | |||||||||||||
| Derivative obligations |
1,854 | — | 1,854 | |||||||||||
| Asset retirement obligation |
938 | — | 938 | |||||||||||
| Deferred tax liability |
— | 18,020 | 4(a) | 18,020 | ||||||||||
|
|
|
|
|
|
|
|||||||||
| Total liabilities |
68,231 | |||||||||||||
| Commitments and contingencies |
||||||||||||||
| Parent net investment |
59,794 | (59,794 | ) | 2 | — | |||||||||
| Preferred Stock, $0.001 par value, 20,000,000 shares authorized |
— | — | — | |||||||||||
| Common Stock, $0.001 par value, 180,000,000 shares authorized |
— | 20 | 2 | |||||||||||
| 5(a) | ||||||||||||||
| 6(b) | ||||||||||||||
| 2 | 1 | |||||||||||||
| Additional paid-in capital |
— | 59,774 | 2 | |||||||||||
| 5(a) | ||||||||||||||
| (544 | ) | 5(b) | ||||||||||||
| 6(b) | ||||||||||||||
| 2 | ||||||||||||||
| 1,573 | 1 | |||||||||||||
| 5(b) | ||||||||||||||
| Deficit |
— | 6(b) | ||||||||||||
| (18,020 | ) | 4(a) | ||||||||||||
| (811 | ) | 3(a) | ||||||||||||
|
|
|
|
|
|
|
|||||||||
| Total parent net investment/stockholders’ equity |
59,794 | |||||||||||||
|
|
|
|
|
|
|
|||||||||
| Total liabilities and parent net investment/stockholders’ equity |
$ | 128,025 | $ | $ | ||||||||||
|
|
|
|
|
|
|
|||||||||
48
Table of Contents
Index to Financial Statements
New Source Energy Corporation
Unaudited Pro Forma Condensed Statement of Operations
| Year Ended December 31, 2010 | ||||||||||||||
| Historical | Pro Forma Adjustments |
Pro Forma | ||||||||||||
| (In thousands) | ||||||||||||||
| Revenues: |
||||||||||||||
| Oil sales |
$ | 5,336 | $ | — | $ | 5,336 | ||||||||
| Natural gas liquids and natural gas sales |
36,388 | — | 36,388 | |||||||||||
|
|
|
|
|
|
|
|||||||||
| Total revenues |
41,724 | — | 41,724 | |||||||||||
| Operating costs and expenses: |
||||||||||||||
| Oil and natural gas production expenses |
11,069 | — | 11,069 | |||||||||||
| General and administrative |
670 | — | 8 | 670 | ||||||||||
| Depreciation, depletion, and amortization |
11,371 | — | 11,371 | |||||||||||
| Accretion expense |
51 | — | 51 | |||||||||||
|
|
|
|
|
|
|
|||||||||
| Total operating costs and expenses |
23,161 | — | 23,161 | |||||||||||
|
|
|
|
|
|
|
|||||||||
| Operating income |
18,563 | — | 18,563 | |||||||||||
| Other income (expense): |
||||||||||||||
| Interest expense |
(2,648 | ) | 2,648 | 3(d) | ||||||||||
| (624 | ) | 3(c) | ||||||||||||
| (360 | ) | 3(e) | (984 | ) | ||||||||||
| Realized and unrealized losses from derivatives |
(574 | ) | — | (574 | ) | |||||||||
|
|
|
|
|
|
|
|||||||||
| Income before income tax expense |
15,341 | 1,664 | 17,005 | |||||||||||
| Income tax expense |
— | (6,020 | ) | 4(b) | (6,020 | ) | ||||||||
|
|
|
|
|
|
|
|||||||||
| Net income |
$ | 15,341 | $ | (4,356 | ) | $ | 10,985 | |||||||
|
|
|
|
|
|
|
|||||||||
| Earnings per share basic and diluted: |
||||||||||||||
| Net Income per common share: basic and diluted |
$ | 7 | $ | |||||||||||
|
|
|
|
|
|||||||||||
| Shares used in computing earnings per share: basic and diluted |
7 | |||||||||||||
|
|
|
|
|
|||||||||||
49
Table of Contents
Index to Financial Statements
New Source Energy Corporation
Unaudited Pro Forma Condensed Statement of Operations
| Six Months Ended June 30, 2011 | ||||||||||||||
| Historical | Pro Forma Adjustments |
Pro Forma | ||||||||||||
| (In thousands) | ||||||||||||||
| Revenues: |
||||||||||||||
| Oil Sales |
$ | 2,331 | $ | — | $ | 2,331 | ||||||||
| Natural gas liquids and natural gas sales |
22,020 | — | 22,020 | |||||||||||
|
|
|
|
|
|
|
|||||||||
| Total revenues |
24,351 | — | 24,351 | |||||||||||
| Operating costs and expenses: |
||||||||||||||
| Oil and natural gas production expenses |
5,945 | — | 5,945 | |||||||||||
| General and administrative |
784 | — | 8 | 784 | ||||||||||
| Depreciation, depletion, and amortization |
5,253 | — | 5,253 | |||||||||||
| Accretion expense |
29 | — | 29 | |||||||||||
|
|
|
|
|
|
|
|||||||||
| Total operating costs and expenses |
12,011 | — | 12,011 | |||||||||||
|
|
|
|
|
|
|
|||||||||
| Operating income |
12,340 | — | 12,340 | |||||||||||
| Other income (expense) |
||||||||||||||
| Interest expense |
(1,444 | ) | 1,444 | 3(d) | ||||||||||
| (312 | ) | 3(c) | ||||||||||||
| (180 | ) | 3(e) | (492 | ) | ||||||||||
| Realized and unrealized losses from derivatives |
(2,758 | ) | — | (2,758 | ) | |||||||||
|
|
|
|
|
|
|
|||||||||
| Income before income tax expense |
8,138 | 952 | 9,090 | |||||||||||
| Income tax expense |
— | (3,222 | ) | 4(b) | (3,222 | ) | ||||||||
|
|
|
|
|
|
|
|||||||||
| Net income |
$ | 8,138 | $ | (2,270 | ) | $ | 5,868 | |||||||
|
|
|
|
|
|
|
|||||||||
| Earnings per share basic and diluted: |
||||||||||||||
| Net income per common share: basic and diluted |
$ | 7 | $ | |||||||||||
|
|
|
|
|
|||||||||||
| Shares used in computing earnings per share: basic and diluted |
7 | |||||||||||||
|
|
|
|
|
|||||||||||
50
Table of Contents
Index to Financial Statements
Pro Forma Adjustments and Assumptions
Private Placement of Common Stock
| (1) | We completed a private placement of 157,500 shares of our common stock at a price of $10.00 per share, solely to accredited investors, raising gross proceeds of approximately $1.6 million. |
Acquisition of Scintilla Assets
| (2) | We acquired the Scintilla Assets in exchange for 20.0 million shares of common stock and $60.0 million in cash, which was used by Scintilla to repay debt. This presentation does not include 1.2 million shares of our common stock issued in exchange for the Other Contributed Assets. |
Credit Facility
| (3) | Represents the pro forma effect of our entrance into a $150.0 million credit agreement, with an initial borrowing base of $72.5 million (redetermined on a semiannual basis) and with a $5.0 million subfacility for standby letters of credit. The credit facility matures on August 12, 2015. In conjunction with the purchase of the Scintilla Assets, we borrowed $62.5 million, of which $60.0 million was paid to acquire the Scintilla Assets and approximately $2.5 million was used to pay certain fees incurred to enter into the credit facility (including professional costs and financing fees). |
The historical carve-out financial statements include a previous credit facility of $60.0 million and $0.8 million in loan fees, which was replaced with the $150.0 million credit facility.
| (a) | Represents the write-off of $0.8 million in loan fees due to the extinguishment of historical debt. No corresponding extinguishment charge has been reflected in the accompanying pro forma condensed statements of operations. A charge will be reflected in the results of operations for the third quarter of 2011, when the extinguishment occurred. |
| (b) | Represents the capitalization of approximately $2.5 million of loan fees relating to costs incurred to establish the new credit facility for purchase of the Scintilla Assets. |
| (c) | Represents the amortization of the loan fees over the four-year term of the credit facility, which is approximately $52,000 per month. |
| (d) | Represents the elimination of interest expense, including loan fee amortization, related to the repayment of the outstanding Scintilla credit facility. |
| (e) | Represents the inclusion of commitment fees of approximately $30,000 per month related to the unused balance of the borrowing base under the credit facility, using a fee of 0.5% applicable to such unused balances. |
Income Taxes
| (4) | The Scintilla Assets have historically been owned by Scintilla, a limited liability company that is treated as a partnership for federal and state income tax purposes. As such, it is not a taxable entity and does not directly pay federal and state income tax. We are a subchapter C corporation and a taxable entity. For purposes of this pro forma statement of operations, no income tax charge is recorded upon the transfer of the Scintilla Assets to us. A charge will be reflected in the results of operations for the third quarter of 2011, when the transfer occurred. |
| (a) | Represents the adjustment due to the change in the tax status by which the Scintilla Assets will be subject to federal and state income taxes. Our acquisition of the Scintilla Assets triggered a partial step-up in our tax basis of the Scintilla Assets, while the book value remains the same, resulting in a deferred tax liability on the date of acquisition. |
| (b) | An effective income tax rate of 35.4%, including state taxes, was applied to pro forma pretax income, adjusted for permanent differences, to the statements of operations for 2011 and 2010, respectively. |
51
Table of Contents
Index to Financial Statements
Effect of Offering
| (5) | Represents the pro forma effect of this offering of shares of our common stock for net proceeds, after deducting underwriters’ commissions and other direct expenses, of $ million (assuming the shares are offered at $ per share of common stock, which is the midpoint of the estimated offering price range set forth on the cover page of this prospectus) and the use of such proceeds to repay all amounts due under our credit facility. |
| (a) | Represents the estimated gross proceeds of $ million from the issuance and sale of common stock. |
| (b) | Represents the payment of the estimated underwriting discounts and commission and other expenses of this offering of $ million, that will be allocated to additional paid-in-capital, of which $0.5 million was capitalized as of June 30, 2011. |
| (c) | Represents the repayment of amounts borrowed under the credit facility of $ million using the net proceeds from the offering. |
| (6) | We have entered into employment agreements with four of our executives officers pursuant to which we have granted an aggregate of 2.9 million shares of restricted common stock, 1.2 million of which will vest upon the consummation of this offering. |
| (a) | We and such executive officers will be subject to withholding taxes on the value of these shares on the vesting date. The employment agreements permit the officers to satisfy their withholding tax obligations by requiring us to withhold shares that would otherwise be distributed to them with a value equal to the withholding tax obligation of the executives and to remit cash in that amount to the Internal Revenue Service and other tax authorities on behalf of those executive officers. Assuming an offering price of $ per share (the midpoint of the price range reflected on the cover of this prospectus) and an assumed combined state and federal tax rate of 30.5%, we estimate that up to approximately $ million of the proceeds of this offering may be used to fund such withholding tax payments. |
| (b) | Assuming that our executive officers do not require us to withhold shares as noted above, represents the vesting of 1.2 million shares of our common stock with an estimated value of $ million to management as compensation upon completion of this offering. No corresponding compensation charge has been reflected in the accompanying pro forma condensed statements of operations. A charge will be reflected in the results of operations for the period in which the offering is completed. |
Pro Forma Net Income per Common Share
| (7) | Pro forma net income per common share was calculated assuming that the following shares of our common stock were outstanding for all periods presented: (i) 20.0 million shares that were issued to Scintilla and subsequently transferred to the David J. Chernicky Trust, which is the common owner of both Scintilla and us, plus (ii) shares assumed to be sold to fund the repayment of the amount outstanding under our new credit facility. For purposes of this calculation, the number of shares of common stock outstanding was assumed to be shares. |
Estimated Incremental General and Administrative Expense
| (8) | Upon completion of this offering, we expect to incur incremental general and administrative expenses as a result of hiring new employees and being a publicly traded company, including costs associated with annual and quarterly reports to stockholders, financial statement audits and tax return preparation, investor relations activities, registrar and transfer agent fees, incremental director and officer liability insurance costs and director compensation. The unaudited pro forma financial data do not reflect these additional anticipated incremental general and administrative expenses, since an estimate of these expenses is not objectively determinable. However, we have internally estimated general and administrative expenses of approximately $ million in the twelve months following consummation of this offering. Our general and administrative expenses are subject to change as our operations change over time. |
52
Table of Contents
Index to Financial Statements
MANAGEMENT’S DISCUSSION AND ANALYSIS OF
FINANCIAL CONDITION AND RESULTS OF OPERATIONS
The following discussion and analysis of the results of operations and financial condition of New Source Energy Corporation should be read in conjunction with the “Selected Historical Financial Data,” our financial statements, and the notes to those financial statements that are included elsewhere in this prospectus. Our discussion includes forward-looking statements based upon current expectations that involve risks and uncertainties, such as our plans, objectives, expectations and intentions. Actual results and the timing of events could differ materially from those anticipated in these forward-looking statements as a result of a number of factors, including those set forth under the “Risk Factors,” “Cautionary Notice Regarding Forward-Looking Statements” and “Business” sections in this prospectus. We use words such as “anticipate,” “estimate,” “plan,” “project,” “continuing,” “ongoing,” “expect,” “believe,” “intend,” “may,” “will,” “should,” “could,” and similar expressions to identify forward-looking statements.
Overview and Basis of Presentation
The accompanying financial statements have been prepared in accordance with GAAP.
Until the closing of our acquisition of the Acquired Assets, we were a newly formed corporation with only nominal assets and no active business operations. We purchased the Acquired Assets on August 12, 2011 with an August 1, 2011 effective date for economic purposes. Since Scintilla is under common control with us, we recorded the Scintilla Assets at their historical carrying values, and no goodwill or other intangible assets were recognized. We acquired the Other Contributed Assets, amounting to approximately 7% of the Acquired Assets (based on PV-10 reserve value as of December 31, 2010), from parties other than Scintilla not under common control with us, and accordingly, the Other Contributed Assets are not included in our historical and pro forma carve-out financial statements but will be included in our financial statements on a forward basis. Likewise, our reserve and production information provided in this prospectus reflects only the Scintilla Assets but will reflect the Other Contributed Assets on a forward basis.
The historical financial information presented here reflects the performance of only the Scintilla Assets. Because our financial statements have been prepared on a “carve-out” basis, they reflect the historical accounts attributable to the Scintilla Assets, including allocations of expenses of Scintilla.
The financial statements may not be indicative of our future performance and may not reflect what our results of operations, financial position and cash flows would have been if we had operated as an independent company during all of the periods presented. To the extent that an asset, liability, revenue or expense is directly associated with the Scintilla Assets or us, it is reflected in the accompanying financial statements.
As a result of outstanding stock-based compensation awards that vest upon consummation of this offering, we will report substantial non-cash compensation expense, which we estimate to be approximately $ million, in the quarter in which this offering is consummated. We expect to incur additional annual costs associated with the outstanding stock-based compensation awards that vest in the future as well as our compliance and disclosure obligations as a public company, which will require us to implement additional financial and management controls, reporting systems, and procedures and hire additional accounting, financial and legal staff.
Background and Plan of Operations
We were incorporated in Delaware on July 12, 2011, and on August 12, 2011, we completed our acquisition of the Acquired Assets. Our producing properties are solely in the Hunton formation in east-central Oklahoma. The following discussion of our business operations is with respect to the Scintilla Assets and our plans going forward.
53
Table of Contents
Index to Financial Statements
We have attempted to structure our organization around essential activities—asset acquisition and management as well as tight fiscal controls and planning. Therefore, we intend to initially rely on the strategic relationships we have with our contract operator for drilling and production operations, as well as its other experience and expertise to help us execute our business plan. We believe that our model will allow us to dedicate capital and other resources towards continuing to identify and develop our oil and natural gas interests.
Our future financial results will depend on (i) our ability to source and screen potential projects; (ii) our ability to develop commercial quantities of natural gas, oil and natural gas liquids; (iii) the market price for oil and natural gas; and (iv) our ability to fully implement our development program, which is in turn dependent on the availability of capital resources. There can be no assurance that we will be successful in any of these efforts, that the prices of hydrocarbons prevailing at the time of production will be at a level allowing for profitable production, or that we will be able to obtain additional funding to increase our current resources.
Implementing our strategy will involve the following:
| • | raising the necessary capital required to acquire and develop oil and natural gas properties and leaseholds; |
| • | pursuing additional acquisitions of leaseholds within our existing core areas of operation and in other fields we identify for future growth; |
| • | focusing on refining our business model as a low cost, non-operator; and |
| • | utilizing our strategic relationships to mitigate risk, benefit from our contract operator’s historical success in identifying and developing conventional resource reservoirs, and leveraging relationships, infrastructure and expertise to develop our asset base. |
54
Table of Contents
Index to Financial Statements
Results of Operations
The following table presents selected financial and operating information for us as a result of the acquisition of the Scintilla Assets. Comparative results of operations for the period indicated are discussed below:
Six months ended June 30, 2011 compared to the six months ended June 30, 2010
| Six Months Ended June 30, | ||||||||||||||||
| 2010 | 2011 | Change | Percent Change |
|||||||||||||
| Income Statement (In thousands): |
||||||||||||||||
| Oil sales |
$ | 2,814 | $ | 2,331 | $ | (483 | ) | (17 | )% | |||||||
| Natural gas liquids and natural gas sales |
18,086 | 22,020 | 3,934 | 22 | % | |||||||||||
|
|
|
|
|
|
|
|
|
|||||||||
| Total revenues |
20,900 | 24,351 | 3,451 | 17 | % | |||||||||||
|
|
|
|
|
|
|
|
|
|||||||||
| Lease operating expenses |
2,463 | 2,923 | 460 | 19 | % | |||||||||||
| Workover expenses |
1,263 | 1,787 | 524 | 41 | % | |||||||||||
| Production taxes |
1,468 | 1,235 | (233 | ) | (16 | )% | ||||||||||
|
|
|
|
|
|
|
|
|
|||||||||
| Total production expenses |
5,194 | 5,945 | 751 | 14 | % | |||||||||||
|
|
|
|
|
|
|
|
|
|||||||||
| General and administrative |
326 | 784 | 458 | 140 | % | |||||||||||
| Depreciation, depletion, and amortization |
5,615 | 5,253 | (362 | ) | (6 | )% | ||||||||||
| Accretion expense |
25 | 29 | 4 | 16 | % | |||||||||||
|
|
|
|
|
|
|
|
|
|||||||||
| Total operating expenses |
11,160 | 12,011 | 851 | 8 | % | |||||||||||
|
|
|
|
|
|
|
|
|
|||||||||
| Operating income |
9,740 | 12,340 | 2,600 | 27 | % | |||||||||||
| Other income (expense): |
||||||||||||||||
| Interest expense |
(1,314 | ) | (1,444 | ) | (130 | ) | 10 | % | ||||||||
| Realized and unrealized gains (losses) from derivatives |
2,438 | (2,758 | ) | (5,196 | ) | (213 | )% | |||||||||
|
|
|
|
|
|
|
|
|
|||||||||
| Net income |
$ | 10,864 | $ | 8,138 | $ | (2,726 | ) | (25 | )% | |||||||
|
|
|
|
|
|
|
|
|
|||||||||
| Sales Volumes: |
||||||||||||||||
| Crude oil (Bbls) |
37,627 | 24,331 | (13,296 | ) | (35 | )% | ||||||||||
| Natural gas liquids and natural gas (Boe) |
400,628 | 428,870 | 28,242 | 7 | % | |||||||||||
|
|
|
|
|
|
|
|
|
|||||||||
| Total crude oil equivalent (Boe)(1) |
438,255 | 453,201 | 14,946 | 3 | % | |||||||||||
|
|
|
|
|
|
|
|
|
|||||||||
| Average Sales Price (Excluding Derivatives): |
||||||||||||||||
| Crude oil (per Bbl) |
$ | 74.79 | $ | 95.80 | $ | 21.01 | 28 | % | ||||||||
| Natural gas liquids and natural gas (per Boe) |
$ | 45.14 | $ | 51.34 | $ | 6.20 | 14 | % | ||||||||
| Average Production Costs (per Boe)(2) |
$ | 11.85 | $ | 13.12 | $ | 1.27 | 11 | % | ||||||||
| (1) | Determined using the ratio of 6 Mcf of natural gas to 1 Bbl of crude oil |
| (2) | Includes lease operating expense, workover expense and production taxes |
55
Table of Contents
Index to Financial Statements
Oil & Natural Gas Revenues
Revenues for the six-month period ended June 30, 2011 were 17% higher than the comparable period in 2010, increasing to $24.4 million due to increases in both production volumes and prices.
The following were specifically related to the impact of production and price levels on revenues recorded during the periods:
| • | the average realized oil price was $95.80 per Bbl during the six months ended June 30, 2011, an increase of 28% from $74.79 per Bbl during the six months ended June 30, 2010; |
| • | total oil production was 24,331 Bbls during the six months ended June 30, 2011, a decrease of 35% from 37,627 Bbls during the six months ended June 30, 2010 primarily due to higher natural gas liquids volumes within the production stream; |
| • | the average realized natural gas liquids and natural gas price was $51.34 per Boe during the six months ended June 30, 2011, an increase of 14% from $45.14 per Boe during the six months ended June 30, 2010; and |
| • | total natural gas liquids and natural gas production was 428,870 Boe for the six months ended June 30, 2011, an increase of 7% from 400,628 Boe for the six months ended June 30, 2010 primarily due to higher natural gas liquids volumes within the production stream. |
Operating Expenses
Lease operating expenses. Lease operating expenses increased $0.4 million, or 19%, to $2.9 million in the first six months of 2011 from $2.5 million in the first six months of 2010 and production costs increased on an equivalent basis from $11.85 per Boe to $13.12 per Boe. The increase in production expenses was related to an increased number of wells drilled and completed in 2011 over 2010.
Workover expenses. Workover expenses increased $0.5 million, or 41%, to $1.8 million in the first six months of 2011 from $1.3 million in the first six months of 2010. The increase was primarily related to an increase in demand for workover services due to relatively higher oil and gas prices than in prior years.
Production taxes. Production taxes decreased $0.3 million, or 16%, to $1.2 million in the first six months of 2011 from $1.5 million in the first six months of 2010. The decrease was primarily related to tax refunds for incentive drilling that were received in 2011.
General and administrative. General and administrative expense increased 140% in the first six months of 2011 from the first six months of 2010. The increase in general and administrative expense was primarily related to an increase in auditing costs for the historical carve-out financial statements in 2011 from 2010.
Depreciation, depletion and amortization. Depreciation, depletion and amortization expense decreased $0.4 million, or 6%, to $5.2 million in the first six months of 2011 from $5.6 million in the six months ended June 30, 2010. This decrease was the result of higher reserves in the six months ended June 30, 2011 compared to the six months ended June 30, 2010.
Net Income
Net income decreased by 25% during the six months ended June 30, 2011 when compared to the six months ended June 30, 2010. This decrease was the result of the loss recorded from decreases in the fair value of the derivative instruments, which included net unrealized losses of $0.2 million on oil derivative instruments and $1.9 million on natural gas liquids instruments for the six months ended June 30, 2011, offset only slightly by net unrealized gains of $0.3 million on natural gas derivative instruments. Realized and unrealized gains of $2.4 million on oil and natural gas derivative instruments were recorded in the six months ended June 30, 2010.
56
Table of Contents
Index to Financial Statements
Year ended December 31, 2010 compared to the year ended December 31, 2009
| Years Ended December 31, | ||||||||||||||||
| 2009 | 2010 | Change | Percent Change |
|||||||||||||
| Income Statement (In thousands): |
||||||||||||||||
| Oil sales |
$ | 4,389 | $ | 5,336 | $ | 947 | 22 | % | ||||||||
| Natural gas liquids and natural gas sales |
26,668 | 36,388 | 9,720 | 36 | % | |||||||||||
|
|
|
|
|
|
|
|
|
|||||||||
| Total revenues |
31,057 | 41,724 | 10,667 | 34 | % | |||||||||||
|
|
|
|
|
|
|
|
|
|||||||||
| Lease operating expenses |
5,063 | 5,556 | 493 | 10 | % | |||||||||||
| Workover expenses |
3,091 | 2,546 | (545 | ) | (18 | )% | ||||||||||
| Production taxes |
1,214 | 2,967 | 1,753 | 144 | % | |||||||||||
|
|
|
|
|
|
|
|
|
|||||||||
| Total production expenses |
9,368 | 11,069 | 1,701 | 18 | % | |||||||||||
| General and administrative |
578 | 670 | 92 | 16 | % | |||||||||||
| Depreciation, depletion, and amortization |
10,529 | 11,371 | 842 | 8 | % | |||||||||||
| Accretion expense |
44 | 51 | 7 | 16 | % | |||||||||||
|
|
|
|
|
|
|
|
|
|||||||||
| Total operating expenses |
20,519 | 23,161 | 2,642 | 13 | % | |||||||||||
|
|
|
|
|
|
|
|
|
|||||||||
| Operating income |
10,538 | 18,563 | 8,025 | 76 | % | |||||||||||
| Other income (expense): |
||||||||||||||||
| Interest expense |
(1,943 | ) | (2,648 | ) | (705 | ) | 36 | % | ||||||||
| Realized and unrealized losses from derivatives |
— | (574 | ) | (574 | ) | (100 | )% | |||||||||
|
|
|
|
|
|
|
|
|
|||||||||
| Net income |
$ | 8,595 | $ | 15,341 | $ | 6,746 | 78 | % | ||||||||
|
|
|
|
|
|
|
|
|
|||||||||
| Sales Volumes: |
||||||||||||||||
| Crude oil (Bbls) |
74,908 | 70,422 | (4,486 | ) | (6 | )% | ||||||||||
| Natural gas and natural gas liquids (Boe) |
836,842 | 807,070 | (29,772 | ) | (4 | )% | ||||||||||
|
|
|
|
|
|
|
|
|
|||||||||
| Total crude oil equivalent (Boe)(1) |
911,750 | 877,492 | (34,258 | ) | (4 | )% | ||||||||||
|
|
|
|
|
|
|
|
|
|||||||||
| Average Sales Price (Excluding Derivatives): |
||||||||||||||||
| Crude oil (per Bbl) |
$ | 58.59 | $ | 75.77 | $ | 17.18 | 29 | % | ||||||||
| Natural gas liquids and natural gas (per Boe) |
$ | 31.87 | $ | 45.09 | $ | 13.22 | 41 | % | ||||||||
| Average Production Costs (per Boe)(2) |
$ | 10.27 | $ | 12.61 | $ | 2.34 | 23 | % | ||||||||
| (1) | Determined using the ratio of 6 Mcf of natural gas to 1 Bbl of crude oil |
| (2) | Includes lease operating expense, workover expense and production taxes |
57
Table of Contents
Index to Financial Statements
Oil & Natural Gas Revenues
Revenues from oil and natural gas operations were approximately $41.7 million for the year ended December 31, 2010, an increase of $10.7 million, or 34%, compared to the year ended December 31, 2009. Of the total revenues generated during 2010, 87% were generated through natural gas liquids and natural gas sales and 13% through oil sales. The increase in revenues during fiscal 2010 was largely the result of significantly higher average prices of oil and natural gas during 2010, which were typically 20-40% higher than those of 2009 for oil, natural gas liquids and natural gas prices, offset by a 4% decrease in oil and gas production.
The following were specifically related to the impact of production and price levels on revenues recorded during the periods:
| • | the average realized oil price was $75.77 per Bbl during the year ended December 31, 2010, an increase of 29% from $58.59 per Bbl during the year ended December 31, 2009; |
| • | total oil production was 70,422 Bbls during the year ended December 31, 2010, a decrease of 6% from 74,908 Bbls during the year ended December 31, 2009 primarily related to the pace of development of our properties; |
| • | the average realized natural gas liquids and natural gas price was $45.09 per Boe during the year ended December 31, 2010, an increase of 41% from $31.87 per Boe during the year ended December 31, 2009; and |
| • | total natural gas liquids and natural gas production was 807,070 Boe for the year ended December 31, 2010, a decrease of 4% from 836,842 Boe for the year ended December 31, 2009 primarily related to the pace of development of our properties. |
Operating Expenses
Lease operating expenses. Lease operating expenses increased $0.5 million, or 10%, to $5.6 million in 2010 from $5.1 million in 2009, and production costs increased on an equivalent basis from $10.27 per Boe to $12.61 per Boe. The increase in production expenses was related to an increased number of wells drilled and completed in 2010 compared to 2009.
Workover expenses. Workover expenses decreased $0.6 million, or 18%, to $2.5 million in 2010 from $3.1 million in 2009. The decrease was primarily related to a high service cost environment that resulted in fewer workovers in 2010 compared to 2009.
Production taxes. Production taxes increased $1.8 million, or 144%, to $3.0 million in 2010 from $1.2 million in 2009. The increase was primarily related to tax refunds for incentive drilling that were received in 2009.
General and administrative. General and administrative expense increased $0.1 million, or 16%, to $0.7 million in 2010 from $0.6 million in 2009. The increase in general and administrative expense was related to an increase in staffing costs in 2010 from 2009.
Depreciation, depletion and amortization. Depreciation, depletion and amortization expense increased $0.9 million, or 8%, to $11.4 million in 2010 from $10.5 million in 2009. This increase was the result of higher capital costs spent in 2010 that resulted in higher depreciation, depletion and amortization in 2010 over 2009.
Net Income
Net income increased by 78% in 2010 when compared to 2009. This increase was primarily the result of significantly higher oil and natural gas liquids prices in 2010 over 2009.
58
Table of Contents
Index to Financial Statements
Year ended December 31, 2009 compared to the year ended December 31, 2008
| Years Ended December 31, | ||||||||||||||||
| 2008 | 2009 | Change | Percent Change |
|||||||||||||
| Income Statement (In thousands): |
||||||||||||||||
| Oil sales |
$ | 5,753 | $ | 4,389 | $ | (1,364 | ) | (24 | )% | |||||||
| Natural gas liquids and natural gas sales |
53,150 | 26,668 | (26,482 | ) | (50 | )% | ||||||||||
|
|
|
|
|
|
|
|
|
|||||||||
| Total revenues |
58,903 | 31,057 | (27,846 | ) | (47 | )% | ||||||||||
|
|
|
|
|
|
|
|
|
|||||||||
| Lease operating expenses |
5,511 | 5,063 | (448 | ) | (8 | )% | ||||||||||
| Workover expenses |
5,107 | 3,091 | (2,016 | ) | (39 | )% | ||||||||||
| Production taxes |
3,093 | 1,214 | (1,879 | ) | (61 | )% | ||||||||||
|
|
|
|
|
|
|
|
|
|||||||||
| Total production expenses |
13,711 | 9,368 | (4,343 | ) | (32 | )% | ||||||||||
|
|
|
|
|
|
|
|
|
|||||||||
| General and administrative |
460 | 578 | 118 | 25 | % | |||||||||||
| Depreciation, depletion, and amortization |
11,611 | 10,529 | (1,082 | ) | (9 | )% | ||||||||||
| Accretion expense |
34 | 44 | 10 | 29 | % | |||||||||||
|
|
|
|
|
|
|
|
|
|||||||||
| Total operating expenses |
25,816 | 20,519 | (5,297 | ) | (21 | )% | ||||||||||
|
|
|
|
|
|
|
|
|
|||||||||
| Operating income |
33,087 | 10,538 | (22,549 | ) | (68 | )% | ||||||||||
| Other income (expense): |
||||||||||||||||
| Interest expense |
(2,536 | ) | (1,943 | ) | 593 | 23 | % | |||||||||
| Realized and unrealized losses from derivatives |
(352 | ) | — | 352 | 100 | % | ||||||||||
|
|
|
|
|
|
|
|
|
|||||||||
| Net income |
$ | 30,199 | $ | 8,595 | $ | (21,604 | ) | (72 | )% | |||||||
|
|
|
|
|
|
|
|
|
|||||||||
| Sales Volumes: |
||||||||||||||||
| Crude oil (Bbls) |
58,784 | 74,908 | 16,124 | 27 | % | |||||||||||
| Natural gas liquids and natural gas (Boe) |
885,940 | 836,842 | (49,098 | ) | (6 | )% | ||||||||||
|
|
|
|
|
|
|
|
|
|||||||||
| Total crude oil equivalent (Boe)(1) |
944,724 | 911,750 | (32,974 | ) | (3 | )% | ||||||||||
|
|
|
|
|
|
|
|
|
|||||||||
| Average Sales Price (Excluding Derivatives): |
||||||||||||||||
| Crude oil (per Bbl) |
$ | 97.87 | $ | 58.59 | $ | (39.28 | ) | (40 | )% | |||||||
| Natural gas liquids and natural gas price (per Boe) |
$ | 59.99 | $ | 31.87 | $ | (28.12 | ) | (47 | )% | |||||||
| Average Production Costs (per Boe)(2) |
$ | 14.51 | $ | 10.27 | $ | (4.24 | ) | (29 | )% | |||||||
| (1) | Determined using the ratio of 6 Mcf of natural gas to 1 Bbl of crude oil |
| (2) | Includes lease operating expense, workover expense and production taxes |
59
Table of Contents
Index to Financial Statements
Oil & Natural Gas Revenues
Revenue from oil and natural gas operations was approximately $31.1 million for the year ended December 31, 2009, a decrease of $27.8 million compared to the year ended December 31, 2008. Of the total revenues generated during 2009, approximately 86% were generated through natural gas sales and approximately 14% through oil sales. The decrease in revenues during fiscal 2009 was largely the result of the significantly decreased realized average price of oil and natural gas liquids and natural gas during 2009 when compared to 2008, which saw historic highs for crude oil and natural gas prices. However, the decrease in the price of oil was offset by a 27% increase in oil production during 2009.
The following were specifically related to the impact of production and price levels on revenues recorded during the periods:
| • | the average realized oil price was $58.59 per Bbl during the year ended December 31, 2009, a decrease of 40% from $97.87 per Bbl during the year ended December 31, 2008; |
| • | total oil production was 74,908 Bbls during the year ended December 31, 2009, an increase of 27% from 58,784 Bbls during the year ended December 31, 2008 as a result of the hydrocarbons developed during 2009 having a higher crude oil percentage; |
| • | the average realized natural gas liquids and natural gas price was $31.87 per Boe during the year ended December 31, 2009, a decrease of 47% from $59.99 per Boe during the year ended December 31, 2008; and |
| • | total natural gas liquids and natural gas production was 836,842 Boe for the year ended December 31, 2009, a decrease of 6% from 885,940 Boe for the year ended December 31, 2008 as a result of the hydrocarbons developed during 2009 having a higher crude oil percentage. |
Operating Expenses
Lease operating expenses. Lease operating expenses decreased $0.4 million, or 8%, to $5.1 million in 2009 from $5.5 million in 2008 and production costs decreased on an equivalent basis from $14.51 per Boe to $10.27 per Boe. The decrease in lease operating expense was primarily related to lower activity due to lower prices of oil and gas in 2009 compared to 2008.
Workover expenses. Workover expenses decreased $2.0 million, or 39%, to $3.1 million in 2009 from $5.1 million in 2008. The decrease was primarily related to lower activity caused by industry contraction due to significantly lower prices of oil and gas in 2009 compared to 2008.
Production taxes. Production taxes decreased $1.9 million, or 61%, to $1.2 million in 2009 from $3.1 million in 2008. The decrease was primarily related to reduced sales revenues and tax refunds for incentive drilling that were received in 2009.
General and administrative. General and administrative expense increased $0.1 million, or 25%, to $0.6 million in 2009 from $0.5 million in 2008. The increase in general and administrative expense was primarily related to increased staffing costs in 2009 over 2008.
Depreciation, depletion and amortization. Depreciation, depletion and amortization expense decreased $1.1 million, or 9%, to $10.5 million in 2009 from $11.6 million in 2008. This decrease was primarily the result of lower reserves utilized in 2008 to compute depreciation, depletion and amortization due to low end of year pricing required for the computation in 2008. These rules were changed effective in the fourth quarter of 2009 to allow for twelve-month average pricing for reserves.
Net Income
Net income decreased by approximately 72% in 2009 when compared to 2008. This decrease was primarily the result of significantly lower oil and gas prices realized during 2009 compared to 2008.
60
Table of Contents
Index to Financial Statements
Capital Commitments, Capital Resources and Liquidity
Our primary needs for cash are to fund (i) our share of development costs associated with well development within our leasehold properties, (ii) the further acquisition of additional leasehold assets, and (iii) the payment of contractual obligations and working capital obligations. We believe that funding for these cash needs will likely be provided by a combination of internally-generated cash flows from operations, additional capital raised through this offering and future equity financings, and supplemented by a combination of additional borrowings under our credit facility.
On August 12, 2011, in conjunction with closing on the Acquired Assets, we:
| • | closed a private placement of our common stock and raised approximately $1.6 million; and |
| • | borrowed $62.5 million under a new credit facility, of which $60.0 million was paid to acquire the Scintilla Assets and approximately $2.5 million was used to pay certain fees incurred to enter into the credit facility (including professional costs and financing fees). As of , 2011, approximately $ million remained available to us under our credit facility to use for general working capital purposes. |
We are subject to restrictive covenants under our credit facility. The ability to maintain this facility and borrow additional funds is dependent on a number of variables, including our proved reserves, and assumptions regarding the price at which oil and natural gas can be sold. For more information regarding the terms of our credit facility, see “—Credit Facility.”
We expect our capital expenditures budget for the remainder of 2011 to be approximately $11.1 million. We expect to be able to fund the remainder of our 2011 capital budget partially with our operating cash flows, in conjunction with the proceeds from the private placement of our common stock, this offering and potential additional draws from our credit facility. Our capital budget is partially discretionary, and if we experience sustained oil and natural gas prices significantly below the current levels or substantial increases in our drilling and completion costs, we may reduce our capital spending program to remain substantially within our operating cash flows or budgetary constraints.
Other than the development of existing leasehold acreage and other miscellaneous property interests, our 2011 capital budget is exclusive of acquisitions as the timing and size of acquisitions are difficult to forecast. However, we expect to actively seek to acquire oil and natural gas properties in conventional resource reservoirs that we believe are not subject to significant risk and that provide opportunities for the addition of new reserves and production in Oklahoma and, possibly, elsewhere.
While we believe that our available cash and cash flows will partially fund our 2011 capital expenditures, as adjusted from time to time, we cannot provide any assurances that we will be successful in securing additional funding for all of our planned expenditures. The actual amount and timing of our expenditures may differ materially from our estimates as a result of, among other things, actual drilling results, the timing of expenditures by third parties on projects that we do not operate, the availability of drilling rigs and other services and equipment, regulatory, technological and competitive developments and market conditions. In addition, we would consider increasing, decreasing, or reallocating our 2011 capital budget under certain circumstances.
As noted above, the primary sources of liquidity for our anticipated day-to-day operations are expected to be cash flows generated from operating activities. We believe that funds from our anticipated cash flows and any financing under a credit facility combined with proceeds from this offering should be sufficient to meet both our short-term working capital requirements and our 2011 capital expenditure plans. However, our growth plan will require that we raise a substantial amount of additional capital. There can be no assurance that we will be able to raise the additional capital that will be necessary to fund our anticipated growth strategy. Capital may not be available to us on reasonable terms, if at all, in the public or private markets.
61
Table of Contents
Index to Financial Statements
| Years Ended December 31, | Six Months Ended June 30, |
|||||||||||||||||||
| 2008 | 2009 | 2010 | 2010 | 2011 | ||||||||||||||||
| (In thousands) | ||||||||||||||||||||
| Financial Measures: |
||||||||||||||||||||
| Net cash provided by operating activities |
$ | 45,949 | $ | 17,042 | $ | 28,674 | $ | 15,363 | $ | 15,034 | ||||||||||
| Net cash used by investing activities |
$ | (25,094 | ) | $ | (22,834 | ) | $ | (26,074 | ) | $ | (8,392 | ) | $ | (16,734 | ) | |||||
| Net cash provided by (used in) financing activities |
$ | (20,855 | ) | $ | 5,792 | $ | (2,600 | ) | $ | (6,971 | ) | $ | 1,700 | |||||||
Net cash provided by operating activities for all periods primarily consisted of cash receipts from oil and natural gas sales, payments to vendors for operating costs and payments of production taxes. Net cash used by investing activities primarily consisted of payments made for drilling and equipping wells. Net cash provided by (used in) financing activities primarily consisted of equity investment by, or distributions to, the owner, credit facility borrowings and loan payments.
Off-Balance Sheet Arrangements
As of June 30, 2011, we had no material off-balance sheet arrangements. We have no plans to enter into any off-balance sheet arrangements in the foreseeable future.
Credit Facility
On August 12, 2011, we entered into a $150.0 million four-year credit facility with Bank of Montreal as administrative agent and KeyBank as syndication agent. Although the credit facility has a $150.0 million borrowing limit, we are only entitled to borrow an amount equal to our borrowing base, which will be redetermined on a semiannual basis and at other times as directed by us or the administrative agent. The initial borrowing base is $72.5 million. The borrowing base will be redetermined based on reserve reports prepared by engineers acceptable to the administrative agent, which we must deliver to the administrative agent on April 1 and October 1 of each year.
We intend to use the net proceeds of this offering to repay all outstanding indebtedness under our credit facility, leaving us the full borrowing base of $72.5 million available for future borrowings. As of , 2011, we had approximately $ million outstanding under our credit facility and, as a result, we had $ million of available borrowing capacity under the credit facility. Of the amount drawn under the credit facility, $60.0 million was used to purchase the Acquired Assets and $2.5 million was used to pay certain fees incurred to enter into the credit facility. The credit facility matures on August 12, 2015. Amounts borrowed and repaid under the credit facility may be reborrowed. The credit facility is available for general corporate purposes, including working capital for our operations.
The obligations of the lenders under our credit facility are several, not joint, meaning that if one lender fails to meet its lending obligations, the other lenders do not have to make us whole. As a result, the total amount that we may borrow might be substantially less than the borrowing base.
Our obligations under the credit facility are secured at all times by substantially all of our assets. We may prepay all advances at any time without penalty, subject to the reimbursement of lender breakage costs in the case of prepayment of LIBOR borrowings.
Indebtedness under the credit facility bears interest, at our option, at either:
| • | the higher of the administrative agent’s prime rate or the federal funds rate plus 0.50%, plus an applicable margin that ranges from 1.50% to 2.25%, depending on the percentage of the borrowing base being utilized; or |
| • | LIBOR plus an applicable margin that ranges from 2.50% to 3.25%, depending on the percentage of borrowing base being utilized. |
62
Table of Contents
Index to Financial Statements
In addition, the credit facility contains various covenants that limit, among other things, our ability to:
| • | grant liens on our assets; |
| • | incur additional indebtedness; |
| • | engage in a merger, consolidation or dissolution; |
| • | sell or otherwise dispose of our assets, businesses and operations; |
| • | materially alter the character of our business; |
| • | make acquisitions, investments and capital expenditures; and |
| • | enter into any transactions with affiliated parties except as specifically contemplated in the credit facility. |
The credit facility also contains covenants requiring us to maintain:
| • | a current ratio (the ratio of our consolidated current assets to our consolidated current liabilities) of not less than 1.0 to 1.0; |
| • | a leverage ratio (the ratio of our consolidated funded indebtedness under the credit facility and all other sources to our consolidated adjusted EBITDAX, as defined in the credit agreement) of not more than 3.5 to 1.0; and |
| • | an interest coverage ratio (the ratio of our consolidated EBITDAX to our consolidated interest expense, as defined in the credit agreement) of not less than 2.5 to 1.0 determined as of the last day of each quarter for the four-quarter period ending on the date of determination. |
As of the closing of the credit facility on August 12, 2011, we were in compliance with these ratios. The credit facility also prohibits us from paying dividends or making other distributions to stockholders. If an event of default exists under the credit facility, the lenders will be able to accelerate the maturity of the credit facility and exercise other rights and remedies. Each of the following could be an event of default under the credit facility:
| • | failure to pay any principal when due or any interest or fees within three business days of the due date; |
| • | failure to perform or otherwise comply with the covenants in the credit facility; |
| • | failure of any representation or warranty to be true and correct in any material respect; |
| • | failure to pay debt; |
| • | a change of control of us; and |
| • | other customary defaults, including specified bankruptcy or insolvency events, violations of the Employee Retirement Income Security Act of 1974, and material judgment defaults. |
Contractual Obligations
In addition to our contractual obligations to service our credit facility and to pay our proportionate shares of costs in existing and new wells in the Golden Lane field and the Luther field, we currently lease 6,595 square feet as our principal executive offices at the rate of $7,100 per month (which we believe reflects current market rates). This lease is for a one-year term with two one-year options on the same terms and conditions. We have also entered into employment agreements with four of our executive officers, Messrs. Kos, Chernicky, Finley and Thompson, providing for the payment of their salaries and certain initial grants of restricted stock described elsewhere in this prospectus. We generally may terminate the employment of these individuals at any time without liability to us under these agreements, except that if we terminate one of these officers without cause, all of such terminated officer’s remaining unvested shares of restricted stock will immediately vest. See “Executive Compensation and Other Information—Potential Payments upon Termination or Change in Control.”
63
Table of Contents
Index to Financial Statements
The following table summarizes our contractual obligations and commitments as of June 30, 2011:
| Payments due by period (in thousands) |
||||||||||||||||||||
| Contractual Obligations |
Total | Less than 1 year |
1-3 years |
3-5 years |
More than 5 years |
|||||||||||||||
| Long-Term Debt Obligations(1) |
$ | 60,000 | — | — | $ | 60,000 | — | |||||||||||||
| Operating Lease Obligations(2) |
— | — | — | — | — | |||||||||||||||
|
|
|
|
|
|
|
|
|
|
|
|||||||||||
| Total |
$ | 60,000 | |
— |
|
— | $ | 60,000 | — | |||||||||||
|
|
|
|
|
|
|
|
|
|
|
|||||||||||
| (1) | Represents long-term debt of Scintilla at June 30, 2011. This long-term debt was repaid as part of the transactions by which we acquired the Scintilla Assets on August 12, 2011, and replaced with our credit facility, which matures on August 12, 2015. As of , 2011, there was $ million outstanding under our credit facility, which will be repaid using the net proceeds of this offering. |
| (2) | We entered into a lease on July 15, 2011, for our principal executive offices at the rate of $7,100 per month for a primary term from August 1, 2011 to August 1, 2012. |
Quantitative and Qualitative Disclosure about Market Risk
As we expand, we will be exposed to a variety of market risks including commodity price risk, credit risk and interest rate risk. We will address these risks through a program of risk management which will likely include the use of derivative instruments including hedging contracts. Such contracts may involve incurring future gains or losses from changes in commodity prices or fluctuations in market interest rates.
Commodity Price Risk. We are exposed to market risk as the prices of oil and natural gas are subject to fluctuations resulting from changes in supply and demand. Factors that may impact the price of oil and natural gas include:
| • | developments generally impacting significant oil-producing countries and regions, such as Iraq, Iran, Syria, and Libya, the gulf coast and offshore South and Central America, Alaska and onshore U.S.; |
| • | the extent to which members of the Organization of Petroleum Exporting Countries and other oil exporting nations are able to continue to manage oil supply through export quotas; |
| • | the overall demand for oil and natural gas in the United States and abroad; |
| • | volatility in the U.S. and global economies; |
| • | weather conditions; and |
| • | new and changing legislation and regulatory philosophy in the U.S. |
Any improvements in oil and natural gas prices may have a favorable impact on our financial condition, results of operations and capital resources. If oil prices decline by $10.00 per Bbl, then our PV-10 as of December 31, 2010 would have been lower by approximately $33.3 million. If natural gas prices decline by $1.00 per Mcf, then our PV-10 as of December 31, 2010 would decrease by approximately $27.8 million.
Our primary commodity risk management objective is to reduce volatility in our cash flow. We enter into hedges for oil and natural gas using NYMEX futures or over-the-counter derivative financial instruments with only certain well-capitalized counterparties.
The use of financial instruments may expose us to the risk of financial loss in certain circumstances, including instances when (1) sales volumes are less than expected requiring market purchases to meet commitments, or (2) our counterparties fail to purchase the contracted quantities of natural gas or otherwise fail to perform according to the hedging arrangement. To the extent that we engage in hedging activities, we may be prevented from realizing the benefits of favorable price changes in the physical market. However, we are similarly insulated against decreases in such prices.
64
Table of Contents
Index to Financial Statements
Presently, all of our hedging arrangements are with one counterparty, which is a lender under our credit facility. If this counterparty fails to perform its obligations, we may suffer financial loss or be prevented from realizing the benefits of favorable price changes in the physical market.
The result of natural gas market prices exceeding our swap prices or collar ceilings requires us to make payment for the settlement of our hedge derivatives, if owed by us, generally up to three business days before we receive market price cash payments from our customers. This could have a material adverse effect on our cash flows for the period between hedge settlement and payment for revenues earned.
Counterparty and Customer Credit Risk. We will monitor our risk of loss due to non-performance by counterparties of their contractual obligations. We have exposure to financial institutions in the form of derivative transactions in connection with our hedging activity. A lender under our credit facility is the counterparty on our derivative instruments currently in place and has investment grade credit ratings. We expect that any future derivative transactions we enter into will be with this or other lenders under our credit facility that carry an investment grade credit rating.
We also have exposure to credit risk through our operating partners and their management of the sale of our oil and natural gas production, which they market to energy marketing companies and refineries. We anticipate that we will monitor our exposure to these counterparties primarily by reviewing credit ratings, financial statements, production, sales, marketing, engineering and reserve reports. See “Business—Principal Customers” for further detail about our significant customers.
Interest Rate Risk. We intend to use the net proceeds from this offering to repay all outstanding indebtedness under our credit facility. As of , 2011, we had $ million outstanding under our credit facility, which is subject to floating market rates of interest. Borrowings under our credit facility bear interest at a fluctuating rate that is tied to an adjusted base rate or LIBOR, at our option. Any increases in these interest rates can have an adverse impact on our results of operations and cash flow.
Critical Accounting Policies and Practices
Investors in our company should be aware of how certain events may impact our financial results based on the accounting policies in place. In our management’s opinion, the more significant reporting areas impacted by our management’s judgments and estimates are revenue recognition, the choice of accounting method for oil and natural gas activities, oil and natural gas reserve estimation, asset retirement obligations, impairment of long-lived assets and valuation of stock-based compensation. Our management’s judgments and estimates in these areas are based on information available from both internal and external sources, including engineers, geologists and historical experience in similar matters. Actual results could differ from the estimates as additional information becomes known.
The selection and application of accounting policies are an important process that changes as our business changes and as accounting rules are developed. Accounting rules generally do not involve a selection among alternatives, but involve an implementation and interpretation of existing rules and the use of judgment to the specific set of circumstances existing in our business. The three policies we consider to be the most significant are discussed below.
Oil and Natural Gas Properties. The accounting for our business is subject to special accounting rules that are unique to the oil and natural gas industry. There are two allowable methods of accounting for oil and natural gas business activities: the successful efforts method and the full-cost method. We utilize the full-cost method of accounting, under which all costs associated with property acquisition, exploration and development activities are capitalized. We also have the ability to capitalize internal costs that can be directly identified with our acquisition, exploration and development activities and do not include any costs related to production, general corporate overhead or similar activities.
65
Table of Contents
Index to Financial Statements
Under the successful efforts method, geological and geophysical costs and costs of carrying and retaining undeveloped properties are charged to expense as incurred. Costs of drilling exploratory wells that do not result in proved reserves are charged to expense. Depreciation, depletion, amortization and impairment of oil and natural gas properties are generally calculated on a well by well or lease or field basis. Additionally, gain or loss may generally be recognized on sales of oil and natural gas properties under the successful efforts method. As a result, our financial statements will differ from companies that apply the successful efforts method, since we will generally reflect a higher level of capitalized costs, as well as a higher oil and natural gas depreciation, depletion and amortization rate, and we will not have exploration expenses that successful efforts companies frequently have.
Under the full-cost method, capitalized costs are amortized on a composite unit-of-production method based on proved oil and natural gas reserves. If we maintain the same level of production year over year, the depreciation, depletion and amortization expense may be significantly different if our estimate of remaining reserves or future development costs changes significantly. Proceeds from the sale of properties are accounted for as reductions of capitalized costs unless such sales involve a significant change in proved reserves and significantly alter the relationship between costs and proved reserves, in which case a gain or loss is recognized. The costs of unproved properties are excluded from amortization until the properties are evaluated. We review all of our unevaluated properties quarterly to determine whether or not and to what extent proved reserves have been assigned to the properties, and otherwise if impairment has occurred.
We review the carrying value of our oil and natural gas properties under the full-cost accounting rules of the SEC on a quarterly basis. This quarterly review is referred to as a ceiling test. Under the ceiling test, capitalized costs, less accumulated amortization and related deferred income taxes, may not exceed an amount equal to the sum of the present value of estimated future net revenues (adjusted for cash flow hedges), less estimated future expenditures to be incurred in developing and producing the proved reserves and less any related income tax effects. Commencing with the quarter ended on December 31, 2009, in calculating estimated future net revenues, current prices have been calculated as the unweighted arithmetic average of oil and natural gas prices on the first day of each month within each applicable twelve-month period. Costs used were those as of the end of the appropriate quarterly period. For quarters prior to the fourth quarter of 2009, current prices and costs used were those as of the end of the appropriate quarterly period.
Two primary factors impacting this test are reserve levels and oil and natural gas prices and their associated impact on the present value of estimated future net revenues. Revisions to estimates of oil and natural gas reserves and/or an increase or decrease in prices can have a material impact on the present value of estimated future net revenues. Any excess of the net book value, less deferred income taxes, is generally written off as an expense.
Oil, Natural Gas Liquids and Natural Gas Reserve Quantities. Proved reserves are defined by the SEC as those volumes of crude oil, condensate, natural gas liquids and natural gas that geological and engineering data demonstrate with reasonable certainty are recoverable from known reservoirs under existing economic and operating conditions. Proved developed reserves are volumes expected to be recovered through existing wells with existing equipment and operating methods. Although our external engineers are knowledgeable of and follow the guidelines for reserves as established by the SEC, the estimation of reserves requires the engineers to make a significant number of assumptions based on professional judgment. Estimated reserves are often subject to future revision, certain of which could be substantial, based on the availability of additional information, including; reservoir performance, new geological and geophysical data, additional drilling, technological advancements, price changes and other economic factors. Changes in oil and natural gas prices can lead to a decision to start-up or shut-in production, which can lead to revisions to reserve quantities. Reserve revisions inherently lead to adjustments of depreciation rates used by us. We cannot predict the types of reserve revisions that will be required in future periods.
66
Table of Contents
Index to Financial Statements
Derivative Instruments. We use commodity price and financial risk management instruments to mitigate our exposure to fluctuations in oil and natural gas prices. Recognized gains and losses on derivative contracts are reported as a component of the related transaction. Results of oil and natural gas derivative contract settlements and the changes in the fair value of derivative instruments that occur prior to maturity are reflected in other income in the statement of operations. Accounting guidance for derivatives and hedging establishes accounting and reporting standards requiring that derivative instruments (including certain derivative instruments embedded in other contracts) be recorded at fair value and included in the balance sheet as assets or liabilities. The accounting for changes in the fair value of a derivative instrument depends on the intended use of the derivative and the resulting designation, which is established at the inception of a derivative. For derivative instruments designated as oil and natural gas cash flow hedges, changes in fair value, to the extent the hedge is effective, are to be recognized in other comprehensive income until the hedged item is recognized in earnings as oil and natural gas sales. Any change in the fair value resulting from ineffectiveness is recognized immediately as gains or losses in the statement of operations. All derivative instruments are recognized as either assets or liabilities in the balance sheet at fair value. None of such instruments have been designated as cash flow hedges. Accordingly, changes in the fair value of all derivative instruments have been recorded in the statements of operations.
One of the primary factors that can have an impact on our results of operations is the method used to value our derivatives. We have established the fair value of our derivative instruments utilizing established index prices, volatility curves and discount factors. These estimates are compared to our counterparty values for reasonableness. Derivative transactions are also subject to the risk that counterparties will be unable to meet their obligations. Such non-performance risk is considered in the valuation of our derivative instruments. The values we report in our financial statements are as of a point in time and subsequently change as these estimates are revised to reflect actual results, changes in market conditions and other factors.
Another factor that can impact our results of operations each period is our ability to estimate the level of correlation between future changes in the fair value of the hedge instruments and the transactions being hedged, both at inception and on an ongoing basis. This correlation is complicated since energy commodity prices, the primary risk we hedge, have quality and location differences that can be difficult to hedge effectively. The factors underlying our estimates of fair value and our assessment of correlation of our hedging derivatives are impacted by actual results and changes in conditions that affect these factors, many of which are beyond our control.
Due to the volatility of oil and natural gas prices, our financial condition and results of operations can be significantly impacted by changes in the market value of our derivative instruments. As of December 31, 2010 and 2009, the fair value of our derivatives was a net liability of $1.5 million and zero, respectively.
67
Table of Contents
Index to Financial Statements
Overview
We are an independent energy company engaged in the development and production of onshore oil and liquids-rich natural gas projects in the United States. Our primary business strategy is to utilize specialized processes and low cost access to existing infrastructure to consistently and economically develop and produce hydrocarbons from known reservoirs previously deemed not prospective by others. See “Business—Specialized Processes” and “—Our Principal Business Relationships-Low Cost Access.” Our current properties consist of non-operated working interests in the Hunton formation, a conventional resource reservoir in east-central Oklahoma. This formation has a 90-year history of exploration and development and thousands of wellbore penetrations that have led to more accurate geologic mapping. We believe our position as non-operator and our strategic relationship with our contract operator allow us to significantly reduce our fixed operating expenses by maintaining a limited in-house employee base aside from our management team. We are committed to pursuing conventional resource plays in proximity to our existing asset base that are similar in profile and that carry what we believe is minimal exploration risk. As of December 31, 2010, the estimated proved reserves on our properties were approximately 19.0 MMBoe, of which approximately 47% were classified as proved developed reserves and approximately 60% of which were comprised of oil or natural gas liquids. Average net daily production from our properties during the six months ended June 30, 2011 was 2,504 Boe/d. Based on net production from our properties for the twelve-month period ending December 31, 2010, the total proved reserves of our properties had a reserve to production ratio of 21.6 years.
We were formed on July 12, 2011, to acquire and develop oil and natural gas properties. On August 12, 2011, we acquired the Acquired Assets in exchange for 21.2 million shares of our common stock and $60.0 million in cash. At the time of our acquisition of the Acquired Assets, we became a party to agreements by which New Dominion will continue as the contract operator of these properties. Both Scintilla and New Dominion are owned and controlled by our principal stockholder, chairman and senior geologist, David J. Chernicky. Scintilla has served as Mr. Chernicky’s holding company for his working interests, while New Dominion has acted as the operator of those assets and related infrastructure. New Dominion has operated the Acquired Assets for 12 years, completing and economically producing from more than 98% of all wells it has drilled in the Hunton formation using the same specialized processes that will be utilized in the development of our properties. As a result of our strategic relationship with Scintilla and New Dominion, we will benefit from the operational efficiencies in these specialized processes to maintain our low average finding, developing and operating costs.
Under our agreements with Scintilla and New Dominion, we have a right of first refusal to acquire all future oil and natural gas projects they pursue for 25 years, until August 12, 2036. As of June 30, 2011, excluding the Acquired Assets, Scintilla and New Dominion collectively held 121,380 gross (70,422 net) acres of leasehold in other formations above and below the Hunton formation that we believe have reservoir profiles similar to our properties. Pursuant to our right of first refusal agreement, we have the right to acquire oil and natural gas projects from New Dominion and Scintilla at and after the point in time such properties are determined to have proved reserves of oil and natural gas. We believe our strategic partnership with New Dominion and Scintilla and the common ownership of Mr. Chernicky in New Dominion, Scintilla and our company enhance our ability to grow our production and expand our proved reserve base over time. In addition, this relationship provides us with significant control over the rate of development of our long-lived, low cost asset base as compared to other traditional non-operators. It also provides us access to personnel with extensive technical expertise and industry relationships and perpetual access to existing infrastructure at what we believe are favorable rates. See “Business—Material Definitive Agreements” and “Certain Relationships and Related Party Transactions.”
Our properties are located in east-central Oklahoma and consist of mature, legacy oil and natural gas reservoirs. We believe that, through application of specialized processes, our properties are low risk due to predictable production profiles, low decline rates, long reserve lives and modest capital requirements. Our properties consist of non-operated working interests in producing and undeveloped leasehold acreage and in identified producing wells with an average working interest of 60% in our properties within the Luther field and
68
Table of Contents
Index to Financial Statements
a working interest ranging from 20% to 88% (39% weighted average) in our properties within the Golden Lane field. As of August 12, 2011, we held 32,780 gross (19,604 net) acres in the Luther field and 88,600 gross (34,669 net) acres in the Golden Lane field. Ralph E. Davis Associates, Inc., our independent reserve engineers, estimated the net proved reserves on our properties to be approximately 19.0 MMBoe as of December 31, 2010, 60% of which were classified as oil and natural gas liquids and 40% of which were classified as natural gas. The average net daily production rate from our properties during the six months ended June 30, 2011 was 2,504 Boe/d.
| Estimated Proved Reserves at December 31, 2010 (1) |
Production for the Six Months Ended June 30, 2011 |
Projected 2011 Capital Expenditures (MM) |
Proved Undeveloped Drilling Locations as of December 31, 2010 |
|||||||||||||||||||||||||||||||||||||
| Field |
Total Proved (MBoe) |
Percent of Total |
Percent Proved Developed |
Percent Oil and Liquids |
PV-10 (in MM)(2) |
Average Net Daily Production (Boe/d) |
Percent of Total |
|||||||||||||||||||||||||||||||||
| Gross | Net | |||||||||||||||||||||||||||||||||||||||
| Golden Lane |
11,733 | 61.9 | % | 66.8 | % | 68.2 | % | $ | 130.8 | 2,306 | 92.1 | % | $ | 21.8 | 54 | 18.9 | ||||||||||||||||||||||||
| Luther |
7,220 | 38.1 | % | 13.9 | % | 46.3 | % | $ | 69.9 | 198 | 7.9 | % | $ | 4.5 | 40 | |
20.0 |
| ||||||||||||||||||||||
|
|
|
|
|
|
|
|
|
|
|
|
|
|
|
|
|
|||||||||||||||||||||||||
| Total |
18,953 | 100.0 | % | 46.6 | % | 59.8 | % | $ | 200.7 | 2,504 | 100.0 | % | $ | 26.3 | 94 | 38.9 | ||||||||||||||||||||||||
| (1) | Proved reserves were calculated using prices equal to the twelve month unweighted arithmetic average of the first-day-of-the-month price for each of the preceding twelve months, which were $79.53 per Bbl of crude oil and $4.39 per Mcf of natural gas. Adjustments were made for location and the grade of the underlying resource, which resulted in an average decrease of $4.00 per Bbl of crude oil and an average decrease of $0.24 per Mcf of natural gas. |
| (2) | PV-10 is a non-GAAP financial measure and represents the present value of estimated future cash inflows from proved oil and natural gas reserves, less future development and production costs, discounted at 10% per annum to reflect timing of future cash flows and using the twelve-month unweighted arithmetic average of the first-day-of-the-month price for each of the preceding twelve months. PV-10 typically differs from the Standardized Measure because it does not include the effects of income tax. However, the Scintilla Assets’ PV-10 and Standardized Measure are equivalent because as of all dates presented the Scintilla Assets were held by a limited liability company not subject to entity-level taxation. Neither PV-10 nor Standardized Measure represents an estimate of fair market value of our natural gas and crude oil properties. PV-10 is used by the industry and by our management as an arbitrary reserve asset value measure to compare against past reserve bases and the reserve bases of other business entities that are not dependent on the taxpaying status of the entity. |
The following table provides an illustration of our historical Standardized Measure, adjusted for the effects of estimated income taxes:
| As of December 31, | ||||||||||||
| 2008 | 2009 | 2010 | ||||||||||
| (In thousands) | ||||||||||||
| Historical Standardized Measure |
$ | 108,794 | $ | 147,038 | $ | 200,735 | ||||||
| Estimated income taxes(a) |
42,321 | 57,198 | 78,086 | |||||||||
|
|
|
|
|
|
|
|||||||
| Standardized Measure, adjusted for the effects of estimated income taxes |
$ | 66,473 | $ | 89,840 | $ | 122,649 | ||||||
|
|
|
|
|
|
|
|||||||
| (a) | Scintilla, which owned the Scintilla Assets before they were contributed to us, was a partnership for federal income tax purposes and, therefore, was not subject to entity-level taxation. Historically, federal or state income taxes have been passed through to the member owners of Scintilla. However, as a corporation, we are subject to U.S. federal and state income taxes. The estimated taxes shown above illustrate the effect of income taxes on net revenues as of December 31, 2008, 2009 and 2010, assuming we had been subject to corporate-level income tax and further assuming an estimated statutory combined 38.9% federal and state income tax rate. |
69
Table of Contents
Index to Financial Statements
We use the term “conventional resource play” to refer to high water saturation (35 – 99%) hydrocarbon reservoirs that typically have been deemed not prospective by others. Conventional resource plays are usually located around and below conventional reservoirs, although they can exist independently. These reservoirs tend to be continuous hydrocarbon zones existing over a contiguous and potentially large geographical area. Conventional resource plays exhibit low exploration risk with consistent results and predictable EUR. With the implementation of specialized processes, we believe we have the ability to economically develop these large-scale reservoirs.
The Hunton formation is our primary conventional resource play in east-central Oklahoma. We intend to continue to develop our Golden Lane and Luther fields in this formation where we maintain interests in approximately 249 gross (102.9 net) producing wells. Our acreage position had 94 gross (38.9 net) proved undeveloped (PUD) locations as of December 31, 2010. Our contract operator is currently using two rigs to drill on our properties, which may be increased up to eight over the next twelve months. Our contract operator has completed an average of 25 gross wells per year on our acquired properties over the past six years.
Our 25-year right of first refusal agreement includes, among other potential opportunities, existing rights to produce approximately 70,422 net acres of prospective conventional resource reservoir formations located above and below the Hunton formation, such as the Cleveland, Red Fork, Caney, Mississippian and Arbuckle. These reservoirs have current production and are in the process of being proved up by our contract operator, pending third-party evaluation. We also have identified similar conventional resource play leaseholds held by third parties in and around our primary acreage in east-central Oklahoma that we will attempt to acquire to increase our proved reserves and drilling inventory.
Our method of hydrocarbon recovery relies upon exploiting the reservoir through development, rather than exploration. Our technical team, in conjunction with our contract operator, has geologic and engineering expertise in horizontal well design, submersible pump placement, fluid and hydrocarbon separation and saltwater disposal. We believe this experience helps us obtain production efficiencies utilizing methodologies that provide a predictable ultimate recovery of hydrocarbons. In developing new reserves in conventional resource plays, we employ, in conjunction with our contract operator, the following six essential components:
| • | proper geologic assessment of the reservoir, which is facilitated by data from numerous existing well penetrations; |
| • | a well-trained and knowledgeable technical team to maintain efficient production; |
| • | strategic placement of wells to maximize the benefit of wells working in concert to create the appropriate draw down in reservoir pressure; |
| • | an economic high volume saltwater transportation and disposal system; |
| • | abundant and economic high current three-phase electrical power; and |
| • | a high volume liquids-rich gas gathering and processing system. |
Business Strategy
Our objective is to increase stockholder value by increasing reserves, production and cash flows at an attractive return on capital. We intend to accomplish these objectives by executing on the following key strategies:
| • | Focus on Conventional Oil and Liquids-Rich Resource Plays. We are focused on developing and converting conventional oil and liquids-rich resource plays into cost-efficient development projects. This strategy enables us to leverage our expertise in economically producing reserves that previously have been deemed not prospective by others. |
70
Table of Contents
Index to Financial Statements
| • | Accelerate Development of Existing Low Cost Proved Inventory. In the near term, we intend to work with our contract operator to accelerate the drilling of our low risk, long lived PUD inventory to maximize the value of our resource potential using existing infrastructure. |
| • | Maintain Our Low Cost Operating Structure. We are focused on continuous improvement of our operating measures. We believe that the size and concentration of our acreage within our project areas provide us with the opportunity to continue to capture economies of scale, including the ability to use existing infrastructure that is contracted at attractive rates. In addition, we, along with our contract operator, attempt to reduce the drilling, completion and infrastructure costs associated with the development of our properties by drilling multiple wells from a single pad site. |
| • | Leverage Strategic Relationships with New Dominion and Scintilla. We intend to maximize the benefits of our relationships with New Dominion and Scintilla to help control our costs, access existing infrastructure at what we believe are favorable rates, reduce exploration risk, and maintain flexibility to determine where and when to deploy our capital. |
| • | Pursue Accretive Acquisitions. We intend to pursue bolt-on acquisitions of properties complementary to our core acreage, including properties subject to our right of first refusal agreement, when we determine such properties carry minimal or no exploration risk. We will pursue additional acquisition opportunities when we believe we possess a strategic or technical advantage due to our existing liquidity, operational experience and access to infrastructure. |
Competitive Strengths
We will rely upon the following combination of strengths to implement our strategies:
| • | Management Team with Proven Ability to Develop Conventional Resource Plays. Our senior management team averages over 25 years of industry experience, including our senior geologist, David J. Chernicky, who has over 28 years of experience in producing oil and natural gas from conventional resource plays in the area of our core assets. Our management team has developed specialized processes that allow us to develop assets that historically have been deemed not prospective by others. |
| • | Strategic Relationship with Related Parties. Our relationship with Scintilla and New Dominion provides us with access to saltwater disposal and other key infrastructure, drilling rigs, completion services, oilfield equipment and oilfield services at what we believe are favorable rates. In addition, the right of first refusal we hold from Scintilla and New Dominion provides us with an exclusive option to acquire additional assets meeting our reservoir criteria after they have been proved up through the efforts of Scintilla and our contract operator. Our contract operator has a strong track record, completing and economically producing from more than 98% of all wells it has drilled in the Hunton formation since beginning to develop the play in 1999. |
| • | Large, Multi-Year Drilling Inventory with Predictable Results. As of December 31, 2010, there were 94 gross (38.9 net) PUD locations targeting the Hunton formation on our properties. With a large portion of our leasehold held by production and the strategic relationship with our contract operator, we have the ability to influence the timing of our drilling projects. Our reserves have significant production history and predictable decline rates. |
| • | Long-Lived Reserves with High and Increasing Liquids Yield. The average productive life of our wells producing from the Hunton formation (on 640-acre spacing) is 18.5 years. The initial average Btu content of natural gas produced from this formation is approximately 1100 Btu per Mcf, increases at an average of 5% per year and, based on past experience, can ultimately reach approximately 2100 Btu per Mcf. |
| • | Competitive Cost Structure. Our position as non-operator and ability to leverage our strategic relationships allow us to mitigate significant fixed operating expenses by maintaining a limited in-house employee base apart from our management team. Our focus on conventional resource plays |
71
Table of Contents
Index to Financial Statements
| utilizing our specialized processes has resulted in average all-in finding and development costs, including revisions, on our properties of $5.77 per Boe over the three-year period ending December 31, 2010. Production costs on our properties averaged $13.12 per Boe over the six-month period ending June 30, 2011. |
| • | Forced Pooling. Oklahoma law allows a working interest owner to commence a “forced pooling” action pursuant to the rules of the Oklahoma Corporation Commission. Such an action, which is very common in Oklahoma, allows the working interest owner to compel the pooling of acreage in the subject spacing unit for the purposes of causing a well or wells to be drilled. Assuming a successful application for a forced pooling order, these provisions will allow us to proceed to develop our properties without the risk of another interest owner preventing such development. |
| • | Accessible Centralized Core Geographic Area. All of our existing acreage, as well as many potential opportunities we have identified for future growth, are within a 150-mile radius of our corporate headquarters in Oklahoma City, Oklahoma. This allows us to utilize and extend existing infrastructure at a reduced cost. |
| • | Financial Flexibility. Existing internal cash flow generation allows us to continue the current rate of development of our properties. Pro forma for this offering, we will have minimal indebtedness and $ million of total liquidity, including availability under our credit facility and cash on hand, that will allow us to accelerate growth, make strategic acquisitions and develop additional reservoirs. |
Our Operations
Our operations are focused in east-central Oklahoma including the Golden Lane field located in Pottawatomie, Seminole and Okfuskee Counties and the Luther field located in Lincoln and Oklahoma Counties. Our developmental focus is on the Hunton formation, a liquids-rich subterranean limestone reservoir. The Hunton formation is a conventional resource reservoir extending thousands of square miles across the State of Oklahoma. Though our current production is only from the Hunton formation, we believe our contract operator’s specialized processes could have potential application in several other reservoirs above and below the Hunton formation including the Cleveland, Red Fork, Caney, Mississippian and Arbuckle.
Conventional Resource Reservoirs—Hunton Formation
The Hunton formation was deposited in a shelf carbonate environment and exhibits many of the characteristics associated with this type of environment, including but not limited to, coral reefs, major dolomitization, and hundreds of major and minor disconformities caused by sea level changes and Karst topography. The Hunton formation is of Silurian-Devonian geological age and consists primarily of the Chimney Hill and Henryhouse subgroup. It varies in thickness from 0 to over 200 feet and can be mapped accurately from the thousands of subsurface penetrations over the last 90 years. It typically exhibits porosity that varies both vertically and laterally. Vertical permeability is generally poor owing to the many disconformities, but horizontal permeability and porosity is much greater and permeability in both directions is greatly enhanced due to many sets of naturally occurring fracture systems.
As of August 12, 2011, our properties consisted of approximately 121,380 gross (54,273 net) acres leased or held by production with 249 gross (102.9 net) wells in production. Additionally, as of December 31, 2010, there were 94 gross (38.9 net) PUD locations that target the Hunton formation. Historical performance of existing wells producing from the Hunton formation have an average EUR per well of approximately 378 MBoe. The average cost per horizontal well drilled by our contract operator in the Hunton formation for the twelve months ended December 31, 2010 was $2.6 million (based upon 640-acre spacing), including acreage, drilling, completion, gathering, and infrastructure connection expenses.
Within our area of operations, we are focused on two fields: the Golden Lane field and the Luther field.
72
Table of Contents
Index to Financial Statements
Golden Lane Field
Our contract operator began development of the Golden Lane field in 1999 and has drilled and completed 180 economic wells since the initial development. We maintain leases on a gross area of 88,600 (34,669 net) acres in the Golden Lane field targeting the Hunton formation.
Average net daily production from our properties in the Golden Lane field was 2,306 Boe/d in the six months ended June 30, 2011, all of which was produced from the Hunton formation. We hold a working interest ranging from 20% to 88% (39% weighted average) and 236 gross (95.2 net) wells in the Golden Lane field. Additionally, as of December 31, 2010, there were 54 gross (18.9 net) identified PUD drilling locations on our Golden Lane acreage based on 640-acre spacing.
During the twelve months ended December 31, 2010, the average cost to drill and complete these wells for our contract operator was $2.5 million. The average EUR per well in the Golden Lane field is 339 MBoe. Our contract operator is currently running two rigs in our Golden Lane field and expects to drill eight gross (2.8 net) wells in this field in the last six months of 2011.
Luther Field
Our contract operator began development of the Luther field in 2008 and has drilled and completed six economic wells since the initial development. We maintain leases on a gross area of 32,780 acres (19,604 net) in the Luther field targeting the Hunton formation.
Average net daily production from our properties in the Luther field was 198 Boe/d in the six months ended June 30, 2011, all of which produced from the Hunton formation. We hold an average working interest of 59% in 13 gross (7.7 net) producing wells in the Luther field. Additionally, as of December 31, 2010, there were 40 gross (20.0 net) identified PUD drilling locations on our Luther acreage based on 640-acre spacing.
During the twelve months ended December 31, 2010, the average cost to drill and complete these wells for our contract operator was $2.8 million. The average EUR per well in the Luther field is 418 MBoe. Our contract operator is not currently running a rig in our Luther field, but expects to add one rig and drill two gross (1.2 net) wells in the last six months of 2011.
Our Principal Business Relationships
We view our relationships with Scintilla and New Dominion, each of which is wholly owned and controlled by our chairman David J. Chernicky, as significant competitive strengths. As a result of Mr. Chernicky’s significant ownership of our common stock, we believe New Dominion and Scintilla will be motivated to support the successful execution of our business strategy and will provide us with opportunities to pursue acquisitions that fit our criteria. These relationships will provide us access to personnel with extensive technical expertise and historical success with our contract operator’s specialized processes.
Low Cost Access
Through our agreements with Scintilla and New Dominion, we have access to saltwater disposal and other low cost access to key infrastructure, drilling rigs, completion services, oilfield equipment and oilfield services. Our contract operator has invested significant capital in this infrastructure and our relationship with our contract operator allows us to defer paying upfront costs for infrastructure until a well is drilled, and avoid competing for these services with other operators necessary to produce our reserves.
Under our agreements with our contract operator, we pay one-time upfront fees for access and connection to its existing saltwater disposal infrastructure as part of the costs of a new well rather than ongoing saltwater disposal fees. These up-front fees are currently $300,000 for wells in the Golden Lane field and $400,000 for
73
Table of Contents
Index to Financial Statements
wells in the Luther field, corresponding to approximately $0.11 and $0.14 per Bbl, respectively, based on average EURs for our wells in these fields. We also are required by these agreements to reimburse our contract operator for our share of its expenses in operating its saltwater disposal infrastructure, which on average have been $0.11 and $0.09 per Bbl for the Golden Lane field wells and Luther field wells, respectively, over the 18 months ended June 30, 2011. On a combined basis, this results in saltwater disposal fees of approximately $0.22 and $0.24 per Bbl for wells in the Golden Lane field and wells in the Luther field, respectively, which we believe are favorable to us compared to prevailing market rates. Other producers typically pay between $2.00 and $3.00 per Bbl to transport their saltwater to disposal wells where they must pay a commercial operator a disposal fee of between $0.50 and $0.65 per barrel, resulting in an all-in disposal cost that can range, on average, from $2.50 to $3.65 per Bbl.
Strategic Value
Our contract operator’s investment in infrastructure is of strategic value to us as it presents a barrier to other producers in our target areas. All of our current inventory and identified near-term growth opportunities are supported by infrastructure owned and operated by our contract operator, thus allowing us to solely focus on the development of our reserves.
Specialized Processes
We, along with our contract operator, use proven methods, mechanical assistance and other specialized processes to produce still-remaining reserves from conventional oil and liquids-rich resource plays previously deemed not prospective by others. Our success comes from understanding the reservoir characteristics and, in conjunction with our contract operator, using the latest available drilling, completion, and production technology to create natural conductive flow paths that enable access to the hydrocarbons within. This advanced recovery technique makes it highly economic to produce from these reservoirs. Along with horizontal and directional drilling, high-volume, electric submersible pumps are used in our wells to reduce the hydrostatic pressure in the reservoir and pull water, gas and oil from source rock formations in a way that enables those formations to produce oil and liquids-rich natural gas. Specially designed separators installed on production pad sites separate out the water, natural gas and oil. The water is sent to permitted transportation and disposal facilities. The natural gas flows into a gathering system and then to processing plants, while the oil is transported to the nearest pipeline.
With the implementation of specialized processes, we have the ability to potentially develop a new class of large-scale reservoir systems. Other reservoirs with high water saturation have been identified in the regions in which we currently operate, and we believe they exist in many other areas in which hydrocarbons have customarily been produced. Large reservoirs previously thought to be too high in water saturation to produce potentially can be opened up to full-scale development involving the drilling and completion of hundreds of wells in a reservoir that can cover thousands of square miles.
Unlike typical oil and natural gas reservoirs, which show declining oil and gas production rates with time, this type of reservoir increases its oil and natural gas production rate over an initial period, and then, as the reservoir is depressurized, the wells assume a more typical decline curve.
Our conventional resource plays
The type of conventional resource play that we focus on is a high water saturation hydrocarbon reservoir that demonstrates characteristics of both a conventional reservoir and a resource play. The reservoir is typically made of carbonate or deltaic sand deposits. In these reservoirs, the porosity and permeability are not well connected vertically in the formation, which restricts the movement of fluid vertically through the reservoir. However, these reservoirs have good horizontal permeability and porosity that usually extends over a large area. In addition, the permeability in both directions often is enhanced by numerous naturally occurring fracture systems.
These types of reservoirs are composed of hydrocarbon accumulations in strata that have “shows” of oil, but the reservoirs typically have been deemed not prospective by others due primarily to having water saturations of 35 to 99 percent. Although the reservoir is saturated with water, there often are significant hydrocarbons present
74
Table of Contents
Index to Financial Statements
and suspended within the reservoir by the hydrostatic pressure. Conventional resource reservoirs are located around and below the conventional reservoir, though they can exist independently. This zone is a continuous hydrocarbon system over a contiguous geographical area that can be very large. Conventional resource plays are regional in extent and exhibit low risk with consistent results and predictable EURs.
Development of our conventional resource plays
Our technical staff, in conjunction with our contract operator, has developed geologic and engineering expertise in the areas of production phase identification, well design for horizontal drilling, strategic submersible pump placement, and product separation with disposal processes. We believe this experience helps us to understand the characteristics of, and obtain efficiencies in production from, the conventional resource plays on which we focus.
EURs in conventional resource reservoirs can be calculated within a reasonable degree of certainty. This has been demonstrated through historical success of our contract operator and validated by our and our contract operator’s independent engineering firms. We, along with our contract operator, use mapping and seismic workstation capabilities to manage large volumes of digital data to correlate key reservoir parameters. This allows the technical staff to process large volumes of geological and geophysical data including cores, well tests, log suites on wells, seismic, and surface variables which in turn provides us with an optimal view and analysis of critical data and minimizes misinterpretations of information.
Resource recovery relies upon exploitation of the reservoir through development versus exploration. This allows production utilizing the following steps:
| • | understanding the reservoir characteristics through complete geological analysis, extensive log analysis, core sampling where appropriate, geophysical review and economic review; |
| • | optimally drilling the reservoir by using multiple horizontal legs to maximize exposure to the reservoir and optimize conductive flow paths to the wellbore, and drilling four 640-acre sections from one well pad; and |
| • | harvesting fluids from the reservoir by pre-installing surface infrastructure, separating the fluids into oil, condensate, natural gas liquids, natural gas, and water, and maximizing recovery through well placement to optimize the effect of wells working in concert. |
The majority of the hydrocarbons remain locked in the reservoir for up to six months after a well is completed and brought online. During this time fluids in the naturally occurring fractures are vacated utilizing electric submersible pumps, allowing the hydrostatic pressure in the reservoir to be lowered, which in turn enables the hydrocarbons to expand and vacate the pores in which they are trapped. It is at this time that peak production rates, which can average over 200 Boe per day, are observed and sustained for periods typically in excess of twelve months. During the latter stages of the well life, the electric submersible pumps are replaced with beam pumps that are less expensive to operate and maintain, resulting in additional cost efficiencies.
As the formation is depressurized, the Btu content of the hydrocarbon production stream increases. Over the life of the well this creates greater volumes of condensate and natural gas liquids per Boe produced.
The decline of saltwater volumes produced is similar to the decline of hydrocarbon production following the peak production period. This reduces operating costs over time, in turn extending the economic life of the well and maximizing the hydrocarbon recovery from the reservoir.
Forced pooling process
Under Oklahoma law, if a party proposes to drill the initial well to a particular formation in a specific drilling and spacing unit but cannot obtain the agreement of all other oil and natural gas interest holders and other leaseholders within the unit as to how the unit should be developed, the party may commence a “forced pooling”
75
Table of Contents
Index to Financial Statements
process. In a forced pooling action, which is common in Oklahoma, the proposed operator files an application for a pooling order with the Oklahoma Corporation Commission and names all other persons with the right to drill the unit as respondents. The proposed operator is required to demonstrate in an administrative proceeding that it has made a good faith effort to bargain with all of the respondents prior to filing its application. The fair market value of the mineral interests in the unit is determined in the administrative proceeding by reference to market transactions involving nearby oil and natural gas rights, especially what has been paid for mineral leases in the particular drilling and spacing unit and the immediately surrounding drilling and spacing units.
Assuming the application is granted and a forced pooling order is granted, the respondents then have 20 days to elect either to participate in the proposed well or accept fair market value for their interest, usually in the form of a cash payment, an overriding royalty, or some combination, based on the fair market value established and approved through the administrative hearing. The pooling order usually also addresses the time frame for drilling the well and provides for the manner in which future wells within the unit may be drilled. The applicant for the pooling order is ordinarily designated as the operator of the wells subject to the pooling order.
The availability of forced pooling means that it normally is difficult for a small number of owners to block or delay the drilling of a particular well proposed by another interest holder. Exploration and production companies in Oklahoma often negotiate to lease as much of the mineral interests in a particular area as are readily available at acceptable rates, and then use the forced pooling process to proceed with the desired development of the well. In this manner, in conjunction with our contract operator, we have the ability to expand into and develop areas near our existing acreage even if we are unable to lease all of the mineral interests in those areas.
Proved Undeveloped Reserves
At December 31, 2010, the proved undeveloped reserves on our properties were 10.1 MMBoe. All proved undeveloped locations are scheduled to be spud within the next five years.
Independent Reserve Engineers
Our proved reserves estimates for the year ended December 31, 2010 included in this prospectus have been independently prepared by Ralph E. Davis Associates, Inc., which was founded in 1924 and performs consulting petroleum engineering services under Texas Board of Professional Engineers Registration No. F-1529. Within Ralph E. Davis Associates, Inc., the technical person primarily responsible for preparing the estimates shown herein was its president, Allen C. Barron. Mr. Barron has been practicing consulting petroleum engineering at Ralph E. Davis Associates, Inc. since 1993. Mr. Barron is a Registered Professional Engineer in the State of Texas (License No. 49284) and has over 40 years of practical experience in petroleum engineering, with over 30 years experience in the estimation and evaluation of reserves. He graduated from the University of Houston in 1968 with a Bachelors of Science in Chemical and Petroleum Engineering. Mr. Barron meets or exceeds the education, training, and experience requirements set forth in the Standards Pertaining to the Estimating and Auditing of Oil and Gas Reserves Information promulgated by the Society of Petroleum Engineers.
Technology Used to Establish Proved Reserves
As referred to in this prospectus, proved reserves are those quantities of oil and natural gas, which, by analysis of geoscience and engineering data, can be estimated with reasonable certainty to be economically producible from a given date forward, from known reservoirs, and under existing economic conditions, operating methods, and government regulations. The term “reasonable certainty” implies a high degree of confidence that the quantities of oil and/or natural gas actually recovered will equal or exceed the estimate. Reasonable certainty can be established using techniques that have been proved effective by actual production from projects in the same reservoir or an analogous reservoir or by other evidence using reliable technology that establishes reasonable certainty. Reliable technology is a grouping of one or more technologies (including computational methods) that has been field tested and has been demonstrated to provide reasonably certain results with consistency and repeatability in the formation being evaluated or in an analogous formation.
76
Table of Contents
Index to Financial Statements
To establish reasonable certainty with respect to our estimated proved reserves, our independent reserves engineering firm employed technologies that have been demonstrated to yield results with consistency and repeatability. The technologies and economic data used in the estimation of our proved reserves include, but are not limited to, electrical logs, radioactivity logs, core analyses, geologic maps and available downhole and production data, 3-D seismic data and well test data. Reserves attributable to producing wells with sufficient production history were estimated using appropriate decline curves or other performance relationships. Reserves attributable to producing wells with limited production history and for undeveloped locations were estimated using performance from analogous wells in the surrounding area and geologic data to assess the reservoir continuity. These wells were considered to be analogous based on production performance from the same formation and completion using similar techniques. In addition to assessing reservoir continuity, geologic data from well logs, core analyses and 3-D seismic data were used to estimate original oil in place in certain areas.
Internal Controls over Reserves Estimation Process
Our management team works closely with our independent reserve engineers to ensure the integrity, accuracy and timeliness of data furnished to our independent reserve engineers in their reserves estimation process. David J. Chernicky, our chairman, serves as our senior geologist and he, along with Carol T. Bryant, our senior engineer, are the technical personnel within our company primarily responsible for overseeing the preparation of our reserves estimates. They have over 50 combined years of industry experience and have evaluated numerous properties throughout the United States with an emphasis on light oil and natural gas liquids, heavy oil, conventional and unconventional reservoirs, operations, reservoir development and property evaluation. Mr. Chernicky holds a Bachelors of Science degree in Exploration Geophysics from the University of Oklahoma, which he received in 1978. Ms. Bryant holds a Petroleum Engineering degree from the University of Tulsa, which she received in 1980.
Our management team plans to meet with representatives of our independent reserve engineers periodically throughout the year to review properties and discuss methods and assumptions used in preparation of the proved reserves estimates. Historically, we have had no formal committee specifically designated to review our reserves reporting and our reserves estimation process, and our reserve report was reviewed by our senior geologist and senior engineer with representatives of our independent reserve engineers and internal technical staff.
Operating Data
| Years Ended December 31, | ||||||||||||
| 2008 | 2009 | 2010 | ||||||||||
| Oil |
||||||||||||
| Production (MBbls) |
59 | 75 | 70 | |||||||||
| Average sales price (per Bbl), excluding derivatives . |
$ | 97.87 | $ | 58.59 | $ | 75.77 | ||||||
| Natural Gas Liquids and Natural Gas |
||||||||||||
| Production (MBoe) |
886 | 837 | 807 | |||||||||
| Average sales price (per Boe), excluding derivatives |
$ | 59.99 | $ | 31.87 | $ | 45.09 | ||||||
| Oil Equivalents |
||||||||||||
| Production (MBoe) |
945 | 912 | 877 | |||||||||
| Average equivalent price (per Boe) |
$ | 62.35 | $ | 34.06 | $ | 47.55 | ||||||
| Average daily production (Boe/d) |
2,581 | 2,498 | 2,404 | |||||||||
| Average production costs (per Boe)(1) |
$ | 14.51 | $ | 10.27 | $ | 12.61 | ||||||
| (1) | Includes lease operating expense, workover expense and production taxes. |
Principal Customers
Our principal products are crude oil and natural gas, which are marketed and sold primarily to purchasers that have access to nearby pipeline facilities, refineries or other markets. Typically, crude oil is sold at the
77
Table of Contents
Index to Financial Statements
wellhead at field-posted prices, and natural gas is sold both (i) under contract at negotiated prices based upon factors normally considered in the industry (such as distance from well to pipeline, pressure, and quality) and (ii) at spot prices.
We rely on our midstream partners for the transportation, marketing, sales and account reporting for all production. The contract operator of our wells is responsible for the marketing and sales of all production to regional purchasers of petroleum products, and we evaluate the creditworthiness of those purchasers periodically. Although historically all of the natural gas, natural gas liquids and crude oil produced from our Golden Lane field and Luther field properties have been sold to a limited number of purchasers, we believe that we would be able to secure replacement purchasers if any of these purchasers were unable to continue to purchase the natural gas and crude oil produced at our properties.
Natural Gas Sales/Customers: New Dominion has previously dedicated all gas produced and sold from wells it operates in the Golden Lane field to Scissortail Energy, LLC, a subsidiary of Copano Energy (“Scissortail”), pursuant to a long-term gas sales contract entered into on May 1, 2005, between our contract operator and Scissortail. As part of the consideration for our long-term gas dedication, Scissortail constructed and owns a gas processing plant in Paden, Oklahoma, where the gas from the Golden Lane field is processed. The gas produced from the Luther field is sold to DCP Midstream, LP (“DCP”) pursuant to a gas purchase contract dated September 1, 2006, as amended, between our contract operator and DCP. None of these purchasers are affiliated in any way with us or any of the other entities controlled by Mr. Chernicky.
Crude Oil Sales/Customers: We anticipate that most of the crude oil produced from the Acquired Assets will be sold to third-party marketing companies, initially United Petroleum Purchasing Company (“UPP”) for oil produced from the Golden Lane field and Enterprise Products (“Enterprise”) for oil produced from the Luther field. These contracts are presently for terms of six-months or less, which is customary for oil sales contracts. During the year ended December 31, 2010, 100% of total oil production from our properties in the Golden Lane field was sold to Sunoco, Inc. For the year ended December 31, 2010, 100% of the oil production from our properties in the Luther field was sold to Enterprise. None of these purchasers are affiliated in any way with us or any of the other entities controlled by Mr. Chernicky.
Productive Wells
The following table sets forth the number of oil and natural gas wells in which we owned a working interest as of August 12, 2011.
| Crude Oil | Natural Gas | Total | ||||||||||||||||||||||
| Gross | Net | Gross | Net | Gross | Net | |||||||||||||||||||
| Golden Lane |
8 | 3.7 | 228 | 91.5 | 236 | 95.2 | ||||||||||||||||||
| Luther |
3 | 1.8 | 10 | 5.9 | 13 | 7.7 | ||||||||||||||||||
|
|
|
|
|
|
|
|
|
|
|
|
|
|||||||||||||
| Total |
11 | 5.5 | 238 | 97.4 | 249 | 102.9 | ||||||||||||||||||
Acreage
The following table sets forth certain information with respect to our developed and undeveloped acreage as of August 12, 2011.
| Undeveloped | Developed | Total | ||||||||||||||||||||||
| Gross | Net | Gross | Net | Gross | Net | |||||||||||||||||||
| Golden Lane |
20,480 | 7,188 | 68,120 | 27,481 | 88,600 | 34,669 | ||||||||||||||||||
| Luther |
18,560 | 11,136 | 14,220 | 8,468 | 32,780 | 19,604 | ||||||||||||||||||
|
|
|
|
|
|
|
|
|
|
|
|
|
|||||||||||||
| Total |
39,040 | 18,324 | 82,340 | 35,949 | 121,380 | 54,273 | ||||||||||||||||||
78
Table of Contents
Index to Financial Statements
The majority of our undeveloped acreage is not subject to material near-term lease expiration risk. As of August 12, 2011, we held approximately 5,100 net acres for which the leases are scheduled to expire (unless a well is drilled and oil or natural gas is produced from the leasehold) on or prior to August 1, 2014, of which 1,668 net acres are scheduled to expire prior to August 1, 2012 and 3,432 net acres are scheduled to expire between August 1, 2012 and August 1, 2014.
Drilling Activity
The following table describes the development wells drilled on our acreage by our predecessors-in-interest during the years ended December 31, 2008, 2009 and 2010.
| Productive Wells | Dry Wells | Total | ||||||||||||||||||||||
| Year | Gross | Net | Gross | Net | Gross | Net | ||||||||||||||||||
| 2008 |
12 | 3.9 | — | — | 12 | 3.9 | ||||||||||||||||||
|
2009 |
24 | 7.9 | — | — | 24 | 7.9 | ||||||||||||||||||
|
2010 |
27 | 10.1 | — | — | 27 | 10.1 | ||||||||||||||||||
Our predecessors drilled no exploratory wells on our acreage during these three years.
Hedging Activity
We have hedging arrangements in place covering 41% of our estimated production for the remainder of 2011 and 32% of our estimated production for 2012. The following table summarizes our hedging positions as of October 11, 2011:
Fixed Price Swaps:
| Instrument |
Settlement | Volumes | Average Price | Range | ||||||||||
| Oil Swaps |
2011 | 11,741 bbl | $82.23 | $80.70 - $83.75 | ||||||||||
| Natural Gas Liquids Swaps |
2011 | 4,271,683 gal | $1.135 | $0.424 - $2.435 | ||||||||||
| Natural Gas Liquids Swaps |
2012 | 10,168,002 gal | $1.266 | $0.399 - $2.381 | ||||||||||
| Natural Gas Liquids Swaps |
2013 | 8,173,305 gal | $1.062 | $0.376 - $2.300 | ||||||||||
| Natural Gas Liquids Swaps |
2014 | 3,148,317 gal | $1.133 | $0.410 - $2.300 | ||||||||||
| Collars: | ||||||||||||||
| Instrument |
Settlement | Volumes | Floor | Ceiling | ||||||||||
| Oil Collars |
2011 | 26,340 bbl | $73.00 | $107.50 | ||||||||||
| Oil Collars |
2012 | 134,159 bbl | $72.00 | $112.02 | ||||||||||
| Oil Collars |
2013 | 91,144 bbl | $72.00 | $118.76 | ||||||||||
| Oil Collars |
2014 | 34,644 bbl | $86.01 | $116.97 | ||||||||||
| Natural Gas Collars |
2011 | 393,750 MMbtu | $ | 3.75 | $4.12 | |||||||||
| Natural Gas Collars |
2012 | 1,375,020 MMbtu | $ | 4.00 | $4.72 | |||||||||
| Natural Gas Collars |
2013 | 950,004 MMbtu | $ | 4.25 | $5.43 | |||||||||
Material Definitive Agreements
Contribution Agreements and Related Transactions
On August 12, 2011, we entered into two contribution agreements setting forth the terms by which Scintilla and certain other parties contributed certain oil and natural gas assets and interests located in east-central Oklahoma including (i) a working interest ranging from 20% to 88% (39% weighted average) in certain oil and natural gas leases and wells located in the Golden Lane field and producing from the Hunton formation (the “Golden Lane Assets”), and (ii) an approximate 60% working interest in certain oil and natural gas leases and
79
Table of Contents
Index to Financial Statements
wells located in the Luther field and relating solely to the Hunton formation (the “Luther Assets,” and together with the Golden Lane Assets, the “Acquired Assets”). Scintilla contributed all of the Golden Lane Assets and approximately 84% of the Luther Assets to us, while other parties contributed the remaining approximately 16% of the Luther Assets to us. The contributing parties and the consideration they received from us in exchange for their respective interests in the Acquired Assets are as follows (in thousands):
| Contributing Party |
Shares of our Common Stock |
Cash Consideration |
||||||
| Scintilla, LLC |
20,000 | (1) | $ | 60,000 | ||||
| Deylau, LLC |
360 | — | ||||||
| Timothy R. and Robin L. Cargile |
180 | — | ||||||
| W.K. Chernicky, L.L.C. |
240 | — | ||||||
| Okeanos, Inc. |
120 | — | ||||||
| Tony McKaig |
180 | — | ||||||
| Red Dragon, L.L.C. |
120 | — | ||||||
|
|
|
|
|
|||||
| TOTAL |
21,200 | $ | 60,000 | |||||
| (1) | Scintilla assigned these shares of our common stock to the David J. Chernicky Trust. |
Based on an assumed value of our common stock of $10.00 per share, which is the price at which we completed our private placement of common stock on August 12, 2011, we paid a total of $260 million to Scintilla for the Scintilla Assets, or an average of $13.72 per Bbl of the 18,953 MBoe in proved reserves attributable to the Scintilla Assets as of December 31, 2010. We valued the Golden Lane Assets at $200 million and Scintilla’s contributed portion of the Luther Assets at $60 million, primarily due to the higher level of developed reserves and corresponding higher producing well count within the Golden Lane Assets compared to a much larger relative portion of undeveloped reserves associated with the Luther Assets. We then used our $60 million valuation for Scintilla’s share of the Luther Assets to determine the appropriate number of shares of our common stock to be issued to the other parties that contributed the Luther Assets to us, based on the proportionate contributions by Scintilla and such other parties of approximately 50% and 10% working interests in the Luther Assets, respectively. Accordingly, we issued an additional 1.2 million shares of our common stock to the other contributing parties, equal to $12 million based upon an assumed value of $10.00 per share. While this describes how we arrived at the number of shares to issue to the other contributing parties, it is not necessarily equivalent to the value at which we will recognize the acquisition of the Other Contributed Assets in our financial statements under GAAP. We believe the aggregate consideration we paid for the Acquired Assets compares favorably to the price third parties have paid for proved reserves within the past 12 to 18 months.
Simultaneously with the acquisition of the Acquired Assets, we entered into an agreement with New Dominion and Scintilla whereby we have the exclusive right, for a 25-year period to acquire up to 90% of Scintilla and New Dominion’s combined interest in oil and natural gas projects determined to have proved reserves. In the case of any such oil and natural gas projects in which we elect to participate, we will negotiate the price we would pay Scintilla and New Dominion for our proportionate share of those properties, but if we are unable to agree on such price, we will refer the matter to an independent appraiser, whose decision will be binding on Scintilla, New Dominion and us.
This agreement also generally provides us with access to New Dominion’s existing saltwater disposal facilities and related rights in the Golden Lane and Luther fields so long as we pay the costs associated with saltwater disposal specified in the Golden Lane Participation Agreement and the Luther JOA described below, respectively.
As further described herein, New Dominion and Scintilla are wholly owned and controlled by our chairman, David J. Chernicky. New Dominion has served as the operator of the Acquired Assets, and we expect to maintain a strategic relationship with New Dominion with respect to the exploration and operation of various oil and natural gas assets and interests.
80
Table of Contents
Index to Financial Statements
Golden Lane Participation Agreement and Luther JOA
Upon the acquisition of the Golden Lane Assets and the Luther Assets, we became parties to a 2007 participation agreement by which New Dominion operates the Golden Lane field (the “Golden Lane Participation Agreement”) and a new joint operating agreement by which New Dominion operates the Luther field (the “Luther JOA”).
The other parties to the Golden Lane Participation Agreement include New Dominion, as operator, Scintilla, as a continuing working interest owner, and a number of unaffiliated companies who also own working interests in the Golden Lane field. The other parties to the Luther JOA include New Dominion, as operator, and Scintilla, as a continuing working interest owner.
The Golden Lane Participation Agreement controls the development and operation of the Golden Lane field and provides New Dominion, as operator, with authority to control the development and operation of the field. Each party to the Golden Lane Participation Agreement has committed to participate in future wells proposed by the operator for its proportionate share of the costs associated with such wells. The operator also is empowered to acquire additional leasehold within the Golden Lane field for the account of the working interest owners in exchange for a turnkey fee per net acre acquired. This turnkey fee is currently $300 per net acre acquired and may be increased by the operator from time to time in the event of an increase in prevailing leasehold acquisition costs. The parties also have agreed to pay New Dominion an initial connection charge of $300,000 per well in the Golden Lane field, subject to increase in certain circumstances, for connection and access to its saltwater disposal infrastructure within the Golden Lane field and also to pay New Dominion their proportionate share of maintenance and operating costs of New Dominion’s saltwater disposal wells.
Under the Luther JOA, New Dominion will continue as the contract operator of our Luther field. New Dominion is permitted to acquire additional leasehold within the Luther field for our and Scintilla’s account, and in such a circumstance we are required to pay New Dominion for our proportionate share of the actual cost of such acreage plus a fee of 15%. We also are required to advance up to $1 million in acreage acquisition costs from time to time for future acquisitions within the Luther field as often as every six months if requested by the operator. The Luther JOA also contains provisions governing the connection and access to New Dominion’s saltwater disposal infrastructure that are similar to those found in the Golden Lane Participation Agreement, except that the current connection fee is $400,000 per well for the Luther field as compared to $300,000 per well for the Golden Lane field. Additionally, the Luther JOA requires us to pay New Dominion for our proportionate share of the cost of other infrastructure deemed necessary by New Dominion to economically produce oil and natural gas, plus a fee of 15% of such amounts.
Both the Golden Lane Participation Agreement and the Luther JOA require us to contribute capital for drilling and completing new wells and related project costs based on our proportionate ownership of each particular new well. Both of these agreements contain significant penalties for a party’s election not to participate in a proposed well within the geographical areas covered by the agreements, as is customary in the oil and natural gas industry. We typically must pay our share of drilling and completion expenses no more than 30 days following notice from the operator, and in some circumstances the operator may require us to advance these amounts in the month before the operator expects to incur them. The Golden Lane Participation Agreement, in particular, requires us to contribute our entire share of estimated drilling and completion costs within 30 days of a new well notice from the operator or at least five days prior to the spud date for the new well, depending on which event occurs later.
In return for serving as the operator of the Golden Lane and Luther fields, New Dominion is entitled to receive reimbursement for costs allocable to the wells subject to the Golden Lane Participation Agreement and the Luther JOA, including allocable shares of its employees and certain other general and administrative expenses, under joint account procedures common in the oil and natural gas industry. We generally are required to pay our proportionate share of these ongoing costs associated with the operation of our wells on a monthly basis and within 30 days of the date of our contract operator’s invoice.
81
Table of Contents
Index to Financial Statements
Credit Agreement
On August 12, 2011, we entered into a four-year $150.0 million credit agreement with a syndicate of banks led by Bank of Montreal providing for a senior secured revolving credit facility with an initial borrowing base of $72.5 million and with a $5.0 million subfacility for standby letters of credit. For a description of the material terms of our credit facility, see “Management’s Discussion and Analysis of Financial Condition and Results of Operations—Credit Facility.” This credit facility financed the cash consideration required for the acquisition of the Acquired Assets.
Registration Rights Agreement
On August 12, 2011, we entered into a Registration Rights Agreement (the “Registration Rights Agreement”) with the contributing parties and the David J. Chernicky Trust as the successor in interest of Scintilla. Subject to certain conditions, the Registration Rights Agreement requires us, at our expense, to use our reasonable efforts to register the resale of the shares of common stock issued to the contributing parties under the Contribution Agreements upon demand of one or more of the contributing parties no earlier than six months from the date of the Registration Rights Agreement, and no more than twice in total. We are also required to register these shares of common stock for resale in any registration statement we file on or after six months from the date of the Registration Rights Agreement. We are not obligated to take any action to register shares pursuant to the Registration Rights Agreement during the period starting with the date 60 days prior to our estimated date of filing, and ending on the date six months immediately following the effective date of, a registration statement relating to our securities as long as we are employing all reasonable efforts in good faith to cause such registration statement to become effective. All of the contributing parties and the David J. Chernicky Trust will be subject to lock-up agreements generally precluding their sale of shares of our common stock for 180 days from the date of this prospectus. See “Underwriting.”
Recent Developments
Private Placement of Common Stock
On August 12, 2011, we completed a private placement of 157,500 shares of our common stock at a price of $10.00 per share, solely to accredited investors, in which we received gross proceeds of approximately $1.6 million. While our existing cash flow is sufficient to maintain our current rate of development, we determined to complete this private placement to provide us with additional financial flexibility pending the completion of this offering.
Initial Management Stock Grants
In addition to the shares received through his ownership of Deylau, LLC (“Deylau”) pursuant to a contribution agreement, Kristian B. Kos, our president and chief executive officer, received a grant of 2.3 million shares of our common stock as part of his compensation on August 12, 2011. Of those shares, 900,000 shares will vest upon completion of this offering, and the remaining 1.4 million shares will vest in equal installments on the first and second anniversary of the grant date. We also granted 200,000 shares of our common stock to each of David J. Chernicky, our chairman and senior geologist; Richard D. Finley, our chief financial officer; and V. Bruce Thompson, our general counsel and secretary, with half of such shares vesting upon completion of this offering and the other half of such shares vesting on the first anniversary of the grant date. At the option of these executive officers, we may withhold shares of their common stock to satisfy withholding tax obligations incurred upon the vesting of such stock upon the consummation of this offering. Assuming an offering price of $ per share and an assumed combined state and federal tax rate of 30.5%, we estimate that up to approximately $ million of the proceeds of this offering may be used to fund such withholding tax payments.
Title to Properties
Our properties are subject to customary royalty interests, liens incident to operating agreements, liens for current taxes and other burdens, including other mineral encumbrances and restrictions. We do not believe that
82
Table of Contents
Index to Financial Statements
any of these burdens materially interfere with our use of the properties in the operation of our business. We believe that we have generally satisfactory title to or rights in all of our producing properties. As is customary in the oil and gas industry, we make minimal investigation of title at the time we acquire undeveloped properties. We make title investigations and receive title opinions of local counsel, if at all, only before we commence drilling operations. We believe that we have satisfactory title to all of our other assets. Although title to our properties is subject to encumbrances in certain cases, we believe that none of these burdens will materially detract from the value of our properties or from our interest therein or will materially interfere with the operation of our business.
Regulation of the Oil and Natural Gas Industry
Our operations are substantially affected by federal, state and local laws and regulations. In particular, oil and natural gas production and related operations are, or have been, subject to price controls, taxes and numerous other laws and regulations. All of the jurisdictions in which we own or operate properties for oil and natural gas production have statutory provisions regulating the exploration for and production of oil and natural gas, including provisions related to permits for the drilling of wells, bonding requirements to drill or operate wells, the location of wells, the method of drilling and casing wells, the surface use and restoration of properties upon which wells are drilled, sourcing and disposal of water used in the drilling and completion process, and the abandonment of wells. Our operations are also subject to various conservation laws and regulations. These include regulation of the size of drilling and spacing units or proration units, the number of wells which may be drilled in an area, and the unitization or pooling of oil and natural gas wells, as well as regulations that generally prohibit the venting or flaring of natural gas and that impose certain requirements regarding the ratability or fair apportionment of production from fields and individual wells.
The regulatory burden on the industry increases the cost of doing business and affects profitability. Failure to comply with applicable laws and regulations can result in substantial penalties. Furthermore, such laws and regulations are frequently amended or reinterpreted, and new proposals that affect the oil and natural gas industry are regularly considered by Congress, state governments, the Federal Energy Regulatory Commission, or FERC, and the courts. We believe we are in substantial compliance with all applicable laws and regulations, and that continued substantial compliance with existing requirements will not have a material adverse effect on our financial position, cash flows or results of operations. We are not currently aware of any specific pending legislation or regulation that is reasonably likely to be enacted, or for which we cannot predict the likelihood of enactment, and that is reasonably likely to have a material effect on our financial position, cash flows or results of operations.
Regulation of transportation of oil
Sales of crude oil, condensate and natural gas liquids are not currently regulated and are made at negotiated prices. Nevertheless, Congress could reenact price controls in the future.
Our sales of crude oil are affected by the availability, terms and cost of transportation. Interstate transportation of oil by pipeline is regulated by FERC pursuant to the ICA, EPAct 1992 and the rules and regulations promulgated under those laws. The ICA and its implementing regulations require that tariff rates for interstate service on oil pipelines, including interstate pipelines that transport crude oil and refined products (collectively referred to as “petroleum pipelines”), be just and reasonable and non-discriminatory and that such rates and terms and conditions of service be filed with FERC. EPAct 1992 deemed certain interstate petroleum pipeline rates then in effect to be just and reasonable under the ICA, which are commonly referred to as “grandfathered rates.” Pursuant to EPAct 1992, FERC also adopted a generally applicable ratemaking methodology, which, as currently in effect, allows petroleum pipelines to change their rates provided they do not exceed prescribed ceiling levels that are tied to changes in the Producer Price Index for Finished Goods (“PPI”), plus 1.3 percent. For the five-year period beginning July 1, 2011, the index will be PPI plus 2.65%.
FERC has also established cost-of-service ratemaking, market-based rates, and settlement rates as alternatives to the indexing approach. A pipeline may file rates based on its cost-of-service if there is a
83
Table of Contents
Index to Financial Statements
substantial divergence between its actual costs of providing service and the rate resulting from application of the index. A pipeline may charge market-based rates if it establishes that it lacks significant market power in the affected markets. Further, a pipeline may establish rates through settlement with all current non-affiliated shippers.
Intrastate oil pipeline transportation rates are subject to regulation by state regulatory commissions. The basis for intrastate oil pipeline regulation, and the degree of regulatory oversight and scrutiny given to intrastate oil pipeline rates, varies from state to state. Insofar as effective interstate and intrastate rates are equally applicable to all comparable shippers, we believe that the regulation of oil transportation rates will not affect our operations in any way that is of material difference from those of our competitors who are similarly situated.
Further, interstate and intrastate common carrier oil pipelines must provide service on a non-discriminatory basis. Under this open access standard, common carriers must offer service to all similarly situated shippers requesting service on the same terms and under the same rates. When oil pipelines operate at full capacity, access is governed by prorationing provisions set forth in the pipelines’ published tariffs. Accordingly, we believe that access to oil pipeline transportation services generally will be available to us to the same extent as to our similarly situated competitors.
Regulation of transportation and sales of natural gas
FERC regulates interstate natural gas transportation rates, and terms and conditions of service, which affect the marketing of natural gas that we produce, as well as the revenues we receive for sales of our natural gas. Since 1985, FERC has endeavored to make natural gas transportation more accessible to natural gas buyers and sellers on an open and non-discriminatory basis. FERC has stated that open access policies are necessary to improve the competitive structure of the interstate natural gas pipeline industry and to create a regulatory framework that will put natural gas sellers into more direct contractual relations with natural gas buyers by, among other things, unbundling the sale of natural gas from the sale of transportation and storage services. Beginning in 1992, FERC issued a series of orders, beginning with Order No. 636, to implement its open access policies. As a result, the interstate pipelines’ traditional role of providing the sale and transportation of natural gas as a single service has been eliminated and replaced by a structure under which pipelines provide transportation and storage service on an open access basis to others who buy and sell natural gas. Although FERC’s orders do not directly regulate natural gas producers, they are intended to foster increased competition within all phases of the natural gas industry.
In 2000, FERC issued Order No. 637 and subsequent orders, which imposed a number of additional reforms designed to enhance competition in natural gas markets. Among other things, Order No. 637 revised FERC’s pricing policy by waiving price ceilings for short-term released capacity for a two-year experimental period, and effected changes in FERC regulations relating to scheduling procedures, capacity segmentation, penalties, rights of first refusal and information reporting.
Gathering services, which occur upstream of jurisdictional transmission services, are regulated by the states onshore and in state waters. Although FERC has set forth a general test for determining whether facilities perform a nonjurisdictional gathering function or a jurisdictional transmission function, FERC’s determinations as to the classification of facilities is done on a case by case basis. To the extent that FERC issues an order which reclassifies transmission facilities as gathering facilities, and depending on the scope of that decision, our costs of getting gas to point of sale locations may increase. State regulation of natural gas gathering facilities generally includes various safety, environmental and, in some circumstances, nondiscriminatory take requirements. Although such regulation has not generally been affirmatively applied by state agencies, natural gas gathering may receive greater regulatory scrutiny in the future.
Intrastate natural gas transportation and facilities are also subject to regulation by state regulatory agencies, and certain transportation services provided by intrastate pipelines are also regulated by FERC. The basis for intrastate regulation of natural gas transportation and the degree of regulatory oversight and scrutiny given to
84
Table of Contents
Index to Financial Statements
intrastate natural gas pipeline rates and services varies from state to state. Insofar as such regulation within a particular state will generally affect all intrastate natural gas shippers within the state on a comparable basis, we believe that the regulation of similarly situated intrastate natural gas transportation in any states in which we operate and ship natural gas on an intrastate basis will not affect our operations in any way that is of material difference from those of our competitors. Like the regulation of interstate transportation rates, the regulation of intrastate transportation rates affects the marketing of natural gas that we produce, as well as the revenues we receive for sales of our natural gas.
Regulation of production
The production of oil and natural gas is subject to regulation under a wide range of local, state and federal statutes, rules, orders and regulations. Federal, state and local statutes and regulations require permits for drilling operations, drilling bonds and reports concerning operations. Oklahoma, where all of our properties are presently located, and other states have regulations governing conservation matters, including provisions for the unitization or pooling of oil and natural gas properties, the establishment of maximum allowable rates of production from oil and natural gas wells, the regulation of well spacing, and plugging and abandonment of wells. The effect of these regulations is to limit the amount of oil and natural gas that we can produce from our wells and to limit the number of wells or the locations at which we can drill, although we can apply for exceptions to such regulations or to have reductions in well spacing. Moreover, most states, including Oklahoma, impose a production or severance tax with respect to the production and sale of oil, natural gas and natural gas liquids within their jurisdiction.
The failure to comply with these rules and regulations can result in substantial penalties. Our competitors in the oil and natural gas industry are subject to the same regulatory requirements and restrictions that affect our operations.
Market transparency rules
In 2007, FERC took steps to enhance its market oversight and monitoring of the natural gas industry by issuing several rulemaking orders designed to promote gas price transparency and to prevent market manipulation. In December 2007, FERC issued a final rule on the annual natural gas transaction reporting requirements, as amended by subsequent orders on rehearing, or Order No. 704. Pursuant to Order No. 704, wholesale buyers and sellers of annual quantities of 2.2 million MMBtu or more of natural gas in the previous calendar year, including intrastate natural gas pipelines, natural gas gatherers, natural gas processors, natural gas marketers and natural gas producers, are required to report, by May 1 of each year, aggregate volumes of natural gas purchased or sold at wholesale in the prior calendar year to the extent such transactions utilize, contribute to, or may contribute to, the formation of price indices. Order No. 704 also requires market participants to indicate whether they report prices to any index publishers and, if so, whether their reporting complies with FERC’s policy statement on price reporting. Some of our operations may be required to comply with Order No. 704’s annual reporting requirements.
In 2008, the FERC issued Order No. 720, which increases the Internet posting obligations of interstate pipelines, and also requires “major non-interstate” pipelines (defined as pipelines that are not natural gas companies under the Natural Gas Act that deliver more than 50 million MMBtu annually and including gathering systems) to post on the Internet the daily volumes scheduled for each receipt and delivery point on their systems with a design capacity of 15,000 MMBtu per day or greater. Numerous parties requested modification or reconsideration of this rule. An order on rehearing, Order No. 720-A, was issued on January 21, 2010. In that order FERC reaffirmed its holding that it has jurisdiction over major non-interstate pipelines for the purpose of requiring public disclosure of information to enhance market transparency. Order No. 720-A also granted clarification regarding application of the rule. Two parties have filed appeals of Order Nos. 720 and 720-A with the Fifth U.S. Circuit Court of Appeals. The parties have filed briefs but no decision has been issued. Unless they qualify for exemptions established by FERC, some of our operations may be required to comply with Order No. 720’s posting requirements.
85
Table of Contents
Index to Financial Statements
In May 2010, the FERC issued Order No. 735, which requires intrastate pipelines providing transportation services under Section 311 of the Natural Gas Policy Act of 1978 and “Hinshaw” pipelines operating under Section 1(c) of the Natural Gas Act to report on a quarterly basis more detailed transportation and storage transaction information, including: rates charged by the pipeline under each contract; receipt and delivery points and zones or segments covered by each contract; the quantity of natural gas the shipper is entitled to transport, store, or deliver; the duration of the contract; and whether there is an affiliate relationship between the pipeline and the shipper. Order No. 735 further requires that such information must be supplied through a new electronic reporting system and will be posted on FERC’s website, and that such quarterly reports may not contain information redacted as privileged. The FERC promulgated this rule after determining that such transactional information would help shippers make more informed purchasing decisions and would improve the ability of both shippers and the FERC to monitor actual transactions for evidence of market power or undue discrimination. Order No. 735 also extends the Commission’s periodic review of the rates charged by the subject pipelines from three years to five years. In December 2010, the Commission issued Order No. 735-A. In Order No. 735-A, the Commission generally reaffirmed Order No. 735 requiring Section 311 and “Hinshaw” pipelines to report on a quarterly basis storage and transportation transactions containing specific information for each transaction, aggregated by contract anomalies. These regulations also require that pipeline operation and maintenance personnel meet certain qualifications and that pipeline operators develop comprehensive spill response plans.
There have been recent initiatives to strengthen and expand pipeline safety regulations and to increase penalties for violations. New pipeline safety legislation requiring more stringent spill reporting and disclosure obligations has been introduced in the U.S. Congress and was passed by the U.S. House of Representatives in 2010, but was not voted on in the U.S. Senate. Similar legislation is being considered by Congress again this year, either independently or in conjunction with the reauthorization of the Pipeline Safety Act. The Department of Transportation has also recently proposed legislation providing for more stringent oversight of pipelines and increased penalties for violations of safety rules, which is in addition to the Pipeline and Hazardous Materials Safety Administration’s announced intention to strengthen its rules. DOT recently promulgated new regulations extending safety rules to certain low pressure, small diameter pipelines in rural areas.
Air emissions
The Clean Air Act, as amended (“CAA”), and comparable state laws and regulations restrict the emission of air pollutants from many sources, including oil and gas operations, and impose various monitoring and reporting requirements. These laws and regulations may require us to obtain pre-approval for the construction or modification of certain projects or facilities expected to produce or significantly increase air emissions, obtain and comply with stringent air permit requirements or utilize specific equipment or technologies to control emissions. Obtaining permits has the potential to delay the development of oil and natural gas projects.
Climate change
The United States is a party to the United Nations Framework Convention on Climate Change, an international treaty focused on stabilizing greenhouse gas, or GHGs, concentrations in the atmosphere at a level that would prevent serious damage to the climate system. While neither the treaty itself, nor subsequent related conferences, have established an obligation for the U.S. to reduce its GHGs emissions by a set amount, it has put significant political pressure on the U.S. to take responsive action. Both houses of Congress have previously considered legislation to reduce emissions of GHGs. Any future federal laws, treaties or implementing regulations that may be adopted to address GHGs emissions could require us to incur increased operating costs and could adversely affect demand for the oil and natural gas we produce.
In addition, the EPA has begun to regulate GHGs emissions. In December 2009, the EPA published its finding that certain emissions of GHGs presented an endangerment to human health and the environment. These findings by the EPA allow the agency to proceed with the adoption and implementation of regulations that would restrict emissions of GHGs under existing provisions of the federal Clean Air Act. Consequently, the EPA is requiring a reduction in emissions of GHGs from new motor vehicles beginning with the 2012 model year.
86
Table of Contents
Index to Financial Statements
Furthermore, the EPA published a final rule on June 3, 2010 to address the permitting of GHGs emissions from stationary sources under the Prevention of Significant Deterioration and Title V permitting programs. This rule “tailors” these permitting programs to apply to certain stationary sources of GHGs emissions, such as power plants and oil refineries, in a multi-step process, with the largest sources first subject to permitting. Facilities required to obtain PSD permits for their GHGs emissions will be required to meet emissions limits that are based on the “best available control technology,” which will be established by the permitting agencies on a case-by-case basis. Starting in January 2011, stationary sources that are already obtaining a Clean Air Act permit for other pollutants must include GHGs in their permits if they emit at least 75,000 tons of these emissions a year. In July 2012, the rule expands to include all new facilities that emit at least 100,000 tons of GHGs per year.
In addition, in October 2009, the EPA issued a final rule requiring the reporting of GHGs from specified large GHG emission sources beginning in 2011 for emissions in 2010.
On November 30, 2010, the EPA published a final rule expanding the existing GHGs monitoring and reporting rule to include certain large onshore and offshore oil and gas production facilities and onshore oil and natural gas processing, transmission, storage and distribution facilities. Reporting of GHGs emissions from such facilities will be required on an annual basis, with reporting beginning in 2012 for emissions occurring in 2011. Several of the EPA’s GHGs rules are being challenged in court proceedings and depending on the outcome of such proceedings, such rules may be modified or rescinded or the EPA could develop new rules. The adoption and implementation of any regulations imposing reporting obligations on, or limiting emissions of GHGs from, our equipment and operations could require us to incur costs to reduce emissions of GHGs associated with our operations or could adversely affect demand for the oil and natural gas we produce.
Even if such legislation is not adopted at the national level, almost one-half of the states have begun taking actions to control and/or reduce emissions of greenhouse gases, primarily through the planned development of GHGs emission inventories and/or regional GHGs cap and trade programs. Although most of the state-level initiatives have to date focused on large sources of GHGs emissions, such as coal-fired electric plants, it is possible that smaller sources of emissions could become subject to GHGs emission limitations or allowance purchase requirements in the future. Any one of these climate change regulatory and legislative initiatives could have a material adverse effect on our business, financial condition and results of operations.
Legislation or regulations that may be adopted to address climate change could also affect the markets for our products by making our products more or less desirable than competing sources of energy. To the extent that our products are competing with higher GHG emitting energy sources such as coal, our products would become more desirable in the market with more stringent limitations on GHG emissions. To the extent that our products are competing with lower GHG emitting energy sources such as solar and wind, our products would become less desirable in the market with more stringent limitations on GHG emissions. We cannot predict with any certainty at this time how these possibilities may affect our operations.
Finally, it should be noted that some scientists have concluded that increasing concentrations of GHGs in the Earth’s atmosphere may produce climate changes that have significant physical effects, such as increased frequency and severity of storms, floods and other climatic events. If any such effects were to occur, they could adversely affect or delay demand for oil or natural gas or otherwise cause us to incur significant costs in preparing for or responding to those effects.
Spills and Discharges
Our operations are subject to Oklahoma Corporation Commission requirements, including regulations for responding to and remediating spills. Furthermore, our facilities maintain Spill, Prevention, Control and Countermeasure (“SPCC”) Plans that set out measures for oil spill prevention, preparedness, and responses in accordance with the Federal Water Pollution Control Act, as amended, which also is known as the Clean Water Act (“CWA”).
87
Table of Contents
Index to Financial Statements
The CWA and analogous state laws impose restrictions and controls regarding the discharge of pollutants into waters of the United States. Pursuant to the CWA and analogous state laws, permits must be obtained to discharge pollutants into state waters or waters of the U.S. Any such discharge of pollutants into regulated waters must be performed in accordance with the terms of the permit issued by the EPA or the analogous state agency. The CWA and regulations implemented thereunder also prohibit the discharge of dredge and fill material into regulated waters, including jurisdictional wetlands, unless authorized by an appropriately issued permit. In addition, the CWA and analogous state laws require individual permits or coverage under general permits for discharges of storm water runoff from certain types of facilities. Federal and state regulatory agencies can impose administrative, civil and criminal penalties as well as other enforcement mechanisms for non-compliance with discharge permits or other requirements of the CWA and analogous state laws and regulations.
Other laws
The Oil Pollution Act of 1990, as amended (“OPA”) establishes strict liability for owners and operators of facilities that are the site of a release of oil into waters of the U.S. The OPA and its associated regulations impose a variety of requirements on responsible parties related to the prevention of oil spills and liability for damages resulting from such spills. A “responsible party” under the OPA includes owners and operators of certain onshore facilities from which a release may affect waters of the U.S. The OPA assigns liability to each responsible party for oil cleanup costs and a variety of public and private damages. While liability limits apply in some circumstances, a party cannot take advantage of liability limits if the spill was caused by gross negligence or willful misconduct or resulted from violation of a federal safety, construction or operating regulation. If the party fails to report a spill or to cooperate fully in the cleanup, liability limits likewise do not apply. Few defenses exist to the liability imposed by the OPA. The OPA imposes ongoing requirements on a responsible party, including the preparation of oil spill response plans and proof of financial responsibility to cover environmental cleanup and restoration costs that could be incurred in connection with an oil spill.
Employees
At October 1, 2011, we had approximately ten full-time employees. None of our employees is represented by a labor union or covered by any collective bargaining agreement. We believe that our relations with our employees are satisfactory.
Legal Proceedings
From time to time, we are subject to legal proceedings and claims that arise in the ordinary course of business. Like other oil and gas producers and marketers, our operations are subject to extensive and rapidly changing federal and state environmental, health and safety and other laws and regulations governing air emissions, wastewater discharges, and solid and hazardous waste management activities.
New Dominion, our contract operator and affiliate, has been named as a defendant in Mattingly v. Equal Energy, which was originally filed in Creek County District Court on August 16, 2010, was subsequently removed to the United States District Court for the Northern District of Oklahoma on September 8, 2010, but was remanded to state court on August 1, 2011. The plaintiffs have asserted claims individually and on behalf of a class of royalty owners alleging that the defendants, including New Dominion, breached certain duties owed to the plaintiffs arising from oil and gas leases between the plaintiffs and the defendants by allegedly deducting post-production costs in calculating the royalties paid to the plaintiffs under those leases and failing to credit the plaintiffs for all revenues, including those attributable to the sale of natural gas, natural gas liquids, condensate and drip. The plaintiffs seek damages in excess of $10,000, punitive damages, interest, costs and attorneys’ fees.
Although we have not been made a party to this litigation, it is possible that we may be joined to the litigation as a defendant due to our acquisition of the Acquired Assets and the future calculation of royalties paid to the plaintiffs in the litigation.
88
Table of Contents
Index to Financial Statements
We are not a party to any other material pending or overtly threatened legal or governmental proceedings, other than proceedings and claims that arise in the ordinary course and are incidental to our business.
Insurance Matters
As is common in the oil and gas industry, we will not insure fully against all risks associated with our business either because such insurance is not available or because premium costs are considered prohibitive. A loss not fully covered by insurance could have a materially adverse effect on our financial position, results of operations or cash flows.
89
Table of Contents
Index to Financial Statements
Set forth below is certain information regarding persons who serve as our executive officers and directors. Prior to completion of this offering, we may appoint additional persons to serve as our executive officers and directors upon completion of this offering.
| Name |
Age | Position | ||||
| David J. Chernicky | 58 | Chairman of the Board and Senior Geologist | ||||
| Kristian B. Kos | 34 | Director, President and Chief Executive Officer | ||||
| Richard D. Finley | 60 | Chief Financial Officer and Treasurer | ||||
| V. Bruce Thompson | 64 | General Counsel and Secretary | ||||
| Carol T. Bryant | 54 | Senior Engineer | ||||
| Kevin A. Easley | 50 | Director | ||||
David J. Chernicky – Chairman and Senior Geologist – Our chairman of the board is Mr. David J. Chernicky. Mr. Chernicky was named chairman of the board and senior geologist in August 2011 and has more than 31 years of experience in the oil and gas industry. On July 1, 1998, Mr. Chernicky co-founded New Dominion, an oil and gas exploration and production company based in Tulsa, Oklahoma. Mr. Chernicky beneficially owns New Dominion and Scintilla. Since April 2002, Mr. Chernicky has served as the president of New Dominion, overseeing that company’s operations as a whole. Mr. Chernicky currently serves on the boards of various governmental bodies, including the Grand River Dam Authority (“GRDA”) and the Oklahoma Ordinance Works Authority. Prior to founding New Dominion, Mr. Chernicky was employed in 1979 as a geologist for Marathon Oil in Casper, Wyoming and later, from 1979 until 1983 as a geologist and geophysicist for Amoco Production in Denver, Colorado. Thereafter, Mr. Chernicky worked as an independent consulting geologist until founding New Dominion, LLC. Mr. Chernicky graduated from the University of Oklahoma in 1978 with a Bachelor of Science degree in exploration geophysics. We believe Mr. Chernicky’s extensive experience in the oil and gas industry, his leadership positions at other oil and gas companies, his reservoir engineering skills and his knowledge regarding our business and operations brings important experience and leadership to our company and our board of directors.
Kristian B. Kos – President and Chief Executive Officer – Our president and chief executive officer is Mr. Kristian B. Kos. Mr. Kos was named president and chief executive officer and director in July 2011 and has been involved in oil and gas and energy industries since 2005. From May 2010 through July 2011, Mr. Kos provided consulting services to New Dominion. In August 2006, Mr. Kos founded Deylau, LLC, a company focused on identifying, managing and financing oil and gas production companies, and served as its manager from August 2006 to July 2011. From February 2006 to February 2007, Mr. Kos served as a Vice President at Diamondback Energy Services, where he was actively involved in identifying and executing growth strategies for that company, including acquisitions. From September 2005 to February 2006, Mr. Kos worked in a business-development role for Gulfport Energy. Prior to working in the oil and gas and energy sectors, Mr. Kos worked in the financial sector for hedge fund manager Wexford Capital LP. Mr. Kos currently serves as a director of . Mr. Kos earned Bachelor of Arts and Master of Arts degrees in Economics and Philosophy from Trinity College, Dublin, Ireland in 1999. He also earned a Master of Philosophy degree in Economics from the University of Aix-Marseille, France in 2000. We believe Mr. Kos’s experience in the financial and oil and gas industries, his leadership positions at other oil and gas companies, and his knowledge regarding our business and operations provides important experience and leadership to our company and our board of directors.
Richard D. Finley – Chief Financial Officer and Treasurer – Our chief financial officer and treasurer is Richard D. Finley, C.P.A. Mr. Finley was named chief financial officer and treasurer in August 2011 and is a partner at Finley & Cook, an Oklahoma Certified Public Accounting firm. Mr. Finley intends to transition out of his role as a partner at Finley & Cook, where he has worked since 1973, overseeing tax and accounting services within various industries and business environments. Mr. Finley has extensive experience with oil and gas exploration and production clients in general matters of accounting and taxation. Mr. Finley earned a Bachelor
90
Table of Contents
Index to Financial Statements
degree in accounting from Central State University, Edmond, Oklahoma, in 1973. He has been a Certified Public Accountant since 1975 and is a member of both the Oklahoma Society of Certified Public Accountants and the American Institute of Certified Public Accountants. He is also a Certified Valuation Analyst and a member of the National Association of Certified Valuation Analysts.
V. Bruce Thompson – General Counsel and Secretary – Our general counsel and secretary is Mr. V. Bruce Thompson. Mr. Thompson was named general counsel and secretary in August 2011. Mr. Thompson also serves as President of The American Exploration & Production Council (AXPC), a Washington, D.C.-based trade association whose membership is composed of 31 of America’s leading independent oil and natural gas exploration and production companies, a position he has held since October 2008. From March 2007 to April 2008, Mr. Thompson served as senior vice president and general counsel of SandRidge Energy, Inc. (NYSE: SD). Additionally, from August 2003 to March 2007, Mr. Thompson served as senior counsel with Brownstein Hyatt Farber Schreck in the firm’s Washington, D.C. and Denver offices. Previously, Mr. Thompson served as senior vice president and general counsel of Forest Oil Corporation (NYSE: FST). Mr. Thompson also served as chief of staff for then Congressman, now U.S. Senator, James Inhofe. Mr. Thompson graduated from the University of Pennsylvania’s Wharton School of Business with a Bachelor of Science degree in Economics with an emphasis on corporate finance in 1969 and received his Juris Doctorate from the University of Tulsa’s College of Law in 1974.
Carol T. Bryant – Senior Engineer – Ms. Carol T. Bryant was named senior engineer for New Source Energy Corporation in August 2011. Prior to joining our company, Ms. Bryant was a consulting petroleum engineer for Pinnacle Energy Services from June 2008 to April 2011 where she prepared third party reserve and engineering reports for clients with assets in the Mid-Continent region. From April 2007 to May 2008, Ms. Bryant was the senior reservoir engineer for Windsor Energy Resources, LLC and Gulfport Energy/Grizzly Oil Sands, LLC, responsible for corporate reserve evaluation and database development, facilitating bank engineering reviews and investor reserve reporting. From May 2000 to April 2007, Ms. Bryant held various reservoir engineering positions with Chaparral Energy, LLC in Oklahoma City. She was the corporate reserve manager responsible for quarterly, year-end and special reporting requirements and facilitated third party and bank engineering reviews. She initiated organizational changes to meet the needs of a rapidly growing reserve base and in preparation to meet initial public offering reporting requirements and Sarbanes-Oxley compliance. As a senior reservoir engineer at Chaparral, Ms. Bryant developed geologic and reservoir simulation models to evaluate CO2 reserve potential for several Morrow CO2 floods in the Oklahoma and Texas panhandles. Prior to that, Ms. Bryant held positions as a production and reservoir engineer with various firms including Amoco Production Company in Denver, Colorado. Ms. Bryant graduated from the University of Tulsa in 1980 with a Bachelor of Science degree in Petroleum Engineering.
Kevin A. Easley – Director – Mr. Kevin A. Easley was named as a director for New Source Energy Corporation in August 2011, Mr. Easley is president and chief executive officer of New Dominion, LLC. Before joining New Dominion in June 2011, he served as chief executive officer of the GRDA from March 2004 to June 2011. During that time, he led the development for the authority of power generation, lake management, and environmental policies and successfully turned the authority’s rating from near junk-bond status to an AA credit rating. In August 2005, during his term with GRDA, Mr. Easley was elected to a six-year executive committee term with the American Public Power Association. In 2005, Mr. Easley was also appointed to the corporate governance committee of the Southwest Power Pool. Prior to that, Mr. Easley served in various management roles for Samson Energy from January 1989 to February 2004, Home-Stake Oil and Gas Company from February 1982 to December 1983, and BP Amoco from January 1981 to January 1983. Mr. Easley was elected to the Oklahoma House of Representatives in November 1984, where he served for six years. Later, as an Oklahoma State senator from November 1990 to January 2003, he identified the need for and initiated the commission for electric and energy studies. His knowledge of natural gas, coal, water and wind generation systems helped create legislation that ensured optimum energy levels for consumers, businesses, and business development opportunities. He authored legislation to create the Oklahoma Energy Resources Board, a state agency designed to deal with environmental clean-up of abandoned oil wells, among other issues.
91
Table of Contents
Index to Financial Statements
Mr. Easley currently serves as chairman of the Senate Energy, Environment and Communications committee, is on the board of directors of the American Public Power Association, and is an executive committee member of the United States Energy Council. Mr. Easley is a graduate of the University of Tulsa where he earned a Bachelor of Science in Business Administration with an emphasis on accounting. In 2009, he received a Master of Business Administration with honors at Oklahoma Christian University. We believe Mr. Easley’s extensive experience in the oil and gas industry as well as his experience in the energy and environmental sectors bring substantial leadership and experience to the board of directors.
Board of Directors
Our board of directors currently consists of three members, including (i) our president and chief executive officer, (ii) our senior geologist and (iii) the president and chief executive officer of New Dominion, our contract operator. Each of our current directors has prior industry experience. None of our current directors will qualify as independent under the standards of the NYSE.
We expect that our board will review the independence of our directors using the independence standards of the NYSE, and we expect that our board of directors will consist of seven directors within one year after the completion of this offering, four of whom will be independent.
Because of the expected continued beneficial ownership of Mr. Chernicky after this offering, we will be a “controlled company” as that term is defined in Section 303A of the NYSE Listed Company Manual. Under the NYSE’s rules, a “controlled company” may elect not to comply with certain NYSE corporate governance requirements, including (i) the requirement that a majority of our board of directors consist of independent directors, (ii) the requirement that our governance committee be composed entirely of independent directors with a written charter addressing that committee’s purpose and responsibilities, and (iii) the requirement that our compensation committee be composed entirely of independent directors with a written charter addressing that committee’s purpose and responsibilities. While these requirements will not apply to us as long as we remain a “controlled company,” we expect that our board of directors will consist of a majority of independent directors and that our governance and compensation committees will consist entirely of independent directors within one year following the completion of this offering. Our governance and compensations committees each will have a written charter addressing such committee’s purpose and responsibilities.
In evaluating director candidates, we will assess whether a candidate possesses the integrity, judgment, knowledge, experience, skills and expertise that are likely to enhance our board’s ability to manage and direct the affairs and business of the company, including, when applicable, to enhance the ability of committees of the board to fulfill their duties.
Committees of the Board of Directors
We expect that our board of directors will appoint an audit committee, a compensation committee, and a governance committee prior to the consummation of this offering and that our board of directors additionally will appoint such other committees as it determines to be necessary from time to time. The standing committees of the board of directors will have the responsibilities described below.
Audit Committee
The audit committee will oversee, review, act on and report on various auditing and accounting matters to our board of directors, including the selection of our independent accountants, the scope of our annual audits, fees to be paid to the independent accountants, the performance of our independent accountants and our accounting practices. In addition, the audit committee will oversee our compliance programs relating to legal and regulatory requirements. We will adopt an audit committee charter defining the committee’s primary duties in a manner consistent with the rules of the SEC and NYSE or market standards. Each of the directors appointed to
92
Table of Contents
Index to Financial Statements
the audit committee will be independent under the standards of the NYSE, and each of these directors will be financially literate. Additionally, at least one of the directors we appoint to the audit committee will qualify as an audit committee financial expert under applicable SEC regulations.
Compensation Committee
The compensation committee will establish salaries, incentives and other forms of compensation for our officers and other employees. Our compensation committee also will administer our incentive compensation and benefit plans. We will adopt a compensation committee charter defining this committee’s primary duties in a manner consistent with the rules of the SEC and NYSE or market standards.
Governance Committee
The governance committee will identify, evaluate and recommend qualified nominees to serve on our board of directors, develop and oversee our internal corporate governance processes and maintain a management succession plan. We will adopt a governance committee charter defining this committee’s primary duties in a manner consistent with the rules of the SEC and NYSE or market standards.
Compensation Committee Interlocks and Insider Participation
Because we are a newly formed entity, we have not yet established our compensation committee. We expect that our board of directors and compensation committee will consist only of directors who have never been an employee of our company and are not executive officers of another company for which any of our executive officers serves on the board of directors or compensation committee, except that Mr. Chernicky, our senior geologist, may be deemed to serve in a capacity similar to that of the compensation committee of New Dominion, of which Mr. Easley is an executive officer. For a description of transactions between us and New Dominion, see “Certain Relationships and Related Party Transactions.”
Code of Business Conduct and Ethics
Prior to the completion of this offering, our board of directors intends to adopt a code of business conduct and ethics applicable to our employees, directors and officers, in accordance with applicable U.S. federal securities laws and the corporate governance rules of the NYSE. We expect that any waiver of this code may be made only by our board of directors and will be promptly disclosed as required by applicable U.S. federal securities laws and the corporate governance rules of the NYSE.
Corporate Governance Guidelines
Prior to the completion of this offering, our board of directors intends to adopt corporate governance guidelines in accordance with the corporate governance rules of the NYSE.
93
Table of Contents
Index to Financial Statements
EXECUTIVE COMPENSATION AND OTHER INFORMATION
Compensation Discussion and Analysis
The following contains a description of the executive compensation programs and objectives that we plan to put into place, based upon the review and determinations made by our board of directors and subject to the further review and approval of the compensation committee of our board of directors.
Compensation of Named Executive Officers
Our named executive officers at present are Kristian B. Kos, our president and chief executive officer (and principal executive officer), Richard D. Finley, our chief financial officer and treasurer (and principal financial and accounting officer), David J. Chernicky, our senior geologist and chairman, V. Bruce Thompson, our general counsel and secretary, and Carol T. Bryant, our senior engineer. We have entered into employment agreements with Messrs. Kos, Finley, Chernicky and Thompson, and we anticipate that we may enter into employment agreements with Ms. Bryant and other key executives from time to time.
Under Mr. Kos’ employment agreement, Mr. Kos’ annual base salary will be $360,000, and he also is eligible for cash bonuses, equity compensation and other compensation as determined by the compensation committee of our board of directors from time to time. Mr. Kos also received a grant of 2,300,000 shares of our common stock, of which 700,000 shares are scheduled to vest on the first anniversary of the date of Mr. Kos’ employment, 700,000 shares are scheduled to vest on the second anniversary of the date of Mr. Kos’ employment, and the remaining 900,000 shares will vest upon the consummation of this offering.
At the option of Mr. Kos, we may withhold shares of his common stock to satisfy withholding tax obligations incurred upon the vesting of such stock upon the consummation of this offering. Assuming an offering price of $ per share and an assumed combined state and federal tax rate of 30.5%, we estimate that up to approximately $ million of the proceeds of this offering may be used to fund such withholding tax payments.
Under Mr. Chernicky’s employment agreement, Mr. Chernicky’s annual base salary will be $360,000, and he also is eligible for cash bonuses, equity compensation and other compensation as determined by the compensation committee of our board of directors from time to time. Mr. Chernicky received a grant of 200,000 shares of our common stock, of which 100,000 shares will vest upon the consummation of this offering, and the remaining 100,000 shares are scheduled to vest on the first anniversary of the date of Mr. Chernicky’s employment.
At the option of Mr. Chernicky, we may withhold shares of his common stock to satisfy withholding tax obligations incurred upon the vesting of such stock upon the consummation of this offering. Assuming an offering price of $ per share and an assumed combined state and federal tax rate of 30.5%, we estimate that up to approximately $ million of the proceeds of this offering may be used to fund such withholding tax payments.
The employment terms of Messrs. Finley and Thompson are identical in all material respects. Their respective annual base salaries are $192,000, and they are eligible for cash bonuses, equity compensation and other compensation determined from time to time by our compensation committee. Each of Messrs. Finley and Thompson received a grant of 200,000 shares of our common stock, of which 100,000 shares will vest upon the consummation of this offering, and the remaining 100,000 shares are scheduled to vest on the first anniversary of the respective date of their employment.
At the option of Messrs. Finley and Thompson, we may withhold shares of their common stock to satisfy withholding tax obligations incurred upon the vesting of such stock upon the consummation of this offering. Assuming an offering price of $ per share and an assumed combined state and federal tax rate of 30.5%, we estimate that up to approximately $ million of the proceeds of this offering may be used to fund such withholding tax payments.
94
Table of Contents
Index to Financial Statements
Ms. Bryant’s annual base salary is $180,000. The other terms of Ms. Bryant’s employment have not been established definitively.
We established the initial base salaries for our named executive officers based on our subjective evaluations of the services to be provided by them and their expertise and abilities as they relate to our overall corporate strategy. The compensation of Messrs. Kos and Chernicky, in particular, reflects their substantial actual and expected efforts and expertise on behalf of our company in structuring the acquisition of our properties and in developing and operating those properties moving forward. We anticipate that the compensation committee of our board of directors will determine the compensation for other key employees and the ongoing compensation of our named executive officers as appropriate and pursuant to our overall compensation goals and objectives described below.
Compensation Program Objectives
We anticipate that our compensation program will have the following long-term goals and objectives:
| • | aligning the interests of our executive officers with the short- and long-term interests of our stockholders; |
| • | linking executive compensation to individual performance and overall business performance; |
| • | leveraging individual performance through an emphasis on incentive compensation; and |
| • | compensating our executive officers at a level and in a manner such that we can continue to attract and retain capable and experienced individuals. |
Because we are a new company and have recently commenced operations, we are in the process of developing our compensation policies and anticipate that this will be an ongoing process as our company develops.
As an independent energy company engaged in the development and production of hydrocarbons from conventional resource plays, we have established our initial compensation packages based on our review of current compensation practices among similar oil and natural gas exploration and production companies. In general, our review focused on a mix of smaller to medium-sized public oil and natural gas exploration and production companies, although some of these companies are larger, and all of them are more established, than we are. We focused on the following companies as our “peer group” for purposes of comparing executive compensation:
Each company’s publicly disclosed information was compiled to provide data on executive compensation, including base pay, other cash compensation and equity-based compensation. With the exception of the initial equity grant to Mr. Kos, which is very high relative to our peers owing to his critical role in positioning our company for this offering, we believe that our initial executive compensation packages are approximately in the middle range of the compensation of this group. This reflects our intent to formulate executive compensation packages that are both representative of industry practices and are sufficient to attract and retain capable and experienced people.
We believe the companies included in our peer group as noted above are a representative list of comparison companies currently, but we expect this list to change as our company matures and as the oil and natural gas industry changes. As our business develops, we will select comparison companies that are comparable to us in
95
Table of Contents
Index to Financial Statements
terms of size and growth profile and that potentially compete with us for executive talent at the time of the comparison. In addition, the comparable companies will also develop over time, which also will necessitate changes in the composition of the comparison group. Future comparison groups may include some, none or all of the companies in the current group, in addition to new companies that may be added. We anticipate that we may engage external compensation consultants in the future to help us determine appropriate compensation packages for our executives, although no such consultants have been engaged to date.
We intend to design our compensation policies and programs to make us competitive with similarly-sized oil and natural gas exploration and production companies, to recognize and reward executive performance consistent with the success of our business, and to attract and retain capable and experienced people. Our compensation committee’s role and philosophy will be to ensure that our compensation goals and objectives, as applied to the actual compensation paid to our executive officers, are aligned with our overall business objectives and with stockholder interests.
In addition to industry comparables, our compensation committee may consider a variety of factors when determining compensation policies and programs and individual compensation levels, including our stockholders’ interests, our overall financial and operating performance, and the compensation committee’s assessment of each executive’s individual performance and contribution toward meeting our corporate objectives. As we grow, we will place increasing importance on the incentive-based component of compensation because we believe that a significant portion of an executive’s compensation should depend upon our overall corporate performance, including common stock share price performance.
Anticipated Elements of Our Compensation Program
The total compensation plan for executive officers likely will be comprised of three components: base salary, annual performance bonuses and equity-based compensation, including grants of restricted stock under our long-term incentive plan. There is currently no policy or target regarding a percentage allocation between cash and non-cash elements of our proposed compensation program or, within cash compensation, between the relative weight of base salary and targeted performance bonuses. Any such allocations will be determined by the compensation committee on an individual basis and may be influenced by such factors as level of responsibility, peer group analysis and individual executive performance.
Base Salary. We believe base salary is an important tool for attracting and retaining qualified personnel. As a general rule for establishing base salaries, our compensation committee will review competitive market data for each executive position and determine placement at an appropriate level in a range. See “Compensation Program Objectives” above, for a discussion of our recent determinations concerning comparison companies. The compensation range for executives will likely be reviewed on an annual basis by our compensation committee to reflect external factors, such as inflation. Additionally, our compensation committee’s ability to decrease the base salary of any of our executive officers may be restricted by the terms of a written employment agreement between us and such executive officer.
Performance Bonuses. We believe annual performance bonuses are valuable as a method to reward our management team when they are successful in reaching our previously established goals, to incentivize our management team to achieve these goals. Our executive officers may earn annual incentive bonuses based on achievement of individual and corporate performance goals. Our compensation committee will determine the elements of individual executive performance goals, and the weight to be given to each, for our president and chief executive officer and our chairman and senior geologist. For all other executive officers, our president and chief executive officer will determine the elements of individual executive performance goals and the weight to be given to each, subject to the review and approval of our compensation committee.
Applicable performance goals will be based upon such factors as our financial, production and other operational targets, our share price performance, and changes in our financial position.
96
Table of Contents
Index to Financial Statements
Equity-Based Compensation. The third element in our total compensation plan will be equity-based compensation, which we expect primarily will be comprised of grants of restricted common stock. This element is intended to emphasize our commitment to our growth and the enhancement of stockholder value through, for example, improvements in operating results, resource base and share price increments, by linking the interests of our stockholders with the economic interests of our management. Since we are a newly-public company, we do not currently maintain a formal policy regarding the timing of equity grants in connection with the release of material, non-public information. We may develop such a policy in the future.
We expect that our compensation committee will propose and that our board of directors will approve a Long Term Incentive Plan, or LTIP, to take effect upon or shortly after consummation of this offering. The purpose of our LTIP will be to attract and retain the best available personnel for positions of substantial responsibility, to provide additional incentives to our employees, directors and consultants, and to align economically the interests of our stockholders with the interests of our management team. Our LTIP will provide for grants of incentive stock options qualified as such under U.S. federal income tax laws, stock options that do not qualify as incentive stock options, stock appreciation rights (“SARs”), restricted stock awards, restricted stock units, performance awards and other awards, including common stock awarded as a bonus.
We believe long-term incentive-based equity compensation is an important component of our overall compensation program because it:
| • | rewards the achievement of our long-term goals; |
| • | aligns our executives’ interests with the long-term interests of our stockholders; |
| • | encourages executive retention; and |
| • | conserves our cash resources. |
We anticipate that our compensation committee will have the authority to award incentive compensation under our LTIP to our named executive officers and others in such amounts and on such terms as our compensation committee determines appropriate in its discretion. In determining such awards, our compensation committee may review analysis provided by compensation consultants it determines to engage to determine the appropriate amount of equity to grant to our executive officers based on market data, while also taking into consideration our performance, individual performance and retention concerns. Our named executive officers and other employees will be entitled to participate in our LTIP subject to certain restrictions.
We do not expect that our LTIP will be subject to the Employee Retirement Income Security Act of 1974, as amended (“ERISA”). For a limited period of time following this offering, we anticipate that grants of options, SARs and restricted stock made pursuant to our LTIP will qualify for an exception to the deductibility limitations imposed by Section 162(m) of the Internal Revenue Code of 1986, as amended, assuming that certain requirements are met. We expect that during that limited period of time, awards under our LTIP will be exempt from the limitations on the deductibility of compensation that exceeds $1.0 million. See “—Accounting and Tax Considerations” below.
Our LTIP will have the following general features:
| • | eligibility for any individual who provides services to us, including non-employee directors and consultants, subject to any limitations provided for by our compensation committee; |
| • | administration by our compensation committee, except as otherwise provided for by the terms of our LTIP; |
| • | stock option grants to be issued with an exercise price not less than the fair market value per share as of the date of grant; |
97
Table of Contents
Index to Financial Statements
| • | SARs, each representing the right to receive an amount, which may be settled in cash or shares of our common stock, equal to the excess of the fair market value of one share of our common stock on the date of exercise over the grant price of the SAR (which grant price will not be less than the fair market value per share as of the date of grant); |
| • | restricted stock awards granting shares of common stock subject to a risk of forfeiture, restrictions on transferability and any other restrictions imposed by the compensation committee in its discretion; |
| • | restricted stock units consisting of rights to receive common stock, cash or a combination of both at the end of a specified period; |
| • | authority granted to the compensation committee to designate certain awards under our LTIP as “performance awards,” the grant, exercise or settlement of which is subject to the attainment of one or more performance goals; and |
| • | other awards related to common stock, subject to applicable legal limitations and the terms of our LTIP and its purposes. |
Other Employee Benefits. We expect that our named executive officers will be eligible for the same health, welfare and other employee benefits available to our employees generally, including medical and dental insurance, short and long-term disability insurance and our qualified retirement plans. We also plan to sponsor a tax-qualified retirement plan in accordance with the provisions of Section 401(a) and 401(k) of the Code.
Perquisites and Other Personal Benefits
We do not expect that our executives will be entitled to significant perquisites or other personal benefits not generally offered to our other employees.
Stock Ownership Guidelines
Stock ownership guidelines have not been implemented for our named executive officers or directors. We will continue to periodically review best practices and reevaluate our position with respect to stock ownership guidelines in the future.
Advisory Stockholder Votes on Executive Compensation
Because we are a new company, we have not yet submitted our executive compensation practices to our stockholders for an advisory vote. We will do so at our first annual meeting of stockholders, and we expect the compensation committee of our board of directors will consider the results of any such advisory vote by our stockholders on our executive compensation programs and practices in making future decisions regarding our compensation and compensation philosophies.
Accounting and Tax Considerations
Section 162(m) of the Code. Generally, Section 162(m) of the Code disallows a tax deduction to any publicly-held corporation for individual compensation in excess of $1.0 million paid in any taxable year to any of its chief executive officer or three other highest paid named executive officers, other than its chief financial officer, unless the compensation meets the requirements for the performance-based compensation exception or the compensation qualifies for the limited transitional exception for new public companies described below. As we are not currently publicly traded, we have not previously taken the deductibility limit imposed by Section 162(m) of the Code into consideration in setting compensation.
Certain exceptions to the deductibility limitation apply for a limited period of time in the case of companies that become publicly-traded through an initial public offering, assuming certain conditions are satisfied. We
98
Table of Contents
Index to Financial Statements
expect that our employment agreements and options, SARs and restricted stock granted pursuant to the LTIP will fit within that exception; however, we reserve the right to use our judgment to authorize compensation payments that are not exempt from the deduction limitation in Section 162(m) of the Code when we believe that such payments are appropriate and in the best interest of our stockholders, after taking into consideration changing business conditions or the executive’s individual performance and/or changes in specific job duties and responsibilities.
Section 409A of the Code. Section 409A of the Code imposes restrictions on non qualified deferred compensation plan. Failure to satisfy these requirements of Section 409A of the Code can expose employees and other service providers to immediate taxation, a 20% penalty tax and interest on their vested compensation under such plans. Accordingly, as a general matter, it is our intention to design and administer our compensation and benefits plans and arrangements for all of our employees and other service providers, including our named executive officers, so that they either are exempt from, or satisfy the requirements of, Section 409A of the Code.
Section 280G of the Code. Section 280G of the Code disallows a tax deduction with respect to excess parachute payments to certain officers, stockholders or other highly compensated individuals providing personal services to a company that undergoes a change in control. In addition, Section 4999 of the Code imposes a 20% excise tax on the individual with respect to the excess parachute payment. In approving the compensation arrangements for our named executive officers in the future, our compensation committee will consider all elements of the cost to us of providing such compensation, including the potential impact of Section 280G of the Code. However, our compensation committee may, in its judgment, authorize compensation arrangements that could give rise to loss of deductibility under Section 280G of the Code and the imposition of excise taxes under Section 4999 of the Code when it believes that such arrangements are appropriate to attract and retain executive talent.
Our employment agreements with our officers, including our named executive officers, do not provide a “gross-up” or other reimbursement payment for any tax liability that such officer might owe as a result of the application of Sections 280G, 4999, or 409A of the Code or other applicable tax provision, and we have not agreed and are not otherwise obligated to provide any named executive officers with such a “gross-up” or other reimbursement.
Accounting Standards. Financial Accounting Standards Board (FASB) Accounting Standards Codification, Topic 718, “Compensation – Stock Compensation” (ASC Topic 718) requires us to recognize an expense for the fair value of equity-based compensation awards. Grants of restricted stock, stock options and other equity-based awards are accounted for under ASC Topic 718. Our compensation committee will consider the accounting implications of significant compensation decisions, especially in connection with decisions that relate to our equity incentive award plans and programs. As accounting standards change, we may revise certain programs to appropriately align accounting expenses of our equity awards with our overall executive compensation philosophy and objectives.
99
Table of Contents
Index to Financial Statements
Compensation of Named Executive Officers during 2011 from Inception
Summary Compensation Table
| Name and Principal Position |
Year | Salary ($) | Bonus ($)(1) |
Stock Awards ($)(2) |
Total ($) |
|||||||||||||||||||
| Inception through September 30, 2011 |
Annualized Rate |
|||||||||||||||||||||||
| Kristian B. Kos Chief Executive Officer and President |
2011 | 75,000 | 360,000 | — | ||||||||||||||||||||
| Richard D. Finley Chief Financial Officer |
2011 | 40,000 | 192,000 | — | ||||||||||||||||||||
| David J. Chernicky Senior Geologist |
2011 | 75,000 | 360,000 | — | ||||||||||||||||||||
| V. Bruce Thompson General Counsel |
2011 | 40,000 | 192,000 | — | ||||||||||||||||||||
| Carol T. Bryant Senior Engineer (3) |
2011 | 30,000 | 180,000 | — | — | 7,500 | ||||||||||||||||||
| (1) | The amount of bonus earned for 2011 is not yet calculable. We expect to determine the amounts of bonuses, if any, following the conclusion of calendar year 2011. |
| (2) | The amount set forth for each stock award is the aggregate grant date fair value of such award, computed in accordance with FASB ASC Topic 718. |
| (3) | We may grant restricted stock to Ms. Bryant during the balance of calendar year 2011. |
Equity Compensation Plan Information
The following table represents the securities authorized for issuance under our equity compensation plans as of , 2011.
| Plan category |
Number of securities to be issued upon exercise of outstanding options, warrants and rights |
Weighted-average exercise price of outstanding options, warrants and rights |
Number of securities remaining available for future issuance under equity compensation plans |
|||||||||
| Equity compensation plans approved by security holders |
— | — | (1) | |||||||||
| Equity compensation plans not approved by security holders |
— | — | — | |||||||||
| (1) | Represents the number of shares of our common stock available for issuance under our LTIP as of the date of this prospectus. |
Grants of Plan-Based Awards
| Name |
Grant Date | All Other Stock Awards: Number of Shares of Stock (#)(1) |
Grant Date Fair Value of Stock Awards ($)(2) |
|||||||||
| Kristian B. Kos |
August 18, 2011 | 2,300,000 | $ | |||||||||
| Richard D. Finley |
August 18, 2011 | 200,000 | $ | |||||||||
| David J. Chernicky |
August 18, 2011 | 200,000 | $ | |||||||||
| V. Bruce Thompson |
August 18, 2011 | 200,000 | $ | |||||||||
| (1) | Of the 2,300,000 shares of restricted common stock granted to Mr. Kos, 900,000 shares will vest upon completion of this offering, and the remaining 1,400,000 shares will vest in equal installments of 700,000 shares upon the first and second |
100
Table of Contents
Index to Financial Statements
| anniversary of the date of grant provided that Mr. Kos remains employed by us on the applicable vesting dates, subject to limited exceptions. Of the 200,000 shares of restricted common stock granted to each of Messrs. Finley, Chernicky and Thompson, 100,000 shares will vest upon completion of this offering, and the remaining 100,000 shares will vest upon the first anniversary of the date of grant provided that each executive remains employed on each of the applicable vesting dates, subject to limited exceptions. |
| (2) | Amounts reflect the full grant date fair value of restricted stock awards granted during 2011 but prior to the date of this prospectus, computed in accordance with ASC Topic 718. |
Narrative Explanation of Summary Compensation and Grants of Plan-Based Awards Tables
Because we did not yet exist as a company in 2010, we paid no compensation to our named executive officers during the three year period ending ended December 31, 2010. We have elected to set forth the compensation actually paid to our named executive officers from the inception of our company on July 12, 2011 through September 30, 2011, as well as the annual rate of compensation payable pursuant to the current terms of employment of each of our named executive officers. See “Compensation Discussion and Analysis—Compensation of Named Executive Officers,” above. We expect to implement additional executive compensation programs for our named executive officers as described above under “Compensation Discussion and Analysis,” possibly including additional programs with respect to calendar year 2011.
Outstanding Equity Awards as of September 30, 2011
| Name |
Stock Awards | |||||||
| Number of Shares of Stock That Have Not Vested (#)(1) |
Market Value of Shares of Stock That Have Not Vested ($)(2) |
|||||||
| Kristian B. Kos |
2,300,000 | $ | ||||||
| Richard D. Finley |
200,000 | $ | ||||||
| David J. Chernicky |
200,000 | $ | ||||||
| V. Bruce Thompson |
200,000 | $ | ||||||
| (1) | The 2,300,000 shares of unvested restricted stock held by Mr. Kos will vest in installments of 700,000 shares on August 18, 2012, and August 18, 2013, and an installment of 900,000 shares on the date of completion of this offering, provided that Mr. Kos remains employed by us on the applicable vesting dates subject to limited exceptions. The 200,000 shares of unvested restricted common stock held by each of Messrs. Finley, Chernicky and Thompson will vest in installments of 100,000 shares on August 18, 2012, and installments of 100,000 shares on the date of completion of this offering, provided that each executive remains employed on each of the applicable vesting dates subject to limited exceptions. |
| (2) | Computed using an estimated price per share of our common stock of $ , the midpoint of the expected price range for this offering set forth on the cover page of this prospectus. |
Potential Payments upon Termination or Change in Control
The table below discloses a hypothetical amount of compensation and/or benefits due to the named executive officers in the event of their termination of employment. None of the named executive officers is entitled to any severance payment following termination for any reason at this time. The amounts disclosed assume such termination was effective as of , 2011, and constitute estimates of the amounts that would be paid to the named executive officers upon termination of their employment. The actual amounts to be paid are dependent on various factors, which may or may not exist at the time a named executive officer is actually terminated. Therefore, such amounts and disclosures should be considered “forward looking statements.” We do not presently have in place any arrangements that would require payments to our named executive officers upon a change in control, although the compensation committee of our board of directors may elect to implement such arrangements in the future.
101
Table of Contents
Index to Financial Statements
| Name |
Payment | Reason for Termination | ||||||||||
| For Cause or Resignation | Without Cause or upon Death or Disability |
|||||||||||
| Kristian B. Kos |
Stock Award | (1) | — | $ | ||||||||
| Richard D. Finley |
Stock Award | (1) | — | $ | ||||||||
| David J. Chernicky |
Stock Award | (1) | — | $ | ||||||||
| V. Bruce Thompson |
Stock Award | (1) | — | $ | ||||||||
| (1) | Upon termination of employment for cause or upon the named executive officer’s resignation, all unvested shares of restricted stock are forfeited. Upon termination by us without cause, death or permanent disability, all unvested shares of restricted stock are automatically vested. The value of such unvested shares that would vest upon such event has been computed using an estimated price per share of our common stock of $ , the midpoint of the expected price range for this offering set forth on the cover page of this prospectus. |
Pension Benefits
We do not yet have any plan that provides for retirement benefits. We expect to sponsor a qualified tax-deferred savings plan in accordance with the provisions of Section 401(k) of the Internal Revenue Code of 1986, as amended.
Non-Qualified Deferred Compensation
We do not presently have any plan that provides for the deferral of compensation on a basis that is not tax qualified.
Transactions with Affiliates of Our Named Executive Officers
In connection with the transactions pursuant to which we acquired our initial assets, we paid to Scintilla, an entity controlled by David J. Chernicky, our chairman and senior geologist, a total of $60.0 million in cash and issued an aggregate of 20.0 million shares of our common stock (which shares Scintilla promptly transferred to the David J. Chernicky Trust) in exchange for the Scintilla Assets. In addition, as a part of such transactions, we also issued 360,000 shares of our common stock to Deylau, LLC an entity owned and managed by Kristian B. Kos, our president and chief executive officer and one of our directors, in exchange for the portion of the Other Contributed Assets contributed to us by that entity. These transactions were not intended to compensate Messrs. Chernicky or Kos for their services as named executive officers but rather were part of the broader transactions pursuant to which we acquired the Acquired Assets. In addition, on July 15, 2011, the company received an unsecured loan in the amount of $0.4 million, bearing no interest and due on demand from Mr. Chernicky, which was repaid in full on August 18, 2011. See “Certain Relationships and Related Party Transactions” in this prospectus.
Compensation of Non-Employee Directors
We do not presently pay cash compensation to our non-employee directors for their services as directors or members of committees of the board of directors. Following the consummation of this offering, we expect to implement an annual compensation package for our initial non-employee directors valued at approximately $100,000, of which approximately 25% would be paid in the form of an annual cash retainer and the remaining 75% would be paid in a grant of restricted common stock. Of the grant of restricted stock, we currently expect that 40% of the shares made subject to such grant would vest immediately, with the remaining 60% of such shares vesting in three equal installments on the first, second and third anniversaries of the date of grant.
We have reimbursed and will continue to reimburse our non-employee directors for their travel, lodging and other reasonable expenses incurred in attending meetings of our board of directors and committees of the board of directors.
102
Table of Contents
Index to Financial Statements
Executive Compensation Risk
We have determined that risks arising from our compensation policies and practices are not reasonably likely to have a material adverse effect on us. We do not believe that our current or proposed compensation policies and practices encourage excessive or unnecessary risk-taking.
Indemnification
Our bylaws provide indemnification rights to our directors and officers and permit us to purchase insurance on behalf of any officer, director, employee or other agent for any liability arising out of that person’s actions as our officer, director, employee or agent, regardless of whether Delaware law would permit indemnification. After completion of this offering, we will evaluate our existing director and officer liability insurance coverage and make such adjustments as we deem appropriate. We believe that the limitation of liability provision in our certificate of incorporation and our indemnity obligations will facilitate our ability to continue to attract and retain qualified individuals to serve as our directors and officers.
103
Table of Contents
Index to Financial Statements
CERTAIN RELATIONSHIPS AND RELATED PARTY TRANSACTIONS
Related Party Transactions
Our acquisition of the Acquired Assets involved various related parties. In negotiating the agreements entered into in connection with the contribution of the Acquired Assets, we did not have any independent directors acting for us; our directors at the time were directly or indirectly related to one or more of the contributing parties. As such, we did not have an audit committee comprised solely of independent directors available to review all of the material terms of these transactions and approve them pursuant to the related party transactions policy that we expect to adopt following the completion of this offering, as described below in “—Procedures for Review and Approval of Related Party Transactions.” However, based upon due diligence conducted by us and our advisors and the information provided to us regarding the Acquired Assets (including financial information, historical production information, and various projections), our board of directors has concluded that the terms by which we acquired the Acquired Assets were fair to us and our stockholders, were in our best interests and were no less favorable than those we would have received from unaffiliated third parties in similar circumstances. The following describes our transactions and relationships with related parties:
Scintilla, LLC – Scintilla, LLC is an Oklahoma limited liability company that contributed the Golden Lane Assets and approximately 83% of the Luther Assets, which collectively comprise a significant majority of the Acquired Assets. Scintilla is owned and controlled by the David J. Chernicky Trust, of which Mr. Chernicky, our chairman, is trustee and current beneficiary. Scintilla owned a portion of the Acquired Assets from 2002 until they were conveyed to us in exchange for 20.0 million shares of our common stock and $60.0 million in cash. For a discussion regarding how we determined the value of the consideration we delivered to Scintilla for these assets, see “Business—Material Definitive Agreements—Contribution Agreements and Related Transactions.” As part of our growth strategy, and pursuant to our right of first refusal with Scintilla, we will likely attempt to acquire further oil and natural gas assets and properties from Scintilla.
Scintilla, its affiliates, and certain employees of its affiliates retained various interests in oil and natural gas properties in the Hunton formation. Additionally, Scintilla retained its interests in formations above and below the Hunton formation, including but not limited to the Arbuckle, Wilcox, Mississipian, and Cleveland formations.
New Dominion, LLC – New Dominion, LLC is an Oklahoma limited liability company that serves as the operator for various oil and natural gas interests in east-central Oklahoma, including the Acquired Assets. New Dominion is owned and controlled by our chairman David J. Chernicky. Kristian B. Kos (our president, chief executive officer and a director) served as a consultant for New Dominion from May 2010 through July 2011 and received compensation of $20,000 per month from New Dominion for his services rendered.
New Dominion is expected to continue to operate the Acquired Assets, and as our contract operator, we expect it and its principals will further explore and identify oil and natural gas projects in which we may exercise our right to participate and/or seek to acquire. We have entered into an agreement with New Dominion and Scintilla giving us a 25-year right of first refusal to acquire up to 90% of New Dominion and Scintilla’s combined ownership interest in oil and gas projects determined to have proved reserves. Under this agreement, we will negotiate the price we will pay to New Dominion and Scintilla for any such interest we elect to acquire. If we are unable to agree on a price, the matter will be referred to an independent appraiser, whose determination of the fair value of the subject properties will be binding on New Dominion, Scintilla and us.
Pursuant to both the Golden Lane Participation Agreement and the Luther JOA, our ownership of the Acquired Assets entitles us to access our contract operator’s facilities used in connection with operating the assets, including all related infrastructure. We will have access to this infrastructure on the same terms and conditions as the other working interest holders; however, we believe that these terms and conditions are favorable to us when compared to general market conditions and are an integral part of our business plan, since
104
Table of Contents
Index to Financial Statements
this relationship will help us keep our operating costs low. The Golden Lane Participation Agreement and the Luther JOA require us to contribute capital for drilling and to pay additional expenses. For information relating to New Dominion’s compensation as our contract operator, our obligations to pay our share of expenses associated with the operation of the Acquired Assets and other terms of our agreements with New Dominion, see “Business—Material Definitive Agreements—Golden Lane Participation Agreement and Luther JOA.”
Deylau, LLC – Deylau, LLC is owned by our president, chief executive officer and one of our directors, Kristian B. Kos. Deylau was a party to a contribution agreement and with us, by which it contributed a three percent working interest in the Luther field, corresponding to approximately five percent of the Luther Assets, to us in exchange for 360,000 shares of our common stock. For a discussion regarding how we determined the number of shares of our common stock to issue to Deylau for these assets, see “Business—Material Definitive Agreements—Contribution Agreements and Related Transactions.” Deylau acquired this working interest in 2010 for approximately $0.6 million, representing Deylau’s proportionate share of the costs incurred under the joint operating agreement then in effect for the Luther field.
Other Related Parties – In performing its obligations, our contract operator utilizes certain service providers to perform work associated with the operation and maintenance of oil and natural gas wells and related infrastructure that we access. Certain affiliates of our contract operator may have interests in certain of these service providers. However, none of these service providers provide services to our contract operator on an exclusive basis, and our contract operator believes that it obtains services from these vendors at commercially reasonable rates. Furthermore, the Golden Lane Participation Agreement and the Luther JOA both require our contract operator to obtain services from any related or affiliated service providers only if they are provided on competitive terms.
Registration Rights Agreement – On August 12, 2011, we entered into a Registration Rights Agreement with the contributing parties and the David J. Chernicky Trust, as the successor in interest of Scintilla. Subject to certain conditions, the Registration Rights Agreement requires us, at our expense, to use our reasonable efforts to register the resale of the shares of common stock issued to the contributing parties under the Contribution Agreements upon demand of one or more of the contributing parties no earlier than six months from the date of the Registration Rights Agreement, and no more than twice in total. We are also required to register these shares of common stock for resale in any registration statement we file on or after six months from the date of the Registration Rights Agreement. However, we are not obligated to take any action to register shares pursuant to the Registration Rights Agreement during the period starting with the date 60 days prior to our estimated date of filing, and ending on the date six months immediately following the effective date of, a registration statement relating to our securities as long as we are employing all reasonable efforts in good faith to cause such registration statement to become effective. All of the contributing parties and the David J. Chernicky Trust will be subject to lock-up agreements generally precluding their sale of shares of our common stock for 180 days from the date of this prospectus. See “Underwriting.”
Private Placement – On August 12, 2011, we completed a private placement of 157,500 shares of our common stock at a price of $10.00 per share, solely to accredited investors, in which we received proceeds of approximately $1.6 million. Certain of our officers, directors and other related parties purchased securities in this private placement.
Promoters – Because of their positions and involvement in our business organization and development, David J. Chernicky, our chairman and senior geologist, and Kristian B. Kos, our president, chief executive officer and a director, may be considered “promoters,” as defined in Rule 405 of the rules and regulations of the SEC. In connection with their employment with the company, Mr. Chernicky and Mr. Kos received grants of restricted stock and will receive additional compensation from the company. See “Executive Compensation and Other Information—Compensation Discussion and Analysis.” In addition, see above under “—Scintilla, LLC,” “—New Dominion, LLC” and “—Deylau, LLC,” for a discussion of the consideration received by such entities in
105
Table of Contents
Index to Financial Statements
exchange for the Acquired Assets. Such consideration may be attributable to Mr. Chernicky or Mr. Kos due to their respective ownership of these entities. On July 15, 2011, the company also received an unsecured loan in the amount of $0.4 million from Mr. Chernicky, which was paid by us on August 18, 2011.
Procedures for Review and Approval of Related Party Transactions
We use the term “related party transaction” to refer to a transaction, arrangement or relationship in which we were, are or will be a participant, the amount of which involved exceeds $120,000, and in which any related person had, has or will have a direct or indirect material interest. We use the term “related person” to refer to:
| • | any person who is, or at any time during the applicable period was, one of our executive officers or one of our directors; |
| • | any person who is known by us to be the beneficial owner of more than 5.0% of our common stock; |
| • | any immediate family member of any of the foregoing persons, which means any child, stepchild, parent, stepparent, spouse, sibling, mother-in-law, father-in-law, son-in-law, daughter-in-law, brother-in-law or sister-in-law of a director, executive officer or a beneficial owner of more than 5.0% of our common stock, and any person (other than a tenant or employee) sharing the household of such director, executive officer or beneficial owner of more than 5.0% of our common stock; and |
| • | any firm, corporation or other entity in which any of the foregoing persons is a partner or principal or in a similar position or in which such person has a 10.0% or greater beneficial ownership interest. |
We expect that our board of directors will adopt a written related party transactions policy following the completion of this offering. Pursuant to this policy, our audit committee will review all material facts of all related party transactions and either approve or disapprove entry into any related party transaction, subject to certain limited exceptions. In determining whether to approve or disapprove entry into a related party transaction, our audit committee will take into account, among other factors, the following: (1) whether the related party transaction is on terms no less favorable than terms generally available to an unaffiliated third party under the same or similar circumstances and (2) the extent of the related person’s interest in the transaction. Further, the policy will require that all related party transactions required to be disclosed in our filings with the SEC be so disclosed in accordance with applicable laws, rules and regulations.
106
Table of Contents
Index to Financial Statements
The following table sets forth information with respect to the beneficial ownership of our common stock as of , 2011 as well as on a fully diluted basis immediately after the completion of this offering, by the following persons:
| • | each stockholder known by us to be the beneficial owner of more than 5% of our outstanding shares of common stock; |
| • | each of our named executive officers; |
| • | each of our directors and our prospective directors; and |
| • | all of our directors and executive officers as a group. |
All information with respect to beneficial ownership assumes an offering price of $ per share of common stock (the midpoint of the range set forth on the cover page of this prospectus). Except as otherwise indicated, the persons listed below have sole voting and investment power with respect to all shares of our common stock beneficially owned by them, except to the extent this power may be shared with a spouse. The information set forth below does not reflect any shares of our common stock that any of the persons named below may purchase pursuant to the directed share program described elsewhere in this prospectus and assumes that none of our executive officers elect to have us withhold shares of restricted common stock that vest upon this offering in satisfaction of tax withholding obligations as described elsewhere in this prospectus. See “Underwriting” and “Use of Proceeds,” respectively.
| Shares Beneficially Owned Prior to the Offering |
Shares Beneficially Owned After the Offering | |||||||||||||
| Name of Beneficial Owner |
Common Stock |
Percentage | Common Stock |
Percentage | ||||||||||
| David J. Chernicky (1) |
20,200,000 | 83.3 | % | 20,200,000 | ||||||||||
| Kristian B. Kos (2) |
2,660,000 | 11.0 | % | 2,660,000 | ||||||||||
| Richard D. Finley (3) |
203,400 | * | 203,400 | |||||||||||
| V. Bruce Thompson (4) |
200,000 | * | 200,000 | |||||||||||
| Kevin A. Easley (5) |
2,500 | * | 2,500 | |||||||||||
| Carol T. Bryant |
— | — | — | |||||||||||
| Directors and executive officers as a group (6 persons) (6) |
23,265,900 | 95.9 | % | 23,265,900 | ||||||||||
* - less than 1%.
| (1) | Includes (a) 20,000,000 shares owned by the David J. Chernicky Trust, of which David J. Chernicky is the trustee, acquired pursuant to the contribution of the Scintilla Assets and (b) 200,000 shares granted as compensation, of which 100,000 shares will vest upon completion of this offering and 100,000 shares are subject to vesting following this offering. The address for the David J. Chernicky Trust is 1307 S. Boulder Avenue, Tulsa, Oklahoma 74119. |
| (2) | Includes (a) 360,000 shares owned by Deylau, LLC, of which Mr. Kos is the manager and the owner and (b) 2,300,000 shares granted as compensation, of which 900,000 shares will vest upon completion of this offering and 1,400,000 shares are subject to vesting following this offering. |
| (3) | Includes (a) 200,000 shares granted as compensation, of which 100,000 shares will vest upon completion of this offering and 100,000 shares are subject to vesting following this offering and (b) 3,400 shares acquired on August 12, 2011 in our private placement. |
| (4) | Includes 200,000 shares granted as compensation, of which 100,000 shares will vest upon completion of this offering and 100,000 shares are subject to vesting following this offering. |
| (5) | Comprised of common stock acquired on August 12, 2011 in our private placement. |
| (6) | The address for our directors and executive officers is 914 North Broadway, Suite 230, Oklahoma City, Oklahoma 73102. |
107
Table of Contents
Index to Financial Statements
General
The following descriptions are summaries of the material terms included in our certificate of incorporation and bylaws. This summary is qualified by reference to our certificate of incorporation and bylaws, the forms of which are filed as exhibits to the registration statement of which this prospectus forms a part, and by the provisions of applicable law.
We are authorized to issue 180,000,000 shares of common stock, par value $0.001 per share, and 20,000,000 shares of preferred stock, par value $0.001 per share. Upon completion of this offering, there will be shares of our sole class of common stock issued and outstanding and no shares of our preferred stock outstanding.
We intend to apply to list shares of our common stock on the NYSE under the symbol “NSE.”
Common Stock
Voting
Holders of shares of our common stock will be entitled to one vote for each share held of record on each matter submitted to a vote of stockholders, including the election of directors, and will not have any cumulative voting rights with regard to the election of directors.
Dividends
Holders of shares of our common stock will be entitled to receive ratably such dividends as our board of directors from time to time may declare out of funds legally available therefor.
Liquidation Rights
In the event of any liquidation, dissolution or winding-up of our affairs, after payment of all of our debts and liabilities and the satisfaction of any liquidation preference applicable to any shares of our then outstanding preferred stock, the holders of common stock will be entitled to share ratably in the distribution of any of our remaining assets.
Other Matters
Holders of shares of our common stock will not have any conversion, preemptive or other subscription rights and there are no redemption rights or sinking fund provisions with respect to the common stock.
Our Preferred Stock
Our board of directors has the so-called “blank check” authority to issue preferred stock in one or more classes or series, up to the total number of our authorized shares of preferred stock, and to fix the designations, powers, preferences and rights, and the qualifications, limitations or restrictions thereof, including dividend rights, dividend rates, conversion rights, voting rights, terms of redemption, redemption prices, liquidation preferences and the number of shares constituting any class or series, without further vote or action by the stockholders. The issuance of preferred stock may have the effect of delaying, deferring or preventing a change in control of us without further action by the stockholders and may adversely affect the voting, governance, liquidation and other rights of the holders of common stock.
108
Table of Contents
Index to Financial Statements
Transfer Agent
Our transfer agent and registrar will be Computershare Trust Company, N.A.
Anti-Takeover Effects of Delaware Laws and Our Charter and Bylaws Provisions
Our certificate of incorporation and bylaws include anti-takeover provisions that may delay, deter, or prevent a tender offer or takeover attempt that a stockholder might consider to be in its best interests, including attempts that might result in a premium being paid over the market price for the shares held by stockholders.
Such provisions could discourage potential acquisition proposals and could delay or prevent a change of control. These provisions are intended to enhance the likelihood of continuity and stability in the composition of the board of directors through the classified board structure and in the policies formulated by the board of directors and to discourage certain types of transactions that may involve an actual or threatened change of control. These provisions are also designed to reduce our vulnerability to an unsolicited acquisition proposal, as well as to discourage certain tactics that may be used in proxy fights. However, such provisions could have the effect of discouraging others from making tender offers for our shares and, as a consequence, they also may inhibit fluctuations in the market price of our common stock that could result from actual or rumored takeover attempts. Such provisions also may have the effect of preventing changes in our management.
Business Combinations. After this offering, we will be subject to the provisions of Section 203 of the Delaware General Corporation Law. In general, Section 203 prohibits a publicly held Delaware corporation from engaging in a “business combination” with an “interested stockholder” for a period of three years after the date of the transaction in which the person became an interested stockholder, unless the business combination is approved in a prescribed manner.
Section 203 defines a “business combination” as a merger, asset sale or other transaction resulting in a financial benefit to the interested stockholders. Section 203 defines an “interested stockholder” as a person who, together with affiliates and associates, owns, or, in some cases, within three years prior, did own, 15% or more of the corporation’s voting stock. Under Section 203, a business combination between us and an interested stockholder is prohibited unless:
| • | our board of directors approved either the business combination or the transaction that resulted in the stockholder becoming an interested stockholder prior to the date the person attained the status; |
| • | upon consummation of the transaction that resulted in the stockholder becoming an interested stockholder, the interested stockholder owned at least 85% of our voting stock outstanding at the time the transaction commenced, excluding, for purposes of determining the number of shares outstanding, shares owned by persons who are directors and also officers and issued employee stock plans, under which employee participants do not have the right to determine confidentially whether shares held under the plan will be tendered in a tender or exchange offer; or |
| • | the business combination is approved by our board of directors on or subsequent to the date the person became an interested stockholder and authorized at an annual or special meeting of the stockholders by the affirmative vote of the holders of at least 66 2/3% of the outstanding voting stock that is not owned by the interested stockholder. |
This provision has an anti-takeover effect with respect to transactions not approved in advance by our board of directors, including discouraging takeover attempts that might result in a premium over the market price for the shares of our common stock. With approval of our stockholders, we could amend our certificate of incorporation in the future to elect not to be governed by the anti-takeover law.
109
Table of Contents
Index to Financial Statements
SHARES ELIGIBLE FOR FUTURE SALE
Prior to this offering, there has been no public market for our common stock. Future sales of our common stock in the public market, or the availability of such shares for sale in the public market, could adversely affect market prices prevailing from time to time. As described below, only a limited number of shares will be available for sale shortly after this offering due to contractual and legal restrictions on resale. Nevertheless, sales of a substantial number of shares of our common stock in the public market after such restrictions lapse, or the perception that those sales may occur, could adversely affect the prevailing market price at such time and our ability to raise equity-related capital at a time and price we deem appropriate.
Sales of Restricted Shares
Upon the closing of this offering, we will have outstanding an aggregate of shares of common stock. All of the shares of common stock to be sold in this offering will be freely tradable without restriction or further registration under the Securities Act, unless the shares are held by any of our “affiliates” as such term is defined in Rule 144 of the Securities Act. All remaining shares of common stock held by existing stockholders will be deemed “restricted securities” as such term is defined under Rule 144. The restricted securities were issued and sold by us in private transactions and are eligible for public sale only if registered under the Securities Act or if they qualify for an exemption from registration under Rule 144 or Rule 701 under the Securities Act, both of which rules are summarized below.
As a result of the lock-up agreements described below and the provisions of Rule 144 and Rule 701 under the Securities Act, all of the shares of our common stock (excluding the shares to be sold in this offering) will be available for sale in the public market upon the expiration of the lock-up agreements, beginning 180 days after the date of this prospectus (subject to extension) and when permitted under Rule 144 or Rule 701.
Lock-up Agreements
We, all of our directors, executive officers, and stockholders have agreed not to sell or otherwise transfer or dispose of any common stock for a period of 180 days from the date of this prospectus, subject to certain exceptions and extensions. See “Underwriting” for a description of these lock-up provisions.
Rule 144
In general, under Rule 144 as currently in effect, once we have been a reporting company subject to the reporting requirements of Section 13 or 15(d) of the Exchange Act for 90 days, a person (or persons whose shares are aggregated) who is not deemed to have been an affiliate of us at any time during the three months preceding a sale, and who has beneficially owned restricted securities within the meaning of Rule 144 for at least six months (including any period of consecutive ownership of preceding non-affiliated holders) would be entitled to sell those shares, subject only to the availability of current public information about us. A non-affiliated person who has beneficially owned restricted securities within the meaning of Rule 144 for at least one year would be entitled to sell those shares without regard to the provisions of Rule 144.
Once we have been a reporting company subject to the reporting requirements of Section 13 or 15(d) of the Exchange Act for 90 days, a person (or persons whose shares are aggregated) who is deemed to be an affiliate of ours and who has beneficially owned restricted securities within the meaning of Rule 144 for at least six months would be entitled to sell within any three-month period a number of shares that does not exceed the greater of one percent of the then outstanding shares of our common stock or the average weekly trading volume of our common stock reported through the NYSE during the four calendar weeks preceding the filing of notice of the sale. Such sales are also subject to certain manner of sale provisions, notice requirements and the availability of current public information about us.
110
Table of Contents
Index to Financial Statements
Rule 701
Employees, directors, officers, consultants or advisors who have purchased shares from us in connection with a compensatory stock or option plan or other written compensatory agreement in accordance with Rule 701 before the effective date of the registration statement are entitled to sell such shares 90 days after the effective date of the registration statement in reliance on Rule 144 without having to comply with the holding period requirement of Rule 144 and, in the case of non-affiliates, without having to comply with the public information, volume limitation or notice filing provisions of Rule 144.
Stock Issued under Employee Plans
We intend to file a registration statement on Form S-8 under the Securities Act to register stock issuable under our new Long-Term Incentive Plan. This registration statement is expected to be filed following the effective date of the registration statement of which this prospectus is a part and will be effective upon filing. Accordingly, shares registered under such registration statement will be available for sale in the open market following the effective date, unless such shares are subject to vesting restrictions with us, Rule 144 restrictions applicable to our affiliates or the lock-up restrictions described above.
Registration Rights
We have entered into a registration rights agreement with the certain of our stockholders, which will require us to file and effect the registration of certain shares of our common stock held by such parties in certain circumstances. See “Certain Relationships and Related Party Transactions—Registration Rights Agreement.”
111
Table of Contents
Index to Financial Statements
MATERIAL U.S. FEDERAL INCOME TAX
CONSIDERATIONS TO NON-U.S. HOLDERS
The following is a general discussion of the material U.S. federal income tax consequences of the acquisition, ownership and disposition of our common stock to a non-U.S. holder. For the purpose of this discussion, a non-U.S. holder is any beneficial owner of our common stock that is not for U.S. federal income tax purposes any of the following:
| • | an individual citizen or resident of the U.S.; |
| • | a corporation (or other entity treated as a corporation for U.S. federal income tax purposes) created or organized in the U.S. or under the laws of the U.S. or any state or the District of Columbia; |
| • | a partnership (or other entity treated as a partnership or other pass-through entity for U.S. federal income tax purposes); |
| • | an estate whose income is subject to U.S. federal income tax regardless of its source; or |
| • | a trust (x) whose administration is subject to the primary supervision of a U.S. court and which has one or more U.S. persons who have the authority to control all substantial decisions of the trust or (y) which has made a valid election to be treated as a U.S. person. |
If a partnership (or an entity treated as a partnership for U.S. federal income tax purposes) holds our common stock, the tax treatment of a partner in the partnership will generally depend on the status of the partner and upon the activities of the partnership. Accordingly, we urge partnerships that hold our common stock and partners in such partnerships to consult their tax advisors.
This discussion assumes that a non-U.S. holder will hold our common stock issued pursuant to the offering as a capital asset (generally, property held for investment). This discussion does not address all aspects of U.S. federal income taxation or any aspects of estate, gift, alternative minimum tax, state, local or non-U.S. taxation, nor does it consider any U.S. federal income tax considerations that may be relevant to non-U.S. holders that may be subject to special treatment under U.S. federal income tax laws, including, without limitation, U.S. expatriates, life insurance companies, tax-exempt or governmental organizations, dealers in securities or currency, banks or other financial institutions, investors whose functional currency is other than the U.S. dollar, registered investment companies, real estate investment trusts, “controlled foreign corporations,” passive foreign investment companies, persons who own, directly or indirectly, more than 5% of our common stock and investors that hold our common stock as part of a hedge, straddle or conversion transaction. Furthermore, the following discussion is based on current provisions of the Internal Revenue Code of 1986, as amended, and Treasury Regulations and administrative and judicial interpretations thereof, all as in effect on the date hereof, and all of which are subject to change, possibly with retroactive effect.
We urge each prospective investor to consult a tax advisor regarding the U.S. federal, state, local and non-U.S. income and other tax consequences of acquiring, holding and disposing of shares of our common stock.
Dividends
We have not paid any dividends on our common stock, and we do not plan to pay any dividends for the foreseeable future. However, if we do pay dividends on our common stock, those payments will constitute dividends for U.S. tax purposes to the extent paid from our current or accumulated earnings and profits, as determined under U.S. federal income tax principles. To the extent those dividends exceed our current and accumulated earnings and profits, the dividends will constitute a return of capital and will first reduce a holder’s adjusted tax basis in the common stock, but not below zero, and then will be treated as gain from the sale of the common stock; see “—Gain on Disposition of Common Stock.”
Any dividend (out of earnings and profits) paid to a non-U.S. holder of our common stock generally will be subject to U.S. withholding tax either at a rate of 30% of the gross amount of the dividend or such lower rate as
112
Table of Contents
Index to Financial Statements
may be specified by an applicable tax treaty. To receive the benefit of a reduced treaty rate, a non-U.S. holder must provide us with an Internal Revenue Service (“IRS”) Form W-8BEN or other appropriate version of IRS Form W-8 certifying qualification for the reduced rate.
Dividends received by a non-U.S. holder that are effectively connected with a U.S. trade or business conducted by the non-U.S. holder (and, if required by an applicable tax treaty, attributable to a permanent establishment or fixed tax base maintained by the non-U.S. holder in the United States) are exempt from such withholding tax. To obtain this exemption, the non-U.S. holder must provide us with an IRS Form W-8ECI properly certifying such exemption. Such effectively connected dividends, although not subject to withholding tax, will be subject to U.S. federal income tax on a net income basis at the same graduated rates generally applicable to U.S. persons, net of certain deductions and credits, subject to any applicable tax treaty providing otherwise. In addition to the income tax described above, dividends received by corporate non-U.S. holders that are effectively connected with a U.S. trade or business of the corporate non-U.S. holder may be subject to a branch profits tax at a rate of 30% or such lower rate as may be specified by an applicable tax treaty.
A non-U.S. holder of our common stock may obtain a refund of any excess amounts withheld if the non-U.S. holder is eligible for a reduced rate of United States withholding tax and an appropriate claim for refund is timely filed with the Internal Revenue Service or the IRS.
Gain on Disposition of Common Stock
A non-U.S. holder generally will not be subject to U.S. federal income tax on any gain realized upon the sale or other disposition of our common stock unless:
| • | the gain is effectively connected with a U.S. trade or business of the non-U.S. holder and, if required by an applicable tax treaty, is attributable to a permanent establishment or fixed base maintained by such non-U.S. holder in the United States; |
| • | the non-U.S. holder is an individual who is present in the United States for a period or periods aggregating 183 days or more during the calendar year in which the sale or disposition occurs and certain other conditions are met; or |
| • | we are or have been a “U.S. real property holding corporation” for U.S. federal income tax purposes during specified periods. |
Unless an applicable tax treaty provides otherwise, gain described in the first bullet point above will be subject to U.S. federal income tax on net income basis at the same graduated rates generally applicable to U.S. persons. Corporate non-U.S. holders also may be subject to a branch profits tax equal to 30% (or such lower rate as may be specified by an applicable tax treaty) of its earnings and profits that are effectively connected with a U.S. trade or business.
Gain described in the second bullet point above (which may be offset by U.S. source capital losses, provided that the non-U.S. holder has timely filed U.S. federal income tax returns with respect to such losses) will be subject to a flat 30% U.S. federal income tax (or such lower rate as may be specified by an applicable tax treaty).
Non-U.S. holders should consult any applicable income tax treaties that may provide for different rules.
We believe that we currently are, and expect to remain for the foreseeable future, a “U.S. real property holding corporation.” However, so long as our common stock is “regularly traded on an established securities market,” a non-U.S. holder will be subject to U.S. federal net income tax on a disposition of our common stock only if the non-U.S. holder actually or constructively holds, or held at any time during the shorter of the five-year period preceding the date of disposition or the holder’s holding period, more than 5% of our common stock. If our common stock is not considered to be so traded, all non-U.S. holders would be subject to U.S. federal net income tax on disposition of our common stock, and a 10% withholding would apply to the gross proceeds from the sale of our common stock by a non-U.S. holder.
113
Table of Contents
Index to Financial Statements
Backup Withholding and Information Reporting
Generally, we must report annually to the IRS the amount of dividends paid to each non-U.S. holder, the name and address of the recipient, and the amount, if any, of tax withheld with respect to those dividends. A similar report is sent to each non-U.S. holder. These information reporting requirements apply even if withholding was not required. Pursuant to tax treaties or other agreements, the IRS may make its reports available to tax authorities in the recipient’s country of residence.
Payments of dividends to a non-U.S. holder may be subject to backup withholding (at the applicable rate) unless the non-U.S. holder establishes an exemption, for example, by properly certifying its non-U.S. status on an IRS Form W-8BEN or another appropriate version of IRS Form W-8. Notwithstanding the foregoing, backup withholding may apply if either we or our paying agent has actual knowledge, or reason to know, that the beneficial owner is a U.S. person that is not an exempt recipient.
Payments of the proceeds from sale or other disposition by a non-U.S. holder of our common stock effected outside the U.S. by or through a foreign office of a broker generally will not be subject to information reporting or backup withholding. However, information reporting (but not backup withholding) will apply to those payments if the broker does not have documentary evidence that the holder is a non-U.S. holder, an exemption is not otherwise established, and the broker has certain relationships with the United States.
Payments of the proceeds from a sale or other disposition by a non-U.S. holder of our common stock effected by or through a U.S. office of a broker generally will be subject to information reporting and backup withholding (at the applicable rate) unless the non-U.S. holder establishes an exemption, for example, by properly certifying its non-U.S. status on an IRS Form W-8BEN or another appropriate version of IRS Form W-8. Notwithstanding the foregoing, information reporting and backup withholding may apply if the broker has actual knowledge, or reason to know, that the holder is a U.S. person that is not an exempt recipient.
Backup withholding is not an additional tax. Rather, the U.S. income tax liability of persons subject to backup withholding will be reduced by the amount of tax withheld. If withholding results in an overpayment of taxes, a refund may be obtained, provided that the required information is timely furnished to the IRS.
Legislation Affecting Common Stock Held Through Foreign Accounts
On March 18, 2010, the Hiring Incentives to Restore Employment Act (the “HIRE Act”) became law, which may result in materially different withholding and information reporting requirements than those described above, for payments made after December 31, 2012. The HIRE Act limits the ability of non-U.S. holders who hold our common stock through a foreign financial institution to claim relief from U.S. withholding tax in respect of dividends paid on our common stock unless the foreign financial institution agrees, among other things, to annually report certain information with respect to “United States accounts” maintained by such institution. The HIRE Act also limits the ability of certain non-financial foreign entities to claim relief from U.S. withholding tax in respect of dividends paid by us to such entities unless (1) those entities meet certain certification requirements; (2) the withholding agent does not know or have reason to know that any such information provided is incorrect and (3) the withholding agent reports the information provided to the IRS. The HIRE Act provisions will have a similar effect with respect to dispositions of our common stock after December 31, 2012. A non-U.S. holder generally would be permitted to claim a refund to the extent any tax withheld exceeded the holder’s actual tax liability. Non-U.S. holders are encouraged to consult with their tax advisers regarding the possible implication of the HIRE Act on their investment in respect of the common stock.
114
Table of Contents
Index to Financial Statements
BMO Capital Markets Corp. and KeyBanc Capital Markets Inc. are acting as the representatives of the underwriters. Subject to the terms and conditions stated in the underwriting agreement dated the date of this prospectus, each underwriter named below has agreed to purchase from us, and we have agreed to sell to such underwriter, the respective number of shares of common stock shown opposite its name below.
| Underwriter |
Number of Shares | |
| BMO Capital Markets Corp. |
||
| KeyBanc Capital Markets Inc. |
||
|
| ||
| Total |
||
|
|
The underwriting agreement provides that the obligations of the underwriters to purchase the shares included in this offering are subject to approval of legal matters by counsel and to other conditions. The underwriters are obligated to purchase all of the shares (other than those covered by the over-allotment option described below) if they purchase any of the shares.
The representatives have advised us that the underwriters propose to offer the shares directly to the public at the public offering price presented on the cover page of this prospectus and to selected dealers, who may include the underwriters, at the public offering price less a selling concession not in excess of $ per share. The underwriters may allow, and the selected dealers may reallow, a concession not in excess of $ per share to brokers and dealers. If all of the ordinary shares are not sold at the initial offering price, the underwriter may change the public offering price and the other selling terms. The representatives have advised us that the underwriters do not intend to confirm sales to any accounts over which they exercise discretionary authority.
We have granted to the underwriters an option to purchase up to an aggregate of shares of common stock, exercisable solely to cover over-allotments, if any, at the public offering price less the underwriting discounts and commissions shown on the cover page of this prospectus. The underwriters may exercise this option in whole or in part at any time until 30 days after the date of the underwriting agreement. To the extent the underwriters exercise this option, each underwriter will be committed, so long as the conditions of the underwriting agreement are satisfied, to purchase a number of additional shares proportionate to that underwriter’s initial commitment as indicated in the preceding table.
We, our directors, executive officers, and existing stockholders have agreed with the underwriters, subject to certain exceptions, not to dispose of or hedge any shares of common stock or securities convertible into or exchangeable for shares of common stock, subject to specified exceptions, during the period from the date of this prospectus continuing through the date 180 days after the date of this prospectus, except with the prior written consent of the representatives. See “Shares Eligible for Future Sale” for a discussion of certain transfer restrictions on existing holders of shares of our common stock. The representatives, in their sole discretion, may release any of the securities subject to these lock-up agreements at any time without notice.
The 180-day restricted period described in the preceding paragraph will be automatically extended if: (1) during the last 17 days of the 180-day restricted period we issue an earnings release or announce material news or a material event; or (2) prior to the expiration of the 180-day restricted period, we announce that we will release earnings results during the 16-day period following the last day of the 180-day period, in which case the restrictions described in the preceding paragraph will continue to apply until the expiration of the 18-day period beginning on the issuance of the earnings release or the announcement of the material news or material event.
115
Table of Contents
Index to Financial Statements
The following table summarizes the underwriting discounts and commissions that we will pay to the underwriters in connection with this offering. These amounts are shown assuming both no exercise and full exercise of the underwriters’ option to purchase additional shares of common stock.
| Per Share | Total | |||||||||||||||
| Without Over- Allotment |
With Over- Allotment |
Without Over- Allotment |
With Over- Allotment |
|||||||||||||
| Underwriting discounts and commissions |
$ | $ | $ | $ | ||||||||||||
| Expenses payable by us |
$ | $ | $ | $ | ||||||||||||
Prior to this offering, there has been no public market for our common stock. The initial public offering price will be negotiated among the representatives and us. In determining the initial public offering price of our common stock, the representatives will consider:
| • | prevailing market conditions; |
| • | our historical performance and capital structure; |
| • | estimates of our business potential and earnings prospects; |
| • | an overall assessment of our management; and |
| • | the consideration of these factors in relation to market valuation of companies in related businesses. |
We intend to apply to list our common stock on the NYSE under the symbol “NSE.”
The underwriters may engage in over-allotment transactions, stabilizing transactions, syndicate covering transactions, penalty bids or purchases and passive market making for the purposes of pegging, fixing or maintaining the price of the common stock, in accordance with Regulation M under the Exchange Act.
Over-allotment transactions involve sales by the underwriters of shares in excess of the number of shares the underwriters are obligated to purchase, which creates a syndicate short position. The short position may be either a covered short position or a naked short position. In a covered short position, the number of shares over-allotted by the underwriters is not greater than the number of shares that they may purchase in the over-allotment option. In a naked short position, the number of shares involved is greater than the number of shares in the over-allotment option. The underwriters may close out any short position by either exercising their over-allotment option and/or purchasing shares in the open market.
Stabilizing transactions permit bids to purchase the underlying security so long as the stabilizing bids do not exceed a specific maximum.
Syndicate covering transactions involve purchases of the common stock in the open market after the distribution has been completed to cover syndicate short positions. In determining the source of shares to close out the short position, the underwriters will consider, among other things, the price of shares available for purchase in the open market as compared to the price at which they may purchase shares through the over-allotment option. If the underwriters sell more shares than could be covered by the over-allotment option, thus creating a naked short position, the position can only be closed out by buying shares in the open market. A naked short position is more likely to be created if the underwriters are concerned that there could be downward pressure on the price of the shares in the open market after pricing that could adversely affect investors who purchase in the offering.
Penalty bids permit the representatives to reclaim a selling concession from a syndicate member when the common stock originally sold by the syndicate member is purchased in a stabilizing or syndicate covering transaction to cover syndicate short positions.
116
Table of Contents
Index to Financial Statements
In passive market making, market makers in the common stock who are underwriters or prospective underwriters may, subject to limitations, make bids for or purchase shares of our common stock until the time, if any, at which a stabilizing bid is made.
These stabilizing transactions, syndicate covering transactions, penalty bids and passive market making may have the effect of raising or maintaining the market price of our common stock or preventing or retarding a decline in the market price of our common stock. As a result, the price of our common stock may be higher than the price that might otherwise exist in the open market. These transactions may be effected on the NYSE or otherwise and, if commenced, may be discontinued at any time.
Neither we nor any of the underwriters make any representation or prediction as to the direction or magnitude of any effect that the transactions described above may have on the price of our common stock. In addition, neither we nor any of the underwriters make any representation that the representatives will engage in these stabilizing transactions or that any transaction, once commenced, will not be discontinued without notice.
At our request, the underwriters have reserved up to shares, or % of our common stock offered by this prospectus, for sale under a directed share program to our officers, directors, employees and certain other selected individuals, including individuals outside the United States. If any of our current directors or executive officers subject to lock-up agreements purchase these reserved shares, the shares will be restricted from sale under the lock-up agreements. We will determine the specific allocation of the shares to be offered under the directed share program in our sole discretion. The number of shares available for sale to the general public will be reduced to the extent these persons purchase the reserved shares. Shares committed to be purchased by directed share participants that are not so purchased will be reallocated for sale to the general public in the offering. All sales of shares under the directed share program will be made at the initial public offering price set forth on the cover page of this prospectus. All sales of shares under the directed share program will be made in accordance with local law and subject to any foreign exchange requirements.
Certain of the underwriters or their affiliates currently are owed balances under our credit facility. As described under “Use of Proceeds,” we intend to use a portion of the net proceeds from this offering to repay all outstanding indebtedness under our credit facility. Because BMO Capital Markets Corp. and its affiliates, and KeyBanc Capital Markets Inc. and its affiliates, will receive, in the aggregate, more than 5% of the net proceeds from this offering as a result of the repayment of such indebtedness, this offering is being made in compliance with FINRA Rule 5121. FINRA Rule 5121 requires that a “qualified independent underwriter” participate in the preparation of the registration statement of which this prospectus forms a part and exercise the usual standards of due diligence with respect thereto. has assumed the responsibilities of acting as the qualified independent underwriter in this offering. No underwriter having a conflict of interest under FINRA Rule 5121 will confirm sales to any account over which the underwriter exercises discretionary authority without the specific written approval of the accountholder.
Certain of the underwriters have performed investment and commercial banking and advisory services for us from time to time for which they have received customary fees and expenses. Affiliates of BMO Capital Markets Corp. and KeyBanc Capital Markets Inc. are lenders under our credit facility. An affiliate of BMO Capital Markets Corp. is also a counterparty to our hedging arrangements. The underwriters may, from time to time, engage in transactions with and perform services for us in the ordinary course of business.
We have agreed to indemnify the underwriters against certain liabilities, including liabilities under the Securities Act of 1933, as amended, or to contribute to payments the underwriter may be required to make because of any of those liabilities.
117
Table of Contents
Index to Financial Statements
The validity of our common stock offered by this prospectus will be passed upon for us by Crowe & Dunlevy, A Professional Corporation, Oklahoma City, Oklahoma. Certain legal matters in connection with this offering will be passed upon for the underwriters by Mayer Brown LLP, Houston, Texas.
The historical carve-out financial statements of the Oil and Natural Gas Properties Transferred to New Source Energy Corporation as of December 31, 2010 and 2009 and for each of the three years in the period ended December 31, 2010 included in this prospectus have been so included in reliance on the reports of BDO USA, LLP, an independent registered public accounting firm, appearing elsewhere herein, given on the authority of said firm as experts in auditing and accounting.
The balance sheet of New Source Energy Corporation as of July 12, 2011 (date of inception) included in this prospectus has been so included in reliance on the report of BDO USA, LLP, an independent registered public accounting firm, appearing elsewhere herein, given on the authority of said firm as experts in auditing and accounting.
Our net proved oil and natural gas reserve estimates at December 31, 2010 are based on a reserve report prepared by Ralph E. Davis Associates, Inc., independent reserve engineers, and are included in this prospectus in reliance upon the authority of said firm as experts in these matters.
WHERE YOU CAN FIND MORE INFORMATION
We have filed with the SEC a registration statement on Form S-1 (including the exhibits, schedules and amendments thereto) under the Securities Act, with respect to the shares of our common stock offered hereby. This prospectus does not contain all of the information set forth in the registration statement and the exhibits and schedules thereto. For further information with respect to us and the common stock offered hereby, we refer you to the registration statement and the exhibits and schedules filed therewith. Statements contained in this prospectus as to the contents of any contract, agreement or any other document are summaries of the material terms of such contract, agreement or other document. With respect to each of these contracts, agreements or other documents filed as an exhibit to the registration statement, reference is made to the exhibits for a more complete description of the matter involved. A copy of the registration statement, and the exhibits and schedules thereto, may be inspected without charge at the public reference facilities maintained by the SEC at 100 F Street NE, Washington, D.C. 20549. Copies of these materials may be obtained, upon payment of a duplicating fee, from the Public Reference Section of the SEC at 100 F Street NE, Washington, D.C. 20549. Please call the SEC at 1-800-SEC-0330 for further information on the operation of the public reference facility. The SEC maintains a website that contains reports, proxy and information statements and other information regarding registrants that file electronically with the SEC. The address of the SEC’s website is http://www.sec.gov.
After we have completed this offering, we will file annual, quarterly and current reports, proxy statements and other information with the SEC. We expect to have an operational website concurrently with the completion of this offering and we expect to make our periodic reports and other information filed with or furnished to the SEC available, free of charge, through our website as soon as reasonably practicable after those reports and other information are electronically filed with or furnished to the SEC. Information on our website or any other website is not incorporated by reference into this prospectus and does not constitute a part of this prospectus. You may read and copy any reports, statements or other information on file at the public reference rooms. You can also request copies of these documents, for a copying fee, by writing to the SEC, or you can review these documents on the SEC’s website, as described above. In addition, we will provide electronic or paper copies of our filings free of charge upon request.
118
Table of Contents
Index to Financial Statements
GLOSSARY OF CERTAIN INDUSTRY TERMS
The definitions set forth below shall apply to the indicated terms as used in this prospectus. All natural gas reserves and production reported in this prospectus are stated at the legal pressure base of the state or area where the reserves exist and at 60 degrees Fahrenheit.
“3-D seismic data” Geophysical data that depicts the subsurface strata in three dimensions.
“Analogous reservoir” Analogous reservoirs, as used in resources assessments, have similar rock and fluid properties, reservoir conditions (depth, temperature, and pressure) and drive mechanisms, but are typically at a more advanced stage of development than the reservoir of interest and thus may provide concepts to assist in the interpretation of more limited data and estimation of recovery. When used to support proved reserves, an “analogous reservoir” refers to a reservoir that shares the following characteristics with the reservoir of interest:
(i) same geological formation (but not necessarily in pressure communication with the reservoir of interest);
(ii) same environment of deposition;
(iii) similar geological structure; and
(iv) same drive mechanism.
“Basin” A large natural depression on the earth’s surface in which sediments generally brought by water accumulate.
“Bbl” One stock tank barrel, or 42 U.S. gallons liquid volume, used herein in reference to crude oil or other liquid hydrocarbons.
“Boe” One barrel of oil equivalent. Determined using a ratio of one barrel of crude oil to six Mcf of natural gas.
“Btu” British thermal unit, which is the heat required to raise the temperature of a one-pound mass of water from 58.5 to 59.5 degrees Fahrenheit.
“Completion” The process of strengthening a well hole with casing, evaluating the pressure and temperature of the formation, and then installing the proper equipment to ensure an efficient flow of oil and natural gas out of the well.
“Condensate” Liquid hydrocarbons associated with the production of a primarily natural gas reserve.
“Conventional Reservoir” A reservoir in which buoyant forces keep hydrocarbons in place below a sealing caprock. Reservoir and fluid characteristics of conventional reservoirs typically permit oil or natural gas to flow readily into wellbores. The term is used to make a distinction from shale and other unconventional reservoirs, in which gas might be distributed throughout the reservoir at the basin scale, and in which buoyant forces or the influence of a water column on the location of hydrocarbons within the reservoir are not significant.
“Conventional Resource Reservoir” A conventional reservoir demonstrating the characteristics defined by a resource play. Conventional resource plays are also referred to as transition zone reservoirs. The reservoir may be over or under-pressured. The conventional resource play is conducive to assembly-line operations, with upside potential to improve recoveries and efficiencies from enhanced methodologies including seismic, log interpretation, cores, drilling, completion and operations.
119
Table of Contents
Index to Financial Statements
“Development costs” Costs incurred to obtain access to proved reserves and to provide facilities for extracting, treating, gathering and storing the oil and gas. More specifically, development costs, including depreciation and applicable operating costs of support equipment and facilities and other costs of development activities, are costs incurred to:
(i) gain access to and prepare well locations for drilling, including surveying well locations for the purpose of determining specific development drilling sites, clearing ground, draining, road building, and relocating public roads, gas lines, and power lines, to the extent necessary in developing the proved reserves;
(ii) drill and equip development wells, development-type stratigraphic test wells, and service wells, including the costs of platforms and of well equipment such as casing, tubing, pumping equipment, and the wellhead assembly;
(iii) acquire, construct, and install production facilities such as lease flow lines, separators, treaters, heaters, manifolds, measuring devices, and production storage tanks, natural gas cycling and processing plants, and central utility and waste disposal systems; and
(iv) provide improved recovery systems.
“Development project” A development project is the means by which petroleum resources are brought to the status of economically producible. As examples, the development of a single reservoir or field, an incremental development in a producing field, or the integrated development of a group of several fields and associated facilities with a common ownership may constitute a development project.
“Development well” A well drilled within the proved area of an oil or gas reservoir to the depth of a stratigraphic horizon known to be productive.
“Economically producible” The term economically producible, as it relates to a resource, means a resource which generates revenue that exceeds, or is reasonably expected to exceed, the costs of the operation. The value of the products that generate revenue shall be determined at the terminal point of oil and gas producing activities.
“Environmental assessment” A study that can be required pursuant to federal law to assess the potential direct, indirect and cumulative impacts of a project.
“Exploratory well” A well drilled to find and produce natural gas or oil reserves not classified as proved, to find a new reservoir in a field previously found to be productive of natural gas or oil in another reservoir or to extend a known reservoir.
“Field” An area consisting of a single reservoir or multiple reservoirs all grouped on or related to the same individual geological structural feature and/or stratigraphic condition. There may be two or more reservoirs in a field that are separated vertically by intervening impervious, strata, or laterally by local geologic barriers, or by both. Reservoirs that are associated by being in overlapping or adjacent fields may be treated as a single or common operational field. The geological terms structural feature and stratigraphic condition are intended to identify localized geological features as opposed to the broader terms of basins, trends, provinces, plays, areas-of-interest, etc.
“Formation” A layer of rock which has distinct characteristics that differ from nearby rock.
“Fracture stimulation” A process whereby fluids mixed with proppants are injected into a well bore under pressure to fracture, or crack open, reservoir rock, thereby allowing oil and/or natural gas trapped in the reservoir rock to travel through the fractures and into the well for production.
“Gross well or acre” A well or acre in which the registrant owns a working interest. The number of gross wells is the total number of wells in which the registrant owns a working interest.
120
Table of Contents
Index to Financial Statements
“Horizon” A reservoir bed within the stratigraphic series of an oil province from which gas or liquid hydrocarbons can be obtained by drilling a well.
“Horizontal drilling” A drilling technique used in certain formations where a well is drilled vertically to a certain depth and then drilled at a right angle within a specified interval.
“MBbls” One thousand barrels of crude oil or other liquid hydrocarbons.
“MBoe” One thousand barrels of oil equivalent. Determined using the ratio of one barrel of crude oil to six Mcf of natural gas.
“Mcf” One thousand cubic feet of natural gas.
“Mcfe” One thousand cubic feet of natural gas equivalent, determined using the ratio of one barrel of crude oil or natural gas liquids to six Mcf of natural gas.
“MMBoe” One million barrels of oil equivalent. Determined using the ratio of one barrel of crude oil to six Mcf of natural gas.
“MMBtu” One million British thermal units (Btu).
“MMcf” One million cubic feet of natural gas.
“Naturally Occurring Fracture” A planar discontinuity in reservoir rock due to deformation or physical diagenesis that is predicted to have a significant effect on fluid flow either in the form of increased permeability and/or porosity.
“Net well or acre” Deemed to exist when the sum of fractional ownership working interests in gross wells or acres equals one. The number of net wells or acres is the sum of the fractional working interests owned in gross wells or acres expressed as whole numbers and fractions of whole numbers.
“NYMEX” The New York Mercantile Exchange.
“Original oil in place” Refers to the oil in place before the commencement of production. Oil in place is distinct from oil reserves, which are the technically and economically recoverable portion of oil volume in the reservoir.
“Permeability” The measure of the ease with which fluid flows through a porous rock and is a function of interconnection between the pores.
“Play” A term applied to a portion of the exploration and production cycle following the identification by geologists and geophysicists of areas with potential oil and gas reserves.
“Plugging and abandonment” Refers to the sealing off of fluids in the strata penetrated by a well so that the fluids from one stratum will not escape into another or to the surface. Regulations of all states require plugging of abandoned wells.
“Porosity” The ratio of the void space in a rock to the bulk volume of that rock multiplied by 100 to express in percent.
“Productive wells” Producing wells and wells mechanically capable of production.
“Proved developed producing” Proved developed reserves that can be expected to be recovered from a reservoir that is currently producing through existing wells.
121
Table of Contents
Index to Financial Statements
“Proved developed reserves” Proved gas and oil that are also developed gas and oil reserves.
“Proved oil and gas reserves” Proved oil and gas reserves are those quantities of oil and gas, which, by analysis of geosciences and engineering data, can be estimated with reasonable certainty to be economically producible-from a given date forward, from known reservoirs, and under existing economic conditions, operating methods, and government regulations-prior to the time at which contracts providing the right to operate expire, unless evidence indicates that renewal is reasonably certain, regardless of whether deterministic or probabilistic methods are used for the estimation. The project to extract the hydrocarbons must have commenced or the operator must be reasonably certain that it will commence the project within a reasonable time. Also referred to as “proved reserves.”
“Proved undeveloped reserves” Proved oil and gas reserves that are also undeveloped oil and gas reserves.
“PUD” Proved undeveloped drilling location.
“Reasonable certainty” A high degree of confidence.
“Recompletion” Redrilling a well to a new producing zone (new depth) when the current zone is depleted.
“Reserves” Estimated quantities of oil and natural gas and related substances anticipated to be economically producible as of a given date by application of development prospects to known accumulations.
“Reservoir” A porous and permeable underground formation containing a natural accumulation of producible oil and/or gas that is confined by impermeable rock or water barriers and is individual and separate from other reservoirs.
“Resource play” An accumulation of hydrocarbons known to exist over a large areal expanse that is believed to have a lower geological and/or commercial development risk. A resource play is a continuous hydrocarbon system over a contiguous geographical area that is regional in extent, exhibits both low exploration risk with consistent results, and predictable estimated ultimate recoveries (EUR). Performance is a function of reservoir geology, which includes variations in thickness, rock lithology, porosity, permeability, in-situ stress, minerology, and completion efficiency. Resource play reservoirs can be described using a statistical description and importantly, this statistical description changes little over time provided interference between wells is minimal. A resource play is conducive to assembly-line operations, with upside potential to improve recoveries and efficiencies from enhanced methodologies – seismic, log interpretation, cores, drilling, completion and operations.
“Royalty interest” An interest in a oil and natural gas property entitling the owner to a share of oil or gas production free of production costs.
“Unconventional reservoirs” A term used in the oil and natural gas industry to refer to a play in which the targeted reservoirs generally fall into one of three categories: (1) tight sands, (2) coal beds, or (3) gas shales. The reservoirs tend to cover large areas and lack the readily apparent traps, seals and discrete hydrocarbon-water boundaries that typically define conventional reservoirs. These reservoirs generally require fracture stimulation treatments or other special recovery processes to produce economic flow rates.
“Undeveloped acreage” Those leased acres on which wells have not been drilled or completed to a point that would permit the production of economic quantities of oil or gas regardless of whether such acreage contains proved reserves.
“Undeveloped oil and gas reserves” Undeveloped oil and gas reserves are reserves of any category that are expected to be recovered from new wells on undrilled acreage, or from existing wells where a relatively major expenditure is required for recompletion. Also referred to as “undeveloped reserves.”
122
Table of Contents
Index to Financial Statements
“Well spacing” The regulation of the number and location of wells over an oil or gas reservoir, as a conservation measure. Well spacing is normally accomplished by order of the regulatory conservation commission in the applicable jurisdiction. The order may be statewide in its application (subject to change for local conditions) or it may be entered for each field after its discovery. In the operational context, “well spacing” refers to the area attributable between producing wells within the scope of what is permitted under a regulatory order.
“Wellbore” The hole drilled by the bit that is equipped for oil or gas production on a completed well. Also called well or borehole.
“West Texas Intermediate” The benchmark crude oil in the United States.
“Working interest” The right granted to the lessee of a property to explore for and to produce and own oil and gas. The working interest owner bears the exploration, development and operating costs of the property.
123
Table of Contents
Index to Financial Statements
Oil and Natural Gas Properties Transferred to New Source Energy Corporation
| F-2 | ||||
| Financial Statements |
||||
| Balance Sheets as of December 31, 2009 and 2010 and as of June 30, 2011 (unaudited) |
F-3 | |||
| F-4 | ||||
| Statement of Parent Net Investment for the years ended December 31, 2008, 2009, and 2010 |
F-5 | |||
| F-6 | ||||
| Notes to Financial Statements (unaudited as of and for the six-month period ended June 30, 2011) |
F-7 to F-17 | |||
| F-18 to F-21 | ||||
| New Source Energy Corporation | ||||
| F-22 | ||||
| Financial Statements |
||||
| F-23 | ||||
| F-24 to F-25 | ||||
F-1
Table of Contents
Index to Financial Statements
Report of Independent Registered Public Accounting Firm
To the Board of Directors and Stockholders of New Source Energy Corporation
Oklahoma City, Oklahoma
We have audited the accompanying carve-out balance sheets of the oil and natural gas properties transferred on August 12, 2011 by Scintilla, LLC to New Source Energy Corporation (the “Properties”) as of December 31, 2010 and 2009 and the related carve-out statements of operations, parent net investment, and cash flows for each of the three years in the period ended December 31, 2010. These financial statements are the responsibility of the management of the Properties. Our responsibility is to express an opinion on these financial statements based on our audits.
We conducted our audits in accordance with the standards of the Public Company Accounting Oversight Board (United States). Those standards require that we plan and perform the audits to obtain reasonable assurance about whether the financial statements are free of material misstatement. The Properties are not required to have, nor were we engaged to perform, an audit of the internal control over financial reporting of the Properties. Our audits included consideration of internal control over financial reporting as a basis for designing audit procedures that are appropriate in the circumstances, but not for the purpose of expressing an opinion on the effectiveness of the internal control over financial reporting of the Properties. Accordingly, we express no such opinion. An audit also includes examining, on a test basis, evidence supporting the amounts and disclosures in the financial statements, assessing the accounting principles used and significant estimates made by management, as well as evaluating the overall financial statement presentation. We believe that our audits provide a reasonable basis for our opinion.
In our opinion, the carve-out financial statements referred to above present fairly, in all material respects, the financial position of the Properties as of December 31, 2010 and 2009, and the results of its operations and its cash flows for each of the three years in the period ended December 31, 2010 in conformity with accounting principles generally accepted in the United States of America.
As discussed in Note 1, the Properties are a group of related assets and liabilities in the form of leasehold interests owned by Scintilla, LLC in certain producing and non-producing oil and gas properties and are not a stand-alone entity. The carve-out financial statements of the Properties reflect the assets, liabilities, revenues, and expenses directly attributable to the Properties, as well as allocations deemed reasonable by management, to present the financial position, results of operations, changes in parent net investment, and cash flows of the Properties on a stand-alone basis and do not necessarily reflect the financial position, results of operations, changes in parent net investment, and cash flows of the Properties in the future or what they would have been had the Properties been a separate, stand-alone entity during the periods presented.
/s/ BDO USA, LLP
| Houston, Texas |
| August 12, 2011 |
F-2
Table of Contents
Index to Financial Statements
Oil and Natural Gas Properties Transferred to
New Source Energy Corporation
(In thousands)
| As of December 31, | As of June 30, |
Pro Forma As of June 30 |
||||||||||||||
| 2009 | 2010 | 2011 | 2011 | |||||||||||||
| (Unaudited) | (Unaudited) | |||||||||||||||
| See Note 1 | ||||||||||||||||
| ASSETS |
||||||||||||||||
| Current assets: |
||||||||||||||||
| Oil and natural gas sales receivables - related parties |
$ | 6,537 | $ | 6,444 | $ | 6,755 | $ | 6,755 | ||||||||
| Derivative assets |
— | 994 | 632 | 632 | ||||||||||||
|
|
|
|
|
|
|
|
|
|||||||||
| Total current assets |
6,537 | 7,438 | 7,387 | 7,387 | ||||||||||||
|
|
|
|
|
|
|
|
|
|||||||||
| Oil and natural gas properties, at cost, using full cost method: |
||||||||||||||||
| Proved oil and natural gas properties |
151,085 | 178,755 | 194,280 | 194,280 | ||||||||||||
| Accumulated depreciation, depletion, and amortization |
(58,679 | ) | (70,050 | ) | (75,303 | ) | (75,303 | ) | ||||||||
|
|
|
|
|
|
|
|
|
|||||||||
| Total oil and natural gas properties, net |
92,406 | 108,705 | 118,977 | 118,977 | ||||||||||||
|
|
|
|
|
|
|
|
|
|||||||||
| Loan fees, net |
— | 1,050 | 811 | 811 | ||||||||||||
| Deferred offering costs |
— | — | 544 | 544 | ||||||||||||
| Derivative assets |
— | 403 | 306 | 306 | ||||||||||||
|
|
|
|
|
|
|
|
|
|||||||||
| Total assets |
$ | 98,943 | $ | 117,596 | $ | 128,025 | $ | 128,025 | ||||||||
|
|
|
|
|
|
|
|
|
|||||||||
| LIABILITIES AND PARENT NET INVESTMENT |
||||||||||||||||
| Current liabilities: |
||||||||||||||||
| Accounts payable - related parties |
$ | 2,871 | $ | 4,454 | $ | 3,107 | $ | 3,107 | ||||||||
| Derivative obligations |
— | 1,555 | 2,332 | 2,332 | ||||||||||||
|
|
|
|
|
|
|
|
|
|||||||||
| Total current liabilities |
2,871 | 6,009 | 5,439 | 5,439 | ||||||||||||
| Credit facility - long-term portion |
60,000 | 60,000 | 60,000 | 60,000 | ||||||||||||
| Derivative obligations |
— | 1,271 | 1,854 | 1,854 | ||||||||||||
| Deferred tax liability |
— | — | — | 18,020 | ||||||||||||
| Asset retirement obligation |
837 | 904 | 938 | 938 | ||||||||||||
|
|
|
|
|
|
|
|
|
|||||||||
| Total liabilities |
63,708 | 68,184 | 68,231 | 86,251 | ||||||||||||
| Commitments and Contingencies (See Note 8) |
||||||||||||||||
| Parent net investment |
35,235 | 49,412 | 59,794 | 41,774 | ||||||||||||
|
|
|
|
|
|
|
|
|
|||||||||
| Total liabilities and parent net investment |
$ | 98,943 | $ | 117,596 | $ | 128,025 | $ | 128,025 | ||||||||
|
|
|
|
|
|
|
|
|
|||||||||
The accompanying notes are an integral part of these financial statements.
F-3
Table of Contents
Index to Financial Statements
Oil and Natural Gas Properties Transferred to
New Source Energy Corporation
(In thousands, except per share amounts)
| Year ended December 31, | Six months ended June 30, | |||||||||||||||||||
| 2008 | 2009 | 2010 | 2010 | 2011 | ||||||||||||||||
| (Unaudited) |
||||||||||||||||||||
| REVENUES |
||||||||||||||||||||
| Oil sales |
$ | 5,753 | $ | 4,389 | $ | 5,336 | $ | 2,814 | $ | 2,331 | ||||||||||
| Natural gas liquids and natural gas sales |
53,150 | 26,668 | 36,388 | 18,086 | 22,020 | |||||||||||||||
|
|
|
|
|
|
|
|
|
|
|
|||||||||||
| Total revenues |
58,903 | 31,057 | 41,724 | 20,900 | 24,351 | |||||||||||||||
| OPERATING COSTS AND EXPENSES |
||||||||||||||||||||
| Oil and natural gas production expenses |
13,711 | 9,368 | 11,069 | 5,194 | 5,945 | |||||||||||||||
| General and administrative |
460 | 578 | 670 | 326 | 784 | |||||||||||||||
| Depreciation, depletion, and amortization |
11,611 | 10,529 | 11,371 | 5,615 | 5,253 | |||||||||||||||
| Accretion expense |
34 | 44 | 51 | 25 | 29 | |||||||||||||||
|
|
|
|
|
|
|
|
|
|
|
|||||||||||
| Total operating costs and expenses |
25,816 | 20,519 | 23,161 | 11,160 | 12,011 | |||||||||||||||
|
|
|
|
|
|
|
|
|
|
|
|||||||||||
| Operating income |
33,087 | 10,538 | 18,563 | 9,740 | 12,340 | |||||||||||||||
| OTHER INCOME (EXPENSE) |
||||||||||||||||||||
| Interest expense |
(2,536 | ) | (1,943 | ) | (2,648 | ) | (1,314 | ) | (1,444 | ) | ||||||||||
| Realized and unrealized gains (losses) from derivatives |
(352 | ) | — | (574 | ) | 2,438 | (2,758 | ) | ||||||||||||
|
|
|
|
|
|
|
|
|
|
|
|||||||||||
| Net income |
$ | 30,199 | $ | 8,595 | $ | 15,341 | $ | 10,864 | $ | 8,138 | ||||||||||
|
|
|
|
|
|
|
|
|
|
|
|||||||||||
| Pro forma reflecting change of tax status (Unaudited) (See Note 1) |
||||||||||||||||||||
| Net income |
30,199 | 8,595 | 15,341 | 10,864 | 8,138 | |||||||||||||||
| Pro forma income tax expense |
10,625 | 2,587 | 5,341 | 3,781 | 2,833 | |||||||||||||||
|
|
|
|
|
|
|
|
|
|
|
|||||||||||
| Pro forma net income |
$ | 19,574 | $ | 6,008 | $ | 10,000 | $ | 7,083 | $ | 5,305 | ||||||||||
|
|
|
|
|
|
|
|
|
|
|
|||||||||||
| Pro forma earnings per share – basic and diluted (Unaudited) (See Note 1) |
||||||||||||||||||||
| Pro forma net income per common share |
$ | 0.98 | $ | 0.30 | $ | 0.50 | $ | 0.35 | $ | 0.27 | ||||||||||
|
|
|
|
|
|
|
|
|
|
|
|||||||||||
| Shares used in computing earnings per share |
20,000 | 20,000 | 20,000 | 20,000 | 20,000 | |||||||||||||||
|
|
|
|
|
|
|
|
|
|
|
|||||||||||
The accompanying notes are an integral part of these financial statements.
F-4
Table of Contents
Index to Financial Statements
Oil and Natural Gas Properties Transferred to
New Source Energy Corporation
Statement of Parent Net Investment
(In thousands)
| Parent Net Investment |
||||
| BALANCE, January 1, 2008 |
$ | 28,504 | ||
| Net income |
30,199 | |||
| Distribution to parent |
(37,855 | ) | ||
|
|
|
|||
| BALANCE, December 31, 2008 |
20,848 | |||
| Net income |
8,595 | |||
| Investment by parent |
5,792 | |||
|
|
|
|||
| BALANCE, December 31, 2009 |
35,235 | |||
| Net income |
15,341 | |||
| Distribution to parent |
(1,164 | ) | ||
|
|
|
|||
| BALANCE, December 31, 2010 |
$ | 49,412 | ||
|
|
|
|||
The accompanying notes are an integral part of these financial statements.
F-5
Table of Contents
Index to Financial Statements
Oil and Natural Gas Properties Transferred to
New Source Energy Corporation
(In thousands)
| Year ended December 31, | Six months ended June 30, | |||||||||||||||||||
| 2008 | 2009 | 2010 | 2010 | 2011 | ||||||||||||||||
| (Unaudited) |
||||||||||||||||||||
| CASH FLOWS FROM OPERATING ACTIVITIES |
||||||||||||||||||||
| Net income |
$ | 30,199 | $ | 8,595 | $ | 15,341 | $ | 10,864 | $ | 8,138 | ||||||||||
| Adjustments to reconcile net income to net cash provided by operating activities |
||||||||||||||||||||
| Depreciation, depletion, and amortization |
11,611 | 10,529 | 11,371 | 5,615 | 5,253 | |||||||||||||||
| Amortization of loan fees |
51 | 49 | 386 | 147 | 239 | |||||||||||||||
| Accretion expense |
34 | 44 | 51 | 25 | 29 | |||||||||||||||
| Unrealized (gain) loss on derivatives |
62 | — | 1,429 | (2,027 | ) | 1,819 | ||||||||||||||
| Changes in operating assets and liabilities |
||||||||||||||||||||
| Oil and natural gas sales receivables – related parties |
3,828 | (2,135 | ) | 92 | 1,231 | (311 | ) | |||||||||||||
| Accounts payable – related parties |
164 | (40 | ) | 4 | (492 | ) | (133 | ) | ||||||||||||
|
|
|
|
|
|
|
|
|
|
|
|||||||||||
| Net cash provided by operating activities |
45,949 | 17,042 | 28,674 | 15,363 | 15,034 | |||||||||||||||
|
|
|
|
|
|
|
|
|
|
|
|||||||||||
| CASH FLOWS FROM INVESTING ACTIVITIES |
||||||||||||||||||||
| Payments for oil and natural gas properties |
(25,094 | ) | (22,834 | ) | (26,074 | ) | (8,392 | ) | (16,734 | ) | ||||||||||
|
|
|
|
|
|
|
|
|
|
|
|||||||||||
| Net cash used in investing activities |
(25,094 | ) | (22,834 | ) | (26,074 | ) | (8,392 | ) | (16,734 | ) | ||||||||||
|
|
|
|
|
|
|
|
|
|
|
|||||||||||
| CASH FLOWS FROM FINANCING ACTIVITIES |
||||||||||||||||||||
| Proceeds from borrowings on credit facility |
17,000 | — | — | — | — | |||||||||||||||
| Payments for deferred loan costs |
— | — | (1,436 | ) | (1,436 | ) | — | |||||||||||||
| Payments for offering costs |
— | — | — | — | (544 | ) | ||||||||||||||
| Investment by (distribution to) parent |
(37,855 | ) | 5,792 | (1,164 | ) | (5,535 | ) | 2,244 | ||||||||||||
|
|
|
|
|
|
|
|
|
|
|
|||||||||||
| Net cash provided by (used in) financing activities |
(20,855 | ) | 5,792 | (2,600 | ) | (6,971 | ) | 1,700 | ||||||||||||
|
|
|
|
|
|
|
|
|
|
|
|||||||||||
| Net change in cash and cash equivalents |
— | — | — | — | — | |||||||||||||||
| Cash and cash equivalents at beginning of period |
— | — | — | — | — | |||||||||||||||
|
|
|
|
|
|
|
|
|
|
|
|||||||||||
| Cash and cash equivalents at end of period |
$ | — | $ | — | $ | — | $ | — | $ | — | ||||||||||
|
|
|
|
|
|
|
|
|
|
|
|||||||||||
| SUPPLEMENTAL CASH FLOW INFORMATION |
||||||||||||||||||||
| Cash paid for interest expense |
$ | 2,485 | $ | 1,894 | $ | 2,262 | $ | 1,167 | $ | 1,205 | ||||||||||
|
|
|
|
|
|
|
|
|
|
|
|||||||||||
| NON-CASH INVESTING AND FINANCING ACTIVITIES |
||||||||||||||||||||
| Asset retirement obligation |
$ | 75 | $ | 108 | $ | 16 | $ | 12 | $ | 6 | ||||||||||
|
|
|
|
|
|
|
|
|
|
|
|||||||||||
| Change in accrued capital expenditures |
$ | 1,582 | $ | 531 | $ | (1,579 | ) | $ | 1,026 | $ | 1,214 | |||||||||
|
|
|
|
|
|
|
|
|
|
|
|||||||||||
The accompanying notes are an integral part of these financial statements.
F-6
Table of Contents
Index to Financial Statements
Oil and Natural Gas Properties Transferred to
New Source Energy Corporation
1. Summary of Significant Accounting Policies
Basis of Presentation and Nature of Operations
Scintilla, LLC (“Scintilla”), transferred certain oil and natural gas properties (the “Properties”) to a newly formed entity, New Source Energy Corporation (“NSE”) on August 12, 2011, in exchange for 20.0 million shares of NSE common stock and $60.0 million in cash. The accompanying financial statements have been prepared on a “carve-out” basis from Scintilla’s financial statements and reflect the historical accounts directly attributable to the Properties together with allocations of expenses from Scintilla. The financial statements may not be indicative of the Properties’ future performance and may not reflect what their financial position, results of operations, changes in parent net investment, and cash flows would have been had they operated as an independent company during the periods presented. The financial statements have been prepared in accordance with GAAP. All significant intercompany accounts and transactions have been eliminated.
Scintilla has provided certain corporate functions to the Properties and costs associated with these functions were allocated to the Properties. These functions included executive management, information technology, tax, insurance, accounting, legal and treasury services. The costs of such services were allocated to the Properties based on the most relevant allocation method to the service provided, primarily based on relative book value of assets, among other factors. Management believes such allocations are reasonable; however, they may not be indicative of the actual expense that would have been incurred had the Properties been operating as an independent company for all of the periods presented. The charges for these functions are included primarily in general and administrative expenses.
Description of the Properties
The Properties include interests in wells producing oil, natural gas, and natural gas liquids from the Misener-Hunton (the “Hunton”) formation in East-Central Oklahoma. The properties represent an undivided 90% of Scintilla’s working interest in certain Hunton formation producing wells located in Pottawatomie, Seminole and Okfuskee Counties, Oklahoma (“Golden Lane Area”), which equates to approximately a 39% weighted average working interest in the Golden Lane Area and an undivided 50% working interest in certain Hunton formation producing wells located in Oklahoma and Lincoln Counties, Oklahoma (“Luther Area”).
Use of Estimates in the Preparation of Financial Statements
Preparation of financial statements in conformity with GAAP requires management to make estimates and assumptions that affect the reported amounts of assets and liabilities, the disclosure of contingent assets and liabilities at the date of the financial statements, and the reported amounts of revenues and expenses during the reporting periods. Actual results could differ from these estimates. Depletion of oil and natural gas properties is determined using estimates of proved oil and natural gas reserves. There are numerous uncertainties inherent in the estimation of quantities of proved reserves and in the projection of future rates of production and the timing of development expenditures. Similarly, evaluations for impairment of proved and unproved oil and natural gas properties are subject to numerous uncertainties including, among others, estimates of future recoverable reserves. Other significant estimates include, but are not limited to, the valuation of commodity derivatives, the allocation of general and administrative expenses and asset retirement obligations.
Oil and Natural Gas Sales Receivables – Related Parties
Receivables from the sale of oil and natural gas are generally unsecured. Allowances for doubtful accounts are determined based on management’s assessment of the creditworthiness of the purchaser. Receivables are considered past due if full payment is not received by the contractual due date. Past due accounts will generally
F-7
Table of Contents
Index to Financial Statements
Oil and Natural Gas Properties Transferred to
New Source Energy Corporation
Notes to Financial Statements
be written off against the allowance for doubtful accounts only after all collection attempts have been exhausted. No allowance was deemed necessary at June 30, 2011, December 31, 2010 or December 31, 2009.
Oil and Natural Gas Properties
Oil and natural gas properties are accounted for under the full cost method whereby productive and nonproductive costs incurred in connection with the acquisition, exploration, and development of oil and natural gas reserves are capitalized. All capitalized costs of oil and natural gas properties and equipment, including the estimated future costs to develop proved reserves, are amortized using the units-of-production method based on total proved reserves. No gains or losses are recognized upon the sale or other disposition of oil and natural gas properties except in transactions that would significantly alter the relationship between capitalized costs and proved reserves.
Under the full cost method, the net book value of oil and natural gas properties may not exceed the estimated future net revenues from proved oil and natural gas properties, discounted at 10% (the ceiling limitation). In arriving at estimated future net revenues, estimated lease operating expenses, development costs, and certain production-related and ad valorem taxes are deducted. In calculating future net revenues, prices and costs in effect at the time of the calculation are held constant indefinitely, except for changes that are fixed and determinable by existing contracts. The net book value is compared to the ceiling limitation on a quarterly and yearly basis. The excess, if any, of the net book value above the ceiling limitation is charged to expense in the period in which it occurs and is not subsequently reinstated. Reserve estimates used in determining estimated future net revenues have been prepared by an independent petroleum engineer. Future net revenues were computed based on reserves using prices calculated as the unweighted arithmetical average oil and natural gas prices on the first day of each month within the latest twelve-month period for fiscal years ending on or after December 31, 2009. For periods ended prior to that date, future net revenues were computed using period-end prices. There have been no full cost ceiling write-downs recorded in the years ended December 31, 2008, 2009 and 2010 or the six months ended June 30, 2011.
Oil and Natural Gas Reserve Estimation
In January 2010, the FASB issued an update to the Oil and Gas Topic, which aligns the oil and natural gas reserve estimation and disclosure requirements with the requirements in the SEC’s final rule, Modernization of the Oil and Gas Reporting Requirements (the “Final Rule”). The Final Rule was issued on December 31, 2008. The Final Rule is intended to provide investors with a more meaningful and comprehensive understanding of oil and natural gas reserves, which should help investors evaluate the relative value of oil and natural gas companies.
The Final Rule permits the use of new technologies to determine proved reserves estimates if those technologies have been demonstrated empirically to lead to reliable conclusions about reserve volume estimates. The Final Rule also allows, but does not require, companies to disclose their probable and possible reserves to investors in documents filed with the SEC. In addition, the new disclosure requirements require companies to report oil and natural gas reserves using an average price based upon the prior twelve-month period rather than a year-end price. The Final Rule became effective for fiscal years ending on or after December 31, 2009. Accordingly, the depreciation, depletion and amortization (“DD&A”) and impairment calculations were based upon proved reserves determined using the new reserve rules for the fourth quarter 2009, whereas DD&A and impairment calculations prior to December 31, 2009 were based upon proved reserves using period end prices. The adoption of the Final Rule had the effect of (i) reducing proved reserve quantities by 1,915,000 thousand cubic feet of natural gas equivalents (Mcfe) (unaudited), (ii) decreasing DD&A of oil and natural gas properties by
F-8
Table of Contents
Index to Financial Statements
Oil and Natural Gas Properties Transferred to
New Source Energy Corporation
Notes to Financial Statements
$0.1 million and (iii) decreasing the present value of future net revenues by approximately $67 million (unaudited). See reserves information in the unaudited supplementary information.
Environmental
Oil and natural gas properties are subject to extensive federal, state and local environmental laws and regulations. These laws, which are often changing, regulate the discharge of materials into the environment and may require the removal or mitigation of the environmental effects of the disposal or release of petroleum or chemical substances at various sites. Environmental expenditures are expensed. Expenditures that relate to an existing condition caused by past operations and that have no future economic benefits are expensed. Liabilities for expenditures of a noncapital nature are recorded when environmental assessment and/or remediation is probable and the costs can be reasonably estimated. Such liabilities are generally undiscounted unless the timing of cash payments is fixed and readily determinable.
Revenue Recognition
Oil and natural gas sales are recognized when production is sold to a purchaser at a fixed or determinable price, delivery has occurred, title has transferred, and collectability of the revenue is probable. Delivery occurs and title is transferred when production has been delivered to a pipeline, railcar or truck, or a tanker lifting has occurred. The sales method of accounting is used for oil and natural gas sales such that revenues are recognized based on the Properties’ share of actual proceeds from the oil and natural gas sold to purchasers. Oil and natural gas imbalances are generated on properties for which two or more owners have the right to take production “in-kind” and, in doing so, take more or less than their respective entitled percentage. For the years ended December 31, 2009 and 2010, and the six months ended June 30, 2011, there were no significant oil and natural gas imbalances associated with the Properties.
Asset Retirement Obligations
Liabilities associated with asset retirement obligations are recorded at fair value in the period in which they are incurred or when properties are acquired with a corresponding increase in the carrying amount of the related oil and natural gas properties. Subsequently, the asset retirement cost included in the carrying amount is allocated to expense through DD&A. Changes in the liability due to passage of time are recognized as an increase in the carrying amount of the liability and as corresponding accretion expense.
General and Administrative Expenses
The accompanying financial statements reflect the direct historical revenues, expenses, assets, liabilities and other financial data of the Properties. In addition to the direct revenues and expenses of the Properties, the financial statements reflect an allocated portion of the actual costs incurred by Scintilla and New Dominion, LLC (“New Dominion”), a company under common ownership with Scintilla, in general and administrative (“G&A”) expenses in the accompanying financial statements.
A wide range of formulas for G&A allocation was considered. Management of Scintilla believes the most accurate and transparent method of allocating G&A expenses is the historical cost basis of the Properties, divided by the cost basis of the total combined assets of Scintilla and New Dominion and applying other factors. Using this method, and considering other factors, G&A expense allocated to the Properties for the years ended December 31, 2008, 2009 and 2010 was $0.5 million, $0.6 million, and $0.7 million, respectively. G&A expense allocated to the Properties for the six months ended June 30, 2010 and 2011 was $0.3 million and $0.8 million, respectively.
F-9
Table of Contents
Index to Financial Statements
Oil and Natural Gas Properties Transferred to
New Source Energy Corporation
Notes to Financial Statements
Income Taxes
The Properties have historically been owned by an LLC that is treated as a partnership for federal and state income tax purposes. As such, it is not a taxable entity and does not directly pay federal and state income tax. The Properties’ taxable income or loss, which may vary substantially from the net income or net loss reported in the statements of operations, is included in the federal and state income tax returns of each LLC member. Accordingly, no recognition has been given to federal and state income taxes associated with the Properties. The aggregate net book basis of the oil and natural gas properties exceeded the aggregate net tax basis by approximately $84 million, $97 million and $106 million at December 31, 2009 and 2010, and at June 30, 2011, respectively.
Pro Forma Change in Tax Status (Unaudited)
Pro forma income taxes in the statements of operations for all periods presented reflect income tax expense resulting from income before taxes, as if the Properties had been included in a C corporation prior to the transfer. Pro forma income tax expense, as if the Company had been a taxable entity during each respective period, was $10.6 million, $2.6 million, $5.3 million, $3.8 million and $2.8 million for the years ended December 31, 2008, 2009 and 2010, and for the six months ended June 30, 2010 and 2011, respectively, substantially all of which is composed of deferred tax expense. The difference between the effective tax rate and the anticipated statutory tax rate is the result of the permanent deductability of tax basis associated with oil and natural gas properties greater than cost for federal and state tax purposes. The pro forma deferred tax liability is based on an anticipated difference of $46.3 million between the book and tax bases of oil and natural gas properties as of June 30, 2011.
Fair Value of Financial Instruments
The fair value of a financial instrument is the amount at which the instrument could be exchanged in an orderly transaction between two willing parties. The carrying amounts of accounts receivable and accounts payable approximate fair value because of the short maturity of these instruments. The carrying amount of the credit facility reported on the balance sheets approximates fair value because the debt instrument carries a variable interest rate based on market interest rates. The carrying amount of derivative assets and liabilities reported on the balance sheets is the estimated fair value of the allocated Properties’ derivative instruments associated with the Properties.
Derivatives
All derivative instruments are recognized as either assets or liabilities in the balance sheet at fair value. None of such instruments have been designated as cash flow hedges. Accordingly, changes in the fair value of all derivative instruments have been recorded in the statements of operations.
Pro Forma Earnings per Share (Unaudited)
Pro forma net earnings per common share is determined by dividing the pro forma net income by 20 million shares, the number of shares of common stock issued to Scintilla in exchange for the Properties.
All shares were assumed to have been outstanding since the beginning of the periods presented. Basic and diluted pro forma earnings per share are the same, as there are no potentially dilutive shares outstanding as of June 30, 2011.
F-10
Table of Contents
Index to Financial Statements
Oil and Natural Gas Properties Transferred to
New Source Energy Corporation
Notes to Financial Statements
Interim Financial information
The unaudited financial statements for the periods ended June 30, 2010 and 2011 are prepared in conformity with GAAP for interim financial reporting. In management’s opinion, all adjustments necessary for a fair presentation are reflected in the interim periods presented. Certain information and footnote disclosures normally included in financial statements prepared in accordance with GAAP have been condensed or omitted in these financial statements for and as of the six months ended June 30, 2010 and 2011. Interim results for the six months ended June 30, 2011 may not be indicative of results that will be realized for the full year ending December 31, 2011.
2. Asset Retirement Obligations
Asset retirement obligations represent the present value of the estimated cash flows expected to be incurred to plug, abandon, and remediate producing properties at the end of their productive lives in accordance with applicable laws. There were no assets legally restricted for purposes of settling asset retirement obligations associated with the Properties as of December 31, 2009 and 2010 and June 30, 2011.
The following table summarizes activity associated with asset retirement obligations for the periods presented:
| December 31, | June 30, |
|||||||||||
| 2009 | 2010 | 2011 | ||||||||||
| (in thousands) | ||||||||||||
| Asset retirement obligations, beginning of period |
$ | 685 | $ | 837 | $ | 904 | ||||||
| Liabilities incurred from new wells |
108 | 16 | 5 | |||||||||
| Accretion expense |
44 | 51 | 29 | |||||||||
|
|
|
|
|
|
|
|||||||
| Asset retirement obligations, end of period |
$ | 837 | $ | 904 | $ | 938 | ||||||
|
|
|
|
|
|
|
|||||||
3. Major Customers
The Properties produce exclusively from the Hunton formation in east-central Oklahoma. The following table represents oil and natural gas sales by New Dominion of our oil and natural gas production by customer for 2008, 2009 and 2010:
| Purchaser |
2008 | 2009 | 2010 | |||||||||
| Scissortail |
90 | % | 85 | % | 85 | % | ||||||
| Sun Refining |
6 | % | 14 | % | 12 | % | ||||||
This market is served by multiple oil and natural gas purchasers. As a result, the loss of any one purchaser would not have a material adverse effect on the ability to sell oil and natural gas production of the Properties.
4. Related Party Transactions
New Dominion, LLC
Scintilla is affiliated by common ownership, and has a working relationship with, New Dominion, LLC, an exploration and production operator based in Tulsa, Oklahoma.
New Dominion is currently contracted to operate the Properties’ existing wells in the Hunton formation in east-central Oklahoma. New Dominion has historically performed this service for Scintilla. As a result, all historical
F-11
Table of Contents
Index to Financial Statements
Oil and Natural Gas Properties Transferred to
New Source Energy Corporation
Notes to Financial Statements
accounts payable related to the Properties are presented as accounts payable—related party in the accompanying balance sheets. Producing overhead charges from New Dominion included in the Properties’ oil and natural gas expenses, drilling and completion overhead charges from New Dominion included in the Properties’ full cost pool of oil and natural gas properties, and saltwater disposal fee charges from New Dominion included in the Properties’ oil and natural gas expenses are shown below for the respective periods. The overhead charges were calculated by multiplying the overhead rate for each well by the working interest associated with the properties transferred.
| Year Ended December 31, | Six Months Ended June 30, |
|||||||||||||||||||
| 2008 | 2009 | 2010 | 2010 | 2011 | ||||||||||||||||
| (In thousands) | ||||||||||||||||||||
| Producing overhead charges |
$ | 475 | $ | 538 | $ | 595 | $ | 288 | $ | 311 | ||||||||||
|
|
|
|
|
|
|
|
|
|
|
|||||||||||
| Drilling and completion overhead charges |
$ | 43 | $ | 43 | $ | 60 | $ | 21 | $ | 37 | ||||||||||
|
|
|
|
|
|
|
|
|
|
|
|||||||||||
| Saltwater disposal fees |
$ | 1,544 | $ | 2,036 | $ | 3,433 | $ | 984 | $ | 1,802 | ||||||||||
|
|
|
|
|
|
|
|
|
|
|
|||||||||||
5. Credit Facility
The accompanying financial statements reflect an allocated portion of New Dominion and Scintilla’s debt, loan fees, and interest expense associated with a credit facility under which the Properties were pledged as collateral. The principal amount that was allocated was equal to the lesser of $60 million (the amount of such debt that was repaid with the proceeds from the credit facility that occurred in connection with the transfer to NSE described in Note 1) or the total amount of such outstanding borrowings. The loan fees and interest expense was allocated based on the proportionate share of the allocated principal amount to the total principal amount outstanding.
In February 2010, the credit facility was refinanced and loan fees attributable to the new facility of $1.4 million were recorded as other assets and are being amortized over the life of the new loan. The credit facility is secured by a first lien security interest in the Properties and has been personally guaranteed by the sole member of Scintilla and New Dominion. The credit facility has a maturity date of February 12, 2013 and accrues interest at a variable rate. Interest on outstanding advances at December 31, 2009 and 2010 was at a weighted average rate of 3.16% and 3.77%, respectively.
Interest rates under the reserve-based credit facility are based on Euro-Dollars (“LIBOR”) or ABR (“Prime”) indications, plus a margin. Interest is generally payable quarterly for Prime loans and at the applicable maturity date for LIBOR loans. The credit agreement contains various covenants, including interest coverage ratio, current ratio, and minimum tangible worth requirements. New Dominion and Scintilla were in compliance with the covenants at December 31, 2010 and 2009, respectively. However, subsequent to March 31, 2011, New Dominion and Scintilla settled certain derivative contracts required by Section 6.23 of the credit facility agreement and therefore, were not in compliance with the debt covenants. On June 15, 2011, New Dominion and Scintilla received a waiver of this debt covenant requirement through July 15, 2011. On July 18, 2011, New Dominion and Scintilla placed the required derivative contracts to be in compliance as required by Section 6.23 of the credit facility.
6. Fair Value Measurements
Measurements of fair value of derivative instruments are classified according to the fair value hierarchy, which prioritizes the inputs to the valuation techniques used to measure fair value. As defined in ASC 820-10, fair value
F-12
Table of Contents
Index to Financial Statements
Oil and Natural Gas Properties Transferred to
New Source Energy Corporation
Notes to Financial Statements
is the price that would be received upon the sale of an asset or paid to transfer a liability in an orderly transaction between market participants at the measurement date. ASC 820-10 requires disclosure that establishes a framework for measuring fair value and expands disclosure about fair value measurements. The statement requires fair value measurements be classified and disclosed in one of the following categories:
Level 1: Measured based on unadjusted quoted prices in active markets that are accessible at the measurement date for identical, unrestricted assets or liabilities. Management considers active markets as those in which transactions for the assets or liabilities occur in sufficient frequency and volume to provide pricing information on an ongoing basis.
Level 2: Measured based on quoted prices in markets that are not active, or inputs which are observable, either directly or indirectly, for substantially the full term of the asset or liability. This category includes those derivative instruments that management values using observable market data. Substantially all of these inputs are observable in the marketplace throughout the term of the derivative instrument, can be derived from observable data, or supported by observable levels at which transactions are executed in the marketplace. Instruments in this category include non-exchange traded derivatives such as oil swaps.
Level 3: Measured based on prices or valuation models that require inputs that are both significant to the fair value measurement and less observable from objective sources (i.e. supported by little or no market activity). Management’s valuation models are primarily industry standard models that consider various inputs including: (a) quoted forward prices for commodities, (b) time value, and (c) current market and contractual prices for the underlying instruments, as well as other relevant economic measures. Level 3 instruments primarily include derivative instruments, such as natural gas liquids (“NGL”) swaps, natural gas swaps for those derivatives that are indexed to local and non-observable indices, and oil, NGL and natural gas collars. Although management utilizes third party broker quotes to assess the reasonableness of our prices and valuation techniques, management does not have sufficient corroborating evidence to support classifying these assets and liabilities as Level 2.
7. Derivative Contracts
The accompanying financial statements reflect an allocated portion of New Dominion and Scintilla’s debt and derivative contracts required by the credit facility. The amount of derivative contracts that has been allocated is based on the proportionate share of the proved reserves of the Properties to the combined proved reserves of New Dominion and Scintilla. Various hedging strategies are utilized to manage the price received for a portion of the future oil and natural gas production to reduce exposure to fluctuations in oil and natural gas prices and to achieve a more predictable cash flow.
During 2008 and 2010, New Dominion and Scintilla entered into certain commodity derivative contracts to manage the impact of oil and natural gas price fluctuations and as required by the terms of the credit facility. For the six months ended June 30, 2010 and 2011, realized gains (losses) on commodity derivatives associated with the Properties amounted to $0.4 million and $(0.9) million, while unrealized gains (losses) amounted to $2.0 million and $(1.8) million, respectively. For the years ended December 31, 2008, 2009 and 2010, realized gains (losses) on commodity derivatives associated with the Properties amounted to $0.3 million, $-0- and $0.9 million, while unrealized gains (losses) amounted to $(0.1) million, $-0- and $(1.4) million, respectively.
F-13
Table of Contents
Index to Financial Statements
Oil and Natural Gas Properties Transferred to
New Source Energy Corporation
Notes to Financial Statements
Commodity derivative positions at December 31, 2010 were as follows:
| Volumes (Bbls) | Avg Price per Bbl | Range per Bbl | ||||||||
| Oil swaps: |
||||||||||
| 2011 |
27,778 | $ | 83.71 | $76.85 - $91.35 | ||||||
| Volumes (Bbls) | Floor Price | Ceiling Price | ||||||||
| Oil collars: |
||||||||||
| 2011 |
29,540 | $ | 69.75 | $91.35 | ||||||
| 2012 |
36,979 | $ | 72.00 | $105.72 | ||||||
| 2013 |
10,495 | $ | 72.00 | $105.01 | ||||||
| Volumes (Gals) | Avg Price per Gal | Range per Gal | ||||||||
| Liquid swaps: |
||||||||||
| 2011 |
6,489,697 | $ | 0.986 | $0.423 - $1.735 | ||||||
| 2012 |
799,949 | $ | 1.123 | $0.399 - $2.008 | ||||||
| 2013 |
3,535,541 | $ | 0.952 | $0.376 - $1.979 | ||||||
| Volumes (Gals) | Floor Price | Ceiling Price | ||||||||
| Liquid collars: |
||||||||||
| 2012 |
1,387,058 | $ | 0.408 | $1.870 | ||||||
| Volumes (MMBtu) | Avg Price per MMBtu | Range per MMBtu | ||||||||
| Natural gas swaps: |
||||||||||
| 2011 |
171,864 | $5.47 | $5.47 | |||||||
| Volumes (MMBtu) | Floor Price | Ceiling Price | ||||||||
| Natural gas collars: |
||||||||||
| 2011 |
1,173,104 | $3.25 | $6.51 | |||||||
| 2012 |
995,781 | $4.04 | $6.65 | |||||||
| 2013 |
557,588 | $4.25 | $6.10 | |||||||
F-14
Table of Contents
Index to Financial Statements
Oil and Natural Gas Properties Transferred to
New Source Energy Corporation
Notes to Financial Statements
Commodity derivative positions at June 30, 2011 were as follows:
| Volumes (Bbls) | Avg Price per Bbl | Range per Bbl | ||||||||
| Oil swaps: |
||||||||||
| 2011 |
11,634 | $ | 82.50 | $80.70 - $83.75 | ||||||
| Volumes (Bbls) | Floor Price | Ceiling Price | ||||||||
| Oil collars: |
||||||||||
| 2011 |
17,074 | $ | 73.00 | $91.35 | ||||||
| 2012 |
43,536 | $ | 72.00 | $111.52 | ||||||
| 2013 |
17,313 | $ | 72.00 | $118.76 | ||||||
| 2014 |
3,860 | $ | 86.50 | $116.97 | ||||||
| Volumes (Gals) | Avg Price per Gal | Range per Gal | ||||||||
| Liquid swaps: |
||||||||||
| 2011 |
3,246,964 | $ | 1.010 | $.424 - $1.734 | ||||||
| 2012 |
1,248,075 | $ | 0.997 | $.399 - $2.008 | ||||||
| 2013 |
3,917,852 | $ | 0.934 | $.376 - $1.979 | ||||||
| 2014 |
606,302 | $ | 1.171 | $.435 - $2.300 | ||||||
| Volumes (Gals) | Floor Price | Ceiling Price | ||||||||
| Liquid collars: |
||||||||||
| 2011 |
1,395,310 | $ | 0.408 | $1.870 | ||||||
| Volumes (MMBtu) | Avg Price per MMBtu | Range per MMBtu | ||||||||
| Natural gas swaps: |
||||||||||
| 2011 |
80,239 | $5.47 | $5.47 | |||||||
| Volumes (MMBtu) | Floor Price | Ceiling Price | ||||||||
| Natural gas collars: |
||||||||||
| 2011 |
512,329 | $3.79 | $6.51 | |||||||
| 2012 |
996,489 | $4.04 | $6.65 | |||||||
| 2013 |
617,625 | $4.25 | $6.20 | |||||||
| 2014 |
120,657 | $4.65 | $6.75 | |||||||
The following table sets forth by level within the fair value hierarchy, the derivative assets and liabilities of the oil and natural gas properties that were accounted for at fair value on a recurring basis as of December 31, 2010:
| Active Markets for Identical Assets (Level 1) |
Observable Inputs (Level 2) |
Unobservable Inputs (Level 3) |
Total Carrying Value |
|||||||||||||
| (In thousands) | ||||||||||||||||
| Oil swaps |
$ | — | $ | (255 | ) | $ | — | $ | (255 | ) | ||||||
| NGL and natural gas swaps |
— | — | (1,606 | ) | (1,606 | ) | ||||||||||
| Oil, NGL and natural gas collars |
— | — | 432 | 432 | ||||||||||||
|
|
|
|
|
|
|
|
|
|||||||||
| Total as of December 31, 2010 |
$ | — | $ | (255 | ) | $ | (1,174 | ) | $ | (1,429 | ) | |||||
|
|
|
|
|
|
|
|
|
|||||||||
F-15
Table of Contents
Index to Financial Statements
Oil and Natural Gas Properties Transferred to
New Source Energy Corporation
Notes to Financial Statements
The following table sets forth by level within the fair value hierarchy, the derivative assets and liabilities of the oil and natural gas properties that were accounted for at fair value on a recurring basis as of June 30, 2011:
| Active Markets for Identical Assets (Level 1) |
Observable Inputs (Level 2) |
Unobservable Inputs (Level 3) |
Total Carrying Value |
|||||||||||||
| (In thousands) | ||||||||||||||||
| Oil swaps |
$ | — | $ | (166 | ) | $ | — | $ | (166 | ) | ||||||
| NGL and natural gas swaps |
— | — | (2,728 | ) | (2,728 | ) | ||||||||||
| Oil, NGL and natural gas collars |
— | — | (354 | ) | (354 | ) | ||||||||||
|
|
|
|
|
|
|
|
|
|||||||||
| Total as of June 30, 2011 |
$ | — | $ | (166 | ) | $ | (3,082 | ) | $ | (3,248 | ) | |||||
|
|
|
|
|
|
|
|
|
|||||||||
There were no open derivative contracts as of December 31, 2009.
Estimates of the fair values of the commodity derivatives are based on published and estimated forward commodity price curves provided by third party counterparties for the underlying commodities as of the date of the estimate for those commodities for which published forward pricing is readily available.
The following table sets forth a reconciliation of changes in the fair value of derivative assets and liabilities classified as Level 3 in the fair value hierarchy:
| Significant Unobservable Inputs (Level 3) |
||||||||||||||||||||
| December 31, | June 30, | |||||||||||||||||||
| 2008 | 2009 | 2010 | 2010 | 2011 | ||||||||||||||||
| (In thousands) | ||||||||||||||||||||
| Beginning balance |
$ | — | $ | — | $ | — | $ | — | $ | (1,174 | ) | |||||||||
| Realized gains (losses) |
(257 | ) | — | 793 | 367 | (743 | ) | |||||||||||||
| Unrealized gains (losses) |
— | — | (1,174 | ) | 1,832 | (1,908 | ) | |||||||||||||
| Settlements paid (received) |
257 | — | (793 | ) | (367 | ) | 743 | |||||||||||||
|
|
|
|
|
|
|
|
|
|
|
|||||||||||
| Ending balance |
$ | — | $ | — | $ | (1,174 | ) | $ | 1,832 | $ | (3,082 | ) | ||||||||
|
|
|
|
|
|
|
|
|
|
|
|||||||||||
| Change in unrealized gains (losses) included in earnings related to derivatives still held at year end |
$ | — | $ | — | $ | (1,174 | ) | $ | 1,832 | $ | (1,908 | ) | ||||||||
|
|
|
|
|
|
|
|
|
|
|
|||||||||||
8. Commitments and Contingencies
New Dominion is a defendant in a legal proceeding arising in the normal course of its business which also relates to the Properties as described below.
In the case of Mattingly v. Equal Energy, LLC, New Dominion is a named defendant. In this case, the plaintiffs assert claims on behalf of a class of royalty owners in wells operated by New Dominion and others from which natural gas is sold by New Dominion to Scissortail Energy, LLC. The plaintiffs assert that royalties to the class should be paid based upon the price received by Scissortail for the gas and its components at the tailgate of the plant, rather than the price paid by Scissortail at the wellhead where the gas is purchased. The plaintiffs assert a variety of breach of contract and tort claims. The case was originally filed in the District Court of Creek County, Oklahoma was removed by the defendants to the federal court but was remanded to state court on August 1, 2011.
F-16
Table of Contents
Index to Financial Statements
Oil and Natural Gas Properties Transferred to
New Source Energy Corporation
Notes to Financial Statements
If a liability does attach to New Dominion as operator, the plaintiffs would look to the working interest owners to pay their proportionate share of any liability. While the outcome and impact on the Properties of this proceeding cannot be predicted with certainty, management believes a range of loss from $10,000 to $250,000 may be reasonably possible.
New Dominion and Scintilla may be involved in other various routine legal proceedings incidental to their businesses which may affect the Properties. However, there were no other material pending legal proceedings to which the Properties are a party or to which any of their assets are subject.
9. Subsequent Events
Management of Scintilla has evaluated events and transactions associated with the Properties after the balance sheet date through August 12, 2011, the date these financial statements were available to be issued.
F-17
Table of Contents
Index to Financial Statements
Oil and Natural Gas Properties Transferred to
New Source Energy Corporation
Unaudited Supplementary Information
Supplemental Oil and Natural Gas Information (unaudited)
Information with respect to oil and natural gas producing activities is presented in the following tables. Estimates of reserve quantities were determined by an independent petroleum engineering firm as of December 2010, 2009 and 2008, and all of this information is unaudited.
Oil and natural gas properties
| December 31, | ||||||||
| 2009 | 2010 | |||||||
| (In thousands) | ||||||||
| Proved |
$ | 151,085 | $ | 178,755 | ||||
| Less: accumulated depreciation, depletion and amortization |
(58,679 | ) | (70,050 | ) | ||||
|
|
|
|
|
|||||
| Net capitalized costs for oil and natural gas properties |
$ | 92,406 | $ | 108,705 | ||||
|
|
|
|
|
|||||
Costs incurred for oil and natural gas producing activities
Costs incurred for oil and natural gas producing activities during the year ended December 31, 2010, consisted of developmental and acquisition expenditures of $22.4 million and $5.3 million, respectively. Costs incurred for oil and natural gas producing activities during the years ended December 31, 2009 and 2008, consisted only of developmental expenditures of $22.4 million and $23.6 million, respectively.
Reserve quantity information
The following information represents estimates of proved reserves associated with the Properties as of December 31, 2010, 2009 and 2008. The proved reserves as of December 31, 2010 and 2009 have been prepared and presented under new SEC rules. These new rules are effective for fiscal years ending on or after December 31, 2009 and require SEC reporting companies to prepare their reserves estimates using revised reserve definitions and revised pricing based on a twelve-month unweighted average of the first-day-of-the-month pricing. The previous rules required that reserve estimates be calculated using last-day-of-the-period pricing. The pricing used for estimates of the Properties’ reserves as of December 31, 2010 and 2009 was based on an unweighted twelve-month average West Texas Intermediate posted price of $79.53 and $61.13, respectively, per Bbl for oil and a Henry Hub spot natural gas price of $4.39 and $3.82, respectively, per MMBtu for natural gas (see table below). The pricing used for estimates of reserves as of December 31, 2008 was based on last-day-of-the-period pricing of $44.60 per Bbl for oil and $5.63 per MMBtu for natural gas. As a result of this change in pricing methodology, direct comparisons of previously-reported reserves amounts may be more difficult.
The Properties are all located in the United States, exclusively in the Hunton formation in east-central Oklahoma. The estimates of proved reserves associated with the Properties at December 31, 2010, 2009 and 2008 are based on reports prepared by independent reserve engineers. Proved reserves for all periods presented were estimated in accordance with the guidelines established by the SEC and the Financial Accounting Standards Board (“FASB”).
F-18
Table of Contents
Index to Financial Statements
The following table summarizes the prices utilized in the reserve estimates as of December 31, 2010, 2009 and 2008 as adjusted for location, grade and quality:
| December 31, | ||||||||||||
| 2008 | 2009 | 2010 | ||||||||||
| Prices utilized in the reserve estimates |
||||||||||||
| Oil (a) |
$ | 41.16 | $ | 61.80 | $ | 75.53 | ||||||
| Liquids (b) |
$ | 24.67 | $ | 30.90 | $ | 37.76 | ||||||
| Gas (c) |
$ | 4.98 | $ | 3.78 | $ | 4.15 | ||||||
| a. | The price of oil used to estimate the Properties’ 2010 and 2009 reserves was based on a twelve-month unweighted average first-day-of-the-month West Texas Intermediate posted price. |
| b. | The price of liquids used to estimate the Properties’ 2010 and 2009 reserves was based on a percentage of oil pricing, which approximates the realizable value received. |
| c. | The price of natural gas used to estimate the Properties’ 2010 and 2009 reserves was based on a twelve-month unweighted average first-day-of-the-month Henry Hub spot price. |
Oil and natural gas reserve quantity estimates are subject to numerous uncertainties inherent in the estimation of quantities of proved reserves and in the projection of future rates of production and the timing of development expenditures. The accuracy of such estimates is a function of the quality of available data and of engineering and geological interpretation and judgment.
Results of subsequent drilling, testing, and production may cause either upward or downward revisions of previous estimates. Further, the volumes considered to be commercially recoverable fluctuate with changes in prices and operating costs. Reserve estimates are inherently imprecise and the estimates of new discoveries are more imprecise than those of currently producing oil and natural gas properties. Accordingly, these estimates are expected to change as additional information becomes available in the future.
The revisions in proved reserves in 2008 were largely due to the deteriorating global financial condition and price environment which existed during late 2008. The revisions in proved reserves in 2010 were largely due to a more detailed mapping process undertaken in 2010 whereby proved undeveloped reserves were reduced to reflect more closely the offset performance. Also, areas where proved developed well performance was not strong during 2010 resulted in several proved developed locations being removed from the previous proved undeveloped category.
F-19
Oil and Natural Gas Properties Transferred to
New Source Energy Corporation
Unaudited Supplementary Information
Table of Contents
Index to Financial Statements
The following table provides a rollforward of the total net proved reserves for the years ended December 31, 2010, 2009 and 2008, as well as proved developed and proved undeveloped reserves at the end of each respective year. Oil and liquids volumes are expressed in Bbls and natural gas volumes are expressed in Mcf.
| Oil (Bbls) |
Natural Gas (Mcf) |
Liquids (Bbls) |
Total Boe |
|||||||||||||
| Total proved reserves |
||||||||||||||||
| Balance, January 1, 2008 |
126,260 | 23,144,680 | 4,936,080 | 8,919,787 | ||||||||||||
| Revisions |
66,104 | (10,696,977 | ) | (1,391,391 | ) | (3,108,117 | ) | |||||||||
| Extensions and discoveries |
90,400 | 6,267,850 | 1,854,930 | 2,989,972 | ||||||||||||
| Production |
(58,784 | ) | (2,157,993 | ) | (526,339 | ) | (944,788 | ) | ||||||||
|
|
|
|
|
|
|
|
|
|||||||||
| Balance, December 31, 2008 |
223,980 | 16,557,560 | 4,873,280 | 7,856,854 | ||||||||||||
|
|
|
|
|
|
|
|
|
|||||||||
| Proved developed reserves |
102,790 | 7,064,500 | 2,092,600 | 3,372,807 | ||||||||||||
| Proved undeveloped reserves |
121,190 | 9,493,060 | 2,780,680 | 4,484,047 | ||||||||||||
|
|
|
|
|
|
|
|
|
|||||||||
| Total proved reserves |
223,980 | 16,557,560 | 4,873,280 | 7,856,854 | ||||||||||||
|
|
|
|
|
|
|
|
|
|||||||||
| Balance, January 1, 2009 |
223,980 | 16,557,560 | 4,873,280 | 7,856,854 | ||||||||||||
| Revisions |
36,378 | 1,217,942 | (257,520 | ) | (18,152 | ) | ||||||||||
| Extensions and discoveries |
189,000 | 18,675,187 | 4,087,120 | 7,388,651 | ||||||||||||
| Production |
(74,908 | ) | (2,032,149 | ) | (498,150 | ) | (911,750 | ) | ||||||||
|
|
|
|
|
|
|
|
|
|||||||||
| Balance, December 31, 2009 |
374,450 | 34,418,540 | 8,204,730 | 14,315,603 | ||||||||||||
|
|
|
|
|
|
|
|
|
|||||||||
| Proved developed reserves |
100,970 | 11,887,620 | 3,044,100 | 5,126,340 | ||||||||||||
| Proved undeveloped reserves |
273,480 | 22,530,920 | 5,160,630 | 9,189,263 | ||||||||||||
|
|
|
|
|
|
|
|
|
|||||||||
| Total proved reserves |
374,450 | 34,418,540 | 8,204,730 | 14,315,603 | ||||||||||||
|
|
|
|
|
|
|
|
|
|||||||||
| Balance, January 1, 2010 |
374,450 | 34,418,540 | 8,204,730 | 14,315,603 | ||||||||||||
| Revisions |
(95,018 | ) | (17,663,282 | ) | (861,392 | ) | (3,900,290 | ) | ||||||||
| Extensions and discoveries |
112,670 | 30,792,450 | 4,170,100 | 9,414,845 | ||||||||||||
| Production |
(70,422 | ) | (1,882,268 | ) | (493,498 | ) | (877,631 | ) | ||||||||
|
|
|
|
|
|
|
|
|
|||||||||
| Balance, December 31, 2010 |
321,680 | 45,665,440 | 11,019,940 | 18,952,527 | ||||||||||||
|
|
|
|
|
|
|
|
|
|||||||||
| Proved developed reserves |
176,270 | 16,579,450 | 5,901,040 | 8,840,552 | ||||||||||||
| Proved undeveloped reserves |
145,410 | 29,085,990 | 5,118,900 | 10,111,975 | ||||||||||||
|
|
|
|
|
|
|
|
|
|||||||||
| Total proved reserves |
321,680 | 45,665,440 | 11,019,940 | 18,952,527 | ||||||||||||
|
|
|
|
|
|
|
|
|
|||||||||
Standardized measure of discounted future net cash flows
The standardized measure of discounted future net cash flows is computed by applying (i) at December 31, 2010 and 2009 the twelve-month unweighted average of the first-day-of-the-month pricing for oil and natural gas and (ii) at December 31, 2008 the year-end prices of oil and natural gas (with consideration of price changes only to the extent provided by contractual arrangements) to the estimated future production of proved oil and natural gas reserves less estimated future expenditures (based on year-end costs) to be incurred in developing and producing the proved reserves, discounted using a rate of 10% per year to reflect the estimated timing of the future cash flows.
F-20
Oil and Natural Gas Properties Transferred to
New Source Energy Corporation
Unaudited Supplementary Information
Table of Contents
Index to Financial Statements
Discounted future cash flow estimates like those shown herein are not intended to represent estimates of the fair value of the Properties. Estimates of fair value would also consider probable and possible reserves, anticipated future oil and natural gas prices, interest rates, changes in development and production costs, and risks associated with future production. Because of these and other considerations, any estimate of fair value is necessarily subjective and imprecise.
The following table provides the standardized measure of discounted future net cash flows as of December 31, 2010, 2009 and 2008:
| December 31, | ||||||||||||
| 2008 | 2009 | 2010 | ||||||||||
| (In thousands) | ||||||||||||
| Future production revenues |
$ | 211,919 | $ | 404,942 | $ | 629,946 | ||||||
| Future costs: |
||||||||||||
| Production |
(49,912 | ) | (99,767 | ) | (152,019 | ) | ||||||
| Development |
(17,125 | ) | (74,546 | ) | (135,507 | ) | ||||||
| Income tax expense(1) |
— | — | — | |||||||||
| 10% annual discount for estimated timing of cash flows |
(36,088 | ) | (83,591 | ) | (141,685 | ) | ||||||
|
|
|
|
|
|
|
|||||||
| Standardized measure of discounted net cash flows |
$ | 108,794 | $ | 147,038 | $ | 200,735 | ||||||
|
|
|
|
|
|
|
|||||||
| (1) | Does not include the effects of income taxes on future net revenues because the Properties were held by a limited liability company not subject to entity-level taxation as of December 31, 2010, 2009, and 2008. Accordingly, no provision for federal or state corporate income taxes has been provided because taxable income is passed through to the equity holders of such limited liability company. |
Changes in standardized measure of discounted future net cash flows
The following table provides a rollforward of the standardized measure of discounted future net cash flows for the years ended December 31, 2010, 2009 and 2008:
| Year Ended December 31, | ||||||||||||
| 2008 | 2009 | 2010 | ||||||||||
| (In thousands) | ||||||||||||
| Discounted future net cash flows at beginning of year |
$ | 132,616 | $ | 108,794 | $ | 147,038 | ||||||
| Increase (decrease) |
||||||||||||
| Sales and transfers, net of production costs |
(45,190 | ) | (21,689 | ) | (30,655 | ) | ||||||
| Net changes in prices and production costs |
(55,817 | ) | (24,247 | ) | 19,799 | |||||||
| Extensions and discoveries |
46,341 | 96,944 | 131,681 | |||||||||
| Changes in future development costs |
18,480 | (34,429 | ) | (38,431 | ) | |||||||
| Purchases of reserves in place |
— | — | 10,975 | |||||||||
| Revisions of previous quantity estimates |
(48,125 | ) | (238 | ) | (64,395 | ) | ||||||
| Timing and other |
47,227 | 11,024 | 10,019 | |||||||||
| Accretion of discount |
13,262 | 10,879 | 14,704 | |||||||||
|
|
|
|
|
|
|
|||||||
| Net increase (decrease) |
(23,822 | ) | 38,244 | 53,697 | ||||||||
|
|
|
|
|
|
|
|||||||
| Discounted future net cash flows at end of year |
$ | 108,794 | $ | 147,038 | $ | 200,735 | ||||||
|
|
|
|
|
|
|
|||||||
F-21
Oil and Natural Gas Properties Transferred to
New Source Energy Corporation
Unaudited Supplementary Information
Table of Contents
Index to Financial Statements
Report of Independent Registered Public Accounting Firm
The Board of Directors and Stockholders of New Source Energy Corporation
Oklahoma City, OK
We have audited the accompanying balance sheet of New Source Energy Corporation, (the “Company”) as of July 12, 2011 (date of inception). This balance sheet is the responsibility of the Company’s management. Our responsibility is to express an opinion on this balance sheet based on our audit.
We conducted our audit in accordance with the standards of the Public Company Accounting Oversight Board (United States). Those standards require that we plan and perform the audit to obtain reasonable assurance about whether the balance sheet is free of material misstatement. We were not engaged to perform an audit of the Company’s internal control over financial reporting. Our audit included consideration of internal control over financial reporting as a basis for designing audit procedures that are appropriate in the circumstances, but not for the purpose of expressing an opinion on the effectiveness of the Company’s internal control over financial reporting. Accordingly, we express no such opinion. An audit also includes examining, on a test basis, evidence supporting the amounts and disclosures in the balance sheet, assessing the accounting principals used and significant estimates made by management, as well as evaluating the overall balance sheet presentation. We believe that our audit provides a reasonable basis for our opinion.
In our opinion, the balance sheet referred to above presents fairly, in all material respects, the financial position of the Company as of July 12, 2011 in conformity with accounting principles generally accepted in the United States of America.
/s/ BDO USA, LLP
Houston, TX
August 12, 2011
F-22
Table of Contents
Index to Financial Statements
Balance Sheet as of July 12, 2011 (Date of Inception)
| ASSETS |
||||
| Total assets |
$ | — | ||
|
|
|
|||
| STOCKHOLDER’S EQUITY |
||||
| Preferred stock, $0.001 par value, 20,000,000 shares authorized; none issued and outstanding |
$ | — | ||
| Common stock, $0.001 par value, 180,000,000 shares authorized; none issued and outstanding |
— | |||
|
|
|
|||
| Total stockholder’s equity |
$ | — | ||
|
|
|
|||
The accompanying notes are an integral part of these financial statements.
F-23
Table of Contents
Index to Financial Statements
Notes to Balance Sheet
(1) Organization and basis of presentation
Organization
New Source Energy Corporation (“NSE” or the “Company”) was incorporated pursuant to the laws of the State of Delaware on July 12, 2011 for the purpose of acquiring and developing oil and natural gas interests.
Basis of presentation
This balance sheet is presented in conformity with GAAP. Separate statements of operations, stockholder’s equity, and cash flows have not been presented because NSE has had no business transactions or activities as of July 12, 2011.
(2) Subsequent Events (Unaudited)
Advance from Related Party
On July 15, 2011, the Company received a $0.4 million advance (“Advance”) from David J. Chernicky, the Company’s chairman and senior geologist, who is also the sole owner of Scintilla, an entity engaged in the oil and natural gas industry. The funds were advanced to NSE for the payment of expenses relating to the contemplated future contribution of certain oil and natural gas properties from Scintilla to NSE in exchange for a majority ownership stake in NSE. The Advance is non-interest bearing and was paid by NSE on August 18, 2011.
Initial Acquisition of Assets and Related Transactions
On August 12, 2011, the Company entered into a four-year, $150.0 million credit agreement with a syndicate of banks led by Bank of Montreal providing for a senior secured revolving credit facility with an initial borrowing base of $72.5 million and with a $5.0 million subfacility for standby letters of credit.
On the same date, pursuant to separate purchase agreements (1) Scintilla transferred certain oil and natural gas properties located in east-central Oklahoma to NSE in exchange for 20.0 million shares of NSE’s common stock and $60.0 million in cash, which NSE borrowed under its credit facility and (2) other parties transferred certain oil and natural gas properties located in east-central Oklahoma to NSE in exchange for 1.2 million shares of NSE’s common stock. The acquisition of the oil and natural gas properties from Scintilla is a transaction among entities under common control and accordingly, the Company will recognize the assets and liabilities acquired at their historical carrying values and present the historical operations of the properties on a retrospective basis for all periods presented in its September 30, 2011 quarterly financial statements. The acquisition of oil and natural gas properties from other contributing parties will be accounted for as purchases at fair value and their operations will be included in the Company’s September 30, 2011 quarterly financial statements from the acquisition date.
The Company also entered into certain registration rights agreements with the contributing parties, including the David J. Chernicky Trust as successor in interest of Scintilla, relating to the common stock issued to them in connection with the purchase transactions. Pursuant to these agreements and subject to certain conditions, the Company is required, at its expense, to use its best efforts to register the resale of these shares of common stock upon demand of one or more of the contributing parties no earlier than six months from the date of the registration rights agreement, and no more than twice in total. The Company is also required to use its best reasonable efforts to register the contributing parties’ common stock for resale in any registration statement filed on or after six months from the date of the registration rights agreement.
F-24
Table of Contents
Index to Financial Statements
New Source Energy Corporation
Notes to Balance Sheet
Under agreements entered into in connection with the transfer of assets, the Company obtained an exclusive right of first refusal from Scintilla and New Dominion (an entity majority owned by David J. Chernicky which is also engaged in the oil and natural gas industry), to participate in all oil and natural gas projects undertaken by either of these parties in the state of Oklahoma for a 25-year period in exchange for a payment of fair value for an interest in such projects, determined each time the Company elects to participate.
The Company entered into a joint operating agreement and became a party to an existing joint operating agreement related to the assets acquired from Scintilla and the contributing parties pursuant to which New Dominion will serve as the contract operator of the Company’s oil and natural gas properties. Accordingly, the Company has access to New Dominion’s existing infrastructure in place, particularly saltwater disposal pipelines and wells and electricity.
Private Placement of Common Stock
On August 12, 2011, NSE completed a private placement of 157,500 shares of its common stock at a price of $10.00 per share, solely to accredited investors, raising gross proceeds of $1.6 million.
Employment Agreements
During August of 2011, the Company entered into employment agreements with its (a) president and chief executive officer, (b) chief financial officer and treasurer, (c) senior geologist and executive chairman, and (d) general counsel and secretary.
In connection with the employment agreements, the Company granted 2,900,000 shares of restricted common stock, with 1,000,000 shares vesting upon the first anniversary of the date of grant, 700,000 shares vesting on the second anniversary of the date of grant and the remaining 1,200,000 shares vesting on the completion of the Company’s initial public offering of common stock pursuant to a filed prospectus provided that the employees remain employed by the Company on the applicable vesting dates subject to limited exceptions.
Evaluation of Subsequent Events
Subsequent events have been evaluated through August 12, 2011, which is the date the financial statements were available to be issued.
F-25
Table of Contents
Index to Financial Statements
PART II
INFORMATION NOT REQUIRED IN PROSPECTUS
| ITEM 13. | Other Expenses of Issuance and Distribution |
The following table sets forth an itemized statement of the amounts of all expenses (excluding underwriting discounts and commissions) payable by us in connection with the registration of the common stock offered hereby. With the exception of the Registration Fee, FINRA Filing Fee and NYSE listing fee, the amounts set forth below are estimates.
| SEC Registration Fee |
$ | 11,610 | ||
| FINRA Filing Fee |
10,500 | |||
| New York Stock Exchange listing fee |
* | |||
| Accountants’ fees and expenses |
* | |||
| Legal fees and expenses |
* | |||
| Printing and engraving expenses |
* | |||
| Transfer agent and registrar fees |
* | |||
| Miscellaneous |
* | |||
|
|
|
|||
| Total |
$ | |||
|
|
|
| * | To be provided by amendment |
| ITEM 14. | Indemnification of Directors and Officers |
Our certificate of incorporation provides that a director will not be liable to the corporation or its stockholders for monetary damages for breach of fiduciary duty as a director, except for liability (1) for any breach of the director’s duty of loyalty to the corporation or its stockholders, (2) for acts or omissions not in good faith or which involved intentional misconduct or a knowing violation of the law, (3) under section 174 of the DGCL for unlawful payment of dividends or improper redemption of stock or (4) for any transaction from which the director derived an improper personal benefit. In addition, we expect that if the DGCL is amended to authorize the further elimination or limitation of the liability of directors, then the liability of a director of the corporation, in addition to the limitation on personal liability provided for in our certificate of incorporation, will be limited to the fullest extent permitted by the amended DGCL. Our bylaws provide that the corporation will indemnify, and advance expenses to, any officer or director to the fullest extent authorized by the DGCL.
Section 145 of the DGCL provides that a corporation may indemnify directors and officers as well as other employees and individuals against expenses, including attorneys’ fees, judgments, fines and amounts paid in settlement in connection with specified actions, suits and proceedings whether civil, criminal, administrative, or investigative, other than a derivative action by or in the right of the corporation, if they acted in good faith and in a manner they reasonably believed to be in or not opposed to the best interests of the corporation and, with respect to any criminal action or proceeding, had no reasonable cause to believe their conduct was unlawful. A similar standard is applicable in the case of derivative actions, except that indemnification extends only to expenses, including attorneys’ fees, incurred in connection with the defense or settlement of such action and the statute requires court approval before there can be any indemnification where the person seeking indemnification has been found liable to the corporation. The statute provides that it is not exclusive of other indemnification that may be granted by a corporation’s certificate of incorporation, bylaws, disinterested director vote, stockholder vote, agreement or otherwise.
Our certificate of incorporation contains indemnification rights for our directors and our officers. Specifically, our certificate of incorporation provides that we will indemnify our officers and directors to the fullest extent authorized by the DGCL. Further, we intend to continue to be allowed to maintain insurance on behalf of our officers and directors against expense, liability or loss asserted incurred by them in their capacities as officers and directors.
II-1
Table of Contents
Index to Financial Statements
We have obtained directors’ and officers’ insurance to cover our directors, officers and some of our employees for certain liabilities.
We expect to enter into written indemnification agreements with our directors and officers. We expect that under these agreements, if an officer or director makes a claim of indemnification to us, either a majority of the independent directors or independent legal counsel selected by the independent directors will review the relevant facts and make a determination whether the officer or director has met the standards of conduct under Delaware law that would permit (under Delaware law) and require (under the indemnification agreement) us to indemnify the officer or director.
| ITEM 15. | Recent Sales of Unregistered Securities |
The contributing parties contributed their interests in the Acquired Assets for a total of 21.2 million shares of our common stock. On August 12, 2011 we sold 157,500 shares of our common stock in a private offering for consideration of approximately $1.6 million. On August 18, 2011, we issued 2.9 million shares of our common stock in the form of shares of restricted stock to employees.
The issuance of our common stock did not involve any underwriters or a public offering, and we believe that such issuance was exempt from the registration requirements pursuant to Section 4(2) of the Securities Act of 1933, as amended, due to the limited number of persons involved and their relationship with us.
| ITEM 16. | Exhibits and Financial Statement Schedules |
A list of exhibits filed as part of this registration statement is set forth in the Exhibit Index, which is incorporated herein by reference.
| ITEM 17. | Undertakings |
The undersigned registrant hereby undertakes to provide to the underwriters at the closing specified in the underwriting agreement certificates in such denominations and registered in such names as required by the underwriters to permit prompt delivery to each purchaser.
Insofar as indemnification for liabilities arising under the Securities Act may be permitted to directors, officers and controlling persons of the registrant pursuant to the foregoing provisions, or otherwise, the registrant has been advised that in the opinion of the Securities and Exchange Commission such indemnification is against public policy as expressed in the Securities Act and is, therefore, unenforceable. In the event that a claim for indemnification against such liabilities (other than the payment by the registrant of expenses incurred or paid by a director, officer or controlling person of the registrant in the successful defense of any action, suit or proceeding) is asserted by such director, officer or controlling person in connection with the securities being registered, the registrant will, unless in the opinion of its counsel the matter has been settled by controlling precedent, submit to a court of appropriate jurisdiction the question whether such indemnification by it is against public policy as expressed in the Securities Act and will be governed by the final adjudication of such issue.
The undersigned registrant hereby undertakes that:
(1) For purposes of determining any liability under the Securities Act, the information omitted from the form of prospectus filed as part of this registration statement in reliance upon Rule 430A and contained in a form of prospectus filed by the registrant pursuant to Rule 424(b)(1) or (4) or 497(h) under the Securities Act shall be deemed to be part of this registration statement as of the time it was declared effective.
(2) FOR THE PURPOSE OF DETERMINING ANY LIABILITY UNDER THE SECURITIES ACT, EACH POST-EFFECTIVE AMENDMENT THAT CONTAINS A FORM OF PROSPECTUS SHALL BE DEEMED TO BE A NEW REGISTRATION STATEMENT RELATING TO THE SECURITIES OFFERED THEREIN, AND THE OFFERING OF SUCH SECURITIES AT THAT TIME SHALL BE DEEMED TO BE THE INITIAL BONA FIDE OFFERING THEREOF.
II-2
Table of Contents
Index to Financial Statements
SIGNATURES
Pursuant to the requirements of the Securities Act of 1933, the registrant has duly caused this registration statement to be signed on its behalf by the undersigned, thereunto duly authorized in the City of Oklahoma City, State of Oklahoma, on October 11, 2011.
| New Source Energy Corporation (Registrant) | ||
| By: | /S/ KRISTIAN B. KOS | |
| Kristian B. Kos, President and Chief Executive Officer | ||
Pursuant to the requirements of the Securities Act of 1933, this registration statement has been signed by the following persons in the capacities and on the dates indicated.
| Date: October 11, 2011 |
||||||||
| By: | /S/ KRISTIAN B. KOS | |||||||
| Kristian B. Kos, Director, President and Chief Executive Officer (Principal Executive Officer) | ||||||||
| Date: October 11, 2011 |
||||||||
| By: | * | |||||||
| David J. Chernicky, Chairman of the Board and Senior Geologist | ||||||||
| Date: October 11, 2011 |
||||||||
| By: | * | |||||||
| Richard D. Finley, Chief Financial Officer | ||||||||
| Date: October 11, 2011 |
||||||||
| By: | * | |||||||
| Kevin A. Easley, Director | ||||||||
| *By: | /S/ KRISTIAN B. KOS | |||||||
| Kristian B. Kos, Attorney-in-Fact | ||||||||
II-3
Table of Contents
Index to Financial Statements
INDEX TO EXHIBITS
| Exhibit |
Description | |
| 1.1* | Form of Underwriting Agreement | |
| 3.1† | Certificate of Incorporation | |
| 3.2† | Bylaws | |
| 5.1* | Opinion of Crowe & Dunlevy, A Professional Corporation as to the legality of the securities being offered | |
| 10.1† | Credit Agreement, dated as of August 12, 2011, among the Registrant, Bank of Montreal, as Administrative Agent, and the lenders party thereto | |
| 10.2† | Contribution Agreement, dated as of August 12, 2011, between the Registrant and Scintilla, LLC | |
| 10.3† | Contribution Agreement, dated as of August 12, 2011, among the Registrant, Deylau, LLC, Timothy R. and Robin L. Cargile, W.K. Chernicky, L.L.C., Okeanos, Inc., Tony McKaig, and Red Dragon, L.L.C. | |
| 10.4† | Right of First Refusal and Access Agreement, dated as of August 12, 2011, among the Registrant, New Dominion, LLC and Scintilla, LLC | |
| 10.5† | Golden Lane Participation Agreement, dated as of January 10, 2007, among New Dominion, LLC, as operator, and the working interest holders in the Golden Lane field | |
| 10.6† | First Amendment to Golden Lane Participation Agreement, dated as of October, 2007, among New Dominion, as operator, and the working interest holders in the Golden Lane field | |
| 10.7† | Joint Operating Agreement, dated as of August 12, 2011, among the Registrant, New Dominion, LLC and Scintilla, LLC | |
| 10.8† | Registration Rights Agreement, dated as of August 12, 2011, among the Registrant, the David J. Chernicky Trust, Deylau, LLC, Timothy R. and Robin L. Cargile, W.K. Chernicky, L.L.C., Okeanos, Inc., Tony McKaig, and Red Dragon, L.L.C. | |
| 10.9† | Letter governing terms of employment between Kristian B. Kos and the Registrant | |
| 10.10† | Letter governing terms of employment between Richard D. Finley and the Registrant | |
| 10.11† | Letter governing terms of employment between David J. Chernicky and the Registrant | |
| 10.12† | Letter governing terms of employment between V. Bruce Thompson and the Registrant | |
| 21.1† | Table of Subsidiaries (Not Applicable) | |
| 23.1* | Consent of Crowe & Dunlevy, A Professional Corporation (included in Exhibit 5.1) | |
| 23.2 | Consent of BDO USA, LLP | |
| 23.3 | Consent of Ralph E. Davis Associates, Inc. | |
| 24.1† | Powers of Attorney (included on signature page to this registration statement) | |
| 99.1 | Report of Independent Petroleum Engineers, Ralph E. Davis Associates, Inc., relating to oil and natural gas reserves as of December 31, 2010. | |
| * | To be filed by amendment |
| † | Previously filed with this registration statement |
II-4