Attached files
| file | filename |
|---|---|
| EX-23.1 - EX-23.1 - Laredo Petroleum, Inc. | a2205314zex-23_1.htm |
| EX-23.3 - EX-23.3 - Laredo Petroleum, Inc. | a2205314zex-23_3.htm |
| EX-23.2 - EX-23.2 - Laredo Petroleum, Inc. | a2205314zex-23_2.htm |
Use these links to rapidly review the document
Table of contents
Index to financial statements
As filed with the Securities and Exchange Commission on October 7, 2011
Registration No. 333-176439
UNITED STATES
SECURITIES AND EXCHANGE COMMISSION
Washington, D.C. 20549
AMENDMENT NO. 1
TO
FORM S-1
REGISTRATION STATEMENT
UNDER
THE SECURITIES ACT OF 1933
LAREDO PETROLEUM HOLDINGS, INC.
(Exact name of registrant as specified in its charter)
| Delaware (State or other jurisdiction of incorporation or organization) |
1311 (Primary Standard Industrial Classification Code Number) |
45-3007926 (IRS Employer Identification No.) |
15 W. Sixth Street, Suite 1800
Tulsa, Oklahoma 74119
(918) 513-4570
(Address, including zip code, and telephone number, including area code, of registrant's principal executive offices)
Kenneth E. Dornblaser
Senior Vice President & General Counsel
15 W. Sixth Street, Suite 1800
Tulsa, Oklahoma 74119
(918) 513-4570
(Name, address, including zip code, and telephone number, including area code, of agent for service)
| Copies to: | ||
Christine B. LaFollette Akin Gump Strauss Hauer & Feld LLP 1111 Louisiana Street, 44th Floor Houston, Texas 77002 (713) 220-5800 |
G. Michael O'Leary Andrews Kurth LLP 600 Travis, Suite 4200 Houston, Texas 77002 (713) 220-4200 |
|
Approximate date of commencement of proposed sale to the public:
As soon as practicable after this registration statement becomes effective.
If any of the securities being registered on this Form are to be offered on a delayed or continuous basis pursuant to Rule 415 under the Securities Act of 1933, check the following box. o
If this Form is filed to register additional securities for an offering pursuant to Rule 462(b) under the Securities Act, check the following box and list the Securities Act registration statement number of the earlier effective registration statement for the same offering. o
If this Form is a post-effective amendment filed pursuant to Rule 462(c) under the Securities Act, check the following box and list the Securities Act registration statement number of the earlier effective registration statement for the same offering. o
If this Form is a post-effective amendment filed pursuant to Rule 462(d) under the Securities Act, check the following box and list the Securities Act registration statement number of the earlier effective registration statement for the same offering. o
Indicate by check mark whether the registrant is a large accelerated filer, an accelerated filer, a non-accelerated filer, or a smaller reporting company. (check one)
| Large accelerated filer o | Accelerated filer o | Non-accelerated filer ý (Do not check if a smaller reporting company) |
Smaller reporting company o |
The registrant hereby amends this registration statement on such date or dates as may be necessary to delay its effective date until the registrant shall file a further amendment which specifically states that this registration statement shall thereafter become effective in accordance with Section 8(a) of the Securities Act of 1933, as amended, or until the registration statement shall become effective on such date as the Securities and Exchange Commission, acting pursuant to said Section 8(a), may determine.
Subject to completion, dated October 7, 2011
The information in this prospectus is not complete and may be changed. We may not sell these securities until the registration statement filed with the Securities and Exchange Commission is effective. This prospectus is not an offer to sell these securities, and we are not soliciting an offer to buy these securities in any state where the offer or sale is not permitted.
Prospectus
shares

Common stock
This is the initial public offering of shares of common stock by Laredo Petroleum Holdings, Inc. Laredo is selling shares of common stock. The estimated initial public offering price is between $ and $ per share.
We intend to apply to have our shares of common stock listed on the New York Stock Exchange under the symbol "LPI."
|
Per share | Total | |||||
Initial public offering price |
$ | $ | |||||
Underwriting discounts and commissions |
$ |
$ |
|||||
Proceeds to Laredo, before expenses |
$ |
$ |
|||||
We have granted the underwriters an option for a period of 30 days from the date of this prospectus to purchase up to an additional shares of our common stock.
Investing in our common stock involves a high degree of risk. Please read "Risk factors" beginning on page 14.
Neither the Securities and Exchange Commission nor any state securities commission has approved or disapproved of these securities or passed upon the accuracy or adequacy of this prospectus. Any representation to the contrary is a criminal offense.
| J.P. Morgan | ||||||
Goldman, Sachs & Co. |
||||||
BofA Merrill Lynch |
||||||
Wells Fargo Securities |
||||||
| Tudor, Pickering, Holt & Co. | ||||||
SOCIETE GENERALE |
Mitsubishi UFJ Securities |
BMO Capital Markets |
BNP PARIBAS |
|||
| Scotia Capital | Capital One Southcoast | BOSC, Inc. |
| BB&T Capital Markets | Comerica Securities | Howard Weil Incorporated |
, 2011
You should rely only on the information contained in this prospectus or in any free writing prospectus we may authorize to be delivered to you. Neither we nor the underwriters have authorized anyone to provide you with additional or different information. If anyone provides you with different or inconsistent information, you should not rely on it. We are offering to sell, and seeking offers to buy, our common stock only in jurisdictions where offers and sales are permitted. The information in this prospectus is accurate as of the date of this prospectus, regardless of the time of delivery of this prospectus or any sale of our common stock. Our business, financial condition, results of operation and prospects may have changed since that date.
i
Through and including , 2011 (25 days after the commencement of this offering), all dealers that effect transactions in our common stock, whether or not participating in this offering, may be required to deliver a prospectus. This delivery requirement is in addition to a dealer's obligation to deliver a prospectus when acting as an underwriter and with respect to their unsold allotments or subscriptions.
This prospectus contains forward-looking statements that are subject to a number of risks and uncertainties, many of which are beyond our control. See "Risk factors" and "Forward-looking statements."
Industry and market data
This prospectus includes industry and market data that we obtained from independent industry publications, government publications or other published independent sources. These publications generally state that the information contained therein has been obtained from sources believed to be reliable, although they do not guarantee the accuracy or completeness of such information. While we believe that each of these publications is reliable, we have not independently verified any of the data from third-party sources nor have we ascertained the underlying economic or operational assumptions relied upon therein.
ii
This summary highlights selected information contained elsewhere in this prospectus. You should read the entire prospectus, including the information presented under the headings "Risk factors," "Forward-looking statements" and "Management's discussion and analysis of financial condition and results of operations" and the pro forma condensed combined and historical combined financial statements and notes thereto included elsewhere in this prospectus before making an investment decision with respect to our common stock. Unless otherwise indicated, information presented in this prospectus assumes that the underwriters' option to purchase additional shares of common stock is not exercised. We have provided definitions for certain oil and natural gas terms used in this prospectus in the "Glossary of oil and natural gas terms" beginning on page A-1 of this prospectus.
In this prospectus, the pro forma condensed combined and historical financial information, operational data and reserve information for Laredo and our recently acquired subsidiary Broad Oak Energy, Inc., a Delaware corporation ("Broad Oak" and subsequently renamed Laredo Petroleum—Dallas, Inc.), have been combined. Although the financial and other information is reported on a combined basis, such presentation is not necessarily indicative of the results that would have been obtained if Laredo had owned and operated Broad Oak from its inception. In addition, our estimated proved reserve information as of June 30, 2011 contained in this prospectus is based on a reserve report relating to our combined properties prepared by our independent petroleum engineers Ryder Scott Company, L.P. ("Ryder Scott"), a summary of which is included in this prospectus as Annex B.
We expect to complete a corporate reorganization simultaneously with, or prior to, the closing of this offering. Unless the context otherwise requires, references in this prospectus to "Laredo," "we," "our," "us" or similar terms refer to Laredo Petroleum, LLC, a Delaware limited liability company, and its subsidiaries before the completion of our corporate reorganization, and to Laredo Petroleum Holdings, Inc., a Delaware corporation, and its subsidiaries as of the completion of our corporate reorganization and thereafter. For a description of the corporate reorganization, see "Corporate reorganization."
Laredo Petroleum Holdings, Inc.
Overview
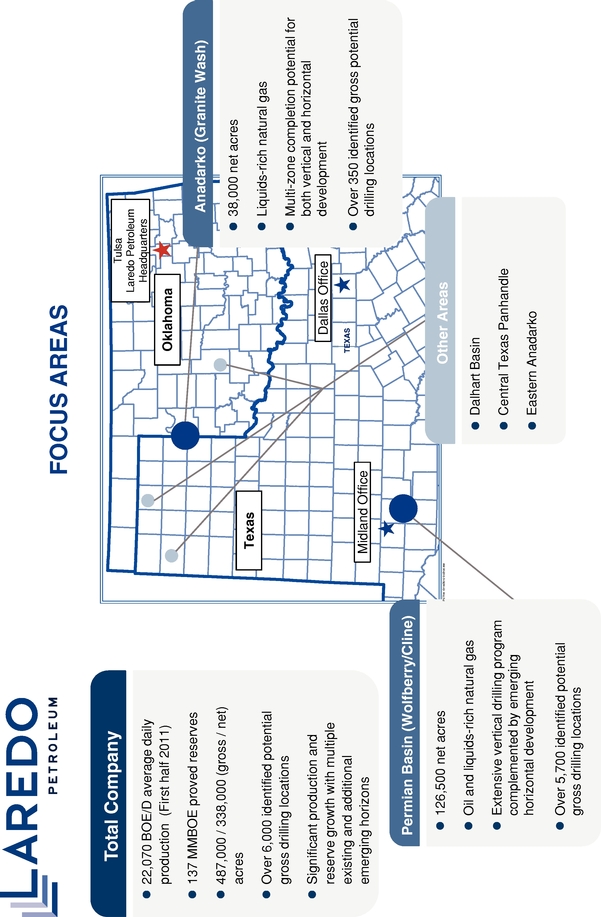
We are an independent energy company focused on the exploration, development and acquisition of oil and natural gas in the Permian and Mid-Continent regions of the United States. Our activities are primarily focused in the Wolfberry and deeper horizons of the Permian Basin in West Texas and the Anadarko Granite Wash in the Texas Panhandle and Western Oklahoma, where we have assembled approximately 126,500 net acres and 38,000 net acres, respectively. These plays are characterized by high oil and liquids-rich natural gas content, multiple target horizons, extensive production histories, long-lived reserves, high drilling success rates and significant initial production rates.
Based upon drilling results from over 625 of our vertical wells, we believe our economic vertical program in these areas has been largely de-risked. Our vertical development drilling activity is complemented by a rapidly emerging horizontal drilling program, which may add significant production and reserves in multiple producing horizons on the same acreage. These drilling
1
programs comprise an extensive, multi-year inventory of exploratory and development opportunities. As of October 1, 2011, we have drilled 23 gross horizontal wells in the Permian and ten gross horizontal wells in the Anadarko Granite Wash.
Laredo was founded in October 2006 by our Chairman and Chief Executive Officer Randy A. Foutch, who was later joined by other members of our management team, many of whom have worked together for a decade or more. Prior to founding Laredo, Mr. Foutch formed, built and sold three private oil and gas companies, all of which were focused on the same general areas of the Permian and Mid-Continent regions in which Laredo currently operates. All of these companies executed the same fundamental business strategy that created significant growth in cash flow, production and reserves. These companies had a total of approximately $547 million of debt and equity capital invested and their cumulative sales proceeds were approximately $1.1 billion.
Since our inception, we have rapidly grown our cash flow, production and reserves through our drilling program. We also seek acquisition opportunities that are complementary to our assets and provide upside potential that is competitive with our existing property portfolio. On July 1, 2011, we completed the acquisition of Broad Oak for a combination of equity and cash. This acquisition provided us incremental scale and significant additional exposure to attractive vertical and horizontal oil and liquids-rich natural gas opportunities. The acquired properties are concentrated on a contiguous land position located in the Permian Basin, primarily in Reagan County, and are being drilled targeting Wolfberry production. This acreage, totaling approximately 64,000 net acres, approximately doubled our Permian Basin position and is immediately south of and on trend with our legacy Permian Basin properties in Glasscock and Howard Counties. We believe the success Laredo has achieved to date in drilling our vertical and horizontal wells may add significant value to this newly acquired acreage.
On a combined basis, our net cash provided by operating activities was approximately $162.1 million for the six months ended June 30, 2011. Our net average daily production for the same period was approximately 22,070 BOE, and our net proved reserves were an estimated 137,052 MBOE as of June 30, 2011.
The following table summarizes, on a combined basis, including our recent acquisition, net acreage, total estimated net proved reserves and producing wells as of June 30, 2011, and average daily production for the six months ended June 30, 2011 in our principal operating regions. Our reserve estimates as of June 30, 2011 are based on a report prepared by Ryder Scott, our independent reserve engineers. Based on such report, we operated approximately 98% of the production from our proved developed oil and natural gas reserves as of June 30, 2011. In addition, the table shows our internally identified potential gross drilling locations as of June 30, 2011.
2
| |
|
Estimated net proved reserves(2)(3) |
|
|
|
|
|
|||||||||||||||||||
|---|---|---|---|---|---|---|---|---|---|---|---|---|---|---|---|---|---|---|---|---|---|---|---|---|---|---|
| |
|
|
Average daily production(3) |
Producing wells |
|
|||||||||||||||||||||
| |
|
|
Identified potential drilling locations(4) |
|||||||||||||||||||||||
| |
|
|
% of Total reserves |
|
||||||||||||||||||||||
| |
Net acreage |
MBOE(1) |
% Oil |
(BOE/D) |
Gross |
Net |
||||||||||||||||||||
Permian |
126,531 | 86,007 | 63% | 49% | 13,437 | 511 | 494 | 5,764 | ||||||||||||||||||
Anadarko Granite Wash |
38,273 | 40,582 | 30% | 8% | 5,782 | 162 | 120 | 351 | ||||||||||||||||||
Other(5) |
173,318 | 10,463 | 7% | 3% | 2,851 | 355 | 180 | — | ||||||||||||||||||
Total |
338,122 | 137,052 | 100% | 34% | 22,070 | 1,028 | 794 | 6,115 | ||||||||||||||||||
(1) MBbl equivalents ("MBOE") converted at a rate of six MMcf per one MBbl.
(2) Our estimated net proved reserves were prepared by Ryder Scott as of June 30, 2011 and are based on reference oil and natural gas prices. In accordance with applicable rules of the Securities and Exchange Commission ("SEC"), the reference oil and natural gas prices are derived from the average trailing twelve-month index prices (calculated as the unweighted arithmetic average of the first-day-of-the-month price for each month within the applicable twelve-month period), held constant throughout the life of the properties. The reference prices were $86.60/Bbl for oil and $4.00/MMBtu for natural gas for the twelve months ended June 30, 2011.
(3) Our reserves and production are reported in two streams: crude oil and liquids-rich natural gas. The economic value of the natural gas liquids in our natural gas is included in the wellhead natural gas price. The reference prices referred to above that were utilized in the June 30, 2011 reserve report prepared by Ryder Scott are adjusted for natural gas liquids content, quality, transportation fees, geographical differentials, marketing bonuses or deductions and other factors affecting the price received at the wellhead. The adjusted reference prices in the Permian area were $7.07/Mcf and $6.79/Mcf for the legacy Laredo and Broad Oak properties, respectively, and $4.84/Mcf in the Anadarko Granite Wash area.
(4) See "Business—Overview" for more information regarding the processes and criteria through which these potential drilling locations were identified.
(5) Includes our acreage in the gas prone Eastern Anadarko (45,281 net acres) and Central Texas Panhandle (54,213 net acres), as well as the Dalhart Basin, which is a new exploration effort (73,824 net acres) targeting liquids-rich formations that are less than 7,000 feet in depth.
We have assembled a multi-year inventory of development drilling and exploitation projects as a result of our early acquisition of technical data, early establishment of significant acreage positions and successful exploratory drilling. We plan to continue our conventional vertical drilling programs, especially in the Permian Basin, and to further de-risk our rapidly emerging horizontal plays in both the Permian and Anadarko Basins. As of October 1, 2011, we have a total of 15 operated drilling rigs running. Ten of these rigs are working on our properties in the Permian Basin, eight of which are drilling vertical wells and two are drilling horizontal wells. The other five rigs are operating on our properties in the Anadarko Granite Wash, three of which are drilling horizontal wells, and two are drilling vertical wells.
Our business strategy
Our goal is to enhance stockholder value by economically growing our cash flow, production and reserves by executing the following strategy:
Grow production and reserves through our lower-risk vertical drilling. We leverage our operating and technical expertise to establish large, contiguous acreage positions. We believe that we have reduced the risk and uncertainty associated with (or "de-risked") our core acreage positions by our vertical development activity, and we intend to generate significant growth in cash flows, production and reserves by drilling our inventory of locations. Our vertical development drilling program not only provides repeatable, predictable, low-risk production growth but also serves as an efficient way to obtain additional critical sub-surface data to target potential horizontal wells.
3
Increase recovery and capital efficiency through our horizontal drilling. Our horizontal drilling program is designed to further capture the upside potential that may exist on our properties. Horizontal drilling may significantly increase our well performance and recoveries compared to our vertical wells. In addition, horizontal drilling may be economic in areas where vertical drilling is currently not economical or logistically viable. We believe multiple vertically stacked producing horizons may be developed using horizontal drilling techniques in both our Permian and Anadarko Granite Wash plays.
Apply our technical expertise to reduce risk in our current asset portfolio, optimize our development program and evaluate emerging opportunities. Our management team has significant experience in successfully identifying opportunities to enhance our cash flow, production and reserves in the basins in which we operate. Our practice is to make a substantial upfront investment to understand the geology, geophysics and reservoir parameters of the rock formations that define our exploration and development programs. Through comprehensive coring programs, acquisition and evaluation of high quality 3D seismic data and advance logging / simulation technologies, we seek to economically de-risk our opportunities to the extent possible before committing to a drilling program.
Enhance returns through prudent capital allocation and continued improvements in operational and cost efficiencies. In the current commodity price environment, we have directed our capital spending toward oil and liquids-rich drilling opportunities that provide attractive returns. Our management team is focused on continuous improvement of our operating practices and has significant experience in successfully converting exploration programs into cost efficient development projects. Operational control allows us to more effectively manage operating costs, the pace of development activities, technical applications, the gathering and marketing of our production and capital allocation.
Evaluate and pursue value enhancing acquisitions, mergers and joint ventures. While we believe our multi-year inventory of identified potential drilling locations provides us with significant growth opportunities, we will continue to evaluate strategically compelling asset acquisitions, mergers and joint ventures within our core areas. Any transaction we pursue will generally complement our asset base and provide a competitive economic proposition relative to our existing opportunities. Our Laredo operated joint ventures with Exxon Mobil and Linn Energy, our 2008 acquisition of properties from Linn Energy and our recently completed acquisition of Broad Oak are examples of this strategy.
Proactively manage risk to limit downside. We continually monitor and control our business and operating risks through various risk management practices, including maintaining a conservative financial profile, making significant upfront investment in research and development as well as data acquisition, owning and operating our natural gas gathering systems with multiple sales outlets, minimizing long-term contracts, maintaining an active commodity hedging program and employing prudent safety and environmental practices.
Our competitive strengths
We have a number of competitive strengths that we believe will help us to successfully execute our business strategy:
Management team with extensive operating experience in core areas of operation. Our management team has extensive industry experience and a proven record of providing a
4
significant return on investment. Four of our six senior officers have worked with Mr. Foutch at one or more of his previous companies. This has resulted in a high degree of continuity among members of our executive managment and has enabled us to attract and retain key employees from previous companies as well as other successful exploration and production companies. Each of Mr. Foutch's previous companies focused on the same general areas of the Permian and Anadarko Basins in which Laredo currently operates. Most members of our management team have over twenty years of experience and knowledge directly associated with our current primary operating areas. Approximately 47% of our full-time employees are experienced technical employees, including 24 petroleum engineers, 21 geoscientists, 15 landmen and 20 technical support staff.
Economic, multi-year drilling inventory. We have assembled a portfolio of over 6,000 identified potential gross drilling locations. We believe our focus on data-rich, mature producing basins with well studied geology, engineering practices and concentrated operation, combined with new technologies in the Permian and Anadarko Basins, as well as our disciplined assessment and monitoring of the three factors that we believe help to de-risk our drilling and exploration projects, as described in the section entitled "Business—Overview," significantly decreases the risk profile of our identified drilling locations. As of October 1, 2011, we have approximately 1,493 square miles of 3D seismic data supporting our exploratory and development drilling programs. From our formation in 2006 through June 30, 2011, we have drilled over 650 vertical and horizontal wells with a success rate of approximately 99%. Our drilling activity has been and will continue to be focused on liquids-rich opportunities in the Permian Basin and Anadarko Granite Wash, where we see liquids-rich natural gas that ranges from 1,230 to 1,425 Btu per cubic foot and 1,115 to 1,175 Btu per cubic foot, respectively. Pursuant to our existing percentage of proceeds contracts during June 2011, our natural gas liquids yield was 133 Bbls/MMcf in the Permian Basin and 65 Bbls/MMcf in the Anadarko Granite Wash.
Significant operational control. We operate approximately 98% of the production from our proved developed oil and natural gas reserves as of June 30, 2011 based on a report prepared by Ryder Scott. We believe that maintaining operating control permits us to better pursue our strategies of enhancing returns through operational and cost efficiencies and maximizing ultimate hydrocarbon recoveries from mature producing basins through reservoir analysis and evaluation and continuous improvement of drilling, completion and stimulation techniques. We expect to maintain operational control over most of our identified potential drilling locations.
Our gathering infrastructure provides secure and timely takeaway capacity and enhanced economics. Our wholly-owned subsidiary, Laredo Gas Services, LLC, has invested approximately $49.0 million in over 170 miles of pipeline in our natural gas gathering systems in the Permian and Anadarko Basins as of June 30, 2011. We have also installed over 400 miles of natural gas gathering lines to over 50 central delivery points on our Permian acreage in Reagan County. These systems and flow lines provide greater operational efficiency and lower differentials for our natural gas production in our liquids-rich Permian and Anadarko Granite Wash plays and enable us to coordinate our activities to connect our wells to market upon completion with minimal days waiting on pipeline. Additionally, they provide us with multiple sales outlets through interconnecting pipelines, minimizing the risks of shut-ins awaiting pipeline connection or curtailment by downstream pipelines.
5
Financial strength and flexibility. We maintain a conservative financial profile in order to preserve operational flexibility and financial stability. On a pro forma basis, after giving effect to this offering and using the net proceeds from this offering (assuming the midpoint of the price range set forth on the cover page of this prospectus) to pay down the borrowings on our senior secured credit facility, we expect to have approximately $ million available for borrowings under our credit facility. At June 30, 2011, pro forma for this offering, we expect to have total debt of approximately $ million, which is times our annualized EBITDA for the first six months of 2011. We have diversified our capital sources, including raising $350 million in senior unsecured notes in January 2011. We believe that our operating cash flow and the aforementioned liquidity sources provide us with the ability to implement our planned exploration and development activities.
Strong institutional investor support and corporate governance. Affiliates of Warburg Pincus LLC ("Warburg Pincus") are our institutional investor and have many years of relevant experience in financing and supporting exploration and production companies and management teams, having been the lead investor in several such companies. Warburg Pincus has been an institutional investor in two previous companies operated by members of our management team. To date, Warburg Pincus, certain members of our management and our independent directors have together invested a total of $710 million of equity in Laredo. Including amounts contributed subsequent to June 30, 2011, $18.6 million is attributable to our management team. Warburg Pincus is not selling shares in this offering and will retain a significant interest in Laredo. We believe that our board of directors is exceptionally qualified and represents a significant resource. It is comprised of Laredo management, representatives of Warburg Pincus and independent individuals with extensive industry and business expertise. We actively engage our board of directors on a regular basis for their expertise on strategic, financial, governance and risk management activities.
Recent developments
Acquisition of Broad Oak Energy, Inc. On July 1, 2011, we completed the acquisition of Broad Oak, which became a wholly-owned subsidiary of Laredo Petroleum, Inc. Broad Oak was formed in 2006 with financial support from its management and Warburg Pincus. On July 19, 2011, we changed the name of Broad Oak to Laredo Petroleum—Dallas, Inc.
Credit agreement amendment. On July 1, 2011, we amended and restated our $1.0 billion senior secured credit facility to increase the borrowing base to $650 million. Our outstanding balance under the senior secured credit facility was $500 million, and we had approximately $91.6 million of cash on hand on that date.
Capital expenditure program. Concurrent with the Broad Oak acquisition, our board of directors approved a revised capital expenditure budget of approximately $360 million for the second half of 2011 and a preliminary budget of $738 million for the calendar year 2012, excluding additional acquisitions. Approximately 90% of these amounts will be targeted for drilling and completion operations, 98% of which are concentrated in our Permian Basin and Anadarko Granite Wash plays.
Risk factors
Investing in our common stock involves risks that include the speculative nature of oil and natural gas exploration, competition, volatile oil and natural gas prices and other material
6
factors. In particular, the following considerations may offset our competitive strengths or have a negative effect on our business strategy as well as on activities on our properties, which could cause a decrease in the price of our common stock and result in a loss of all or a portion of your investment:
- •
- Oil and natural gas prices are volatile. A substantial or extended decline in oil and natural gas prices may adversely
affect our business, financial condition or results of operations and our ability to meet our capital expenditure obligations and financial commitments.
- •
- Our business requires substantial capital expenditures and we may be unable to obtain needed capital or financing on
satisfactory terms or at all.
- •
- Drilling for and producing oil and natural gas are high risk activities with many uncertainties that could adversely
affect our business, financial condition or results of operations. Regulation could prohibit or restrict our ability to apply hydraulic fracturing to our wells.
- •
- Estimating reserves and future net revenues involves uncertainties. Decreases in oil and natural gas prices, or negative
revisions to reserve estimates or assumptions as to future oil and natural gas prices, may lead to decreased earnings, losses or impairment of oil and natural gas assets.
- •
- Our operations may be exposed to significant delays, costs and liabilities as a result of environmental, health and safety
requirements applicable to our business activities.
- •
- The concentration of our capital stock ownership among our largest stockholder will limit your ability to influence corporate matters.
This list is not exhaustive. Please read the full discussion of these risks and other risks described under "Risk factors."
Corporate history and structure
Laredo Petroleum Holdings, Inc., a recently formed Delaware corporation, is a wholly-owned subsidiary of Laredo Petroleum, LLC. Pursuant to the terms of a corporate reorganization that will be completed simultaneously with, or prior to, the closing of this offering, Laredo Petroleum, LLC will merge into Laredo Petroleum Holdings, Inc., with Laredo Petroleum Holdings, Inc. surviving the merger. In connection with such merger, the outstanding units of Laredo Petroleum, LLC will be exchanged for shares of common stock of Laredo Petroleum Holdings, Inc. in accordance with the terms of the limited liability company agreement of Laredo Petroleum, LLC. For more information on our corporate reorganization and ownership of our common stock, see "Corporate reorganization" and "Security ownership of certain beneficial owners and management."
Laredo Petroleum, LLC is a Delaware limited liability company formed in 2007 by Warburg Pincus, our institutional investor, and the management of Laredo Petroleum, Inc., which was founded in October 2006 by Randy A. Foutch, our Chairman and Chief Executive Officer, to acquire, develop and operate oil and gas properties in the Permian and Mid-Continent regions of the United States. Warburg Pincus has many years of relevant experience in the financing and support of growing exploration and production companies, having been the lead investor in several such companies, including companies previously founded by Mr. Foutch as well as the former Broad Oak. Upon completion of the corporate reorganization described above and this
7
offering, Warburg Pincus will initially own approximately % of our outstanding shares of common stock (or % if the underwriters' option to acquire additional shares of common stock is exercised in full) based on an initial public offering price of $ per share (the midpoint of the price range set forth on the cover of this prospectus). In addition, members of our management team will initially own an approximate aggregate % interest in us.
Upon completion of the corporate reorganization, Laredo Petroleum Holdings, Inc. will have four wholly-owned subsidiaries: Laredo Petroleum, Inc., a Delaware corporation formed in October 2006; Laredo Petroleum Texas, LLC, a Texas limited liability company formed in March 2007; Laredo Gas Services, LLC, a Delaware limited liability company formed in November 2007; and Laredo Petroleum—Dallas, Inc., a Delaware corporation formed in May 2006, formerly known as Broad Oak Energy, Inc.
Laredo Petroleum, Inc. is the borrower under our senior secured credit facility as well as the issuer of our $350 million senior unsecured notes due 2019, which we refer to as the senior unsecured notes. All of Laredo's subsidiaries (other than Laredo Petroleum, Inc.) and Laredo Petroleum, LLC are guarantors of the obligations under our senior secured credit facility and the senior unsecured notes.
Ownership structure immediately after giving effect to this offering
The following diagram depicts our ownership structure after giving effect to our corporate reorganization and this offering based on the initial public offering price of $ per share (the midpoint of the price range set forth on the cover of this prospectus) and assuming no exercise of the underwriters' option to acquire additional shares of common stock.
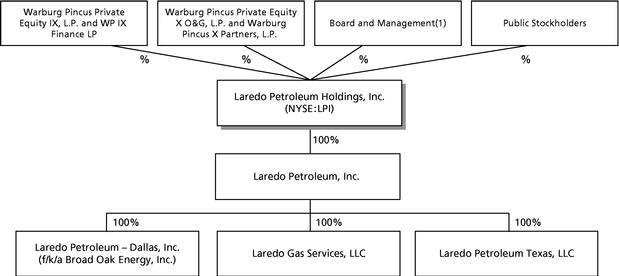
(1) Including former Broad Oak management and directors.
Our offices
Our executive offices are located at 15 W. Sixth Street, Suite 1800, Tulsa, Oklahoma 74119, and the phone number at this address is (918) 513-4570. Our website address is www.laredopetro.com. We expect to make our periodic reports and other information filed with or furnished to the SEC, available free of charge through our website as soon as reasonably practicable after those reports and other information are electronically filed with or furnished to the SEC. Information on our website or any other website is not incorporated by reference into, and does not constitute a part of, this prospectus.
8
| Common stock offered by us | shares. | |
shares, if the underwriters exercise their option to acquire additional shares of common stock in full. |
||
Underwriters' option to purchase additional common stock |
shares. |
|
Common stock outstanding after this offering(1) |
shares ( shares if the underwriters exercise their option to acquire additional shares of common stock in full). |
|
Use of proceeds (conflicts of interest) |
We expect to receive net proceeds from the issuance and sale of common stock offered by this prospectus of approximately $ million, based upon the assumed public offering price of $ per share (the midpoint of the price range set forth on the cover of this prospectus), after deducting underwriting discounts and commissions and offering expenses (or approximately $ million if the underwriters exercise their option to acquire additional shares of common stock in full). We intend to use the net proceeds from this offering, including the net proceeds from any exercise of the underwriters' option to acquire additional shares of common stock, to repay our outstanding indebtedness under our senior secured credit facility, approximately $525 million of which was outstanding on October 1, 2011. See "Use of proceeds." |
9
| Affiliates of certain of the underwriters are lenders under our senior secured credit facility and, accordingly, will receive a portion of the net proceeds of this offering. Because affiliates of certain of the underwriters may receive more than 5% of the net proceeds in this offering, certain of the underwriters may be deemed to have a "conflict of interest" under Rule 5121(f)(5) of the Financial Industry Regulatory Authority, Inc., or FINRA. Accordingly, this offering will be made in compliance with the applicable provisions of Rule 5121. Rule 5121 requires that a qualified independent underwriter, or QIU, participate in the preparation of this prospectus and exercise the usual standards of due diligence with respect thereto. Goldman, Sachs & Co. has served in that capacity and performed due diligence investigations and reviewed and participated in the preparation of the registration statement of which this prospectus is a part. We have agreed, subject to certain terms and conditions, to indemnify Goldman, Sachs & Co. against certain liabilities incurred in connection with it acting as QIU in this offering, including liabilities under the Securities Act of 1933, as amended, or the Securities Act. See "Underwriting (conflicts of interest)." | ||
Dividend policy |
We do not anticipate paying any cash dividends on our common stock. In addition, our senior secured credit facility prohibits us from paying cash dividends. See "Dividend policy." |
|
Exchange listing |
We intend to apply to list our common stock on the New York Stock Exchange under the symbol "LPI." |
|
Risk factors |
Investing in our common stock involves risks. See "Risk factors" for a discussion of certain factors you should consider in evaluating whether or not to invest in our common stock. |
(1) The number of shares outstanding gives effect to the corporate reorganization immediately prior to the completion of this offering which is described under "Corporate reorganization" and "Dilution."
10
Summary historical combined financial data
The following summary financial data should be read in conjunction with "Management's discussion and analysis of financial condition and results of operations," "Selected historical combined financial data" and our unaudited and audited combined financial statements and notes thereto included elsewhere in this prospectus. We believe that the assumptions underlying the preparation of our combined financial statements are reasonable. The financial information included in this prospectus may not be indicative of our future results of operations, financial position and cash flows.
Prior to the acquisition of Broad Oak, the majority equity ownership of both Laredo and Broad Oak was effectively controlled by a common owner. For this reason, both the unaudited and audited financial statements included in this prospectus consist of the historical audited combined balance sheets of Laredo Petroleum, LLC (and its historical subsidiaries) as well as Broad Oak, as of December 31, 2010, 2009 and 2008, and the related combined statements of operations, owners' equity and cash flows for each of the three years then ended, and the unaudited historical combined balance sheets of Laredo Petroleum, LLC (and its historical subsidiaries) as well as Broad Oak, as of June 30, 2011 and the related combined statements of operations, owners' equity and cash flows for the six months ended June 30, 2011 and 2010. As a result, the financial statements included in this prospectus, and the financial and other data contained in this prospectus treat Broad Oak as having been a part of the historic consolidated group of Laredo from inception. Such combined information is not necessarily indicative of the results that would have been obtained if Laredo had owned and operated Broad Oak from its inception.
Presented below is our summary combined financial data for the periods and as of the dates indicated. The summary combined financial data for the years ended December 31, 2010, 2009 and 2008 and the balance sheets as of December 31, 2010 and 2009 are derived from our audited combined financial statements and the notes thereto included elsewhere in this prospectus. The summary combined financial data for the six months ended June 30, 2011 and 2010 and the balance sheet as of June 30, 2011 are derived from our unaudited combined financial statements and the notes thereto included elsewhere in this prospectus. The summary combined financial data for the year ended December 31, 2007 and for the period from our inception in May 2006 through December 31, 2006 and the balance sheet data as of December 31, 2008, 2007 and 2006 are derived from our unaudited combined financial statements not included in this prospectus.
11
| |
For the six months ended June 30, |
|
|
|
|
|
||||||||||||||||||
|---|---|---|---|---|---|---|---|---|---|---|---|---|---|---|---|---|---|---|---|---|---|---|---|---|
| |
For the years ended December 31, | Inception to December 31, 2006 |
||||||||||||||||||||||
| (in thousands) |
2011 |
2010 |
2010 |
2009 |
2008(2) |
2007 |
||||||||||||||||||
| |
(unaudited) |
|
|
|
(unaudited) |
(unaudited) |
||||||||||||||||||
Statement of operations data: |
||||||||||||||||||||||||
Total operating revenues |
$ | 238,841 | $ | 96,926 | $ | 242,004 | $ | 96,892 | $ | 74,735 | $ | 9,650 | $ | — | ||||||||||
Total operating costs and expenses(1) |
131,208 | 69,896 | 169,022 | 350,421 | 351,201 | 17,273 | 2,029 | |||||||||||||||||
Income (loss) from operations |
107,633 | 27,030 | 72,982 | (253,529 | ) | (276,466 | ) | (7,623 | ) | (2,029 | ) | |||||||||||||
Realized and unrealized gain (loss): |
||||||||||||||||||||||||
Commodity derivative financial instruments, net |
(9,585 | ) | 23,090 | 11,190 | 5,744 | 40,569 | 1,579 | — | ||||||||||||||||
Interest rate derivatives, net |
(1,094 | ) | (3,952 | ) | (5,375 | ) | (3,394 | ) | (6,274 | ) | — | — | ||||||||||||
Interest expense |
(22,252 | ) | (5,928 | ) | (18,482 | ) | (7,464 | ) | (4,410 | ) | (2,046 | ) | — | |||||||||||
Other non-operating income (expense) |
(3,223 | ) | 65 | 121 | 142 | 817 | 634 | 188 | ||||||||||||||||
Net income (loss) |
$ | 45,742 | $ | 34,525 | $ | 86,248 | $ | (184,495 | ) | $ | (192,047 | ) | $ | (6,051 | ) | $ | (1,841 | ) | ||||||
(1) In 2009, we recognized a pre-tax non-cash full cost ceiling impairment charge of approximately $245.9 million on our proved properties and we reduced materials and supplies by approximately $0.8 million to reflect our materials and supplies at the lower of cost or market. In 2008, we recognized a pre-tax non-cash full cost ceiling impairment charge of approximately $282.6 million on our proved properties. For a discussion of our impairment expense, see Notes B.5, B.7 and B.19 in our audited combined financial statements included elsewhere in this prospectus.
(2) The year ended December 31, 2008 contains the results of operations for the acquisition of properties from Linn Energy beginning August 15, 2008, the closing date of the property acquisition. See Note C in our audited combined financial statements included elsewhere in this prospectus.
| |
|
As of December 31, | ||||||||||||||||||
|---|---|---|---|---|---|---|---|---|---|---|---|---|---|---|---|---|---|---|---|---|
| |
As of June 30, 2011 |
|||||||||||||||||||
| (in thousands) |
2010 |
2009 |
2008 |
2007 |
2006 |
|||||||||||||||
| |
(unaudited) |
|
|
|
(unaudited) |
(unaudited) |
||||||||||||||
Balance sheet data: |
||||||||||||||||||||
Cash and cash equivalents |
$ | 22,052 | $ | 31,235 | $ | 14,987 | $ | 13,512 | $ | 6,937 | $ | 6,345 | ||||||||
Net property and equipment |
1,078,036 | 809,893 | 396,100 | 350,702 | 137,852 | 7,539 | ||||||||||||||
Total assets |
1,316,793 | 1,068,160 | 625,344 | 578,387 | 171,799 | 13,903 | ||||||||||||||
Current liabilities |
148,745 | 150,243 | 79,265 | 101,864 | 16,809 | 550 | ||||||||||||||
Long-term debt |
690,400 | 491,600 | 247,100 | 148,600 | 44,500 | — | ||||||||||||||
Total owners' equity |
457,717 | 411,099 | 289,107 | 318,364 | 109,708 | 13,316 | ||||||||||||||
| |
For the six months ended June 30, |
|
|
|
|
|
|||||||||||||||||
|---|---|---|---|---|---|---|---|---|---|---|---|---|---|---|---|---|---|---|---|---|---|---|---|
| |
For the years ended December 31, | Inception to December 31, 2006 |
|||||||||||||||||||||
| (in thousands) |
2011 |
2010 |
2010 |
2009 |
2008 |
2007 |
|||||||||||||||||
| |
(unaudited) |
|
|
|
(unaudited) |
(unaudited) |
|||||||||||||||||
Other financial data: |
|||||||||||||||||||||||
Net cash provided by (used in) operating activities |
$ | 162,058 | $ | 57,652 | $ | 157,043 | $ | 112,669 | $ | 25,332 | $ | 5,019 | $ | (1,231 | ) | ||||||||
Net cash used in investing activities |
(359,449 | ) | (181,265 | ) | (460,547 | ) | (361,333 | ) | (490,897 | ) | (131,153 | ) | (7,581 | ) | |||||||||
Net cash provided by financing activities |
188,208 | 133,507 | 319,752 | 250,139 | 472,140 | 126,726 | 15,157 | ||||||||||||||||
| |
For the six months ended June 30, |
|
|
|
|
|
|||||||||||||||||
|---|---|---|---|---|---|---|---|---|---|---|---|---|---|---|---|---|---|---|---|---|---|---|---|
| |
For the years ended December 31, | Inception to December 31, 2006 |
|||||||||||||||||||||
| (in thousands, unaudited) |
2011 |
2010 |
2010 |
2009 |
2008 |
2007 |
|||||||||||||||||
Adjusted EBITDA(1) |
$ | 183,796 | $ | 73,612 | $ | 194,502 | $ | 104,908 | $ | 49,305 | $ | (1,522 | ) | $ | (1,798 | ) | |||||||
(1) Adjusted EBITDA is a non-GAAP financial measure. For a definition of Adjusted EBITDA and a reconciliation of Adjusted EBITDA to net income (loss) see "Selected historical combined financial data—Non-GAAP financial measures and reconciliations."
12
Summary historical combined reserve data
Prior to the acquisition of Broad Oak, the majority equity ownership of both Laredo and Broad Oak was effectively controlled by a common owner. For this reason, the information in this prospectus with respect to our estimated proved reserves for the periods stated have been prepared by our independent reserve engineers combining the reserves of Broad Oak with the reserves historically reported by Laredo. These reserves were determined in accordance with the rules and regulations of the SEC applicable to fiscal years ending on and after December 31, 2009. Certain operational terms used in this prospectus are defined in "Annex A: Glossary of oil and natural gas terms."
The following table sets forth certain unaudited information concerning our proved oil and natural gas reserves as of June 30, 2011 based on a reserve report prepared by Ryder Scott, our independent reserve engineers. A copy of the summary report prepared by Ryder Scott as of June 30, 2011 is included as Annex B to this prospectus.
| |
June 30, 2011 | |||||||||||||
|---|---|---|---|---|---|---|---|---|---|---|---|---|---|---|
| |
Reserve category | |||||||||||||
| |
PDP |
PDNP |
PUD |
Total |
||||||||||
Proved Reserves: |
||||||||||||||
Oil (MBbls) |
15,828 | 1,472 | 28,629 | 45,929 | ||||||||||
Natural gas (MMcf) |
200,752 | 17,698 | 328,291 | 546,741 | ||||||||||
Oil equivalents(1) (MBOE) |
49,286 | 4,422 | 83,344 | 137,052 | ||||||||||
% Oil |
32% | 33% | 34% | 34% | ||||||||||
% Natural Gas |
68% | 67% | 66% | 66% | ||||||||||
(1) MBbl equivalents ("MBOE") converted at a rate of six MMcf per one MBbl.
13
Investing in our common stock involves a high degree of risk. You should carefully consider the risks and uncertainties described below, as well as other information contained in this prospectus, before purchasing our common stock. If any of the following risks actually occur, our business, financial condition, operating results or cash flow could be materially and adversely affected. Additional risks and uncertainties not presently known to us or not believed by us to be material may also negatively impact us.
Risks related to our business
Oil and natural gas prices are volatile. A substantial or extended decline in oil and natural gas prices may adversely affect our business, financial condition or results of operations and our ability to meet our capital expenditure obligations and financial commitments.
The prices we receive for our oil and natural gas production heavily influence our revenue, profitability, access to capital and future rate of growth. Oil and natural gas are commodities and, therefore, their prices are subject to wide fluctuations in response to relatively minor changes in supply and demand. Historically, the market for oil and natural gas has been volatile. This market will likely continue to be volatile in the future. The prices we receive for our production, and the levels of our production, depend on numerous factors beyond our control. These factors include the following:
- •
- worldwide and regional economic and financial conditions impacting the global supply and demand for oil and natural gas;
- •
- the price and quantity of imports of foreign oil and natural gas, including liquefied natural gas;
- •
- political conditions in or affecting other oil and natural gas-producing countries, including the current
conflicts in the Middle East and conditions in South America and Russia;
- •
- the level of global oil and natural gas exploration and production;
- •
- our future cash flow, production and estimated reserves could be adversely affected by further regulatory changes,
including any future restrictions on our ability to apply hydraulic fracturing to our wells;
- •
- the level of global oil and natural gas inventories;
- •
- prevailing prices on local oil and natural gas price indexes in the areas in which we operate;
- •
- localized and global supply and demand fundamentals and transportation availability;
- •
- weather conditions;
- •
- technological advances affecting energy consumption;
- •
- the price and availability of alternative fuels; and
- •
- domestic, local and foreign governmental regulation and taxes.
14
Lower oil and natural gas prices will reduce our cash flows and borrowing ability. We may be unable to obtain needed capital or financing on satisfactory terms, which could lead to a decline in our oil and natural gas reserves as existing reserves are depleted. Substantial decreases in oil and natural gas prices would render uneconomic a significant portion of our exploration, development and exploitation projects. This may result in our having to make significant downward adjustments to our estimated proved reserves. As a result, a substantial or extended decline in oil and natural gas prices may materially and adversely affect our future business, financial condition, results of operations, liquidity or ability to finance planned capital expenditures.
Our business requires significant capital expenditures and we may be unable to obtain needed capital or financing on satisfactory terms or at all.
Our exploration, development and acquisition activities require substantial capital expenditures. Historically, we have funded our capital expenditures through a combination of cash flows from operations, capital contributions or borrowings under our senior secured credit facility or under our senior unsecured notes. Future cash flows are subject to a number of variables, including the level of production from existing wells, prices of oil and natural gas and our success in developing and producing new reserves. If our cash flow from operations is not sufficient to fund our capital expenditure budget, we may have limited ability to obtain the additional capital necessary to sustain our operations at current levels. We may not be able to obtain debt or equity financing on terms favorable to us or at all. The failure to obtain additional financing could result in a curtailment of our operations relating to exploration and development of our prospects, which in turn could lead to a decline in our oil and natural gas production or reserves, and in some areas a loss of properties.
Drilling for and producing oil and natural gas are high risk activities with many uncertainties that could adversely affect our business, financial condition or results of operations.
Our future financial condition and results of operations will depend on the success of our exploitation, exploration, development and production activities. Our oil and natural gas exploration, exploitation, development and production activities are subject to numerous risks beyond our control, including the risk that drilling will not result in commercially viable oil and natural gas production. Our decisions to purchase, explore, develop or otherwise exploit locations or properties will depend in part on the evaluation of information obtained through geophysical and geological analyses, production data and engineering studies, the results of which are often inconclusive or subject to varying interpretations. For a discussion of the uncertainty involved in these processes, see "—Estimating reserves and future net revenues involves uncertainties. Decreases in oil and natural gas prices, or negative revisions to reserve estimates or assumptions as to future oil and natural gas prices, may lead to decreased earnings, losses or impairment of oil and natural gas assets." In addition, our cost of drilling, completing and operating wells is often uncertain before drilling commences. Further, many factors may curtail, delay or cancel our scheduled drilling projects, including the following:
- •
- delays imposed by or resulting from compliance with regulatory and contractual requirements and related lawsuits, which
may include limitations on hydraulic fracturing or the discharge of greenhouse gases;
- •
- pressure or irregularities in geological formations;
15
- •
- shortages of or delays in obtaining equipment and qualified personnel;
- •
- equipment failures or accidents;
- •
- fires and blowouts;
- •
- adverse weather conditions, such as hurricanes, blizzards and ice storms;
- •
- declines in oil and natural gas prices;
- •
- limited availability of financing at acceptable rates;
- •
- title problems; and
- •
- limitations in the market for oil and natural gas.
Federal and state legislation and regulatory initiatives relating to hydraulic fracturing could prohibit projects or result in materially increased costs and additional operating restrictions or delays because of the significance of hydraulic fracturing in our business.
Hydraulic fracturing is a practice that is used to stimulate production of hydrocarbons, particularly natural gas, from tight formations. The process involves the injection of water, sand and chemicals under pressure into the formation to fracture the surrounding rock and stimulate production. Nearly all of our proved non-producing and proved undeveloped reserves associated with future drilling, recompletion and refracture stimulation projects, or over 61% of our total estimated proved reserves as of June 30, 2011, will require hydraulic fracturing. If we are unable to apply hydraulic fracturing to our wells or the process is prohibited or significantly regulated or restricted, we would lose the ability to (i) drill and complete the projects for such proved reserves and (ii) maintain the associated acreage, which would have a material adverse effect on our future business, financial condition, operating results and prospects.
The process is typically regulated by state oil and gas commissions. The U.S. Environmental Protection Agency (the "EPA"), however, recently asserted federal regulatory authority over hydraulic fracturing involving diesel additives under the federal Safe Drinking Water Act's ("SDWA") Underground Injection Control ("UIC") Program by posting a new requirement on its website that requires facilities to obtain permits to use diesel fuel in hydraulic fracturing operations. The U.S. Energy Policy Act of 2005, which exempts hydraulic fracturing from regulation under the SDWA, prohibits the use of diesel fuel in the fracturing process without a UIC permit. Industry groups have filed suit challenging the EPA's recent decisions as a "final agency action" and, thus, in violation of the notice-and-comment rulemaking procedures of the Administrative Procedure Act. At the same time, the EPA has commenced a study of the potential environmental impacts of hydraulic fracturing activities, with results of the study anticipated to be available by late 2012, and a committee of the House of Representatives is conducting an investigation of hydraulic fracturing practices. Furthermore, on August 23, 2011, the EPA published a proposed rule in the Federal Register to establish new emissions standards to reduce volatile organic compounds ("VOC") emissions from several types of processes and equipment used in the oil and gas industry, including a 95% reduction in VOCs emitted during the construction or modification of hydraulically-fractured wells. In addition, legislation is pending in Congress to repeal the hydraulic fracturing exemption from the SDWA, provide for
16
federal regulation of hydraulic fracturing, and require public disclosure of the chemicals used in the fracturing process.
Further, certain members of Congress have called upon: (i) the U.S. Government Accountability Office to investigate how hydraulic fracturing might adversely affect water resources; (ii) the SEC to investigate the natural gas industry and any possible misleading of investors or the public regarding the economic feasibility of pursuing natural gas deposits in shales by means of hydraulic fracturing; and (iii) the U.S. Energy Information Administration to provide a better understanding of that agency's estimates regarding natural gas reserves, including reserves from shale formations, as well as uncertainties associated with those estimates. Finally, the Shale Gas Subcommittee of the Secretary of Energy Advisory Board released a report on August 11, 2011, proposing recommendations to reduce the potential environmental impacts from shale gas production. These ongoing or proposed studies, depending on their degree of pursuit and any meaningful results obtained, could spur initiatives to further regulate hydraulic fracturing under the SDWA or other regulatory mechanism.
Some states have adopted, and other states are considering adopting, regulations that could restrict hydraulic fracturing in certain circumstances or otherwise require the public disclosure of chemicals used in the hydraulic fracturing process. For example, pursuant to legislation adopted by the State of Texas in June 2011, the Railroad Commission of Texas (the "RRC") published a proposed rule on September 9, 2011 requiring disclosure to the RRC and the public of certain information regarding the components used in the hydraulic fracturing process. In addition to state law, local land use restrictions, such as city ordinances, may restrict or prohibit the performance of well drilling in general and/or hydraulic fracturing in particular.
If these or any other new laws or regulations that significantly restrict hydraulic fracturing are adopted, such laws could make it more difficult or costly for us to drill and produce from conventional or tight formations as well as make it easier for third parties opposing the hydraulic fracturing process to initiate legal proceedings. In addition, if hydraulic fracturing is regulated at the federal level, fracturing activities could become subject to additional permitting and financial assurance requirements, more stringent construction specifications, increased monitoring, reporting and recordkeeping obligations, plugging and abandonment requirements and also to attendant permitting delays and potential increases in costs. These developments, as well as new laws or regulations, could cause us to incur substantial compliance costs, and compliance or the consequences of failure to comply by us could have a material adverse effect on our financial condition and results of operations. At this time, it is not possible to estimate the potential impact on our business that may arise if federal or state legislation governing hydraulic fracturing is enacted into law.
Estimating reserves and future net revenues involves uncertainties. Decreases in oil and natural gas prices, or negative revisions to reserve estimates or assumptions as to future oil and natural gas prices, may lead to decreased earnings, losses or impairment of oil and natural gas assets.
The reserve data included in this prospectus represent estimates. Reserve estimation is a subjective process of evaluating underground accumulations of oil and natural gas that cannot be measured in an exact manner. Reserves that are "proved reserves" are those estimated quantities of crude oil, natural gas and natural gas liquids that geological and engineering data demonstrate with reasonable certainty are recoverable in future years from known
17
reservoirs under existing economic and operating conditions and that relate to projects for which the extraction of hydrocarbons must have commenced or the operator must be reasonably certain will commence within a reasonable time.
The estimation process relies on interpretations of available geological, geophysical, engineering and production data. There are numerous uncertainties inherent in estimating quantities of proved reserves and in projecting future rates of production and timing of developmental expenditures, including many factors beyond the control of the producer. In addition, the estimates of future net revenues from our proved reserves and the present value of such estimates are based upon certain assumptions about future production levels, prices and costs that may not prove to be correct.
Quantities of proved reserves are estimated based on economic conditions in existence during the period of assessment. Changes to oil and gas prices in the markets for such commodities may have the impact of shortening the economic lives of certain fields because it becomes uneconomic to produce all recoverable reserves on such fields, which reduces proved property reserve estimates.
If negative revisions in the estimated quantities of proved reserves were to occur, it would have the effect of increasing the rates of depreciation, depletion and amortization on the affected properties, which would decrease earnings or result in losses through higher depreciation, depletion and amortization expense. These revisions, as well as revisions in the assumptions of future cash flows of these reserves, may also trigger impairment losses on certain properties, which would result in a noncash charge to earnings.
Our estimates of proved reserves as of December 31, 2009, December 31, 2010 and June 30, 2011 have been prepared under current SEC rules that went into effect for fiscal years ending on or after December 31, 2009, which may make comparisons to prior periods difficult and could limit our ability to book additional proved undeveloped reserves in the future.
This prospectus presents estimates of our proved reserves as of December 31, 2009, December 31, 2010 and June 30, 2011, which have been prepared and presented under SEC rules that are effective for fiscal years ending on or after December 31, 2009, and require SEC reporting companies to prepare their reserve estimates using revised reserve definitions and revised pricing based on a 12-month unweighted arithmetic average of the first-day-of-the-month pricing. The previous rules required that reserve estimates be calculated using last-day-of-the-year pricing. The pricing that was used for estimates of our reserves as of June 30, 2011 was $86.60 per barrel for condensate and oil and $4.00 per MMBtu for gas without giving any effect to our commodity hedges. These prices are the unweighted arithmetic average of the first day of the month price for the 12 calendar months ending June 30, 2011 and were held constant for the life of each property. Product prices which were actually used for each property reflect all appropriate adjustments including gravity, quality, local conditions, fuel and shrinkage and/or distance to market. As a result of this change in pricing methodology, direct comparisons of reserve amounts reported for periods prior to 2009 may be more difficult.
Another impact of the current SEC rules is a general requirement that, subject to limited exceptions, proved undeveloped reserves may only be booked if they relate to wells scheduled to be drilled within five years after the date of booking. This new rule has limited and may continue to limit our potential to book additional proved undeveloped reserves as we pursue
18
our drilling program. Moreover, we may be required to write down our proved undeveloped reserves if we do not drill those wells within the required five-year timeframe.
Our identified potential drilling locations are scheduled out over many years, making them susceptible to uncertainties that could materially alter the occurrence or timing of their drilling, which in certain instances could prevent production prior to the expiration date of leases for such locations. In addition, we may not be able to raise the substantial amount of capital that would be necessary to drill a substantial portion of our identified potential drilling locations.
Our management team has specifically identified and scheduled certain potential drilling locations as an estimation of our future multi-year drilling activities on our existing acreage. These potential drilling locations represent a significant part of our growth strategy. Our ability to drill and develop these potential drilling locations depends on a number of uncertainties, including oil and natural gas prices, the availability and cost of capital, drilling and production costs, availability of drilling services and equipment, drilling results, lease expirations, gathering system, marketing and pipeline transportation constraints, regulatory approvals and other factors. Because of these uncertain factors, we do not know if the numerous potential drilling locations we have identified will ever be drilled or if we will be able to produce oil or natural gas from these or any other potential drilling locations. In addition, unless production is established within the spacing units covering the undeveloped acres on which some of the potential locations are obtained, the leases for such acreage will expire. As such, our actual drilling activities may materially differ from those presently identified.
If commodity prices decrease, we may be required to take write-downs of the carrying values of our properties.
Accounting rules require that we periodically review the carrying value of our properties for possible impairment. Based on prevailing commodity prices and specific market factors and circumstances at the time of prospective impairment reviews, and the continuing evaluation of development plans, production data, economics and other factors, we may be required to write down the carrying value of our properties. A write-down constitutes a non-cash charge to earnings. We may incur impairment charges in the future, which could have a material adverse effect on our results of operations for the periods in which such charges are taken.
Unless we replace our oil and natural gas reserves, our reserves and production will decline, which would adversely affect our future cash flows and results of operations.
Producing oil and natural gas reservoirs generally are characterized by declining production rates that vary depending upon reservoir characteristics and other factors. Unless we conduct successful ongoing exploration, development and exploitation activities or continually acquire properties containing proved reserves, our proved reserves will decline as those reserves are produced. Our future oil and natural gas reserves and production, and therefore our future cash flow and results of operations, are highly dependent on our success in efficiently developing and exploiting our current reserves and economically finding or acquiring additional recoverable reserves. We may not be able to develop, exploit, find or acquire sufficient additional reserves to replace our current and future production. If we are unable to replace our current and future production, the value of our reserves will decrease, and our business, financial condition and results of operations would be adversely affected.
19
Currently, we receive significant incremental cash flows as a result of our hedging activity. To the extent we are unable to obtain future hedges at effective prices consistent with those we have received to date and oil and natural gas prices do not improve, our cash flows and financial condition may be adversely impacted.
To achieve more predictable cash flows and reduce our exposure to downward price fluctuations, we have entered into a number of hedge contracts for approximately 4.5 million Bbls of our crude oil production and 33.8 million MMBtu of our natural gas production from October 2011 through December 2014. We are currently realizing a significant benefit from these hedge positions. If future oil and natural gas prices remain comparable to current prices, we expect that this benefit will decline materially over the life of the hedges, which cover decreasing volumes at declining prices through December 2014. If we are unable to enter into new hedge contracts in the future at favorable pricing and for a sufficient amount of our production, our financial condition and results of operations could be materially adversely affected. For additional information regarding our hedging activities, please see "Management's discussion and analysis of financial condition and results of operations—Commodity derivative financial instruments."
Our derivative activities could result in financial losses or could reduce our earnings.
To achieve more predictable cash flows and reduce our exposure to adverse fluctuations in the prices of oil and natural gas, we enter into derivative instrument contracts for a portion of our oil and natural gas production, including collars, puts and basis swaps. In accordance with applicable accounting principles, we are required to record our derivative financial instruments at fair market value and they are included on our combined balance sheet as assets or liabilities and in our combined statement of operation as realized or unrealized gains. Losses on derivatives are included in our cash flows from operating activities. Accordingly, our earnings may fluctuate significantly as a result of changes in fair value of our derivative instruments.
Derivative instruments also expose us to the risk of financial loss in some circumstances, including when:
- •
- production is less than the volume covered by the derivative instruments;
- •
- the counter-party to the derivative instrument defaults on its contractual obligations;
- •
- there is an increase in the differential between the underlying price in the derivative instrument and actual prices
received; or
- •
- there are issues with regard to legal enforceability of such instruments.
In addition, derivative arrangements could limit the benefit we would receive from increases in the prices for oil and natural gas, which could also have a material adverse effect on our financial condition.
The inability of our significant customers to meet their obligations to us may materially adversely affect our financial results.
In addition to credit risk related to receivables from commodity derivative contracts, our principal exposure to credit risk is through joint operations receivables (approximately $13.4 million at June 30, 2011) and the sale of our oil and natural gas production
20
(approximately $42.5 million in receivables at June 30, 2011), which we market to energy marketing companies, refineries and affiliates. Joint interest receivables arise from billing entities who own partial interest in the wells we operate. These entities participate in our wells primarily based on their ownership in leases on which we wish to drill. We are generally unable to control which co-owners participate in our wells. We are also subject to credit risk due to the concentration of our oil and natural gas receivables with several significant customers. The largest purchaser of our oil and natural gas during the six months ended June 30, 2011 purchased approximately 33.1% of our operated production. We do not require our customers to post collateral. The inability or failure of our significant customers or joint working interest owners to meet their obligations to us or their insolvency or liquidation may materially adversely affect our financial results.
We may incur substantial losses and be subject to substantial liability claims as a result of our operations. Additionally we may not be insured for, or our insurance may be inadequate to protect us against, these risks.
We are not insured against all risks. Losses and liabilities arising from uninsured and underinsured events could materially and adversely affect our business, financial condition or results of operations. Our oil and natural gas exploration and production activities are subject to all of the operating risks associated with drilling for and producing oil and natural gas, including the possibility of:
- •
- environmental hazards, such as uncontrollable flows of oil, natural gas, brine, well fluids, toxic gas or other pollution
into the environment, including groundwater and shoreline contamination;
- •
- abnormally pressured formations;
- •
- mechanical difficulties, such as stuck oilfield drilling and service tools and casing collapse;
- •
- fires, explosions and ruptures of pipelines;
- •
- personal injuries and death;
- •
- natural disasters; and
- •
- terrorist attacks targeting oil and natural gas related facilities and infrastructure.
Any of these risks could adversely affect our ability to conduct operations or result in substantial losses to us as a result of:
- •
- injury or loss of life;
- •
- damage to and destruction of property, natural resources and equipment;
- •
- pollution and other environmental damage and associated clean-up responsibilities;
- •
- regulatory investigations, penalties or other sanctions;
- •
- suspension of our operations; and
- •
- repair and remediation costs.
21
We may elect not to obtain insurance if we believe that the cost of available insurance is excessive relative to the risks presented. In addition, pollution and environmental risks generally are not fully insurable. The occurrence of an event that is not fully covered by insurance could have a material adverse effect on our business, financial condition and results of operations.
Locations that we decide to drill may not yield oil or natural gas in commercially viable quantities.
Locations that we decide to drill that do not yield oil or natural gas in commercially viable quantities will adversely affect our results of operations and financial condition. In this prospectus, we describe some of our current drilling locations and our plans to explore those drilling locations. Our drilling locations are in various stages of evaluation, ranging from those that are ready to drill to those that will require substantial additional seismic data processing and interpretation before a decision can be made to proceed with the drilling of such locations. There is no way to predict in advance of drilling and testing whether any particular drilling location will yield oil or natural gas in sufficient quantities to recover drilling or completion costs or to be economically viable. The use of seismic data and other technologies and the study of producing fields in the same area will not enable us to know conclusively prior to drilling whether oil or natural gas will be present or, if present, whether oil or natural gas will be present in commercial quantities. We cannot assure you that the analogies we draw from available data from other wells, more fully explored locations or producing fields will result in successfully locating oil or natural gas in commercial quantities on our prospective acreage.
Our use of 2D and 3D seismic data is subject to interpretation and may not accurately identify the presence of oil and natural gas, which could adversely affect the results of our drilling operations.
Even when properly used and interpreted, 2D and 3D seismic data and visualization techniques are only tools used to assist geoscientists in identifying subsurface structures and hydrocarbon indicators and do not enable geoscientists to know whether hydrocarbons are, in fact, present in those structures or the amount of hydrocarbons. We employ 3D seismic technology with respect to certain of our projects. The implementation and practical use of 3D seismic technology is relatively new, unproven and unconventional, which can lessen its effectiveness, at least in the near term, and increase our costs. In addition, the use of 3D seismic and other advanced technologies requires greater pre-drilling expenditures than traditional drilling strategies, and we could incur greater drilling and exploration expenses as a result of such expenditures, which may result in a reduction in our returns. As a result, our drilling activities may not be successful or economical, and our overall drilling success rate or our drilling success rate for activities in a particular area could decline.
We often gather 3D seismic data over large areas. Our interpretation of seismic data delineates those portions of an area that we believe are desirable for drilling. Therefore, we may choose not to acquire option or lease rights prior to acquiring seismic data, and, in many cases, we may identify hydrocarbon indicators before seeking option or lease rights in the location. If we are not able to lease those locations on acceptable terms, we will have made substantial expenditures to acquire and analyze 3D data without having an opportunity to attempt to benefit from those expenditures.
22
Market conditions, the unavailability of satisfactory oil and natural gas gathering, processing or transportation arrangements or operational impediments may adversely affect our access to oil, natural gas and natural gas liquids markets or delay our production.
The availability of a ready market for our oil and natural gas production depends on a number of factors, including the demand for and supply of oil and natural gas and the proximity of reserves to pipelines, trucking and terminal facilities. Our ability to market our production depends in substantial part on the availability and capacity of gathering systems, pipelines, trucking and processing facilities owned and operated by third parties. Our failure to obtain such services on acceptable terms could materially harm our business. We may be required to shut in wells due to lack of a market or inadequacy or unavailability of oil and natural gas pipeline, trucking, gathering system or processing capacity. In addition, if oil or natural gas quality specifications for the third party oil or natural gas pipelines with which we connect change so as to restrict our ability to transport oil or natural gas, our access to oil and natural gas markets could be impeded. If our production becomes shut in for any of these or other reasons, we would be unable to realize revenue from those wells until other arrangements were made to deliver the products to market.
We are subject to complex federal, state, local and other laws and regulations that could adversely affect the cost, manner or feasibility of conducting our operations or expose us to significant liabilities.
Our oil and natural gas exploration, production and gathering operations are subject to complex and stringent laws and regulations. In order to conduct our operations in compliance with these laws and regulations, we must obtain and maintain numerous permits, approvals and certificates from various federal, state and local governmental authorities. We may incur substantial costs in order to maintain compliance with these existing laws and regulations. In addition, our costs of compliance may increase if existing laws and regulations are revised or reinterpreted, or if new laws and regulations become applicable to our operations. Such costs could have a material adverse effect on our business, financial condition and results of operations. Failure to comply with laws and regulations applicable to our operations, including any evolving interpretation and enforcement by governmental authorities, could have a material adverse effect on our business, financial condition and results of operations.
See "Business—Regulation of the oil and natural gas industry" for a further description of the laws and regulations that affect us.
23
Our operations may be exposed to significant delays, costs and liabilities as a result of environmental, health and safety requirements applicable to our business activities.
We may incur significant delays, costs and liabilities as a result of federal, state and local environmental, health and safety requirements applicable to our exploration, development and production activities. These laws and regulations may require us to obtain a variety of permits or other authorizations governing our air emissions, water discharges, waste disposal or other environmental impacts associated with drilling, production and transporting product pipelines or other operations; regulate the sourcing and disposal of water used in the drilling, fracturing and completion processes; limit or prohibit drilling activities in certain areas and on certain lands lying within wilderness, wetlands, frontier and other protected areas; require remedial action to prevent or mitigate pollution from former operations such as plugging abandoned wells or closing earthen pits; and/or impose substantial liabilities for spills, pollution or failure to comply with regulatory filings. In addition, these laws and regulations may restrict the rate of oil or natural gas production. These laws and regulations are complex, change frequently and have tended to become increasingly stringent over time. Failure to comply with these laws and regulations may result in the assessment of administrative, civil and criminal penalties, imposition of cleanup and site restoration costs and liens, the suspension or revocation of necessary permits, licenses and authorizations, the requirement that additional pollution controls be installed and, in some instances, issuance of orders or injunctions limiting or requiring discontinuation of certain operations.
Under certain environmental laws that impose strict as well as joint and several liability, we may be required to remediate contaminated properties currently or formerly operated by us or facilities of third parties that received waste generated by our operations regardless of whether such contamination resulted from the conduct of others or from consequences of our own actions that were in compliance with all applicable laws at the time those actions were taken. In addition, claims for damages to persons or property, including natural resources, may result from the environmental, health and safety impacts of our operations. In addition, the risk of accidental spills or releases from our operations could expose us to significant liabilities under environmental laws. Moreover, public interest in the protection of the environment has increased dramatically in recent years. The trend of more expansive and stringent environmental legislation and regulations applied to the crude oil and natural gas industry could continue, resulting in increased costs of doing business and consequently affecting profitability. To the extent laws are enacted or other governmental action is taken that restricts drilling or imposes more stringent and costly operating, waste handling, disposal and cleanup requirements, our business, prospects, financial condition or results of operations could be materially adversely affected.
See "Business—Regulation of environmental and occupational health and safety matters" for a further description of the laws and regulations that affect us.
The unavailability or high cost of additional drilling rigs, equipment, supplies, personnel and oilfield services as well as fees for the cancellation of such services could adversely affect our ability to execute our exploration and development plans within our budget and on a timely basis.
The demand for and availability of qualified and experienced personnel to drill wells and conduct field operations, geologists, geophysicists, engineers and other professionals in the oil and natural gas industry can fluctuate significantly, often in correlation with oil and natural
24
gas prices, causing periodic shortages. Historically, there have been shortages of drilling and workover rigs, pipe and other equipment as demand for rigs and equipment has increased along with the number of wells being drilled. In particular, the high level of drilling activity in the Permian Basin and Anadarko Granite Wash has resulted in equipment shortages in those areas. We committed to several short-term drilling contracts with various third parties in order to complete various drilling projects. An early termination clause in these contracts requires us to pay significant penalties to the third party should we cease drilling efforts. These penalties could significantly impact our financial statements upon contract termination. As a result of these commitments, approximately $1.6 million in stacked rig fees were incurred in 2009. We cannot predict whether these conditions will exist in the future and, if so, what their timing and duration will be. The shortages as well as rig related fees could delay or cause us to incur significant expenditures that are not provided for in our capital budget, which could have a material adverse effect on our business, financial condition or results of operations.
A change in the jurisdictional characterization of some of our assets by federal, state or local regulatory agencies or a change in policy by those agencies may result in increased regulation of our assets, which may cause our revenues to decline and operating expenses to increase.
Section 1(b) of the Natural Gas Act of 1938 (the "NGA") exempts natural gas gathering facilities from regulation by the Federal Energy Regulatory Commission ("FERC"). We believe that the natural gas pipelines in our gathering systems meet the traditional tests FERC has used to establish whether a pipeline performs a gathering function and therefore is exempt from the FERC's jurisdiction under the NGA. However, the distinction between FERC-regulated transmission services and federally unregulated gathering services is a fact-based determination. The classification of facilities as unregulated gathering is the subject of ongoing litigation, so the classification and regulation of our gathering facilities are subject to change based on future determinations by FERC, the courts or Congress, which could cause our revenues to decline and operating expenses to increase and may materially adversely affect our business, financial condition or results of operations. In addition, FERC has adopted regulations that may subject certain of our otherwise non-FERC jurisdictional facilities to FERC annual reporting and daily scheduled flow and capacity posting requirements. Additional rules and legislation pertaining to those and other matters may be considered or adopted by FERC from time to time. Failure to comply with those regulations in the future could subject us to civil penalty liability, which could have a material adverse effect on our business, financial condition or results of operations.
The adoption of climate change legislation or regulations restricting emissions of "greenhouse gases" could result in increased operating costs and reduced demand for the oil and natural gas we produce.
Recent scientific studies have suggested that emissions of certain gases, commonly referred to as "greenhouse gases" ("GHGs"), including carbon dioxide and methane, may be contributing to warming of the earth's atmosphere and other climatic changes. In response to such studies, Congress has, from time to time, considered legislation to reduce emissions of GHGs. One bill approved by the House of Representatives in June 2009, known as the American Clean Energy and Security Act of 2009, would have required an 80% reduction in emissions of GHGs from sources within the U.S. between 2012 and 2050 but was not approved by the Senate in the 2009-2010 legislative session. Congress is likely to continue to consider similar bills. Moreover, almost half of the states have already taken legal measures to reduce emissions of GHGs,
25
through the planned development of GHG emission inventories and/or regional GHG cap and trade programs or other mechanisms. Most cap and trade programs work by requiring major sources of emissions, such as electric power plants, or major producers of fuels, such as refineries and gas processing plants, to acquire and surrender emission allowances corresponding with their annual emissions of GHGs. The number of allowances available for purchase is reduced each year until the overall GHG emission reduction goal is achieved. As the number of GHG emission allowances declines each year, the cost or value of allowances is expected to escalate significantly. Some states have enacted renewable portfolio standards, which require utilities to purchase a certain percentage of their energy from renewable fuel sources.
In addition, in December 2009, the EPA determined that emissions of carbon dioxide, methane and other GHGs present an endangerment to human health and the environment, because emissions of such gases are, according to the EPA, contributing to warming of the earth's atmosphere and other climatic changes. These findings by the EPA allow the agency to proceed with the adoption and implementation of regulations that would restrict emissions of GHGs under existing provisions of the federal Clean Air Act. In response to its endangerment finding, the EPA recently adopted two sets of rules regarding possible future regulation of GHG emissions under the Clean Air Act, one of which purports to regulate emissions of GHGs from motor vehicles and the other of which would regulate emissions of GHGs from large stationary sources of emissions such as power plants or industrial facilities. The motor vehicle rule was finalized in April 2010 and became effective in January 2011 but it does not require immediate reductions in GHG emissions. The stationary source rule was adopted in May 2010 and also became effective January 2011 and is the subject of several pending lawsuits filed by industry groups and Congress is considering legislation to limit or strip the EPA's authority to regulate GHGs. Additionally, in September 2009, the EPA issued a final rule requiring the reporting of GHG emissions from specified large GHG emission sources in the U.S., including natural gas liquids fractionators and local natural gas/distribution companies, beginning in 2011 for emissions occurring in 2010. The EPA also plans to implement GHG emissions standards for power plants in May 2012 and for refineries in November 2012.
The adoption of legislation or regulatory programs to reduce GHG emissions could require us to incur increased operating costs, such as costs to purchase and operate emissions control systems, to acquire emissions allowances or comply with new regulatory requirements. Any GHG emissions legislation or regulatory programs applicable to power plants or refineries could also increase the cost of consuming, and thereby reduce demand for, the oil and natural gas we produce. Consequently, legislation and regulatory programs to reduce GHG emissions could have an adverse effect on our business, financial condition and results of operations.
The derivatives reform legislation adopted by Congress could have a material adverse impact on our ability to hedge risks associated with our business.
On July 21, 2010, The Dodd-Frank Wall Street Reform and Consumer Protection Act of 2010 ("Dodd-Frank") was signed into law by the U.S. President. Title VII of Dodd-Frank ("Title VII") imposes comprehensive regulation on the over-the-counter ("OTC") derivatives marketplace and could affect the use of derivatives in hedging transactions. Among other things, Title VII subjects swap dealers and major swap participants to substantial supervision and regulation, including capital standards, margin requirements, business conduct standards, and recordkeeping and reporting requirements. Title VII also requires central clearing for many
26
transactions entered into between swap dealers, major swap participants and other entities. All swaps subject to the clearing requirement must be executed on a regulated exchange or a swap execution facility ("SEF"), unless no exchange or SEF makes it available for trading. For these purposes, although not yet defined by the Commodity Futures Trading Commission (the "CFTC"), it is expected that a major swap participant generally will be someone other than a dealer (i) who maintains a "substantial" net position in outstanding swaps, excluding swaps used for commercial hedging or for reducing or mitigating commercial risk, or (ii) whose positions create substantial net counterparty exposure that could have serious adverse effects on the financial stability of the U.S. banking system or financial markets. In addition, Title VII provides the CFTC with express authority to impose aggregate position limits on derivatives related to energy commodities, including contracts traded on exchanges, SEFs, non-U.S. boards of trade and swaps that are not centrally cleared. The CFTC has proposed a large number of rules to implement Title VII in multiple rulemaking proceedings and has finalized a number of such rules. Under Dodd-Frank, the CFTC was generally given until July 16, 2011 to adopt final rules under Title VII, though some rules were required to be completed sooner. However, most of the contemplated rules were not adopted by such date. Since certain provisions of Dodd-Frank reference terms that require further definition or repeal provisions of current law, such provisions will not be effective until there is a final rulemaking with respect thereto. To address the consequences of this regulatory backlog and avoid "undue disruption" to current practices during the transition to the new regulatory regime, the CFTC issued a final order, effective July 14, 2011, which (i) delays the effectiveness of provisions which reference certain terms that require further definition until the earlier of the effective date of the final rule defining the referenced term or December 31, 2011 and (ii) exempts transactions in exempt and excluded commodities which comply with Part 35 of the CFTC's regulations from the regulation under the Commodity Exchange Act, as amended by Dodd-Frank. Part 35 provides a safe harbor from CFTC regulation for certain transactions between "eligible swap participants", such as Laredo, until the earlier of the repeal, withdrawal or replacement of Part 35 or December 31, 2011. The CFTC continues to propose and finalize rules to implement Title VII in multiple rulemaking proceedings. It is not possible at this time to predict the outcome of these proceedings or, in the case of final rules, the impact that such rules will have on the new regulatory regime and the OTC derivatives marketplace. Any laws or regulations that may be adopted that subject us or our counterparties to additional capital or margin requirements relating to, or to additional restrictions on, trading and commodity positions could have a material adverse effect on our ability to hedge risks associated with our business or on the cost of our hedging activity.
Many of the anticipated benefits of acquiring Broad Oak may not be realized.
Laredo acquired Broad Oak with the expectation that the acquisition would result in various benefits, including, among other things, incremental scale and significant additional exposure to attractive vertical and horizontal oil and liquids-rich natural gas opportunities. However, to realize these anticipated benefits, we must successfully integrate Broad Oak into Laredo. If we are not able to achieve these objectives, the anticipated benefits of the acquisition may not be realized fully or at all or may take longer to realize than expected. It is possible that the integration process could take longer than anticipated and could result in the loss of valuable employees or the disruption of our ongoing businesses or inconsistencies in standards, controls, procedures, practices, policies and compensation arrangements, which could adversely affect our ability to achieve the anticipated benefits of the acquisition. Our combined results of
27
operations could also be adversely affected by any issues attributable to either company's operations that arise or are based on events or actions that occurred prior to the closing of the acquisition. Laredo may have difficulty addressing possible differences in corporate cultures and management philosophies. Integration efforts will also divert management attention and resources. These integration activities could have an adverse effect on our business during the transition period. The integration process is subject to a number of uncertainties and no assurance can be given regarding when, or even if, the anticipated benefits will be realized. Failure to achieve these anticipated benefits could result in increased costs or decreases in the amount of expected revenues and could adversely affect Laredo's future business, financial condition, operating results and prospects.
Competition in the oil and natural gas industry is intense, making it more difficult for us to acquire properties, market oil and natural gas and secure trained personnel.
Our ability to acquire additional locations and to find and develop reserves in the future will depend on our ability to evaluate and select suitable properties and to consummate transactions in a highly competitive environment for acquiring properties, marketing oil and natural gas and securing trained personnel. Also, there is substantial competition for capital available for investment in the oil and natural gas industry, especially in our focus areas. Many of our competitors possess and employ financial, technical and personnel resources substantially greater than ours. Those companies may be able to pay more for productive oil and natural gas properties and exploratory locations and to evaluate, bid for and purchase a greater number of properties and locations than our financial or personnel resources permit. In addition, other companies may be able to offer better compensation packages to attract and retain qualified personnel than we are able to offer. The cost to attract and retain qualified personnel has increased due to competition and may increase substantially in the future. We may not be able to compete successfully in the future in acquiring prospective reserves, developing reserves, marketing hydrocarbons, attracting and retaining quality personnel and raising additional capital, which could have a material adverse effect on our business.
The loss of senior management or technical personnel could materially adversely affect operations.
We depend on the services of our senior management and technical personnel. The loss of the services of our senior management or technical personnel, including Randy A. Foutch, our Chairman and Chief Executive Officer, could have a material adverse effect on our operations. We do not maintain, nor do we plan to obtain, any insurance against the loss of any of these individuals.
A significant reduction by Warburg Pincus of its ownership interest in us could adversely affect us.
Warburg Pincus is our largest stockholder and two members of our board of directors are affiliates of Warburg Pincus. We believe that Warburg Pincus' substantial ownership interest in us provides them with an economic incentive to assist us to be successful. Following the 180th day after the closing of this offering, however, Warburg Pincus will not be subject to any obligation to maintain their ownership interest in us and may elect at any time thereafter to sell all or a substantial portion of or otherwise reduce its ownership interest in us. If Warburg Pincus sells all or a substantial portion of its ownership interest in us, Warburg Pincus may have less incentive to assist in our success and its affiliates that are members of our board of
28
directors may resign. Such actions could adversely affect our ability to successfully implement our business strategies which could adversely affect our cash flows or results of operations.
We have limited control over activities on properties we do not operate, which could materially reduce our production and revenues.
A portion of our business activities is conducted through joint operating agreements under which we own partial interests in oil and natural gas properties. If we do not operate the properties in which we own an interest, we do not have control over normal operating procedures, expenditures or future development of the underlying properties. The failure of an operator of our wells to adequately perform operations or an operator's breach of the applicable agreements could materially reduce our production and revenues. The success and timing of our drilling and development activities on properties operated by others, therefore, depends upon a number of factors outside of our control, including the operator's timing and amount of capital expenditures, expertise and financial resources, inclusion of other participants in drilling wells and use of technology. Because we do not have a majority interest in most wells that we do not operate, we may not be in a position to remove the operator in the event of poor performance.
Seasonal weather conditions and lease stipulations adversely affect our ability to conduct drilling activities in some of the areas where we operate.
Oil and natural gas operations in our operating areas can be adversely affected by seasonal weather conditions and lease stipulations designed to protect various wildlife. This limits our ability to operate in those areas and can intensify competition during those months for drilling rigs, oilfield equipment, services, supplies and qualified personnel, which may lead to periodic shortages. These constraints and the resulting shortages or high costs could delay our operations and materially increase our operating and capital costs.
Increases in interest rates could adversely affect our business.
Our business and operating results can be harmed by factors such as the availability, terms of and cost of capital, increases in interest rates or a reduction in credit rating. These changes could cause our cost of doing business to increase, limit our ability to pursue acquisition opportunities, reduce our cash flow available for drilling and place us at a competitive disadvantage. For example, as of October 1, 2011, we have approximately $125 million of additional borrowing capacity under our senior secured credit facility, subject to compliance with financial covenants. The impact of a 1.0% increase in interest rates on an assumed borrowing of the full $650 million available under our senior secured credit facility would result in increased annual interest expense of approximately $1.25 million and a corresponding decrease in our net income before the effects of increased interest rates on the value of our interest rate contracts. Recent and continuing disruptions and volatility in the global financial markets may lead to a contraction in credit availability impacting our ability to finance our operations. We require continued access to capital. A significant reduction in our cash flows from operations or the availability of credit could materially and adversely affect our ability to achieve our planned growth and operating results.
29
We may be subject to risks in connection with acquisitions of properties.
The successful acquisition of producing properties requires an assessment of several factors, including:
- •
- recoverable reserves;
- •
- future oil and natural gas prices and their applicable differentials;
- •
- operating costs; and
- •
- potential environmental and other liabilities.
The accuracy of these assessments is inherently uncertain. Our assessment will not reveal all existing or potential problems nor will it permit us to become sufficiently familiar with the properties to fully assess their deficiencies and capabilities. Inspections may not always be performed on every well, and environmental problems are not necessarily observable even when an inspection is undertaken. Even when problems are identified, the seller may be unwilling or unable to provide effective contractual protection against all or part of the problems. We often are not entitled to contractual indemnification for environmental liabilities and acquire properties on an "as is" basis. Even in those circumstances in which we have contractual indemnification rights for pre-closing liabilities, it remains possible that the seller will not be able to fulfill its contractual obligations. Problems with properties we acquire could have a material adverse effect on our business, financial condition and results of operations.
We may be unable to make attractive acquisitions or successfully integrate acquired businesses, and any inability to do so may disrupt our business and hinder our ability to grow.
In the future we may make acquisitions of businesses that complement or expand our current business. We may not be able to identify attractive acquisition opportunities. Even if we do identify attractive acquisition opportunities, we may not be able to complete the acquisition or do so on commercially acceptable terms.
The success of any completed acquisition will depend on our ability to integrate effectively the acquired business into our existing operations. The process of integrating acquired businesses may involve unforeseen difficulties and may require a disproportionate amount of our managerial and financial resources. In addition, possible future acquisitions may be larger and for purchase prices significantly higher than those paid for earlier acquisitions. No assurance can be given that we will be able to identify additional suitable acquisition opportunities, negotiate acceptable terms, obtain financing for acquisitions on acceptable terms or successfully acquire identified targets. Our failure to achieve consolidation savings, to incorporate the acquired businesses and assets into our existing operations successfully or to minimize any unforeseen operational difficulties could have a material adverse effect on our financial condition and results of operations.
We have incurred losses from operations for various periods since our inception and may do so in the future.
We incurred net losses from our inception to the year ended December 31, 2006 of approximately $1.8 million and for each of the years ended December 31, 2007, 2008 and 2009 of approximately $6.1 million, $192.0 million and $184.5 million, respectively. Our development of and participation in an increasingly larger number of locations has required and will
30
continue to require substantial capital expenditures. The uncertainty and factors described throughout this section may impede our ability to economically find, develop, exploit and acquire oil and natural gas reserves. As a result, we may not be able to achieve or sustain profitability or positive cash flows from operating activities in the future.
The inability of one or more of our customers to meet their obligations may adversely affect our financial results.
Substantially all of our accounts receivable result from oil and natural gas sales or joint interest billings to third parties in the energy industry. At June 30, 2011, three customers accounted for more than 10% of our oil and gas sales receivables: Enterprise Products Partners, LP 34%, Targa Resources Partners, LP 15% and PVR Midstream, LLC 13%. This concentration of customers and joint interest owners may impact our overall credit risk in that these entities may be similarly affected by changes in economic and other conditions. In addition, our oil and natural gas hedging arrangements expose us to credit risk in the event of nonperformance by counterparties. Current economic circumstances and the increased bankruptcies may further increase these risks.
We require a significant amount of cash to service our indebtedness. Our ability to generate cash depends on many factors beyond our control.
Our ability to make payments on and to refinance our indebtedness and to fund planned capital expenditures depends on our ability to generate cash in the future. This, to a certain extent, is subject to general economic, financial, competitive, legislative, regulatory and other factors that are beyond our control. We cannot assure you that we will generate sufficient cash flow from operations or that future borrowings will be available to us under our senior secured credit facility or otherwise in an amount sufficient to enable us to pay our indebtedness or to fund our other liquidity needs. We may need to refinance all or a portion of our indebtedness at or before maturity. We cannot assure you that we will be able to refinance any of our indebtedness on commercially reasonable terms or at all.
We may incur significant additional amounts of debt.
As of July 1, 2011, we had total long-term indebtedness of approximately $850 million. Immediately after the closing of this offering and application of the net proceeds therefrom as described under "Use of Proceeds," we expect to have total long-term indebtedness of approximately $ million outstanding and $ million of additional borrowing capacity, under our senior secured credit facility (in each case assuming the underwriters' option to purchase additional shares of our common stock is not exercised). In addition, we may be able to incur substantial additional indebtedness, including secured indebtedness, in the future. The restrictions on the incurrence of additional indebtedness contained in the indenture governing our senior unsecured notes and our senior secured credit facility are subject to a number of significant qualifications and exceptions, and under certain circumstances, the amount of indebtedness that could be incurred in compliance with these restrictions could be substantial. If new debt is added to our existing debt levels, the related risks that we face would increase and may make it more difficult to satisfy our existing financial obligations. In addition, the indenture governing the senior unsecured notes does not prevent us from incurring obligations that do not constitute indebtedness under the indenture.
31
Our debt agreements contain restrictions that will limit our flexibility in operating our business.
The indenture governing our senior unsecured notes and our senior secured credit facility each contain, and any future indebtedness we incur may contain, various covenants that limit our ability to engage in specified types of transactions. These covenants limit our ability to, among other things:
- •
- incur additional indebtedness;
- •
- pay dividends on, repurchase or make distributions in respect of our capital stock or make other restricted payments;
- •
- make certain investments;
- •
- sell certain assets;
- •
- create liens;
- •
- consolidate, merge, sell or otherwise dispose of all or substantially all of our assets; and
- •
- enter into certain transactions with our affiliates.
As a result of these covenants, we are limited in the manner in which we may conduct our business and we may be unable to engage in favorable business activities or finance future operations or our capital needs. In addition, the covenants in our senior secured credit facility require us to maintain a minimum working capital ratio and minimum interest coverage ratio and also limit our capital expenditures. A breach of any of these covenants could result in a default under one or more of these agreements, including as a result of cross default provisions and, in the case of our senior secured credit facility, permit the lenders to cease making loans to us. Upon the occurrence of an event of default under our senior secured credit facility, the lenders could elect to declare all amounts outstanding under our senior secured credit facility to be immediately due and payable and terminate all commitments to extend further credit. Such actions by those lenders could cause cross defaults under our other indebtedness, including the senior unsecured notes. If we were unable to repay those amounts, the lenders under our senior secured credit facility could proceed against the collateral granted to them to secure that indebtedness. We pledged a significant portion of our assets as collateral under our senior secured credit facility. If the lenders under our senior secured credit facility accelerate the repayment of the borrowings thereunder, the proceeds from the sale or foreclosure upon such assets will first be used to repay debt under our senior secured credit facility, and we may not have sufficient assets to repay our unsecured indebtedness thereafter.
We may incur more taxes and certain of our projects may become uneconomic if certain federal income tax deductions currently available with respect to oil and natural gas exploration and development are eliminated as a result of future legislation.
The President's proposed budget for fiscal year 2012 contains a proposal to eliminate certain key U.S. federal income tax preferences currently available to oil and natural gas exploration and production companies. These changes include, but are not limited to (i) the repeal of the percentage depletion allowance for oil and natural gas properties, (ii) the elimination of current deductions for intangible drilling and development costs, (iii) the elimination of the deduction for certain U.S. production activities and (iv) an extension of the amortization period
32
for certain geological and geophysical expenditures. It is unclear whether any of the foregoing changes will actually be enacted or how soon any such changes could become effective. The passage of any legislation as a result of the budget proposal or any other similar change in U.S. federal income tax law could eliminate certain tax deductions that are currently available with respect to oil and natural gas exploration and development. Any such change could materially adversely affect our financial condition and results of operations by increasing the costs we incur which would in turn make it uneconomic to drill some locations if commodity prices are not sufficiently high, resulting in lower revenues and decreases in production and reserves.
Loss of our information and computer systems could adversely affect our business.
We are heavily dependent on our information systems and computer based programs, including our well operations information, seismic data, electronic data processing and accounting data. If any of such programs or systems were to fail or create erroneous information in our hardware or software network infrastructure, possible consequences include our loss of communication links, inability to find, produce, process and sell oil and natural gas and inability to automatically process commercial transactions or engage in similar automated or computerized business activities. Any such consequence could have a material adverse effect on our business.
Risks relating to this offering
There currently exists no market for our common stock. An active trading market may not develop for our common stock, and the price of our common stock may be subject to factors beyond our control. If our share price fluctuates after this offering, you could lose all or a significant part of your investment.
Prior to this offering, no public market existed for our common stock. An active and liquid market for our common stock may not develop following the completion of this offering or, if developed, may not be maintained. If an active public market does not develop or is not maintained, you may have difficulty selling your shares. The initial public offering price of our common stock was determined by negotiations between us and the underwriters for this offering and may not be indicative of the price at which the common stock will trade following the completion of this offering.
The market price of our common stock may also be influenced by many other factors, some of which are beyond our control, including, among other things:
- •
- actual or anticipated variations in quarterly and annual operating results;
- •
- changes in financial estimates and recommendations by research analysts following our common stock or the failure of
research analysts to cover our common stock after this offering;
- •
- actual or anticipated changes in U.S. economies or the oil and gas industry;
- •
- terrorist acts or wars;
- •
- weather and acts of God;
- •
- changes in the stock price of other oil and gas companies;
33
- •
- announcements by us or our competitors of significant acquisitions, strategic partnerships, divestitures, joint ventures
or other strategic initiatives;
- •
- actual or anticipated sales or distributions of shares of our common stock by our officers and directors, whether in the
market or in subsequent public offerings;
- •
- the trading volume of our common stock; and
- •
- changes in business, legal, or regulatory conditions, or other developments affecting the oil and gas industry.
As a result of this volatility, you may not be able to resell your shares at or above the initial public offering price. In addition, the stock market in general has experienced extreme price and volume fluctuations that have often been unrelated or disproportionate to the operating performance of companies like us. These broad market and industry factors may materially reduce the market price of the common stock, regardless of our operating performance.
Investors purchasing common stock in this offering will incur substantial and immediate dilution.
The initial public offering price of our common stock is substantially higher than the net tangible book value per share of our outstanding common stock. Purchasers of our common stock in this offering will incur immediate and substantial dilution of $ per share in the net tangible book value of our common stock from an initial public offering price of $ per share. This means that if we were to be liquidated immediately after this offering, there might be no assets available for distribution to you after satisfaction of all our obligations to creditors. For a further description of the effects of dilution in the net tangible book value of our common stock, see "Dilution."
Our share price may decline because of the ability of our stockholders to sell our common stock.
Sales of substantial amounts of our common stock after this offering, or the possibility of those sales, could adversely affect the market price of our common stock and impede our ability to raise capital through the issuance of equity securities. See "Shares eligible for future sale" for a discussion of possible future sales of our common stock.
After this offering, Warburg Pincus will own % of the outstanding shares of our common stock ( % if the underwriters exercise their option to acquire additional shares of common stock in full). Warburg Pincus has no contractual obligation to retain any of our common stock, except for a limited period, as described under "Underwriting (conflicts of interest)," during which it will not sell any of our common stock without the underwriters' consent until 180 days after the date of this prospectus. Subject to applicable securities laws, after the expiration of this 180-day lock-up period, or before, with consent of the representatives of the underwriters to this offering, Warburg Pincus may sell any or all of our common stock that it beneficially owns.
The shares of our common stock sold in this offering will be freely tradable without restriction in the United States, except for any shares acquired by one of our affiliates, which can be sold under Rule 144 under the Securities Act, subject to various volume and other limitations. Subject to limited exceptions, we, our executive officers and directors and Warburg Pincus have
34
agreed not to sell, dispose of, or hedge any shares of our common stock or any securities convertible into, or exchangeable for, our common stock for 180 days after the date of this prospectus without the prior written consent of the underwriters, who may waive this restriction at any time without public notice. After the expiration of the 180-day lock-up period, our executive officers, directors and Warburg Pincus could dispose of all or any part of their shares of our common stock through a public offering, sales under Rule 144 or another transaction.
In the future, we may also issue additional common stock for a number of reasons, including to finance our operations and business strategy, to adjust our ratio of debt to equity or to provide incentives pursuant to certain executive compensation arrangements. Such future issuances of equity securities, or the expectation that they will occur, could cause the market price for our common stock to decline. The price of our common stock also could be affected by hedging or arbitrage trading activity that may exist or develop involving our common stock. Any sale by Warburg Pincus or us of shares of our common stock in the public market, or the perception that sales could occur, could adversely affect prevailing market prices for our common stock.
Your percentage ownership in us may be diluted by future issuances of common stock or securities or instruments that are convertible into our common stock, which could reduce your influence over matters on which stockholders vote.
Our board of directors has the authority, without action or vote of our stockholders, to issue all or any part of our authorized but unissued shares of common stock, including shares issuable upon the exercise of options, shares that may be issued to satisfy our obligations under our incentive plans, shares of our authorized but unissued preferred stock and securities and instruments that are convertible into or exchangeable for our common stock. Issuances of common stock or voting preferred stock would reduce your influence over matters on which our stockholders vote and, in the case of issuances of preferred stock, likely would result in your interest in us being subject to the prior rights of holders of that preferred stock.
The requirements of being a public company, including compliance with the reporting requirements of the Exchange Act and the requirements of the Sarbanes-Oxley Act and Dodd-Frank, may strain our resources, increase our costs and distract management; and we may be unable to comply with these requirements in a timely or cost-effective manner.
As a public company with listed equity securities, we will need to comply with new laws, regulations and requirements, certain corporate governance provisions of the Sarbanes-Oxley Act of 2002, related regulations of the SEC, Dodd-Frank and the requirements of the New York Stock Exchange, or the NYSE, with which we are not required to comply as a private company. Complying with these statutes, regulations and requirements will occupy a significant amount of time of our board of directors and management and will significantly increase our costs and expenses. We will need to:
- •
- institute a more comprehensive compliance function;
- •
- design, establish, evaluate and maintain a system of internal controls over financial reporting in compliance with the requirements of Section 404 of the Sarbanes-Oxley Act of 2002 and the related rules and regulations of the SEC and the Public Company Accounting Oversight Board;
35
- •
- comply with rules promulgated by the NYSE;
- •
- prepare and distribute periodic public reports in compliance with our obligations under the federal securities laws;
- •
- establish new internal policies, such as those relating to disclosure controls and procedures and insider trading;
- •
- involve and retain to a greater degree outside counsel and accountants in the above activities; and
- •
- establish an investor relations function.
In addition, we also expect that being a public company subject to these rules and regulations will require us to accept less director and officer liability insurance coverage than we desire or to incur substantial costs to obtain coverage. These factors could also make it more difficult for us to attract and retain qualified members of our board of directors, particularly to serve on our audit committee, and qualified executive officers.
We do not anticipate paying any dividends on our common stock in the foreseeable future. As a result, you will need to sell your shares of common stock to receive any income or realize a return on your investment.
We do not anticipate paying any dividends on our common stock in the foreseeable future. Any declaration and payment of future dividends to holders of our common stock may be limited by the provisions of the Delaware General Corporation Law, or DGCL, and certain restrictive covenants in our senior secured credit facility and the indenture governing our senior unsecured notes. The future payment of dividends will be at the sole discretion of our board of directors and will depend on many factors, including our earnings, capital requirements, financial condition and other considerations that our board of directors deems relevant. As a result, to receive any income or realize a return on your investment, you will need to sell your shares of common stock. You may not be able to sell your shares of common stock at or above the price you paid for them.
Our amended and restated certificate of incorporation, amended and restated bylaws, and Delaware state law contain provisions that may have the effect of delaying or preventing a change in control.
Our amended and restated certificate of incorporation authorizes our board of directors to issue preferred stock and to determine the designations, powers, preferences and relative, participating, optional, or other special rights, if any, and the qualifications, limitations, or restrictions of our preferred stock, including the number of shares, in any series, without any further vote or action by the stockholders. The rights of the holders of our common stock will be subject to the rights of the holders of any preferred stock that may be issued in the future. The issuance of preferred stock could delay, deter or prevent a change in control and could adversely affect the voting power or economic value of your shares.
In addition, some provisions of our amended and restated certificate of incorporation and amended and restated bylaws could make it more difficult for a third party to acquire control of us, even if the change of control would be beneficial to our stockholders, including:
- •
- limitations on the ability of our stockholders to call special meetings;
36
- •
- limitations on the ability of our stockholders to act by written consent;
- •
- at such time as Warburg Pincus no longer beneficially owns more than 50% of our outstanding common stock, our board of
directors will be divided into three classes with each class serving staggered three year terms;
- •
- a separate vote of % of the voting power of the outstanding shares of capital stock in order for
stockholders to amend the bylaws in certain circumstances; and
- •
- advance notice provisions for stockholder proposals and nominations for elections to the board of directors to be acted upon at meetings of stockholders.
Delaware law prohibits us from engaging in any business combination with any "interested stockholder," meaning generally that a stockholder who owns 15% of our stock cannot acquire us for a period of three years from the date such stockholder became an interested stockholder, unless various conditions are met, such as the approval of the transaction by our board of directors. Warburg Pincus, however, is not subject to this restriction.
For a further description of these provisions of our amended and restated certificate of incorporation, amended and restated bylaws, and Delaware law, see "Description of capital stock—Anti-takeover effects of provisions of our certificate of incorporation, our bylaws and Delaware law."
The concentration of our capital stock ownership among our largest stockholder will limit your ability to influence corporate matters.
Upon completion of this offering (assuming no exercise of the underwriters' option to acquire additional shares of common stock), we anticipate that Warburg Pincus will initially own up to approximately % of our outstanding common stock (based on an assumed initial public offering price of $ per share, the midpoint of the price range set forth on the cover of this prospectus). Consequently, Warburg Pincus will continue to have significant influence over all matters that require approval by our stockholders, including the election of directors and approval of significant corporate transactions. This concentration of ownership will limit your ability to influence corporate matters, and as a result, actions may be taken that you may not view as beneficial.
Furthermore, conflicts of interest could arise in the future between us, on the one hand, and Warburg Pincus and its affiliates, including its portfolio companies, on the other hand, concerning among other things, potential competitive business activities or business opportunities. Warburg Pincus LLC is a private equity firm that has invested, among other things, in companies in the energy industry. As a result, Warburg Pincus' existing and future portfolio companies which it controls may compete with us for investment or business opportunities. These conflicts of interest may not be resolved in our favor.
We have also renounced our interest in certain business opportunities. See "—Our amended and restated certificate of incorporation contains a provision renouncing our interest and expectancy in certain corporate opportunities, which could adversely affect our business or prospects."
37
Our amended and restated certificate of incorporation contains a provision renouncing our interest and expectancy in certain corporate opportunities, which could adversely affect our business or prospects.
Our amended and restated certificate of incorporation provides that, to the fullest extent permitted by applicable law, we renounce any interest or expectancy in, or in being offered an opportunity to participate in, any business opportunity that may be from time to time presented to Warburg Pincus or its affiliates or any of their respective officers, directors, agents, shareholders, members, partners, affiliates and subsidiaries (other than us and our subsidiaries) or business opportunities that such parties participate in or desire to participate in, even if the opportunity is one that we might reasonably have pursued or had the ability or desire to pursue if granted the opportunity to do so, and no such person shall be liable to us for breach of any fiduciary or other duty, as a director or officer or controlling stockholder or otherwise, by reason of the fact that such person pursues or acquires any such business opportunity, directs any such business opportunity to another person or fails to present any such business opportunity, or information regarding any such business opportunity, to us unless, in the case of any such person who is our director or officer, any such business opportunity is expressly offered to such director or officer solely in his or her capacity as our director or officer.
As a result, Warburg Pincus or its affiliates may become aware, from time to time, of certain business opportunities, such as acquisition opportunities, and may direct such opportunities to other businesses in which they have invested, in which case we may not become aware of or otherwise have the ability to pursue such opportunity. Further, such businesses may choose to compete with us for these opportunities. As a result, by renouncing our interest and expectancy in any business opportunity that from time to time may be presented to Warburg Pincus and its affiliates, our business and prospects could be adversely affected if attractive business opportunities are procured by such parties for their own benefit rather than for ours. See "Description of capital stock—Corporate opportunity."
We expect to be a "controlled company" within the meaning of the NYSE rules and, if applicable, would qualify for and could rely on exemptions from certain corporate governance requirements.
Because Warburg Pincus will own a majority of our outstanding common stock following the completion of this offering, we expect to be a "controlled company" as that term is set forth in Section 303A of the NYSE Listed Company Manual. Under the NYSE rules, a company of which more than 50% of the voting power is held by another person or group of persons acting together is a "controlled company" and may elect not to comply with certain NYSE corporate governance requirements, including:
- •
- the requirement that a majority of our board of directors consist of independent directors;
- •
- the requirement that our nominating and governance committee be composed entirely of independent directors with a written
charter addressing the committee's purpose and responsibilities; and
- •
- the requirement that our compensation committee be composed entirely of independent directors with a written charter addressing the committee's purpose and responsibilities.
These requirements will not apply to us as long as we remain a "controlled company." Following this offering, we may utilize some or all of these exemptions. Accordingly, you may not have the same protections afforded to stockholders of companies that are subject to all of the corporate governance requirements of the NYSE. Warburg Pincus' significant ownership interest could adversely affect investors' perceptions of our corporate governance.
38
This prospectus contains "forward-looking statements." Such statements can generally be identified by the use of forward-looking terminology such as "believes," "expects," "may," "estimates," "will," "should," "plans" or "anticipates" or the negative thereof or other variations thereon or comparable terminology, or by discussions of strategy. Readers are cautioned that any such forward-looking statements are not guarantees of future performance and may involve significant risks and uncertainties, and that actual results may vary materially from those in the forward-looking statements as a result of various factors. Among the factors that significantly impact our business and could impact our business in the future are:
- •
- the ongoing instability and uncertainty in the U.S. and international financial and consumer markets that is adversely
affecting the liquidity available to us and our customers and is adversely affecting the demand for commodities, including crude oil and natural gas;
- •
- volatility of oil and gas prices;
- •
- the possible introduction of regulations that prohibit or restrict our ability to apply hydraulic fracturing to our oil
and natural gas wells;
- •
- discovery, estimation, development and replacement of oil and gas reserves, including our expectations that estimates of
our proved reserves will increase;
- •
- competition in the oil and gas industry;
- •
- availability and costs of drilling and production equipment, labor, and oil and gas processing and other services;
- •
- changes in domestic and global demand for oil and natural gas;
- •
- the availability of sufficient pipeline and transportation facilities;
- •
- uncertainties about the estimates of our oil and natural gas reserves;
- •
- changes in the regulatory environment and changes in international, legal, political, administrative or economic
conditions;
- •
- successful results from our identified drilling locations;
- •
- our ability to execute our strategies;
- •
- our ability to recruit and retain the qualified personnel necessary to operate our business;
- •
- our ability to comply with federal, state and local regulatory requirements;
- •
- evolving industry standards and adverse changes in global economic, political and other conditions;
- •
- restrictions contained in our debt agreements, including our senior secured credit facility and the indenture governing
our senior unsecured notes, as well as debt that could be incurred in the future;
- •
- our ability to generate sufficient cash to service our indebtedness and to generate future profits; and
39
- •
- other factors discussed in this prospectus, including in the section entitled "Risk factors."
These forward-looking statements involve a number of risks and uncertainties that could cause actual results to differ materially from those suggested by the forward-looking statements. Forward-looking statements should, therefore, be considered in light of various factors, including those set forth in this prospectus under "Risk factors," in "Management's discussion and analysis of financial condition and results of operations" and elsewhere in this prospectus. In light of such risks and uncertainties, we caution you not to place undue reliance on these forward-looking statements in deciding whether to invest in our common stock.
Reserve engineering is a process of estimating underground accumulations of oil and natural gas that cannot be measured in an exact way. The accuracy of any reserve estimate depends on the quality of available data, the interpretation of such data and price and cost assumptions made by reservoir engineers. In addition, the results of drilling, testing and production activities may justify revisions of estimates that were made previously. If significant, such revisions would change the schedule of any further production and development drilling. Accordingly, reserve estimates may differ significantly from the quantities of natural gas that are ultimately recovered.
These forward-looking statements speak only as of the date of this prospectus, and we do not undertake any obligation to publicly release any revisions to these forward-looking statements to reflect events or circumstances after the date of this prospectus or to reflect the occurrence of unanticipated events.
40
We expect to receive net proceeds from the issuance and sale of shares of common stock offered by this prospectus of approximately $ million after deducting underwriting discounts and commissions and estimated offering expenses (or approximately $ million if the underwriters exercise their option to acquire additional shares of common stock in full). We intend to use the net proceeds from this offering, including the net proceeds from any exercise of the underwriters' option to acquire additional shares of common stock, to repay our outstanding indebtedness under our senior secured credit facility, approximately $525 million of which was outstanding on October 1, 2011.
Our senior secured credit facility matures in 2016 and bears interest at a variable rate, which was approximately 2.75% per annum as of October 1, 2011. Our outstanding borrowings under our senior secured credit facility were incurred in connection with the acquisition of Broad Oak, to fund capital expenditures and for general working capital purposes. Affiliates of certain of the underwriters are lenders under our senior secured credit facility and, accordingly, will receive a portion of the net proceeds of this offering. See "Underwriting (conflicts of interest)."
Our estimates assume an initial public offering price of $ per share of common stock (the midpoint of the price range set forth on the cover of this prospectus). An increase or decrease in the initial public offering price of $1.00 per share of common stock would cause the net proceeds from the offering, after deducting underwriting discounts and commissions and estimated offering expenses, to increase or decrease by $ million. If the net proceeds increase due to a higher initial public offering price, we will use the additional proceeds to repay our outstanding indebtedness under our senior secured credit facility and for general working capital purposes. If the net proceeds decrease due to a lower initial public offering price, we will have less funds available to repay our outstanding indebtedness under our senior secured credit facility and for general working capital purposes.
We do not anticipate declaring or paying any cash dividends to holders of our common stock in the foreseeable future. We currently intend to retain our future earnings, if any, to support the growth and development of our business. The payment of future cash dividends, if any, will be at the discretion of our board of directors and will depend upon, among other things, our financial condition, results of operations, capital requirements and development expenditures, future business prospects and any restrictions imposed by future debt instruments. In addition, our senior secured credit facility and the indenture governing our senior unsecured notes prohibit us from paying cash dividends.
41
The following table sets forth the capitalization of Laredo Petroleum, LLC, Laredo Petroleum Holdings, Inc., and Broad Oak Energy, Inc., as applicable, as of June 30, 2011:
- •
- on an actual basis;
- •
- on an adjusted basis to give effect to the transactions described under "Corporate reorganization" that will occur
simultaneously with, or prior to, the closing of this offering; and
- •
- on an as further adjusted basis to give effect to this offering and the application of the net proceeds as described under "Use of proceeds."
You should read the following table in conjunction with "Use of proceeds," "Selected historical combined financial data," "Management's discussion and analysis of financial condition and results of operations" and our historical combined financial statements and notes thereto included elsewhere in this prospectus.
| |
As of June 30, 2011 | ||||||||||
|---|---|---|---|---|---|---|---|---|---|---|---|
| (in thousands) |
Actual |
As adjusted to give effect to our corporate reorganization |
As further adjusted for the effect of this offering(1) |
||||||||
Cash and cash equivalents |
$ | 22,052 | $ | $ | |||||||
Long-term debt, including current maturities |
|||||||||||
Credit facilities(2)(3) |
$ | 340,400 | $ | $ | |||||||
Senior unsecured notes due 2019 |
$ | 350,000 | $ | $ | |||||||
Owners' equity |
$ | 457,717 | $ | $ | |||||||
Total capitalization |
$ | 1,148,117 | $ | $ | |||||||
(1) Gives effect to the issuance of shares of common stock contemplated by this offering at an assumed initial public offering price of $ per share of common stock (the midpoint of the price range set forth on the cover page of this prospectus) less underwriting discounts and commissions and expenses payable by us.
(2) As of October 1, 2011, we had an additional $184.6 million outstanding under our senior secured credit facility.
(3) Subsequent to June 30, 2011, the outstanding balance of the Broad Oak Energy, Inc. credit facility was paid in full and the agreement was terminated on July 1, 2011.
42
Purchasers of the common stock in this offering will experience immediate and substantial dilution in the net tangible book value per share of the common stock for accounting purposes. Our net tangible book value as of June 30, 2011, after giving pro forma effect to the transactions described under "Corporate reorganization," was approximately $ million, or $ per share of common stock. Pro forma net tangible book value per share is determined by dividing our pro forma tangible net worth (tangible assets less total liabilities) by the total number of outstanding shares of common stock that will be outstanding immediately prior to the closing of this offering. After giving effect to our corporate reorganization and the sale of the shares in this offering and assuming the receipt of the estimated net proceeds (after deducting estimated discounts and expenses of this offering), our adjusted pro forma net tangible book value as of June 30, 2011 would have been approximately $ million, or $ per share. This represents an immediate increase in the net tangible book value of $ per share to our existing stockholders and an immediate dilution (i.e., the difference between the offering price and the adjusted pro forma net tangible book value after this offering) to new investors purchasing shares in this offering of $ per share. The following table illustrates the per share dilution to new investors purchasing shares in this offering:
Assumed initial public offering price per share |
$ | |||||||
Pro forma net tangible book value per share as of June 30, 2011 (after giving effect to our corporate reorganization) |
$ | |||||||
Increase per share attributable to new investors in this offering |
||||||||
As adjusted pro forma net tangible book value per share after giving effect to our corporate reorganization and this offering |
||||||||
Dilution in pro forma net tangible book value per share to new investors in this offering |
$ | |||||||
The following table summarizes, on an adjusted pro forma basis as of June 30, 2011, the total number of shares of common stock owned by existing stockholders and to be owned by new investors, the total consideration paid and the average price per share paid by our existing stockholders and to be paid by new investors in this offering at $ (the midpoint of the price range set forth on the cover page of this prospectus), calculated before deduction of estimated underwriting discounts and commissions:
| |
Shares acquired | Total consideration | |
|||||||||||||
|---|---|---|---|---|---|---|---|---|---|---|---|---|---|---|---|---|
| |
Average price per share |
|||||||||||||||
| |
Number |
Percent |
Number |
Percent |
||||||||||||
Existing stockholders |
||||||||||||||||
New investors |
||||||||||||||||
Total |
||||||||||||||||
Assuming the underwriters' option to acquire additional shares of common stock is exercised in full, sales by us in this offering will reduce the percentage of shares held by existing stockholders to % and will increase the number of shares held by new investors to , or % on an adjusted pro forma basis as of June 30, 2011.
43
Selected historical combined financial data
The following financial data should be read in conjunction with "Management's discussion and analysis of financial condition and results of operations," and our unaudited and audited combined financial statements and notes thereto included elsewhere in this prospectus. We believe that the assumptions underlying the preparation of our combined financial statements are reasonable. The financial information included in this prospectus may not be indicative of our future results of operations, financial position and cash flows.
Prior to the acquisition of Broad Oak, the majority equity ownership of both Laredo and Broad Oak was effectively controlled by a common owner. For this reason, both the unaudited and audited financial statements included in this prospectus consist of the historical audited combined balance sheets of Laredo Petroleum, LLC (and its historical subsidiaries) as well as Broad Oak, as of December 31, 2010, 2009 and 2008, and the related combined statements of operations, owners' equity and cash flows for each of the three years then ended, and the unaudited historical combined balance sheets of Laredo Petroleum, LLC (and its historical subsidiaries) as well as Broad Oak, as of June 30, 2011 and the related combined statements of operations, owners' equity and cash flows for the six months ended June 30, 2011 and 2010. As a result, the financial statements included in this prospectus, and the financial and other data contained in this prospectus treat Broad Oak as having been a part of the historical consolidated group of Laredo from inception. Such combined information is not necessarily indicative of the results that would have been obtained if Laredo had owned and operated Broad Oak from its inception.
Presented below is our combined financial data for the periods and as of the dates indicated. The combined financial data for the years ended December 31, 2010, 2009 and 2008 and the balance sheets as of December 31, 2010 and 2009 are derived from our audited combined financial statements and the notes thereto included elsewhere in this prospectus. The combined financial data for the six months ended June 30, 2011 and 2010 and the balance sheet data as of June 30, 2011 are derived from our unaudited combined financial statements and the notes thereto included elsewhere in this prospectus. The combined financial data for the year ended December 31, 2007 and for the period from our inception in May 2006 through December 31, 2006 and the balance sheet data as of December 31, 2008, 2007 and 2006, are derived from our unaudited combined financial statements not included in this prospectus.
44
| |
For the six months ended June 30, |
For the years ended December 31, |
|
||||||||||||||||||||||
|---|---|---|---|---|---|---|---|---|---|---|---|---|---|---|---|---|---|---|---|---|---|---|---|---|---|
| |
Inception to December 31, 2006 |
||||||||||||||||||||||||
| (in thousands) |
2011 |
2010 |
2010 |
2009 |
2008(2) |
2007(3) |
|||||||||||||||||||
| |
(unaudited) |
|
|
|
(unaudited) |
(unaudited) |
|||||||||||||||||||
Statement of operations data: |
|||||||||||||||||||||||||
Revenues: |
|||||||||||||||||||||||||
Oil and gas sales |
$ | 236,532 | $ | 95,615 | $ | 239,783 | $ | 94,347 | $ | 73,883 | $ | 9,541 | $ | — | |||||||||||
Natural gas transportation and treating |
2,306 | 1,308 | 2,217 | 2,227 | 304 | 87 | — | ||||||||||||||||||
Drilling and production |
3 | 3 | 4 | 318 | 548 | 22 | — | ||||||||||||||||||
Total revenues |
238,841 | 96,926 | 242,004 | 96,892 | 74,735 | 9,650 | — | ||||||||||||||||||
Costs and expenses: |
|||||||||||||||||||||||||
Lease operating expenses |
18,112 | 9,676 | 21,684 | 12,531 | 6,436 | 2,739 | — | ||||||||||||||||||
Production and ad valorem taxes |
14,999 | 6,568 | 15,699 | 6,129 | 5,481 | 718 | — | ||||||||||||||||||
Natural gas transportation treating |
1,167 | 1,643 | 2,501 | 1,416 | 154 | — | — | ||||||||||||||||||
Drilling rig fees |
— | — | — | 1,606 | — | — | — | ||||||||||||||||||
Drilling and production |
696 | 96 | 344 | 1,076 | 23 | — | — | ||||||||||||||||||
General and administrative |
19,770 | 15,053 | 30,908 | 22,492 | 23,248 | 8,828 | 1,986 | ||||||||||||||||||
Bad debt expense |
— | — | — | 91 | — | — | — | ||||||||||||||||||
Accretion of asset retirement obligations |
304 | 221 | 475 | 406 | 170 | 2 | — | ||||||||||||||||||
Depreciation, depletion and amortization |
75,917 | 36,639 | 97,411 | 58,005 | 33,102 | 4,986 | 43 | ||||||||||||||||||
Impairment expense(1) |
243 | — | — | 246,669 | 282,587 | — | — | ||||||||||||||||||
Total costs and expenses |
131,208 | 69,896 | 169,022 | 350,421 | 351,201 | 17,273 | 2,029 | ||||||||||||||||||
Operating income (loss) |
107,633 | 27,030 | 72,982 | (253,529 | ) | (276,466 | ) | (7,623 | ) | (2,029 | ) | ||||||||||||||
Non-operating income (expense): |
|||||||||||||||||||||||||
Realized and unrealized gain (loss): |
|||||||||||||||||||||||||
Commodity derivative financial instruments, net |
(9,585 | ) | 23,090 | 11,190 | 5,744 | 40,569 | 1,579 | — | |||||||||||||||||
Interest rate derivatives, net |
(1,094 | ) | (3,952 | ) | (5,375 | ) | (3,394 | ) | (6,274 | ) | — | — | |||||||||||||
Interest expense |
(22,252 | ) | (5,928 | ) | (18,482 | ) | (7,464 | ) | (4,410 | ) | (2,046 | ) | — | ||||||||||||
Interest income |
55 | 97 | 150 | 223 | 781 | 633 | 188 | ||||||||||||||||||
Write-off of deferred loan costs |
(3,246 | ) | — | — | — | — | — | — | |||||||||||||||||
Loss on disposal of assets |
(35 | ) | (32 | ) | (30 | ) | (85 | ) | (2 | ) | — | — | |||||||||||||
Other |
3 | — | 1 | 4 | 38 | 1 | — | ||||||||||||||||||
Non-operating income (expense), net |
(36,154 | ) | 13,275 | (12,546 | ) | (4,972 | ) | 30,702 | 167 | 188 | |||||||||||||||
Income (loss) before income taxes |
71,479 | 40,305 | 60,436 | (258,501 | ) | (245,764 | ) | (7,456 | ) | (1,841 | ) | ||||||||||||||
Income tax (expense) benefit: |
|||||||||||||||||||||||||
Current |
— | — | — | — | (12 | ) | — | — | |||||||||||||||||
Deferred |
(25,737 | ) | (5,780 | ) | 25,812 | 74,006 | 53,729 | 1,405 | — | ||||||||||||||||
Total income tax (expense) benefit, net |
(25,737 | ) | (5,780 | ) | 25,812 | 74,006 | 53,717 | 1,405 | — | ||||||||||||||||
Net income (loss) |
$ | 45,742 | $ | 34,525 | $ | 86,248 | $ | (184,495 | ) | $ | (192,047 | ) | $ | (6,051 | ) | $ | (1,841 | ) | |||||||
(1) In 2009, we recognized a pre-tax non-cash full cost ceiling impairment charge of approximately $245.9 million on our proved properties and we reduced materials and supplies by approximately $0.8 million to reflect our materials and supplies at the lower of cost or market. In 2008, we recognized a pre-tax non-cash full cost ceiling impairment charge of approximately $282.6 million on our proved properties. For a discussion of our impairment expense, see Notes, B.5, B.7 and B.19 in our audited combined financial statements included elsewhere in this prospectus.
(2) The year ended December 31, 2008 contains the results of operations for the acquisition of properties from Linn Energy beginning August 15, 2008, the closing date of the property acquisition. See Note C in our audited combined financial statements included elsewhere in this prospectus.
(3) The year ended December 31, 2007 contains the results of operations for the acquisition of properties from Jones Energy beginning June 5, 2007, the closing date of the property acquisition.
45
| |
As of June 30, 2011 |
As of December 31, | ||||||||||||||||||
|---|---|---|---|---|---|---|---|---|---|---|---|---|---|---|---|---|---|---|---|---|
| (in thousands) |
2010 |
2009 |
2008 |
2007 |
2006 |
|||||||||||||||
| |
(unaudited) |
|
|
|
(unaudited) |
(unaudited) |
||||||||||||||
Balance sheet data: |
||||||||||||||||||||
Cash and cash equivalents |
$ | 22,052 | $ | 31,235 | $ | 14,987 | $ | 13,512 | $ | 6,937 | $ | 6,345 | ||||||||
Net property and equipment |
1,078,036 | 809,893 | 396,100 | 350,702 | 137,852 | 7,539 | ||||||||||||||
Total assets |
1,316,793 | 1,068,160 | 625,344 | 578,387 | 171,799 | 13,903 | ||||||||||||||
Current liabilities |
148,745 | 150,243 | 79,265 | 101,864 | 16,809 | 550 | ||||||||||||||
Long-term debt |
690,400 | 491,600 | 247,100 | 148,600 | 44,500 | — | ||||||||||||||
Total owners' equity |
457,717 | 411,099 | 289,107 | 318,364 | 109,708 | 13,316 | ||||||||||||||
| |
For the six months ended June 30, |
For the years ended December 31, |
|
||||||||||||||||||||
|---|---|---|---|---|---|---|---|---|---|---|---|---|---|---|---|---|---|---|---|---|---|---|---|
| |
Inception to December 31, 2006 |
||||||||||||||||||||||
| (in thousands) |
2011 |
2010 |
2010 |
2009 |
2008 |
2007 |
|||||||||||||||||
| |
(unaudited) |
|
|
|
(unaudited) |
(unaudited) |
|||||||||||||||||
Other financial data: |
|||||||||||||||||||||||
Net cash provided by (used in) operating activities |
$ | 162,058 | $ | 57,652 | $ | 157,043 | $ | 112,669 | $ | 25,332 | $ | 5,019 | $ | (1,231 | ) | ||||||||
Net cash used in investing activities |
(359,449 | ) | (181,265 | ) | (460,547 | ) | (361,333 | ) | (490,897 | ) | (131,153 | ) | (7,581 | ) | |||||||||
Net cash provided by financing activities |
188,208 | 133,507 | 319,752 | 250,139 | 472,140 | 126,726 | 15,157 | ||||||||||||||||
| |
For the six months ended June 30, |
For the years ended December 31, |
|
||||||||||||||||||||
|---|---|---|---|---|---|---|---|---|---|---|---|---|---|---|---|---|---|---|---|---|---|---|---|
| |
Inception to December 31, 2006 |
||||||||||||||||||||||
| (in thousands, unaudited) |
2011 |
2010 |
2010 |
2009 |
2008 |
2007 |
|||||||||||||||||
Adjusted EBITDA(1) |
$ | 183,796 | $ | 73,612 | $ | 194,502 | $ | 104,908 | $ | 49,305 | $ | (1,522 | ) | $ | (1,798 | ) | |||||||
(1) Adjusted EBITDA is a non-GAAP financial measure. For a definition of Adjusted EBITDA and a reconciliation of Adjusted EBITDA to net income (loss) see "—Non-GAAP financial measures and reconciliations" below.
The historical financial data for January 1, 2007 to June 4, 2007 has been derived from the historical accounting records of Jones Energy, the accounting predecessor to Laredo Petroleum, LLC. The historical financial data for the year ended December 31, 2006 has been derived from the audited statement of revenues and direct operating expenses for the properties acquired from Jones Energy. The statements do not reflect depreciation, depletion and amortization, general and administrative expenses, income taxes or interest expense.
| (in thousands) |
Period from January 1, 2007 to June 4, 2007 |
Year ended December 31, 2006 |
||||||
|---|---|---|---|---|---|---|---|---|
Statement of operations data: |
||||||||
Oil and gas revenues |
$ | 6,565 | $ | 19,722 | ||||
Direct operating expenses |
2,280 | 5,661 | ||||||
Excess of revenues over direct operating expenses |
$ | 4,285 | $ | 14,061 | ||||
46
Non-GAAP financial measures and reconciliations
Adjusted EBITDA is a non-GAAP financial measure that we define as net income or loss plus adjustments for interest expense, depreciation, depletion and amortization, impairment of long-lived assets, write-off of deferred financing fees and other, gains or losses on sale of assets, unrealized gains or losses on derivative financial instruments, realized losses on interest rate derivatives, realized gains or losses on canceled derivative financial instruments, non-cash equity-based compensation and income tax expense or benefit. Adjusted EBITDA, as used and defined by us, may not be comparable to similarly titled measures employed by other companies and is not a measure of performance calculated in accordance with GAAP. Adjusted EBITDA should not be considered in isolation or as a substitute for operating income or loss, net income or loss, cash flows provided by operating activities, used in investing activities and provided by financing activities, or statement of operations or statement of cash flow data prepared in accordance with GAAP. Adjusted EBITDA provides no information regarding a company's capital structure, borrowings, interest costs, capital expenditures, working capital increases, working capital decreases or its tax position. Adjusted EBITDA does not represent funds available for discretionary use, because those funds are required for debt service, capital expenditures and working capital, income taxes, franchise taxes and other commitments and obligations. However, our management team believes Adjusted EBITDA is useful to an investor in evaluating our operating performance because this measure:
- •
- is widely used by investors in the oil and natural gas industry to measure a company's operating performance without
regard to items excluded from the calculation of such term, which can vary substantially from company to company depending upon accounting methods and book value of assets, capital structure and the
method by which assets were acquired, among other factors;
- •
- helps investors to more meaningfully evaluate and compare the results of our operations from period to period by removing
the effect of our capital structure from our operating structure; and
- •
- is used by our management team for various purposes, including as a measure of operating performance, in presentations to our board of directors, and as a basis for strategic planning and forecasting.
There are significant limitations to the use of Adjusted EBITDA as a measure of performance, including the inability to analyze the effect of certain recurring and non-recurring items that materially affect our net income or loss, the lack of comparability of results of operations to different companies, and the methods of calculating Adjusted EBITDA and our measurements of Adjusted EBITDA for financial reporting and compliance under our debt agreements differ.
47
The following presents a reconciliation of net income (loss) to Adjusted EBITDA:
| |
For the six months ended June 30, |
|
|
|
|
|
|||||||||||||||||
|---|---|---|---|---|---|---|---|---|---|---|---|---|---|---|---|---|---|---|---|---|---|---|---|
| |
For the years ended December 31, | Inception to December 31, 2006 |
|||||||||||||||||||||
| (in thousands, unaudited) |
|||||||||||||||||||||||
| 2011 |
2010 |
2010 |
2009 |
2008 |
2007 |
||||||||||||||||||
Net income (loss) |
$ | 45,742 | $ | 34,525 | $ | 86,248 | $ | (184,495 | ) | $ | (192,047 | ) | $ | (6,051 | ) | $ | (1,841 | ) | |||||
Plus: |
|||||||||||||||||||||||
Interest expense |
22,252 | 5,928 | 18,482 | 7,464 | 4,410 | 2,046 | — | ||||||||||||||||
Depreciation, depletion and amortization |
75,917 | 36,639 | 97,411 | 58,005 | 33,102 | 4,986 | 43 | ||||||||||||||||
Impairment of long-lived assets |
243 | — | — | 246,669 | 282,587 | — | — | ||||||||||||||||
Write-off of deferred loan costs |
3,246 | — | — | — | — | — | — | ||||||||||||||||
Loss on disposal of assets |
35 | 32 | 30 | 85 | 2 | — | — | ||||||||||||||||
Unrealized losses (gains) on derivative financial instruments |
7,192 | (12,603 | ) | 11,648 | 46,003 | (27,174 | ) | (1,098 | ) | — | |||||||||||||
Realized losses (gains) on interest rate derivatives |
2,556 | 2,623 | 5,238 | 3,764 | 278 | — | — | ||||||||||||||||
Non-cash equity-based compensation |
876 | 688 | 1,257 | 1,419 | 1,864 | — | — | ||||||||||||||||
Income tax expense (benefit) |
25,737 | 5,780 | (25,812 | ) | (74,006 | ) | (53,717 | ) | (1,405 | ) | — | ||||||||||||
Adjusted EBITDA |
$ | 183,796 | $ | 73,612 | $ | 194,502 | $ | 104,908 | $ | 49,305 | $ | (1,522 | ) | $ | (1,798 | ) | |||||||
48
Management's discussion and analysis of financial
condition and results of operations
The following discussion and analysis of our financial condition and results of operations should be read in conjunction with our combined financial statements and notes thereto appearing elsewhere in this prospectus. The following discussion contains "forward-looking statements" that reflect our future plans, estimates, beliefs and expected performance. We caution that assumptions, expectations, projections, intentions or beliefs about future events may, and often do, vary from actual results and the differences can be material. Some of the key factors which could cause actual results to vary from our expectations include changes in oil and gas prices, the timing of planned capital expenditures, availability of acquisitions, uncertainties in estimating proved reserves and forecasting production results, potential failure to achieve production from development projects, operational factors affecting the commencement or maintenance of producing wells, the condition of the capital markets generally, as well as our ability to access them, the proximity to and capacity of transportation facilities, and uncertainties regarding environmental regulations or litigation and other legal or regulatory developments affecting our business, as well as those factors discussed below and elsewhere in this prospectus, all of which are difficult to predict. In light of these risks, uncertainties and assumptions, the forward-looking events discussed may not occur. See "Forward-looking statements" and "Risk factors."
The historical financial and operational data presented herein for Laredo and Broad Oak have been combined.
Overview
We are an independent energy company focused on the exploration, development and acquisition of oil and natural gas properties in the Permian and Mid-Continent regions of the United States. Laredo was founded in October 2006 to explore, develop and operate oil and natural gas properties and has grown rapidly through its drilling program and by making strategic acquisitions and joint ventures. On July 1, 2011, we completed the acquisition of Broad Oak whereby Broad Oak became a wholly-owned subsidiary of Laredo Petroleum, Inc. Our combined financial and operating performance for the six months ended June 30, 2011 included the following:
- •
- Oil and natural gas sales of approximately $236.5 million, compared to approximately $95.6 million for the
six months ended June 30, 2010;
- •
- Average daily production of 22,070 BOE/D, compared to 12,207 BOE/D for the six months ended June 30, 2010;
and
- •
- Estimated net proved reserves of 137,052 MBOE as of June 30, 2011, compared to 102,807 MBOE as of June 30, 2010.
Mergers and acquisitions
Our use of capital for development and acquisitions allows us to direct our capital resources toward what we believe to be the most attractive opportunities as market conditions evolve. We have historically developed properties that we believe will meet or exceed our rate of
49
return criteria. For acquisitions of properties with additional development and exploration potential, we have focused on acquiring properties that we expect to operate so that we can control the timing and implementation of capital spending. We also make acquisitions in core, mature areas where management can leverage knowledge and experience to identify upsides in assets.
On May 30, 2008 and August 6, 2008, we entered into purchase and sale agreements with Linn Energy to acquire ownership interests in oil and gas properties located in the Verden area in Caddo, Grady and Comanche Counties, Oklahoma, for a total purchase price of $185.0 million, subject to certain adjustments. The first purchase and sale agreement had an effective date of July 1, 2008, and was closed on August 15, 2008. The second purchase and sale agreement completed the acquisition of the remaining property, had an effective date of July 1, 2008 and was closed on August 7, 2008. For additional discussion of completed acquisitions in 2008, refer to Note C in our audited combined financial statements included elsewhere in this prospectus. There were no significant acquisitions during 2009 and 2010.
As noted above, on July 1, 2011, we consummated the acquisition of Broad Oak for consideration consisting of (i) cash payments totaling $82.0 million to certain members of management and employees, (ii) equity issuances of 86.5 million preferred Laredo Petroleum, LLC units to Warburg Pincus, (iii) equity issuances of 2.4 million preferred Laredo Petroleum, LLC units to certain directors and management of Broad Oak and (iv) repayment of the $265.4 million of outstanding debt under the Broad Oak credit facility. Immediately following the consummation of such transaction, Laredo Petroleum, LLC assigned 100% of its ownership interest in Broad Oak to Laredo Petroleum, Inc. as a contribution to capital. Refer to Note O in our audited combined financial statements included elsewhere in this prospectus for further discussion of the Broad Oak acquisition.
Core areas of operations
Our activities are primarily focused in the Wolfberry and deeper horizons of the Permian Basin in West Texas and the Anadarko Granite Wash in the Texas Panhandle and Western Oklahoma. Both of these plays are characterized by high oil and liquids-rich content, multiple target horizons, extensive production histories, long-lived reserves, high drilling success rates and significant initial production rates. As of June 30, 2011, we had an interest in 1,028 gross producing wells and operated approximately 98% of the production of our proved developed oil and natural gas reserves.
Additionally, as of June 30, 2011, we have accumulated approximately 338,100 net acres with over 6,000 identified potential gross drilling locations on our existing acreage. We intend to develop this large acreage position to increase our cash flow, production and reserves through continued vertical and horizontal drilling programs.
Reserves and pricing
In December 2008, the SEC released the final rule for Modernization of Oil and Gas Reporting. Among other changes, the final rule requires us to report oil and gas reserves and calculate the full cost ceiling value using the unweighted arithmetic average first-day-of-the-month oil and gas prices during the 12-month period ending in the reporting period. The prior SEC rule required using prices at period end. The requirements of this standard became effective for the
50
year ended December 31, 2009. These revisions and requirements affect the comparability between reporting periods prior to and after the year ended December 31, 2009 for reserve volume and value estimates, full cost pool write-down calculations and the calculations of depletion of oil and gas assets.
Ryder Scott, our independent reserve engineers, estimated 100% of our combined proved reserves at December 31, 2010 and June 30, 2011. Ryder Scott also estimated the proved reserves for the legacy Laredo properties as of December 31, 2009 and December 31, 2008. Ryder Scott did not perform evaluations of the Broad Oak properties on these dates. Our estimates of the combined proved reserves at December 31, 2009 and December 31, 2008 are a combination of the Ryder Scott reports on the legacy Laredo properties and Laredo's internal proved reserve estimates of the Broad Oak properties. Based upon such reserve estimates we calculated for Broad Oak, we believe the legacy Laredo properties represented 93% and 96% of such combined proved reserves at year end 2009 and 2008, respectively. As of June 30, 2011, we had 137,052 MBOE of estimated net proved reserves as compared to 136,560 MBOE of estimated net proved reserves at December 31, 2010, 52,519 MBOE of estimated net proved reserves at December 31, 2009 and 44,183 MBOE at December 31, 2008. The unweighted arithmetic average first-day-of-the-month prices for the prior 12 months were $86.60 per Bbl for oil and $4.00 per MMBtu for natural gas at June 30, 2011, $75.96 per Bbl for oil and $4.15 per MMBtu for natural gas at December 31, 2010, and $57.04 per Bbl for oil and $3.15 per MMBtu for natural gas at December 31, 2009. The period end index prices used at December 31, 2008 were $44.60 per Bbl for oil and $4.68 per MMBtu for natural gas. The prices used to estimate proved reserves for all periods did not give effect to derivative transactions, were held constant throughout the life of the properties and have been adjusted for quality, transportation fees, geographical differentials, marketing bonuses or deductions and other factors affecting the price received at the wellhead.
Prices for oil and natural gas can fluctuate widely in response to relatively minor changes in the global and regional supply of and demand for oil and natural gas, market uncertainty, economic conditions and a variety of additional factors. Since the inception of our oil and natural gas activities, commodity prices have experienced significant fluctuations, and additional changes in commodity prices may significantly affect the economic viability of drilling projects, as well as the economic valuation and economic recovery of oil and gas reserves. We have entered into a number of commodity derivatives, which have allowed us to offset a portion of the changes caused by price fluctuations on our oil and gas production as discussed in "—Sources of our revenue" below.
Sources of our revenue
Our revenues are derived from the sale of oil and natural gas within the continental United States and do not include the effects of derivatives. For the six months ended June 30, 2011, our revenues are comprised of sales of approximately, 60% oil, 39% gas and 1% for transportation, gathering, drilling and production. Our revenues may vary significantly from period to period as a result of changes in volumes of production sold or changes in commodity prices. Oil and natural gas prices have historically been volatile. In 2008, prices peaked at over $133.00 per Bbl and $10.00 per MMBtu with subsequent declines to approximately $41.00 per Bbl and $3.00 per MMBtu in 2009. In the first six months of 2011, West Texas Intermediate Light Sweet Crude Oil prices have been in a range between $88.00 and $110.00 per Bbl for oil and wellhead natural gas market prices have been in a range between $3.90 and $4.23 per MMBtu.
51
Hedging
Due to the inherent volatility in oil and gas prices, we use commodity derivative instruments, such as collars, swaps, puts and basis swaps to hedge price risk associated with a significant portion of our anticipated oil and gas production. By removing a majority of the price volatility associated with future production, we expect to reduce, but not eliminate, the potential effects of variability in cash flow from operations due to fluctuations in commodity prices. We have not elected hedge accounting on these derivatives and, therefore, the unrealized gains and losses on open positions are reflected currently in earnings. At each period end, we estimate the fair value of our commodity derivatives and recognize an unrealized gain or loss. For the six months ended June 30, 2011 and June 30, 2010, we recognized an unrealized loss and an unrealized gain, respectively, largely due to the inclusion of derivative premium liabilities in our unrealized value in the six months ended June 30, 2011 that were not outstanding at June 30, 2010. During the years ended December 31, 2010 and 2009, we recognized unrealized losses as market prices generally increased during these periods. During the year ended December 31, 2008, we recognized significant unrealized gains on our commodity derivatives as market prices generally decreased during this period.
Our open hedge positions as of June 30, 2011 are as follows:
| |
Remaining year 2011 |
Year 2012 |
Year 2013 |
||||||||
|---|---|---|---|---|---|---|---|---|---|---|---|
Oil Positions(1): |
|||||||||||
Puts: |
|||||||||||
Hedged volume (Bbls) |
174,000 | 672,000 | 1,080,000 | ||||||||
Average price ($/Bbl) |
$ | 62.52 | $ | 65.79 | $ | 65.00 | |||||
Swaps: |
|||||||||||
Hedged volume (Bbls) |
438,170 | 732,000 | 600,000 | ||||||||
Average price ($/Bbl) |
$ | 86.73 | $ | 93.52 | $ | 96.32 | |||||
Collars: |
|||||||||||
Hedged volume (Bbls) |
360,000 | 498,000 | 216,000 | ||||||||
Average floor price ($/Bbl) |
$ | 78.25 | $ | 75.06 | $ | 73.89 | |||||
Average ceiling price ($/Bbl) |
$ | 113.58 | $ | 107.17 | $ | 120.56 | |||||
Natural Gas Positions(2): |
|||||||||||
Puts: |
|||||||||||
Hedged volume (MMBtu) |
180,000 | 4,320,000 | 6,600,000 | ||||||||
Average price ($/MMBtu) |
$ | 3.50 | $ | 5.38 | $ | 4.00 | |||||
Swaps: |
|||||||||||
Hedged volume (MMBtu) |
782,173 | 1,680,000 | — | ||||||||
Average price ($/MMBtu) |
$ | 5.65 | $ | 6.14 | $ | — | |||||
Collars: |
|||||||||||
Hedged volume (MMBtu) |
5,700,000 | 7,800,000 | 6,600,000 | ||||||||
Average floor price ($/MMBtu) |
$ | 4.82 | $ | 4.12 | $ | 4.00 | |||||
Average ceiling price ($/MMBtu) |
$ | 7.98 | $ | 5.79 | $ | 7.05 | |||||
Basis Swaps: |
|||||||||||
Hedged volume (MMBtu) |
2,520,000 | 2,880,000 | 1,200,000 | ||||||||
Average price ($/MMBtu) |
$ | 0.29 | $ | 0.31 | $ | 0.33 | |||||
(1) The oil derivatives are settled based on the month's average daily NYMEX price of West Texas Intermediate Light Sweet Crude Oil.
(2) The natural gas derivatives are settled based on NYMEX gas futures, the Northern Natural Gas Co. demarcation price or the Panhandle Eastern Pipe Line spot price of natural gas for the calculation period. The basis swap derivatives are settled based on the differential between the NYMEX gas futures and the West Texas WAHA index gas price.
52
Principal components of our cost structure
Lease operating and natural gas transportation and treating expenses. These are daily costs incurred to bring oil and gas out of the ground and to the market, together with the daily costs incurred to maintain our producing properties. Such costs also include maintenance, repairs and workover expenses related to our oil and gas properties.
Production and ad valorem taxes. Production taxes are paid on produced oil and gas based on a percentage of revenues from products sold at market prices or at fixed rates established by federal, state or local taxing authorities. We take full advantage of all credits and exemptions in our various taxing jurisdictions. In general, the production taxes we pay correlate to the changes in oil and gas revenues. Ad valorem taxes are property taxes assessed based on a flat rate per natural gas equivalent produced on our properties located in Texas.
Drilling rig fees. These are costs incurred under short-term drilling contracts for fees paid to various third parties if we terminate our drilling or cease efforts, including for stacked drilling rigs in lieu of drilling.
Drilling and production. These are costs incurred to maintain facilities that support our drilling activities.
General and administrative. These are costs incurred for overhead, including payroll and benefits for our corporate staff, costs of maintaining our headquarters, costs of managing our production and development operations, franchise taxes, audit and other fees for professional services and legal compliance.
Depreciation, depletion and amortization. Under the full cost accounting method, we capitalize costs within a cost center and then systematically expense those costs on a units of production basis based on proved oil and natural gas reserve quantities. We calculate depletion on the following types of costs: (i) all capitalized costs, other than the cost of investments in unproved properties and major development projects for which proved reserves cannot yet be assigned, less accumulated amortization; (ii) the estimated future expenditures to be incurred in developing proved reserves; and (iii) the estimated dismantlement and abandonment costs, net of estimated salvage values. We calculate depreciation on the cost of fixed assets related to our pipelines and other fixed assets.
Impairment expense. This is the cost to reduce proved oil and gas properties to the calculated full cost ceiling value and the write-downs of our materials and supplies inventory, consisting of pipe and well equipment, to the lower of cost or market value at the end of the respective period.
Other income (expense)
Realized and unrealized gain (loss) on commodity derivative financial instruments. We utilize commodity derivative financial instruments to reduce our exposure to fluctuations in the price of crude oil and natural gas. This amount represents (i) the recognition of unrealized gains and losses associated with our open derivative contracts as commodity prices change and commodity derivative contracts expire or new ones are entered into, and (ii) our realized gains and losses on the settlement of these commodity derivative instruments. We classify these gains and losses as operating activities in our combined statements of cash flows.
53
Realized and unrealized gain (loss) on interest rate derivative instruments. We utilize interest rate swaps and caps to reduce our exposure to fluctuations in interest rates on our outstanding debt. This amount represents (i) the recognition of unrealized gains and losses associated with our open interest rate derivative contracts as interest rates change and interest rate contracts expire or new ones are entered into, and (ii) our realized gains and losses on the settlement of these interest rate contracts. We classify these gains and losses as operating activities in our combined statements of cash flows.
Interest expense. We finance a portion of our working capital requirements, capital expenditures and acquisitions with borrowings under our senior secured credit facility, our senior unsecured notes and, prior to its termination on July 1, 2011, the Broad Oak credit facility. As a result, we incur interest expense that is affected by both fluctuations in interest rates and our financing decisions. We have entered into various interest rate derivative contracts to mitigate the effects of interest rate changes. We do not designate these derivative contracts as hedges and therefore hedge accounting treatment is not applicable. Realized and unrealized gains or losses on these interest rate contracts are included in non-operating income (expense) as discussed above. We reflect interest paid to the lenders and bondholders in interest expense. In addition, we include the amortization of deferred financing costs (including origination and amendment fees), commitment fees and annual agency fees in interest expense.
Interest income. This represents the interest received on our cash and cash equivalents.
Income tax expense. Income taxes are generally presented on an "as combined" basis. However, in light of the historic ownership structure of the combined entities, U.S. tax laws do not allow tax losses of one entity to offset income and losses of another entity until July 1, 2011. As such, the financial accounting for the income tax consequences of each combined company is calculated separately in the combined financial statements.
Laredo Petroleum, LLC is a limited liability company treated as a partnership for federal and state income tax purposes. The taxable income of Laredo Petroleum, LLC is passed through to its members. As such, no recognition of federal or state income taxes for Laredo Petroleum, LLC has been provided for in the accompanying combined financial statements. Laredo Petroleum, LLC's subsidiaries and Broad Oak, are separate taxable corporations and these corporations along with subsidiaries that are organized as limited liability companies, are subject to federal and state corporate income taxes. These income taxes are accounted for under the asset and liability method pursuant to Accounting Standards Codification 740, Income Taxes. Deferred tax assets and liabilities are recognized for the future tax consequences attributable to differences between the financial statement carrying amounts of existing assets and liabilities and their respective tax bases and operating losses and tax credit carry-forwards. Under this method, deferred tax assets and liabilities are measured using enacted tax rates expected to apply to taxable income in the years in which those temporary differences are expected to be recovered or settled. The effect on deferred tax assets and liabilities of a change in tax rates is recognized in income in the period that includes the enactment date. On a quarterly basis, management evaluates the need for and adequacy of valuation allowances based on the expected realization of the deferred tax assets and adjusts the amount of such allowances, if necessary.
54
Results of operations
Six months ended June 30, 2011 as compared to six months ended June 30, 2010
The following table sets forth selected operating data for the six months ended June 30, 2011 compared to the six months ended June 30, 2010:
| |
Six months ended June 30, |
|||||||||
|---|---|---|---|---|---|---|---|---|---|---|
| (in thousands except for production data and average sales prices) |
2011 |
2010 |
||||||||
| |
(unaudited) |
|||||||||
Operating results: |
||||||||||
Revenues |
||||||||||
Oil |
$ | 143,464 | $ | 44,252 | ||||||
Natural gas |
93,068 | 51,363 | ||||||||
Natural gas transportation and treating |
2,306 | 1,308 | ||||||||
Drilling and production |
3 | 3 | ||||||||
Total revenues |
238,841 | 96,926 | ||||||||
Costs and expenses |
||||||||||
Lease operating expenses |
18,112 | 9,676 | ||||||||
Production and ad valorem taxes |
14,999 | 6,568 | ||||||||
Natural gas transportation and treating |
1,167 | 1,643 | ||||||||
Drilling and production |
696 | 96 | ||||||||
General and administrative |
19,770 | 15,053 | ||||||||
Accretion of asset retirement obligations |
304 | 221 | ||||||||
Depreciation, depletion and amortization |
75,917 | 36,639 | ||||||||
Impairment expense |
243 | — | ||||||||
Total costs and expenses |
131,208 | 69,896 | ||||||||
Non-operating income (expense): |
||||||||||
Realized and unrealized gain (loss): |
||||||||||
Commodity derivative financial instruments, net |
(9,585 | ) | 23,090 | |||||||
Interest rate derivatives, net |
(1,094 | ) | (3,952 | ) | ||||||
Interest expense |
(22,252 | ) | (5,928 | ) | ||||||
Interest income |
55 | 97 | ||||||||
Write-off of deferred loan costs |
(3,246 | ) | — | |||||||
Loss on disposal of assets |
(35 | ) | (32 | ) | ||||||
Other |
3 | — | ||||||||
Non-operating income (expense), net |
(36,154 | ) | 13,275 | |||||||
Income tax expense |
(25,737 | ) | (5,780 | ) | ||||||
Net income |
$ | 45,742 | $ | 34,525 | ||||||
Production data: |
||||||||||
Oil (MBbls) |
1,517 | 592 | ||||||||
Natural gas (MMcf) |
14,866 | 9,710 | ||||||||
Barrels of oil equivalent(1) (MBOE) |
3,995 | 2,210 | ||||||||
Average daily production (BOE/D) |
22,070 | 12,207 | ||||||||
Average sales prices: |
||||||||||
Oil, realized ($/Bbl) |
$ | 94.57 | $ | 74.75 | ||||||
Oil, hedged(2) ($/Bbl) |
$ | 90.31 | $ | 75.32 | ||||||
Natural gas, realized ($/Mcf) |
$ | 6.26 | $ | 5.29 | ||||||
Natural gas, hedged(2) ($/Mcf) |
$ | 6.63 | $ | 6.20 | ||||||
(1) MBbl equivalents ("MBOE") converted at a rate of six MMcf per one MBbl.
(2) Hedged prices reflect the after-effect of our commodity hedging transactions on our average sales prices. Our calculation of such after-effect includes realized gains or losses on cash settlements for commodity derivatives, which do not qualify for hedge accounting.
55
Oil and gas revenues. Our oil and gas revenues increased by approximately $140.9 million, or 147%, to $236.5 million during the six months ended June 30, 2011 as compared to the six months ended June 30, 2010. Our revenues are a function of oil and gas production volumes sold and average sales prices received for those volumes. Average daily production sold increased by 9,863 BOE/D during the six months ended June 30, 2011 as compared to the same period in 2010. The total increase in revenue of approximately $140.9 million is largely attributable to higher oil and gas production volumes as well as an increase in oil prices being realized for the six months ended June 30, 2011 as compared to the six months ended June 30, 2010. Production increased by 925 MBbls for oil and 5,156 MMcf for gas for the first six months of 2011 as compared to the first six months of 2010. The net dollar effect of the increase in prices of approximately $44.5 million (calculated as the change in year-to-year average prices times current year production volumes for oil and gas) and the net dollar effect of the change in production of approximately $140.9 million (calculated as the increase in year-to-year volumes for oil and gas times the prior year average prices) are shown below.
| |
Change in prices(1) |
Production volumes at June 30, 2011(2) |
Total net dollar effect of change (in thousands) |
|||||||||
|---|---|---|---|---|---|---|---|---|---|---|---|---|
Effect of changes in price: |
||||||||||||
Oil |
$ | 19.82 | 1,517 | $ | 30,067 | |||||||
Natural gas |
$ | 0.97 | 14,866 | $ | 14,420 | |||||||
Total revenues due to change in price |
$ | 44,487 | ||||||||||
| |
Change in production volumes(2) |
Prices at June 30, 2010(1) |
Total net dollar effect of change (in thousands) |
|||||||||
|---|---|---|---|---|---|---|---|---|---|---|---|---|
Effect of changes in volumes: |
||||||||||||
Oil |
925 | $ | 74.75 | $ | 69,144 | |||||||
Natural gas |
5,156 | $ | 5.29 | $ | 27,275 | |||||||
Total revenues due to change in volumes |
$ | 96,419 | ||||||||||
Rounding differences |
$ | 11 | ||||||||||
Total change in revenues |
$ | 140,917 | ||||||||||
(1) Prices shown are realized, unhedged $/Bbl for oil and are realized, unhedged $/Mcf for gas.
(2) Production volumes are presented in MBbls for oil and in MMcf for natural gas.
Natural gas transportation and treating. Our revenues related to natural gas transportation and treating increased by approximately $1.0 million during the six months ended June 30, 2011 as compared to the six months ended June 30, 2010. This increase was due to the sale of oil condensate from our pipeline assets during the first six months of 2011.
Lease operating expenses. Lease operating expenses increased to approximately $18.1 million for the six months ended June 30, 2011 from $9.7 million for the six months ended June 30, 2010, an increase of 87%. This increase was primarily due to an increase in well count for the first half of 2011 compared to the first half of 2010 due to our successful drilling program. On
56
a per-BOE basis, lease operating expenses increased in total to $4.53 per BOE at June 30, 2011 from $4.38 per BOE at June 30, 2010.
Production and ad valorem taxes. Production and ad valorem taxes increased to approximately $15.0 million for the six months ended June 30, 2011 from $6.6 million for the six months ended June 30, 2010, an increase of $8.4 million, or 127%, primarily due to significant increases in production as well as an increase in oil market prices (not including the effects of hedging) for the first six months of 2011 as compared to the same period in 2010.
Drilling and production. Drilling and production costs increased to approximately $0.7 million at June 30, 2011 from $0.1 million at June 30, 2010 as a result of an increase in our activities.
General and administrative. General and administrative expense increased to approximately $19.8 million at June 30, 2011 from $15.1 million at June 30, 2010, an increase of $4.7 million, or 31%. Increases in salaries, benefits and bonus expense (net of capitalized salary and benefits) accounted for approximately $0.9 million, or 19%, of the change in general and administrative expense as we continued to grow our employee base during 2011. The remainder of the increase largely consisted of an increase in professional fees related to the Broad Oak acquisition and the issuance of and other matters related to our senior unsecured notes. On a per-BOE basis, general and administrative expense decreased to $4.95 per BOE during the six months ended June 30, 2011 from $6.81 per BOE at June 30, 2010. This decrease was a result of the significant increase in production between periods.
Depreciation, depletion and amortization ("DD&A"). DD&A increased to approximately $75.9 million at June 30, 2011 from $36.6 million at June 30, 2010, an increase of $39.3 million, or 107%, due to increased production. Depletion related to oil and gas properties was approximately $73.7 million and $34.9 million for the six months ended June 30, 2011 and 2010, respectively. Depletion was $18.45 per BOE and $15.79 per BOE for the six months ended June 30, 2011 and 2010, respectively.
Depreciation for pipeline and gas gathering assets was approximately $1.2 million and $0.9 million for the six months ended June 30, 2011 and 2010, respectively. The increase in depreciation for pipeline and gas gathering assets was primarily due to the expansion of our gas gathering system.
Depreciation for other fixed assets was approximately $1.0 million and $0.8 million for the six months ended June 30, 2011 and 2010, respectively. The increase in depreciation for other fixed assets was primarily due to an increase in fixed asset additions.
Impairment expense. Impairment expense increased to approximately $0.2 million for the six months ended June 30, 2011 from zero for the six months ended June 30, 2010. This increase is due to a write-down of our materials and supplies inventory to reflect the balance at the lower of cost or market value calculated as of June 30, 2011. It was determined at June 30, 2010 that a lower of cost or market adjustment was not needed for materials and supplies.
We evaluate the impairment of our oil and natural gas properties on a quarterly basis according to the full cost method prescribed by the SEC. If the carrying amount exceeds the calculated full cost ceiling, we reduce the carrying amount of the oil and gas properties to the calculated full cost ceiling amount, which is determined to be their estimated fair value. It was
57
determined that the full cost ceiling exceeded the carrying value of our oil and gas properties for the six months ended June 30, 2011 and 2010.
Commodity derivative financial instruments. Due to the inherent volatility in oil and gas prices, we use commodity derivative instruments, including puts, swaps, collars and basis swaps to hedge price risk associated with a significant portion of our anticipated oil and gas production. At each period end, we estimate the fair value of our commodity derivatives and recognize an unrealized gain or loss. We have not elected hedge accounting on these derivatives and, therefore, the unrealized gains and losses on open positions are reflected in current earnings. For the six months ended June 30, 2011 and 2010, our hedges resulted in a realized loss of approximately $0.9 million and a realized gain of $9.2 million, respectively. For the six months ended June 30, 2011 and 2010, our hedges resulted in an unrealized loss of approximately $8.7 million and an unrealized gain of $13.9 million, respectively. During the fourth quarter of 2010, we entered into a number of new commodity derivatives of which seven had associated deferred premiums totaling approximately $13.4 million. The estimated fair value of our total deferred premiums was approximately $12.7 million at June 30, 2011. The fair market value of these premiums is deducted from our unrealized gains and losses and largely accounts for the overall unrealized loss on commodity derivatives at June 30, 2011.
Interest expense and realized and unrealized gains and losses on interest rate derivatives. Interest expense increased to approximately $22.3 million for the six months ended June 30, 2011 from $6.0 million for the six months ended June 30, 2010, due to a higher weighted average outstanding debt balance and a higher weighted average interest rate during the six months ended June 30, 2011. We incurred a weighted average interest rate of 8.71% on weighted average outstanding principal of $362.6 million on the senior secured credit facility and our senior unsecured notes for the six months ended June 30, 2011 as compared to a weighted average interest rate of 3.29% on weighted average outstanding principal of $202.5 million for the six months ended June 30, 2010. We also incurred a weighted average interest rate of 3.07% on weighted average outstanding principal of $122.9 million on the Broad Oak credit facility for the six months ended June 30, 2011 as compared to 4.69% on weighted average outstanding principal of $38.1 million for the six months ended June 30, 2010. The overall increase in our weighted average interest rate and debt balance was largely due to the addition of our senior unsecured notes issued in January 2011.
We have entered into certain variable-to-fixed interest rate derivatives that hedge our exposure to interest rate variations on our variable interest rate debt. At June 30, 2011, we had interest rate swaps and one interest rate cap outstanding for a notional amount of $260.0 million with fixed pay rates ranging from 1.11% to 3.41% and terms expiring from June 2012 to September 2013 compared to outstanding swaps for a notional amount of $200.0 million with fixed pay rates ranging from 1.35% to 3.41% and terms expiring from June 2011 to June 2012 at June 30, 2010. We realized a loss on interest rate derivatives of approximately $2.6 million for both the six months ended June 30, 2011 and 2010. Additionally, we recorded an unrealized gain on interest rate derivatives of approximately $1.5 million as of June 30, 2011 compared to an unrealized loss of approximately $1.3 million at June 30, 2010. At June 30, 2011, the estimated fair value of our interest rate derivatives was in a net liability position of approximately $4.1 million compared to approximately $5.5 million at December 31, 2010.
58
Income tax expense. As previously noted, we prepared separate tax returns for Laredo Petroleum, LLC, Laredo Petroleum, Inc. and Broad Oak for the period prior to July 1, 2011. We recorded a combined deferred income tax expense of approximately $25.7 million for the six months ended June 30, 2011, compared to a deferred income tax expense of approximately $5.8 million for the six months ended June 30, 2010.
For Laredo, at June 30, 2011 and 2010, we recorded a $0.4 million and $0.8 million valuation allowance, respectively, against our Texas deferred tax asset, as we believe it is more likely than not that we will not realize a future benefit for the full amount of our Texas deferred tax asset. The estimated annual effective tax rate was 36% for the six months ended June 30, 2011 and June 30, 2010. Our annual effective tax rate is based on our estimated annual permanent tax differences and estimated annual pre-tax book income. Our estimates involve assumptions we believe to be reasonable at the time of the estimation.
For Broad Oak, at June 30, 2011, we recorded a valuation of approximately $0.6 million against our deferred tax asset. At June 30, 2010, we increased the valuation allowance against Broad Oak's net federal deferred tax asset by approximately $8.7 million and decreased the valuation allowance against Broad Oak's Louisiana deferred tax by approximately $0.1 million. As of June 30, 2011 and 2010, we believed it is more likely than not that we will not realize a future benefit for the full amount of our Federal and Louisiana net deferred tax asset.
59
Results of operations
Year ended December 31, 2010 as compared to year ended December 31, 2009
The following table sets forth selected operating data for the year ended December 31, 2010 compared to the year ended December 31, 2009:
| |
Years ended December 31, |
|||||||||
|---|---|---|---|---|---|---|---|---|---|---|
| (in thousands except for production data and average sales prices) |
||||||||||
| 2010 |
2009 |
|||||||||
Operating results: |
||||||||||
Revenues |
||||||||||
Oil |
$ | 126,891 | $ | 29,946 | ||||||
Natural gas |
112,892 | 64,401 | ||||||||
Natural gas transportation and treating |
2,217 | 2,227 | ||||||||
Drilling and production |
4 | 318 | ||||||||
Total revenues |
242,004 | 96,892 | ||||||||
Costs and expenses |
||||||||||
Lease operating expenses |
21,684 | 12,531 | ||||||||
Production and ad valorem taxes |
15,699 | 6,129 | ||||||||
Natural gas transportation and treating |
2,501 | 1,416 | ||||||||
Drilling rig fees |
— | 1,606 | ||||||||
Drilling and production |
344 | 1,076 | ||||||||
General and administrative |
30,908 | 22,492 | ||||||||
Bad debt expense |
— | 91 | ||||||||
Accretion of asset retirement obligations |
475 | 406 | ||||||||
Depreciation, depletion and amortization |
97,411 | 58,005 | ||||||||
Impairment expense |
— | 246,669 | ||||||||
Total costs and expenses |
169,022 | 350,421 | ||||||||
Non-operating income (expense): |
||||||||||
Realized and unrealized gain (loss): |
||||||||||
Commodity derivative financial instruments, net |
11,190 | 5,744 | ||||||||
Interest rate derivatives, net |
(5,375 | ) | (3,394 | ) | ||||||
Interest expense |
(18,482 | ) | (7,464 | ) | ||||||
Interest income |
150 | 223 | ||||||||
Loss on disposal of assets |
(30 | ) | (85 | ) | ||||||
Other |
1 | 4 | ||||||||
Non-operating expense, net |
(12,546 | ) | (4,972 | ) | ||||||
Income tax benefit |
25,812 | 74,006 | ||||||||
Net income (loss) |
$ | 86,248 | $ | (184,495 | ) | |||||
Production data: |
||||||||||
Oil (MBbls) |
1,648 | 513 | ||||||||
Natural gas (MMcf) |
21,381 | 18,302 | ||||||||
Barrels of oil equivalent(1) (MBOE) |
5,212 | 3,563 | ||||||||
Average daily production (BOE/D) |
14,278 | 9,762 | ||||||||
Average sales prices: |
||||||||||
Oil, realized ($/Bbl) |
$ | 77.00 | $ | 58.37 | ||||||
Oil, hedged(2) ($/Bbl) |
$ | 77.26 | $ | 65.42 | ||||||
Natural gas, realized ($/Mcf) |
$ | 5.28 | $ | 3.52 | ||||||
Natural gas, hedged(2) ($/Mcf) |
$ | 6.32 | $ | 6.17 | ||||||
(1) MBbl equivalents ("MBOE") converted at a rate of six MMcf per one MBbl.
(2) Hedged prices reflect the after-effect of our commodity hedging transactions on our average sales prices. Our calculation of such after-effect includes realized gains or losses on cash settlements for commodity derivatives, which do not qualify for hedge accounting.
60
Oil and gas revenues. Our oil and gas revenues increased by approximately $145.4 million, or 154%, to approximately $239.8 million during the year ended December 31, 2010 as compared to the year ended December 31, 2009. Our revenues are a function of oil and gas production volumes sold and average sales prices received for those volumes. Average daily production increased by 4,516 BOE/D during the year ended December 31, 2010 as compared to the year ended December 31, 2009. The total increase in revenue of approximately $145.4 million is largely attributable to an increase in oil and gas production volumes as well as an increase in oil and gas prices realized for the year ended December 31, 2010 as compared to the year ended December 31, 2009. Production increased by 1,135 MBbls for oil and by 3,079 MMcf for gas during 2010 as compared to 2009. The net dollar effect of the increase in prices of approximately $68.3 million (calculated as the change in year-to-year average prices times current year production volumes for oil and gas) and the net dollar effect of the change in production of approximately $77.1 million (calculated as the change in year-to-year volumes for oil and gas times the prior year average prices) are shown below.
| |
Change in prices(1) |
Production volumes at December 31, 2010(2) |
Total net dollar effect of change (in thousands) |
|||||||||
|---|---|---|---|---|---|---|---|---|---|---|---|---|
Effect of changes in price: |
||||||||||||
Oil |
$ | 18.63 | 1,648 | $ | 30,702 | |||||||
Natural gas |
$ | 1.76 | 21,381 | $ | 37,631 | |||||||
Total revenues due to change in price |
$ | 68,333 | ||||||||||
| |
Change in production volumes(2) |
Prices at December 31, 2009(1) |
Total net dollar effect of change (in thousands) |
|||||||||
|---|---|---|---|---|---|---|---|---|---|---|---|---|
Effect of changes in volumes: |
||||||||||||
Oil |
1,135 | $ | 58.37 | $ | 66,250 | |||||||
Natural gas |
3,079 | $ | 3.52 | $ | 10,838 | |||||||
Total revenues due to change in volumes |
$ | 77,088 | ||||||||||
Rounding differences |
$ | 15 | ||||||||||
Total change in revenues |
$ | 145,436 | ||||||||||
(1) Prices shown are realized, unhedged $/Bbl for oil and are realized, unhedged $/Mcf for gas.
(2) Production volumes are presented in MBbls for oil and in MMcf for natural gas.
Natural gas transportation and treating. Our revenues related to natural gas transportation and treating did not change significantly during the year ended December 31, 2010 as compared to the year ended December 31, 2009.
Lease operating expenses. Lease operating expenses increased to approximately $21.7 million for the year ended December 31, 2010 from $12.5 million for the year ended December 31, 2009, an increase of 74%, primarily due to the increase in the number of owned properties during 2010 as compared to 2009. On a per-BOE basis, lease operating expenses increased in total to $4.16 per BOE at December 31, 2010 from $3.52 per BOE at December 31, 2009. This increase was largely a result of lower production for the first nine months of 2010 as we scaled
61
back our drilling program in response to lower oil and gas prices, while continuing to incur lease operating expenses on properties with normal declining production.
Production and ad valorem taxes. Production and ad valorem taxes increased to approximately $15.7 million for the year ended December 31, 2010 from $6.1 million for the year ended December 31, 2009, an increase of $9.6 million, or 157%, primarily due to the increase in market prices (not including the effects of hedging) for 2010 as compared to 2009. The average realized prices excluding derivatives for the year ended December 31, 2010 were $77.00 per Bbl for oil and $5.28 per Mcf for natural gas as compared to $58.37 per Bbl for oil and $3.52 per Mcf for natural gas for the year ended December 31, 2009.
Drilling rig fees. We have committed to several short-term drilling contracts with various third parties to complete our drilling projects. The contracts contain an early termination clause that requires us to pay significant penalties to the third parties if we cease drilling efforts. For the year ended December 31, 2009, we incurred approximately $1.6 million in stacked rig fees. In 2010, we did not incur any stacked rig fees related to our drilling rig contracts.
Drilling and production. Drilling and production costs decreased to approximately $0.3 million at December 31, 2010 from $1.1 million at December 31, 2009 as a result of improved cost control measures related to our activities.
General and administrative. General and administrative expense increased to approximately $30.9 million at December 31, 2010 from $22.5 million at December 31, 2009, an increase of $8.4 million, or 37%. Increases in salaries, benefits and bonus expense (net of capitalized salary and benefits) accounted for approximately $5.4 million, or 64%, of the change in general and administrative expense as we continued to grow our employee base during 2010. The remainder of the increase largely consisted of additional expenditures for technology, travel costs and professional fees. On a per-BOE basis, general and administrative expense decreased to $5.93 per BOE during the year ended December 31, 2010 from $6.31 per BOE at December 31, 2009. This decrease was a result of a larger overall increase in production volumes between the two periods.
Depreciation, depletion and amortization ("DD&A"). DD&A increased to approximately $97.4 million at December 31, 2010 from $58.0 million at December 31, 2009, an increase of $39.4 million, or 68%, due largely to the increase in production noted above. Depletion related to oil and gas properties was approximately $93.8 million and $55.4 million for the years ended December 31, 2010 and 2009, respectively. Depletion was $18.36 per BOE and $16.56 per BOE for the years ended December 31, 2010 and 2009, respectively.
Depreciation for pipeline and gas gathering assets was approximately $2.0 million and $1.5 million for the years ended December 31, 2010 and 2009, respectively. The increase in depreciation for pipeline and gas gathering assets was primarily due to the expansion of our gas gathering system.
Depreciation for other fixed assets was approximately $1.6 million and $1.1 million for the years ended December 31, 2010 and 2009, respectively. The increase in depreciation for other fixed assets was primarily due to an increase in fixed asset additions as we grew the company.
Impairment expense. We evaluate the impairment of our oil and gas properties on a quarterly basis according to the full cost method prescribed by the SEC. If the carrying amount exceeds
62
the calculated full cost ceiling, we reduce the carrying amount of the oil and gas properties to the calculated full cost ceiling amount, which is determined to be their estimated fair value.
Impairment expense at December 31, 2009 reflects the impairment of our oil and gas properties of approximately $245.9 million due to declining market prices for oil and gas, and the write-down to lower of cost of market of materials and supplies of approximately $0.8 million, consisting of pipe and well equipment, due to declining market prices. For oil and natural gas assets, the full cost ceiling calculation was computed using the unweighted arithmetic average first-day-of-the-month prices for the 12-months ended December 31, 2009 of $57.04 per Bbl for oil and $3.15 per MMBtu for natural gas, adjusted for energy content, transportation fees and regional price differentials. It was determined that oil and natural gas properties were not impaired for the year ended December 31, 2010 as their carrying amount did not exceed the calculated full cost ceiling. Additionally, a write-down of our materials and supplies was not necessary at December 31, 2010 based on our lower of cost or market analysis.
Commodity derivative financial instruments. Due to the inherent volatility in oil and gas prices, we use commodity derivative instruments including puts, swaps, collars, and basis swaps to hedge future price risk associated with a significant portion of our anticipated oil and gas production. At each period end, we estimate the fair value of our commodity derivatives and recognize an unrealized gain or loss. We have not elected hedge accounting on these derivatives and, therefore, the unrealized gains and losses on open positions are reflected in current earnings. For the years ended December 31, 2010 and 2009, our hedges resulted in realized gains of approximately $22.7 million and $52.1 million, respectively. For the years ended December 31, 2010 and 2009, our hedges resulted in unrealized losses of approximately $11.5 million and $46.4 million, respectively. During 2009, some of our hedge contracts matured and commodity prices began to recover, creating an unrealized loss at December 31, 2009. During 2010, we entered into a number of new commodity derivatives of which seven had associated deferred premiums totaling approximately $13.4 million. The estimated fair value of our total deferred premiums was approximately $12.5 million at December 31, 2010. The fair market value of these premiums is deducted from our unrealized gains and losses and largely accounts for the overall unrealized loss on commodity derivatives at December 31, 2010.
Interest expense and realized and unrealized gains and losses on interest rate derivatives. Interest expense increased to approximately $18.5 million for the year ended December 31, 2010 from $7.5 million for the year ended December 31, 2009, due to a higher weighted average interest rate and a higher weighted average outstanding debt balance during the year ended December 31, 2010. We incurred a weighted average interest rate of 4.40% on weighted average outstanding principal of $225.2 million on our senior secured credit facility and term loan for the year ended December 31, 2010 as compared to a weighted average interest rate of 3.67% on weighted average outstanding principal of $154.0 million for year ended December 31, 2009. We also incurred a weighted average interest rate of 4.27% on weighted average outstanding principal of $123.8 million on the Broad Oak credit facility for the year ended December 31, 2010 as compared to 4.65% on weighted average outstanding principal of $27.7 million for the year ended December 31, 2009. The overall increase in our interest expense was largely due to the addition of our term loan facility at an interest rate of 9.25% on principal of $100.0 million in July 2010 as well as additional borrowings on our senior secured credit facility and the Broad Oak credit facility.
63
During 2010 and 2009, we entered into certain variable-to-fixed interest rate derivatives that hedge our exposure to interest rate variations on our variable interest rate debt. At December 31, 2010, we had interest rate swaps and caps outstanding for a notional amount of $300.0 million with fixed pay rates ranging from 1.11% to 3.41% and terms expiring from June 2011 to September 2013 compared to outstanding swaps for a notional amount of $180.0 million with fixed pay rates ranging from 1.60% to 3.41% and terms expiring from June 2011 to June 2012 at December 31, 2009. During the year ended December 31, 2010, we realized a loss on interest rate derivatives of approximately $5.2 million compared to a realized loss of $3.8 million for the year ended December 31, 2009. Additionally, we recorded an unrealized loss on interest rate derivatives of approximately $0.1 million as of December 31, 2010 compared to an unrealized gain of $0.4 million at December 31, 2009. At December 31, 2010, the estimated fair value of our interest rate derivatives was in a net liability position of approximately $5.5 million compared to $5.6 million at December 31, 2009.
Income tax expense. We recorded a combined deferred income tax benefit of approximately $25.8 million for the year ended December 31, 2010, compared to a combined deferred income tax benefit of approximately $74.0 million for the year ended December 31, 2009. At December 31, 2009, we recognized a combined deferred income tax benefit for the impairment of our oil and gas properties of approximately $86.1 million.
Additionally, for Laredo, we recorded a valuation allowance of approximately $0.7 million against our Texas deferred tax asset at December 31, 2010, as we believe it is more likely than not that we will not realize a future benefit for the full amount of our Texas deferred tax asset. The estimated annual effective tax rate was 37% for the year ended December 31, 2010 and 35% for the year ended December 31, 2009. Our annual effective tax rate is based on our estimated annual permanent tax differences and estimated annual pre-tax book income. Our estimates involve assumptions we believe to be reasonable at the time of the estimation.
During the fourth quarter of 2010, we determined that it was more likely than not that the remaining federal net operating loss carry-forwards and net federal deferred assets would be realized. Consideration given included estimated future net cash flows from oil and gas reserves (including the timing of those cash flows) and the future tax effect of the deferred tax assets and liabilities recorded at December 31, 2010. As a result of this determination, the valuation allowance was released against the deferred tax assets, resulting in a decrease of the valuation allowance by approximately $47.9 million.
For the year ended December 31, 2009, we increased the valuation allowance against Broad Oak's net federal deferred tax asset by approximately $16.5 million and decreased the valuation allowance against Broad Oak's Louisiana deferred tax by approximately $0.1 million. We believed it was more likely than not that we would not realize a future benefit for the full amount of our federal and Louisiana net deferred tax asset as of December 31, 2009.
64
Year ended December 31, 2009 as compared to year ended December 31, 2008
The following table sets forth selected operating data for the year ended December 31, 2009 compared to the year ended December 31, 2008:
| |
Years Ended December 31, |
|||||||||
|---|---|---|---|---|---|---|---|---|---|---|
| (in thousands except for production data and average sales prices) |
||||||||||
| 2009 |
2008 |
|||||||||
Operating results: |
||||||||||
Revenues |
||||||||||
Oil |
$ | 29,946 | $ | 16,544 | ||||||
Natural gas |
64,401 | 57,339 | ||||||||
Natural gas transportation and treating |
2,227 | 304 | ||||||||
Drilling and production |
318 | 548 | ||||||||
Total revenues |
96,892 | 74,735 | ||||||||
Costs and expenses |
||||||||||
Lease operating expenses |
12,531 | 6,436 | ||||||||
Production and ad valorem taxes |
6,129 | 5,481 | ||||||||
Natural gas transportation and treating |
1,416 | 154 | ||||||||
Drilling rig fees |
1,606 | — | ||||||||
Drilling and production |
1,076 | 23 | ||||||||
General and administrative |
22,492 | 23,248 | ||||||||
Bad debt expense |
91 | — | ||||||||
Accretion of asset retirement obligations |
406 | 170 | ||||||||
Depreciation, depletion and amortization |
58,005 | 33,102 | ||||||||
Impairment expense |
246,669 | 282,587 | ||||||||
Total costs and expenses |
350,421 | 351,201 | ||||||||
Non-operating income (expense): |
||||||||||
Realized and unrealized gain (loss): |
||||||||||
Commodity derivative financial instruments, net |
5,744 | 40,569 | ||||||||
Interest rate derivatives, net |
(3,394 | ) | (6,274 | ) | ||||||
Interest expense |
(7,464 | ) | (4,410 | ) | ||||||
Interest income |
223 | 781 | ||||||||
Loss on disposal of assets |
(85 | ) | (2 | ) | ||||||
Other |
4 | 38 | ||||||||
Non-operating income (expense), net |
(4,972 | ) | 30,702 | |||||||
Income tax benefit |
74,006 | 53,717 | ||||||||
Net loss |
$ | (184,495 | ) | $ | (192,047 | ) | ||||
Production data: |
||||||||||
Oil (MBbls) |
513 | 192 | ||||||||
Natural gas (MMcf) |
18,302 | 8,124 | ||||||||
Barrels of oil equivalents(1) (MBOE) |
3,563 | 1,546 | ||||||||
Average daily production (BOE/D) |
9,762 | 4,226 | ||||||||
Average sales prices: |
||||||||||
Oil, realized ($/Bbl) |
$ | 58.37 | $ | 86.17 | ||||||
Oil, hedged(2) ($/Bbl) |
$ | 65.42 | $ | 91.93 | ||||||
Natural gas, realized ($/Mcf) |
$ | 3.52 | $ | 7.06 | ||||||
Natural gas, hedged(2) ($/Mcf) |
$ | 6.17 | $ | 7.83 | ||||||
(1) MBbl equivalents ("MBOE") converted at a rate of six MMcf per one MBbl.
(2) Hedged prices reflect the after-effect of our commodity hedging transactions on our average sales prices. Our calculation of such after-effect includes realized gains or losses on cash settlements for commodity derivatives, which do not qualify for hedge accounting.
65
Oil and gas revenues. Our oil and gas sales revenues increased by approximately $20.5 million, or 28%, to approximately $94.3 million during the year ended December 31, 2009 as compared to the year ended December 31, 2008. Our revenues are a function of oil and gas production volumes sold and average sales prices received for those volumes. Average daily production sold increased by 5,536 BOE/D during the year ended December 31, 2009 as compared to the year ended December 31, 2008. The net increase in revenues resulted from the net dollar effect of commodity price decreases of approximately $79.1 million (calculated as the decrease in year-to-year average prices times current year production volumes for oil and gas) offset by increased production of approximately $99.5 million (calculated as the increase in year-to-year volumes for oil and gas times the prior year average prices) as shown in the calculation below. The increase in production was largely attributed to a full year of production in 2009 on the properties acquired in August 2008 as well as successful drilling efforts.
| |
Change in prices(1) |
Production volumes at December 31, 2009(2) |
Total net dollar effect of change (in thousands) |
|||||||||
|---|---|---|---|---|---|---|---|---|---|---|---|---|
Effect of changes in price: |
||||||||||||
Oil |
$ | (27.80 | ) | 513 | $ | (14,261 | ) | |||||
Natural gas |
$ | (3.54 | ) | 18,302 | $ | (64,789 | ) | |||||
Total revenues due to change in price |
$ | (79,050 | ) | |||||||||
| |
Change in production volumes(2) |
Prices at December 31, 2008(1) |
Total net dollar effect of change (in thousands) |
|||||||||
|---|---|---|---|---|---|---|---|---|---|---|---|---|
Effect of changes in volumes: |
||||||||||||
Oil |
321 | $ | 86.17 | $ | 27,661 | |||||||
Natural gas |
10,178 | $ | 7.06 | $ | 71,857 | |||||||
Total revenues due to change in volumes |
$ | 99,518 | ||||||||||
Rounding differences |
$ | (4 | ) | |||||||||
Total change in revenues |
$ | 20,464 | ||||||||||
(1) Prices shown are realized, unhedged $/Bbl for oil and are realized, unhedged $/Mcf for gas.
(2) Production volumes are presented in Bbls for oil and in MMcf for natural gas.
Natural gas transportation and treating. Our revenues related to natural gas transportation and treating increased by approximately $1.9 million, or 633%, during the year ended December 31, 2009 as compared to the year ended December 31, 2008. This increase was due to higher natural gas volumes being transported on behalf of third parties on our gas gathering system, which also caused natural gas transportation and treating expenses to increase.
Lease operating expenses. Lease operating expenses increased to approximately $12.5 million for the year ended December 31, 2009 from $6.4 million for the year ended December 31, 2008, an increase of 95%, primarily as a result of a full year of operations in 2009 for the properties acquired in 2008, as well as increased drilling and production. On a per-BOE basis, lease operating expenses decreased in total to $3.52 per BOE at December 31, 2009 from $4.16 per BOE at December 31, 2008 due to improved cost control measures and an improved mix of properties with lower operating costs.
66
Production and ad valorem taxes. Production and ad valorem taxes increased to approximately $6.1 million for the year ended December 31, 2009 from $5.5 million for the year ended December 31, 2008, an increase of $0.6 million, or 11%, primarily due to the increase in revenues noted above.
Drilling rig fees. We have committed to several long-term drilling contracts with various third parties to complete our drilling projects. The contracts contain an early termination clause that requires us to pay significant penalties to the third parties if we cease drilling efforts. For the year ended December 31, 2009, we incurred approximately $1.6 million in stacked rig fees. We did not incur any stacked rig fees for the year ended December 31, 2008.
Drilling and production. Drilling and production costs increased to approximately $1.1 million at December 31, 2009 from $0.02 million at December 31, 2008 as a result of increased costs incurred related to frac pits in 2009 as compared to 2008.
General and administrative. General and administrative expense decreased to approximately $22.5 million for the year ended December 31, 2009 from $23.2 million for the year ended December 31, 2008, a decrease of $0.7 million, or 3%. The decrease is primarily due to a reduction in the bonus accrual for 2009 as compared to 2008 because of the economic downturn which lead to lower oil and gas prices. On a per-BOE basis, general and administrative expense decreased to $6.31 per BOE for the year ended December 31, 2009 from $15.04 per BOE for 2008.
Depreciation, depletion and amortization ("DD&A"). DD&A increased to approximately $58.0 million at December 31, 2009 from $33.1 million at December 31, 2008, an increase of $24.9 million, or 75%. Depletion related to oil and gas properties was approximately $55.4 million and $31.9 million at December 31, 2009 and 2008, respectively, and increased primarily as a result of a 130% increase in production during 2009 as compared to 2008. Production increased largely as a result of a full year of operations for the properties acquired in August 2008, as well as successful drilling efforts during 2009. The depletion rate for oil and gas properties was $16.56 per BOE for the year ended December 31, 2009 as compared to $20.69 per BOE for the year ended December 31, 2008.
Depreciation for pipeline and gas gathering assets was approximately $1.5 million and $0.5 million for the years ended December 31, 2009 and 2008, respectively. The increase was primarily due to the expansion of our gas gathering system.
Depreciation for other fixed assets was approximately $1.1 million and $0.7 million for the years ended December 31, 2009 and 2008, respectively. The increase was primarily due to an increase in fixed asset additions as we grew the company.
Impairment expense. Impairment expense decreased to approximately $246.7 million for the year ended December 31, 2009 from $282.6 million for the year ended December 31, 2008, a decrease of $35.9 million, or 13%, primarily due to the decrease in prices for oil and gas. Our impairment expense of approximately $246.7 million at December 31, 2009 reflects the impairment of our oil and gas assets of $245.9 million and the write-down of $0.8 million of our materials and supplies inventory, consisting of pipe and well equipment, to the lower-of-cost-or-market. For oil and gas assets, the full cost ceiling calculation was computed using the unweighted arithmetic average first-day-of-the-month prices of the 12-months ended December 31, 2009 of $57.04 per barrel for oil and $3.15 per MMBtu for natural gas, adjusted for energy content, transportation fees and regional price differentials. Impairment expense for
67
2008 related entirely to the write-down of our oil and gas properties to the full cost ceiling value and was calculated using the December 31, 2008 index price of $44.60 per barrel for oil and $4.68 per MMBtu for natural gas, adjusted for energy content, transportation fees and regional price differentials.
Commodity derivative financial instruments. For the years ended December 31, 2009 and 2008, our hedges resulted in realized gains of approximately $52.1 million and $7.4 million, respectively. For the years ended December 31, 2009 and 2008, our hedges resulted in unrealized losses of approximately $46.4 million and unrealized gains of $33.2 million, respectively. Unrealized gains in 2008 occurred as commodity prices began to fall below our fixed price derivatives as a result of the weakening U.S. and global economies. During 2009, we realized part of these gains as our 2009 hedge contracts matured and prices began to recover, therefore, partially reversing the unrealized gains recorded in 2008.
Interest expense and realized and unrealized gains and losses on interest rate derivatives. Interest expense increased to approximately $7.5 million for the year ended December 31, 2009 from $4.4 million for the year ended December 31, 2008, primarily due to a higher weighted average outstanding debt balance during the year ended December 31, 2009. We incurred a weighted average interest rate on our senior secured credit facility of 3.67% on weighted average outstanding principal of $154.0 million for the year ended December 31, 2009 as compared to a weighted average interest rate of 5.40% on weighted average outstanding principal of $75.9 million for the year ended December 31, 2008. We also incurred a weighted average interest rate on the Broad Oak credit facility of 4.65% on weighted average outstanding principal of $27.7 million for the year ended December 31, 2009 as compared to a weighted average interest rate of 4.43% on weighted average outstanding principal of $6.3 million.
During 2008, we entered into various variable-to-fixed interest rate derivatives to hedge our exposure to interest rate variations on our variable interest rate debt. At December 31, 2009, we had interest rate swaps outstanding for a notional amount of $180.0 million with fixed pay rates ranging from 1.60% to 3.41% and terms expiring from June 2011 to June 2012 as compared to swaps outstanding for a notional amount of $125.0 million with fixed pay rates ranging from 3.02% to 3.63% and terms expiring from March 2011 to August 2011 at December 31, 2008. For the year ended December 31, 2009, we realized a loss on interest rate swaps of approximately $3.8 million compared to a realized loss of $0.3 million for the year ended December 31, 2008. Additionally, we recorded an unrealized gain on interest rate swaps of approximately $0.4 million as of December 31, 2009 compared to an unrealized loss of $6.0 million at December 31, 2008. At December 31, 2009, the estimated fair value of our interest rate swap agreements was a liability of approximately $5.6 million compared to $6.0 million at December 31, 2008.
Income tax benefit. We recorded a combined deferred income tax benefit of approximately $74.0 million for the year ended December 31, 2009 as compared to a combined deferred income tax benefit of approximately $53.7 million for the year ended December 31, 2008 due largely to the full cost ceiling impairments taken on our oil and gas properties during 2009 and 2008.
For Laredo, the estimated annual effective tax rate was 35% for the year ended December 31, 2009 and 34% for the year ended December 31, 2008. Laredo's annual effective tax rate is based on our estimated annual permanent tax differences and estimated annual pre-tax book
68
income. Our estimates involved assumptions we believed to be reasonable at the time of the estimation. Additionally, at December 31, 2009 we recorded a valuation allowance of approximately $0.4 million against our Texas deferred tax asset, as we believed it was more likely than not that we would not realize a future benefit for the full amount of our Texas deferred tax asset.
For Broad Oak, we increased the valuation allowance against Broad Oak's net federal deferred tax asset by approximately $16.5 million and decreased the valuation allowance against Broad Oak's Louisiana deferred tax by approximately $0.1 million for the year ended December 31, 2009. We believed it was more likely than not that we would not realize a future benefit for the full amount of our federal and Louisiana net deferred tax asset as of December 31, 2009.
Liquidity and capital resources
Our primary sources of liquidity have been capital contributions from Warburg Pincus, certain members of our management and board of directors, borrowings under our senior secured credit facility, our senior unsecured notes, borrowings under the prior Broad Oak credit facility, borrowings under our prior term loan facility and cash flows from operations. Our primary use of capital has been for the exploration, development and acquisition of oil and gas properties. As we pursue reserves and production growth, we continually consider which capital resources, including equity and debt financings, are available to meet our future financial obligations, planned capital expenditure activities and liquidity requirements. Our future ability to grow proved reserves and production will be highly dependent on the capital resources available to us. We are monitoring market conditions and are considering taking on additional debt, which may be in the form of bank debt, debt securities or other sources of financing. We cannot assure you that we will take on any such debt or what the terms of such debt would be.
At June 30, 2011, a total of $710 million of equity has been invested in Laredo by Warburg Pincus, certain members of management and our independent directors.
At June 30, 2011, we had approximately $340.4 million in combined debt outstanding and approximately $0.03 million of outstanding letters of credit under our senior secured credit facility and the Broad Oak credit facility and $350.0 million in senior unsecured notes. As of October 1, 2011 we had $525 million in debt outstanding under our senior secured credit facility.
On January 20, 2011, we completed the offering of our $350.0 million senior unsecured notes. We used the net proceeds from such offering (i) to repay and retire the $100.0 million outstanding under the term loan facility as of January 20, 2011, (ii) to pay in full approximately $177.5 million outstanding under our senior secured credit facility as of January 20, 2011 and (iii) for general working capital purposes.
We expect that, in the future, our commodity derivative positions will help us stabilize a portion of our expected cash flows from operations despite potential declines in the price of oil and gas. Please see "—Quantitative and qualitative disclosures about market risk" below.
On a pro forma basis, after giving effect to this offering (assuming the midpoint of the price range set forth on the cover page of this prospectus) and the application of a portion of the net proceeds to pay down amounts outstanding under our $1 billion senior secured credit facility, we expect to have approximately $ available for borrowings under our senior secured credit facility. We believe such availability as well as cash flow from operations and cash on hand provide us with the ability to implement our planned exploration and development activities.
69
Cash flows
Our cash flows for the six months ended June 30, 2011 and 2010 and for the years ended December 31, 2010, 2009 and 2008 are as follows:
| |
Six months ended June 30, |
Years ended December 31, | |||||||||||||||
|---|---|---|---|---|---|---|---|---|---|---|---|---|---|---|---|---|---|
| (in thousands) |
2011 |
2010 |
2010 |
2009 |
2008 |
||||||||||||
| |
(unaudited) |
|
|
|
|||||||||||||
Net cash provided by operating activities |
$ | 162,058 | $ | 57,652 | $ | 157,043 | $ | 112,669 | $ | 25,332 | |||||||
Net cash used in investing activities |
(359,449 | ) | (181,265 | ) | (460,547 | ) | (361,333 | ) | (490,897 | ) | |||||||
Net cash provided by financing activities |
188,208 | 133,507 | 319,752 | 250,139 | 472,140 | ||||||||||||
Net increase (decrease) in cash |
$ | (9,183 | ) | $ | 9,894 | $ | 16,248 | $ | 1,475 | $ | 6,575 | ||||||
Cash flows provided by operating activities
Net cash provided by operating activities was approximately $162.1 million and $57.7 million for the six months ended June 30, 2011 and 2010, respectively. The increase of $104.4 million was largely due to an increase in revenue due to our successful drilling program in the fourth quarter of 2010 and the first six months of 2011, as well as increases in depletion and income tax expense.
Net cash provided by operating activities was approximately $157.0 million, $112.7 million and $25.3 million for the years ended December 31, 2010, 2009 and 2008, respectively. The increase in cash flows from 2008 to 2009 and from 2009 to 2010 was largely due to increased sales and production from our successful drilling program and acquisitions of properties as well as higher prices for oil and natural gas.
Our operating cash flows are sensitive to a number of variables. The most significant of which are production levels and the volatility of oil and gas prices. Regional and worldwide economic activity, weather, infrastructure, capacity to reach markets, costs of operations and other variable factors significantly impact the prices of these commodities. These factors are not within our control and are difficult to predict. For additional information on the impact of changing prices on our financial position, see "—Quantitative and qualitative disclosures about market risk" below.
Cash flows used in investing activities
We had cash flows used in investing activities of approximately $359.4 million and $181.3 million for the six months ended June 30, 2011 and 2010, respectively. The increase of $178.2 million is due to increasing our drilling efforts in our Permian Basin and Anadarko Granite Wash areas in order to take advantage of strategic vertical and horizontal drilling and improving commodity prices.
We had cash flows used in investing activities of approximately $460.5 million, $361.3 million and $490.9 million for the years ended December 31, 2010, 2009 and 2008, respectively. Cash flows used in investing activities declined in total from 2008 to 2009 as no acquisitions were
70
completed during 2009, however, drilling activity, land and seismic activity and pipeline activity all increased.
Our cash used in investing activities for acquisitions and capital expenditures for the six months ended June 30, 2011 and 2010 and the years ended December 31, 2010, 2009 and 2008 is summarized in the table below.
| |
Six months ended June 30, |
Years ended December 31, | ||||||||||||||||
|---|---|---|---|---|---|---|---|---|---|---|---|---|---|---|---|---|---|---|
| (in thousands) |
2011 |
2010 |
2010 |
2009 |
2008 |
|||||||||||||
| |
(unaudited) |
|
|
|
||||||||||||||
Acquisition of oil and gas properties |
$ | — | $ | — | $ | — | $ | — | $ | (179,141 | ) | |||||||
Restricted cash |
— | — | — | 2,201 | (2,201 | ) | ||||||||||||
Capital expenditures: |
||||||||||||||||||
Oil and gas properties |
(348,523 | ) | (179,077 | ) | (454,161 | ) | (340,636 | ) | (288,555 | ) | ||||||||
Pipeline and gathering assets |
(6,344 | ) | (1,456 | ) | (4,277 | ) | (19,995 | ) | (17,548 | ) | ||||||||
Other fixed assets |
(4,602 | ) | (786 | ) | (2,198 | ) | (3,071 | ) | (3,474 | ) | ||||||||
Proceeds from other asset disposals |
20 | 54 | 89 | 168 | 22 | |||||||||||||
Net cash used in investing activities |
$ | (359,449 | ) | $ | (181,265 | ) | $ | (460,547 | ) | $ | (361,333 | ) | $ | (490,897 | ) | |||
Capital expenditure budget
Concurrent with the Broad Oak acquisition, our board of directors has approved a revised capital expenditure budget of approximately $360 million for the second half of 2011 and a preliminary budget of $738 million for calendar year 2012, excluding additional acquisitions. We do not have a specific acquisition budget since the timing and size of acquisitions cannot be accurately forecasted.
The amount, timing and allocation of capital expenditures are largely discretionary and within management's control. If oil and gas prices decline to levels below our acceptable levels, or costs increase to levels above our acceptable levels, we may choose to defer a portion of our budgeted capital expenditures until later periods in order to achieve the desired balance between sources and uses of liquidity and prioritize capital projects that we believe have the highest expected returns and potential to generate near-term cash flow. We may also increase our capital expenditures significantly to take advantage of opportunities we consider to be attractive. We consistently monitor and adjust our projected capital expenditures in response to success or lack of success in drilling activities, changes in prices, availability of financing, drilling and acquisition costs, industry conditions, the timing of regulatory approvals, the availability of rigs, contractual obligations, internally generated cash flow and other factors both within and outside our control.
Cash flows provided by financing activities
We had cash flows provided by financing activities of approximately $188.2 million and $133.5 million for the six months ended June 30, 2011 and 2010, respectively. Net cash provided by financing activities in the first six months of 2011 was largely due to the issuance of our senior unsecured notes on January 20, 2011 as well as net borrowings on our senior secured credit facility totaling $75.0 million and borrowings on the Broad Oak credit facility
71
totaling approximately $51.3 million, offset by total payments of approximately $231.3 million on our senior secured credit facility and the Broad Oak credit facility and payments of $100.0 million on our term loan facility. For the six months ended June 30, 2010, net cash from financing activities was the result of capital contributions of $61.6 million and borrowings of $79.5 million on the Broad Oak credit facility.
We had cash flows provided by financing activities of approximately $319.8 million, $250.1 million and $472.1 million for the years ended December 31, 2010, 2009 and 2008, respectively. Net cash provided by financing activities in 2010 was primarily the result of capital contributions from Warburg Pincus, certain members of our management and our independent directors of approximately $85.0 million, borrowings on our senior secured credit facility of $75.0 million and borrowings on our prior term loan facility of $100.0 million, which were subsequently used to pay down the outstanding balance on our senior secured credit facility. Additionally, we incurred net borrowings on the Broad Oak credit facility of approximately $169.5 million as of December 31, 2010.
In 2009, net cash from financing activities was primarily the result of capital contributions from Warburg Pincus, certain members of our management and our independent directors of approximately $154.6 million, borrowings on our senior secured credit facility of $75.0 million and net borrowings of approximately $23.5 million on the Broad Oak credit facility.
In 2008, net cash from financing activities was primarily the result of capital contributions from Warburg Pincus, certain members of our management and our independent directors of approximately $368.8 million, borrowings on our senior secured credit facility of $83.0 million and net borrowings on the Broad Oak credit facility of approximately $21.1 million.
Credit facilities
At June 30, 2011, our credit facilities were comprised of our senior secured credit facility and, prior to its termination on July 1, 2011, the Broad Oak credit facility. Our term loan facility was paid in full and retired in conjunction with the closing of the January 2011 offering of our senior unsecured notes.
Laredo senior secured credit facility. Laredo Petroleum, Inc. is the borrower under our $500.0 million senior secured credit facility, which was amended and restated as of July 29, 2008, amended in December 2008, May 2009 and November 2009, and amended and restated as of July 7, 2010. Effective contemporaneously with the issuance of our senior unsecured notes on January 20, 2011, our senior secured credit facility was amended to (i) permit the offering and the repayment of amounts outstanding under the term loan facility, (ii) extend the maturity of our senior secured credit facility by one year to July 7, 2015, (iii) reduce the applicable margins for Eurodollar Tranches to between 2.00% and 2.75% and for Adjusted Base Rate Tranches to between 1.00% and 1.75% based on the ratio of outstanding revolving credit to the conforming borrowing base and (iv) eliminate the leverage tests. We used the net proceeds from our January 2011 offering of our senior unsecured notes, among other things, to pay down all loan amounts outstanding under the senior secured credit facility, which were approximately $177.5 million at December 31, 2010. Refer to Note O of our audited combined financial statements included elsewhere in this prospectus for further discussion of the January 2011 offering of our senior unsecured notes and use of proceeds. On June 3, 2011, the borrowing base under our senior secured credit facility was redetermined at $270.0 million. Future borrowing bases will be set by the banks in our senior secured credit facility, giving
72
consideration to such criteria as proved oil and gas reserves, estimated future cash flow from these reserves and hedge positions, and any other outstanding indebtedness. The borrowing base is redetermined semiannually; the next redetermination is scheduled to occur in November 2011. Following the next scheduled borrowing base redetermination, we may be subject to similar restrictions on our ability to incur indebtedness or our borrowing base may be reduced.
On July 1, 2011, in conjunction with the Broad Oak acquisition, we entered into our $1.0 billion Third Amended and Restated Credit Agreement that provided for (i) the replacement of Bank of America, N.A. as the administrative agent by Wells Fargo Bank, N.A., (ii) the rearranging of debt under this senior unsecured credit facility to repay amounts outstanding under and terminate the Broad Oak credit facility under the senior secured credit facility, (iii) an extension of the maturity date of the senior secured credit facility by one year to July 1, 2016, (iv) an increase in the facility capacity to $1.0 billion and an increase in the borrowing base of the senior secured credit facility to $650.0 million and (v) a reduction in the applicable margins for Eurodollar Tranches to between 1.75% and 2.75% and for Adjusted Base Rate Tranches to between 0.75% and 1.75% based on the ratio of outstanding revolving credit to the conforming borrowing base. Refer to Note O of our audited combined financial statements included elsewhere in this prospectus for further discussion of the Broad Oak acquisition and the Third Amended and Restated Credit Agreement.
Principal amounts borrowed under the senior secured credit facility are payable on the final maturity date with such borrowings bearing interest that is payable, at our election, either on the last day of each fiscal quarter at an Adjusted Base Rate or at the end of one-, two-, three-, six- or, to the extent available, twelve-month interest periods (and in the case of six- and twelve-month interest periods, every three months prior to the end of such interest period) at an Adjusted London Interbank Offered Rate ("LIBOR"), in each case, plus an applicable margin based on the ratio of outstanding senior secured credit to the borrowing base. At June 30, 2011, the applicable margin rates were 1.75% for the adjusted base rate advances and 2.75% for the Eurodollar advances. The amount of the senior secured credit facility outstanding at June 30, 2011 was subject to an average interest rate of approximately 2.14%. We are also required to pay an annual commitment fee on the unused portion of the bank's commitment of 0.5%.
As of June 30, 2011 and 2010, borrowings outstanding under our senior secured credit facility totaled $75.0 million and $202.5 million, respectively.
As of December 31, 2010, 2009 and 2008, borrowings outstanding under our senior secured credit facility totaled $177.5 million, $202.5 million and $127.5 million, respectively. As of October 1, 2011, our outstanding balance under the senior secured credit facility was $525 million.
Our senior secured credit facility is secured by a first priority lien on our assets and stock, including oil and natural gas properties constituting at least 80% of the present value of our proved reserves owned now or in the future. At June 30, 2011, we were subject to the following financial and non-financial ratios on a consolidated basis:
- •
- a current ratio at the end of each fiscal quarter, as defined by the agreement, that is not permitted to be less than 1.00 to 1.00; and
73
- •
- at the end of each fiscal quarter, the ratio of earnings before interest, taxes, depreciation, depletion, amortization and exploration expenses and other non-cash charges ("EBITDAX") for the four fiscal quarters ending on the relevant date to the sum of net interest expense plus letter of credit fees, in each case for such period, is not permitted to be less than 2.50 to 1.00.
Our senior secured credit facility contains both financial and non-financial covenants. We were in compliance with these covenants at June 30, 2011, June 30, 2010, December 31, 2010, December 31, 2009 and December 31, 2008. At September 30, 2009, we were in violation of our current ratio covenant. A covenant waiver was included in the fourth amended senior secured credit facility agreement dated November 5, 2009.
Our senior secured credit facility contains various covenants that limit our ability to:
- •
- incur indebtedness;
- •
- pay dividends and repay certain indebtedness;
- •
- grant certain liens;
- •
- merge or consolidate;
- •
- engage in certain asset dispositions;
- •
- use proceeds for any purpose other than to finance the acquisition, exploration and development of mineral interests and
for working capital and general corporate purposes;
- •
- make certain investments;
- •
- enter into transactions with affiliates;
- •
- engage in certain transactions that violate ERISA or the Internal Revenue Code or enter into certain employee benefit
plans and transactions;
- •
- enter into certain swap agreements or hedge transactions;
- •
- incur, become or remain liable under any operating lease which would cause rentals payable to be greater than
$2.5 million in a fiscal year;
- •
- acquire all or substantially all of the assets or capital stock of any person, other than assets consisting of oil and
natural gas properties and certain other oil and natural gas related acquisitions and investments; and
- •
- repay or redeem our senior unsecured notes, or amend, modify or make any other change to any of the terms in our senior unsecured notes that would change the term, life, principal, rate or recurring fee, add call or pre-payment premiums, or shorten any interest periods.
As of June 30, 2011, we were in compliance with the terms of our senior secured credit facility. If an event of default exists under the senior secured credit facility, the lenders will be able to accelerate the maturity of the senior secured credit facility and exercise other rights and remedies. As of June 30, 2011, each of the following will be an event of default:
- •
- failure to pay any principal of any note or any reimbursement obligation under any letter of credit when due or any interest, fees or other amount within certain grace periods;
74
- •
- failure to perform or otherwise comply with the covenants in the senior secured credit facility and other loan documents,
subject, in certain instances, to certain grace periods;
- •
- a representation, warranty, certification or statement is proved to be incorrect in any material respect when made;
- •
- failure to make any payment in respect of any other indebtedness in excess of $2.0 million, any event occurs that
permits or causes the acceleration of any such indebtedness or any event of default or termination event under a hedge agreement occurs in which the net hedging obligation owed is greater than
$2.0 million;
- •
- voluntary or involuntary bankruptcy or insolvency events involving us or our subsidiaries and in the case of an
involuntary proceeding, such proceeding remains undismissed and unstayed for the applicable grace period;
- •
- one or more adverse judgments in excess of $2.0 million to the extent not covered by acceptable third party
insurers, are rendered and are not satisfied, stayed or paid for the applicable grace period;
- •
- incurring environmental liabilities which exceed $2.0 million to the extent not covered by acceptable third party
insurers;
- •
- the loan agreement or any other loan paper ceases to be in full force and effect, or is declared null and void, or is
contested or challenged, or any lien ceases to be a valid, first priority, perfected lien;
- •
- failure to cure any borrowing base deficiency in accordance with the senior secured credit facility;
- •
- a change of control, as defined in our senior secured credit facility; and
- •
- notification if an "event of default" shall occur under the indenture governing our senior unsecured notes.
Additionally, our senior secured credit facility provides for the issuance of letters of credit, limited in the aggregate to the lesser of $10.0 million and the total availability under the facility. At June 30, 2011, we had one letter of credit outstanding totaling approximately $0.03 million under the senior secured credit facility.
Broad Oak credit facility. At June 30, 2011, Broad Oak had a $600.0 million revolving credit facility under its seventh amendment executed on February 1, 2011 between Broad Oak and certain financial institutions. Under the seventh amendment, the borrowing base was redetermined at $375.0 million. The borrowing base was subject to a semi-annual redetermination. The Broad Oak credit facility term extended to April 11, 2013, at which time the outstanding balance would have been due. As defined in the Broad Oak credit facility, the Adjusted Base Rate Advances and Eurodollar Advances under the facilities bore interest payable quarterly at an Adjusted Base Rate or Adjusted LIBOR plus an applicable margin based on the ratio of outstanding revolving credit to the conforming borrowing base. At June 30, 2011, the applicable margin rates were 1.50% for the Adjusted Base Rate advances and 2.50% for the Eurodollar advances. Additionally, we were also required to pay a quarterly commitment fee of 0.5% on the unused portion of the bank's commitment.
75
The Broad Oak credit facility was secured by a first priority lien on Broad Oak's oil and gas properties.
As of June 30, 2011, December 31, 2010, 2009, and 2008, borrowings outstanding under the Broad Oak credit facility totaled approximately $265.4 million, $214.1 million, $44.6 million and $21.1 million, respectively.
Concurrently with the Broad Oak acquisition on July 1, 2011, the Broad Oak credit facility was paid in full and terminated. Refer to Note O of our audited combined financial statements included elsewhere in this prospectus for further discussion of the Broad Oak transaction.
Senior unsecured notes. On January 20, 2011, Laredo Petroleum, Inc. completed an offering of $350 million 91/2% senior unsecured notes due 2019. Our senior unsecured notes will mature on February 15, 2019 and bear an interest rate of 91/2% per annum, payable semi-annually, in cash in arrears on February 15 and August 15 of each year, commencing August 15, 2011. Our senior unsecured notes are fully and unconditionally guaranteed, jointly and severally, on a senior unsecured basis by Laredo Petroleum, LLC and its subsidiaries (other than Laredo Petroleum, Inc. and Laredo Petroleum Holdings, Inc.) (collectively, the "guarantors"). The net proceeds from our senior unsecured notes were used (i) to repay and retire $100 million outstanding under our prior term loan facility, (ii) to pay in full approximately $177.5 million outstanding under our senior secured credit facility and (iii) for general working capital purposes. Our senior unsecured notes were issued under and are governed by an indenture dated January 20, 2011, among Laredo Petroleum, Inc., Wells Fargo Bank, National Association, as trustee, and the guarantors. The indenture contains customary terms, events of default and covenants relating to, among other things, the incurrence of debt, the payment of dividends or similar restricted payments, undertaking transactions with Laredo Petroleum, Inc.'s unrestricted affiliates and limitations on asset sales. Indebtedness under our senior unsecured notes may be accelerated in certain circumstances upon an event of default as set forth in the indenture.
Laredo Petroleum, Inc. may redeem all or a portion of our senior unsecured notes at any time on or after February 15, 2015, on not less than 30 nor more than 60 days' prior notice in amounts of $2,000 or whole multiples of $1,000 in excess thereof, at the redemption prices (expressed as percentages of principal amount) of 104.750% for the twelve-month period beginning on February 15, 2015, 102.375% for the twelve-month period beginning on February 15, 2016 and 100.000% for the twelve-month period beginning on February 15, 2017 and at any time thereafter, together with accrued and unpaid interest, if any, thereon to the applicable date of redemption (subject to the rights of holders of record on relevant record dates to receive interest due on an interest payment date). In addition, before February 15, 2015, Laredo Petroleum, Inc. may redeem all or any part of our senior unsecured notes at a redemption price equal to the sum of the principal amount thereof, plus a make whole premium at the redemption date, plus accrued and unpaid interest, if any, to the applicable redemption date (subject to the rights of holders of record on relevant record dates to receive interest due on an interest payment date). Furthermore, before February 15, 2014, Laredo Petroleum, Inc. may, at any time or from time to time, redeem up to 35% of the aggregate principal amount of our senior unsecured notes (including the principal amount of any additional notes) with the net proceeds of a public or private equity offering at a redemption price of 109.500% of the principal amount of our senior unsecured notes, plus accrued and unpaid interest, if any, to the date of redemption (subject to the rights of holders of record on relevant record dates to receive interest due on an interest payment date), if at least 65% of
76
the aggregate principal amount of our senior unsecured notes (including the principal amount of any additional notes) issued under the indenture remains outstanding immediately after such redemption and the redemption occurs no later than 180 days of the closing date of such equity offering. Laredo Petroleum, Inc. may also be required to make an offer to purchase our senior unsecured notes upon a change of control triggering event.
In connection with the issuance of our senior unsecured notes, Laredo Petroleum, Inc. and the guarantors entered into a registration rights agreement with the initial purchasers of our senior unsecured notes on January 20, 2011 pursuant to which Laredo Petroleum, Inc. and the guarantors have agreed to file with the SEC and use commercially reasonable efforts to cause to become effective a registration statement with respect to an offer to exchange our senior unsecured notes for substantially identical notes (other than with respect to restrictions on transfer or to any increase in annual interest rate) that are registered under the Securities Act, so as to permit the exchange offer to be consummated by the 365th day after January 20, 2011. If Laredo Petroleum, Inc. is unable (except in limited circumstances) to effect such an exchange offer, Laredo Petroleum, Inc. and the guarantors have agreed to use commercially reasonable efforts to cause to become effective a shelf registration statement relating to resales of our senior unsecured notes. Laredo Petroleum, Inc. will be obligated to pay additional interest to the extent the transfer of such notes remains unregistered following the specified time periods or the two year anniversary of the issuance of the senior unsecured notes.
77
Obligations and commitments
We had the following significant contractual obligations and commitments that will require capital resources at December 31, 2010:
| |
Payments due | |||||||||||||||
|---|---|---|---|---|---|---|---|---|---|---|---|---|---|---|---|---|
| (in thousands) |
Less than 1 year |
1 - 3 years |
3 - 5 years |
More than 5 years |
Total |
|||||||||||
Senior secured credit facility(1) |
$ | — | $ | — | $ | 177,500 | $ | — | $ | 177,500 | ||||||
Term loan facility(1) |
— | — | 100,000 | — | 100,000 | |||||||||||
Broad Oak credit facility(1) |
— | — | 214,100 | — | 214,100 | |||||||||||
Drilling rig commitments(2) |
7,379 | — | — | — | 7,379 | |||||||||||
Derivative financial instruments(3) |
85 | 13,356 | — | — | 13,441 | |||||||||||
Asset retirement obligations(4) |
731 | 1,224 | 283 | 6,040 | 8,278 | |||||||||||
Office and equipment leases(5) |
1,265 | 2,248 | 1,059 | 89 | 4,661 | |||||||||||
Total |
$ | 9,460 | $ | 16,828 | $ | 492,942 | $ | 6,129 | $ | 525,359 | ||||||
(1) Includes outstanding principal amount at December 31, 2010. This table does not include future commitment fees, interest expense or other fees on these facilities because they are floating rate instruments and we cannot determine with accuracy the timing of future loan advances, repayments or future interest rates to be charged. As of December 31, 2010, the principal on our senior secured credit facility was due on July 7, 2014 and the principal on our term loan facility was due on January 7, 2015. The senior secured credit facility and the term loan facility were paid in full and the term loan facility was retired with the proceeds of our senior unsecured notes offering on January 20, 2011. As of June 30, 2011, the principal due on our senior secured credit facility was $75.0 million and principal due on the Broad Oak credit facility was approximately $265.4 million. The Broad Oak credit facility was terminated as of July 1, 2011. Additionally, with the completion of our January 2011 senior secured notes offering, we have incurred an additional obligation of $616.0 million in total principal and interest as of June 30, 2011. Refer to Note O of our audited combined financial statements included elsewhere in this prospectus for further discussion of the January 2011 offering of our senior unsecured notes and use of proceeds.
(2) At December 31, 2010, we had eight drilling rigs under contracts which expire during 2011. Any other rig performing work for us is doing so on a well-by-well basis and therefore can be released without penalty at the conclusion of drilling on the current well. Therefore, drilling obligations on well-by-well rigs have not been included in the table above. The value in the table represents the gross amount that we are committed to pay. However, we will record our proportionate share based on our working interest in our audited combined financial statements as incurred. At June 30, 2011, our drilling rig commitments totaled approximately $10.0 million.
(3) Represents payments due for deferred premiums on our commodity hedging contracts. This total deferred premiums due has not changed significantly as of June 30, 2011.
(4) Amounts represent our estimate of future asset retirement obligations. Because these costs typically extend many years into the future, estimating these future costs requires management to make estimates and judgments that are subject to future revisions based upon numerous factors, including the rate of inflation, changing technology and the political and regulatory environment. See Note B to our combined financial statements included elsewhere in this prospectus. Our total asset retirement obligation has increased to approximately $8.8 million as of June 30, 2011.
(5) See Note K to our audited combined financial statements included elsewhere in this prospectus for a description of lease obligations and drilling contract commitments. Our total office and equipment leases obligation has not changed significantly as of June 30, 2011.
Critical accounting policies and estimates
The discussion and analysis of our financial condition and results of operations are based upon our combined financial statements, which have been prepared in accordance with generally accepted accounting principles in the United States of America. The preparation of our financial statements requires us to make estimates and assumptions that affect the reported amounts of assets, liabilities, revenues and expenses and related disclosure of contingent assets and liabilities. Certain accounting policies involve judgments and uncertainties to such an extent that there is reasonable likelihood that materially different amounts could have been reported under different conditions, or if different assumptions had been used. We evaluate
78
our estimates and assumptions on a regular basis. We base our estimates on historical experience and various other assumptions that are believed to be reasonable under the circumstances, the results of which form the basis for making judgments about the carrying values of assets and liabilities that are not readily apparent from other sources. Actual results may differ from these estimates and assumptions used in preparation of our combined financial statements. We believe these accounting policies reflect our more significant estimates and assumptions used in preparation of our combined financial statements. See Note B to our combined financial statements included elsewhere in this prospectus for a discussion of additional accounting policies and estimates made by management.
Method of accounting for oil and natural gas properties
The accounting for our business is subject to special accounting rules that are unique to the oil and gas industry. There are two allowable methods of accounting for oil and gas business activities: the successful efforts method and the full cost method. We follow the full cost method of accounting under which all costs associated with property acquisition, exploration and development activities are capitalized. We also capitalize internal costs that can be directly identified with our acquisition, exploration and development activities and do not include any costs related to production, general corporate overhead or similar activities.
Under the full cost method, capitalized costs are amortized on a composite unit of production method based on proved oil and gas reserves. If we maintain the same level of production year over year, the depreciation, depletion and amortization expense may be significantly different if our estimate of remaining reserves or future development costs changes significantly. Proceeds from the sale of properties are accounted for as reductions of capitalized costs unless such sales involve a significant change in the relationship between costs and proved reserves, in which case a gain or loss is recognized. The costs of unproved properties are excluded from amortization until the properties are evaluated. We review all of our unevaluated properties quarterly to determine whether or not and to what extent proved reserves have been assigned to the properties, and otherwise if impairment has occurred.
Oil and natural gas reserve quantities and standardized measure of future net revenue
Our independent reserve engineers prepare the estimates of oil and gas reserves and associated future net cash flows. The SEC has defined proved reserves as the estimated quantities of oil and gas which geological and engineering data demonstrate with reasonable certainty to be recoverable in future years from known reservoirs under existing economic and operating conditions. The process of estimating oil and gas reserves is complex, requiring significant decisions in the evaluation of available geological, geophysical, engineering and economic data. The data for a given property may also change substantially over time as a result of numerous factors, including additional development activity, evolving production history and a continual reassessment of the viability of production under changing economic conditions. As a result, material revisions to existing reserve estimates occur from time to time. Although every reasonable effort is made to ensure that reserve estimates reported represent the most accurate assessments possible, the subjective decisions and variances in available data for various properties increase the likelihood of significant changes in these estimates. If such changes are material, they could significantly affect future amortization of capitalized costs and result in impairment of assets that may be material.
79
Revenue recognition
Revenue from our interests in producing wells is recognized when the product is delivered, at which time the customer has taken title and assumed the risks and rewards of ownership and collectability is reasonably assured. The sales prices for oil and natural gas are adjusted for transportation and other related deductions. These deductions are based on contractual or historical data and do not require significant judgment. Subsequently, these revenue deductions are adjusted to reflect actual charges based on third party documents. Since there is a ready market for oil and natural gas, we sell the majority of production soon after it is produced at various locations.
Impairment
We review the carrying value of our oil and gas properties under the full cost accounting rules of the SEC on a quarterly basis. This quarterly review is referred to as a ceiling test. Under the ceiling test, capitalized costs, less accumulated amortization and related deferred income taxes, may not exceed an amount equal to the sum of the present value of estimated future net revenues less estimated future expenditures to be incurred in developing and producing the proved reserves, less any related income tax effects. For the years ended December 31, 2009 and 2008, capitalized costs of oil and gas properties exceeded the estimated present value of future net revenues from our proved reserves, net of related income tax considerations, resulting in a write-down in the carrying value of oil and gas properties of $245.9 million and $282.6 million, respectively. For the six months ended June 30, 2011 and 2010 and the year ended December 31, 2010, the result of the ceiling test concluded that the carrying amount of our oil and natural gas properties was significantly below the calculated ceiling test value and as such a write-down was not required. In calculating future net revenues, effective December 31, 2009, current prices are calculated as the average oil and gas prices during the preceding 12-month period prior to the end of the current reporting period, determined as the unweighted arithmetic average first-day-of- the-month prices for the prior 12-month period and costs used are those as of the end of the appropriate quarterly period. Prior to December 31, 2009, prices were calculated as posted prices on the last day of the appropriate period, adjusted by lease for energy content, transportation fees and regional price differentials for natural gas and as the posted price per barrel adjusted by lease for quality, transportation fees and regional price differentials for oil.
Asset retirement obligations
In accordance with the Financial Accounting Standard Board's (the "FASB") authoritative guidance on asset retirement obligations ("ARO"), we record the fair value of a liability for a legal obligation to retire an asset in the period in which the liability is incurred with the corresponding cost capitalized by increasing the carrying amount of the related long-lived asset. For oil and gas properties, this is the period in which the well is drilled or acquired. The ARO represents the estimated amount we will incur to plug, abandon and remediate the properties at the end of their productive lives, in accordance with applicable state laws. The liability is accreted to its present value each period and the capitalized cost is depreciated on the unit of production method. The accretion expense is recorded as a component of depreciation, depletion and amortization in our combined statement of operations.
We determine the ARO by calculating the present value of estimated cash flows related to the liability. Estimating the future ARO requires management to make estimates and judgments
80
regarding timing and existence of a liability, as well as what constitutes adequate restoration. Included in the fair value calculation are assumptions and judgments including the ultimate costs, inflation factors, credit adjusted discount rates, timing of settlement and changes in the legal, regulatory, environmental and political environments. To the extent future revisions to these assumptions impact the fair value of the existing ARO liability, a corresponding adjustment is made to the related asset.
Derivatives
We record all derivative instruments on the balance sheet as either assets or liabilities measured at their estimated fair value. We have not designated any derivative instruments as hedges for accounting purposes and we do not enter into such instruments for speculative trading purposes. Realized gains and realized losses from the settlement of commodity derivative instruments and unrealized gains and unrealized losses from valuation changes in the remaining unsettled commodity derivative instruments are reported under Other Income (Expense) in our combined statements of operations.
Recent accounting pronouncements
In May 2011, the FASB issued Accounting Standards Update ("ASU") 2011-04 Amendments to Achieve Common Fair Value Measurement and Disclosure Requirements in U.S. GAAP and IFRS which provides a consistent definition of fair value and common requirements for measurement of and disclosure about fair value between GAAP and International Financial Reporting Standards. This new guidance changes some fair value measurement principles and disclosure requirements, but does not require additional fair value measurements and is not intended to establish valuation standards or affect valuation practices outside of financial reporting. The update is effective for annual periods beginning after December 15, 2011 and we are in the process of evaluating the impact, if any, the adoption of this update will have on our financial statements.
Inflation
Inflation in the U.S. has been relatively low in recent years and did not have a material impact on our results of operations for the period from December 31, 2008 through the six months ended June 30, 2011. Although the impact of inflation has been insignificant in recent years, it continues to be a factor in the U.S. economy and we do experience inflationary pressure on the costs of oilfield services and equipment as drilling activity increases in the areas in which we operate.
Quantitative and qualitative disclosures about market risk
The primary objective of the following information is to provide forward-looking quantitative and qualitative information about our potential exposure to market risk. The term "market risk" refers to the risk of loss arising from adverse changes in oil and gas prices and interest rates. The disclosures are not meant to be precise indicators of expected future losses, but rather indicators of how we view and manage our ongoing market risk exposures. All of our market risk sensitive instruments were entered into for hedging purposes, rather than for speculative trading.
81
Commodity price exposure. For a discussion of how we use financial commodity put, collar, swap and basis swap contracts to mitigate some of the potential negative impact on our cash flow caused by changes in oil and gas prices, see "—Hedging."
Interest rate risk. As part of our senior secured credit facility and the Broad Oak credit facility, we have debt which bears interest at a floating rate. For the six months ended June 30, 2011, the weighted average indebtedness outstanding on our senior secured credit facility bore a weighted average interest rate of 2.14% and the weighted average indebtedness on the Broad Oak credit facility bore a weighted average interest rate of 3.07%. Based on the total outstanding borrowings under these facilities at June 30, 2011 of $340.4 million, a 1.0% increase in each of the average LIBOR rates and federal funds rates would result in an estimated $3.4 million increase in interest expense for the year ended December 31, 2011 before giving effect to interest rate derivatives.
Through interest rate derivative contracts, we have attempted to mitigate our exposure to changes in interest rates. We have entered into various fixed interest rate swap and cap agreements which hedge our exposure to interest rate variations on our senior secured credit facility. At June 30, 2011, we had interest rate swaps and one interest rate cap outstanding for a notional amount of $260.0 million with fixed pay rates ranging from 1.11% to 3.41% and terms expiring from June 2012 to September 2013.
Counterparty and customer credit risk. Our principal exposures to credit risk are through receivables resulting from commodity derivatives contracts (approximately $7.5 million at June 30, 2011), joint interest receivables and the receivables from the sale of our oil and natural gas production, which we market to energy marketing companies and refineries.
We are subject to credit risk due to the concentration of our oil and natural gas receivables with several significant customers. We do not require our customers to post collateral, and the inability of our significant customers to meet their obligations to us or their insolvency or liquidation may adversely affect our financial results. At June 30, 2011, we had three customers that made up approximately 34%, 15% and 13% of our total oil and gas sales accounts receivable. At December 31, 2010, we had three customers that made up approximately 41%, 16% and 14% of our total oil and gas sales accounts receivable. At December 31, 2009, we had two customers that made up approximately 43% and 17% of our total oil and gas sales accounts receivable, respectively.
Joint operations receivables arise from billings to entities that own partial interests in the wells we operate. These entities participate in our wells primarily based on their ownership in leases on which we intend to drill. We have little ability to control who participates in our wells. At June 30, 2011, we had three customers that made up approximately 28%, 23% and 17% of our total joint operations receivables. At December 31, 2010, we had two customers that made up approximately 77% and 11% of our total joint operations receivables. At December 31, 2009, we had two interest owners that made up approximately 38% and 23% of our total joint operations receivables.
Refer to Note I of our unaudited combined financial statements and Note J of our audited combined financial statements included elsewhere in this prospectus for additional disclosures regarding credit risk.
Off-balance sheet arrangements
Currently, we do not have any off-balance sheet arrangements other than operating leases, which are included in "—Obligations and commitments."
82
Overview
We are an independent energy company focused on the exploration, development and acquisition of oil and natural gas in the Permian and Mid-Continent regions of the United States. Our activities are primarily focused in the Wolfberry and deeper horizons of the Permian Basin in West Texas and the Anadarko Granite Wash in the Texas Panhandle and Western Oklahoma, where we have assembled approximately 126,500 net acres and 38,000 net acres, respectively. These plays are characterized by high oil and liquids-rich natural gas content, multiple target horizons, extensive production histories, long-lived reserves, high drilling success rates and significant initial production rates.
Based upon drilling results from over 625 of our vertical wells, we believe our economic vertical program in these areas has been largely de-risked. Our vertical development drilling activity is complemented by a rapidly emerging horizontal drilling program, which may add significant production and reserves in multiple producing horizons on the same acreage. These drilling programs comprise an extensive, multi-year inventory of exploratory and development opportunities. As of October 1, 2011, we have drilled 23 gross horizontal wells in the Permian and ten gross horizontal wells in the Anadarko Granite Wash.
Laredo was founded in October 2006 by our Chairman and Chief Executive Officer Randy A. Foutch, who was later joined by other members of our management team, many of whom have worked together for a decade or more. Prior to founding Laredo, Mr. Foutch formed, built and sold three private oil and gas companies, all of which were focused on the same general areas of the Permian and Mid-Continent regions in which Laredo currently operates. In 1991, Mr. Foutch formed Colt Resources Corporation ("Colt"), with an institutional sponsor. Colt was sold in a private transaction in 1996 for approximately $33 million. In 1997, Mr. Foutch formed Lariat Petroleum, Inc. ("Lariat") with a large institutional sponsor investing approximately $74 million and using approximately $100 million of debt. In 2001, Lariat subsequently was sold for approximately $333 million. Most recently, in 2002, Mr. Foutch and several of our current managers formed Latigo Petroleum, Inc. ("Latigo"), with institutional sponsors investing approximately $160 million, and utilizing an additional approximately $200 million of debt. Latigo was sold in 2006 for approximately $750 million. All of these companies executed the same fundamental business strategy in the same general operating areas that created significant growth in cash flow, production and reserves.
Since our inception, we have rapidly grown our cash flow, production and reserves through our drilling program. We also seek acquisition opportunities that are complementary to our assets and provide upside potential that is competitive with our existing property portfolio. On July 1, 2011, we completed the acquisition of Broad Oak Energy, Inc., a Delaware corporation, for a combination of equity and cash. This acquisition provided us incremental scale and significant additional exposure to attractive vertical and horizontal oil and liquids-rich natural gas opportunities. The acquired properties are concentrated on a contiguous land position located in the Permian Basin, primarily in Reagan County, and are being drilled targeting Wolfberry production. This acreage, totaling approximately 64,000 net acres, approximately doubled our Permian Basin position and is immediately south of and on trend with our legacy Permian Basin properties in Glasscock and Howard Counties. We believe the success Laredo has achieved
83
to date in drilling our vertical and horizontal wells may add significant value to this newly acquired acreage.
On a combined basis, our net cash provided by operating activities was approximately $162.1 million for the six months ended June 30, 2011. Our net average daily production for the same period was approximately 22,070 BOE, and our net proved reserves were an estimated 137,052 MBOE as of June 30, 2011.
The following table summarizes, on a combined basis, including our recent acquisition, net acreage, total estimated net proved reserves and producing wells as of June 30, 2011, and average daily production for the six months ended June 30, 2011 in our principal operating regions. Our reserve estimates as of June 30, 2011 are based on a report prepared by Ryder Scott, our independent reserve engineers. Based on such report, we operated approximately 98% of the production from our proved developed oil and natural gas reserves as of June 30, 2011. In addition, the table shows our internally identified potential gross drilling locations as of June 30, 2011.
| |
|
Estimated net proved reserves(2)(3) |
|
|
|
|
||||||||||||||||||||
|---|---|---|---|---|---|---|---|---|---|---|---|---|---|---|---|---|---|---|---|---|---|---|---|---|---|---|
| |
|
Average daily production(3) |
|
|
|
|||||||||||||||||||||
| |
|
Producing wells | |
|||||||||||||||||||||||
| |
|
|
% of total reserves |
|
Identified potential drilling locations(4) |
|||||||||||||||||||||
| |
Net acreage |
MBOE(1) |
% Oil |
(BOE/D) |
Gross |
Net |
||||||||||||||||||||
Permian |
126,531 | 86,007 | 63% | 49% | 13,437 | 511 | 494 | 5,764 | ||||||||||||||||||
Anadarko Granite Wash |
38,273 | 40,582 | 30% | 8% | 5,782 | 162 | 120 | 351 | ||||||||||||||||||
Other(5) |
173,318 | 10,463 | 7% | 3% | 2,851 | 355 | 180 | — | ||||||||||||||||||
Total |
338,122 | 137,052 | 100% | 34% | 22,070 | 1,028 | 794 | 6,115 | ||||||||||||||||||
(1) MBbl equivalents ("MBOE") converted at a rate of six MMcf per one MBbl.
(2) Our estimated net proved reserves were prepared by Ryder Scott as of June 30, 2011 and are based on reference oil and natural gas prices. In accordance with applicable rules of the SEC, the reference oil and natural gas prices are derived from the average trailing twelve-month index prices (calculated as the unweighted arithmetic average of the first-day-of-the-month price for each month within the applicable twelve-month period), held constant throughout the life of the properties. The reference prices were $86.60/Bbl for oil and $4.00/MMBtu for natural gas for the twelve months ended June 30, 2011.
(3) Our reserves and production are reported in two streams: crude oil and liquids-rich natural gas. The economic value of the natural gas liquids in our natural gas is included in the wellhead natural gas price. The reference prices referred to above that were utilized in the June 30, 2011 reserve report prepared by Ryder Scott are adjusted for natural gas liquids content, quality, transportation fees, geographical differentials, marketing bonuses or deductions and other factors affecting the price received at the wellhead. The adjusted reference prices in the Permian area were $7.07/Mcf and $6.79/Mcf for the legacy Laredo and Broad Oak properties, respectively, and $4.84/Mcf in the Anadarko Granite Wash area.
(4) See below for more information regarding the processes and criteria through which these potential drilling locations were identified.
(5) Includes our acreage in the gas prone Eastern Anadarko (45,281 net acres) and Central Texas Panhandle (54,213 net acres), as well as the Dalhart Basin, which is a new exploration effort (73,824 net acres) targeting liquid rich formations that are less than 7,000 feet in depth.
We have assembled a multi-year inventory of development drilling and exploitation projects as a result of our early acquisition of technical data, early establishment of significant acreage positions and successful exploratory drilling. We plan to continue our conventional vertical drilling programs, especially in the Permian Basin, and to further de-risk our rapidly emerging horizontal plays in both the Permian and Anadarko Basins. As of October 1, 2011, we have a total of 15 operated drilling rigs running. Ten of these rigs are working on our properties in the Permian Basin, eight of which are drilling vertical wells and two are drilling horizontal wells. The other five rigs are operating on our properties in the Anadarko Granite Wash, three of which are drilling horizontal wells, and two are drilling vertical wells.
84
In the drilling and development of hydrocarbon reserves, there are three key factors that can have an effect on our objective of establishing commercial production. Each of these factors must be addressed in order to reduce the risk and uncertainty associated with (or "de-risk") our exploration and production program:
- •
- Does the prospective reservoir underlie our acreage position and can it be defined both vertically and horizontally?
- •
- Are the petro-physics of the reservoir rock such that it contains hydrocarbons that can be recovered?
- •
- Can the hydrocarbons be produced on a commercial basis?
We carefully assess and monitor all three factors in our drilling and exploration projects. Our drilling activities in areas containing extensive historical industry activity have enabled us to determine whether a prospective reservoir underlies our acreage position, and whether it can be defined both vertically and horizontally. We use a number of proven mapping techniques to understand the physical extent of the targeted reservoir. This includes 2D and 3D seismic data, as well as Laredo-owned and historical public well databases (which in the Anadarko Basin may extend back approximately 50 years and in the Permian basin over 80 years). We also utilize our laboratory and field derived data from whole cores, sidewall cores, well cuttings, mudlogs and open-hole well logs to understand the petro-physics of the rock characteristics prior to the commencement of any completion operations. Finally, after defining the reservoir, our engineers utilize their technical expertise to develop completion programs that we believe will maximize the amount of hydrocarbons that can be recovered. As more wells are completed in the targeted reservoir and additional data becomes available, the process is further refined (and further "de-risked") in order to minimize costs and maximize recoveries.
As of June 30, 2011, we have identified a total of 6,115 potential drilling locations, 5,764 of which underlie our Permian Basin acreage and 351 of which are located in our Anadarko Basin focus area. Both areas have a vertical and horizontal drilling component relative to the types of potential drilling locations. While the Permian and Anadarko areas share some of the same qualifying technical metrics that define a potential location, as a matter of clarification, we consider the Granite Wash area to represent a conventional drilling program, while the potential locations identified in the Permian are characterized as a resource play.
In the Anadarko Basin, both the Granite Wash horizontal and vertical potential locations have been identified through a series of detailed maps which we have internally generated based on an extensive geological and engineering database. Information incorporated into this process includes both our own proprietary information as well as industry data available in the public domain. Specifically, open hole logging data, production statistics from operated and non-operated wells, petrophysical data describing the reservoir rock as derived from cores and, where appropriate, 3D seismic data provide the technical basis from which we identified the potential locations. We anticipate that in the Anadarko Basin, a majority of these locations will be drilled within the next 3-5 years (assuming a utilization rate of 3-4 rigs per year), subject primarily to commodity pricing and the continued success of our existing drilling program.
In the Permian Basin, both the Wolfberry interval (comprised of multiple producing formations) and the individual targeted shale formations are considered a resource play. As such, the mapping of the gross interval for each of the producing formations underlying a majority of
85
our entire acreage position is the main factor we considered in identifying our potential locations. In the general region and immediately around our acreage position, publicly available well data exists from a significant number of vertical wells (in excess of several thousand for the Cline Shale alone) that have allowed us to define the areal extent of each of the producing intervals, whether the whole vertical Wolfberry section or the targeted Cline and Wolfcamp Shales. In addition to this publicly available well data, we have also incorporated our internally generated information from cores, 3D seismic, open hole logging and reservoir engineering data into defining the extent of the targeted intervals, the ability of such intervals to produce commercial quantities of hydrocarbons, and the viability of the potential locations. Based on our currently projected capital expenditure budget, we estimate that by the end of 2013 we will have drilled approximately 440 of these potential locations. As with the Granite Wash drilling program, the timing of drilling the identified potential Permian locations will be influenced by several factors, including commodity prices, capital requirements, Texas Railroad Commission well-spacing requirements and a continuation of the positive results from both our the vertical and horizontal development drilling program.
Our business strategy
Our goal is to enhance stockholder value by economically growing our cash flow, production and reserves by executing the following strategy:
Grow production and reserves through our lower-risk vertical drilling. We leverage our operating and technical expertise to establish large, contiguous acreage positions. We believe that we have reduced the risk and uncertainty associated with (or "de-risked") our core acreage positions by our vertical development activity, and we intend to generate significant growth in cash flows, production and reserves by drilling our inventory of locations. Our vertical development drilling program provides repeatable, predictable, low-risk production growth but also serves as an efficient way to obtain additional critical sub-surface data to target potential horizontal wells.
Increase recovery and capital efficiency through our horizontal drilling. Our horizontal drilling program is designed to further capture the upside potential that may exist on our properties. Horizontal drilling may significantly increase our well performance and recoveries compared to our vertical wells. In addition, horizontal drilling may be economic in areas where vertical drilling is currently not economical or logistically viable. We believe multiple vertically stacked producing horizons may be developed using horizontal drilling techniques in both our Permian and Anadarko Granite Wash plays.
Apply our technical expertise to reduce risk in our current asset portfolio, optimize our development program and evaluate emerging opportunities. Our management team has significant experience in successfully identifying opportunities to enhance our cash flow, production and reserves in the basins in which we operate. Our practice is to make a substantial upfront investment to understand the geology, geophysics and reservoir parameters of the rock formations that define our exploration and development programs. Through comprehensive coring programs, acquisition and evaluation of high quality 3D seismic data and advance logging / simulation technologies, we seek to economically de-risk our opportunities to the extent possible before committing to a drilling program.
86
Enhance returns through prudent capital allocation and continued improvements in operational and cost efficiencies. In the current commodity price environment, we have directed our capital spending toward oil and liquids-rich drilling opportunities that provide attractive returns. Our management team is focused on continuous improvement of our operating practices and has significant experience in successfully converting exploration programs into cost efficient development projects. Operational control allows us to more effectively manage operating costs, the pace of development activities, technical applications, the gathering and marketing of our production and capital allocation. Laredo is the operator in our joint ventures, having drilled 24 wells as of June 30, 2011 in the Exxon Mobil joint venture and 128 wells under the Linn Energy joint venture.
Evaluate and pursue value enhancing acquisitions, mergers and joint ventures. While we believe our multi-year inventory of identified potential drilling locations provides us with significant growth opportunities, we will continue to evaluate strategically compelling asset acquisitions, mergers and joint ventures within our core areas. Any transaction we pursue will generally complement our asset base and provide a competitive economic proposition relative to our existing opportunities. Our Laredo operated joint ventures with Exxon Mobil and Linn Energy, our 2008 acquisition of properties from Linn Energy and our recently completed acquisition of Broad Oak are examples of this strategy.
Proactively manage risk to limit downside. We continually monitor and control our business and operating risks through various risk management practices, including maintaining a conservative financial profile, making significant upfront investment in research and development as well as data acquisition, owning and operating our natural gas gathering systems with multiple sales outlets, minimizing long-term contracts, maintaining an active commodity hedging program and employing prudent safety and environmental practices.
Our competitive strengths
We have a number of competitive strengths that we believe will help us to successfully execute our business strategy:
Management team with extensive operating experience in core areas of operation. Our management team has extensive industry experience and proven record of providing a significant return on investment. Four of our six senior officers have worked with Mr. Foutch at one or more of his previous companies. This has resulted in a high degree of continuity among members of our executive management and has enabled us to attract and retain key employees from previous companies as well as other successful exploration and production companies. Each of Mr. Foutch's previous companies focused on the same general areas of the Permian and Anadarko Basins in which Laredo currently operates. Most members of our management team have over twenty years of experience and knowledge directly associated with our current primary operating areas. Approximately 47% of our full-time employees are experienced technical employees, including 24 petroleum engineers, 21 geoscientists, 15 landmen and 20 technical support staff.
Economic, multi-year drilling inventory. We have assembled a portfolio of over 6,000 identified potential gross drilling locations. We believe our focus on data-rich, mature producing basins with well studied geology, engineering practices and concentrated operation, combined with new technologies in the Permian and Anadarko Basins, as well as our
87
disciplined assessment and monitoring of the three factors that we believe help to de-risk our drilling and exploration projects, as described above, significantly decreases the risk profile of our identified drilling locations. As of October 1, 2011, we have approximately 1,493 square miles of 3D seismic data supporting our exploratory and development drilling programs. From our formation in 2006 through June 30, 2011, we have drilled over 650 vertical and horizontal wells with a success rate of approximately 99%. Our drilling activity has been and will continue to be focused on liquids-rich opportunities in the Permian Basin and Anadarko Granite Wash, where we see liquids-rich natural gas that ranges from 1,230 to 1,425 Btu per cubic foot and 1,115 to 1,175 Btu per cubic foot, respectively. Pursuant to our existing percentage of proceeds contracts during June 2011, our natural gas liquids yield was 133 Bbls/MMcf in the Permian Basin and 65 Bbls/MMcf in the Anadarko Granite Wash and our ratio of residue natural gas to wellhead natural gas was 70% and 84%, respectively.
Significant operational control. We operate approximately 98% of the production from our proved developed oil and natural gas reserves as of June 30, 2011, based on a report prepared by Ryder Scott. We believe that maintaining operating control permits us to better pursue our strategies of enhancing returns through operational and cost efficiencies and maximizing ultimate hydrocarbon recoveries from mature producing basins through reservoir analysis and evaluation and continuous improvement of drilling, completion and stimulation techniques. We expect to maintain operation control over most of our identified potential drilling locations.
Our gathering infrastructure provides secure and timely takeaway capacity and enhanced economics. Our wholly-owned subsidiary, Laredo Gas Services, LLC, has invested approximately $49.0 million in over 170 miles of pipeline in our natural gas gathering systems in the Permian and Anadarko Basins as of June 30, 2011. We have also installed over 400 miles of natural gas gathering lines to over 50 central delivery points on our Permian acreage in Reagan County. These systems and flow lines provide greater operational efficiency and lower differentials for our natural gas production in our liquids-rich Permian and Anadarko Granite Wash plays and enable us to coordinate our activities to connect our wells to market upon completion with minimal days waiting on pipeline. Additionally, they provide us with multiple sales outlets through interconnecting pipelines, minimizing the risks of shut-ins awaiting pipeline connection or curtailment by downstream pipelines.
Financial strength and flexibility. We maintain a conservative financial profile in order to preserve operational flexibility and financial stability. On a pro forma basis, after giving effect to this offering and using the net proceeds from this offering (assuming the midpoint of the price range set forth on the cover page of this prospectus) to pay down the borrowings on our senior secured credit facility, we expect to have approximately $ million available for borrowings under our credit facility. At June 30, 2011, pro forma for this offering, we expect to have total debt of approximately $ million, which is times our annualized EBITDA for the first six months of 2011. We have diversified our capital sources, including raising $350 million in senior unsecured notes in January 2011. We believe that our operating cash flow and the aforementioned liquidity sources provide us with the ability to implement our planned exploration and development activities.
Strong institutional investor support and corporate governance. Warburg Pincus is our institutional investor and has many years of relevant experience in financing and supporting exploration and production companies and management teams, having been the lead investor in several such companies. Warburg Pincus has been an institutional investor in two previous
88
companies operated by members of our management team. To date, Warburg Pincus, certain members of our management and our independent directors have together invested a total of $710 million of equity in Laredo. Including amounts contributed subsequent to June 30, 2011, $18.6 million is attributable to our management team. Warburg Pincus is not selling shares in this offering and will retain a significant interest in Laredo. We believe that our board of directors is exceptionally qualified and represents a significant resource. It is comprised of Laredo management, representatives of Warburg Pincus and independent individuals with extensive industry and business expertise. We actively engage our board of directors on a regular basis for their expertise on strategic, financial, governance and risk management activities.
Focus areas
We focus on developing a balanced inventory of quality drilling opportunities that provide us with the operational flexibility to economically develop and produce oil and natural gas reserves from conventional and unconventional formations. Our properties are currently located in the prolific Permian and Mid-Continent regions of the United States, where we leverage our experience and knowledge to identify and exploit additional upside potential. We have been successful in delivering repeatable results through internally generated vertical and horizontal drilling programs.
Permian Basin
The Permian Basin, located in west Texas and southeastern New Mexico, is one of the most prolific onshore oil and natural gas producing regions in the United States. It is characterized by an extensive production history, mature infrastructure, long reserve life and hydrocarbon potential in multiple intervals. Our Permian activities are centered on the eastern side of the basin approximately 35 miles east of Midland, Texas in Glasscock, Howard, Reagan and Sterling Counties. As of June 30, 2011, we held 126,531 net acres in over 175 sections with an average working interest of 97% in wells drilled to date.
The overall Wolfberry interval, the principal focus of our drilling activities, is an oil play that also includes a liquids-rich natural gas component. Our production/exploration fairway extends approximately 20 miles wide and 80 miles long. While exploration and drilling efforts in the southern half of our acreage block have been centered on the shallower portion of the Wolfberry (Spraberry, Dean and Wolfcamp formations) the emphasis in the northern half has been on the deeper intervals, including the Wolfcamp, Cline Shale, Strawn and Atoka formations. Considering the geology and the reservoir extent of each contributing formation, we now have identified significant potential throughout our total acreage block for the entire Wolfberry interval from the shallow zones to the deepest.
We have drilled and completed approximately 500 gross vertical wells and have defined the productive limits on our acreage throughout the trend. The success of our vertical drilling program, coupled with industry activity, has substantially reduced risks associated with our future drilling programs in the Wolfberry interval.
We have expanded our drilling program to include a horizontal component targeting the Cline and Wolfcamp Shales. The drilling of the Cline Shale, located in the lower Wolfberry, was initiated after our extensive technical review that included coring and testing the Cline separately in multiple vertical wells. We believe the Cline Shale exhibits similar petrophysical
89
attributes and favorable economics compared to other liquids-rich shale plays operated by other companies, such as in the Eagle Ford and Bakken Shale formations. We have acquired 3D seismic data to assist in fracture analysis and the definition of the structural component within the Cline Shale.
We have drilled three gross horizontal Wolfcamp Shale wells as of October 1, 2011 with encouraging results out of the uppermost interval (the Wolfcamp "A"). The Wolfcamp "B" and "C" Shale intervals also look prospective based on open hole logs and petrophysical data we have gathered through coring. This data, along with industry activity to the south, suggests that multiple, repeatable shale opportunities underlay a majority of our acreage position. As of October 1, 2011, we have drilled a total of 21 gross horizontal wells in the Wolfcamp and Cline formations, of which 18 are in the Cline Shale and three in the Wolfcamp Shale.
We have identified approximately 5,764 total potential gross drilling locations (both vertical and horizontal) in the Permian, all of which are within the larger Wolfberry interval.
Anadarko Granite Wash
Straddling the Texas/Oklahoma state line, our Granite Wash play extends over a large area in the western part of the Anadarko Basin. As of June 30, 2011, we held 38,273 net acres in Hemphill County, Texas and Roger Mills County, Oklahoma. Our play consists of vertical and horizontal drilling opportunities targeting the liquids-rich Granite Wash formation. By utilizing the whole core data we obtained early in the exploration process and the subsurface information from our vertical wells, enhanced logging techniques and other wells drilled by the industry, we have developed a detailed regional geologic depositional and engineering understanding. As a result, we have been able to target our current vertical development drilling program in the higher productive areas. As of June 30, 2011, we have drilled and completed 155 vertical wells.
Our horizontal Granite Wash program is in the evaluation phase with our current emphasis on reducing risks through our drilling program and by incorporating practices similar to the industry's successful drilling results in the immediate area. The economic viability of our Anadarko Granite Wash horizontal program has been validated by our recent completions and by the announced success of our competitors in close proximity to our acreage. In addition to the Granite Wash zones tested to date, we believe that additional potential upside exists within the multiple mapped and targeted horizontal Granite Wash zones that remain to be tested. As a result of our and the industry's recent horizontal success, we anticipate the majority of our Granite Wash drilling going forward to be horizontal. As of June 30, 2011, we have identified approximately 101 potential gross drilling locations for the horizontal Granite Wash, which includes both our Texas and Oklahoma acreage.
In addition to the Granite Wash intervals in this area, there are both shallower and deeper zones that we believe are prospective, including the Cleveland and Morrow channel sands. We have acquired 3D seismic data to help further define the areal extent of these additional formations. Considering the Granite Wash and Upper Morrow intervals identified as of June 30, 2011, we estimate there are approximately 351 identified potential gross vertical and horizontal drilling locations, of which the majority are in the Granite Wash.
90
Other areas
In addition to our Permian Wolfberry and Anadarko Granite Wash plays, we continue to evaluate opportunities in three other areas within our core operating regions. We believe that our activity in the Dalhart Basin has positioned us to begin drilling three wells budgeted for 2011. We expect the other two areas, which represent 13% of our production and 8% of our estimated proved reserves as of June 30, 2011, could become more compelling in the future with improving commodity prices.
The Dalhart Basin is located on the western side of the Texas Panhandle. As of June 30, 2011, we held 73,824 net acres in the Dalhart Basin. It is characterized by both a conventional Granite Wash play and several potential liquids-rich shale plays that may underlie a significant portion of the entire area. Both targeted intervals are considered oil plays at depths of less than 7,000 feet. Our initial 3D seismic program of approximately 155 square miles was recently completed and is in the final stages of being interpreted.
The second area is centrally located in the Texas Panhandle, where our operations are currently conducted through our joint venture with ExxonMobil. As of June 30, 2011, we held 54,213 net acres in the Texas Panhandle. The prospective zones in this area are relatively shallow (less than 9,500 feet), with a majority being predominately natural gas.
The third area is located in the eastern end of the Anadarko Basin, in Caddo County, Oklahoma. As of June 30, 2011, we held 45,281 net acres in the Eastern Anadarko. There are multiple targets to drill in this area, varying in depth between 8,000 feet and 22,000 feet, which are predominantly dry natural gas. While our economic metrics require higher natural gas prices to justify additional drilling, the area could play a significant role in our future if natural gas prices increase.
91
Our operations
Estimated proved reserves
Unless otherwise specifically identified in this prospectus, the information with respect to our estimated proved reserves presented below has been prepared by Ryder Scott, our independent reserve engineers, in accordance with the rules and regulations of the SEC applicable to the periods presented. Our net proved reserves are estimated at 137,052 MBOE as of June 30, 2011, 39% of which were classified as proved developed and 34% oil. The following table presents summary data for each of our core operating areas as of June 30, 2011 (prepared in accordance with the SEC's rules regarding oil and natural gas reserve reporting that are currently in effect), unless otherwise noted. Our estimated proved reserves at June 30, 2011 assume our ability to fund the capital costs necessary for their development and are impacted by pricing assumptions. See "Risk factors—Risks related to our business—Estimating reserves and future net revenues involves uncertainties. Decreases in oil and natural gas prices, or negative revisions to reserve estimates or assumptions as to future oil and natural gas prices, may lead to decreased earnings, losses or impairment of oil and natural gas assets" and "—Our estimates of proved reserves as of December 31, 2009, December 31, 2010 and June 30, 2011 have been prepared under current SEC rules that went into effect for fiscal years ending on or after December 31, 2009, which may make comparisons to prior periods difficult and could limit our ability to book additional proved undeveloped reserves in the future." In addition, we may not be able to raise the amounts of capital that would be necessary to drill a substantial portion of our proved undeveloped reserves.
| |
At June 30, 2011 | |||||
|---|---|---|---|---|---|---|
| |
Proved reserves |
|||||
| |
(MBOE)(1) |
|||||
Area |
||||||
Permian Basin |
86,007 | |||||
Anadarko Granite Wash |
40,582 | |||||
Other(2) |
10,463 | |||||
Total |
137,052 | |||||
(1) MBbl equivalents ("MBOE") converted at a rate of six MMcf per one MBbl.
(2) Includes Eastern Anadarko, Central Texas Panhandle and Dalhart Basin.
The following table sets forth more information regarding our estimated proved reserves at June 30, 2011 and December 31, 2010, 2009 and 2008. Ryder Scott, our independent reserve engineers, estimated 100% of our combined proved reserves at December 31, 2010 and June 30, 2011. Ryder Scott also estimated the proved reserves for the legacy Laredo properties as of December 31, 2009 and December 31, 2008. Ryder Scott did not perform evaluations of the Broad Oak properties on these dates. Our estimates of the combined proved reserves at December 31, 2009 and December 31, 2008 are a combination of the Ryder Scott reports on the legacy Laredo properties and Laredo's internal proved reserve estimates of the Broad Oak properties. Based upon such reserve estimates we calculated for Broad Oak, we believe the legacy Laredo properties represented 93% and 96% of such combined proved reserves at year end 2009 and 2008, respectively. The reserve estimates at December 31, 2008 were prepared in accordance with the SEC's rules regarding oil and natural gas reserve reporting in effect for years ending prior to December 31, 2009. The reserve estimates at June 30, 2011 and December 31, 2010 and 2009 were prepared in accordance with the SEC's rules regarding oil and natural gas reserve reporting currently in effect. A copy of the summary report prepared
92
by Ryder Scott as of June 30, 2011 is included as Annex B to this prospectus. The information in the following table does not give any effect to our commodity hedges.
| |
|
At December 31, | |||||||||||||
|---|---|---|---|---|---|---|---|---|---|---|---|---|---|---|---|
| |
At June 30, 2011 |
||||||||||||||
| |
2010 |
2009 |
2008 |
||||||||||||
Estimated proved reserves: |
|||||||||||||||
Oil and condensate (MBbl) |
45,929 | 44,847 | 5,928 | 3,508 | |||||||||||
Natural gas (MMCF) |
546,741 | 550,278 | 279,549 | 244,051 | |||||||||||
Total estimated proved reserves (MBOE)(1) |
137,052 | 136,560 | 52,519 | 44,183 | |||||||||||
Proved developed producing (MBOE)(1) |
49,286 | 39,300 | 23,333 | (2) | 16,336 | (3) | |||||||||
Proved developed non-producing (MBOE)(1) |
4,422 | 5,533 | 2,106 | 3,032 | |||||||||||
Proved undeveloped (MBOE)(1) |
83,344 | 91,727 | 27,080 | (4) | 24,815 | (5) | |||||||||
Percent developed |
39% | 33% | 48% | 44% | |||||||||||
(1) MBbl equivalents ("MBOE") converted at a rate of six MMcf per one MBbl.
(2) Laredo selected only the PDP wells in the December 31, 2010 Ryder Scott report that were PDP on January 1, 2010 and added the 2010 production from this group of wells to the December 31, 2010 Ryder Scott forecast on these wells to estimate the PDP reserves as of December 31, 2009. New wells drilled in 2010 were considered to be reserve adds during the year and are not included as PDP reserves at December 31, 2009.
(3) Laredo selected only the PDP wells in the December 31, 2010 Ryder Scott report that were PDP on January 1, 2009 and added the 2009 and 2010 production from this group of wells to the December 31, 2010 Ryder Scott forecast to estimate the PDP reserves at December 31, 2008. New wells drilled in 2009 and 2010 were considered to be reserve adds and are not included as PDP reserves at December 31, 2008.
(4) Laredo applied the year-end 2009 SEC prices of $3.15/MMBtu and $57.04/Bbl to the PUD's identified in the December 31, 2010 Ryder Scott report and determined that five locations are economic and only these locations/reserves are captured in the December 31, 2009 proved undeveloped estimates.
(5) All of the legacy Broad Oak PUD's in the December 31, 2010 Ryder Scott reserve report are uneconomical at year-end 2008 SEC prices of $4.68/MMBtu and $44.60/Bbl. Therefore, there are no legacy Broad Oak PUD reserves at December 31, 2008.
Technology used to establish proved reserves. Under the SEC rules, proved reserves are those quantities of oil and natural gas that by analysis of geoscience and engineering data can be estimated with reasonable certainty to be economically producible from a given date forward from known reservoirs, and under existing economic conditions, operating methods and government regulations. The term "reasonable certainty" implies a high degree of confidence that the quantities of oil and/or natural gas actually recovered will equal or exceed the estimate. Reasonable certainty can be established using techniques that have been proven effective by actual production from projects in the same reservoir or an analogous reservoir or by other evidence using reliable technology that establishes reasonable certainty. Reliable technology is a grouping of one or more technologies (including computational methods) that has been field tested and has been demonstrated to provide reasonably certain results with consistency and repeatability in the formation being evaluated or in an analogous formation.
To establish reasonable certainty with respect to our estimated proved reserves, our internal reserve engineers and Ryder Scott, our independent reserve engineers, employed technologies that have been demonstrated to yield results with consistency and repeatability. The technologies and economic data used in the estimation of our proved reserves include, but are not limited to, open hole logs, core analyses, geologic maps, available downhole and production data and seismic data. Reserves attributable to producing wells with sufficient production history were estimated using appropriate decline curves, material balance calculations or other performance relationships. Reserves attributable to producing wells with limited production history and for undeveloped locations were estimated using pore volume calculations and performance from analogous wells in the surrounding area and geologic data
93
to assess the reservoir continuity. These wells were considered to be analogous based on production performance from the same formation and completion using similar techniques.
Qualifications of technical persons and internal controls over reserves estimation process. In accordance with the Standards Pertaining to the Estimating and Auditing of Oil and Gas Reserves Information promulgated by the Society of Petroleum Engineers and guidelines established by the SEC, Ryder Scott, our independent reserve engineers, estimated 100% of our proved reserve information as of June 30, 2011 included in this prospectus. The technical persons responsible for preparing the reserves estimates presented herein meet the requirements regarding qualifications, independence, objectivity and confidentiality set forth in the Standards Pertaining to the Estimating and Auditing of Oil and Gas Reserves Information promulgated by the Society of Petroleum Engineers.
We maintain an internal staff of petroleum engineers and geoscience professionals who work closely with our independent reserve engineers to ensure the integrity, accuracy and timeliness of data furnished to Ryder Scott in their reserves estimation process. Our technical team meets regularly with representatives of Ryder Scott to review properties and discuss methods and assumptions used in Ryder Scott's preparation of the year-end reserves estimates. The Ryder Scott reserve report is reviewed with representatives of Ryder Scott and our internal technical staff before dissemination of the information. Additionally, our senior management reviews the Ryder Scott reserve report.
John E. Minton, our Senior Vice President of Reservoir Engineering, is the technical person primarily responsible for overseeing the preparation of our reserves estimates. He has over 36 years of practical experience with approximately 32 years of this experience being in the estimation and evaluation of reserves. He has been a registered Professional Engineer in the State of Oklahoma since 1982. He has a Bachelor of Science degree in Mechanical Engineering and is a life member in good standing of the Society of Petroleum Engineers. Mr. Minton reports directly to our President and Chief Operating Officer. Reserve estimates are reviewed and approved by senior engineering staff with final approval by our President and Chief Operating Officer and certain other members of our senior management. Our senior management also reviews our independent engineers' reserve estimates and related reports with senior reservoir engineering staff and other members of our technical staff.
Proved undeveloped reserves
Our proved undeveloped reserves increased from 27,080 MBOE at December 31, 2009 to 91,727 MBOE at December 31, 2010. Material changes are a result of new proved undeveloped reserve additions totaling 70,830 MBOE, of which 63,444 MBOE is attributable to our Permian Basin play and 7,002 MBOE is attributable to our Anadarko Granite Wash play. During the year, 3,229 MBOE of proved undeveloped reserves were converted to proved developed reserves as a result of the drilling of 20 locations at a total net cost of $42 million.
Our proved undeveloped reserves decreased from 91,727 MBOE at December 31, 2010 to 83,344 MBOE at June 30, 2011 primarily due to converting proved undeveloped reserves to proved developed reserves. During the first six months of 2011, 6,358 MBOE of proved undeveloped reserves were converted to proved developed reserves as a result of drilling 78 locations at a total net cost of $124 million. Estimated total future development and abandonment costs related to the development of proved undeveloped reserves as shown in our June 30, 2011 reserve report is $1.53 billion, of which $69 million is scheduled to occur in
94
the second half of 2011 and $167 million is scheduled to occur in 2012. As of June 30, 2011, our estimated development expenditures relating to proved undeveloped reserves for 2013, 2014 and 2015 are $261.3 million, $412.0 million and $529.7 million, respectively.
Production, revenues and price history
The following table sets forth information regarding production, revenues and realized prices and production costs for the six months ended June 30, 2011 and 2010 and for the years ended December 31, 2010, 2009 and 2008. Our reserves and production are reported in two streams: crude oil and liquids-rich natural gas. The economic value of the natural gas liquids in our liquids-rich natural gas is included in the wellhead natural gas price. For additional information on price calculations, see information set forth in "Management's discussion and analysis of financial condition and results of operations."
| |
For the six months ended June 30, |
For the years ended December 31, | |||||||||||||||
|---|---|---|---|---|---|---|---|---|---|---|---|---|---|---|---|---|---|
| |
2011 |
2010 |
2010 |
2009 |
2008 |
||||||||||||
Production data: |
|||||||||||||||||
Oil (MBbls) |
1,517 | 592 | 1,648 | 513 | 192 | ||||||||||||
Natural gas (MMcf) |
14,866 | 9,710 | 21,381 | 18,302 | 8,124 | ||||||||||||
Oil equivalents (MBOE)(1) |
3,995 | 2,210 | 5,212 | 3,563 | 1,546 | ||||||||||||
Average daily production (BOE/D) |
22,070 | 12,207 | 14,278 | 9,762 | 4,226 | ||||||||||||
Revenues (in thousands): |
|||||||||||||||||
Oil |
$ | 143,464 | $ | 44,252 | $ | 126,891 | $ | 29,946 | $ | 16,544 | |||||||
Natural gas |
$ | 93,068 | $ | 51,563 | $ | 112,892 | $ | 64,401 | $ | 57,339 | |||||||
Average sales prices without hedges: |
|||||||||||||||||
Benchmark oil ($/Bbl)(2) |
$ | 98.33 | $ | 78.37 | $ | 79.53 | $ | 61.79 | $ | 99.80 | |||||||
Realized oil ($/Bbl)(3) |
$ | 94.57 | $ | 74.75 | $ | 77.00 | $ | 58.37 | $ | 86.17 | |||||||
Benchmark natural gas ($/MMBtu)(2) |
$ | 4.24 | $ | 4.69 | $ | 4.39 | $ | 3.98 | $ | 9.03 | |||||||
Realized natural gas ($/Mcf)(3) |
$ | 6.26 | $ | 5.29 | $ | 5.28 | $ | 3.52 | $ | 7.06 | |||||||
Average price ($/BOE) |
$ | 59.21 | $ | 43.36 | $ | 46.01 | $ | 26.48 | $ | 47.79 | |||||||
Average sales prices with hedges(4): |
|||||||||||||||||
Oil ($/Bbl) |
$ | 90.31 | $ | 75.32 | $ | 77.26 | $ | 65.42 | $ | 91.93 | |||||||
Natural gas ($/Mcf) |
$ | 6.63 | $ | 6.20 | $ | 6.32 | $ | 6.17 | $ | 7.83 | |||||||
Average price ($/BOE) |
$ | 58.98 | $ | 47.40 | $ | 50.37 | $ | 41.10 | $ | 52.58 | |||||||
Average cost per BOE: |
|||||||||||||||||
Lease operating expenses |
$ | 4.53 | $ | 4.38 | $ | 4.16 | $ | 3.52 | $ | 4.16 | |||||||
Production and ad valorem taxes |
$ | 3.75 | $ | 2.97 | $ | 3.01 | $ | 1.72 | $ | 3.55 | |||||||
Depreciation, depletion and amortization |
$ | 19.00 | $ | 16.58 | $ | 18.69 | $ | 16.28 | $ | 21.41 | |||||||
General and administrative |
$ | 4.95 | $ | 6.81 | $ | 5.93 | $ | 6.31 | $ | 15.04 | |||||||
(1) MBbl equivalents ("MBOE") converted at a rate of six MMcf per one MBbl.
(2) Benchmark oil prices are the simple average of the daily settlement price for NYMEX West Texas Intermediate Light Sweet Crude Oil each month for the period indicated. Benchmark natural gas prices are the simple arithmetic average of the last day settlement price for NYMEX natural gas each month for the period indicated.
(3) Realized crude oil and natural gas prices are the actual prices realized at the wellhead after all adjustments for natural gas liquids content, quality, transportation fees, geographical differentials, marketing bonuses or deductions and other factors affecting the price at the wellhead.
(4) Hedged prices reflect the after effect of our commodity hedging transactions on our average sales prices. Our calculation of such after effects include realized gains and losses on cash settlements for commodity derivatives, which do not qualify for hedge accounting.
95
Productive wells
The following table sets forth certain information regarding productive wells in each of our core areas at June 30, 2011. We also own royalty and overriding royalty interests in a small number of wells in which we do not own a working interest.
| |
Total producing wells | |
|||||||||||||||
|---|---|---|---|---|---|---|---|---|---|---|---|---|---|---|---|---|---|
| |
Gross | |
Average working interest |
||||||||||||||
| |
Vertical |
Horizontal |
Total(1) |
Net |
|||||||||||||
Permian |
495 | 16 | 511 | 494 | 97% | ||||||||||||
Anadarko Granite Wash |
155 | 7 | 162 | 120 | 74% | ||||||||||||
Other(2) |
346 | 9 | 355 | 180 | 51% | ||||||||||||
Total |
996 | 32 | 1,028 | 794 | 77% | ||||||||||||
(1) 855 of the 1,028 total gross producing wells are Laredo operated.
(2) Includes Eastern Anadarko, Central Texas Panhandle and Dalhart Basin.
Acreage
The following table sets forth certain information regarding the developed and undeveloped acreage in which we own an interest as of June 30, 2011 for each of our core operating areas, including acreage held by production ("HBP"). A majority of our developed acreage is subject to liens securing our senior secured credit facility.
| |
Developed acres | Undeveloped acres | Total acres | |
|||||||||||||||||||
|---|---|---|---|---|---|---|---|---|---|---|---|---|---|---|---|---|---|---|---|---|---|---|---|
| |
% HBP |
||||||||||||||||||||||
| |
Gross |
Net |
Gross |
Net |
Gross |
Net |
|||||||||||||||||
Permian |
67,039 | 63,745 | 99,711 | 62,786 | 166,750 | 126,531 | 50.4% | ||||||||||||||||
Anadarko Granite Wash |
29,104 | 20,177 | 30,489 | 18,096 | 59,593 | 38,273 | 52.7% | ||||||||||||||||
Other(1) |
91,285 | 60,929 | 169,596 | 112,389 | 260,881 | 173,318 | 35.2% | ||||||||||||||||
Total |
187,428 | 144,851 | 299,796 | 193,271 | 487,224 | 338,122 | 42.8% | ||||||||||||||||
(1) Includes Eastern Anadarko, Central Texas Panhandle and Dalhart Basin.
Undeveloped acreage expirations
The following table sets forth the gross and net undeveloped acreage in our core operating areas as of June 30, 2011 that will expire over the next three years unless production is established within the spacing units covering the acreage or the lease is renewed or extended under continuous drilling provisions prior to the primary term expiration dates.
| |
Remaining 2011 | 2012 | 2013 | 2014 | ||||||||||||||||||||||
|---|---|---|---|---|---|---|---|---|---|---|---|---|---|---|---|---|---|---|---|---|---|---|---|---|---|---|
| |
Gross |
Net |
Gross |
Net |
Gross |
Net |
Gross |
Net |
||||||||||||||||||
Permian |
8,556 | 5,703 | 10,479 | 4,470 | 54,818 | 37,118 | 12,127 | 9,269 | ||||||||||||||||||
Anadarko Granite Wash |
9,858 | 5,544 | 10,953 | 6,349 | 2,502 | 1,718 | 2,853 | 1,183 | ||||||||||||||||||
Other(1) |
67,561 | 48,412 | 76,633 | 46,825 | 23,782 | 15,797 | 1,620 | 1,354 | ||||||||||||||||||
Total |
85,975 | 59,659 | 98,065 | 57,644 | 81,102 | 54,633 | 16,600 | 11,806 | ||||||||||||||||||
(1) Includes Eastern Anadarko, Central Texas Panhandle and Dalhart Basin.
Drilling activity
The following table summarizes our drilling activity for the six months ended June 30, 2011 and for the years ended December 31, 2010, 2009 and 2008. Gross wells reflect the sum of all
96
wells in which we own an interest. Net wells reflect the sum of our working interests in gross wells.
| |
Six months ended June 30, |
Years ended December 31, | |||||||||||||||||||||||||
|---|---|---|---|---|---|---|---|---|---|---|---|---|---|---|---|---|---|---|---|---|---|---|---|---|---|---|---|
| |
2011 | 2010 | 2009 | 2008 | |||||||||||||||||||||||
| |
Gross |
Net |
Gross |
Net |
Gross |
Net |
Gross |
Net |
|||||||||||||||||||
Development wells: |
|||||||||||||||||||||||||||
Productive |
111 | 106.3 | 294 | 276.6 | 127 | 114.7 | 120 | 95.5 | |||||||||||||||||||
Dry |
0 | 0.0 | 2 | 2.0 | 2 | 2.0 | 5 | 4.8 | |||||||||||||||||||
Total development wells |
111 | 106.3 | 296 | 278.6 | 129 | 116.7 | 125 | 100.3 | |||||||||||||||||||
Exploratory wells: |
|||||||||||||||||||||||||||
Productive |
0 | 0.0 | 11 | 9.3 | 17 | 13.7 | 6 | 4.6 | |||||||||||||||||||
Dry |
0 | 0.0 | 1 | 1.0 | 2 | 1.3 | 1 | 0.0 | |||||||||||||||||||
Total exploratory wells |
0 | 0.0 | 12 | 10.3 | 19 | 15.0 | 7 | 4.6 | |||||||||||||||||||
Corporate history and structure
Laredo Petroleum Holdings, Inc., a Delaware corporation formed on August 12, 2011, is a wholly-owned subsidiary of Laredo Petroleum, LLC. Pursuant to the terms of a corporate reorganization that will be completed simultaneously with, or prior to, the closing of this offering, Laredo Petroleum, LLC will merge into Laredo Petroleum Holdings, Inc., with Laredo Petroleum Holdings, Inc. surviving the merger. The outstanding units of Laredo Petroleum, LLC will be exchanged for common stock of Laredo Petroleum Holdings, Inc. in accordance with the limited liability company agreement of Laredo Petroleum, LLC (as amended and restated, the "limited liability company agreement"). For more information on our corporate reorganization and ownership of our common stock, see "Corporate reorganization" and "Security ownership of certain beneficial owners and management."
Laredo Petroleum, LLC is a Delaware limited liability company formed in 2007 by Warburg Pincus, our institutional investor, and the management of Laredo Petroleum, Inc., which was founded in October 2006 by Randy A. Foutch, our Chairman and Chief Executive Officer, to acquire, develop and operate oil and gas properties in the Permian and Mid-Continent regions of the United States. Warburg Pincus has many years of relevant experience in financing and support of growing exploration and production companies, having been the lead investor in several such companies, including companies previously founded by Mr. Foutch as well as the former Broad Oak. Upon completion of the corporate reorganization described above and this offering, Warburg Pincus will initially own approximately % of our outstanding shares of common stock (or % if the underwriters' option to acquire additional shares of common stock is exercised in full) based on an initial public offering price of $ per share (the midpoint of the price range set forth on the cover of this prospectus). In addition, members of our management team will initially own an approximate aggregate % interest in us.
97
Upon completion of the corporate reorganization, Laredo Petroleum Holdings, Inc. will have four wholly-owned subsidiaries: Laredo Petroleum, Inc., a Delaware corporation formed in October 2006; Laredo Petroleum Texas, LLC, a Texas limited liability company formed in March 2007; Laredo Gas Services, LLC, a Delaware limited liability company formed in November 2007; and Laredo Petroleum—Dallas, Inc., a Delaware corporation formed in May 2006, formerly known as Broad Oak Energy, Inc.
Laredo Petroleum, Inc. is the borrower under our senior secured credit facility as well as the issuer of our $350 million senior unsecured notes. All of Laredo's subsidiaries (other than Laredo Petroleum, Inc.) are guarantors of the obligations under our senior secured credit facility and the senior unsecured notes.
The following diagrams indicate our current ownership structure and our ownership structure after giving effect to our corporate reorganization and this offering based on the initial public offering price of $ per share (the midpoint of the price range set forth on the cover of this prospectus) and assuming no exercise of the underwriters' option to acquire additional shares of common stock. The ownership percentages for the current ownership structure diagram assume that all of the shares of common stock that will be held by current investors are valued at the current public offering price of $ per share, less underwriting discounts and commissions.
Current ownership structure
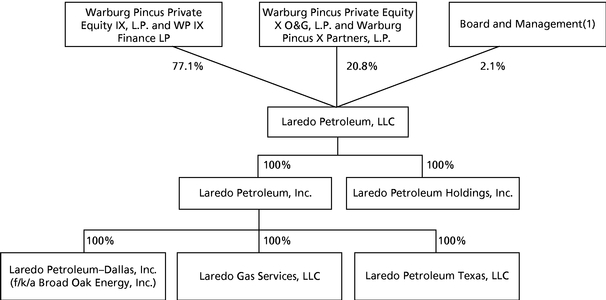
98
Ownership structure immediately after giving effect to this offering
(1) Including former Broad Oak management and directors.
Marketing and major customers
We market the majority of production from properties we operate for both our account and the account of the other working interest owners in our operated properties. We sell substantially all of our production to a variety of purchasers under contracts ranging from one month to several years, all at market prices. We normally sell production to a relatively small number of customers, as is customary in the exploration, development and production business. However, based on the current demand for oil and natural gas and the availability of alternate purchasers, we believe that the loss of any one of our major purchasers would not have a material adverse effect on our financial condition and results of operations. For information regarding our customers that accounted for 10% or more of our oil and natural gas revenues during the first six months of 2011 and the last three calendar years, see Note I in our unaudited and Note J in our audited combined financial statements included elsewhere in this prospectus. See "Risk factors—Risks related to our business—The inability of our significant customers to meet their obligations to us may materially adversely affect our financial results." See also "Certain relationships and related party transactions."
Title to properties
We believe that we have satisfactory title to all of our producing properties in accordance with generally accepted industry standards. As is customary in the industry, in the case of undeveloped properties, often cursory investigation of record title is made at the time of lease acquisition. Investigations are made before the consummation of an acquisition of producing properties and before commencement of drilling operations on undeveloped properties. Individual properties may be subject to burdens that we believe do not materially interfere with the use or affect the value of the properties. Burdens on properties may include customary royalty interests, liens incident to operating agreements and for current taxes, obligations or duties under applicable laws, development obligations under natural gas leases, or net profits interests.
99
Oil and natural gas leases
The typical oil and natural gas lease agreement covering our properties provides for the payment of royalties to the mineral owner for all oil and natural gas produced from any wells drilled on the leased premises. The lessor royalties and other leasehold burdens on our properties generally range from 12.5% to 25%, resulting in a net revenue interest to us generally ranging from 87.5% to 75%. 43% of our leases are held by production.
Seasonality
Demand for oil and natural gas generally decreases during the spring and fall months and increases during the summer and winter months. However, seasonal anomalies such as mild winters or mild summers sometimes lessen this fluctuation. In addition, certain natural gas users utilize natural gas storage facilities and purchase some of their anticipated winter requirements during the summer. This can also lessen seasonal demand fluctuations. These seasonal anomalies can increase competition for equipment, supplies and personnel during the spring and summer months, which could lead to shortages and increase costs or delay our operations.
Competition
The oil and natural gas industry is intensely competitive, and we compete with other companies in our industry that have greater resources than we do, especially in our focus areas. Many of these companies not only explore for and produce oil and natural gas, but also carry on refining operations and market petroleum and other products on a regional, national or worldwide basis. These companies may be able to pay more for productive natural gas properties and exploratory locations or define, evaluate, bid for and purchase a greater number of properties and locations than our financial or human resources permit and may be able to expend greater resources to attract and maintain industry personnel. In addition, these companies may have a greater ability to continue exploration activities during periods of low natural gas market prices. Our larger competitors may be able to absorb the burden of existing, and any changes to, federal, state and local laws and regulations more easily than we can, which would adversely affect our competitive position. Our ability to acquire additional properties and to discover reserves in the future will be dependent upon our ability to evaluate and select suitable properties and to consummate transactions in a highly competitive environment. In addition, because we have fewer financial and human resources than many companies in our industry, we may be at a disadvantage in bidding for exploratory locations and producing natural gas properties.
Hydraulic fracturing
We use hydraulic fracturing as a means to maximize the productivity of almost every well that we drill and complete. Hydraulic fracturing is a necessary part of the completion process for our producing properties in Texas and Oklahoma because our properties are dependent upon our ability to effectively fracture the producing formations in order to produce at economic rates. We are currently conducting hydraulic fracturing activity in the completion of both our vertical and horizontal wells in the Permian Basin and the Anadarko Granite Wash. While hydraulic fracturing is not required to maintain 43% of our leasehold acreage that is currently
100
held by production from existing wells, it will be required in the future to develop the proved non-producing and proved undeveloped reserves associated with this acreage. Nearly all of our proved non-producing and proved undeveloped reserves associated with future drilling, recompletion, and refracture stimulation projects, or over 61% of our total estimated proved reserves as of June 30, 2011, require hydraulic fracturing.
We have and continue to follow applicable industry standard practices and legal requirements for groundwater protection in our operations which are subject to supervision by state and federal regulators (including the Bureau of Land Management on federal acreage). These protective measures include setting surface casing at a depth sufficient to protect fresh water zones as determined by regulatory agencies, and cementing the well to create a permanent isolating barrier between the casing pipe and surrounding geological formations. This aspect of well design essentially eliminates a pathway for the fracturing fluid to contact any aquifers during the hydraulic fracturing operations. For recompletions of existing wells, the production casing is pressure tested prior to perforating the new completion interval.
Injection rates and pressures are monitored instantaneously and in real time at the surface during our hydraulic fracturing operations. Pressure is monitored on both the injection string and the immediate annulus to the injection string. Hydraulic fracturing operations would be shut down immediately if an abrupt change occurred to the injection pressure or annular pressure.
Certain state regulations require disclosure of the components in the solutions used in hydraulic fracturing operations. More than 99% of the hydraulic fracturing fluids we use are made up of water and sand. The remainder of the constituents in the fracturing fluid are managed and used in accordance with applicable requirements.
Hydraulic fracture stimulation requires the use of a significant volume of water. Upon flowback of the water, we dispose of it in a way that minimizes the impact to nearby surface water by disposing into approved disposal or injection wells. We currently do not discharge water to the surface.
For information regarding existing and proposed governmental regulations regarding hydraulic fracturing and related environmental matters, please read "Business—Regulation of environmental and occupational health and safety matters—Water and other waste discharges and spills." For related risks to our stockholders, please read "Risk factors—Risks related to our business—Federal and state legislation and regulatory initiatives relating to hydraulic fracturing could prohibit projects or result in increased costs and additional operating restrictions or delays because of the significance of hydraulic fracturing in our business."
Regulation of the oil and natural gas industry
Our operations are substantially affected by federal, state and local laws and regulations. In particular, natural gas production and related operations are, or have been, subject to price controls, taxes and numerous other laws and regulations. All of the jurisdictions in which we own or operate producing oil and natural gas properties have statutory provisions regulating the exploration for and production of oil and natural gas, including provisions related to permits for the drilling of wells, bonding requirements to drill or operate wells, the location of wells, the method of drilling and casing wells, the surface use and restoration of properties
101
upon which wells are drilled, sourcing and disposal of water used in the drilling and completion process, and the abandonment of wells. Our operations are also subject to various conservation laws and regulations. These include the regulation of the size of drilling and spacing units or proration units, the number of wells which may be drilled in an area, and the unitization or pooling of crude natural gas wells, as well as regulations that generally prohibit the venting or flaring of natural gas, and impose certain requirements regarding the ratability or fair apportionment of production from fields and individual wells.
Failure to comply with applicable laws and regulations can result in substantial penalties. The regulatory burden on the industry increases the cost of doing business and affects profitability. Although we believe we are in substantial compliance with all applicable laws and regulations, such laws and regulations are frequently amended or reinterpreted. Therefore, we are unable to predict the future costs or impact of compliance. Additional proposals and proceedings that affect the natural gas industry are regularly considered by Congress, the states, FERC, and the courts. We cannot predict when or whether any such proposals may become effective.
We believe we are in substantial compliance with currently applicable laws and regulations and that continued substantial compliance with existing requirements will not have a material adverse effect on our financial position, cash flows or results of operations. However, current regulatory requirements may change, currently unforeseen environmental incidents may occur or past non-compliance with environmental laws or regulations may be discovered.
Regulation of production of oil and natural gas
The production of oil and natural gas is subject to regulation under a wide range of local, state and federal statutes, rules, orders and regulations. Federal, state and local statutes and regulations require permits for drilling operations, drilling bonds and reports concerning operations. All of the states in which we own and operate properties have regulations governing conservation matters, including provisions for the unitization or pooling of oil and natural gas properties, the establishment of maximum allowable rates of production from oil and natural gas wells, the regulation of well spacing, and plugging and abandonment of wells. The effect of these regulations is to limit the amount of oil and natural gas that we can produce from our wells and to limit the number of wells or the locations at which we can drill, although we can apply for exceptions to such regulations or to have reductions in well spacing. Moreover, each state generally imposes a production or severance tax with respect to the production and sale of oil, natural gas and natural gas liquids within its jurisdiction. We own interests in properties located onshore in different U.S. states. These states regulate drilling and operating activities by requiring, among other things, permits for the drilling of wells, maintaining bonding requirements in order to drill or operate wells, and regulating the location of wells, the method of drilling and casing wells, the surface use and restoration of properties upon which wells are drilled and the plugging and abandonment of wells. The laws of these states also govern a number of environmental and conservation matters, including the handling and disposing or discharge of waste materials, the size of drilling and spacing units or proration units and the density of wells that may be drilled, unitization and pooling of oil and natural gas properties and establishment of maximum rates of production from oil and natural gas wells. Some states have the power to prorate production to the market demand for oil and natural gas. The failure to comply with these rules and regulations can result in substantial penalties. Our competitors in the oil and natural gas industry are subject to the same regulatory requirements and restrictions that affect our operations.
102
Regulation of environmental and occupational health and safety matters
Our operations are subject to numerous stringent federal, state and local statutes and regulations governing the discharge of materials into the environment or otherwise relating to protection of the environment or occupational health and safety. Numerous governmental agencies, such as the U.S. Environmental Protection Agency ("EPA"), issue regulations, which often require difficult and costly compliance measures that carry substantial administrative, civil and criminal penalties and may result in injunctive obligations for failure to comply. These laws and regulations may require the acquisition of a permit before drilling commences, restrict the types, quantities and concentrations of various substances that can be released into the environment in connection with drilling, production and transporting through pipelines, govern the sourcing and disposal of water used in the drilling, completion and production process, limit or prohibit drilling activities in certain areas and on certain lands lying within wilderness, wetlands, frontier and other protected areas, require some form of remedial action to prevent or mitigate pollution from current or former operations such as plugging abandoned wells or closing earthen pits, result in the suspension or revocation of necessary permits, licenses and authorizations, require that additional pollution controls be installed and impose substantial liabilities for pollution resulting from operations or failure to comply with regulatory filings. In addition, these laws and regulations may restrict the rate of production. The strict and joint and several liability nature of such laws and regulations could impose liability upon us regardless of fault. Public interest in the protection of the environment has increased dramatically in recent years. The trend of more expansive and stringent environmental legislation and regulations applied to the crude oil and natural gas industry could continue, resulting in increased costs of doing business and consequently affecting profitability. Changes in environmental laws and regulations occur frequently, and to the extent laws are enacted or other governmental action is taken that restricts drilling or imposes more stringent and costly operating, waste handling, disposal and cleanup requirements, our business and prospects, as well as the oil and natural gas industry in general, could be materially adversely affected.
Hazardous substance and waste handling
Our operations are subject to environmental laws and regulations relating to the management and release of hazardous substances, solid and hazardous wastes and petroleum hydrocarbons. These laws generally regulate the generation, storage, treatment, transportation and disposal of solid and hazardous waste and may impose strict and, in some cases, joint and several liability for the investigation and remediation of affected areas where hazardous substances may have been released or disposed. The Comprehensive Environmental Response, Compensation, and Liability Act, as amended, referred to as CERCLA or the Superfund law, and comparable state laws, impose liability, without regard to fault or the legality of the original conduct, on certain classes of persons deemed "responsible parties." These persons include current owners or operators of the site where a release of hazardous substances occurred, prior owners or operators that owned or operated the site at the time of the release or disposal of hazardous substances, and companies that disposed or arranged for the disposal of the hazardous substances found at the site. Under CERCLA, these persons may be subject to strict and joint and several liability for the costs of cleaning up the hazardous substances that have been released into the environment, for damages to natural resources and for the costs of certain health studies. CERCLA also authorizes the EPA and, in some instances, third parties to
103
act in response to threats to the public health or the environment and to seek to recover the costs they incur from the responsible classes of persons. It is not uncommon for neighboring landowners and other third parties to file claims for personal injury and property damage allegedly caused by hazardous substances or other pollutants released into the environment. Despite the "petroleum exclusion" of Section 101(14) of CERCLA, which currently encompasses natural gas, we may nonetheless handle hazardous substances within the meaning of CERCLA, or similar state statutes, in the course of our ordinary operations and, as a result, may be jointly and severally liable under CERCLA for all or part of the costs required to clean up sites at which these hazardous substances have been released into the environment. In addition, we may have liability for releases of hazardous substances at our properties by prior owners or operators or other third parties.
The Oil Pollution Act of 1990 (the "OPA") is the primary federal law imposing oil spill liability. The OPA contains numerous requirements relating to the prevention of and response to petroleum releases into waters of the United States, including the requirement that operators of offshore facilities and certain onshore facilities near or crossing waterways must maintain certain significant levels of financial assurance to cover potential environmental cleanup and restoration costs. Under the OPA, strict, joint and several liability may be imposed on "responsible parties" for all containment and cleanup costs and certain other damages arising from a release, including, but not limited to, the costs of responding to a release of oil to surface waters and natural resource damages, resulting from oil spills into or upon navigable waters, adjoining shorelines or in the exclusive economic zone of the United States. A "responsible party" includes the owner or operator of an onshore facility. The OPA establishes a liability limit for onshore facilities of $350 million. These liability limits may not apply if: a spill is caused by a party's gross negligence or willful misconduct; the spill resulted from violation of a federal safety, construction or operating regulation; or a party fails to report a spill or to cooperate fully in a clean-up. We are also subject to analogous state statutes that impose liabilities with respect to oil spills.
We also generate solid wastes, including hazardous wastes, which are subject to the requirements of the Resource Conservation and Recovery Act ("RCRA"), as amended, and comparable state statutes. Although RCRA regulates both solid and hazardous wastes, it imposes strict requirements on the generation, storage, treatment, transportation and disposal of hazardous wastes. Certain petroleum production wastes are excluded from RCRA's hazardous waste regulations. It is possible, however, that these wastes, which could include wastes currently generated during our operations, will be designated as "hazardous wastes" in the future and, therefore, be subject to more rigorous and costly disposal requirements. Indeed, legislation has been proposed from time to time in Congress to re-categorize certain oil and gas exploration and production wastes as "hazardous wastes." Any such changes in the laws and regulations could have a material adverse effect on our maintenance capital expenditures and operating expenses.
We believe that we are in substantial compliance with the requirements of CERCLA, RCRA, OPA and related state and local laws and regulations, and that we hold all necessary and up-to-date permits, registrations and other authorizations required under such laws and regulations. Although we believe that the current costs of managing our wastes as they are presently classified are reflected in our budget, any legislative or regulatory reclassification of oil and
104
natural gas exploration and production wastes could increase our costs to manage and dispose of such wastes.
Water and other waste discharges and spills
The Federal Water Pollution Control Act, as amended, also known as the Clean Water Act, the Safe Drinking Water Act, the OPA and comparable state laws impose restrictions and strict controls regarding the discharge of pollutants, including produced waters and other natural gas wastes, into federal and state waters. The discharge of pollutants into regulated waters is prohibited, except in accordance with the terms of a permit issued by the EPA or the state. The discharge of dredge and fill material in regulated waters, including wetlands, is also prohibited, unless authorized by a permit issued by the U.S. Army Corps of Engineers. The EPA has also adopted regulations requiring certain oil and natural gas exploration and production facilities to obtain individual permits or coverage under general permits for storm water discharges. Costs may be associated with the treatment of wastewater or developing and implementing storm water pollution prevention plans, as well as for monitoring and sampling the storm water runoff from certain of our facilities. Some states also maintain groundwater protection programs that require permits for discharges or operations that may impact groundwater conditions. The underground injection of fluids is subject to permitting and other requirements under state laws and regulation. Obtaining permits has the potential to delay the development of oil and natural gas projects. These same regulatory programs also limit the total volume of water that can be discharged, hence limiting the rate of development, and require us to incur compliance costs. These laws and any implementing regulations provide for administrative, civil and criminal penalties for any unauthorized discharges of oil and other substances in reportable quantities and may impose substantial potential liability for the costs of removal, remediation and damages. Pursuant to these laws and regulations, we may be required to obtain and maintain approvals or permits for the discharge of wastewater or storm water and the underground injection of fluids and are required to develop and implement spill prevention, control and countermeasure plans, also referred to as "SPCC plans," in connection with on-site storage of significant quantities of oil. We maintain all required discharge permits necessary to conduct our operations, and we believe we are in substantial compliance with their terms.
Hydraulic fracturing is a practice that is used to stimulate production of hydrocarbons, particularly natural gas, from tight formations. The process involves the injection of water, sand and chemicals under pressure into the formation to fracture the surrounding rock and stimulate production. The process is typically regulated by state oil and gas commissions. The EPA, however, recently asserted federal regulatory authority over hydraulic fracturing involving diesel additives under the federal Safe Drinking Water Act's ("SDWA") Underground Injection Control ("UIC") Program by posting a new requirement on its website that requires facilities to obtain permits to use diesel fuel in hydraulic fracturing operations. The U.S. Energy Policy Act of 2005, which exempts hydraulic fracturing from regulation under the SDWA, prohibits the use of diesel fuel in the fracturing process without a UIC permit. Although the EPA has yet to take any action to enforce or implement this newly-asserted regulatory authority, industry groups have filed suit challenging the EPA's recent decisions as a "final agency action" and, thus, in violation of the notice-and-comment rulemaking procedures of the Administrative Procedures Act. At the same time, the EPA has commenced a study of the potential environmental impacts of hydraulic fracturing activities, with results of the study anticipated to
105
be available by late 2012, and a committee of the House of Representatives also is conducting an investigation of hydraulic fracturing practices. Furthermore, on August 23, 2011, the EPA published a proposed rule in the Federal Register to establish new emissions standards to reduce volatile organic compounds ("VOC") emissions from several types of processes and equipment used in the oil and gas industry, including a 95% reduction in VOCs emitted during the construction or modification of hydraulically-fractured wells. In addition, legislation is pending in Congress to repeal the hydraulic fracturing exemption from the SDWA, provide for federal regulation of hydraulic fracturing, and require public disclosure of the chemicals used in the fracturing process, and such legislation could be introduced in the current session of Congress.
Further, certain members of the Congress have called upon: (i) the U.S. Government Accountability Office to investigate how hydraulic fracturing might adversely affect water resources; (ii) the SEC to investigate the natural gas industry and any possible misleading of investors or the public regarding the economic feasibility of pursuing natural gas deposits in shales by means of hydraulic fracturing; and (iii) the U.S. Energy Information Administration to provide a better understanding of that agency's estimates regarding natural gas reserves, including reserves from shale formations, as well as uncertainties associated with those estimates. Finally, the Shale Gas Subcommittee of the Secretary of Energy Advisory Board released a report on August 11, 2011, proposing recommendations to reduce the potential environmental impacts from shale gas production. These ongoing or proposed studies, depending on their degree of pursuit and any meaningful results obtained, could spur initiatives to further regulate hydraulic fracturing under the SDWA or other regulatory mechanism.
Some states have adopted, and other states are considering adopting, regulations that could restrict hydraulic fracturing in certain circumstances or otherwise require the public disclosure of chemicals used in the hydraulic fracturing process. For example, pursuant to legislation adopted by the State of Texas in June 2011, the Railroad Commission of Texas (the "RRC") published a proposed rule on September 9, 2011 requiring disclosure to the RRC and the public of certain information regarding the components used in the hydraulic fracturing process. In addition to state law, local land use restrictions, such as city ordinances, may restrict or prohibit the performance of well drilling in general and/or hydraulic fracturing in particular.
If these or any other new laws or regulations that significantly restrict hydraulic fracturing are adopted, such laws could make it more difficult or costly for us to drill and produce from tight formations as well as make it easier for third parties opposing the hydraulic fracturing process to initiate legal proceedings. In addition, if hydraulic fracturing is regulated at the federal level, fracturing activities could become subject to additional permitting and financial assurance requirements, more stringent construction specifications, increased monitoring, reporting and recordkeeping obligations, plugging and abandonment requirements and also to attendant permitting delays and potential increases in costs. These developments, as well as new laws or regulations, could cause us to incur substantial compliance costs, and compliance or the consequences of failure to comply by us could have a material adverse effect on our financial condition and results of operations. At this time, it is not possible to estimate the potential impact on our business that may arise if federal or state legislation governing hydraulic fracturing is enacted into law.
106
Air emissions
The federal Clean Air Act, as amended, and comparable state laws restrict the emission of air pollutants from many sources, including compressor stations, through the issuance of permits and the imposition of other requirements. In addition, the EPA has developed, and continues to develop, stringent regulations governing emissions of toxic air pollutants at specified sources. In particular, on August 23, 2011, pursuant to a court-ordered consent decree, the EPA published a proposed rule establishing new emissions standards to reduce VOC and sulfur dioxide emissions from several types of processes and equipment used in the oil and gas industry, including a 95 percent reduction in VOCs emitted during construction or modification of hydraulically-fractured wells. The consent decree requires the EPA to take final action by February 28, 2012, following a public comment period, which is presently underway. These proposed standards, should they be adopted, as well as any future laws and their implementing regulations, may require us to obtain pre-approval for the expansion or modification of existing facilities or the construction of new facilities expected to produce air emissions, impose stringent air permit requirements, or utilize specific equipment or technologies to control emissions. Our failure to comply with these requirements could subject us to monetary penalties, injunctions, conditions or restrictions on operations and, potentially, criminal enforcement actions.
We may be required to incur certain capital expenditures in the next few years for air pollution control equipment in connection with maintaining or obtaining operating permits addressing other air emission related issues, which may have a material adverse effect on our operations. Obtaining permits also has the potential to delay the development of oil and natural gas projects. We believe that we currently are in substantial compliance with all air emissions regulations and that we hold all necessary and valid construction and operating permits for our current operations.
Regulation of "greenhouse gas" emissions
Recent scientific studies have suggested that emissions of certain gases, commonly referred to as "greenhouse gases" ("GHGs") and including carbon dioxide and methane, may be contributing to warming of the earth's atmosphere and other climatic changes. In response to such studies, Congress has, from time to time, considered legislation to reduce emissions of GHGs. One bill approved by the House of Representatives in June 2009, known as the American Clean Energy and Security Act of 2009 would have required an 80% reduction in emissions of GHGs from sources within the U.S. between 2012 and 2050, but it was not approved by the U.S. Senate in the 2009-2010 legislative session. Congress is likely to continue to consider similar bills. Moreover, almost half of the states have already taken legal measures to reduce emissions of GHGs through the planned development of GHG emission inventories and/or regional GHG cap and trade programs or other mechanisms. Most cap and trade programs work by requiring major sources of emissions, such as electric power plants, or major producers of fuels, such as refineries and gas processing plants, to acquire and surrender emission allowances corresponding with their annual emissions of GHGs. The number of allowances available for purchase is reduced each year until the overall GHG emission reduction goal is achieved. As the number of GHG emission allowances declines each year, the cost or value of allowances is expected to escalate significantly. Some states have enacted renewable portfolio standards, which require utilities to purchase a certain percentage of their energy from renewable fuel sources.
107
In addition, in December 2009, the EPA determined that emissions of carbon dioxide, methane and other GHGs present an endangerment to human health and the environment, because emissions of such gases are, according to the EPA, contributing to warming of the earth's atmosphere and other climatic changes. These findings by the EPA allow the agency to proceed with the adoption and implementation of regulations that would restrict emissions of GHGs under existing provisions of the federal Clean Air Act. In response to its endangerment finding, the EPA recently adopted two sets of rules regarding possible future regulation of GHG emissions under the Clean Air Act, one of which purports to regulate emissions of GHGs from motor vehicles and the other of which would regulate emissions of GHGs from large stationary sources of emissions such as power plants or industrial facilities. The motor vehicle rule was finalized in April 2010 and became effective in January 2011 but it does not require immediate reductions in GHG emissions. The stationary source rule was adopted in May 2010 and also became effective January 2011 and is the subject of several pending lawsuits filed by industry groups. Additionally, in September 2009, the EPA issued a final rule requiring the reporting of GHG emissions from specified large GHG emission sources in the U.S., including natural gas liquids fractionators and local natural gas/distribution companies, beginning in 2011 for emissions occurring in 2010. The EPA also plans to implement GHG emissions standards for power plants in May 2012 and for refineries in November 2012.
The adoption of legislation or regulatory programs to reduce GHG emissions could require us to incur increased operating costs, such as costs to purchase and operate emissions control systems, to acquire emissions allowances or comply with new regulatory requirements. Any GHG emissions legislation or regulatory programs applicable to power plants or refineries could also increase the cost of consuming, and thereby reduce demand for, the oil and natural gas we produce. Consequently, legislation and regulatory programs to reduce GHG emissions could have an adverse effect on our business, financial condition and results of operations.
Occupational safety and health act
We are also subject to the requirements of the federal Occupational Safety and Health Act, as amended ("OSHA") and comparable state laws that regulate the protection of the health and safety of employees. In addition, OSHA's hazard communication standard requires that information be maintained about hazardous materials used or produced in our operations and that this information be provided to employees, state and local government authorities and citizens. We believe that our operations are in substantial compliance with the OSHA requirements.
National environmental policy act
Oil and natural gas exploration and production activities on federal lands are subject to the National Environmental Policy Act ("NEPA"). NEPA requires federal agencies, including the Departments of Interior and Agriculture, to evaluate major agency actions having the potential to significantly impact the environment. In the course of such evaluations, an agency prepares an environmental assessment to evaluate the potential direct, indirect and cumulative impacts of a proposed project. If impacts are considered significant, the agency will prepare a more detailed environmental impact study that is made available for public review and comment. All of our current exploration and production activities, as well as proposed exploration and development plans, on federal lands require governmental permits that are subject to the requirements of NEPA. This environmental impact assessment process has the potential to delay the development of oil and natural gas projects. Authorizations under NEPA also are subject to protest, appeal or litigation, which can delay or halt projects.
108
Endangered species act
The Endangered Species Act ("ESA") was established to protect endangered and threatened species. Pursuant to the ESA, if a species is listed as threatened or endangered, restrictions may be imposed on activities adversely affecting that species' habitat. Similar protections are offered to migratory birds under the Migratory Bird Treaty Act. We conduct operations on federal oil and natural gas leases in areas where certain species that are listed as threatened or endangered and where other species, such as the sage grouse, potentially could be listed as threatened or endangered under the ESA exist. The U.S. Fish and Wildlife Service may designate critical habitat and suitable habitat areas that it believes are necessary for survival of a threatened or endangered species. A critical habitat or suitable habitat designation could result in further material restrictions to federal land use and may materially delay or prohibit land access for oil and natural gas development. If we were to have a portion of our leases designated as critical or suitable habitat, it could cause us to incur additional costs or become subject to operating restrictions or bans in the affected areas, which could adversely impact the value of our leases.
Summary
In summary, we believe we are in substantial compliance with currently applicable environmental laws and regulations. Although we have not experienced any material adverse effect from compliance with environmental requirements, there is no assurance that this will continue. We did not have any material capital or other non-recurring expenditures in connection with complying with environmental laws or environmental remediation matters in 2010 and the first six months of 2011, nor do we anticipate that such expenditures will be material in the remainder of 2011 and 2012.
Employees
As of October 1, 2011, we had 173 full-time employees. We also employed a total of 26 contract personnel who assist our full-time employees with respect to specific tasks and perform various field and other services. Our future success will depend partially on our ability to attract, retain and motivate qualified personnel. We are not a party to any collective bargaining agreements and have not experienced any strikes or work stoppages. We consider our relations with our employees to be satisfactory.
Our offices
Our executive offices are located at 15 W. Sixth Street, Suite 1800, Tulsa, Oklahoma 74119, and the phone number at this address is (918) 513-4570. Our website address is www.laredopetro.com. We expect to make our periodic reports and other information filed with or furnished to the SEC, available free of charge through our website as soon as reasonably practicable after those reports and other information are electronically filed with or furnished to the SEC. Information on our website or any other website is not incorporated by reference into, and does not constitute a part of, this prospectus.
Legal proceedings
From time to time, we are subject to various legal proceedings arising in the ordinary course of business, including proceedings for which we have insurance coverage. As of the date hereof, we are not party to any material legal proceedings.
109
Executive officers and directors
The following table sets forth information regarding the individuals who are currently serving as our executive officers and directors. The respective age of each individual in the table is as of October 1, 2011. There are no family relationships among any of our directors or executive officers.
| Name |
Age |
Position |
|||
|---|---|---|---|---|---|
Randy A. Foutch |
60 | Chairman and Chief Executive Officer | |||
Jerry R. Schuyler |
56 | Director, President and Chief Operating Officer | |||
W. Mark Womble |
60 | Senior Vice President and Chief Financial Officer | |||
Patrick J. Curth |
59 | Senior Vice President—Exploration and Land | |||
John E. Minton |
63 | Senior Vice President—Reservoir Engineering | |||
Rodney S. Myers |
58 | Senior Vice President—Permian | |||
Kenneth E. Dornblaser |
56 | Senior Vice President and General Counsel | |||
Peter R. Kagan |
43 | Director | |||
James R. Levy |
35 | Director | |||
B.Z. (Bill) Parker |
64 | Director | |||
Pamela S. Pierce |
56 | Director | |||
Ambassador Francis Rooney |
57 | Director | |||
Edmund P. Segner, III |
57 | Director | |||
Donald D. Wolf |
68 | Director | |||
The following table lists information regarding other key employees as of October 1, 2011:
| Name |
Age |
Position |
|||
|---|---|---|---|---|---|
Dan C. Schooley |
55 | Vice President—Marketing | |||
Dave M. Boncaldo |
47 | Vice President—Operations | |||
Jeffrey A. Tanner |
48 | Vice President—Exploration | |||
Mark W. King |
50 | Vice President—Land | |||
Mark H. Elliott |
56 | Vice President—Exploration and Land—Permian | |||
Diane T. Wood |
49 | Controller | |||
Randy A. Foutch is our founder and has served as our Chairman and Chief Executive Officer since that time. He also served as our President from October 2006 to July 2008. Mr. Foutch has over 30 years of experience in the oil and gas industry. Prior to our formation, Mr. Foutch founded Latigo Petroleum, Inc. ("Latigo") in 2001 and served as its President and Chief Executive Officer until it was sold to Pogo Producing Co. in May 2006. Previous to Latigo, Mr. Foutch founded Lariat Petroleum, Inc. ("Lariat") in 1996 and served as its President until January 2001 when it was sold to Newfield Exploration, Inc. He is currently serving on the board of directors of Helmerich & Payne, Inc. and is also a member of its audit, governance
110
and nominating and corporate committees. Mr. Foutch is also a member of the National Petroleum Council, America's Natural Gas Alliance and the Advisory Council of the Energy Institute at the University of Texas, Austin. From 2006 to August 2011, he served on the board of directors of Bill Barrett Corporation and from 2006 to 2008, on the board of directors of MacroSolve, Inc. Mr. Foutch also serves on several nonprofit and private industry boards. He holds a Bachelor of Science in Geology from the University of Texas and a Master of Science in Petroleum Engineering from the University of Houston.
Mr. Foutch has been successful in founding other oil and gas companies and serves in director positions of various oil and gas companies. As a result, he provides a strong operational and strategic background and has valuable business, leadership and management experience and insights into many aspects of the operations of exploration and productions companies. Mr. Foutch also brings financial expertise to the board, including his experience in obtaining financing for startup oil and gas companies. For these reasons, we believe Mr. Foutch is qualified to serve as a director.
Jerry R. Schuyler joined Laredo in June 2007 as Executive Vice President and Chief Operating Officer. In July 2008, he was promoted to President and Chief Operating Officer and has served in that capacity since that time. He is also one of our directors. Prior to joining Laredo, he held various executive positions with Atlantic Richfield Company ("ARCO"), Dominion Exploration and Production, Inc. and St. Mary Land & Exploration. While at St. Mary Land & Exploration from December 2003 to June 2007, he established their Houston and Midland offices and managed all exploration and production activities in the Gulf of Mexico, Gulf Coast and Permian areas. While at Dominion Exploration and Production, Inc. from March 2000 to July 2002, he managed all exploration and production activities in the Gulf Coast, Michigan and Appalachian areas. During his years with ARCO from 1977 to 1999, he held several key positions, such as Prudhoe Bay Field Manager, Manager of Worldwide Exploration and Production Planning and President of ARCO Middle East and Central Asia. Mr. Schuyler serves on several industry and college related boards of directors. He earned a Bachelor of Science degree in Petroleum Engineering from Montana Tech University and attended numerous graduate business courses at University of Houston.
Mr. Schuyler has significant experience managing oil and gas operations and serving in executive positions for various exploration and production companies and extensive knowledge of the energy industry. For these reasons, we believe Mr. Schuyler is qualified to serve as a director.
W. Mark Womble has served as our Chief Financial Officer and Senior Vice President since July 2007. Prior to joining Laredo, he was the Vice President and Chief Financial Officer of Latigo and served in this capacity from 2002 until the company was sold in May 2006. He then retired until joining Laredo in July 2007. Mr. Womble has more than 30 years of experience in the oil and natural gas industry and, throughout his career, has served as financial analyst, consultant and in several executive positions with multiple companies. He earned a Bachelor of Business Administration degree and a Master of Business Administration degree in finance and accounting from West Texas State University in Canyon, Texas.
Patrick J. Curth has served as our Senior Vice President—Exploration and Land since October 2006. He has been involved in exploration and development projects in the Mid-Continent area for over three decades. Prior to joining Laredo, Mr. Curth joined Latigo in 2000 as Exploration
111
Manager and served as Vice President—Exploration when Latigo was sold in May 2006. From 1997 to 2001, he was the Vice President—Exploration at Lariat. Mr. Curth holds a Bachelor of Arts in Geology from Windham College, a Masters Degree in Geological Sciences from the University of Wisconsin—Milwaukee and a second Masters Degree in Environmental Sciences from Oklahoma State University.
John E. Minton joined Laredo in October 2007 as Vice President—Reservoir Engineering and became Senior Vice President—Reservoir Engineering in September 2009. Before joining Laredo, Mr. Minton served as Senior Vice President of Reservoir Engineering at Rockford II Energy Partners from July 2006 to October 2007. In 2003, he joined Latigo as a Senior Reservoir Engineer and later became Manager of Corporate Reservoir Engineering. He served in this position until the company was sold in May 2006. He joined Lariat in 2000 as a Senior Reservoir Engineer and stayed with its successor Newfield Exploration until early 2003 as a Senior Reservoir Engineer. Mr. Minton is a member of the Society of Petroleum Engineers and has been a Registered Professional Engineer in the state of Oklahoma since 1982. He graduated from the University of Oklahoma with a Bachelor of Science degree in Mechanical Engineering.
Rodney S. Myers joined Laredo in November 2010 as Senior Vice President—Special Projects, and in September 2011 he assumed the newly created position of Senior Vice President—Permian. Immediately prior to joining Laredo, Mr. Myers came out of retirement in November 2009 to manage Sheridan Production Company's Mid-Continent District office in Tulsa, Oklahoma. Previously, from December 2002 until his retirement in May 2006, he served as the Senior Vice President and Chief Operating Officer of Latigo. Prior to Latigo, Mr. Myers spent over 13 years with Apache Corporation where he was Vice President for the Mid-Continent Region and Vice President of Production for its Central Region. Mr. Myers earned a Bachelor of Science degree in Petroleum Engineering from the University of Missouri at Rolla.
Kenneth E. Dornblaser joined Laredo in June 2011 as Senior Vice President and General Counsel. Immediately prior to joining Laredo, Mr. Dornblaser was a shareholder in the Johnson & Jones law firm, which he co-founded in March 1994. Prior to co-founding Johnson & Jones, Mr. Dornblaser had been engaged in the private practice of law in Tulsa, Oklahoma, since 1980. Mr. Dornblaser graduated from Oklahoma State University with a B.S. degree in Accounting and the University of Oklahoma where he received his Juris Doctorate degree.
Peter R. Kagan has served as one of our directors since July 2007. He has been with Warburg Pincus since 1997 where he leads the firm's investment activities in energy and natural resources. He is a Partner of Warburg Pincus & Co. and a Managing Director of Warburg Pincus LLC. He is also a member of Warburg Pincus' Executive Management Group. Mr. Kagan is currently on the board of directors of Antero Resources, China CBM Investment Holdings, Ltd., Fairfield Energy, MEG Energy, Canbriam Energy Inc., Targa Resources Inc. and Targa Resources Partners L.P. He previously served on the board of directors of Broad Oak, Lariat and Latigo. Mr. Kagan received a Bachelor of Arts degree cum laude from Harvard College and Juris Doctorate and Master of Business Administration degrees with honors from the University of Chicago.
Mr. Kagan has significant experience with energy companies and investments and broad familiarity with the industry and related transactions and capital markets activity, which enhance his contributions to the board of directors. For these reasons, we believe Mr. Kagan is qualified to serve as a director.
112
James R. Levy has served as one of our directors since May 2007. He joined Warburg Pincus in 2006 and focuses on investments in the energy industry. Prior to joining Warburg Pincus, he worked as an Associate at Kohlberg & Company, a middle market private equity investment firm, from 2002 to 2006, and as an Analyst and Associate at Wasserstein Perella & Co. from 1999 to 2002. Mr. Levy currently serves on the board of directors of EnStorage, Inc., a privately held energy storage system development company, and Suniva, Inc., a private company that manufactures solar cells for use in power generation, and Black Swan Energy Ltd, a privately held oil and gas exploration and production company. He is a former director of Broad Oak. Mr. Levy received a Bachelor of Arts in history from Yale University.
Mr. Levy has significant experience with investments in the energy industry and currently serves on the boards of various energy companies. For these reasons, we believe Mr. Levy is qualified to serve as a director.
B. Z. (Bill) Parker has served as one of our directors since May 2007. Mr. Parker joined Phillips Petroleum Company in 1970 where he held various engineering positions in exploration and production in the United States and abroad. He later served in numerous executive positions at Phillips Petroleum Company and in 2000, he was named Executive Vice President for Worldwide Production & Operations. He retired from Phillips Petroleum Company in this position in November 2002. Mr. Parker served on the board of Williams Partners GP from August 2005 to September 2010 where he also served as chairman of the conflicts and audit committees. He served on the board of directors of Latigo from January 2003 to May 2006 where he also served as chairman of the audit committee. Mr. Parker is a member of the Society of Petroleum Engineers. He received a Bachelor of Science degree in petroleum engineering from the University of Oklahoma.
Mr. Parker has over 40 years of experience in the oil and gas industry, having served in various engineering and executive positions for an exploration and production company and as a director and audit committee member for various energy companies. For these reasons, we believe Mr. Parker is qualified to serve as a director.
Pamela S. Pierce has served as one of our directors since May 2007. She has been a partner at Ztown Investments, Inc. since 2005, focused on investments in domestic oil and natural gas non-working interests. She also serves on the Michael Baker, Inc. board of directors and Scientific Drilling International, Inc. board of directors. From 2002 to 2004, she was the President of Huber Energy, an operating company of J.M. Huber Corporation. From 2000 to 2002, she was the President and Chief Executive Officer of Houston-based Mirant Americas Energy Capital and Production Company. She has also held a variety of managerial positions with ARCO Oil and Gas Company, ARCO Alaska and Vastar Resources. . She received a Bachelor of Science Degree in Petroleum Engineering from the University of Oklahoma and a Master of Business Administration in Corporate Finance from the University of Dallas.
Ms. Pierce is a highly experienced business executive with extensive knowledge of the energy industry. Her business acumen enhances the board of directors' discussions on all issues affecting us and her leadership insights contribute significantly to the board of directors' decision making process. For these reasons, we believe Ms. Pierce is qualified to serve as a director.
Ambassador Francis Rooney has served as one of our directors since February 2010. He has been the Chief Executive Officer of Rooney Holdings, Inc. since 1984, and of Manhattan
113
Construction Group, Tulsa, since 2008, which is engaged in road and bridge construction, civil works and building construction and construction management in the United States, Mexico and the Central America/Caribbean region. From 2005 through 2008, he served as the United States Ambassador to the Holy See, appointed by President George W. Bush. Ambassador Rooney currently serves on the boards of directors of Helmerich & Payne, Inc. and VETRA Energy Group, Bogota, Colombia. He is a member of the Board of Advisors of the Panama Canal Authority, Republic of Panama, the Board of the Florida Gulf Coast University Foundation, the INCAE Presidential Advisory Council and the Board of Visitors of the University of Oklahoma International Programs. Ambassador Rooney graduated from Georgetown University with a Bachelor of Arts and from Georgetown University Law Center with a Juris Doctorate. He is a member of the District of Columbia and Texas Bar Associations.
Ambassador Rooney has broad business and financial experience and has served as a director of public and private energy companies. For these reasons, we believe Ambassador Rooney is qualified to serve as a director.
Edmund P. Segner, III joined our board of directors in August 2011. Mr. Segner currently is a professor in the practice of engineering management in the Department of Civil and Environmental Engineering at Rice University in Houston, Texas, a position he has held since July 2006 and full time since July 2007. In 2008, Mr. Segner retired from EOG Resources, Inc. ("EOG"), a publicly traded independent oil and gas exploration and production company. Among the positions he held at EOG were President, Chief of Staff, and director from 1999 to 2007. From March 2003 through June 2007, he also served as the Principal Financial Officer of EOG. He has been a member of the board of directors of Bill Barrett Corporation, an oil and gas company primarily active in the Rocky Mountain region of the United States, since August 2009, and of Exterran Partners, L.P., a master limited partnership that provides natural gas contract operations services, since May 2009. From August 2009 until October 2011, Mr. Segner was a member of the board of directors of Seahawk Drilling, Inc., an offshore oil and natural gas drilling company. He also currently serves as a member of the board or as a trustee for several non-profit organizations. Mr. Segner graduated from Rice University with a Bachelor of Science degree in civil engineering and received an M.A. degree in economics from the University of Houston. He is a certified public accountant.
Mr. Segner's service as President, Principal Financial Officer and director of publicly traded oil and gas exploration and development companies provides our board of directors with a strong operational, financial, accounting and strategic background and provides valuable business, leadership and management experience and insights into many aspects of the operations of exploration and production companies. Mr. Segner also brings financial and accounting expertise to the board of directors, including through his experience in financing transactions for oil and gas companies, his background as a certified public accountant, his service as a Principal Financial Officer, his supervision of principal financial officers and principal accounting officers, and his service on the audit committees of other companies. For these reasons, we believe Mr. Segner is qualified to serve as a director
Donald D. Wolf has served as one of our directors since February 2010. Mr. Wolf currently serves as the Chairman of the general partner of QR Energy, LP., which is a master limited partnership operated by Quantum Resources Management. He was the Chief Executive Officer of Quantum Resources Management from 2006 to 2009. He served as President and Chief Executive Officer of Aspect Energy, LLC from 2004 to 2006. Prior to joining Aspect, Mr. Wolf
114
served as Chairman and Chief Executive Officer of Westport Resources Corporation from 1996 to 2004. He is currently a director of the general partner of MarkWest Energy Partners, L.P., Enduring Resources, LLC, Ute Energy, LLC, and Aspect Energy, LLC. Mr. Wolf graduated from Greenville College, Greenville, Illinois, with a Bachelor of Science in Business Administration.
Mr. Wolf has had a diversified career in the oil and natural gas industry and has served in executive positions for various exploration and production companies. His extensive experience in the energy industry brings substantial experience and leadership skill to the board of directors. For these reasons, we believe Mr. Wolf is qualified to serve as a director.
Dan C. Schooley joined Laredo in June of 2007 and is our Vice President—Marketing. In December 2006, Mr. Schooley came out of retirement to serve as the Vice President of gas supply at Superior Pipeline, a position he held until June 2007. From October 2004 until his retirement in May 2006, he was a marketing manager at Latigo, where he was responsible for marketing and risk management. Mr. Schooley holds Bachelors and Masters degrees from Oklahoma State University.
Dave M. Boncaldo joined Laredo in March 2010 as Production and Completions Manager and currently serves as Vice President—Operations. In January and February of 2010, Mr. Boncaldo worked as a contract engineer for Laredo. Between July 2009 and December 2009, Mr. Boncaldo was self-employed, evaluating oil and gas opportunities for himself and others. From July 1998 to June 2009, he served in various roles at Samson Resources including General Manager—East Texas Division, Operations Manager for the Mid-Continent Division and Team Manager for several different asset teams. Prior to Samson, he worked for Torch Energy Advisors as Operations Manager in Tulsa and the Black Warrior Basin along with various engineering positions in Houston. He began his career at BP Exploration (Tex/Con Oil & Gas Company) as an engineer with assignments in the Permian Basin and Louisiana Gulf Coast. He has over 25 years of experience in the oil and gas industry and holds a Bachelor of Science degree in Petroleum Engineering from Marietta College.
Jeffrey A. Tanner joined Laredo in October 2010 as Vice President—Exploration. From 2003 to September 2010, he was with Cabot Oil & Gas and worked various technical and managerial assignments, including Exploration Manager for two different regions tasked with expanding into unconventional shale plays. He has over 20 years of experience in the oil and natural gas industry. Mr. Tanner graduated from Texas A&M and the University of Houston with a Bachelors and Masters degree in Geology, respectively.
Mark W. King joined Laredo in April 2008 as Land Manager and currently serves as Vice President—Land, a position he has held since May 2011. From September 2004 to March 2008, he was the Vice President of Land at Orion Exploration, LLC. Prior to joining Orion Exploration, from September 1984 to September 2004, he was founder and Chief Executive Officer of Frontier Land Corp./Frontier Energy Leasing Service Inc., a full service land company that provided support for numerous major and mid-major oil and gas companies. He attended Oklahoma State University and Central State University.
Mark H. Elliott joined Laredo in May 2008 as Exploration Manager—Permian Basin and became Vice President—Midland in July, 2011 and Vice President—Exploration and Land—Permian, in September 2011. Before joining Laredo, Mr. Elliott served as Vice President of Geology & Exploration for Rex Energy Operating Company's Southwest Region from May 2007 to May 2008. From August 2006 to May 2007, he was a Senior Geologist at Cimarex Energy. In 2004, he
115
joined Latigo in the Midland office as a Senior Geologist. He served in this position until the company was sold in 2006. Mr. Elliott has more than 30 years experience in the oil and gas industry, and, throughout his career, has served in both staff and management positions. Mr. Elliott graduated from Thiel College with a Bachelor degree in Geology.
Diane T. Wood joined Laredo in October 2010 as Controller. Prior to joining Laredo, she was the Chief Financial Officer and Vice President—Finance for Cherokee Nation Businesses, LLC from December 2007 to June 2010. Between July and September 2010, Ms. Wood conducted an employment search which resulted in her position at Laredo. Immediately prior to her position with Cherokee Nation Businesses, LLC, Ms. Wood was an independent consultant from January 2007 until November 2007. She was the Chief Financial Officer for Genisoy Foods from September 2005 to December 2006. Ms. Wood's experience includes 10 years in public accounting, primarily performing audits of oil and gas companies, and 15 years of industry experience in oil and gas, consumer food products and acquisitions. Ms. Wood is a certified public accountant in the State of Oklahoma. Ms. Wood graduated from the University of Tulsa with a Bachelor of Science in Business Administration, with a degree in accounting.
Board of directors
Our board of directors consists of nine members, including our Chief Executive Officer and our President and Chief Operating Officer. The board of directors reviewed the independence of our directors using the independence standards of the NYSE and, based on this review, determined that Messrs. Kagan, Levy, Parker, Rooney, Segner, Wolf and Ms. Pierce are independent within the meaning of the NYSE listing standards currently in effect.
Because Warburg Pincus will own a majority of our outstanding common stock following the completion of this offering, we will be a "controlled company" as that term is set forth in Section 303A of the NYSE Listed Company Manual. Under the NYSE rules, a "controlled company" may elect not to comply with certain NYSE corporate governance requirements, including: (1) the requirement that a majority of our board of directors consist of independent directors, (2) the requirement that our nominating and governance committee be composed entirely of independent directors with a written charter addressing the committee's purpose and responsibilities, and (3) the requirement that our compensation committee be composed entirely of independent directors with a written charter addressing the committee's purpose and responsibilities. While these requirements will not apply to us as long as we remain a "controlled company," our board of directors will nonetheless consist of a majority of independent directors and our nominating and governance committee and compensation committee will consist entirely of independent directors within the meaning of the NYSE listing standards currently in effect. Prior to the consummation of this offering, our nominating and governance committee and compensation committee will each have a written charter addressing such committee's purpose and responsibilities in accordance with NYSE listing standards.
Initially, our board of directors will consist of a single class of directors each serving one year terms. Once Warburg Pincus no longer beneficially owns more than 50% of our issued and outstanding common stock, our board of directors will be divided into three classes of directors, with each class as nearly equal in number as possible, serving staggered three year terms, and such directors being removable only for "cause."
116
Committees of the board of directors
Our board of directors has an audit committee, a compensation committee and a nominating and governance committee, and may have such other committees as the board of directors shall determine from time to time. Each of the standing committees of the board of directors has the composition and responsibilities described below.
Audit committee
The members of our audit committee are Messrs. Parker, Levy and Wolf, each of whom our board of directors has determined is financially literate. Mr. Parker is the chairman of this committee. Our board of directors has determined that Mr. Wolf is the audit committee financial expert. It has further determined that Messrs. Parker and Wolf are "independent" under the standards of the New York Stock Exchange and SEC regulations. We will rely on the phase-in rules of the SEC and NYSE with respect to the independence of our audit committee. These rules permit us to have an audit committee that has one member that is independent upon the effectiveness of the registration statement of which this prospectus forms a part, a majority of members that are independent within 90 days thereafter and all members that are independent within one year thereafter.
This committee oversees, reviews, acts on and reports on various auditing and accounting matters to our board of directors, including: the selection of our independent accountants, the scope of our annual audits, fees to be paid to the independent accountants, the performance of our independent accountants and our accounting practices. In addition, the audit committee will oversee our compliance programs relating to legal and regulatory requirements. Prior to the consummation of this offering, we will adopt an audit committee charter defining the committee's primary duties in a manner consistent with the rules of the SEC and NYSE or market standards.
Compensation committee
The members of the compensation committee are Messrs. Wolf, Rooney, Kagan and Ms. Pierce. Mr. Wolf is the chairman of this committee. This committee establishes salaries, incentives and other forms of compensation for officers and other employees. Our compensation committee also administers our incentive compensation and benefit plans. Prior to the consummation of this offering, we will adopt a compensation committee charter defining the committee's primary duties in a manner consistent with the rules of the SEC and NYSE or market standards.
Nominating and governance committee
The members of our nominating and governance committee are Messrs. Rooney, Parker, Segner, Wolf and Ms. Pierce. Mr. Rooney is the chairman of this committee. This committee identifies, evaluates and recommends qualified nominees to serve on our board of directors, develops and oversees our internal corporate governance processes and maintains a management succession plan. Prior to the consummation of this offering, we will adopt a Nominating and Governance Committee charter defining the committee's primary duties in a manner consistent with the rules of the SEC and NYSE or market standards.
Compensation committee interlocks and insider participation
No member of our compensation committee has been at any time an employee of ours. None of our executive officers serve on the board of directors or compensation committee of a
117
company that has an executive officer that serves on our board or compensation committee. No member of our board is an executive officer of a company in which one of our executive officers serves as a member of the board of directors or compensation committee of that company.
Code of business conduct and ethics
Prior to the consummation of this offering, our board of directors will adopt a code of business conduct and ethics applicable to our employees, directors and officers, in accordance with applicable U.S. federal securities laws and the corporate governance rules of the NYSE. Any waiver of this code may be made only by our board of directors and will be promptly disclosed as required by applicable U.S. federal securities laws and the corporate governance rules of the NYSE. A copy of the code of business conduct and ethics will be available on our website at www.laredopetro.com prior to or upon completion of this offering. Information on our website or any other website is not incorporated by reference into, and does not constitute part of, this prospectus.
Corporate governance guidelines
Prior to the consummation of this offering, our board of directors will adopt corporate governance guidelines in accordance with the corporate governance rules of the NYSE, a copy of which will be available on our website at www.laredopetro.com prior to or upon completion of this offering. Information on our website or any other website is not incorporated by reference into, and does not constitute part of, this prospectus.
118
Compensation discussion and analysis
The following discussion and analysis contains statements regarding our and our named executive officers' future performance targets and goals. These targets and goals are disclosed in the limited context of our compensation programs and should not be understood to be statements of management's expectations or estimates of results or other guidance.
Introduction
The following compensation discussion and analysis describes the material elements of compensation for our named executive officers as determined by the compensation committee of Laredo Petroleum, LLC's board of directors (the "compensation committee") for the periods prior to the completion of this offering, as well as changes we intend to make in connection with this offering. In particular, this "Compensation discussion and analysis" (1) provides an overview of our historical and proposed compensation policies and programs; (2) explains our compensation objectives, policies and practices with respect to our executive officers; and (3) identifies the elements of compensation for each of the individuals identified in the following table, who we refer to in this "Compensation discussion and analysis" section as our "named executive officers."
Named executive officers
For the 2010 fiscal year, our named executive officers are:
| Name |
Principal position |
|
|---|---|---|
Randy A. Foutch |
Chairman and Chief Executive Officer | |
W. Mark Womble |
Senior Vice President and Chief Financial Officer | |
Jerry R. Schuyler |
President and Chief Operating Officer | |
Patrick J. Curth |
Senior Vice President—Exploration and Land | |
John E. Minton |
Senior Vice President—Reservoir Engineering | |
Messrs. Foutch and Womble are named executive officers by reason of their positions as the principal executive and financial officers of Laredo, and each of Messrs. Schuyler, Curth and Minton are named executive officers by reason of their being the three most highly compensated officers of Laredo other than Messrs. Foutch and Womble. Each of the named executive officers is an employee of Laredo Petroleum, Inc., which is a wholly-owned subsidiary of Laredo Petroleum, LLC, and an officer of both Laredo Petroleum, Inc. and Laredo Petroleum, LLC; however, each of the named executive officers is compensated by Laredo Petroleum, Inc., not Laredo Petroleum, LLC.
Administration of our compensation programs
During 2010, our executive compensation program was overseen by the compensation committee. The purpose of the compensation committee is to oversee the administration of compensation programs for all officers and employees of Laredo Petroleum, LLC and its subsidiaries, including Laredo Petroleum, Inc. Officer compensation is reviewed annually for possible adjustments by the compensation committee. After this offering, compensatory
119
arrangements with our named executive officers will remain the responsibility of our compensation committee.
The following discussion of our compensation programs and philosophy describes the material elements of compensation for our named executive officers as determined by the compensation committee for the periods prior to the completion of this offering. Based on input from the compensation consultant advising the compensation committee, we also highlight under the heading titled "—Other matters—Changes to our compensation program," material changes to our compensation program that we have adopted in connection with, and for periods continuing after, this offering and other changes adopted in 2011 by the compensation committee.
In addition, for a description of the corporate reorganization to be effected in connection with this offering, see "Corporate reorganization."
Compensation philosophy and objectives of our executive compensation program
Since our inception in 2006, we have sought to grow our privately owned energy company focused on the exploration and development of oil and natural gas in the Permian and Mid-Continent regions of the United States. Our compensation philosophy has been primarily focused on recruiting and motivating individuals to help us continue that growth. Our executive compensation program is designed to attract, retain and motivate our highly qualified and committed personnel by compensating them with both long-term incentive compensation in the form of equity based incentive awards and cash compensation comprised of salary and the possibility of annual bonuses. With respect to long-term incentive compensation, we provide our officers and certain other key employees an opportunity to invest in our equity on the same terms as our institutional equity investor and award profit units to all employees so they can benefit financially from the continued success of Laredo. Annual bonus amounts, which are entirely discretionary, reward our employees for overall company performance with consideration given to individual performance during the year relative to our continually evolving company objectives.
Although we strive to keep our executive officers' total cash compensation at levels that we believe are generally competitive with comparable positions of similar responsibility within our industry, no particular baseline (e.g., median or percentile) or particularized survey data has historically been employed for comparison or compensation-setting purposes. We periodically assessed the competitiveness of the compensation packages for our executive officers and made appropriate adjustments to our program when we deemed it necessary. Any adjustment to our executive officers' compensation requires the recommendation of the compensation committee and the approval of the board of directors.
In order to facilitate an effective transition into the new requirements we will face following consummation of this offering, over the course of the several months preceding this offering, we have undertaken various reporting company preparedness initiatives to ensure the competiveness of our executive compensation programs and further align the interests of our executive officers and other employees with the long-term objectives of Laredo. In particular, we engaged a compensation consultant to review the compensation we provide to our executive officers, recommend prospective compensation changes and identify potential areas where our compensation programs could be more competitive as discussed under the headings "Role of external advisors" and "—Other matters—Changes to our compensation program."
120
Implementing our objectives
Executive compensation decisions have historically been made on an annual basis by the compensation committee with input from Randy A. Foutch, our Chairman and Chief Executive Officer, Jerry R. Schuyler, our President and Chief Operating Officer, and W. Mark Womble, our Senior Vice President and Chief Financial Officer. Although the compensation committee considers the input received from these executive officers, compensation decisions are ultimately recommended by the compensation committee and approved by the board of directors.
From time to time, Messrs. Foutch, Schuyler and Womble obtained and reviewed external market information to assess Laredo's ability to provide competitive compensation packages to its executive officers and recommend an adjustment to the compensation levels, when necessary. In making executive compensation decisions and recommendations, Messrs. Foutch, Schuyler and Womble considered the executive officers' performance during the year and Laredo's performance during the year. Moreover, an executive officer's expanded role at Laredo could also serve as a basis for adjustment. Specifically, Messrs. Foutch, Schuyler and Womble provided recommendations to the compensation committee regarding the compensation levels for our existing executive officers (including themselves) and our compensation program as a whole. The compensation committee may adjust base salary levels and then determine the amounts of discretionary cash bonus awards and the amount of any equity grants for each of our executive officers.
While the compensation committee gave considerable weight to Messrs. Foutch, Schuyler and Womble's input on compensation matters, the board of directors, after considering the recommendations of the compensation committee, has the final decision making authority on all officer compensation matters. No other executive officers have assumed a role in the evaluation, design or administration of our executive officer compensation program.
Role of external advisors
In July 2011, our compensation committee engaged Cogent Compensation Partners, Inc. ("Cogent") to serve as its independent compensation advisor. Cogent does not currently provide any other services to Laredo. The compensation committee's objective when engaging Cogent was to assess our level of competitiveness for executive-level talent and provide recommendations for attracting, motivating and retaining key employees in light of our transition into the new obligations we will face as a SEC registrant. As part of its engagement, Cogent:
- •
- Collected and reviewed all relevant company information, including our historical executive compensation data and our
organizational structure, and conducted interviews with our executive officers and our institutional equity investor to gain insight into the vision, business strategy, culture and effectiveness of
our current executive compensation program as well as expectations for the future;
- •
- With the feedback from the compensation committee and management, established a peer group of companies to use for
executive compensation comparisons;
- •
- Developed a working compensation strategy upon which to base suggestions for going-forward program changes;
121
- •
- Developed a framework for annual and long-term incentive compensation programs;
- •
- Assessed the competitiveness of our compensation program's position relative to the market for our top executive officers
and our stated compensation philosophy; and
- •
- Prepared a report of its analyses, findings and recommendations for our executive and director compensation programs.
Cogent's report was presented to the board of directors as a whole in August 2011. The report was utilized by the compensation committee when making their recommendations to the board of directors for the compensation programs and adjustments to the current programs that were adopted in connection with, and for periods continuing after, this offering.
Competitive benchmarking
Cogent was engaged in part to assess the compensation levels of our top executive officers relative to the market and Laredo's peer group of companies, as set forth below. Cogent used the following parameters when constructing the peer group for its assessment: (1) resource-focused exploration and production companies that are publicly traded, (2) companies with a good performance track record, (3) companies with a strong management team with technical expertise, and (4) companies with revenue between $100 million and $1 billion. Using these parameters and collaborating with Messrs. Foutch, Schuyler and Womble and members of the compensation committee, Cogent developed and recommended a 17-company, industry reference peer group (the "Cogent Peer Group"), which was recommended by the compensation committee and approved by the board of directors. The Cogent Peer Group included the following companies:
- •
- Berry Petroleum Company
- •
- Bill Barrett Corporation
- •
- Brigham Exploration Company
- •
- Cabot Oil & Gas Corporation
- •
- Carrizo Oil & Gas, Inc.
- •
- Comstock Resources, Inc.
- •
- Concho Resources Inc.
- •
- Continental Resources, Inc.
- •
- EXCO Resources, Inc.
- •
- Forest Oil Corporation
- •
- LINN Energy LLC
- •
- Oasis Petroleum Inc.
- •
- Quicksilver Resources, Inc.
- •
- Range Resources Corporation
- •
- Sandridge Energy, Inc.
- •
- SM Energy Company
- •
- Swift Energy Company
Due to the broad responsibilities of our executive officers and our status as a privately-held company, comparing survey data to the job descriptions of our executive officers is sometimes difficult, although, as discussed above, our compensation objective is designed to be competitive with executives in comparable positions of similar responsibility within our industry.
122
Given Cogent's engagement and their analysis, described under the heading "—Other matters—Changes to our compensation program," compensation program changes were adopted by the board of directors so as to target base salary and annual incentive compensation around the market median, and long-term incentive compensation with the opportunity to earn between the median and upper quartile so that total direct compensation levels would be between the median and the upper quartile among the Cogent Peer Group. We believe that targeting this level of compensation helps us achieve our overall total rewards strategy and executive compensation objectives outlined above. The details of our ongoing compensation program, as adjusted, are discussed more fully under "—Other matters—Changes to our compensation program."
Elements of compensation
Compensation of our executive officers has historically included the following key components:
- •
- Base salaries;
- •
- Annual discretionary cash bonus awards, based primarily on the overall company performance, with consideration also given
to relative individual performance; and
- •
- Long-term equity-based incentive awards, based primarily on the relative contribution of various officer positions, with consideration given to relative individual performance.
Base salaries
Base salaries are designed to provide a fixed level of cash compensation for services rendered during the year. Base salaries are reviewed annually, at a minimum, but are not adjusted if the compensation committee believes that our executives are currently compensated at proper levels in light of either our internal performance or external market factors.
In addition to providing a base salary that we believe is competitive with other, similarly situated, independent oil and gas exploration and production companies, we also consider internal pay equity factors to appropriately align each of our named executive officer's salary levels relative to the salary levels of our other officers so that it accurately reflects the officer's relative skills, responsibilities, experience and contributions to Laredo. To that end, annual salary adjustments are based on a subjective analysis of many individual factors, including the:
- •
- responsibilities of the officer;
- •
- scope, level of expertise and experience required for the officer's position;
- •
- strategic impact of the officer's position;
- •
- potential future contribution of the officer; and
- •
- actual performance of the officer during the year.
In addition to the individual factors listed above, we also take into consideration our overall business performance and implementation of company objectives. While these factors generally provide context for making salary decisions, base salary decisions do not depend directly on attainment of specific goals or performance levels and no specific weighting is given to one factor over another.
123
In February 2010, the compensation committee approved a 5% base salary increase for John Minton in connection with his promotion to Senior Vice President—Reservoir Engineering and to adjust his base salary in order to provide him with fixed compensation comparable to market levels for similarly situated executives at the company. Messrs. Foutch, Womble, Schuyler and Curth did not receive a base salary increase during 2010. In February of 2011, the compensation committee approved a base salary increase of 3% for Messrs. Foutch, Womble, Schuyler and Curth and a 4% base salary increase for John Minton due to Laredo's performance during 2010 and in order to provide the named executive officers with fixed compensation comparable to market levels for similarly situated executives in the industry.
Annual discretionary cash bonus awards
Discretionary cash bonus awards are a key part of each named executive officer's annual compensation package. The compensation committee believes that discretionary cash bonuses are an appropriate way to further our goals of attracting, retaining and rewarding highly qualified and experienced officers. Discretionary cash bonuses are generally awarded annually following completion of the service year for which bonuses are payable and are based primarily on Laredo's performance for such service year, but consideration is also given to individual performance and specific contribution to Laredo's success and performance.
For the 2010 fiscal year, discretionary cash bonuses were determined in two parts at the sole discretion of the compensation committee for ultimate approval by the board of directors. 50% of the discretionary cash bonus awards for each named executive officer was determined by the 2010 Bonus Performance Metric Results described below, while the remaining 50% was subjectively determined by the compensation committee, while considering input provided by Mr. Foutch regarding individual performance factors such as leadership, commitment, attitude, motivational effect, level of responsibility and overall contribution to Laredo's success. Although our cash bonus program includes Laredo performance goals and objectives, our compensation committee has the ultimate discretion to recommend whether to award any, and the amount of, cash bonus awards, if any, even if the Bonus Performance Metric Results satisfy the Bonus Performance Metric Targets.
The 2010 Bonus Performance Metric Results consisted of the following performance metric categories and targets for Laredo (the targets reflected in Laredo's 2010 internal budget), with
124
the percentile as recommended by the compensation committee and approved by the board of directors:
| Performance metric |
2010 targets |
2010 results |
Relative weighting |
||||||||
|---|---|---|---|---|---|---|---|---|---|---|---|
Drilling Capital Efficiency ($/MCFE) |
$ | 2.88 | $ | 2.83 | 25% | ||||||
Calculated by dividing the drilling dollars spent by the net Proved Developed Producing (PDP) reserves added |
|||||||||||
Drilling ROR (%) |
20% | 25% | 25% | ||||||||
The rate of return on a well by well basis at pre-drill commodity prices and actual costs |
|||||||||||
Production (BCFE) |
17.5 | 18.6 | 15% | ||||||||
New Reserves (BCFE) |
51.4 | 68.8 | 15% | ||||||||
Proved Developed Producing (PDP) and Proved Developed Not Producing (PDNP) reserves added in the wells drilled in 2010 |
|||||||||||
Direct Lifting Cost ($/MCFE) |
$ | 0.52 | $ | 0.53 | 10% | ||||||
Finding Cost ($/MCFE) |
$ | 0.80 | $ | 0.94 | 10% | ||||||
The total exploration costs and developmental costs divided by the total proven reserves added during the year (BCFE) |
|||||||||||
The historical discretionary cash bonus target for all named executive officers has been 100% of their respective annual base salary. Based on Laredo's 2010 accomplishments and the 2010 performance results, Messrs. Foutch, Schuyler and Womble recommended to the compensation committee an average payout of 100% of the discretionary cash bonus target for the named executive officers. The compensation committee recommended, and the board of directors approved, a payout of 100% of the discretionary cash bonus target to Messrs. Foutch, Womble, Schuyler and Curth and a payout of 106% of the discretionary cash bonus target to Mr. Minton in connection with his promotion to Senior Vice President—Reservoir Engineering.
For the portion of the 2011 fiscal year preceding this offering, the performance metric categories include all of the 2010 performance metric categories and a General and Administrative Expenses performance metric category has been added. The relative weighting of the performance metric categories are reallocated each year as recommended by the compensation committee and approved by the board of directors.
Long-term equity based incentive awards
Our historical long-term equity-based incentive program was designed to provide our employees, including our named executive officers, with an incentive to focus on our long-term success and to act as a long-term retention tool by aligning the interests of our employees with those of our equityholders. We granted restricted units in Laredo Petroleum, LLC to our named executive officers and certain independent directors as a means of providing them with long-term equity incentive compensation that may directly profit from any success we achieve. This structure enabled us to identify a fixed number of restricted units on which distributions will flow through Laredo Petroleum, LLC to our named executive officers and directors. The grant of some of Laredo Petroleum, LLC's Series B-1, Series B-2, Series C, Series D and Series E
125
Units (collectively, the "restricted units") were awarded at least annually, at the discretion of the compensation committee, and were based primarily on the relative value of each named executive officer's position, with consideration given to their individual performance. Specifically, individual performance factors such as leadership, commitment, attitude, motivational effect, level of responsibility and overall contribution to Laredo's success were also considered.
On February 1, 2010 we granted certain Laredo Petroleum, LLC Series D Units to each of our named executive officers pursuant to certain restricted unit agreements. These restricted units are intended to constitute "profits interests" in Laredo Petroleum, LLC that will participate solely in any future profits and distributions of Laredo Petroleum, LLC. The allocation of numbers of restricted units in Laredo Petroleum, LLC that were granted to each named executive officer was determined at levels that primarily considered the relative importance of each executive's position with Laredo, the maintenance of their percentage ownership of the relevant series of restricted units, as well as each executive's performance and contribution to Laredo, as described above. The outstanding restricted units by series as of December 31, 2010 were as follows: 5,615,400 Series B-1 Units, 2,383,000 Series B-2 Units, 7,260,000 Series C Units, 9,611,600 Series D Units and 6,562,000 Series E Units. Therefore, the aggregate amount of outstanding restricted units as of December 31, 2010 was 31,432,000.
The restricted units have a four year vesting schedule, vesting 20% on the grant date and 20% on each of the next four anniversaries of the grant date. Pursuant to the restricted unit agreement executed by Laredo Petroleum, LLC and each named executive officer, in the event of a termination of employment for cause, the named executive officer will forfeit all restricted units to Laredo Petroleum, LLC, including unvested restricted units and vested restricted units, and all rights arising from such restricted units and from being a holder thereof. In the event of a termination of employment without cause or an officer's resignation, the named executive officer will forfeit all unvested restricted units to Laredo Petroleum, LLC and all rights arising from such restricted units and from being a holder thereof. In the event of a termination without cause or an officer's resignation, we may elect to redeem his vested restricted units at a price equal to the fair market value of such units.
If the named executive officer's employment with Laredo is terminated upon the death of the named executive officer or because the named executive officer is determined to be disabled by the board of directors, then all unvested units held by the named executive officer will automatically vest. Under the restricted unit agreement, a named executive officer will be considered to have incurred a "disability" in the event of the officer's inability to perform, even with reasonable accommodation, on a full-time basis the employment duties and responsibilities due to accident, physical or mental illness, or other circumstance; provided, however, that such inability continues for a period exceeding 180 days during any 12-month period.
For a discussion of the treatment of our long-term equity based incentive awards as a result of this offering, see "Corporate reorganization."
Other benefits
- •
- Health and welfare benefits. Our named executive officers are eligible to participate in all of our employee health and welfare benefit plans on the same basis as other employees (subject to applicable law) to meet their health and welfare needs. These plans include
126
medical and dental insurance, as well as medical and dependent care flexible spending accounts. These benefits are provided in order to ensure that we are able to competitively attract and retain officers and other employees. This is a fixed component of compensation, and these benefits are provided on a non-discriminatory basis to all employees.
- •
- Retirement benefits. Our named executive officers also participate in our 401(k) defined contribution plan on the same
basis as our other employees. The plan allows eligible employees to make tax-deferred contributions up to 100% of their annual compensation, not to exceed annual limits established by the
federal government. We make matching contributions of up to 6% of an employee's compensation and may make additional discretionary contributions.
- •
- Perquisites. We believe that the total mix of compensation and benefits provided to our executive officers is currently
competitive and, therefore, perquisites should not play a significant role in our executive officers' total compensation.
- •
- Other benefits. As described in detail in "Certain relationships and related party transactions—Other related party transactions," our board of directors has adopted an aircraft use policy for Mr. Foutch, whereby his personally owned aircraft can be used for business travel, subject to certain conditions. For safety reasons, we reimburse or pay for certain operational expenses, such as the training and certification expenses of Mr. Foutch and the cost of aircraft safety and mechanical inspections. These paid-for expenses, however, represent only a partial refund of the total costs and expenses of operating the aircraft. For further details, see the Summary Compensation Table below and "Certain relationships and related party transactions—Other related party transactions."
Employment, severance or change in control agreements
We do not currently maintain any employment agreements. Following the offering, we intend to adopt a change in control severance policy that will cover our named executive officers and eligible vice presidents, as selected by our compensation committee.
Other matters
Risk assessment
The compensation committee has reviewed our compensation policies as generally applicable to our employees and believes that our policies do not encourage excessive and unnecessary risk-taking, and that the level of risk that they do encourage is not reasonably likely to have a material adverse effect on us.
Our compensation philosophy and culture support the use of base salary, discretionary cash bonuses and long-term incentive restricted unit compensation that are generally uniform in design and operation throughout our organization and with all levels of employees. In addition, the following specific factors, in particular, reduce the likelihood of excessive risk-taking:
- •
- Our overall compensation levels are competitive with the market; and
- •
- Our compensation mix is balanced among (i) fixed components like base salary and benefits, (ii) discretionary cash bonuses and (iii) long-term incentive units that reward our employees
127
based on long-term overall financial performance, operational measures and individual performance.
Furthermore, we provide our officers the opportunity to invest in our equity, and all of our named executive officers have made such an investment, thereby aligning their interests with those of our equity holders.
In summary, because the compensation committee focuses on Laredo's performance, with only some consideration given to the specific individual performance of the employee when making compensation decisions, we believe our historical compensation programs did not encourage excessive and unnecessary risk taking by executive officers (or other employees). These programs were designed to encourage employees to remain focused on both our short and long-term operational and financial goals. We set performance goals that we believe were reasonable in light of our past performance and market conditions.
Changes to our compensation program
Actions taken after the 2010 fiscal year
Base salaries: As mentioned above under "—Compensation discussion and analysis—Elements of compensation—Base salaries", during 2011, the compensation committee approved a base salary increase of 3% for Messrs. Foutch, Womble, Schuyler and Curth and a 4% base salary increase for John E. Minton due to Laredo's performance during 2010 and in order to provide the named executive officers with fixed compensation comparable to market levels for similarly situated executive officers in the industry.
Annual discretionary cash bonus awards: As mentioned above under "—Compensation discussion and analysis—Elements of compensation—Annual discretionary cash bonus awards", for the portion of the 2011 fiscal year preceding this offering, the performance metric categories for the annual discretionary cash bonus awards will include all of the 2010 performance metric categories and a General and Administrative Expenses performance metric category will be added. The relative weighting of the performance metric categories are reallocated each year as recommended by the compensation committee and approved by the board of directors.
Adjustments to compensation program proposed by Cogent: After a review of our current compensation practices and survey of the Cogent Peer Group, Cogent proposed a number of changes to base salary as well as annual and long-term incentive targets, that are intended to provide more typical public company base salary and incentive arrangements as compared to the Cogent Peer Group. Cogent proposed that the following changes be adopted:
Base salary
| Name |
Current salary |
Proposed salary |
|||||
|---|---|---|---|---|---|---|---|
Randy A. Foutch |
$ | 466,800 | $ | 600,000 | |||
W. Mark Womble |
$ | 275,000 | $ | 350,000 | |||
Jerry R. Schuyler |
$ | 315,000 | $ | 375,000 | |||
Patrick J. Curth |
$ | 275,000 | $ | 330,000 | |||
John E. Minton |
$ | 230,000 | $ | 260,000 | |||
128
Based on these proposals, the compensation committee recommended, and the board of directors approved, increases in the base salaries of our executive officers as shown in the table above, effective as of September 1, 2011. The rationale for increasing base salaries was to adjust base salaries to approximately the median of the Cogent Peer Group, consistent with our compensation strategy. Cogent reported that prior to the adjustments, current base salaries of Laredo's named executive officers were approximately 85% of the market median.
Incentive compensation
Cogent also proposed setting annual incentive targets and long-term incentive targets as a percentage of base salary, and assumes (for purposes of the annual incentive plan) that Laredo adopt a more traditional performance-based annual bonus plan. Cogent's suggestion for a new annual incentive plan includes determining the bonus calculation as follows: 50% based on financial metrics and individual performance and 50% based on operational metrics. The chart below shows the new target award levels for each named executive under the annual and long-term incentive programs.
| Name |
Annual incentive target |
Long-term incentive target |
|||||
|---|---|---|---|---|---|---|---|
Randy A. Foutch |
100% of Base Salary | 450% of Base Salary | |||||
W. Mark Womble |
80% | 275% | |||||
Jerry R. Schuyler |
85% | 275% | |||||
Patrick J. Curth |
70% | 275% | |||||
John E. Minton |
60% | 150% | |||||
Based on these proposals, the compensation committee recommended, and the board of directors approved, an annual bonus program that provides for 50% of a named executive officer's annual incentive to be non-formulaic at the compensation committee's discretion, based on the company's performance relative to such factors as, without limitation, EBITDA and cash flow amounts, relative total shareholder return, individual performance and such other factors as may be determined by the compensation committee to be appropriate, and 50% to be determined based upon pre-established performance criteria consisting of the following operational metrics: (i) drilling capital efficiency, (ii) drilling ROR (%), (iii) production, (iv) new reserves, (v) direct lifting costs, (vi) finding costs, and (vii) general and administrative expense.
Threshold, target and maximum annual incentives under this newly adopted program have not been established for our named executive officers for the 2011 fiscal year or any period following the offering. Target incentive levels for each executive are listed above. Award levels are calculated on a threshold level of 50% of target and a maximum of 200% of target.
Adoption of long-term incentive plan: The compensation committee recommended and the board of directors approved the adoption of a new long-term incentive plan that provides for performance awards, restricted stock and stock options to eligible employees. Performance units and restricted stock awards would cliff vest after three years based on service while stock options would vest ratably over four years based on service. For the performance unit awards, company performance that reaches the 40th percentile of the Relative Total Shareholder Return Goal would result in a target performance payout of 50% of the target award level, a 60th percentile achievement would result in a target performance payout of 100% of the target award level and an 80th percentile achievement would result in a maximum performance
129
payout of 200% of the target award level. Based on these proposals, the compensation committee recommended, and the board of directors approved, the Laredo Petroleum Holdings, Inc. 2011 Omnibus Equity Incentive Plan, effective as of the date of this offering.
Target long-term incentives under this newly adopted program have not been established for our named executive officers for the 2011 year or any period following the offering.
Adoption of change in control severance policy: Cogent proposed the adoption of, and Laredo intends to adopt, a change in control severance policy that would cover our named executive officers and eligible vice presidents, as selected by our compensation committee. The new policy would provide an eligible participant with a lump sum cash severance payment and continued health benefits in the event that the participant experiences a qualifying termination within the one year period following the occurrence of a qualifying change in control event.
Recent grants of restricted units: On July 1, 2011, the limited liability company agreement of Laredo Petroleum, LLC was amended and restated. The amendment and restatement, among other things, created three new series of incentive units, which are subject to the same vesting requirements as the other restricted units. On August 10, 2011, Laredo granted an aggregate of approximately 5.3 million Series F Units to legacy Laredo employees, including to the named executive officers, and approximately 1.3 million Series G Units and approximately 0.9 million BOE Incentive Units to certain new employees from Broad Oak, all of which were authorized pursuant to the limited liability company agreement. For a description of the corporate reorganization to be effected in connection with this offering, see "Corporate reorganization".
Equity ownership guidelines
The compensation committee recommended and the board of directors approved stock ownership guidelines for directors and the executive management team in order to further align the interest of our directors and officers with those of our stockholders. Effective as of the consummation of this offering, individuals have three years to reach the following stock ownership guidelines (as a multiple of base salary): (i) Chief Executive Officer: 5x, (ii) Chief Operating Officer and Executive Vice President: 3x, (iii) Senior Vice President: 2x, (iv) Vice President: 1x and (v) directors: $400,000 worth of company stock. Stock actually owned, as well as stock awarded under restricted stock awards, are included for purposes of satisfying these guidelines. No stock potentially exercisable under stock options is included.
Tax and accounting implications
Internal Revenue Code Section 162(m) denies a federal income tax deduction for certain compensation in excess of $1 million per year paid to the chief executive officer and the three other most highly-paid executive officers (other than the chief executive officer and chief financial officer) of a publicly-traded corporation. Certain types of compensation, including compensation based on performance criteria that are approved in advance by stockholders, are excluded from the deduction limit. In addition, "grandfather" provisions may apply to certain compensation arrangements that were entered into by a corporation before it was publicly held. In view of these grandfather provisions, we believe that Section 162(m) of the Internal Revenue Code will not limit our tax deductions for executive compensation for the first three fiscal years following the consummation of the offering. Going forward, our policy is to qualify compensation paid to our executive officers for deductibility for federal income tax purposes to the extent feasible. However, to retain highly skilled executives and remain competitive with
130
other employers, the compensation committee will have the right to authorize compensation that would not otherwise be deductible under Section 162(m) or otherwise.
Compensation committee report
Our Compensation Committee has reviewed and discussed the Compensation Discussion and Analysis required by Item 402(b) of Regulation S-K with management and, based on such review and discussions, the Compensation Committee recommended to the board of directors that the Compensation Discussion and Analysis be included in this prospectus.
The Compensation Committee
Donald D. Wolf, Chairman
Ambassador Francis Rooney
Peter R. Kagan
Pamela S. Pierce
Summary compensation
The following table summarizes, with respect to our named executive officers, information relating to the compensation earned for services rendered in all capacities during the fiscal year ended December 31, 2010.
Summary compensation table for the year ended December 31, 2010
| Name and principal position |
Salary ($)(1) |
Bonus ($) |
Stock awards ($)(2)(3) |
All other compensation ($)(4) |
Total ($) |
||||||||||||
|---|---|---|---|---|---|---|---|---|---|---|---|---|---|---|---|---|---|
Randy A. Foutch, |
452,100 | 453,200 | 0 | 183,408 | (5) | 1,088,708 | |||||||||||
Chairman and Chief Executive Officer |
|||||||||||||||||
W. Mark Womble, |
266,350 | 267,000 | 0 | 17,022 | 550,372 | ||||||||||||
Senior Vice President and Chief Financial Officer |
|||||||||||||||||
Jerry R. Schuyler, |
305,158 | 305,900 | 0 | 17,022 | 628,080 | ||||||||||||
President and Chief Operating Officer |
|||||||||||||||||
Patrick J. Curth, |
266,350 | 267,000 | 0 | 17,022 | 550,372 | ||||||||||||
Senior Vice President—Exploration and Land |
|||||||||||||||||
John E. Minton, |
220,083 | 235,000 | 0 | 16,983 | 472,066 | ||||||||||||
Senior Vice President—Reservoir Engineering |
|||||||||||||||||
(1) We review compensation in the first quarter of each fiscal year. Salary amounts in this table reflect the actual base salary payments earned in 2010.
(2) We awarded restricted unit awards to our named executive officers, which we describe above under the heading "—Compensation discussion and analysis—Elements of compensation—Long-term equity based incentive awards."
(3) The amounts reported under "Stock Awards" reflect the aggregate grant date fair value for restricted units granted to our named executive officers during the fiscal year ended December 31, 2010, calculated in accordance with FASB Accounting Standards Codification ("ASC") topic 718 ("ASC 718"), Compensation—Unit Compensation. The restricted units vest 20% on the grant date and 20% on each of the next four anniversaries of the grant date. The valuation assumptions used in determining
131
these amounts are the present value of our proved reserves based on future prices, adjusted for the current market value of our other non-oil and gas assets and liabilities, and other subjective assumptions (see Note F in our audited combined financial statements included elsewhere in this prospectus for further information).
(4) Includes the aggregate value of matching contributions to our 401(k) plan and the dollar value of life insurance coverage during 2010.
(5) During 2010, $166,386 represents the portion of the expenses paid by us which would otherwise have been paid by Mr. Foutch for the use of his personally owned aircraft not directly related to business. These payments represent only a partial refund of the total costs and expenses of flying the aircraft. For further details, see "Certain relationships and related party transactions—Other related party transactions."
Grants of plan-based awards for fiscal year 2010
The following table provides information concerning each restricted unit award (referred to in the table as "stock awards") granted to our named executive officers under any plan that has been transferred during the fiscal year ended December 31, 2010.
Grants of plan-based awards table for the year ended December 31, 2010
| Name |
Grant date |
All other stock awards(1) |
Grant date fair value of stock and option awards(2) |
|||||||
|---|---|---|---|---|---|---|---|---|---|---|
| |
|
(#) |
($) |
|||||||
Randy A. Foutch |
2/1/2010 | 1,476,000 | 0 | |||||||
W. Mark Womble |
2/1/2010 | 268,000 | 0 | |||||||
Jerry R. Schuyler |
2/1/2010 | 468,000 | 0 | |||||||
Patrick J. Curth |
2/1/2010 | 289,000 | 0 | |||||||
John E. Minton |
2/1/2010 | 135,000 | 0 | |||||||
(1) Represents the number of Series D Units in Laredo Petroleum, LLC granted pursuant to the restricted unit agreement. The restricted units vest ratably over four years at each anniversary of the grant. For more information concerning these awards, see the discussion above in "—Compensation discussion and analysis—Elements of compensation—Long-term equity based incentive awards".
(2) See footnote 3 to the Summary Compensation Table for a description of the calculation of the grant date fair value for the equity awards.
For more information concerning our equity, consisting of the preferred units and the restricted units, see Notes E and F in our audited combined financial statements included elsewhere in this prospectus.
Narrative disclosure to summary compensation table and grants of plan-based awards table
The following is a discussion of material factors necessary to an understanding of the information disclosed in the Summary compensation table and the Grants of plan-based awards table set forth above.
Restricted stock awards
The stock awards reflected above in the "Grants of plan-based awards table" consists of Series D Units in Laredo Petroleum, LLC. These restricted units are intended to constitute "profits interests" in Laredo Petroleum, LLC that will participate solely in any future profits and distributions of Laredo Petroleum, LLC. The allocation of numbers of restricted units in Laredo Petroleum, LLC that were granted to each named executive officer was determined at levels that primarily considered the relative importance of each executive's title and position with
132
Laredo, the maintenance of their percentage ownership of the relevant series of restricted units, as well as each executive's performance and contribution to Laredo. Absent a termination of employment prior to full vesting of the restricted units, the restricted units have a four year vesting schedule, vesting 20% on the grant date and 20% on each of the next four anniversaries of the grant date.
Base salary and discretionary cash bonus awards in proportion to total compensation
The following table sets forth the approximate percentage of each named executive officer's total compensation that we paid in the form of base salary and cash bonus awards during fiscal 2010. We view the various components of compensation as related but distinct, and emphasize "performance" with significant portions of the total compensation tied to short- and long-term financial and strategic goals, currently in the form of base salaries, annual discretionary cash bonus awards and long-term equity based incentive awards. Our compensation philosophy is designed to align the interests of our employees with those of our equity holders. While the current value of the cash compensation components outweighs the current value of the incentive-based grant of the restricted units, this proportion does not reflect the concept that the future value of our equity is an incentive for the long-term success of Laredo. For more information regarding the restricted unit awards, see the "Grants of plan-based awards table" above. We also attempt to set each officer's base salary in line with comparable positions with our peers and to award an annual cash bonus based on the achievement of overall company strategic goals and each individual's relative contribution to those goals.
| Name |
Percentage of total compensation |
|||
|---|---|---|---|---|
Randy A. Foutch |
83% | |||
W. Mark Womble |
97% | |||
Jerry R. Schuyler |
97% | |||
Patrick J. Curth |
97% | |||
John E. Minton |
96% | |||
133
Outstanding equity awards at 2010 fiscal year-end
The following table provides information concerning restricted unit awards that had not vested for our named executive officers as of December 31, 2010.
Outstanding equity awards table as of December 31, 2010
| Name |
Shares/units not vested(1)(2) |
Market value of shares/units not vested(3) |
||||||
|---|---|---|---|---|---|---|---|---|
| |
(#) |
($) |
||||||
Randy A. Foutch |
||||||||
Series B-1 |
470,000 | 0 | ||||||
Series B-2 |
334,000 | 0 | ||||||
Series C |
820,000 | 0 | ||||||
Series D |
2,059,800 | 0 | ||||||
Series E |
1,602,000 | 0 | ||||||
W. Mark Womble |
||||||||
Series B-1 |
97,200 | 0 | ||||||
Series B-2 |
60,400 | 0 | ||||||
Series C |
220,000 | 0 | ||||||
Series D |
374,000 | 0 | ||||||
Series E |
399,000 | 0 | ||||||
Jerry R. Schuyler |
||||||||
Series B-1 |
170,200 | 0 | ||||||
Series B-2 |
108,800 | 0 | ||||||
Series C |
380,000 | 0 | ||||||
Series D |
653,400 | 0 | ||||||
Series E |
684,000 | 0 | ||||||
Patrick J. Curth |
||||||||
Series B-1 |
93,800 | 0 | ||||||
Series B-2 |
65,600 | 0 | ||||||
Series C |
190,000 | 0 | ||||||
Series D |
403,400 | 0 | ||||||
Series E |
285,000 | 0 | ||||||
John E. Minton |
||||||||
Series B-1 |
40,000 | 0 | ||||||
Series B-2 |
20,000 | 0 | ||||||
Series C |
70,000 | 0 | ||||||
Series D |
186,000 | 0 | ||||||
Series E |
90,000 | 0 | ||||||
(1) Represents the number of restricted units in Laredo Petroleum, LLC granted pursuant to the restricted unit agreement. For more information concerning these restricted unit awards, see the discussion above under "—Compensation discussion and analysis—Elements of compensation—Long-term equity based incentive awards". As described below under "—Compensation discussion and analysis—Potential payments upon termination or change of control", the restricted unit awards may terminate upon the officer's termination of employment. Please see footnote 2 below for a description of the vesting schedule for the awards that remained outstanding as of December 31, 2010.
(2) The restricted units have a four year vesting schedule, vesting 20% on the grant date and 20% on each of the next four anniversaries of the grant date.
134
(3) The market value was calculated in accordance with ASC 718, Compensation—Unit Compensation. The assumptions used in determining market value included the present value of our proved reserves based on future price, adjusted for the current market value of our other non-oil and gas assets and liabilities, and other subjective assumptions.
For more information concerning our equity, consisting of the preferred units and the restricted units, see Notes E and F in our audited combined financial statements included elsewhere in this prospectus.
Registration Rights
Upon the consummation of the corporate reorganization, we will become a party to a registration rights agreement pursuant to which we will grant certain registration rights to the members of Laredo Petroleum, LLC that receive shares of our common stock in the corporate reorganization. Pursuant to the lock-up agreements, certain of these stockholders have agreed not to exercise those rights during the lock-up period following this offering without the prior written consent of J.P. Morgan Securities LLC, Goldman, Sachs & Co. and Merrill Lynch, Pierce, Fenner & Smith Incorporated. See "Underwriting (conflicts of interest)" for a description of these lock-up provisions.
Units vested in fiscal year 2010
The following table provides information concerning the vesting of restricted unit awards (referred to in the table as "stock awards"), during fiscal 2010 on an aggregated basis with respect to each of our named executive officers.
135
Stock vested for the year ended December 31, 2010
| |
Stock awards | |||||||
|---|---|---|---|---|---|---|---|---|
| Name |
Shares acquired on vesting(1) |
Value realized on vesting(2) |
||||||
| |
(#) |
($) |
||||||
Randy A. Foutch |
||||||||
Series B-1 |
405,000 | 0 | ||||||
Series B-2 |
167,000 | 0 | ||||||
Series C |
560,000 | 0 | ||||||
Series D |
588,200 | 0 | ||||||
Series E |
534,000 | 0 | ||||||
W. Mark Womble |
||||||||
Series B-1 |
73,600 | 0 | ||||||
Series B-2 |
30,200 | 0 | ||||||
Series C |
140,000 | 0 | ||||||
Series D |
106,800 | 0 | ||||||
Series E |
133,000 | 0 | ||||||
Jerry R. Schuyler |
||||||||
Series B-1 |
126,600 | 0 | ||||||
Series B-2 |
54,400 | 0 | ||||||
Series C |
240,000 | 0 | ||||||
Series D |
186,600 | 0 | ||||||
Series E |
228,000 | 0 | ||||||
Patrick J. Curth |
||||||||
Series B-1 |
79,400 | 0 | ||||||
Series B-2 |
32,800 | 0 | ||||||
Series C |
120,000 | 0 | ||||||
Series D |
115,200 | 0 | ||||||
Series E |
95,000 | 0 | ||||||
John E. Minton |
||||||||
Series B-1 |
30,000 | 0 | ||||||
Series B-2 |
10,000 | 0 | ||||||
Series C |
40,000 | 0 | ||||||
Series D |
53,000 | 0 | ||||||
Series E |
30,000 | 0 | ||||||
(1) The number of shares acquired on vesting represents the gross number of units vested. There were no payroll taxes withheld from these awards.
(2) The value realized upon vesting was the gross number of units vested multiplied by the fair market value of the units. The fair market value of the units as of December 31, 2010 was $0.00. The value was calculated in accordance with ASC 718, Compensation—Unit Compensation. The valuation assumptions used in determining these amounts were the present value of our proved reserves based on future prices, adjusted for the current market value of our other non-oil and gas assets and liabilities, and other subjective assumptions.
Pension benefits
We maintain a 401(k) Plan for our employees, including our named executive officers, but at this time we do not sponsor or maintain a pension plan for any of our employees.
136
Nonqualified deferred compensation
We do not provide a deferred compensation plan for our employees at this time.
Potential payments upon termination or change in control
As described above, we do not maintain individual employment agreements. Following this offering, we intend to enter into severance agreements or change in control agreements with the named executive officers.
Each of the named executive officers has been awarded restricted units by Laredo Petroleum, LLC that may be affected by the officer's termination of employment or the occurrence of certain corporate events. As mentioned above under the heading "—Compensation discussion and analysis—Elements of compensation—Long-term equity based incentive awards," pursuant to the restricted unit agreement executed by Laredo Petroleum, LLC and each named executive officer, in the event of a termination of employment for cause, the named executive officer will forfeit all restricted units to Laredo Petroleum, LLC, including unvested restricted units and vested restricted units, and all rights arising from such restricted units and from being a holder thereof. In the event of a termination of employment without cause or an officer's resignation, the named executive officer will forfeit all unvested restricted units to Laredo Petroleum, LLC and all rights arising from such restricted units and from being a holder thereof. For a period of one year from the date of termination of the named executive officer's employment, in the event of a termination of employment for cause, we may also elect to redeem his Series A-1 Units and Series A-2 Units (collectively, the "preferred units") at a price per unit equal to the lesser of the fair market value or original purchase price. In the event of a termination without cause or an officer's resignation, we may elect to redeem his preferred units and vested restricted units at a price equal to the fair market value of such units.
If the named executive officer's employment with Laredo is terminated upon the death of the named executive officer or because the named executive officer is determined to be disabled by the board of directors, then all of his unvested restricted units will automatically vest. Under the restricted unit agreement, a named executive officer will be considered to have incurred a "disability" in the event of the officer's inability to perform, even with reasonable accommodation, on a full-time basis the employment duties and responsibilities due to accident, physical or mental illness, or other circumstance; provided, however, that such inability continues for a period exceeding 180 days during any 12-month period.
Pursuant to the restricted unit agreement executed by Laredo Petroleum, LLC and each named executive officer, in the event of a change of control, all unvested restricted units will become fully vested as of the date of the change of control, provided that the named executive officer remains employed by Laredo Petroleum, Inc. through the date of such change of control. According to the limited liability company agreement of Laredo Petroleum, LLC, a "change of control" generally includes the occurrence of (i) at any time prior to a qualified public offering (which is defined to be any firm commitment underwritten initial public offering of equity securities pursuant to an effective registration statement of at least $100,000,000, whereby such equity securities are authorized and approved for listing on the New York Stock Exchange or admitted to trading and quoted in the Nasdaq Global Market system), the holders of preferred units dispose of in the aggregate 80% of the outstanding preferred units by way of unit disposition or pursuant to any merger or other business combination of Laredo
137
Petroleum, LLC, (ii) at any time after a qualified public offering, any person acquires beneficial ownership of securities of Laredo Petroleum, LLC, or any of its subsidiaries, representing 40% or more of the combined voting power of the outstanding securities (provided, however, that if the surviving entity becomes a subsidiary of another entity, then the outstanding securities shall be deemed to refer to the outstanding securities of the parent entity), (iii) at any time after a qualified public offering, a majority of the members of the board of directors who served on the date of the qualified public offering no longer serve as directors; or (iv) at any time after a qualified public offering, the consummation of a merger or consolidation of the IPO issuer with any other corporation, other than a merger or consolidation which would result in the voting securities of the IPO issuer outstanding immediately prior thereto continuing to represent more than 40% of the combined voting power of the voting securities of the IPO issuer outstanding immediately after such merger or consolidation. After this offering, comparable provisions regarding acceleration of vesting and forfeiture of unvested stock received in exchange for unvested units as a part of our corporate reorganization will apply.
Potential payments upon termination or change in control table for fiscal 2010
The information set forth in the table below is based on the assumption that the applicable triggering event under the restricted unit agreement to which each named officer was a party occurred on December 31, 2010, the last business day of fiscal 2010. Accordingly, the information reported in the table indicates the value of units that would vest by reason of a termination under the circumstances described above, or upon a change of control, and is our best estimation of our obligations to each named executive officer and will only be determinable with any certainty upon the occurrence of the applicable event. The fair market value per unit of each applicable unit in Laredo Petroleum, LLC was $0.00 on December 31, 2010.
| Name |
Occurrence of a termination event ($) |
Occurrence of a change of control ($)(6) |
|||||
|---|---|---|---|---|---|---|---|
Randy A. Foutch(1) |
0 | 0 | |||||
W. Mark Womble(2) |
0 | 0 | |||||
Jerry R. Schuyler(3) |
0 | 0 | |||||
Patrick J. Curth(4) |
0 | 0 | |||||
John E. Minton(5) |
0 | 0 | |||||
(1) As of December 31, 2010, Randy A. Foutch held 470,000 unvested Series B-1 restricted units, 334,000 unvested Series B-2 restricted units, 820,000 unvested Series C restricted units, 2,059,800 unvested Series D restricted units and 1,602,000 unvested Series E restricted units.
(2) As of December 31, 2010, W. Mark Womble held 97,200 unvested Series B-1 restricted units, 60,400 unvested Series B-2 restricted units, 220,000 unvested Series C restricted units, 374,000 unvested Series D restricted units and 399,000 unvested Series E restricted units.
(3) As of December 31, 2010, Jerry R. Schuyler held 170,200 unvested Series B-1 restricted units, 108,800 unvested Series B-2 restricted units, 380,000 unvested Series C restricted units, 653,400 unvested Series D restricted units and 684,000 unvested Series E restricted units.
(4) As of December 31, 2010, Patrick J. Curth held 93,800 unvested Series B-1 restricted units, 65,600 unvested Series B-2 restricted units, 190,000 unvested Series C restricted units, 403,400 unvested Series D restricted units and 285,000 unvested Series E restricted units.
(5) As of December 31, 2010, John E. Minton held 40,000 unvested Series B-1 restricted units, 20,000 unvested Series B-2 restricted units, 70,000 unvested Series C restricted units, 186,000 unvested Series D restricted units and 90,000 unvested Series E restricted units.
138
(6) The value was calculated in accordance with ASC 718, Compensation—Unit Compensation. The assumptions used in determining market value included the present value of our proved reserves based on future price, adjusted for the current market value of our other non-oil and gas assets and liabilities, and other subjective assumptions.
Compensation of directors
For the 2010 fiscal year, the members of the board of directors did not receive cash compensation for their services as directors. The independent directors are eligible to receive restricted units under our long-term equity based incentive program. However, the directors appointed by Warburg Pincus receive no equity compensation for their services as a director.
An employee/member of the board of directors receives no additional compensation for services as a director. Accordingly, the Summary Compensation Table reflects the total compensation received by Randy A. Foutch and Jerry R. Schuyler.
Our independent directors may be reimbursed for their expenses to attend board meetings. However, the directors appointed by Warburg Pincus receive no reimbursement for expenses to attend board meetings.
As mentioned above under "—Compensation discussion and analysis—Elements of compensation—Long-term equity based incentive awards", we grant restricted units in Laredo Petroleum, LLC to our directors as a means of providing them with long-term equity incentive compensation that may directly profit from any success we achieve. This structure enables us to identify a fixed number of restricted units on which distributions will flow through Laredo Petroleum, LLC to our directors. We believe that providing equity compensation from Laredo Petroleum, LLC allows us to retain the ability to incentivize our directors to focus on our long-term success.
Pursuant to certain restricted unit agreements, on February 1, 2010 we granted certain Laredo Petroleum, LLC Series D Units to directors Bill Parker and Pamela Pierce, and on February 16, 2010, we granted certain Laredo Petroleum, LLC Series D Units and Series E Units to directors Ambassador Francis Rooney and Donald D. Wolf. These restricted units are intended to constitute "profits interests" in Laredo Petroleum, LLC that will participate solely in any future profits of Laredo Petroleum, LLC that result from any distributions on our units that are held by Laredo Petroleum, LLC.
The following table summarizes, with respect to our non-employee directors, information relating to the compensation earned for services rendered as directors during the fiscal year ended December 31, 2010. Prior to the offering, the stock awards will be converted into common stock or common stock awards in connection with the corporate reorganization. See "Corporate reorganization."
139
Director compensation table for the year ended December 31, 2010
| Name |
Stock awards(1) |
All other compensation |
Total |
||||||||
|---|---|---|---|---|---|---|---|---|---|---|---|
| |
|
($) |
($) |
||||||||
Jeffrey Harris |
— | — | — | ||||||||
Peter R. Kagan |
— | — | — | ||||||||
James R. Levy |
— | — | — | ||||||||
B.Z. (Bill) Parker(2) |
|||||||||||
Series D |
30,000 | — | — | ||||||||
Pamela S. Pierce(3) |
|||||||||||
Series D |
30,000 | — | — | ||||||||
Ambassador Francis Rooney(4) |
|||||||||||
Series D |
70,000 | — | — | ||||||||
Series E |
78,000 | — | — | ||||||||
Donald D. Wolf(5) |
|||||||||||
Series D |
70,000 | — | — | ||||||||
Series E |
78,000 | — | — | ||||||||
(1) We awarded the restricted unit awards as described above under "—Compensation discussion and analysis—Elements of compensation—Long-term equity based incentive awards". The amounts reported as Stock Awards represent the grant date fair value of restricted unit grants awarded to or in respect of our directors during 2010, computed in accordance with ASC 718, Compensation—Unit Compensation. Restricted units vest ratably over four years at each anniversary of the grant. The valuation assumptions used in determining these amounts are the present value of our proved reserves based on future prices, adjusted for the current market value of the our other non-oil and gas assets and liabilities, and other subjective assumptions (see Note F in our audited combined financial statements included elsewhere in this prospectus for further information).
(2) At December 31, 2010, the director held 28,000 Series B-1 restricted units, 17,000 Series B-2 restricted units, 40,000 Series C restricted units, 60,000 Series D restricted units and 38,000 Series E restricted units.
(3) At December 31, 2010, the director held 28,000 Series B-1 restricted units, 17,000 Series B-2 restricted units, 40,000 Series C restricted units, 60,000 Series D restricted units and 38,000 Series E restricted units.
(4) At December 31, 2010, the director held 70,000 Series D restricted units and 78,000 Series E restricted units.
(5) At December 31, 2010, the director held 70,000 Series D restricted units and 78,000 Series E restricted units.
Director compensation post IPO
Based on a competitive review by Cogent of outside director compensation paid by our peers, the board of directors adopted the compensation arrangement for Laredo following this offering described below.
- •
- Annual Cash Retainer—$40,000 (directors can elect to have their cash retainer paid in the form of restricted
stock)
- •
- Committee Chairman Fees—
- •
- Chairman of Audit Committee: $15,000/year paid in restricted stock
- •
- Chairman of Compensation Committee: $12,500/year paid in restricted stock
- •
- Chairman of Other Committees: $12,500/year paid in restricted stock
- •
- Annual Stock Grant—Equivalent value of $160,000 in restricted stock.
Directors who are also employees of Laredo will not receive any additional compensation for serving on our board of directors.
140
Certain relationships and related party transactions
Acquisition of Broad Oak Energy, Inc.
On July 1, 2011, we completed an acquisition of Broad Oak Energy, Inc., a Delaware corporation ("Broad Oak") with Broad Oak becoming a wholly-owned subsidiary of Laredo Petroleum, Inc., for a combination of equity and cash. Warburg Pincus Private Equity IX, L.P., a Delaware limited partnership and the owner of the majority of our equity, was a majority stockholder in Broad Oak and received approximately $611.2 million in the form of units in Laredo Petroleum, LLC in the transaction. We changed the name of Broad Oak to Laredo Petroleum-Dallas, Inc. on July 19, 2011.
Corporate reorganization
In connection with our corporate reorganization, we will engage in certain transactions with certain affiliates and our existing equity holders. Please see "Corporate reorganization" for a description of these transactions.
Historical transactions relating to Laredo Petroleum, LLC
To date, our equity investors, including members of our management team and our independent directors, have invested approximately $710 million in us. The limited liability company agreement of Laredo Petroleum, LLC was initially entered into on May 21, 2007 and amended and restated on each of October 15, 2008 and July 1, 2011 among Warburg Pincus and members of our management, directors and employees. Pursuant to the limited liability company agreement, Warburg Pincus, members of our management, our directors and employees purchased preferred units and profits units in Laredo Petroleum, LLC.
Under the limited liability company agreement, if Laredo Petroleum, LLC proposes to issue certain additional equity securities, certain of the existing holders of Laredo Petroleum, LLC's units who are "accredited investors" under the Securities Act will have the right to purchase a pro rata amount of such securities. Certain of the units are subject to rights of first refusal held by certain members. In addition, if certain members seek to sell any units to a third party, such members must offer to include in such sale certain units held by other unit holders. In addition, the Warburg Pincus Group (comprising Warburg Pincus Private Equity IX, L.P., Warburg Pincus Private Equity X O&G, L.P. and their affiliates) has the right to require all holders of units to sell all of their units in certain sale transactions in accordance with the provisions of the limited liability company agreement.
None of Laredo Petroleum, LLC's outstanding units are entitled to current cash distributions or are convertible into indebtedness. Although Laredo Petroleum, LLC is required to make distributions to cover any income taxes allocated to each unitholder, the unitholders have no other rights to cash distributions (except in the case of certain liquidation events). We do not anticipate making any such tax distributions in the foreseeable future.
The limited liability company agreement of Laredo Petroleum, LLC provides that Laredo Petroleum LLC's members will, upon the corporate reorganization, be entitled to certain demand and "piggyback" registration rights regarding the shares of common stock owned by them after this offering. Under these registration rights, Warburg Pincus may require Laredo to
141
file a registration statement for the public sale of their shares of common stock. In addition, any time Laredo Petroleum Holdings, Inc. proposes to file a registration statement with respect to an offering of shares, each of the members who received shares of common stock in the corporate reorganization will have the right to include his, her or its shares in that offering. The underwriters of any underwritten offering will have the right to limit the number of shares of common stock to be included in such underwritten offering by such stockholders. We will pay all expenses relating to any demand or piggyback registration, except for underwriters' or brokers' commission or discounts. The shares of common stock owned by these stockholders will no longer have registration rights under the registration rights agreement to the extent they have been sold to the public either pursuant to a registration statement or under Rule 144 promulgated under the Securities Act or are otherwise eligible for resale pursuant to Rule 144 under the Securities Act. Upon the consummation of the corporate reorganization, we will become a party to a registration rights agreement pursuant to which we will grant the registration rights described above. See "Shares eligible for future sales—Registration rights."
Upon completion of our corporate reorganization to be completed simultaneously with, or prior to, the consummation of this offering, the limited liability company agreement will no longer be in effect.
Gas gathering and processing arrangement with Targa
Laredo has a gas gathering and processing arrangement with affiliates of Targa Resources, Inc. ("Targa"). Warburg Pincus Private Equity IX, L.P., a majority equityholder in Laredo, and other Warburg Pincus affiliates hold investment interests in Targa. Mr. Kagan, one of our directors, is on the board of directors of affiliates of Targa. Our net oil and gas sales to Targa were approximately $33.5 million and $35.0 million during the first six months of 2011 and for the year ended December 31, 2010, respectively.
Other related party transactions
Our board of directors has adopted an aircraft use policy for our Chairman and Chief Executive Officer Randy A. Foutch, whereby his personally owned aircraft can be used for Laredo business travel, subject to certain conditions. Mr. Foutch travels extensively for company business, often on short notice and to areas that have limited access to direct commercial flights, so our board of directors has determined that the use of Mr. Foutch's aircraft is an efficient and cost-effective option that is beneficial to us. On occasion, other Laredo Petroleum, Inc. employees fly with Mr. Foutch when convenient or necessary on these business trips at no extra cost to us. Mr. Foutch's aircraft is owned by a family limited partnership that he controls. Although Mr. Foutch is a fully qualified pilot with a single pilot rating and has flown his aircraft solo for business while working for other companies in the past, we believe it is in our best interest to require the presence of a fully-licensed and qualified co-pilot and certain specified safety and mechanical inspections to assure the airworthiness of the aircraft. The expenses covered by us consist of the salary of the co-pilot and his out-of-pocket expenses on business trips, the training and certification expenses of Mr. Foutch and the co-pilot, and the cost of aircraft safety and mechanical inspections. In addition, we reimburse Mr. Foutch for the use of this aircraft for company business in an amount equal to the cost of a first class commercial airline ticket to such destination or the cost of a charter flight if commercial flights are not available to such destination. During 2010, we incurred approximately $401,600 in
142
expenses for business trips pursuant to this policy. These payments represent only a partial refund of the total costs and expenses of flying the aircraft, including the additional fixed costs required to be incurred under the policy, and as a result Mr. Foutch incurs a loss each year on the aircraft. All amounts reimbursed to Mr. Foutch are approved by our Chief Financial Officer in accordance with the board approved policy.
Procedures for approval of related party transactions
Our board of directors will adopt a written related party transactions policy prior to the completion of this offering. Pursuant to this policy, the audit committee will review all material facts of all related party transactions and either approve or disapprove entry into the related party transaction, subject to certain limited exceptions. In determining whether to approve or disapprove entry into a related party transaction, the audit committee shall take into account, among other factors, the following: (1) whether the related party transaction is on terms no less favorable than terms generally available to an unaffiliated third-party under the same or similar circumstances and (2) the extent of the related person's interest in the transaction. Further, the policy will require that all related party transactions required to be disclosed in our filings with the SEC be so disclosed in accordance with applicable laws, rules and regulations. A copy of the policy will be available on our website at www.laredopetro.com prior to or upon completion of this offering. Information on our website or any other website is not incorporated by reference into, and does not constitute part of, this prospectus.
143
Laredo Petroleum Holdings, Inc. is a Delaware corporation that was formed for the purpose of making this offering. Pursuant to the terms of a corporate reorganization that will be completed concurrently with, or prior to, the closing of this offering, Laredo Petroleum Holdings, Inc. will merge with Laredo Petroleum, LLC, with Laredo Petroleum Holdings, Inc. being the surviving entity. All of our outstanding preferred equity units will be exchanged for shares of Laredo Petroleum Holdings, Inc. common stock in accordance with the limited liability company agreement of Laredo Petroleum, LLC. In addition, under our limited liability company agreement and the restricted unit agreements, certain series of our incentive equity units will also be exchanged into Laredo Petroleum Holdings, Inc. common stock, depending upon the initial public offering price of the common stock in this offering. To the extent any of such incentive units are subject to vesting requirements, the common stock issuable in exchange therefor will also be subject to such requirements.
The number of shares of common stock that a holder of units will receive in the reorganization will be determined by the value such holder would have received under the distribution provisions in our limited liability company agreement upon a liquidation of Laredo at a liquidation value determined by reference to the initial offering price. Purchasers of common stock in this offering will only receive, and this prospectus only describes the offering of, shares of common stock of Laredo Petroleum Holdings, Inc. Upon completion of our corporate reorganization, the former holders of units in Laredo Petroleum, LLC will own an aggregate of shares of Laredo Petroleum Holdings, Inc.'s common stock (based upon the midpoint of the price range set forth on the cover page of this prospectus). See "Description of capital stock" for additional information regarding the terms of our amended and restated certificate of incorporation and amended and restated bylaws as will be in effect upon the closing of this offering.
We refer to (i) the merger of Laredo Petroleum Holdings, Inc. and Laredo Petroleum, LLC, (ii) the exchange of all of the outstanding preferred equity units and certain series of incentive equity units of Laredo Petroleum, LLC into shares of Laredo Petroleum Holdings, Inc.'s common stock in accordance with the limited liability company agreement of Laredo Petroleum, LLC and (iii) the consummation of the other related transactions collectively as our "corporate reorganization."
144
Security ownership of certain beneficial owners and management
The following table sets forth certain information as of , 2011, after giving effect to our corporate reorganization, regarding the beneficial ownership of our common stock by (1) beneficial owners of 5% or more of the common stock, (2) each of our directors, (3) each of our named executive officers and (4) all of our directors and named executive officers as a group.
| |
|
Percent of shares of common stock outstanding(1)(2) |
||||
|---|---|---|---|---|---|---|
| |
Number of shares of common stock(1) |
|||||
| Name of beneficial owner |
Before the offering |
After the offering |
||||
Warburg Pincus Private Equity IX, L.P.(3) |
||||||
Warburg Pincus Private Equity X O&G, L.P.(3) |
||||||
Randy A. Foutch(4) |
||||||
Jerry R. Schuyler |
||||||
W. Mark Womble |
||||||
Patrick J. Curth |
||||||
John E. Minton |
||||||
Peter R. Kagan(5) |
||||||
James R. Levy |
||||||
B.Z. (Bill) Parker |
||||||
Pamela S. Pierce |
||||||
Francis Rooney |
||||||
Edmund P. Segner, III |
||||||
Donald D. Wolf |
||||||
Directors and named executive officers as a group (12 persons) |
||||||
(1) Assumes the completion of our corporate reorganization concurrently with, or prior to, the closing of this offering (based upon the midpoint of the price range set forth on the cover page of this prospectus). See "Corporate reorganization."
(2) Assumes no exercise of the underwriters' option to purchase additional shares of common stock.
(3) The stockholders are Warburg Pincus Private Equity IX, L.P., a Delaware limited partnership, together with affiliated partnerships ("WP IX"), and Warburg Pincus Private Equity X O&G, L.P., a Delaware limited partnership, together with affiliated partnerships ("WP O&G"). Warburg Pincus IX, LLC, a New York limited liability company ("WPIX LLC"), an indirect subsidiary of Warburg Pincus & Co., a New York general partnership ("WP"), is the general partner of WP IX. Warburg Pincus X, L.P., a Delaware limited partnership ("WP X GP") is the general partner of the WP O&G. Warburg Pincus X, LLC, a Delaware limited liability company ("WP X LLC") is the general partner of WP X GP. Warburg Pincus Partners, LLC, a New York limited liability company ("WP Partners"), is the sole member of WPIX LLC and WP X LLC. WP is the managing member of WP Partners. Warburg Pincus LLC, a New York limited liability company ("WP LLC"), manages WP IX and WP O&G. The address of the Warburg Pincus entities is 450 Lexington Avenue, New York, New York 10017.
(4) Randy A. Foutch, our Chief Executive Officer and Chairman of the Board, is a limited partner of certain members of the Warburg Pincus Group.
(5) Mr. Kagan, director of Laredo, is a partner of WP and a Managing Director and Member of WP LLC. Mr. Kagan may be deemed to have an indirect pecuniary interest (within the meaning of Rule 16a-1 under the Securities Exchange Act of 1934) in an indeterminate portion of the common stock owned by WP IX and WP O&G. Charles R. Kaye and Joseph P. Landy are Managing General Partners of WP and Managing Members and Co-Presidents of WP LLC and may be deemed to control the Warburg Pincus entities. Messrs. Kaye, Landy and Kagan disclaim beneficial ownership of all shares of common stock held by the Warburg Pincus entities.
The address for all officers and directors is c/o Laredo Petroleum Holdings, Inc., 15 W. Sixth Street, Suite 1800, Tulsa, Oklahoma 74119.
145
Upon completion of this offering, the authorized capital stock of Laredo Petroleum Holdings, Inc. will consist of shares of common stock, par value $0.01 per share, of which shares will be issued and outstanding, and shares of preferred stock, par value $0.01 per share, of which no shares will be issued and outstanding.
We will adopt an amended and restated certificate of incorporation and amended and restated bylaws concurrently with, or prior to, the completion of this offering. The following summary of the capital stock and amended and restated certificate of incorporation and amended and restated bylaws of Laredo Petroleum Holdings, Inc. does not purport to be complete and is qualified in its entirety by reference to the provisions of applicable law and to our amended and restated certificate of incorporation and amended and restated bylaws, which are filed as exhibits to the registration statement of which this prospectus is a part.
Common stock
Except as provided by law or in a preferred stock designation, holders of common stock are entitled to one vote for each share held of record on all matters submitted to a vote of the stockholders, have the exclusive right to vote for the election of directors and do not have cumulative voting rights. Except as otherwise required by law, holders of common stock, as such, are not entitled to vote on any amendment to the amended and restated certificate of incorporation (including any certificate of designations relating to any series of preferred stock) that relates solely to the terms of any outstanding series of preferred stock if the holders of such affected series are entitled, either separately or together with the holders of one or more other such series, to vote thereon pursuant to the amended and restated certificate of incorporation (including any certificate of designations relating to any series of preferred stock) or pursuant to the General Corporation Law of the State of Delaware, or DGCL. Subject to preferences that may be applicable to any outstanding shares or series of preferred stock, holders of common stock are entitled to receive ratably such dividends (payable in cash, stock or otherwise), if any, as may be declared from time to time by our board of directors out of funds legally available for dividend payments. All outstanding shares of common stock are fully paid and non-assessable. The holders of common stock have no preferences or rights of conversion, exchange, pre-emption or other subscription rights. There are no redemption or sinking fund provisions applicable to the common stock. In the event of any liquidation, dissolution or winding-up of our affairs, holders of common stock will be entitled to share ratably in our assets that are remaining after payment or provision for payment of all of our debts and obligations and after liquidation payments to holders of outstanding shares of preferred stock, if any.
Preferred stock
Our amended and restated certificate of incorporation authorizes our board of directors, subject to any limitations prescribed by law, without further stockholder approval, to establish and to issue from time to time one or more classes or series of preferred stock, par value $0.01 per share, covering up to an aggregate of shares of preferred stock. Each class or series of preferred stock will cover the number of shares and will have the powers, preferences, rights, qualifications, limitations and restrictions determined by our board of
146
directors, which may include, among others, dividend rights, liquidation preferences, voting rights, conversion rights, preemptive rights and redemption rights.
Anti-takeover effects of provisions of our certificate of incorporation, our bylaws and Delaware law
Some provisions of Delaware law, and our amended and restated certificate of incorporation and our amended and restated bylaws described below, contain provisions that could make the following transactions more difficult: acquisitions of us by means of a tender offer, a proxy contest or otherwise and removal of our incumbent officers and directors. These provisions may also have the effect of preventing changes in our management. It is possible that these provisions could make it more difficult to accomplish or could deter transactions that stockholders may otherwise consider to be in their best interest or in our best interests, including transactions that might result in a premium over the market price for our shares.
These provisions, summarized below, are expected to discourage coercive takeover practices and inadequate takeover bids. These provisions are also designed to encourage persons seeking to acquire control of us to first negotiate with us. We believe that the benefits of increased protection and our potential ability to negotiate with the proponent of an unfriendly or unsolicited proposal to acquire or restructure us outweigh the disadvantages of discouraging these proposals because, among other things, negotiation of these proposals could result in an improvement of their terms.
Delaware law
Upon completion of this offering, we will be subject to the provisions of Section 203 of the DGCL, which regulates corporate takeovers. In general, those provisions prohibit a Delaware corporation, including those whose securities are listed for trading on the NYSE, from engaging in any business combination with any interested stockholder for a period of three years following the date that the stockholder became an interested stockholder, unless:
- •
- the business combination or transaction in which the person became interested is approved by the board of directors before
the date the interested stockholder attained that status;
- •
- upon consummation of the transaction that resulted in the stockholder becoming an interested stockholder, the interested
stockholder owned at least 85% of the voting stock of the corporation outstanding at the time the transaction commenced other than, for purposes of determining the voting stock outstanding (but not
the outstanding stock owned by the interested stockholder), shares owned by persons who are directors and also officers of Laredo and by certain employee stock plans; or
- •
- on or after such time the business combination is approved by the board of directors and authorized at a meeting of stockholders by at least two-thirds of the outstanding voting stock that is not owned by the interested stockholder.
Section 203 defines "business combination" to include the following:
- •
- certain mergers or consolidations involving the corporation and the interested stockholder;
- •
- any sale, transfer, pledge or other disposition of 10% or more of the assets of the corporation to or with the interested stockholder;
147
- •
- subject to certain exceptions, any transaction that results in the issuance or transfer by the corporation of any stock of
the corporation to the interested stockholder;
- •
- subject to certain exceptions, any transaction involving the corporation that has the effect of increasing the
proportionate share of the stock of any class or series of the corporation beneficially owned by the interested stockholder; or
- •
- the receipt by the interested stockholder of the benefit of loans, advances, guarantees, pledges or other financial benefits provided by or through the corporation.
In general, Section 203 defines an interested stockholder as any entity or person beneficially owning 15% or more of the outstanding voting stock of the corporation and any entity or person affiliated with or controlling or controlled by any of these entities or persons. Since Warburg Pincus will have owned their equity in us at the time we will complete the corporate reorganization, Warburg Pincus will not be subject to the restrictions of Section 203.
Certificate of incorporation and bylaws
Among other things, our amended and restated certificate of incorporation and amended and restated bylaws:
- •
- provide advance notice procedures with regard to stockholder nomination of candidates for election as directors or
proposals of business to be brought before meetings of our stockholders. These procedures provide that notice of stockholder nominations or proposals must be timely given in writing to our corporate
secretary prior to the meeting at which the action is to be taken. Generally, to be timely, notice must be received at our principal executive offices not less than 45 days nor more than
75 days prior to the first anniversary date of the annual meeting for the preceding year. Our amended and restated bylaws specify the requirements as to form and content of all stockholders'
notices. These requirements may make it more difficult for stockholders to bring matters before the stockholders at an annual or special meeting;
- •
- provide our board of directors the ability to establish the terms of undesignated preferred stock. This ability makes it
possible for our board of directors to issue, without stockholder approval, preferred stock with voting or other rights or preferences that could impede the success of any attempt to change control of
us. These and other provisions may have the effect of deterring hostile takeovers or delaying changes in control or management of Laredo;
- •
- provide that at such time as Warburg Pincus no longer beneficially owns more than 50% of our outstanding common stock, our
board of directors will be divided into three classes with each class serving staggered three year terms;
- •
- provide that the authorized number of directors may be changed only by resolution of our board of directors;
- •
- provide that all vacancies, including newly created directorships, may, except as otherwise required by law and subject to the rights of the holders of any series of preferred stock, be filled by the affirmative vote of a majority of directors then in office, even if less than a quorum;
148
- •
- provide that any action required or permitted to be taken by the stockholders must be effected at a duly called annual or
special meeting of stockholders and may not be effected by any consent in writing in lieu of a meeting of such stockholders, subject to the rights of the holders of any series of preferred stock;
- •
- provide that certain provisions of our amended and restated certificate of incorporation may be amended only with the
affirmative vote of the holders of at least of our then outstanding common stock;
- •
- provide that our amended and restated bylaws may be amended by the affirmative vote of the holders of at least
of our then outstanding common stock;
- •
- provide that special meetings of our stockholders may only be called by the board of directors; and
- •
- provide that our amended and restated bylaws can be amended or repealed by our board of directors or our stockholders.
Limitation of liability and indemnification matters
Our amended and restated certificate of incorporation limits the liability of our directors for monetary damages for breach of their fiduciary duty as directors, except for the following liabilities that cannot be eliminated under the DGCL:
- •
- for any breach of their duty of loyalty to us or our stockholders;
- •
- for acts or omissions not in good faith or which involve intentional misconduct or a knowing violation of law;
- •
- for an unlawful payment of dividends or an unlawful stock purchase or redemption, as provided under Section 174 of
the DGCL; or
- •
- for any transaction from which the director derived an improper personal benefit.
Any amendment or repeal of these provisions will be prospective only and would not affect any limitation on liability of a director for acts or omissions that occurred prior to any such amendment or repeal.
Our amended and restated bylaws also provide that we will indemnify our directors and officers to the fullest extent permitted by Delaware law; provided that we shall indemnify any such person seeking indemnification in connection with a proceeding (or part thereof) initiated by such person only if such proceeding (or part thereof) was authorized by the board of directors. Our amended and restated bylaws also explicitly authorize us to purchase insurance to protect any of our officers, directors, employees or agents or any person who is or was serving at our request as an officer, director, employee or agent of another enterprise for any expense, liability or loss, regardless of whether Delaware law would permit indemnification.
We expect to enter into indemnification agreements with each of our directors and officers. The agreements will provide that we will indemnify and hold harmless each indemnitee for certain expenses to the fullest extent permitted or authorized by law, including the DGCL, in effect on the date of the agreement or as it may be amended to provide more advantageous rights to the indemnitee. If such indemnification is unavailable as a result of a court decision and if we and the indemnitee are jointly liable in the proceeding, we will contribute funds to
149
the indemnitee for his expenses in proportion to relative benefit and fault of us and indemnitee in the transaction giving rise to the proceeding. The indemnification agreements will also provide that we will indemnify the indemnitee for monetary damages for actions taken as our director or officer or for serving at our request as a director or officer or another position at another corporation or enterprise, as the case may be but only if (i) the indemnitee acted in good faith and, in the case of conduct in his official capacity, in a manner he reasonably believed to be in our best interests and, in all other cases, not opposed to the our best interests and (ii) in the case of a criminal proceeding, the indemnitee must have had no reasonable cause to believe that his conduct was unlawful. The indemnification agreements also provide that we must advance payment of certain expenses to the indemnitee, including fees of counsel, subject to receipt of an undertaking from the indemnitee to return such advance if it is it is ultimately determined that the indemnitee is not entitled to indemnification.
We believe that the limitation of liability provision in our amended and restated certificate of incorporation and the indemnification agreements will facilitate our ability to continue to attract and retain qualified individuals to serve as directors and officers.
Corporate opportunity
Our amended and restated certificate of incorporation provides that, to the fullest extent permitted by applicable law, we renounce any interest or expectancy in any business opportunity, transaction or other matter in which any of Warburg Pincus or any private fund that it manages or advises, their affiliates (other than us and our subsidiaries), and any portfolio company in which such entities or persons has an equity investment (other than us and our subsidiaries) participates or desires or seeks to participate in and that involves any aspect of the energy business or industry, unless any such business opportunity, transaction or matter is (i) offered to such person in its capacity as one of our directors and with respect to which no other such person (other than one of our directors) independently receives notice or otherwise identifies such business opportunity, transaction or matter or (ii) identified by such person solely through the disclosure of information by us or on our behalf.
Transfer agent and registrar
The transfer agent and registrar for our common stock is American Stock Transfer & Trust Company, LLC.
Listing
We intend to apply to have our shares of common stock listed on the NYSE under the symbol "LPI."
150
Shares eligible for future sale
Prior to this offering, there has been no public market for our common stock. Future sales of our common stock in the public market, or the availability of such shares for sale in the public market, could adversely affect market prices prevailing from time to time. As described below, only a limited number of shares will be available for sale shortly after this offering due to contractual and legal restrictions on resale. Nevertheless, sales of a substantial number of shares of our common stock in the public market after such restrictions lapse, or the perception that those sales may occur, could adversely affect the prevailing market price at such time and our ability to raise equity-related capital at a time and price we deem appropriate.
Sales of restricted shares
Upon the closing of this offering, we will have outstanding an aggregate of shares of common stock. Of these shares, all of the shares of common stock to be sold in this offering will be freely tradable without restriction or further registration under the Securities Act, unless the shares are held by any of our "affiliates" as such term is defined in Rule 144 of the Securities Act. All remaining shares of common stock held by existing stockholders will be deemed "restricted securities" as such term is defined under Rule 144. The restricted securities were issued and sold by us in private transactions and are eligible for public sale only if registered under the Securities Act or if they qualify for an exemption from registration under Rule 144 or Rule 701 under the Securities Act, which rules are summarized below.
As a result of the lock-up agreements described below and the provisions of Rule 144 and Rule 701 under the Securities Act, all of the shares of our common stock (excluding the shares to be sold in this offering) will be available for sale in the public market upon the expiration of the lock-up agreements, beginning 180 days after the date of this prospectus (subject to extension) and when permitted under Rule 144 or Rule 701.
Lock-up agreements
We, all of our directors and certain of our officers and our principal stockholders have agreed not to sell or otherwise transfer or dispose of any common stock for a period of 180 days from the date of this prospectus, subject to certain exceptions and extensions. There are no agreements or other intentions, either tacit or explicit, regarding the possible early release of any common stock subject to these lock-up provisions. See "Underwriting (conflicts of interest)" for a description of these lock-up provisions.
Rule 144
In general, under Rule 144 as currently in effect, once we have been a reporting company subject to the reporting requirements of Section 13 or 15(d) of the Exchange Act for 90 days, a person (or persons whose shares are aggregated) who is not deemed to have been an affiliate of ours at any time during the three months preceding a sale, and who has beneficially owned restricted securities within the meaning of Rule 144 for at least six months (including any period of consecutive ownership of preceding non-affiliated holders) would be entitled to sell those shares, subject only to the availability of current public information about us. A non-affiliated person who has beneficially owned restricted securities within the meaning of
151
Rule 144 for at least one year would be entitled to sell those shares without regard to the provisions of Rule 144.
Once we have been a reporting company subject to the reporting requirements of Section 13 or 15(d) of the Exchange Act for 90 days, a person (or persons whose shares are aggregated) who is deemed to be an affiliate of ours and who has beneficially owned restricted securities within the meaning of Rule 144 for at least six months would be entitled to sell within any three-month period a number of shares that does not exceed the greater of one percent of the then outstanding shares of our common stock or the average weekly trading volume of our common stock reported through the NYSE during the four calendar weeks preceding the filing of notice of the sale. Such sales are also subject to certain manner of sale provisions, notice requirements and the availability of current public information about us.
Rule 701
Employees, directors, officers, consultants or advisors who purchases shares from us in connection with a compensatory stock or option plan or other written compensatory agreement in accordance with Rule 701 before the effective date of the registration statement are entitled to sell such shares 90 days after the effective date of the registration statement in reliance on Rule 144 without having to comply with the holding period requirement of Rule 144 and, in the case of non-affiliates, without having to comply with the public information, volume limitation or notice filing provisions of Rule 144. The SEC has indicated that Rule 701 will apply to typical stock options granted by an issuer before it becomes subject to the reporting requirements of the Exchange Act, along with the shares acquired upon exercise of such options, including exercises after the date of this prospectus.
Stock issued under employee plans
We intend to file a registration statement on Form S-8 under the Securities Act to register stock issuable under our long-term incentive plan. This registration statement is expected to be filed following the effective date of the registration statement of which this prospectus is a part and will be effective upon filing. Accordingly, shares registered under such registration statement will be available for sale in the open market following the effective date, unless such shares are subject to vesting restrictions with us, Rule 144 restrictions applicable to our affiliates or the lock-up restrictions described above.
Registration rights
Upon the consummation of the corporate reorganization, we will become a party to a registration rights agreement pursuant to which we will grant certain registration rights to the members of Laredo Petroleum, LLC that receive shares of our common stock in the corporate reorganization. Pursuant to the lock-up agreements described above, certain of these stockholders have agreed not to exercise those rights during the lock-up period following this offering without the prior written consent of J.P. Morgan Securities LLC, Goldman, Sachs & Co. and Merrill Lynch, Pierce, Fenner & Smith Incorporated. See "Certain relationships and related party transactions—Historical transactions relating to Laredo Petroleum, LLC."
152
Certain U.S. federal income tax considerations for
non-U.S. holders of shares of our common stock
Introduction
The following is a discussion of certain U.S. federal income tax considerations applicable to Non-U.S. Holders (as defined below) arising from the acquisition, ownership and disposition of shares of our common stock. This summary is for general information purposes only and does not purport to be a complete analysis or listing of all potential U.S. federal income tax considerations that may apply to a Non-U.S. Holder as a result of the acquisition, ownership and disposition of shares of our common stock. In addition, this summary does not take into account the individual facts and circumstances of any particular Non-U.S. Holder that may affect the U.S. federal income tax considerations applicable to such holder. Accordingly, this summary is not intended to be, and should not be construed as, legal or U.S. federal income tax advice with respect to any Non-U.S. Holder. Moreover, this summary is not binding on the Internal Revenue Service (the "IRS") or the U.S. courts, and no assurance can be provided that the conclusions reached in this summary will not be challenged by the IRS or will be sustained by a U.S. court if so challenged. We have not requested, and we do not intend to request, a ruling from the IRS or an opinion from U.S. legal counsel regarding any of the U.S. federal income or other tax considerations of the acquisition, ownership and disposition of shares of our common stock. Each Non-U.S. Holder should consult its own tax advisor regarding the acquisition, ownership and disposition of shares of our common stock.
Scope of this disclosure
Authorities
This summary is based on the Internal Revenue Code of 1986, as amended (the "Code"), Treasury Regulations (final, temporary, and proposed), U.S. court decisions, published IRS rulings and published administrative positions of the IRS, that are applicable and, in each case, as in effect and available, as of the date of this prospectus. Any of the authorities on which this summary is based could be changed in a material and adverse manner at any time, and any such change could be applied on a retroactive basis and could affect the U.S. federal income tax considerations described in this summary.
Non-U.S. holders
For purposes of this summary, a "Non-U.S. Holder" is a beneficial owner of shares of our common stock that is not a partnership or other entity classified as a partnership for U.S. federal income tax purposes and that is not: (a) an individual who is a citizen or resident of the U.S., (b) a corporation, or other entity classified as a corporation for U.S. federal income tax purposes, that is created or organized in or under the laws of the U.S. or any state in the U.S., including the District of Columbia, (c) an estate if the income of such estate is subject to U.S. federal income tax regardless of the source of such income, or (d) a trust if (i) such trust has validly elected to be treated as a U.S. person for U.S. federal income tax purposes or (ii) a U.S. court is able to exercise primary supervision over the administration of such trust and one or more U.S. persons have the authority to control all substantial decisions of such trust.
153
Non-U.S. holders subject to special U.S. federal income tax rules not addressed
This summary does not address the U.S. federal income tax considerations of the acquisition, ownership and disposition of shares of our common stock by Non-U.S. Holders that are subject to special provisions under the Code, including the following Non-U.S. Holders: (a) Non-U.S. Holders that are tax-exempt organizations, qualified retirement plans, individual retirement accounts, or other tax-deferred accounts; (b) Non-U.S. Holders that are financial institutions, insurance companies, real estate investment trusts, or regulated investment companies or that are broker-dealers, dealers, or traders in securities or currencies that elect to apply a mark-to-market accounting method; (c) Non-U.S. Holders that have a "functional currency" other than the U.S. dollar; (d) Non-U.S. Holders that own shares of our common stock as part of a straddle, hedging transaction, conversion transaction, constructive sale, or other arrangement involving more than one position; (e) Non-U.S. Holders that acquire shares of our common stock in connection with the exercise of employee stock options or otherwise as compensation for services; (f) Non-U.S. Holders that hold shares of our common stock other than as a capital asset within the meaning of Section 1221 of the Code; (g) Non-U.S. Holders who are U.S. expatriates or former long term residents of the United States; and (h) Non-U.S. Holders that own, directly, indirectly, or by attribution, 5% or more, by voting power or value, of the outstanding shares of our common stock. Non-U.S. Holders that are subject to special provisions under the Code, including but not limited to Non-U.S. Holders described immediately above, should consult their own tax advisors regarding the U.S. federal, U.S. state and local, and foreign tax and other tax considerations of the acquisition, ownership and disposition of shares of our common stock.
If a partnership or other entity that is classified as partnership for U.S. federal income tax purposes holds shares of our common stock, the U.S. federal income tax considerations to such partnership and the partners of such partnership generally will depend on the activities of the partnership and the status of such partners (or owners). Partnerships or other entities that are classified as partnerships for U.S. federal income tax purposes and their owners should consult their own tax advisors regarding the U.S. federal income tax considerations of the acquisition, ownership and disposition of shares of our common stock.
Tax considerations other than U.S. federal income tax considerations not addressed
This summary does not address any state, local, alternative minimum, estate and gift, foreign, or other tax considerations other than U.S. federal income tax considerations that may be relevant to Non-U.S. Holders in connection with the acquisition, ownership and disposition of shares of our common stock. Each Non-U.S. Holder should consult its own tax advisors regarding any state, local, estate and gift, foreign, and any other tax considerations that may be relevant to such holder in connection with the acquisition, ownership and disposition of shares of our common stock.
Dividends
In general, if distributions with respect to shares of our common stock are made, such distributions would be treated as dividends to the extent of our current or accumulated earnings and profits as determined under the Code. Any portion of a distribution that exceeds our current or accumulated earnings and profits will first be applied to reduce the Non-U.S. Holder's basis in shares of our common stock, and, to the extent such portion exceeds the
154
Non-U.S. Holder's basis, the excess will be treated as gain from the disposition of shares of our common stock, the tax treatment of which is discussed below under the heading "Gain on sale or other disposition of shares of our common stock."
Generally, dividends paid in respect of shares of our common stock to a Non-U.S. Holder will be subject to U.S. withholding tax at a 30% rate, subject to the two following exceptions:
- •
- Dividends effectively connected with a trade or business of a Non-U.S. Holder within the U.S. generally will
not be subject to withholding if the Non-U.S. Holder complies with applicable IRS certification and disclosure requirements and generally will be subject to U.S. federal income tax on a
net income basis at regular U.S. federal income tax rates (in the same manner as a U.S. person) on its U.S. trade or business income. In the case of a Non-U.S. Holder that is a
corporation, such effectively connected income also may be subject to the branch profits tax at a 30% rate (or such lower rate as may be prescribed by an applicable tax treaty).
- •
- The withholding tax might not apply, or might apply at a reduced rate, under the terms of an applicable tax treaty. Under Treasury Regulations, to obtain a reduced rate of withholding under a tax treaty, a Non-U.S. Holder generally will be required to satisfy applicable certification and other requirements. A Non-U.S. Holder of shares of our common stock eligible for a reduced rate of U.S. withholding tax may obtain a refund or credit of any excess amounts withheld by filing an appropriate claim for refund with the IRS.
Gain on sale or other disposition of shares of our common stock
Except as described in the discussion below under the heading "Information Reporting; Backup Withholding Tax," a Non-U.S. Holder generally will not be subject to U.S. federal income tax, including withholding tax, in connection with the receipt of proceeds from the sale, exchange, or other taxable disposition of shares of our common stock, unless:
- •
- the gain is effectively connected with the Non-U.S. Holder's conduct of a trade or business within the United
States and, if subject to an applicable tax treaty, is attributable to a permanent establishment or fixed base maintained by the Non-U.S. Holder in the U.S.;
- •
- in the case of an individual, the Non-U.S. Holder has been present in the U.S. for at least 183 days or
more in the taxable year of disposition (and certain other conditions are satisfied); or
- •
- we are or have been a "U.S. real property holding corporation" ("USRPHC"), for U.S. federal income tax purposes (that is, a domestic corporation whose trade or business and real property assets consist primarily of "U.S. real property interests") at any time during the shorter of the five-year period ending on the date of disposition and the Non-U.S. Holder's holding period for its shares of our common stock and, if shares of our common stock are "regularly traded on an established securities market," the Non-U .S. Holder held, directly or indirectly, at any time during such period, more than 5% of the issued and outstanding common stock.
Income that is effectively connected with the conduct of a U.S. trade or business by a Non-U.S. Holder generally will be subject to regular U.S. federal income tax in the same manner as if it were realized by a U.S. Holder. In addition, if such Non-U.S. Holder is a corporation, such gain
155
may be subject to a branch profits tax at a rate of 30% (or such lower rate as is provided by an applicable income tax treaty).
If an individual Non-U.S. Holder is present in the U.S. for at least 183 days during the taxable year of disposition, the Non-U.S. Holder may be subject to a flat 30% tax on any U.S.-source gain derived from the sale, exchange, or other taxable disposition of shares of our common stock (other than gain effectively connected with a U.S. trade or business), which may be offset by U.S.-source capital losses.
It is likely that we are a USRPHC. As a result, any gain recognized by a Non-U.S. Holder on the sale, exchange, or other taxable disposition of our common stock may be subject to U.S. federal income tax in the same manner as gain recognized by a U.S. Holder ("FIRPTA Tax"). In addition, a Non-US. Holder may under certain circumstances be subject to withholding in an amount equal to 10% of the gross proceeds on the sale or disposition; if the Non-U.S. Holder files a U.S. federal income tax return, any amounts so withheld will generally be credited against, and refunded to the extent in excess of, any FIRPTA Tax such Non-U.S. Holder owes.
However, so long as our common stock is considered to be "regularly traded on an established securities market" ("regularly traded") at any time during the calendar year, a Non-U.S. Holder generally will not be subject to FIRPTA Tax on any gain recognized on the sale or other disposition of our common stock unless the Non-U.S. Holder owned (actually or constructively) shares of our common stock with a fair market value of more than 5% of the total fair market value of our common stock at any time during the applicable period described in the third bullet point above. No withholding is required under these rules upon a sale or other taxable disposition of our common stock if it is considered to be regularly traded. If, on the other hand, our common stock is not considered to be regularly traded, you would be subject to FIRPTA Tax on any gain recognized on your sale or other taxable disposition of our common stock, and withholding on the gross proceeds thereof, regardless of your percentage ownership of our common stock.
Recent law changes affecting U.S. federal income tax withholding
Recently enacted legislation and administrative guidance will require withholding at a rate of 30% on dividends paid on or after January 1, 2014 and gross proceeds from the sale of shares of our common stock paid on or after January 1, 2015 to certain foreign financial institutions (including investment funds), unless such institution enters into an agreement with the Secretary of the Treasury to, among other things, report, on an annual basis, information with respect to accounts with or shares in the institution held by certain U.S. persons and by certain non-U.S. entities that are wholly or partially owned by United States persons, and to withhold on payments made to certain account holders. Accordingly, the entity through which shares of our common stock is held will affect the determination of whether such withholding is required. Similarly, dividends in respect of, and gross proceeds from the sale of, shares of our common stock held by an investor that is a non-financial foreign entity will be subject to withholding at a rate of 30% if such entity or another non-financial foreign entity is the beneficial owner of the payment, unless, among other things, the beneficial owner or the payee either (i) certifies to us that such entity does not have any "substantial United States owners" or (ii) provides certain information regarding the entity's "substantial United States owners," which we will in turn provide to the Secretary of the Treasury. Non-U.S. Holders are
156
encouraged to consult with their tax advisors regarding the possible implications of the legislation on their investment in shares of our common stock.
Information reporting and backup withholding tax
A Non-U.S. Holder generally will not be subject to information reporting or backup withholding with respect to payments of dividends on, or gross proceeds from the disposition of, shares of our common stock that are made within the United States or though certain U.S.-related financial intermediaries, provided that the Non-U.S. Holder certifies as to its foreign status or otherwise establishes an exemption.
Backup withholding is not an additional tax. Amounts withheld as backup withholding may be credited against a Non-U.S. Holder's U.S. federal income tax liability, and a Non-U.S. Holder may obtain a refund of any excess amounts withheld under the backup withholding rules by timely filing the appropriate claim for refund with the IRS and furnishing any required information. Non-U.S. Holders should consult their own tax advisors regarding the application of the information reporting and backup withholding rules to them in their particular circumstances.
157
There are certain considerations to be made in connection with the purchase of the common stock by (1) employee benefit plans that are subject to Title I of the Employee Retirement Income Security Act of 1974, as amended, or ERISA, (2) plans, individual retirement accounts and other arrangements that are subject to Section 4975 of the Code or provisions under any federal, state, local, non-U.S. or other laws or regulations that are similar to such provisions of the Code or ERISA, which similar provisions are collectively referred to herein as Similar Laws, and (3) entities whose underlying assets are considered to include "plan assets" of any such plan, account or arrangement, each (1), (2), and (3), a Plan.
ERISA and the Code impose certain duties on persons who are fiduciaries of a Plan subject to Title I of ERISA or Section 4975 of the Code, which Plan is referred to herein as an ERISA Plan, and prohibit certain transactions involving the assets of an ERISA Plan with parties that are "parties in interest" under ERISA or "disqualified persons" under the Code. Under ERISA and the Code, any person who exercises any discretionary authority or control over the administration of such an ERISA Plan or the management or disposition of the assets of such an ERISA Plan, or who renders investment advice for a fee or other compensation to such an ERISA Plan, is generally considered to be a fiduciary of the ERISA Plan.
In considering an investment in the common stock of a portion of the assets of any Plan, a fiduciary should determine whether the investment is in accordance with the documents and instruments governing the Plan and the applicable provisions of ERISA, the Code or any Similar Law relating to a fiduciary's duties to the Plan including, without limitation, the prudence, diversification, delegation of control and prohibited transaction provisions of ERISA, the Code and any other applicable Similar Laws.
158
Underwriting (conflicts of interest)
We are offering the shares of common stock described in this prospectus through a number of underwriters. J.P. Morgan Securities LLC, Goldman, Sachs & Co., Merrill Lynch, Pierce, Fenner & Smith Incorporated and Wells Fargo Securities, LLC are acting as book-running managers of the offering. J.P. Morgan Securities LLC, Goldman, Sachs & Co., Merrill Lynch, Pierce, Fenner & Smith Incorporated and Wells Fargo Securities, LLC are the representatives of the underwriters. We have entered into an underwriting agreement with the underwriters. Subject to the terms and conditions of the underwriting agreement, we have agreed to sell to the underwriters, and each underwriter has severally agreed to purchase, at the public offering price less the underwriting discount set forth on the cover page of this prospectus, the number of shares of common stock listed next to its name in the following table:
| Name |
Number of Shares |
||
|---|---|---|---|
| J.P. Morgan Securities LLC | |||
| Goldman, Sachs & Co. | |||
| Merrill Lynch, Pierce, Fenner & Smith Incorporated |
|||
| Wells Fargo Securities, LLC | |||
| Tudor, Pickering, Holt & Co. Securities, Inc. | |||
| SG Americas Securities, LLC | |||
| Mitsubishi UFJ Securities (USA), Inc. | |||
| BMO Capital Markets Corp. | |||
| BNP Paribas Securities Corp. | |||
| Scotia Capital (USA) Inc. | |||
| Capital One Southcoast, Inc. | |||
| BOSC, Inc. | |||
| BB&T Capital Markets, a division of Scott & Stringfellow, LLC | |||
| Comerica Securities, Inc. | |||
| Howard Weil Incorporated | |||
| Total | |||
The underwriters are committed to purchase all the common stock offered by us if they purchase any shares. The underwriting agreement also provides that if an underwriter defaults, the purchase commitments of non-defaulting underwriters may also be increased or the offering may be terminated.
The underwriters propose to offer the common stock directly to the public at the initial public offering price set forth on the cover page of this prospectus and to certain dealers at that price less a concession not in excess of $ per share. After the initial public offering of the shares, the offering price and other selling terms may be changed by the underwriters. Sales of shares made outside of the United States may be made by affiliates of the underwriters. The representatives have advised us that the underwriters do not intend to confirm discretionary sales in excess of 5% of the common stock offered in this offering. The offering of the shares by the underwriters is subject to receipt and acceptance and subject to the underwriters right to reject any order in whole or in part.
159
The underwriters have an option to buy up to additional shares of common stock from us to cover sales of shares by the underwriters which exceed the number of shares specified in the table above. The underwriters have 30 days from the date of this prospectus to exercise this option to acquire additional shares of common stock. If any shares are purchased with option to acquire additional shares of common stock, the underwriters will purchase shares in approximately the same proportion as shown in the table above. If any additional shares of common stock are purchased, the underwriters will offer the additional shares on the same terms as those on which the shares are being offered.
The underwriting fee is equal to the public offering price per share of common stock less the amount paid by the underwriters to us per share of common stock. The underwriting fee is $ per share. The following table shows the per share and total underwriting discount to be paid to the underwriters assuming both no exercise and full exercise of the underwriters' option to purchase additional shares of common stock.
| |
Without over- allotment exercise |
With full over- allotment exercise |
|||||
|---|---|---|---|---|---|---|---|
Per share |
$ | $ | |||||
Total |
$ | $ | |||||
We estimate that the total expenses of this offering to us, including registration, filing and listing fees, printing fees, and legal and accounting expenses, but excluding the underwriting discount, will be approximately $ .
A prospectus in electronic format may be made available on the web sites maintained by one or more underwriters, or selling group members, if any, participating in the offering. The underwriters may agree to allocate a number of shares to underwriters and selling group members for sale to their online brokerage account holders. Internet distributions will be allocated by the representatives to underwriters and selling group members that may make Internet distributions on the same basis as other allocations.
We have agreed that we will not (1) offer, pledge, announce the intention to sell, sell, contract to sell, sell any option or contract to purchase, purchase any option or contract to sell, grant any option, right or warrant to purchase, or otherwise dispose of, directly or indirectly, or file with the Securities and Exchange Commission a registration statement under the Securities Act relating to, any shares of our common stock or securities convertible into or exchangeable or exercisable for any shares of our common stock, or publicly disclose the intention to make any offer, sale, pledge, disposition, or filing, or (2) enter into any swap or other arrangement that transfers all or a portion of the economic consequences associated with the ownership of any shares of common stock or any such other securities (regardless of whether any of these transactions are to be settled by the delivery of shares of common stock or such other securities, in cash or otherwise), in each case without the prior written consent of J.P. Morgan Securities LLC, Goldman, Sachs & Co. and Merrill Lynch, Pierce, Fenner & Smith Incorporated for a period of 180 days after the date of this prospectus, other than the shares of our common stock to be sold hereunder and any shares of our common stock issued upon the exercise of options granted under our management incentive plans. There are no agreements or other intentions, either tacit or explicit, regarding the possible early release of any common stock subject to the lock-up provisions.
160
Notwithstanding the foregoing, if (A) during the last 17 days of the 180-day restricted period, we issue an earnings release or material news or a material event relating to Laredo occurs; or (B) prior to the expiration of the 180-day restricted period, we announce that we will release earnings results during the 16-day period beginning on the last day of the 16-day period, the restrictions described above shall continue to apply until the expiration of the 18-day period beginning on the issuance of the earnings release or the occurrence of the material news or material event.
Certain affiliates of Warburg Pincus and each of our directors and executive officers have entered into lock-up agreements with the underwriters prior to the commencement of this offering pursuant to which each of these persons or entities, with limited exceptions, for a period of 180 days after the date of this prospectus, may not, without the prior written consent of J.P. Morgan Securities LLC, Goldman, Sachs & Co. and Merrill Lynch, Pierce, Fenner & Smith Incorporated (1) offer, pledge, announce the intention to sell, sell, contract to sell, sell any option or contract to purchase, purchase any option or contract to sell, grant any option, right or warrant to purchase, or otherwise transfer or dispose of, directly or indirectly, any shares of our common stock or any securities convertible into or exercisable or exchangeable for our common stock (including, without limitation, common stock or such other securities which may be deemed to be beneficially owned by such directors, executive officers, managers, and members in accordance with the rules and regulations of the SEC and securities which may be issued upon exercise of a stock option or warrant) or (2) enter into any swap or other agreement that transfers, in whole or in part, any of the economic consequences of ownership of the common stock or such other securities, whether any such transaction described in clause (1) or (2) above is to be settled by delivery of common stock or such other securities, in cash or otherwise, or (3) make any demand for or exercise any right with respect to the registration of any shares of our common stock or any security convertible into or exercisable or exchangeable for our common stock, except that Warburg Pincus will be permitted to spin-off our common stock that it owns to its shareholders days after the date of this prospectus. In addition, the lock-up agreements will not restrict the transfer of common stock as bona fide gifts, transfer by will or the laws of intestacy, transfers to family members (including to vehicles of which they are beneficial owners), transfers pursuant to domestic relations or court orders, or (in the case of corporations or other entities) transfers to affiliates, in each case so long as the transferee agrees to be bound by the restrictions in the lock-up agreements. Notwithstanding the foregoing, if (A) during the last 17 days of the 180-day restricted period, we issue an earnings release or material news or a material event relating to our company occurs; or (B) prior to the expiration of the 180-day restricted period, we announce that we will release earnings results during the 16-day period beginning on the last day of the 180-day period, the restrictions described above shall continue to apply until the expiration of the 18-day period beginning on the issuance of the earnings release or the occurrence of the material news or material event.
We have agreed to indemnify the several underwriters against certain liabilities, including liabilities under the Securities Act.
We intend to apply to have our shares of common stock listed on the New York Stock Exchange under the symbol "LPI."
In connection with this offering, the underwriters may engage in stabilizing transactions, which involves making bids for, purchasing and selling shares of common stock in the open market
161
for the purpose of preventing or retarding a decline in the market price of the common stock while this offering is in progress. These stabilizing transactions may include making short sales of the common stock, which involves the sale by the underwriters of a greater number of shares of common stock than they are required to purchase in this offering, and purchasing shares of common stock on the open market to cover positions created by short sales. Short sales may be "covered" shorts, which are short positions in an amount not greater than the underwriters' option to acquire additional shares of common stock referred to above, or may be "naked" shorts, which are short positions in excess of that amount. The underwriters may close out any covered short position either by exercising their option to acquire additional shares of common stock, in whole or in part, or by purchasing shares in the open market. In making this determination, the underwriters will consider, among other things, the price of shares available for purchase in the open market compared to the price at which the underwriters may purchase shares through the option to acquire additional shares of common stock. A naked short position is more likely to be created if the underwriters are concerned that there may be downward pressure on the price of the common stock in the open market that could adversely affect investors who purchase in this offering. To the extent that the underwriters create a naked short position, they will purchase shares in the open market to cover the position.
The underwriters have advised us that, pursuant to Regulation M of the Securities Act, they may also engage in other activities that stabilize, maintain or otherwise affect the price of the common stock, including the imposition of penalty bids. This means that if the representatives of the underwriters purchase common stock in the open market in stabilizing transactions or to cover short sales, the representative can require the underwriters that sold those shares as part of this offering to repay the underwriting discount received by them.
These activities may have the effect of raising or maintaining the market price of the common stock or preventing or retarding a decline in the market price of the common stock, and, as a result, the price of the common stock may be higher than the price that otherwise might exist in the open market. If the underwriters commence these activities, they may discontinue them at any time. The underwriters may carry out these transactions on the NYSE, in the over-the-counter market or otherwise.
Prior to this offering, there has been no public market for our common stock. The initial public offering price will be determined by negotiations between us and the representatives of the underwriters. In determining the initial public offering price, we and the representatives of the underwriters expect to consider a number of factors including:
- •
- the information set forth in this prospectus and otherwise available to the representative;
- •
- our prospects and the history and prospects for the industry in which we compete;
- •
- an assessment of our management;
- •
- our prospects for future earnings;
- •
- the general condition of the securities markets at the time of this offering;
- •
- the recent market prices of, and demand for, publicly traded common stock of generally comparable companies; and
162
- •
- other factors deemed relevant by the underwriters and us.
Neither we nor the underwriters can assure investors that an active trading market will develop for our common stock, or that the shares will trade in the public market at or above the initial public offering price.
Other than in the United States, no action has been taken by us or the underwriters that would permit a public offering of the securities offered by this prospectus in any jurisdiction where action for that purpose is required. The securities offered by this prospectus may not be offered or sold, directly or indirectly, nor may this prospectus or any other offering material or advertisements in connection with the offer and sale of any such securities be distributed or published in any jurisdiction, except under circumstances that will result in compliance with the applicable rules and regulations of that jurisdiction. Persons into whose possession this prospectus comes are advised to inform themselves about and to observe any restrictions relating to the offering and the distribution of this prospectus. This prospectus does not constitute an offer to sell or a solicitation of an offer to buy any securities offered by this prospectus in any jurisdiction in which such an offer or a solicitation is unlawful.
This document is only being distributed to and is only directed at (1) persons who are outside the United Kingdom or (2) to investment professionals falling within Article 19(5) of the Financial Services and Markets Act 2000 (Financial Promotion) Order 2005, which we refer to as the Order, or (3) high net worth entities, and other persons to whom it may lawfully be communicated, falling within Article 49(2)(a) to (d) of the Order, all such persons together we refer to as relevant persons. The securities are only available to, and any invitation, offer or agreement to subscribe, purchase or otherwise acquire such securities will be engaged in only with, relevant persons. Any person who is not a relevant person should not act or rely on this document or any of its contents.
In relation to each Member State of the European Economic Area which has implemented the Prospectus Directive, which we refer to as a Relevant Member State, from and including the date on which the European Union Prospectus Directive, or the EU Prospectus Directive, is implemented in that Relevant Member State, which we refer to this date as the Relevant Implementation Date, an offer of securities described in this prospectus may not be made to the public in that Relevant Member State prior to the publication of a prospectus in relation to the shares which has been approved by the competent authority in that Relevant Member State or, where appropriate, approved in another Relevant Member State and notified to the competent authority in that Relevant Member State, all in accordance with the EU Prospectus Directive, except that it may, with effect from and including the Relevant Implementation Date, make an offer of shares to the public in that Relevant Member State at any time:
- •
- to legal entities which are authorized or regulated to operate in the financial markets or, if not so authorized or
regulated, whose corporate purpose is solely to invest in securities;
- •
- to any legal entity which has two or more of (1) an average of at least 250 employees during the last financial
year; (2) a total balance sheet of more than €43,000,000 and (3) an annual net turnover of more than €50,000,000, as shown in its last annual or
consolidated accounts;
- •
- to fewer than 100 natural or legal persons (other than qualified investors as defined in the EU Prospectus Directive) subject to obtaining the prior consent of the book-running managers for any such offer; or
163
- •
- in any other circumstances which do not require the publication by the issuer of a prospectus pursuant to Article 3 of the Prospectus Directive.
For the purposes of this provision, the expression an "offer of securities to the public" in relation to any securities in any Relevant Member State means the communication in any form and by any means of sufficient information on the terms of the offer and the securities to be offered so as to enable an investor to decide to purchase or subscribe for the securities, as the same may be varied in that Member State by any measure implementing the EU Prospectus Directive in that Member State and the expression EU Prospectus Directive means Directive 2003/71/EC and includes any relevant implementing measure in each Relevant Member State.
The shares may not be offered or sold by means of any document other than (i) in circumstances which do not constitute an offer to the public within the meaning of the Companies Ordinance (Cap.32, Laws of Hong Kong), or (ii) to "professional investors" within the meaning of the Securities and Futures Ordinance (Cap.571, Laws of Hong Kong) and any rules made thereunder, or (iii) in other circumstances which do not result in the document being a "prospectus" within the meaning of the Companies Ordinance (Cap.32, Laws of Hong Kong), and no advertisement, invitation or document relating to the shares may be issued or may be in the possession of any person for the purpose of issue (in each case whether in Hong Kong or elsewhere), which is directed at, or the contents of which are likely to be accessed or read by, the public in Hong Kong (except if permitted to do so under the laws of Hong Kong) other than with respect to shares which are or are intended to be disposed of only to persons outside Hong Kong or only to "professional investors" within the meaning of the Securities and Futures Ordinance (Cap. 571, Laws of Hong Kong) and any rules made thereunder.
This prospectus has not been registered as a prospectus with the Monetary Authority of Singapore. Accordingly, this prospectus and any other document or material in connection with the offer or sale, or invitation for subscription or purchase, of the shares may not be circulated or distributed, nor may the shares be offered or sold, or be made the subject of an invitation for subscription or purchase, whether directly or indirectly, to persons in Singapore other than (i) to an institutional investor under Section 274 of the Securities and Futures Act, Chapter 289 of Singapore (the "SFA"), (ii) to a relevant person, or any person pursuant to Section 275(1A), and in accordance with the conditions, specified in Section 275 of the SFA or (iii) otherwise pursuant to, and in accordance with the conditions of, any other applicable provision of the SFA.
Where the shares are subscribed or purchased under Section 275 by a relevant person which is: (a) a corporation (which is not an accredited investor) the sole business of which is to hold investments and the entire share capital of which is owned by one or more individuals, each of whom is an accredited investor; or (b) a trust (where the trustee is not an accredited investor) whose sole purpose is to hold investments and each beneficiary is an accredited investor, shares, debentures and units of shares and debentures of that corporation or the beneficiaries' rights and interest in that trust shall not be transferable for 6 months after that corporation or that trust has acquired the shares under Section 275 except: (1) to an institutional investor under Section 274 of the SFA or to a relevant person, or any person pursuant to Section 275(1A), and in accordance with the conditions, specified in Section 275 of the SFA; (2) where no consideration is given for the transfer; or (3) by operation of law.
164
The securities have not been and will not be registered under the Financial Instruments and Exchange Law of Japan (the Financial Instruments and Exchange Law) and each underwriter has agreed that it will not offer or sell any securities, directly or indirectly, in Japan or to, or for the benefit of, any resident of Japan (which term as used herein means any person resident in Japan, including any corporation or other entity organized under the laws of Japan), or to others for re-offering or resale, directly or indirectly, in Japan or to a resident of Japan, except pursuant to an exemption from the registration requirements of, and otherwise in compliance with, the Financial Instruments and Exchange Law and any other applicable laws, regulations and ministerial guidelines of Japan.
The underwriters and their respective affiliates are full service financial institutions engaged in various activities, which may include securities trading, commercial and investment banking, financial advisory, investment management, investment research, principal investment, hedging, financing and brokerage activities. Certain of the underwriters and their affiliates have provided in the past to us and our affiliates and may provide from time to time in the future certain commercial banking, financial advisory, investment banking and other services for us and such affiliates for which they have received and may continue to receive customary fees and commissions. J.P. Morgan Securities LLC served as financial advisor to Broad Oak in connection with Laredo's acquisition of Broad Oak in July 2011.
In the ordinary course of their various business activities, the underwriters and their respective affiliates may make or hold a broad array of investments and actively trade debt and equity securities (or related derivative securities) and financial instruments (including bank loans) for their own account and for the accounts of their customers, and such investment and securities activities may involve securities and/or instruments of the issuer. The underwriters and their respective affiliates may also make investment recommendations and/or publish or express independent research views in respect of such securities or instruments and may at any time hold, or recommend to clients that they acquire, long and/or short positions in such securities and instruments.
Notice to prospective investors in Switzerland
The shares may not be publicly offered in Switzerland and will not be listed on the SIX Swiss Exchange ("SIX") or on any other stock exchange or regulated trading facility in Switzerland. This document has been prepared without regard to the disclosure standards for issuance prospectuses under art. 652a or art. 1156 of the Swiss Code of Obligations or the disclosure standards for listing prospectuses under art. 27 ff. of the SIX Listing Rules or the listing rules of any other stock exchange or regulated trading facility in Switzerland. Neither this document nor any other offering or marketing material relating to the shares or the offering may be publicly distributed or otherwise made publicly available in Switzerland.
Neither this document nor any other offering or marketing material relating to the offering, Laredo, the shares have been or will be filed with or approved by any Swiss regulatory authority. In particular, this document will not be filed with, and the offer of shares will not be supervised by, the Swiss Financial Market Supervisory Authority FINMA (FINMA), and the offer of shares has not been and will not be authorized under the Swiss Federal Act on Collective Investment Schemes ("CISA"). The investor protection afforded to acquirers of interests in collective investment schemes under the CISA does not extend to acquirers of shares.
165
Notice to prospective investors in the Dubai International Financial Centre
This prospectus relates to an Exempt Offer in accordance with the Offered Securities Rules of the Dubai Financial Services Authority ("DFSA"). This prospectus is intended for distribution only to persons of a type specified in the Offered Securities Rules of the DFSA. It must not be delivered to, or relied on by, any other person. The DFSA has no responsibility for reviewing or verifying any documents in connection with Exempt Offers. The DFSA has not approved this prospectus nor taken steps to verify the information set forth herein and has no responsibility for the prospectus. The shares to which this prospectus relates may be illiquid and/or subject to restrictions on their resale. Prospective purchasers of the shares offered should conduct their own due diligence on the shares. If you do not understand the contents of this prospectus you should consult an authorized financial advisor.
Conflicts of interest
We intend to use at least five percent of the net proceeds of this offering to repay indebtedness owed by us to certain affiliates of the underwriters who are lenders under our senior secured credit facility. See "Use of proceeds." An affiliate of each of J.P. Morgan Securities LLC, Goldman, Sachs & Co., Merrill Lynch, Pierce, Fenner & Smith Incorporated and Wells Fargo Securities, LLC is a lender under our senior secured credit facility, and may receive its pro rata portion of the proceeds from this offering used to repay amounts outstanding under our senior secured credit facility. J.P. Morgan Securities LLC, Merrill Lynch, Pierce, Fenner & Smith Incorporated and Wells Fargo Securities, LLC each have a "conflict of interest" within the meaning of FINRA Rule 5121, or Rule 5121. Accordingly, this offering will be made in compliance with the applicable provisions of Rule 5121. Rule 5121 provides that if at least five percent of the net offering proceeds not including underwriting compensation, are used to reduce or retire the balance of a loan or credit facility extended by any underwriter or its affiliates, a qualified independent underwriter, or QIU, meeting certain standards must participate in the preparation of the registration statement and the prospectus and exercise the usual standards of due diligence with respect thereto. Goldman, Sachs & Co. has served in that capacity and performed due diligence investigations and reviewed and participated in the preparation of the registration statement of which this prospectus forms a part. We have agreed to indemnify Goldman, Sachs & Co. against certain liabilities incurred in connection with it acting as a QIU for this offering, including liabilities under the Securities Act.
Certain legal matters in connection with this offering will be passed upon for us by Kenneth E. Dornblaser, our Senior Vice President and General Counsel. Upon the consummation of this offering, Mr. Dornblaser will beneficially own shares of common stock, of which are subject to forfeiture and vesting requirements. The validity of our common stock offered by this prospectus will be passed upon for us by Akin Gump Strauss Hauer & Feld LLP, Houston, Texas. Certain legal matters in connection with this offering will be passed upon for the underwriters by Andrews Kurth LLP, Houston, Texas.
166
The balance sheet of Laredo Petroleum Holdings, Inc. as of August 12, 2011 and the combined financial statements of Laredo Petroleum as of December 31, 2010 and 2009 and for each of the years in the three year period ended December 31, 2010, included in this prospectus and elsewhere in the registration statement have been so included in reliance upon the reports of Grant Thornton LLP, independent registered public accountants, upon the authority of said firm as experts in accounting and auditing in giving said reports.
The statement of revenue and direct operating expenses of the interests of Linn Energy Holdings, LLC, Linn Operating, Inc., Mid-Continent I, LLC, Mid-Continent II, LLC, and Linn Exploration Midcontinent, LLC in certain oil and gas properties acquired by Laredo Petroleum, Inc. and subsidiaries for the period from January 1, 2008 to August 14, 2008, included in this prospectus and elsewhere in the registration statement have been so included in reliance upon the report of Grant Thornton LLP, independent certified public accountants, upon the authority of said firm as experts in accounting and auditing in giving said report.
The combined estimates of our proved reserves as of December 31, 2010 and June 30, 2011, as well as the estimates of Laredo Petroleum Inc.'s proved reserves as of December 31, 2008 and December 2009 included in this prospectus are based on a reserve report prepared by Ryder Scott Company, L.P., independent petroleum engineers. These estimates are included in this prospectus in reliance upon the authority of the firm as experts in these matters.
167
Where you can find more information
We have filed with the SEC a registration statement on Form S-1 (including the exhibits, schedules and amendments thereto) regarding the shares of our common stock offered hereby. This prospectus does not contain all of the information found in the registration statement and the exhibits and schedules thereto. For further information regarding us and the common stock offered by this prospectus, you may desire to review the full registration statement, including its exhibits and schedules, filed under the Securities Act. Statements contained in this prospectus as to the contents of any contract, agreement or any other document are summaries of the material terms of this contract, agreement or other document. With respect to each of these contracts, agreements or other documents filed as an exhibit to the registration statement, reference is made to the exhibits for a more complete description of the matter involved. The registration statement of which this prospectus forms a part, including its exhibits and schedules, may be inspected and copied at the public reference room maintained by the SEC at 100 F Street, N.E., Washington, D.C. 20549. Copies of the materials may also be obtained from the SEC at prescribed rates by writing to the public reference room maintained by the SEC at 100 F Street, N.E., Room 1580, Washington, D.C. 20549. You may obtain information on the operation of the public reference room by calling the SEC at 1-800-SEC-0330. The SEC maintains a website on the Internet at http://www.sec.gov. Our registration statement, of which this prospectus constitutes a part, can be downloaded from the SEC's website.
After we have completed this offering, we will file annual, quarterly and current reports, proxy statements and other information with the SEC. We maintain a website at www.laredopetro.com and we expect to make our periodic reports and other information filed with or furnished to the SEC available, free of charge, through our website, as soon as reasonably practicable after those reports and other information are electronically filed with or furnished to the SEC. Information on our website or any other website is not incorporated by reference into, and does not constitute a part of, this prospectus. You may read and copy any reports, statements or other information on file at the public reference rooms. You can also request copies of these documents, for a copying fee, by writing to the SEC, or you can review these documents on the SEC's website, as described above. In addition, we will provide electronic or paper copies of our filings free of charge upon request.
168
F-1
Laredo Petroleum
Unaudited pro forma condensed combined
financial statements
Introduction
On July 1, 2011, Laredo Petroleum, LLC ("Laredo LLC") and its wholly-owned subsidiary Laredo Petroleum, Inc. ("Laredo") completed the acquisition of Broad Oak Energy, Inc. ("Broad Oak"), which became a wholly-owned subsidiary of Laredo (the "Broad Oak Transaction"). As Laredo LLC and Broad Oak (collectively and including Laredo, Laredo Petroleum Texas, LLC, and Laredo Gas Services, LLC, the "Combined Company" or "Laredo Petroleum") are commonly controlled by affiliates of Warburg Pincus LLC, the Broad Oak Transaction was accounted for in a manner similar to a pooling of interests. As a result, the Laredo Petroleum historical amounts in the accompanying unaudited pro forma condensed combined financial statements give retrospective effect to the Broad Oak Transaction, whereby the assets and liabilities of Laredo LLC and Broad Oak are reflected at the historical carrying values and their operations are presented as if they were combined for all periods presented.
On August 12, 2011, Laredo LLC formed a new wholly-owned subsidiary, Laredo Petroleum Holdings, Inc. ("Laredo Holdings") in anticipation of an initial public offering ("IPO"). Immediately prior to the consummation of the IPO, Laredo LLC will be merged into Laredo Holdings and Laredo Holdings will continue as the surviving corporation.
Set forth below are the unaudited pro forma condensed combined balance sheets as of June 30, 2011 and the unaudited pro forma condensed combined statements of operations for the year ended December 31, 2010 and the six months ended June 30, 2011, giving effect to the transactions described below under "—Offering Transactions."
Our unaudited pro forma condensed combined financial statements should be read in conjunction with the audited and unaudited combined financial statements of Laredo Petroleum included elsewhere in this prospectus. These unaudited pro forma condensed combined financial statements are based on (i) the audited historical results of operations of the Combined Company for the year ended December 31, 2010 and (ii) the unaudited historical results of operations of the Combined Company for the six months ended June 30, 2011.
Our unaudited pro forma condensed combined financial statements present the unaudited pro forma condensed combined balance sheet of the Combined Company as of June 30, 2011, after giving pro forma effect to the transactions described below under "—Offering Transactions", as if the Offering Transactions had occurred on June 30, 2011.
Our unaudited pro forma condensed combined financial statements present the unaudited condensed combined statements of operations of the Combined Company for the year ended December 31, 2010 and the six months ended June 30, 2011, after giving pro forma effect to the transactions described below under "—Offering Transactions" as if the Offering Transactions had occurred on January 1, 2010.
Our unaudited pro forma condensed combined financial statements do not include an adjustment for the estimated incremental increase in general and administrative expenses over historical levels as a result of becoming a publicly-traded corporation. We estimate that such
F-2
increase in costs will be approximately $5 million. In addition, our unaudited pro forma condensed combined financial statements do not give any effect to any restructuring costs, potential costs savings or other changes related to the Broad Oak Transaction.
Our unaudited pro forma condensed combined financial statements are based on certain assumptions and do not purport to be indicative of the results that actually would have been achieved if the Offering Transaction was completed on the applicable dates. Moreover, they do not project our financial position or results of operations for any future date or period.
Offering transactions
Our unaudited pro forma condensed combined financial statements give pro forma effect to the following transactions, which we refer to collectively as the "Offering Transactions":
- •
- The conversion of all of the outstanding Series A-1, A-2 and BOE Preferred Units, and the
Series B-1 Units, Series B-2 Units,
Series D Units, Series F Units,
Series G Units and BOE Incentive Units held by the members of Laredo LLC into shares of common stock of Laredo Holdings and the Series C Units and
Series E
Units expiring without value;
- •
- The assumed issuance of approximately million shares of common stock of Laredo Holdings in this
offering resulting in estimated proceeds of approximately $ million, net of estimated offering costs of approximately
$ million, as described in "Use of
proceeds;" and
- •
- The application of the net proceeds from this offering as described in "Use of proceeds."
We currently estimate that the initial public offering price of our common stock will be $ per share. Our estimate of offering costs is as follows:
| (in thousands) |
|
|
|---|---|---|
Underwriting fees, discounts and commissions |
$ | |
Accounting and legal costs |
||
Printing costs |
||
Other |
||
Estimated total offering costs |
$ | |
F-3
Laredo Petroleum
Unaudited pro forma condensed combined balance sheet
as of June 30, 2011
(in thousands)
| |
|
Offering transasction pro forma adjustments |
|
||||||||||||
|---|---|---|---|---|---|---|---|---|---|---|---|---|---|---|---|
| |
Laredo Petroleum historical |
|
|||||||||||||
| |
Amount |
Note 2 |
Pro forma |
||||||||||||
ASSETS |
|||||||||||||||
CURRENT ASSETS: |
|||||||||||||||
Cash and cash equivalents |
$ | 22,052 | $ | $ | |||||||||||
Accounts receivable, net |
56,081 | ||||||||||||||
Materials and supplies |
3,983 | ||||||||||||||
Prepaid expenses |
2,177 | ||||||||||||||
Derivative financial instruments |
5,974 | ||||||||||||||
Deferred income taxes |
13,652 | ||||||||||||||
Total current assets |
103,919 | ||||||||||||||
PROPERTY AND EQUIPMENT: |
|||||||||||||||
Net property and equipment |
1,078,036 | ||||||||||||||
OTHER LONG-TERM ASSETS, net |
19,275 | ||||||||||||||
DEFERRED INCOME TAXES |
115,563 | ||||||||||||||
Total assets |
$ | 1,316,793 | $ | $ | |||||||||||
LIABILITIES AND EQUITY |
|||||||||||||||
CURRENT LIABILITIES: |
|||||||||||||||
Accounts payable |
$ | 43,318 | $ | $ | |||||||||||
Other current liabilities |
105,427 | ||||||||||||||
Total current liabilities |
148,745 | ||||||||||||||
LONG-TERM DEBT |
690,400 | ||||||||||||||
OTHER LONG-TERM LIABILITIES |
19,931 | ||||||||||||||
Total liabilities |
859,076 | ||||||||||||||
EQUITY |
457,717 | ||||||||||||||
Total liabilities and equity |
$ | 1,316,793 | $ | $ | |||||||||||
See accompanying notes.
F-4
Laredo Petroleum
Unaudited pro forma
condensed combined statement of operations
For the six months ended June 30, 2011
(in thousands, except per share amounts)
| |
|
Offering transaction pro forma adjustments |
|
|||||||||||||
|---|---|---|---|---|---|---|---|---|---|---|---|---|---|---|---|---|
| |
Laredo Petroleum historical |
|
||||||||||||||
| |
Amount |
Note 2 |
Pro forma |
|||||||||||||
REVENUES: |
||||||||||||||||
Oil and gas sales |
$ | 236,532 | $ | $ | ||||||||||||
Natural gas transportation and treating |
2,306 | |||||||||||||||
Drilling and production |
3 | |||||||||||||||
Total revenues |
238,841 | |||||||||||||||
COSTS AND EXPENSES: |
||||||||||||||||
Lease operating expenses, including production taxes |
33,111 | |||||||||||||||
Natural gas transportation and treating |
1,167 | |||||||||||||||
Drilling and production |
696 | |||||||||||||||
General and administrative |
19,770 | |||||||||||||||
Accretion of asset retirement obligations |
304 | |||||||||||||||
Depreciation, depletion and amortization |
75,917 | |||||||||||||||
Other costs and expenses |
243 | |||||||||||||||
Total costs and expenses |
131,208 | |||||||||||||||
OPERATING INCOME (LOSS) |
107,633 | |||||||||||||||
NON-OPERATING INCOME (EXPENSE): |
||||||||||||||||
Realized and unrealized gain (loss): |
||||||||||||||||
Commodity derivative financial instruments, net |
(9,585 | ) | ||||||||||||||
Interest rate derivatives, net |
(1,094 | ) | ||||||||||||||
Interest expense |
(22,252 | ) | ||||||||||||||
Other |
(3,223 | ) | ||||||||||||||
Non-operating expense, net |
(36,154 | ) | ||||||||||||||
Income before income taxes |
71,479 | |||||||||||||||
INCOME TAX EXPENSE: |
||||||||||||||||
Deferred |
(25,737 | ) | ||||||||||||||
Total income tax expense |
(25,737 | ) | ||||||||||||||
NET INCOME |
$ | 45,742 | $ | $ | ||||||||||||
Earnings per common share: |
||||||||||||||||
Basic |
$ | |||||||||||||||
Diluted |
$ | |||||||||||||||
Weighted average common shares outstanding: |
||||||||||||||||
Basic |
||||||||||||||||
Diluted |
||||||||||||||||
See accompanying notes.
F-5
Laredo Petroleum
Unaudited pro forma condensed combined
statement of operations
for the year ended December 31, 2010
(in thousands, except per share amounts)
| |
|
Offering transasction pro forma adjustments |
|
|||||||||||||
|---|---|---|---|---|---|---|---|---|---|---|---|---|---|---|---|---|
| |
Laredo Petroleum historical |
|
||||||||||||||
| |
Amount |
Note 2 |
Pro forma |
|||||||||||||
REVENUES: |
||||||||||||||||
Oil and gas sales |
$ | 239,783 | $ | $ | ||||||||||||
Natural gas transportation and treating |
2,217 | |||||||||||||||
Drilling and production |
4 | |||||||||||||||
Total revenues |
242,004 | |||||||||||||||
COSTS AND EXPENSES: |
||||||||||||||||
Lease operating expenses, including production taxes |
37,383 | |||||||||||||||
Natural gas transportation and treating |
2,501 | |||||||||||||||
Drilling and production |
344 | |||||||||||||||
General and administrative |
30,908 | |||||||||||||||
Accretion of asset retirement obligations |
475 | |||||||||||||||
Depreciation, depletion and amortization |
97,411 | |||||||||||||||
Total costs and expenses |
169,022 | |||||||||||||||
OPERATING INCOME |
72,982 | |||||||||||||||
NON-OPERATING INCOME (EXPENSE): |
||||||||||||||||
Realized and unrealized gain (loss): |
||||||||||||||||
Commodity derivative financial instruments, net |
11,190 | |||||||||||||||
Interest rate derivatives, net |
(5,375 | ) | ||||||||||||||
Interest expense |
(18,482 | ) | ||||||||||||||
Other |
121 | |||||||||||||||
Non-operating expense, net |
(12,546 | ) | ||||||||||||||
Income before income taxes |
60,436 | |||||||||||||||
INCOME TAX BENEFIT: |
||||||||||||||||
Deferred |
25,812 | |||||||||||||||
Total income tax benefit |
25,812 | |||||||||||||||
NET INCOME |
$ | 86,248 | $ | $ | ||||||||||||
Earnings per common share: |
||||||||||||||||
Basic |
$ | |||||||||||||||
Diluted |
$ | |||||||||||||||
Weighted average common shares outstanding: |
||||||||||||||||
Basic |
||||||||||||||||
Diluted |
||||||||||||||||
See accompanying notes.
F-6
Laredo Petroleum
Unaudited pro forma condensed combined
financial statements
Note 1—Basis of presentation
See "—Introduction" for more information regarding the basis of presentation for the unaudited pro forma condensed combined financial statements.
See Note E to the audited combined financial statements and Note D in the unaudited combined financial statements included in this prospectus for additional information pertaining to owners' equity as of December 31, 2010 and June 30, 2011.
Note 2—Pro forma adjustments
Our pro forma condensed combined financial statements reflect the impact of the following adjustments:
Offering transactions adjustments
(a) Reflects the estimated proceeds from the issuance of common stock in this offering, net of issuance costs of $ million.
(b) Reflects the utilization of the net proceeds from the Offering Transactions to pay in full the historical long-term credit facilities of the Combined Company as of January 1, 2010 and the related elimination of historical interest expense.
(c) Gives effect to the issuance of common shares contemplated by this offering at an assumed initial public offering price of $ per share of common stock (the midpoint of the price range set forth on the cover page of this prospectus) less underwriting discounts and commissions and expenses payable by us.
(d) Gives effect to the accumulated 7% preferred return for Series A-1, Series A-2 and BOE Preferred Units. The holders of Series A-1, Series A-2 and BOE Preferred Units will receive the accumulated preferred return upon the consummation of a "Qualified Public Offering" as defined in the limited liability company agreement of Laredo LLC (as amended and restated, the "Agreement"). The pro forma accumulated preferred return has been recorded as of June 30, 2011. See Note E in our audited combined financial statements and Note D in our unaudited combined financial statements.
F-7
Note 3—Pro forma earnings per share computation
(a) Gives effect to the exchange of all the interest in Laredo LLC for newly issued shares of common stock of Laredo Holdings pursuant to the terms of a corporate reorganization that will be completed simultaneously with, or prior to, the closing of this offering. Pursuant to the Agreement, all of the preferred units of Laredo LLC and certain series of restricted units of Laredo LLC (depending upon the initial public offering price of the offering), will be exchanged into common stock based on the pre-offering equity value of such interests. This results in the Series A-1, Series A-2, BOE Preferred, Series B-1, Series B-2, Series D Units, Series F Units, Series G Units and BOE Incentive Units being exchanged into , , , , , , , and shares of common stock, respectively, or shares of common stock in the aggregate.
(b) The weighted average common shares outstanding have been calculated as if the ownership structure resulting from the corporate reorganization was in place since January 1, 2010.
F-8
Laredo Petroleum
Combined balance sheets
June 30, 2011 and December 31, 2010
(in thousands)
(Unaudited)
| |
June 30, 2011 |
December 31, 2010 |
||||||||
|---|---|---|---|---|---|---|---|---|---|---|
ASSETS |
||||||||||
CURRENT ASSETS: |
||||||||||
Cash and cash equivalents |
$ | 22,052 | $ | 31,235 | ||||||
Accounts receivable, net: |
||||||||||
Oil and gas sales |
42,542 | 31,773 | ||||||||
Joint operations |
13,445 | 12,031 | ||||||||
Other |
94 | 135 | ||||||||
Materials and supplies |
3,983 | 4,154 | ||||||||
Prepaid expenses |
2,177 | 1,483 | ||||||||
Derivative financial instruments |
5,974 | 8,376 | ||||||||
Deferred income taxes |
13,652 | 11,229 | ||||||||
Total current assets |
103,919 | 100,416 | ||||||||
PROPERTY AND EQUIPMENT: |
||||||||||
Oil and gas properties, full cost method: |
||||||||||
Proved properties |
1,723,530 | 1,379,885 | ||||||||
Unproved properties not being amortized |
87,128 | 96,515 | ||||||||
Pipeline and gas gathering assets |
48,746 | 43,271 | ||||||||
Other fixed assets |
15,136 | 10,869 | ||||||||
|
1,874,540 | 1,530,540 | ||||||||
Less accumulated depreciation, depletion, amortization and impairment |
796,504 | 720,647 | ||||||||
Net property and equipment |
1,078,036 | 809,893 | ||||||||
OTHER ASSETS, net |
76 | 85 | ||||||||
MATERIALS AND SUPPLIES |
1,889 | 1,886 | ||||||||
DEFERRED INCOME TAXES |
115,563 | 143,723 | ||||||||
DERIVATIVE FINANCIAL INSTRUMENTS |
1,523 | 1,804 | ||||||||
DEFERRED LOAN COSTS, net |
15,787 | 10,353 | ||||||||
Total assets |
$ | 1,316,793 | $ | 1,068,160 | ||||||
LIABILITIES AND OWNERS' EQUITY |
||||||||||
CURRENT LIABILITIES: |
||||||||||
Accounts payable |
$ | 43,318 | $ | 41,338 | ||||||
Undistributed revenue and royalties |
18,683 | 10,664 | ||||||||
Accrued capital expenditures |
41,520 | 65,900 | ||||||||
Accrued compensation and benefits |
4,808 | 8,778 | ||||||||
Other accrued liabilities |
27,882 | 10,854 | ||||||||
Current portion of asset retirement obligations |
397 | 731 | ||||||||
Derivative financial instruments |
12,137 | 11,978 | ||||||||
Total current liabilities |
148,745 | 150,243 | ||||||||
LONG-TERM DEBT |
690,400 | 491,600 | ||||||||
GAS IMBALANCES |
1,042 | 1,093 | ||||||||
DERIVATIVE FINANCIAL INSTRUMENTS |
10,042 | 5,987 | ||||||||
ASSET RETIREMENT OBLIGATIONS |
8,361 | 7,547 | ||||||||
DEFERRED LEASE LIABILITY |
486 | 591 | ||||||||
Total liabilities |
859,076 | 657,061 | ||||||||
OWNERS' EQUITY, per accompanying statement |
457,717 | 411,099 | ||||||||
Total liabilities and owners' equity |
$ | 1,316,793 | $ | 1,068,160 | ||||||
The accompanying condensed notes are an integral part of these combined financial statements.
F-9
Laredo Petroleum
Combined statements of operations
For the six months ended June 30, 2011 and 2010
(in thousands)
(Unaudited)
| |
Six months ended June 30, |
|||||||||
|---|---|---|---|---|---|---|---|---|---|---|
| |
2011 |
2010 |
||||||||
REVENUES: |
||||||||||
Oil and gas sales |
$ | 236,532 | $ | 95,615 | ||||||
Natural gas transportation and treating |
2,306 | 1,308 | ||||||||
Drilling and production |
3 | 3 | ||||||||
Total revenues |
238,841 | 96,926 | ||||||||
COSTS AND EXPENSES: |
||||||||||
Lease operating expenses |
18,112 | 9,676 | ||||||||
Production and ad valorem taxes |
14,999 | 6,568 | ||||||||
Natural gas transportation and treating |
1,167 | 1,643 | ||||||||
Drilling and production |
696 | 96 | ||||||||
General and administrative |
19,770 | 15,053 | ||||||||
Accretion of asset retirement obligations |
304 | 221 | ||||||||
Depreciation, depletion and amortization |
75,917 | 36,639 | ||||||||
Impairment expense |
243 | — | ||||||||
Total costs and expenses |
131,208 | 69,896 | ||||||||
OPERATING INCOME |
107,633 | 27,030 | ||||||||
NON-OPERATING INCOME (EXPENSE): |
||||||||||
Realized and unrealized gain (loss): |
||||||||||
Commodity derivative financial instruments, net |
(9,585 | ) | 23,090 | |||||||
Interest rate derivatives, net |
(1,094 | ) | (3,952 | ) | ||||||
Interest expense |
(22,252 | ) | (5,928 | ) | ||||||
Interest income |
55 | 97 | ||||||||
Write-off of deferred loan costs |
(3,246 | ) | — | |||||||
Loss on disposal of assets |
(35 | ) | (32 | ) | ||||||
Other |
3 | — | ||||||||
Non-operating income (expense), net |
(36,154 | ) | 13,275 | |||||||
Income before income taxes |
71,479 | 40,305 | ||||||||
INCOME TAX EXPENSE: |
||||||||||
Deferred |
(25,737 | ) | (5,780 | ) | ||||||
Total income tax expense |
(25,737 | ) | (5,780 | ) | ||||||
NET INCOME |
$ | 45,742 | $ | 34,525 | ||||||
The accompanying condensed notes are an integral part of these combined financial statements.
F-10
Laredo Petroleum
Combined statement of owners' equity
For the six months ended June 30, 2011
(in thousands)
(Unaudited)
| |
Broad Oak | Laredo | |
|
||||||||||||||||||||||||||||||||||||
|---|---|---|---|---|---|---|---|---|---|---|---|---|---|---|---|---|---|---|---|---|---|---|---|---|---|---|---|---|---|---|---|---|---|---|---|---|---|---|---|---|
| |
Common Stock | Preferred Stock | Treasury Stock (at cost) |
Additional paid-in capital |
Series A | Restricted Units | Treasury Units (at cost) |
|
|
|||||||||||||||||||||||||||||||
| |
Accumulated deficit |
|
||||||||||||||||||||||||||||||||||||||
| |
Shares |
Amount |
Shares |
Amount |
Units |
Amount |
Units |
Amount |
Total |
|||||||||||||||||||||||||||||||
BALANCE, December 31, 2010 |
249 | $ | — | 1,600 | $ | 2 | $ | (504 | ) | $ | 156,098 | 99,870 | $ | 549,187 | 31,432 | $ | 4,504 | $ | — | $ | (298,188 | ) | $ | 411,099 | ||||||||||||||||
Equity-based compensation |
— | — | — | — | — | 30 | — | — | 2,131 | 846 | — | — | 876 | |||||||||||||||||||||||||||
Cancellation of restricted units |
— | — | — | — | — | — | — | — | (353 | ) | — | — | — | — | ||||||||||||||||||||||||||
Net income |
— | — | — | — | — | — | — | — | — | — | — | 45,742 | 45,742 | |||||||||||||||||||||||||||
BALANCE, June 30, 2011 |
249 | $ | — | 1,600 | $ | 2 | $ | (504 | ) | $ | 156,128 | 99,870 | $ | 549,187 | 33,210 | $ | 5,350 | $ | — | $ | (252,446 | ) | $ | 457,717 | ||||||||||||||||
The accompanying notes are an integral part of these combined financial statements.
F-11
Laredo Petroleum
Combined statements of cash flows
For the six months ended June 30, 2011 and 2010
(in thousands)
(Unaudited)
| |
Six months ended June 30, |
||||||||||
|---|---|---|---|---|---|---|---|---|---|---|---|
| |
2011 |
2010 |
|||||||||
CASH FLOWS FROM OPERATING ACTIVITIES: |
|||||||||||
Net income |
$ | 45,742 | $ | 34,525 | |||||||
Adjustments to reconcile net income to net cash provided by operating activities: |
|||||||||||
Deferred income tax expense (benefit) |
25,737 | 5,780 | |||||||||
Depreciation, depletion and amortization |
75,917 | 36,639 | |||||||||
Impairment expense |
243 | — | |||||||||
Non-cash equity-based compensation |
876 | 688 | |||||||||
Accretion of asset retirement obligations |
304 | 221 | |||||||||
Unrealized (gain) loss on derivative financial instruments, net |
7,192 | (12,603 | ) | ||||||||
Premiums paid for derivative financial instruments |
(512 | ) | (132 | ) | |||||||
Amortization of premiums paid for derivative financial instruments |
216 | 72 | |||||||||
Amortization of deferred loan costs |
1,909 | 640 | |||||||||
Write-off of deferred loan costs |
3,246 | — | |||||||||
Amortization of other assets |
9 | 11 | |||||||||
Loss on disposal of assets |
12 | 32 | |||||||||
Changes in assets and liabilities: |
|||||||||||
Change in accounts receivable |
(12,142 | ) | (5,197 | ) | |||||||
Change in materials and supplies |
(74 | ) | 11 | ||||||||
Change in prepaid expenses |
(694 | ) | 377 | ||||||||
Change in accounts payable |
(6,513 | ) | (6,124 | ) | |||||||
Change in undistributed revenue and royalties |
8,019 | (386 | ) | ||||||||
Change in accrued compensation and benefits |
(3,970 | ) | 985 | ||||||||
Change in other accrued liabilities |
16,595 | 2,116 | |||||||||
Change in deferred lease liability |
(54 | ) | (3 | ) | |||||||
Net cash provided by operating activities |
162,058 | 57,652 | |||||||||
CASH FLOWS FROM INVESTING ACTIVITIES: |
|||||||||||
Capital expenditures: |
|||||||||||
Oil and gas properties |
(348,523 | ) | (179,077 | ) | |||||||
Pipeline and gathering assets |
(6,344 | ) | (1,456 | ) | |||||||
Other fixed assets |
(4,602 | ) | (786 | ) | |||||||
Proceeds from other fixed asset disposals |
20 | 54 | |||||||||
Net cash used in investing activities |
(359,449 | ) | (181,265 | ) | |||||||
CASH FLOWS FROM FINANCING ACTIVITIES: |
|||||||||||
Borrowings on revolving credit facilities |
180,100 | 79,500 | |||||||||
Payments on revolving credit facilities |
(231,300 | ) | (5,800 | ) | |||||||
Payments on term loan |
(100,000 | ) | — | ||||||||
Issuance of 2019 Notes |
350,000 | — | |||||||||
Capital contributions |
— | 61,575 | |||||||||
Payments for loan costs |
(10,592 | ) | (1,768 | ) | |||||||
Net cash provided by financing activities |
188,208 | 133,507 | |||||||||
NET INCREASE (DECREASE) IN CASH AND CASH EQUIVALENTS |
(9,183 | ) | 9,894 | ||||||||
CASH AND CASH EQUIVALENTS, beginning of period |
31,235 | 14,987 | |||||||||
CASH AND CASH EQUIVALENTS, end of period |
$ | 22,052 | $ | 24,881 | |||||||
SUPPLEMENTAL DISCLOSURE OF CASH FLOW INFORMATION: |
|||||||||||
Cash paid during the period: |
|||||||||||
Interest |
$ | 6,626 | $ | 5,003 | |||||||
The accompanying condensed notes are an integral part of these combined financial statements.
F-12
Laredo Petroleum
Condensed notes to the combined financial statements
June 30, 2011
(Unaudited)
A—Organization
Laredo Petroleum, Inc. ("Laredo"), a Delaware corporation, was incorporated on October 10, 2006, for the purpose of acquiring, developing and operating oil and gas producing properties on its behalf and on the behalf of others. On October 20, 2006, Laredo entered into a consulting agreement with Warburg Pincus Private Equity IX, L.P. ("Warburg Pincus IX") under which Laredo, as an independent contractor, agreed to pursue and develop acquisition and investment opportunities in the oil and gas industry for the benefit of Warburg Pincus IX and certain of its affiliates, all formed by and under common control of Warburg Pincus LLC (collectively, the "Warburg Pincus Partnerships").
Laredo Petroleum Texas, LLC ("Laredo Texas"), a Texas limited liability company, was formed in 2007 and is a wholly-owned subsidiary of Laredo. Laredo Texas was formed to acquire ownership interest in certain oil and gas properties primarily in Hansford, Hutchinson, Roberts and Ochiltree Counties, Texas.
Laredo Gas Services, LLC ("Laredo Gas"), a Delaware limited liability company, was formed in 2007 and is a wholly-owned subsidiary of Laredo. Laredo Gas was formed to own and operate gathering and marketing assets and related facilities for Laredo and Laredo Texas.
In May 2007, certain investors of the Warburg Pincus Partnerships and Laredo management contributed their common stock in Laredo to Laredo Petroleum, LLC ("Laredo LLC"), a Delaware limited liability company, and Laredo became a wholly-owned subsidiary of Laredo LLC. The consulting agreement between Laredo and Warburg Pincus IX was consequently terminated. Laredo LLC is focused on the exploration, development and acquisition of oil and natural gas in the Mid-Continent and Permian regions of the United States.
In these notes, the "Company" refers to Laredo LLC, Laredo, Laredo Texas and Laredo Gas, collectively.
Broad Oak Energy, Inc. ("Broad Oak"), a Delaware corporation, was formed on May 11, 2006, and is engaged in the acquisition, exploration, development and production of oil and natural gas in the southwestern United States. Immediately upon formation, Broad Oak entered into a stock purchase agreement with Warburg Pincus IX and Broad Oak management.
On July 1, 2011, Laredo LLC and Laredo completed the acquisition of Broad Oak, which became a wholly-owned subsidiary of Laredo and subsequently changed its name to Laredo Petroleum—Dallas, Inc. In connection with the transaction, Laredo LLC issued: (i) approximately 86.5 million preferred equity units to Warburg Pincus IX and its affiliate in exchange for the convertible preferred stock previously held in Broad Oak; and (ii) approximately 2.4 million preferred equity units to Broad Oak's management and directors in exchange for certain of the vested common stock and convertible preferred stock previously held in Broad Oak. In addition, Laredo paid approximately $82 million in cash for certain Broad Oak vested common stock,
F-13
convertible preferred stock and all outstanding and vested Broad Oak options that certain Broad Oak directors, management and employees elected to sell. All unvested shares of Broad Oak common stock and unvested Broad Oak options were cancelled. Immediately following the consummation of this transaction, Laredo LLC assigned 100% of its ownership interest in Broad Oak to Laredo as a contribution to capital (the transactions described in this paragraph collectively, the "Broad Oak Transaction"). In connection with the Broad Oak Transaction, the Broad Oak Credit Facility was paid in full and terminated on July 1, 2011.
Because the Company and Broad Oak (collectively and including Laredo, Laredo Texas, and Laredo Gas, the "Combined Company" or "Laredo Petroleum") are commonly controlled by Warburg Pincus Partnerships, the Broad Oak Transaction was accounted for in a manner similar to a pooling of interests. As a result, the accompanying unaudited combined historical financial statements give retrospective effect to the Broad Oak Transaction, whereby the assets and liabilities of the Company and Broad Oak are reflected at the historical carrying values and their operations are presented as if they were combined for all periods presented.
On August 12, 2011, Laredo LLC formed a new wholly-owned subsidiary, Laredo Petroleum Holdings, Inc. ("Laredo Holdings") in anticipation of an initial public offering ("IPO"). Immediately prior to the consummation of the IPO, Laredo LLC will be merged into Laredo Holdings and Laredo Holdings will continue as the surviving corporation.
B—Basis of presentation and significant accounting policies
1. Basis of presentation
The accompanying combined financial statements were derived from the historical accounting records of the Combined Company and reflect the historical financial position, results of operations and cash flows for the periods described herein. All material intercompany transactions and account balances have been eliminated in the combination of accounts. The accompanying combined financial statements have not been audited, except that the Combined balance sheet at December 31, 2010 is derived from the Combined Company's audited combined financial statements. The Combined Company operates oil and natural gas properties as one business segment, which explores, develops and produces oil and natural gas.
In the opinion of management, the accompanying combined financial statements reflect all necessary adjustments to present fairly the Combined Company's financial position at June 30, 2011 and its results of operations for the six months ended June 30, 2011 and 2010 and its cash flows for the six months ended June 30, 2011 and 2010. All such adjustments are of a normal recurring nature.
Certain disclosures have been condensed or omitted from these combined financial statements. Accordingly, they do not include all of the information and notes required by accounting principles generally accepted in the United States of America ("GAAP") for complete combined financial statements and should be read in conjunction with the audited combined financial statements and notes for the year ended December 31, 2010.
2. Use of estimates in the preparation of combined financial statements
The preparation of the accompanying combined financial statements in conformity with GAAP requires management of the Combined Company to make estimates and assumptions about future events. These estimates and the underlying assumptions affect the reported amounts of
F-14
assets and liabilities and disclosure of contingent assets and liabilities at the date of the financial statements and the reported amounts of revenues and expenses during the reporting period. Although management believes these estimates are reasonable, actual results could differ from these estimates.
Significant estimates include, but are not limited to, estimates of the Combined Company's reserves of oil and natural gas, future cash flows from oil and natural gas properties, depreciation, depletion and amortization, asset retirement obligations, equity-based compensation, deferred income taxes and fair values of commodity and interest rate derivatives. As fair value is a market-based measurement, it is determined based on the assumptions that market participants would use. These estimates and assumptions are based on management's best judgment. Management evaluates its estimates and assumptions on an ongoing basis using historical experience and other factors, including the current economic environment, which management believes to be reasonable under the circumstances. Such estimates and assumptions are adjusted when facts and circumstances dictate. Illiquid credit markets and volatile equity and energy markets have combined to increase the uncertainty inherent in such estimates and assumptions. As future events and their effects cannot be determined with precision, actual results could differ from these estimates. Any changes in estimates resulting from future changes in the economic environment will be reflected in the financial statements in future periods.
3. Materials and supplies
Materials and supplies are comprised of equipment used in developing oil and gas properties. They are carried at the lower of cost or market using the average cost method. On a regular basis, the Combined Company reviews materials and supplies quantities on hand and records a provision for excess or obsolete materials and supplies, if necessary.
At June 30, 2011 the Combined Company reduced materials and supplies by approximately $0.2 million in order to reflect the balance at the lower of cost or market. Although management believes it has established adequate allowances, it is possible that additional losses on materials and supplies could occur in future periods. The Combined Company determined a lower of cost or market adjustment was not necessary for materials and supplies at December 31, 2010.
4. Derivative financial instruments
The Combined Company uses derivative financial instruments to reduce exposure to fluctuations in the prices of oil and natural gas. In addition, the Combined Company enters into derivative contracts in the form of interest rate swaps and caps to minimize the effects of fluctuations in interest rates.
Derivative financial instruments are recorded at fair value and are included on the combined balance sheets as assets or liabilities. The Combined Company netted the fair value of derivative instruments by counterparty in the accompanying combined balance sheets where the right of offset exists. The Combined Company determines the fair value of its derivative financial instruments utilizing pricing models for significantly similar instruments. Inputs to the pricing models include publicly available prices and forward price curves generated from a compilation of data gathered from third parties.
F-15
None of the Combined Company's derivatives at June 30, 2011 or December 31, 2010, were designated as hedges for financial statement purposes. Realized and unrealized gains and losses on derivatives are included in cash flows from operating activities (see Note G).
5. Property and equipment
The following table sets forth the Combined Company's property and equipment:
| (in thousands) |
June 30, 2011 |
December 31, 2010 |
|||||
|---|---|---|---|---|---|---|---|
Proved oil and gas properties |
$ | 1,723,530 | $ | 1,379,885 | |||
Less accumulated depreciation, depletion, amortization |
786,771 | 713,118 | |||||
Proved oil and gas properties, net |
936,759 | 666,767 | |||||
Unproved oil and gas properties not being amortized |
87,128 |
96,515 |
|||||
Pipeline and gas gathering assets |
48,746 |
43,271 |
|||||
Less accumulated depreciation and amortization |
5,079 | 3,928 | |||||
Pipeline and gas gathering assets, net |
43,667 | 39,343 | |||||
Other fixed assets |
15,136 |
10,869 |
|||||
Less accumulated depreciation and amortization |
4,654 | 3,601 | |||||
Other fixed assets, net |
10,482 | 7,268 | |||||
Total property and equipment, net |
$ | 1,078,036 | $ | 809,893 | |||
For the six months ended June 30, 2011 and 2010, depletion expense was $18.45 per BOE and $15.79 per BOE, respectively.
6. Deferred loan costs
Loan origination fees are stated at cost, net of amortization, which are amortized over the life of the respective debt agreements on a basis that represents the effective interest method. The Combined Company capitalized $10.6 million and $2.5 million in the six months ended June 30, 2011 and 2010, respectively. The Combined Company had total deferred loan costs of $15.8 million and $10.4 million, net of accumulated amortization of $4.4 million and $2.8 million, at June 30, 2011 and December 31, 2010, respectively.
During the six months ended June 30, 2011, the Company wrote-off $3.2 million in deferred loan costs as a result of retirement of debt and changes in the borrowing base under the $500.0 million revolving Laredo Senior Secured Credit Facility (as later defined) (see Note C).
Future amortization expense of deferred loan costs at June 30, 2011 is as follows:
| (in thousands) |
|
|||
|---|---|---|---|---|
Remaining 2011 |
$ | 1,942 | ||
2012 |
3,884 | |||
2013 |
2,525 | |||
2014 |
2,161 | |||
2015 |
1,695 | |||
Thereafter |
3,580 | |||
Total |
$ | 15,787 | ||
F-16
7. Asset retirement obligations
Asset retirement obligations associated with the retirement of tangible long-lived assets are recognized as a liability in the period in which they are incurred and become determinable. The associated asset retirement costs are part of the carrying amount of the long-lived asset. Subsequently, the asset retirement cost included in the carrying amount of the related long-lived asset is charged to expense through the depletion of the asset. Changes in the liability due to the passage of time are recognized as an increase in the carrying amount of the liability and as corresponding accretion expense. See Note H for fair value disclosures related to the Combined Company's asset retirement obligation.
The Combined Company is obligated by contractual and regulatory requirements to remove certain pipeline and gas gathering assets and perform other remediation of the sites where such pipeline and gas gathering assets are located upon the retirement of those assets. However, the fair value of the asset retirement obligation cannot currently be reasonably estimated because the settlement dates are indeterminate. The Combined Company will record an asset retirement obligation for pipeline and gas gathering assets in the periods in which settlement dates are reasonably determinable.
The following reconciles the Combined Company's asset retirement obligations liability:
| |
Six months ended June 30, |
||||||
|---|---|---|---|---|---|---|---|
| (in thousands) |
2011 |
2010 |
|||||
Liability at beginning of period |
$ | 8,278 | $ | 5,844 | |||
Liabilities added due to acquisitions, drilling, and other |
547 | 455 | |||||
Liabilities removed due to sale of well |
— | (34 | ) | ||||
Accretion expense |
304 | 221 | |||||
Liabilities settled upon plugging and abandonment |
(359 | ) | (4 | ) | |||
Revision of estimates |
(12 | ) | 180 | ||||
Liability at end of period |
$ | 8,758 | $ | 6,662 | |||
8. Fair value measurements
The carrying amounts reported in the Combined balance sheets for cash and cash equivalents, accounts receivable, prepaid expenses, accounts payable undistributed revenue and royalties, and other accrued liabilities approximate their fair values. See Note C for fair value disclosures related to the Combined Company's debt obligations. The Combined Company carries its derivative financial instruments at fair value. See Note G and Note H for details about the fair value of the Combined Company's derivative financial instruments.
9. Revenue recognition
Oil and gas revenues are recorded using the sales method. Under this method, the Combined Company recognizes revenues based on actual volumes of oil and gas sold to purchasers. The Combined Company and other joint interest owners may sell more or less than their entitlement share of the volumes produced. Under the sales method, when a working interest owner has overproduced in excess of its share of remaining estimated reserves, the overproduced party recognizes the excessive gas imbalance as a liability. If the underproduced
F-17
working interest owner determines that an overproduced partner's share of remaining net reserves is insufficient to settle the imbalance, the underproduced owner recognizes a receivable, net of any allowance from the overproduced working interest owner.
The following tables reflect the Combined Company's natural gas imbalance positions at June 30, 2011 and December 31, 2010 as well as amounts reflected in oil and gas sales for the six months ended June 30, 2011 and 2010.
| (dollars in thousands) |
June 30, 2011 |
December 31, 2010 |
|||||
|---|---|---|---|---|---|---|---|
Natural gas imbalance current receivable (included in "Accounts receivable-Oil and gas sales") |
$ | 184 | $ | 174 | |||
Underproduced positions (Mcf) |
49,312 | 43,720 | |||||
Natural gas imbalance current liability (included in "Other accrued liabilities") |
$ |
23 |
$ |
15 |
|||
Overproduced positions (Mcf) |
6,072 | 3,839 | |||||
Natural gas imbalance long-term liability |
$ |
1,042 |
$ |
1,093 |
|||
Overproduced positions (Mcf) |
279,426 | 275,201 | |||||
| |
Six months ended June 30, |
||||||
|---|---|---|---|---|---|---|---|
| (dollars in thousands) |
2011 |
2010 |
|||||
Value of net underproduced (overproduced) positions arising during the period increasing oil and gas sales |
$ | 53 | $ | (254 | ) | ||
Net overproduced positions arising during the period (Mcf) |
866 | 22,617 | |||||
10. General and administrative expense
The Combined Company receives fees for the operation of jointly-owned oil and gas properties and records such reimbursements as a reduction of general and administrative expenses. Such fees totaled approximately $0.8 million and $0.7 million for the six months ended June 30, 2011 and 2010, respectively.
11. Equity-based awards
The Combined Company recognizes equity-based awards as a charge against earnings over the requisite service period, in an amount equal to the fair value of equity-based awards granted to employees and directors. The fair value of the equity-based awards is computed at the date of grant (see Note E).
12. Impairment of long-lived assets
Impairment losses are recorded on property and equipment used in operations and other long-lived assets when indicators of impairment are present and the undiscounted cash flows estimated to be generated by those assets are less than the assets' carrying amount. Impairment is measured based on the excess of the carrying amount over the fair value of the asset. See Note B.3 for disclosure of the write-down of materials and supplies for the six months ended June 30, 2011. Other than the aforementioned write-down, the Combined
F-18
Company did not record any additional impairment to property and equipment used in operations or other long-lived assets in the six months ended June 30, 2011 and 2010.
13. Recently issued accounting standards
In May 2011, the Financial Accounting Standards Board ("FASB") issued Accounting Standards Update ("ASU") 2011-04 Amendments to Achieve Common Fair Value Measurement and Disclosure Requirements in U.S. GAAP and IFRS which provides a consistent definition of fair value and common requirements for measurement of and disclosure about fair value between GAAP and International Financial Reporting Standards. This new guidance changes some fair value measurement principles and disclosure requirements, but does not require additional fair value measurements and is not intended to establish valuation standards or affect valuation practices outside of financial reporting. The update is effective for annual periods beginning after December 15, 2011 and we are in the process of evaluating the impact, if any, the adoption of this update will have on our financial statements.
C—Debt
1. Interest expense
The following amounts have been incurred and charged to interest expense for the six months ended June 30, 2011 and 2010:
| |
Six months ended June 30, |
|||||||
|---|---|---|---|---|---|---|---|---|
| (in thousands) |
2011 |
2010 |
||||||
Cash payments for interest |
$ | 6,626 | $ | 5,003 | ||||
Amortization and write-off of deferred loan costs |
5,155 | 640 | ||||||
Net change in accrued interest |
10,471 | 285 | ||||||
Total interest expense |
$ | 22,252 | $ | 5,928 | ||||
Laredo
1. 2019 Notes
On January 20, 2011 Laredo completed an offering of $350 million 91/2% Senior Notes due 2019 (the "2019 Notes"). The 2019 Notes will mature on February 15, 2019 and bear an interest rate of 9.5% payable semi-annually, in cash, in arrears on February 15 and August 15 of each annual year, commencing August 15, 2011. The 2019 Notes are fully and unconditionally guaranteed, jointly and severally, on a senior unsecured basis by Laredo LLC, Laredo Texas and Laredo Gas (collectively, the "Guarantors"). The net proceeds from the 2019 Notes were used (i) to repay and retire $100 million outstanding under Laredo's Second Lien Term Loan Agreement (the "Term Loan"), (ii) to pay in full $177.5 million outstanding under Laredo's revolving Second Amended and Restated Senior Secured Credit Facility Agreement (the "Laredo Senior Secured Credit Facility"), and (iii) for general working capital purposes.
The 2019 Notes were issued under and are governed by an indenture dated January 20, 2011 (the "Indenture"), among Laredo, Wells Fargo Bank, National Association, as trustee, and the Guarantors. The Indenture contains customary terms, events of default and covenants relating to, among other things, the incurrence of debt, the payment of dividends or similar restricted payments, undertaking transactions with Laredo's unrestricted affiliates and limitations on asset
F-19
sales. Indebtedness under the 2019 Notes may be accelerated in certain circumstances upon an event of default as set forth in the Indenture.
Laredo will have the option to redeem the 2019 Notes, in whole or in part, at any time on or after February 15, 2015, at the redemption prices (expressed as percentages of principal amount) of 104.750% for the twelve-month period beginning on February 15, 2015, 102.375% for the twelve-month period beginning on February 15, 2016 and 100.000% for the twelve-month period beginning on February 15, 2017 and at any time thereafter, together with accrued and unpaid interest, if any, to the date of redemption. In addition, before February 15, 2015, Laredo may redeem all or any part of the 2019 Notes at a redemption price equal to the sum of the principal amount thereof, plus a make-whole premium at the redemption date, plus accrued and unpaid interest, if any, to the redemption date. Furthermore, before February 15, 2014, Laredo may, at any time or from time to time, redeem up to 35% of the aggregate principal amount of the 2019 Notes with the net proceeds of a public or private equity offering at a redemption price of 109.500% of the principal amount of 2019 Notes, plus any accrued and unpaid interest to the date of redemption, if at least 65% of the aggregate principal amount of the 2019 Notes issued under the Indenture remains outstanding immediately after such redemption and the redemption occurs within 180 days of the closing date of such equity offering. Laredo may also be required to make an offer to purchase the 2019 Notes upon a change of control triggering event.
In connection with the issuance of the 2019 Notes, Laredo and the Guarantors entered into a registration rights agreement with the initial purchasers of the 2019 Notes on January 20, 2011 pursuant to which Laredo and the Guarantors have agreed to file with the SEC and use commercially reasonable efforts to cause to become effective a registration statement with respect to an offer to exchange the 2019 Notes for substantially identical notes (other than with respect to restrictions on transfer or to any increase in annual interest rate) that are registered under the Securities Act of 1933, as amended, so as to permit the exchange offer to be consummated by the 365th day after January 20, 2011. Under specified circumstances, Laredo and the Guarantors have also agreed to use commercially reasonable efforts to cause to become effective a shelf registration statement relating to any resale of the 2019 Notes. Laredo will be obligated to pay additional interest if it fails to comply with their obligations to register the 2019 Notes to the extent the transfer of such notes remains unregistered following the specified time periods or the two year anniversary of the issuance of the notes.
2. Secured credit facility
At June 30, 2011, the $500.0 million revolving Laredo Senior Secured Credit Facility, dated December 29, 2010, between Laredo and certain financial institutions had a borrowing base of $270.0 million and $75.0 million was outstanding. As of December 31, 2010, the borrowing base under this facility was $220.0 million and $177.5 million was outstanding. The borrowing base is subject to a semi-annual redetermination based on the financial institutions' evaluation of Laredo's oil and gas reserves. The Laredo Senior Secured Credit Facility is available to Laredo until July 2015, at which time the outstanding balance will be due. As defined in the Laredo Senior Secured Credit Facility, the Adjusted Base Rate Advances and Eurodollar Advances under the facilities bear interest payable quarterly at an Adjusted Base Rate or Adjusted London Interbank Offered Rate ("LIBOR") plus an applicable margin based on the ratio of outstanding revolving credit to the conforming borrowing base. Laredo is also required to pay an annual commitment fee on the unused portion of the bank's commitment of 0.5%.
F-20
The Laredo Senior Secured Credit Facility is secured by a first priority lien on Laredo's assets and stock, including oil and gas properties, constituting at least 80% of the present value of Laredo's proved reserves. Further, Laredo is subject to various financial and non-financial ratios at the Company level on a consolidated basis, including a current ratio at the end of each calendar quarter, of not less than 1.00 to 1.00. As defined by the Laredo Senior Secured Credit Facility, the current ratio represents the ratio of current assets to current liabilities, inclusive of available capacity and exclusive of current balances associated with derivative positions. Additionally, at the end of each calendar quarter, Laredo LLC must maintain a ratio of its consolidated net income (a) plus each of the following; (i) any provision for (or less any benefit from) income or franchise taxes; (ii) consolidated net interest expense; (iii) depreciation, depletion and amortization expense; (iv) exploration expenses; and (v) other noncash charges, and (b) minus all non-cash income ("EBITDAX"), as defined in the Laredo Senior Secured Credit Facility, to the sum of net interest expense plus letter of credit fees of not less than 2.50 to 1.00, in each case for the four quarters then ending. The Laredo Senior Secured Credit Facility contains both financial and non-financial covenants and Laredo was in compliance with these covenants at June 30, 2011 and December 31, 2010.
Additionally, the Laredo Senior Secured Credit Facility provides for the issuance of letters of credit, limited to the total capacity. At June 30, 2011, Laredo had one letter of credit outstanding totaling $0.03 million under the Laredo Senior Secured Credit Facility.
Subsequent to June 30, 2011, Laredo amended and restated its Laredo Senior Secured Credit Facility. See Note N for further discussion regarding the amendment and restatement.
3. Term loan
In January 2011, Laredo paid in full its $100.0 million outstanding balance under the Term Loan, dated July 7, 2010, between Laredo and certain financial institutions, using a portion of the proceeds from its 2019 Notes and retired the loan. The Term Loan was subject to an interest rate of 9.25% prior to its pay-off and subsequent retirement.
4. Fair value of debt
The following table presents the carrying amount and fair value of Laredo's debt instruments at June 30, 2011 and December 31, 2010:
| |
June 30, 2011 | December 31, 2010 | ||||||||||||
|---|---|---|---|---|---|---|---|---|---|---|---|---|---|---|
| (in thousands) |
Carrying value |
Fair value |
Carrying value |
Fair value |
||||||||||
2019 Notes |
$ | 350,000 | $ | 371,221 | $ | — | $ | — | ||||||
Laredo Senior Secured Credit Facility |
75,000 | 75,148 | 177,500 | 177,997 | ||||||||||
Term Loan |
— | — | 100,000 | 100,707 | ||||||||||
Total value of debt |
$ | 425,000 | $ | 446,369 | $ | 277,500 | $ | 278,704 | ||||||
At June 30, 2011 the fair value of the debt outstanding on the 2019 Notes was determined using the June 30, 2011 quoted market price. For June 30, 2011, the fair value of the outstanding debt on the Laredo Senior Secured Credit Facility and for December 31, 2010, the fair value of the outstanding debt on the Laredo Senior Secured Credit Facility and Term Loan was estimated utilizing pricing models for similar instruments.
F-21
Broad Oak
1. Credit facility
At June 30, 2011, Broad Oak had a $600.0 million revolving credit facility under its Seventh Amendment to the Credit Agreement (the "Broad Oak Credit Facility"), dated April 11, 2008, between Broad Oak and certain financial institutions. As of June 30, 2011, the Broad Oak Credit Facility had a borrowing base of $375 million with $265.4 million outstanding. As of December 31, 2010, the borrowing was $250.0 million with $214.1 million outstanding. The borrowing base was subject to a semi-annual redetermination based on the financial institutions' evaluation of Broad Oak's oil and gas reserves. The Broad Oak Credit Facility was available to Broad Oak until April 2013, at which time the outstanding balance would have been due. As defined in the Broad Oak Credit Facility, the Adjusted Base Rate Advances and Eurodollar Advances bore interest payable quarterly at an Adjusted Base Rate or Adjusted LIBOR plus an applicable margin based on the ratio of outstanding revolving credit to the conforming borrowing base. Broad Oak is also required to pay a quarterly commitment fee of 0.5% on the unused portion of the bank's commitment.
The Broad Oak Credit Facility was secured by a first priority lien on Broad Oak's oil and gas properties. Further, Broad Oak was subject to various financial and non-financial ratios, including a current ratio at the end of each calendar quarter, of not less than 1.00 to 1.00. As defined by the Broad Oak Credit Facility, the current ratio represents the ratio of current assets to current liabilities, inclusive of available capacity and exclusive of current balances associated with non-cash derivative positions. Additionally, at the end of each calendar quarter, Broad Oak must maintain a ratio of debt to "Consolidated EBITDAX" of not more than 3.50 to 1.00, based on the quarter then ended annualized. "Consolidated EBITDAX" is defined as consolidated net income plus the sum of (i) income or franchise taxes; (ii) consolidated net interest expense; (iii) depreciation, depletion and amortization expense; (iv) any non-cash losses or charges on any derivative positions; (v) other noncash charges; and (vi) costs associated with oil and gas capital expenditures that are expensed rather than capitalized, less, to the extent included in the calculation of Consolidated Net Income (as defined in the Broad Oak Credit Facility), the sum of (A) the income of any person (other than wholly owned subsidiaries of such person) unless such income is received by such person in a cash distribution; (B) gains of losses from sales or other dispositions of assets (other than hydrocarbons produced in the normal course of business); (C) any non-cash gains on any hedge agreement resulting from the requirements of Accounting Standards Codification ("ASC") 815 Derivatives and Hedging for that period; (D) extraordinary or non-recurring gains, but not net of extraordinary or non-recurring "cash" losses; and (E) costs and expenses associated with, and attributable to, oil and gas capital expenditures that are expensed rather than capitalized. The Broad Oak Credit Facility contains both financial and non-financial covenants and Broad Oak was in compliance with these covenants at June 30, 2011 and December 31, 2010.
Additionally, the Broad Oak Credit Facility provides for the issuance of letters of credit, limited to the total capacity. At June 30, 2011 and December 31, 2010, Broad Oak had no letters of credit outstanding.
On July 1, 2011, Laredo paid the Broad Oak Credit Facility in full and the facility was terminated and the lenders under the Laredo Senior Secured Credit Facility have a first priority lien on Broad Oak's oil and gas properties.
F-22
2. Fair value of debt
The carrying value of the Broad Oak Credit Facility approximates fair value as it is subject to short-term floating interest rates that represent the rates available to Broad Oak for those periods.
D—Owners' equity
Laredo
The Laredo LLC First Amended and Restated Limited Liability Company Agreement (the "LLC Agreement") provides for the issuance of two series of Series A units. First, it authorizes a total of 60 million Series A-1 Units of Laredo LLC for total consideration of $300 million, consisting of approximately $294.9 million from Warburg Pincus IX and $5.1 million from certain members of Laredo LLC's management team and Board of Managers. This portion was fully funded as of December 31, 2009. Secondly, it provides for a total of 48 million Series A-2 Units of Laredo LLC for total consideration of $300 million, initially consisting of approximately $288.5 million from Warburg Pincus X O&G, L.P. ("Warburg Pincus X"), $9.2 million from Warburg Pincus X Partners, L.P. ("Warburg Pincus X Partners") and $2.3 million from certain members of Laredo LLC's management team and Board of Managers. The Series A Units have a liquidation preference amount equal to the total capital then invested, plus a 7% cumulative return, compounded quarterly. The Series A Units 7% cumulative return had accumulated to approximately $110.8 million and $88.5 million as of June 30, 2011 and December 31, 2010, respectively. The cumulative return has not been declared by the Board of Managers and as such, is not reflected in the combined financial statements. The LLC Agreement was amended and restated on July 1, 2011 in connection with the Broad Oak Transaction, as described in Note N.2.
As of June 30, 2011, approximately $549.2 million had been contributed to Laredo LLC, net of Series A Unit repurchases by Laredo. Of this total, approximately $294.9 million was contributed by Warburg Pincus IX, $238.4 million was contributed by Warburg Pincus X, $7.6 million was contributed by Warburg Pincus X Partners, and $8.3 million was contributed by certain members of Laredo LLC's management and Board of Managers.
Laredo LLC is authorized to issue up to 16,923,077 Series B Units, up to 8,791,209 Series C Units, up to 13,538,462 Series D Units and up to 7,032,967 Series E Units under restricted unit agreements with management (collectively, the "Restricted Units"). The Series B Units are divided into two unit series, B-1 Units and B-2 Units. The Series B-1 Units have an initial threshold value of $0 and the Series B-2 Units have an initial threshold value of $1.25. The Series C Units have an initial threshold value of $10.00, the Series D Units have an initial threshold value of $1.25, and the Series E Units have an initial threshold value of $13.75.
The table below summarizes the activity of restricted units by series for the six months ended June 30, 2011:
| (in thousands) |
Series B units |
Series C units |
Series D units |
Series E units |
Total units |
||||||||||||
|---|---|---|---|---|---|---|---|---|---|---|---|---|---|---|---|---|---|
BALANCE, December 31, 2010 |
7,998 | 7,260 | 9,612 | 6,562 | 31,432 | ||||||||||||
Issuance of restricted units |
— | — | 2,006 | 125 | 2,131 | ||||||||||||
Cancellation of restricted units |
(115 | ) | (90 | ) | (108 | ) | (40 | ) | (353 | ) | |||||||
BALANCE, June 30, 2011 |
7,883 | 7,170 | 11,510 | 6,647 | 33,210 | ||||||||||||
F-23
Any distributions made by Laredo LLC are allocated first to Series A-1 and A-2 Units until the holders of Series A-1 and A-2 Units have received their invested capital and aforementioned preference amount. Second, until the B-2 and D Unit "$1.25 Threshold" is met, all distributions are made to Series A-1 Units and Series B-1 Units in proportion to their unit ratios. Third, until the C Unit "$10.00 Threshold" has been met, the distributions are made to the holders of Series A-1 and A-2 Units, Series B-1 and B-2 Units and Series D Units in proportion to their unit ratios. Fourth, until the Series E Unit "$13.75 Threshold" has been met, the distributions are made to the holders of the Series A-1 and A-2 Units, Series B-1 and B-2 Units, Series C Units and Series D Units in proportion to their unit ratios. Finally, after the Series E Unit "$13.75 Threshold" has been met, the distributions will be made to the holders of the Series A-1 and A-2 Units, Series B-1 and B-2 Units, Series C Units, Series D Units, and Series E Units in proportion to their unit ratios. Each threshold represents the point when holders of Series A-1 and A-2 Units have received the preference amount plus $1.25, $10.00, and $13.75 per unit, respectively.
If future Series B-1, B-2, C, D, or E Units are issued with higher threshold values than prior units in that series, units having a higher threshold value will not share in distributions within the series until units having the lower threshold value have received distributions in an amount necessary to bring them into balance. Until the time that Series A-1 and A-2 Unit investors have fully funded their capital commitments, distributions to holders of Series B-1, B-2, C, D and E Units are subject to being held back until the total of the amounts held back equals the total remaining commitment of Series A-1 and A-2 Unit investors. The holdback amount is subject to distribution to holders of Series A-1 and A-2 Units if future returns are not sufficient to fund the Series A-1 and A-2 Unit preference amounts. Series B-1, B-2, C, D and E Units are also subject to a claw-back (not to exceed distributions received, less taxes) if distributions to such units exceed their entitlement.
In connection with any qualified public offering, each outstanding Series A-1 and A-2 Units and vested Series B-1, B-2, C, D, or E Units will be converted into or exchanged (at values determined in the LLC Agreement) for shares of common stock of Laredo Holdings. The converted or exchanged units will receive value equal to the same proportion of the aggregate pre-IPO value such that each holder of units will receive IPO securities having a value based on the provisions of the LLC Agreement.
Management may request the funding of capital calls under the amended investors' commitment for development activities, working capital and acquisitions, subject to the approval of the Board of Managers. All capital calls are subject to the approval of Warburg Pincus Partnerships owning Laredo LLC units and must be for an amount not less than $5 million.
F-24
The approval of Warburg Pincus Partnerships owning Laredo LLC units is required with respect to certain events, including material contracts and commitments, certain acquisitions and dispositions, certain expenditures and incurrence of debt, and amendments to Laredo's structure.
Broad Oak
The purchase terms, conditions and stockholders' rights of Broad Oak's Series A Preferred Stock were outlined in the Broad Oak Series A Preferred Stock Agreement, Stockholders' Agreement and Certificate of Designations dated May 16, 2006. The Series A Preferred Stock accrued dividends daily from the date of issue at a rate of 7% per annum through its termination on July 1, 2011. Dividends compound on a quarterly basis in arrears on March 31, June 30, September 30 and December 31 of each year. Dividends in arrears accumulated to approximately $39.6 million and $32.9 million as of June 30, 2011 and December 31, 2010, respectively. Since inception, dividends were not declared by the Board of Directors and as such, no liability was reflected in the combined financial statements.
The purchase price of the Series A Preferred Stock was $100 per share, subject to adjustment upon the occurrence of certain events. It ranked senior in rights of preference to the common stock or any other equity securities of Broad Oak and received all dividends paid by Broad Oak until the purchase price plus accrued dividends had been paid.
See Note N for additional discussion regarding the effect of the Broad Oak Transaction on Broad Oak's Series A Preferred Stock and Common Stock.
E—Equity-based awards
Laredo
The Company recognizes the fair value of equity-based payments to employees and directors, including awards in the form of Restricted Units of Laredo LLC as a charge against earnings. The Company recognizes equity-based payment expense over the requisite service period. Laredo LLC's equity-based payment awards are accounted for as equity instruments. Equity-based compensation is included in "General and administrative expense" in the Combined Statements of Operations and amounted to $0.8 million and $0.7 million for the six months ended June 30, 2011 and 2010, respectively.
For the six months ended June 30, 2010, the fair value of equity-based compensation for restrictive units was estimated on the date of grant using the Company's estimated market value. The Company calculates the estimated market value at the end of each calendar quarter and then applies the calculated value to each Series B-1, B-2, C, D and E Units granted during the current calendar quarter. The Company determination of the fair value for Series B-1, B-2, C, D and E Units is calculated based on the present value of the Company's proved reserves, adjusted for current market values of the Company's other non-oil and gas assets and liabilities. The Company's determination of the fair value of each Series B-1, B-2, C, D and E Units is affected by the Company's proved reserves, current commodity prices, current values of the Company's non-oil and gas assets and liabilities, as well as assumptions regarding a number of complex and subjective variables. Although the fair value of the unit grants is determined in accordance with GAAP, that value may not be indicative of the fair value observed in a willing-buyer/willing-seller market transaction.
F-25
For the six months ended June 30, 2011, the estimated market value of equity-based compensation for restrictive units was estimated on the date of grant using a valuation prepared by the Company's third-party valuation firm. The estimated market value is calculated at the end of each calendar quarter and the estimated market value of the Company is applied to each Series B-1, B-2, C, D and E Units granted during the current calendar quarter. The method of allocation is based on first determining the enterprise value using the market approach and the income approach and then weighting the indicated value to arrive at the fair value of the unit grants. Although the fair value of the unit grants is determined in accordance with GAAP, that value may not be indicative of the fair value observed in a market transaction between a willing buyer and a willing seller.
Laredo LLC is authorized to issue equity incentive awards in the form of Restricted Units. Unvested Restricted Units may not be sold, transferred or assigned. The fair value of the Restricted Units is measured based upon the estimated market price of the underlying member units as of the date of grant. The Restricted Units are subject to the following vesting terms: 20% at the grant date and 20% annually thereafter. The fair value of the Restricted Units in excess of the amounts paid by the employee, which is zero, is amortized to expense over its applicable requisite service period using the straight-line method. In the event of a termination of employment for cause, all Restricted Units, including unvested Restricted Units and vested Restricted Units, and all rights arising from such Restricted Units and from being a holder thereof, are forfeited. In the event of a termination of employment without cause or a resignation, all unvested Restricted Units and all rights arising from such Restricted Units and from being a holder thereof, are forfeited. For a period of one year from the date of termination of employment, in the event of a termination of employment for cause, the Company may also elect to redeem the Series A-1 Units and Series A-2 Units at a price per unit equal to the lesser of the fair market value or original purchase price. In the event of a termination without cause or a resignation, the Company may elect to redeem the Series A-1 Units and Series A-2 Units and vested Restricted Units at a price equal to the fair market value.
The table below summarizes activity relating to the unvested Restricted Units for the six months ended June 30, 2011:
| (in thousands, except grant date fair values) |
Series B-1 restricted units |
Weighted average fair value |
Series B-2 restricted units |
Weighted average fair value |
Series C restricted units |
Weighted average fair value |
Series D restricted units |
Weighted average fair value |
Series E restricted units |
Weighted average fair value |
|||||||||||||||||||||
|---|---|---|---|---|---|---|---|---|---|---|---|---|---|---|---|---|---|---|---|---|---|---|---|---|---|---|---|---|---|---|---|
Outstanding at December 31, 2010 |
1,419 | $ | 0.36 | 942 | $ | 2.10 | 2,129 | $ | — | 6,745 | $ | — | 4,016 | $ | — | ||||||||||||||||
Granted |
— | $ | — | — | $ | — | — | $ | — | 2,006 | $ | — | 125 | $ | — | ||||||||||||||||
Vested |
(290 | ) | $ | 0.24 | (11 | ) | $ | 2.11 | (683 | ) | $ | — | (2,152 | ) | $ | 0.16 | (1,188 | ) | $ | — | |||||||||||
Forfeited |
(10 | ) | $ | — | (9 | ) | $ | — | — | $ | — | (41 | ) | $ | — | — | $ | — | |||||||||||||
Outstanding at June 30, 2011 |
1,119 | $ | 0.46 | 922 | $ | 2.09 | 1,446 | $ | — | 6,558 | $ | 0.12 | 2,953 | $ | — | ||||||||||||||||
Unrecognized equity-based compensation expense related to unvested Restricted Units was $2.2 million and $3.0 million for the six months ended June 30, 2011 and 2010, respectively. That cost is expected to be recognized over a weighted average period of 1.5 years.
F-26
A summary of weighted average grant date fair value and intrinsic value of vested Restricted Units are as follows:
| |
June 30, 2011 |
December 31, 2010 |
|||||
|---|---|---|---|---|---|---|---|
B-1 Units |
|||||||
Weighted average grant date fair value |
$ | 0.24 | $ | 0.27 | |||
Total intrinsic value of units vested (in thousands) |
$ | 236 | $ | 431 | |||
B-2 Units |
|||||||
Weighted average grant date fair value |
$ | 2.11 | $ | 2.12 | |||
Total intrinsic value of units vested (in thousands) |
$ | — | $ | — | |||
C Units |
|||||||
Weighted average grant date fair value |
$ | — | $ | — | |||
Total intrinsic value of units vested (in thousands) |
$ | — | $ | — | |||
D Units |
|||||||
Weighted average grant date fair value |
$ | 0.16 | $ | — | |||
Total intrinsic value of units vested (in thousands) |
$ | 634 | $ | — | |||
E Units |
|||||||
Weighted average grant date fair value |
$ | — | $ | — | |||
Total intrinsic value of units vested (in thousands) |
$ | — | $ | — | |||
Broad Oak
In 2006 Broad Oak's Board of Directors and shareholders approved the Broad Oak 2006 Stock Incentive Plan (the "Plan"). The Plan provided that a maximum of 371,250 shares of common stock in the aggregate could be issued pursuant to options or restricted stock grants. In March 2009, the maximum was increased by 125,000 shares by the Amendment to the Plan (the "Amendment"). Broad Oak used newly issued shares of common stock to satisfy option exercises and restricted stock awards. The persons eligible to receive awards under the Plan include employees, directors and consultants of Broad Oak.
The Plan was administered by the Compensation Committee of the Broad Oak Board of Directors, which determined the number of option shares or restricted stock to be granted and the effective dates of the grants. Options outstanding become exercisable at any time after the grant date, subject to time vesting and dollar vesting, and expire ten years after the grant date. Generally, options and restricted stock grants time vested 20% at the time of issuance with the remainder vesting in equal increments over a four-year period. Options and restricted stock grants were also subject to dollar vesting. For the common stock and options subject to the Plan, dollar vesting was at the rate of 0.667% for every $1.0 million received and accepted by Broad Oak for its Series A Preferred Stock under the Stock Purchase Agreement dated May 16, 2006. For the common stock and options subject to the Amendment, dollar vesting was at the rate of 2% for every $1.0 million received and accepted by Broad Oak for its Series A Preferred Stock under the Amended Stock Purchase Agreement dated March 26, 2009. In the absence of an established market for shares of Broad Oak's common stock, the Broad Oak Board of Directors determined the fair market value of Broad Oak's common stock.
F-27
Restricted stock. The transfer of these shares was restricted and they had a two-tier vesting criteria. Any vested and non-forfeited shares could be purchased by Broad Oak at fair market value if the recipient ceased to remain in the service of Broad Oak other than by death or disability. In the case of death or disability, time vesting is eliminated in most circumstances. On May 1, 2010, Broad Oak reissued 2,125 shares of restricted common treasury stock at a fair market value of $61 per share. There were no shares of restricted common stock granted during the six months ended June 30, 2011. Compensation expense related to restricted stock is measured as the difference between the fair market value of Broad Oak's common stock at the date of grant and the price paid, if any. Compensation expense is recognized over the related vesting period. During the six month ended June 30, 2011 and 2010, stock compensation expense was nominal.
Options. The fair market value of stock options granted under the Plan in 2010, 2009 and 2008 was estimated using the Black-Scholes stock option pricing model. In May 2010, Broad Oak granted 1,000 options with a grant date fair market value of $1.77; accordingly, the total compensation expense recorded in the Combined statement of operations was nominal. There were no options granted during the six months ended June 30, 2011.
See Note N for additional discussion regarding the effect of the Broad Oak Transaction on Broad Oak's restricted stock grants and stock options.
F—Income taxes
Income taxes in these financial statements are generally presented on an "as combined" basis. However, in light of the historic ownership structure of the combined entities, U.S. tax laws do not allow tax losses of one entity to offset income and losses of another entity until after the Broad Oak Transaction on July 1, 2011. As such, the financial accounting for the income tax consequences of each combined company is calculated separately in these combined financial statements.
Deferred income taxes reflect the net tax effects of temporary differences between the carrying amounts of assets and liabilities for financial reporting purposes and the amounts used for income tax purposes.
Laredo LLC's subsidiaries and Broad Oak are subject to corporate income taxes. In addition, limited liability companies are subject to the Texas margin tax. Income tax expense for the six months ended June 30, 2011 and 2010 consisted of the following:
| |
Six months ended June 30, |
|||||||
|---|---|---|---|---|---|---|---|---|
| (in thousands) |
2011 |
2010 |
||||||
Current taxes |
||||||||
Federal |
$ | — | $ | — | ||||
State |
— | — | ||||||
Deferred taxes |
||||||||
Federal |
24,528 | 5,170 | ||||||
State |
1,209 | 610 | ||||||
|
$ | 25,737 | $ | 5,780 | ||||
F-28
Income tax benefit differed from amounts computed by applying the federal income tax rate of 34% to pre-tax income from operations as a result of the following:
| |
Six months ended June 30, |
|||||||
|---|---|---|---|---|---|---|---|---|
| (in thousands) |
2011 |
2010 |
||||||
Income tax benefit computed by applying the statutory rate |
$ | 24,303 | $ | 13,704 | ||||
State income tax, net of federal tax benefit and increase in valuation allowance |
1,189 | 1,300 | ||||||
Income from non-taxable entity |
(16 | ) | (31 | ) | ||||
Non-deductible compensation |
287 | 225 | ||||||
Valuation allowance |
2 | (8,703 | ) | |||||
Other items |
(28 | ) | (715 | ) | ||||
Income tax benefit |
$ | 25,737 | $ | 5,780 | ||||
Significant components of the Combined Company's deferred tax assets as are as follows:
| (in thousands) |
June 30, 2011 |
December 31, 2010 |
||||||
|---|---|---|---|---|---|---|---|---|
Derivative financial instruments |
$ | 13,392 | $ | 10,862 | ||||
Oil and gas properties and equipment |
(114,855 | ) | (59,854 | ) | ||||
Other |
(1,948 | ) | (2,174 | ) | ||||
Net operating loss carry-forward |
233,718 | 207,427 | ||||||
|
130,307 | 156,261 | ||||||
Valuation allowance |
(1,092 | ) | (1,309 | ) | ||||
Net deferred tax asset |
$ | 129,215 | $ | 154,952 | ||||
Net deferred tax assets and liabilities were classified in the Combined balance sheets as follows:
| (in thousands) |
June 30, 2011 |
December 31, 2010 |
||||||
|---|---|---|---|---|---|---|---|---|
Deferred tax asset |
$ | 129,215 | $ | 154,952 | ||||
Deferred tax liability |
— | — | ||||||
Net deferred tax asset |
$ | 129,215 | $ | 154,952 | ||||
The Company had federal net operating loss carry-forwards totaling approximately $312.3 million and state net operating loss carry-forwards totaling approximately $136.5 million at June 30, 2011. These carry-forwards begin expiring in 2026. The Company maintains a valuation allowance to reduce certain deferred tax assets to amounts that are more likely than not to be realized. At June 30, 2011, a $0.5 million valuation allowance has been recorded against the state of Texas deferred tax asset and a $0.02 million valuation allowance has been recorded against the Company's charitable contribution carry-forward at June 30, 2011. The Company believes the federal and state of Oklahoma net operating loss carry-forwards are fully realizable. The Company considered all available evidence, both positive and negative, in determining whether, based on the weight of that evidence, a valuation allowance was needed. Such consideration included estimated future net cash flows from its oil and gas
F-29
reserves (including the timing of those cash flows), the future tax effect of the deferred tax assets and liabilities recorded at June 30, 2011 and the Company's ability to use tax-planning strategies to prevent an operating loss carry-forward from expiring unused. Additionally, the Company takes advantage of allowable annual elections and techniques (such as capitalizing intangible drilling and development costs and amortizing such costs over five years) to enhance its tax position.
Broad Oak had federal net operating loss carry-forwards totaling approximately $357.7 million and state net operating loss carry-forwards totaling approximately $7.9 million at June 30, 2011. These carry-forwards begin expiring in 2026. Broad Oak maintains a valuation allowance to reduce certain deferred tax assets to amounts that are more likely than not to be realized. At June 30, 2011, a $0.6 million valuation allowance has been recorded against the state of Louisiana deferred tax asset and a $0.01 million valuation allowance has been recorded against Broad Oak's charitable contribution carry-forward. As of June 30, 2010, Broad Oak determined that it was more likely than not that its net deferred tax asset would not be realized in the amount of $39.2 million.
The Combined Company's income tax returns for the years 2007 through 2009 remain open and subject to examination by federal tax authorities and/or the tax authorities in Oklahoma, Texas, and Louisiana which are the jurisdictions where the Combined Company has or had principal operations. Additionally, the statute of limitations for examination of federal net operating loss carryovers typically does not begin to run until the year the attribute is utilized in a tax return. In evaluating its current tax positions in order to identify any material uncertain tax positions, the Combined Company developed a policy in identifying uncertain tax positions that considers support for each tax position, industry standards, tax return disclosures and schedules, and the significance of each position. The Combined Company had no material adjustments to its unrecognized tax benefits during the six months ended June 30, 2011.
G—Derivative financial instruments
1. Commodity derivatives
The Combined Company engages in derivative transactions such as collars, swaps, puts and basis swaps to hedge price risks due to unfavorable changes in oil and gas prices related to its oil and gas production. As of June 30, 2011, the Combined Company had 78 open derivative contracts with financial institutions, none of which were designated as hedges, which extend from July 2011 to December 2013. The contracts are recorded at fair value on the balance sheet and any realized and unrealized gains and losses are recognized in current year earnings.
Each collar transaction has an established price floor and ceiling. When the settlement price is below the price floor established by these collars, the Combined Company receives an amount from its counterparty equal to the difference between the settlement price and the price floor multiplied by the hedged contract volume. When the settlement price is above the price ceiling established by these collars, the Combined Company pays its counterparty an amount equal to the difference between the settlement price and the price ceiling multiplied by the hedged contract volume.
Each swap or put transaction has an established fixed price. When the settlement price is above the fixed price, the Combined Company pays its counterparty an amount equal to the difference between the settlement price and the fixed price multiplied by the hedged contract
F-30
volume. When the settlement price is below the fixed price, the counterparty pays the Combined Company an amount equal to the difference between the settlement price and the fixed price multiplied by the hedged contract volume.
Each basis swap transaction has an established fixed differential between the NYMEX gas futures and West Texas WAHA ("WAHA") index gas price. When the NYMEX futures settlement price less the fixed WAHA differential is greater than the actual WAHA price, the difference multiplied by the hedged contract volume is paid to the Combined Company by the counterparty. When the difference between the NYMEX futures settlement price less the fixed WAHA differential is less than the actual WAHA price, the Combined Company pays the counterparty an amount equal to the difference multiplied by the hedged contract volume.
During the six months ended June 30, 2011, the Combined Company entered into additional commodity contracts to hedge a portion of its estimated future production. The following table summarizes information about these additional commodity derivative contracts.
| |
Aggregate Volumes |
Index Price |
Contract period |
|||||
|---|---|---|---|---|---|---|---|---|
Oil (volumes in Bbls): |
||||||||
Swap |
100,000 | $101.00 | March 2011 - December 2011 | |||||
Price collar |
160,000 | $85.00 - $125.00 | March 2011 - December 2011 | |||||
Swap |
90,000 | $100.10 | April 2011 - December 2011 | |||||
Price collar |
80,000 | $95.00 - $125.70 | May 2011 - December 2011 | |||||
Price collar |
120,000 | $85.00 - $125.00 | January 2012 - December 2012 | |||||
Swap |
120,000 | $99.75 | January 2012 - December 2012 | |||||
Swap |
120,000 | $101.10 | January 2012 - December 2012 | |||||
Swap |
120,000 | $100.06 | January 2012 - December 2012 | |||||
Swap |
120,000 | $99.10 | January 2013 - December 2013 | |||||
Swap |
120,000 | $100.02 | January 2013 - December 2013 | |||||
Swap |
120,000 | $102.50 | January 2013 - December 2013 | |||||
Price collar |
96,000 | $85.00 - $125.00 | January 2013 - December 2013 | |||||
Natural gas (volumes in MMBtu): |
||||||||
Basis Swap |
500,000 | $0.26 | March 2011 - December 2011 | |||||
Swap |
350,000 | $4.75 | June 2011 - December 2011 | |||||
F-31
The following table summarizes open positions as of June 30, 2011, and represents, as of such date, derivatives in place through December 31, 2013, on annual production volumes:
| |
Remaining year 2011 |
Year 2012 |
Year 2013 |
||||||||
|---|---|---|---|---|---|---|---|---|---|---|---|
Oil positions: |
|||||||||||
Puts: |
|||||||||||
Hedged volume (Bbls) |
174,000 | 672,000 | 1,080,000 | ||||||||
Average price ($/Bbl) |
$ | 62.52 | $ | 65.79 | $ | 65.00 | |||||
Swaps: |
|||||||||||
Hedged volume (Bbls) |
438,170 | 732,000 | 600,000 | ||||||||
Average price ($/Bbl) |
$ | 86.73 | $ | 93.52 | $ | 96.32 | |||||
Collars: |
|||||||||||
Hedged volume (Bbls) |
360,000 | 498,000 | 216,000 | ||||||||
Average floor price ($/Bbl) |
$ | 78.25 | $ | 75.06 | $ | 73.89 | |||||
Average ceiling price ($/Bbl) |
$ | 113.58 | $ | 107.17 | $ | 120.56 | |||||
Natural gas positions: |
|||||||||||
Puts: |
|||||||||||
Hedged volume (MMBtu) |
180,000 | 4,320,000 | 6,600,000 | ||||||||
Average price ($/MMBtu) |
$ | 3.50 | $ | 5.38 | $ | 4.00 | |||||
Swaps: |
|||||||||||
Hedged volume (MMBtu) |
782,173 | 1,680,000 | — | ||||||||
Average price ($/MMBtu) |
$ | 5.65 | $ | 6.14 | $ | — | |||||
Collars: |
|||||||||||
Hedged volume (MMBtu) |
5,700,000 | 7,800,000 | 6,600,000 | ||||||||
Average floor price ($/MMBtu) |
$ | 4.82 | $ | 4.12 | $ | 4.00 | |||||
Average ceiling price ($/MMBtu) |
$ | 7.98 | $ | 5.79 | $ | 7.05 | |||||
Basis Swaps: |
|||||||||||
Hedged volume (MMBtu) |
2,520,000 | 2,880,000 | 1,200,000 | ||||||||
Average price ($/MMBtu) |
$ | 0.29 | $ | 0.31 | $ | 0.33 | |||||
The natural gas derivatives are settled based on NYMEX gas futures, the Northern Natural Gas Co. Demarcation price or the Panhandle Eastern Pipe Line spot price of natural gas for the calculation period. The oil derivatives are settled based on the month's average daily NYMEX price of West Texas Intermediate Light Sweet Crude Oil. Each basis swap transaction is settled based on the differential between the NYMEX gas futures and WAHA index gas price.
2. Interest rate derivatives
The Combined Company is exposed to market risk for changes in interest rates related to its credit facilities. Interest rate swap agreements are used to manage a portion of the exposure related to changing interest rates by converting floating-rate debt to fixed-rate debt. If LIBOR is lower than the fixed rate in the contract, the Combined Company is required to pay the counterparties the difference, and conversely, the counterparties are required to pay the Combined Company if LIBOR is higher than the fixed rate in the contract. For the interest rate cap below, the agreement cost was $0.2 million for the premium payment made in 2010 upon entering into the agreement. The Combined Company did not designate the interest rate
F-32
derivatives as cash flow hedges; therefore, the changes in fair value of these instruments are recorded in current earnings.
The following presents the settlement terms of the interest rate derivatives at June 30, 2011:
| (in thousands except rate data) |
Year 2011 |
Year 2012 |
Year 2013 |
|||||||
|---|---|---|---|---|---|---|---|---|---|---|
Notional amount |
$ | 110,000 | $ | 110,000 | $ | — | ||||
Fixed rate |
3.41 | % | 3.41 | % | — | |||||
Notional amount |
$ |
30,000 |
$ |
30,000 |
$ |
— |
||||
Fixed rate |
1.60 | % | 1.60 | % | — | |||||
Notional amount |
$ |
20,000 |
$ |
20,000 |
$ |
— |
||||
Fixed rate |
1.35 | % | 1.35 | % | — | |||||
Notional amount |
$ |
50,000 |
$ |
50,000 |
$ |
50,000 |
||||
Fixed rate |
1.11 | % | 1.11 | % | 1.11 | % | ||||
Notional amount |
$ |
50,000 |
$ |
50,000 |
$ |
50,000 |
||||
Cap rate |
3.00 | % | 3.00 | % | 3.00 | % | ||||
Total |
$ | 260,000 | $ | 260,000 | $ | 100,000 | ||||
3. Balance sheet presentation
The Combined Company's oil and gas commodity derivatives and interest rate derivatives are presented on a net basis in "Derivative financial instruments" in the Combined Balance Sheets.
The following summarizes the fair value of derivatives outstanding on a gross basis as of:
| (in thousands) |
June 30, 2011 |
December 31, 2010 |
|||||||
|---|---|---|---|---|---|---|---|---|---|
Assets: |
|||||||||
Commodity derivatives: |
|||||||||
Oil derivatives |
$ | 7,529 | $ | 8,398 | |||||
Natural gas derivatives |
17,048 | 22,035 | |||||||
Interest rate derivatives |
64 | 248 | |||||||
|
$ | 24,641 | $ | 30,681 | |||||
Liabilities: |
|||||||||
Commodity derivatives: |
|||||||||
Oil derivatives(1) |
$ | 27,065 | $ | 23,405 | |||||
Natural gas derivatives(2) |
8,115 | 9,271 | |||||||
Interest rate derivatives |
4,143 | 5,790 | |||||||
|
$ | 39,323 | $ | 38,466 | |||||
(1) The oil derivatives fair value is netted with a deferred premium liability of $7.8 million and $7.6 million at June 30, 2011 and December 31, 2010, respectively.
(2) The natural gas derivatives fair value is netted against a deferred premium liability of $4.9 million at June 30, 2011 and December 31, 2010.
F-33
By using derivative instruments to economically hedge exposures to changes in commodity prices and interest rates, the Combined Company exposes itself to credit risk and market risk. Credit risk is the failure of the counterparty to perform under the terms of the derivative contract. When the fair value of a derivative contract is positive, the counterparty owes the Combined Company, which creates credit risk. The Company's counterparties are participants in its credit facilities (as described in Note C) which is secured by the Company's oil and gas reserves; therefore, the Company is not required to post any collateral. Broad Oak's counterparties are participants in its credit facilities (as described in Note C) which is secured by Broad Oak's oil and gas reserves; therefore, Broad Oak is not required to post any collateral. The Combined Company does not require collateral from its counterparties. The Combined Company minimizes the credit risk in derivative instruments by: (i) limiting its exposure to any single counterparty; (ii) entering into derivative instruments only with counterparties that are also lenders in the Combined Company's credit facilities and meet the Combined Company's minimum credit quality standard, or have a guarantee from an affiliate that meets the Combined Company's minimum credit quality standard; and (iii) monitoring the creditworthiness of the Combined Company's counterparties on an ongoing basis. In accordance with the Combined Company's standard practice, its commodity and interest rate derivatives are subject to counterparty netting under agreements governing such derivatives and, therefore, the risk of such loss is somewhat mitigated at June 30, 2011.
4. Gain (loss) on derivatives
Gains and losses on derivatives are reported on the combined statements of operations in the respective "Realized and unrealized gain (loss)" amounts. Realized gains (losses), represent amounts related to the settlement of derivative instruments, and for commodity derivatives, are aligned with the underlying production. Unrealized gains (losses) represent the change in fair value of the derivative instruments and are non-cash items.
The following represents the Combined Company's reported gains and losses on derivative instruments for the six months ended June 30, 2011 and 2010:
| |
Six months ended June 30, |
|||||||
|---|---|---|---|---|---|---|---|---|
| (in thousands) |
2011 |
2010 |
||||||
Realized gains (losses): |
||||||||
Commodity derivatives |
$ | (931 | ) | $ | 9,158 | |||
Interest rate derivatives |
(2,556 | ) | (2,623 | ) | ||||
|
(3,487 | ) | 6,535 | |||||
Unrealized gains (losses): |
||||||||
Commodity derivatives |
(8,654 | ) | 13,932 | |||||
Interest rate derivatives |
1,462 | (1,329 | ) | |||||
|
(7,192 | ) | 12,603 | |||||
Total gains (losses): |
||||||||
Commodity derivatives |
(9,585 | ) | 23,090 | |||||
Interest rate derivatives |
(1,094 | ) | (3,952 | ) | ||||
|
$ | (10,679 | ) | $ | 19,138 | |||
F-34
H—Fair value measurements
The Combined Company accounts for its oil and gas commodity derivatives and interest rate derivatives at fair value (see Note G). The fair value of derivative financial instruments is determined utilizing pricing models for similar instruments. The models use a variety of techniques to arrive at fair value, including quotes and pricing analysis. Inputs to the pricing models include publicly available prices and forward curves generated from a compilation of data gathered from third parties.
The Combined Company has categorized its assets and liabilities measured at fair value, based on the priority of inputs to the valuation technique, into a three-level fair value hierarchy. The fair value hierarchy gives the highest priority to quoted prices in active markets for identical assets or liabilities (Level 1) and the lowest priority to unobservable inputs (Level 3).
Assets and liabilities recorded at fair value on the consolidated balance sheets are categorized based on the inputs to the valuation techniques as follows:
| Level 1— | Assets and liabilities recorded at fair value for which values are based on unadjusted quoted prices for identical assets or liabilities in an active market that management has the ability to access. Active markets are considered to be those in which transactions for the assets or liabilities occur in sufficient frequency and volume to provide pricing information on an ongoing basis. | |
Level 2— |
Assets and liabilities recorded at fair value for which values are based on quoted prices in markets that are not active or model inputs that are observable either directly or indirectly for substantially the full term of the asset or liability. Substantially all of these inputs are observable in the marketplace throughout the full term of the price risk management instrument, can be derived from observable data or supported by observable levels at which transactions are executed in the marketplace. |
|
Level 3— |
Assets and liabilities recorded at fair value for which values are based on prices or valuation techniques that require inputs that are both unobservable and significant to the overall fair value measurement. Unobservable inputs that are not corroborated by market data. These inputs reflect management's own assumptions about the assumptions a market participant would use in pricing the asset or liability. |
When the inputs used to measure fair value fall within different levels of the hierarchy in a liquid environment, the level within which the fair value measurement is categorized is based on the lowest level input that is significant to the fair value measurement in its entirety. The Combined Company conducts a review of fair value hierarchy classifications on a quarterly basis. Changes in the observability of valuation inputs may result in a reclassification for certain financial assets or liabilities.
Fair value measurement on a recurring basis
The following presents the Combined Company's fair value hierarchy for assets and liabilities measured at fair value on a recurring basis at June 30, 2011 and December 31, 2010, respectively. These items are included in "Derivative financial instruments" on the Combined balance sheets. Significant Level 2 assumptions associated with the calculations of discounted
F-35
cash flows used in the mark-to-market analysis include NYMEX natural gas and crude oil prices, appropriate risk adjusted discount rates and other relevant data.
| (in thousands) |
Level 1 |
Level 2 |
Level 3 |
Total fair value |
|||||||||||
|---|---|---|---|---|---|---|---|---|---|---|---|---|---|---|---|
As of June 30, 2011: |
|||||||||||||||
Commodity derivatives |
$ | — | $ | (11,871 | ) | $ | 13,938 | $ | 2,067 | ||||||
Deferred premiums |
— | — | (12,670 | ) | (12,670 | ) | |||||||||
Interest rate derivatives |
— | (4,079 | ) | — | (4,079 | ) | |||||||||
Total |
$ | — | $ | (15,950 | ) | $ | 1,268 | $ | (14,682 | ) | |||||
| (in thousands) |
Level 1 |
Level 2 |
Level 3 |
Total fair value |
|||||||||||
|---|---|---|---|---|---|---|---|---|---|---|---|---|---|---|---|
As of December 31, 2010: |
|||||||||||||||
Commodity derivatives |
$ | — | $ | (9,774 | ) | $ | 20,026 | $ | 10,252 | ||||||
Deferred premiums |
— | — | (12,495 | ) | (12,495 | ) | |||||||||
Interest rate derivatives |
— | (5,542 | ) | — | (5,542 | ) | |||||||||
Total |
$ | — | $ | (15,316 | ) | $ | 7,531 | $ | (7,785 | ) | |||||
A summary of the changes in assets classified as Level 3 measurements for the six months ended June 30, 2011 and 2010 are presented below.
| (in thousands) |
Derivative option contracts |
Deferred premiums |
||||||
|---|---|---|---|---|---|---|---|---|
Balance of Level 3 at December 31, 2010 |
$ | 20,026 | $ | (12,495 | ) | |||
Realized and unrealized losses included in earnings |
(6,588 | ) | — | |||||
Amortization of deferred premiums |
— | (216 | ) | |||||
Total purchases and settlements: |
||||||||
Purchases |
500 | — | ||||||
Settlements |
— | 41 | ||||||
Balance of Level 3 at June 30, 2011 |
$ | 13,938 | $ | (12,670 | ) | |||
Change in unrealized gains attributed to earnings |
||||||||
relating to derivatives still held at June 30, 2011 |
$ | 1,970 | $ | — | ||||
| (in thousands) |
Derivative option contracts |
Deferred premiums |
||||||
|---|---|---|---|---|---|---|---|---|
Balance of Level 3 at December 31, 2009 |
$ | 14,610 | $ | (3,524 | ) | |||
Realized and unrealized gains included in earnings |
1,344 | — | ||||||
Amortization of deferred premiums |
— | (50 | ) | |||||
Total purchases, issuances and settlements: |
||||||||
Purchases |
449 | — | ||||||
Balance of Level 3 at June 30, 2010 |
$ | 16,403 | $ | (3,574 | ) | |||
Change in unrealized gains attributed to earnings |
||||||||
relating to derivatives still held at June 30, 2010 |
$ | 442 | $ | — | ||||
F-36
Fair value measurement on a nonrecurring basis
The Combined Company accounts for additions to its asset retirement obligation (see Note B.7) and impairment of long-lived assets (see Note B.12), if any, at fair value on a nonrecurring basis in accordance with GAAP. For purposes of fair value measurement, it was determined that the impairment of long-lived assets and the additions to the asset retirement obligation are classified as Level 3. No impairments of long-lived assets were recorded during the six months ended June 30, 2011 and 2010.
Inherent in the fair value calculation of asset retirement obligations are numerous assumptions and judgments, including, in addition to those noted above, the ultimate settlement of these amounts, the ultimate timing of such settlement, and changes in legal, regulatory, environmental and political environments. To the extent future revisions to these assumptions impact the fair value of the existing asset retirement obligation liability, a corresponding adjustment will be made to the asset balance.
Asset retirement obligations. The accounting policies for asset retirement obligations are discussed in Note B.7 including a reconciliation of the Combined Company's asset retirement obligation. The fair value of additions to the asset retirement obligation liability is measured using valuation techniques consistent with the income approach, which converts future cash flows to a single discounted amount. Significant inputs to the valuation include: (i) estimated plug and abandonment cost per well based on Combined Company experience; (ii) estimated remaining life per well based on the reserve life per well; (iii) future inflation factors; and (iv) the Company's and Broad Oak's average credit adjusted risk free rate.
I—Credit risk
The Combined Company's oil and gas sales are to a variety of purchasers, including intrastate and interstate pipelines or their marketing affiliates and independent marketing companies. The Combined Company's joint operations accounts receivable are from a number of oil and gas companies, partnerships, individuals and others who own interests in the properties operated by the Combined Company. Management believes that any credit risk imposed by a concentration in the oil and gas industry is offset by the creditworthiness of the Combined Company's customer base. The Combined Company routinely assesses the recoverability of all material joint operations and other receivables to determine collectability.
F-37
The following table summarizes the net oil and gas sales (oil and gas sales less production taxes) received from the Combined Company's related party and included in the Combined statements of operation for the periods presented:
| |
For the six months ended June 30, |
||||||
|---|---|---|---|---|---|---|---|
| (in thousands) |
2011 |
2010 |
|||||
Net oil and gas sales(1) |
$ | 33,533 | $ | 11,206 | |||
The following table summarizes the amounts included in oil and gas sales receivable in the Combined balance sheets for the periods presented:
| (in thousands) |
At June 30, 2011 |
At December 31, 2010 |
|||||
|---|---|---|---|---|---|---|---|
Oil and gas sales receivable(1) |
$ | 6,545 | $ | 4,435 | |||
(1) The Combined Company has a gas gathering and processing arrangement with affiliates of Targa Resources, Inc. ("Targa"). Warburg Pincus IX, a majority equityholder in the Combined Company, and other Warburg Pincus affiliates hold investment interests in Targa. One of Laredo LLC's directors is on the board of directors of affiliates of Targa.
J—Commitments and contingencies
1. Lease commitments
The Combined Company leases equipment and office space under operating leases expiring on various dates through 2016. Minimum annual lease commitments at June 30, 2011, and for the calendar years following are:
| (in thousands) |
|
|||
|---|---|---|---|---|
Remaining 2011 |
$ | 654 | ||
2012 |
1,187 | |||
2013 |
1,061 | |||
2014 |
715 | |||
2015 |
344 | |||
Thereafter |
89 | |||
Total |
$ | 4,050 | ||
Rent expense was approximately $0.6 million and $0.4 million for the six months ended June 30, 2011 and 2010, respectively.
The Combined Company's office space lease agreement contains scheduled escalation in lease payments during the term of the lease. In accordance with GAAP, the Combined Company records rent expense on a straight-line basis and a deferred lease liability for the difference between the straight-line amount and the actual amounts of the lease payments.
2. Litigation
The Combined Company may be involved in legal proceedings and/or is subject to industry rulings that could bring rise to claims in the ordinary course of business. The Combined Company has concluded that the likelihood is remote that the ultimate resolution of any
F-38
pending litigation or pending claims will be material or have a material adverse effect on the Combined Company's business, financial position, results of operations or liquidity.
3. Drilling contracts
The Combined Company has committed to several short-term drilling and long-term contracts with various third parties in order to complete its various drilling projects. The contracts contain an early termination clause that require the Combined Company to pay significant penalties to the third party should the Combined Company cease drilling efforts. These penalties could significantly impact the Combined Company's financial statements upon contract termination. These commitments are not recorded in the accompanying combined balance sheets. Future commitments as of June 30, 2011 are $16.5 million. Management does not anticipate canceling any drilling contracts or discontinuing drilling efforts in 2011.
4. Federal and state regulations
Oil and natural gas exploration, production and related operations are subject to extensive federal and state laws, rules and regulations. Failure to comply with these laws, rules and regulations can result in substantial penalties. The regulatory burden on the oil and natural gas industry increases the cost of doing business and affects profitability. The Combined Company believes that it is in compliance with currently applicable state and federal regulations and these regulations will not have a material adverse impact on the financial position or results of operations of the Combined Company. Because these rules and regulations are frequently amended or reinterpreted, the Combined Company is unable to predict the future cost or impact of complying with these regulations.
K—Defined contribution plan
Laredo
Laredo sponsors a 401(k) defined contribution plan for the benefit of substantially all employees at the date of hire. The plan allows eligible employees to make tax-deferred contributions up to 100% of their annual compensation, not to exceed annual limits established by the federal government. Laredo makes matching contributions of up to 6% of an employee's compensation and may make additional discretionary contributions for eligible employees. Employees are 100% vested in the employer contributions upon receipt. Company contributions to the plan were $0.4 million for both of the six month periods ended June 30, 2011 and 2010.
Broad Oak
Broad Oak sponsors a 401(k) defined contribution plan for the benefit of all employees. Employees are eligible to join the plan the first day of the calendar month immediately following the employee's date of employment. The plan allows each participant to contribute up to the maximum allowable by the federal government. Each pay period, Broad Oak makes a contribution to the plan that equals the employee's contribution up to the first 6% of the employee's compensation for the period. Employees are 100% vested in the employer contributions upon receipt. Broad Oak's employer contributions were $0.3 million and $0.2 million for the six months ended June 30, 2011 and 2010, respectively. In addition, each year in accordance with the plan, Broad Oak may make an additional discretionary matching contribution of up to 4% of the employee's earnings. Broad Oak's discretionary matching
F-39
contributions totaled $0.2 million and $0.1 million for the six months ended June 30, 2011 and 2010, respectively.
L—Other accrued current liabilities
The following table provides the components of the Combined Company's accrued other current liabilities at June 30, 2011 and December 31, 2010:
| (in thousands) |
June 30, 2011 |
December 31, 2010 |
||||||
|---|---|---|---|---|---|---|---|---|
Accrued expenses |
$ | 3,378 | $ | 2,870 | ||||
Accrued interest payable |
15,053 | 1,542 | ||||||
Production taxes payable |
3,566 | 1,378 | ||||||
Prepaid drilling liability |
2,550 | 1,896 | ||||||
Lease operating expense accrual |
3,074 | 2,913 | ||||||
Other |
261 | 255 | ||||||
Other accrued current liabilities |
$ | 27,882 | $ | 10,854 | ||||
M—Subsidiary guarantees
Laredo LLC and all of Laredo's wholly-owned subsidiaries (Laredo Gas and Laredo Texas, collectively, the "Subsidiary Guarantors") have fully and unconditionally guaranteed the 2019 Notes and the Laredo Senior Secured Credit Facility (see Note C). In accordance with practices accepted by the SEC, Laredo has prepared condensed combined consolidating financial statements in order to quantify the assets, results of operations and cash flows of such subsidiaries as issuer subsidiary guarantors. The following Condensed Combined Consolidating Balance Sheets at June 30, 2011 and December 31, 2010, and Condensed Combined Consolidating Statements of Operations and Condensed Combined Consolidating Statements of Cash Flows for the six months ended June 30, 2011 and 2010, present financial information for Laredo LLC as the parent of Laredo on a stand-alone basis (carrying any investments in subsidiaries under the equity method), financial information for Laredo on a stand-alone basis (carrying any investment in subsidiaries under the equity method), financial information for the Subsidiary Guarantors on a stand-alone basis (carrying any investment in subsidiaries under the equity method), financial information for Broad Oak on a stand-alone basis and the consolidation and elimination entries necessary to arrive at the information for the Combined Company on a condensed combined consolidated basis. All deferred income taxes are recorded on the books of Laredo's statements of financial position, as Laredo's subsidiaries are flow-through entities for income tax purposes. The Subsidiary Guarantors are not restricted from making distributions to Laredo.
F-40
Condensed combined balance sheet
June 30, 2011
| (in thousands) |
Laredo LLC |
Laredo |
Subsidiary guarantors |
Broad Oak |
Intercompany eliminations |
Combined company |
||||||||||||||
|---|---|---|---|---|---|---|---|---|---|---|---|---|---|---|---|---|---|---|---|---|
Accounts receivable |
$ | — | $ | 34,235 | $ | 843 | $ | 21,003 | $ | — | $ | 56,081 | ||||||||
Other current assets |
31,382 | 21,651 | — | 14,863 | (20,058 | ) | 47,838 | |||||||||||||
Total oil and natural gas properties, net |
— | 586,826 | 17,911 | 419,150 | — | 1,023,887 | ||||||||||||||
Total pipeline and gas gathering assets, net |
— | — | 43,667 | — | — | 43,667 | ||||||||||||||
Total other fixed assets, net |
— | 9,963 | — | 519 | — | 10,482 | ||||||||||||||
Investment in subsidiaries |
518,526 | 113,728 | — | — | (632,254 | ) | — | |||||||||||||
Total other long-term assets |
128,973 | — | 5,865 | — | 134,838 | |||||||||||||||
Total assets |
$ | 549,908 | $ | 895,376 | $ | 62,421 | $ | 461,400 | $ | (652,312 | ) | $ | 1,316,793 | |||||||
Accounts payable |
$ |
1 |
$ |
40,778 |
$ |
705 |
$ |
21,892 |
$ |
(20,058 |
) |
$ |
43,318 |
|||||||
Other current liabilities |
— | 72,912 | 1,751 | 30,764 | — | 105,427 | ||||||||||||||
Other long-term liabilities |
— | 8,776 | 2,412 | 8,743 | — | 19,931 | ||||||||||||||
Long-term debt |
— | 425,000 | — | 265,400 | — | 690,400 | ||||||||||||||
Owners' equity |
549,907 | 347,910 | 57,553 | 134,601 | (632,254 | ) | 457,717 | |||||||||||||
Total liabilities and owners' equity |
$ | 549,908 | $ | 895,376 | $ | 62,421 | $ | 461,400 | $ | (652,312 | ) | $ | 1,316,793 | |||||||
Condensed combined balance sheet
December 31, 2010
| (in thousands) |
Laredo LLC |
Laredo |
Subsidiary guarantors |
Broad Oak |
Intercompany eliminations |
Combined company |
||||||||||||||
|---|---|---|---|---|---|---|---|---|---|---|---|---|---|---|---|---|---|---|---|---|
Accounts receivable |
$ | — | $ | 24,168 | $ | 824 | $ | 18,947 | $ | — | $ | 43,939 | ||||||||
Other current assets |
38,652 | 21,391 | — | 10,340 | (13,906 | ) | 56,477 | |||||||||||||
Total oil and natural gas properties, net |
— | 430,242 | 20,105 | 312,936 | — | 763,283 | ||||||||||||||
Total pipeline and gas gathering assets, net |
— | — | 39,343 | — | — | 39,343 | ||||||||||||||
Total other fixed assets, net |
— | 6,915 | — | 352 | — | 7,267 | ||||||||||||||
Investment in subsidiaries |
511,208 | 114,881 | — | — | (626,089 | ) | — | |||||||||||||
Total other long-term assets |
— | 129,799 | — | 28,052 | — | 157,851 | ||||||||||||||
Total assets |
$ | 549,860 | $ | 727,396 | $ | 60,272 | $ | 370,627 | $ | (639,995 | ) | $ | 1,068,160 | |||||||
Accounts payable |
$ |
1 |
$ |
42,311 |
$ |
1,235 |
$ |
12,551 |
$ |
(13,906 |
) |
$ |
42,192 |
|||||||
Other current liabilities |
— | 64,675 | 2,210 | 41,166 | — | 108,051 | ||||||||||||||
Other long-term liabilities |
— | 6,602 | 2,340 | 6,276 | — | 15,218 | ||||||||||||||
Long-term debt |
— | 277,500 | — | 214,100 | — | 491,600 | ||||||||||||||
Owner's equity |
549,859 | 336,308 | 54,486 | 96,535 | (626,089 | ) | 411,099 | |||||||||||||
Total liabilities and owners' equity |
$ | 549,860 | $ | 727,396 | $ | 60,271 | $ | 370,628 | $ | (639,995 | ) | $ | 1,068,160 | |||||||
F-41
Condensed combined statement of operations
For the six months ended June 30, 2011
| (in thousands) |
Laredo LLC |
Laredo |
Subsidiary guarantors |
Broad Oak |
Intercompany eliminations |
Combined company |
||||||||||||||
|---|---|---|---|---|---|---|---|---|---|---|---|---|---|---|---|---|---|---|---|---|
Total operating revenues |
$ | — | $ | 102,485 | $ | 10,238 | $ | 129,412 | $ | (3,294 | ) | $ | 238,841 | |||||||
Total operating costs and expenses |
7 | 71,862 | 6,018 | 56,615 | (3,294 | ) | 131,208 | |||||||||||||
Income (loss) from operations |
(7 | ) | 30,623 | 4,220 | 72,797 | — | 107,633 | |||||||||||||
Interest income (expense), net |
55 | (17,155 | ) | — | (5,097 | ) | — | (22,197 | ) | |||||||||||
Other, net |
— | (5,693 | ) | — | (8,264 | ) | — | (13,957 | ) | |||||||||||
Income from operations before income tax |
48 | 7,775 | 4,220 | 59,436 | — | 71,479 | ||||||||||||||
Income tax expense |
— | (4,336 | ) | — | (21,401 | ) | — | (25,737 | ) | |||||||||||
Net income |
$ | 48 | $ | 3,439 | $ | 4,220 | $ | 38,035 | $ | — | $ | 45,742 | ||||||||
Condensed combined statement of operations
For the six months ended June 30, 2010
| (in thousands) |
Laredo LLC |
Laredo |
Subsidiary guarantors |
Broad Oak |
Intercompany eliminations |
Combined company |
||||||||||||||
|---|---|---|---|---|---|---|---|---|---|---|---|---|---|---|---|---|---|---|---|---|
Total operating revenues |
$ | — | $ | 41,440 | $ | 9,376 | $ | 48,019 | $ | (1,909 | ) | $ | 96,926 | |||||||
Total operating costs and expenses |
7 | 40,806 | 7,196 | 23,796 | (1,909 | ) | 69,896 | |||||||||||||
Income (loss) from operations |
(7 | ) | 634 | 2,180 | 24,223 | — | 27,030 | |||||||||||||
Interest income (expense), net |
97 | (3,704 | ) | — | (2,224 | ) | — | (5,831 | ) | |||||||||||
Other, net |
— | 14,543 | — | 4,563 | — | 19,106 | ||||||||||||||
Income from operations before income tax |
90 | 11,473 | 2,180 | 26,562 | — | 40,305 | ||||||||||||||
Income tax expense |
— | (4,947 | ) | — | (833 | ) | — | (5,780 | ) | |||||||||||
Net income |
$ | 90 | $ | 6,526 | $ | 2,180 | $ | 25,729 | $ | — | $ | 34,525 | ||||||||
Condensed combined statement of cash flows
For the six months ended June 30, 2011
| (in thousands) |
Laredo LLC |
Laredo |
Subsidiary guarantors |
Broad Oak |
Intercompany eliminations |
Combined company |
||||||||||||||
|---|---|---|---|---|---|---|---|---|---|---|---|---|---|---|---|---|---|---|---|---|
Net cash flows provided by operating activities |
$ | 47 | $ | 65,580 | $ | 7,965 | $ | 94,618 | $ | (6,152 | ) | $ | 162,058 | |||||||
Net cash flows used in investing activities |
(7,318 | ) | (203,452 | ) | (7,965 | ) | (140,714 | ) | — | (359,449 | ) | |||||||||
Net cash flows provided by financing activities |
— | 137,872 | — | 50,336 | — | 188,208 | ||||||||||||||
Net increase (decrease) in cash and cash equivalents |
(7,271 | ) | — | — | 4,240 | (6,152 | ) | (9,183 | ) | |||||||||||
Cash and cash equivalents at beginning of period |
38,652 | — | — | 6,489 | (13,906 | ) | 31,235 | |||||||||||||
Cash and cash equivalents at end of period |
$ | 31,381 | $ | — | $ | — | $ | 10,729 | $ | (20,058 | ) | $ | 22,052 | |||||||
F-42
Condensed combined statement of cash flows
For the six months ended June 30, 2010
| (in thousands) |
Laredo LLC |
Laredo |
Subsidiary guarantors |
Broad Oak |
Intercompany eliminations |
Combined company |
||||||||||||||
|---|---|---|---|---|---|---|---|---|---|---|---|---|---|---|---|---|---|---|---|---|
Net cash flows provided by operating activities |
$ | 90 | $ | 20,936 | $ | 2,973 | $ | 31,906 | $ | 1,747 | $ | 57,652 | ||||||||
Net cash flows used in investing activities |
(45,254 | ) | (20,778 | ) | (2,973 | ) | (112,260 | ) | — | (181,265 | ) | |||||||||
Net cash flows provided by (used in) financing activities |
51,575 | (158 | ) | — | 82,090 | — | 133,507 | |||||||||||||
Net increase in cash and cash equivalents |
6,411 | — | — | 1,736 | 1,747 | 9,894 | ||||||||||||||
Cash and cash equivalents at beginning of period |
16,922 | — | — | 1,766 | (3,701 | ) | 14,987 | |||||||||||||
Cash and cash equivalents at end of period |
$ | 23,333 | $ | — | $ | — | $ | 3,502 | $ | (1,954 | ) | $ | 24,881 | |||||||
N—Subsequent events
1. Amendments to the Laredo Senior Secured Credit Facility
As previously described in Note A, on July 1, 2011, Laredo LLC and Laredo consummated a transaction by which Broad Oak became a wholly-owned subsidiary of Laredo LLC. The cash portion of the transaction was funded under an amendment and restatement to the Laredo Senior Secured Credit Facility. Under this third amendment and restatement, the Laredo Senior Secured Credit Facility's capacity increased to $1.0 billion, with a borrowing base of $650.0 million. At August 22, 2011, $500.0 million was outstanding. The borrowing base is subject to a semi-annual redetermination based on the financial institutions' evaluation of Laredo's oil and gas reserves. The amendment lengthened the term of the Laredo Senior Secured Credit Facility making it available to July 2016, at which time the outstanding balance will be due. As defined in the Senior Secured Credit Facility, (i) the Adjusted Base Rate advances under the facility bear interest payable quarterly at an Adjusted Base Rate plus applicable margin and (ii) the Eurodollar advances under the facility bear interest, at our election, at the end of one-month, two-month, three-month, six-month or, to the extent available, twelve-month interest periods (and in the case of six-month and twelve-month interest periods, every three months prior to the end of such interest period) at an Adjusted London Interbank Offered Rate plus an applicable margin, based on the ratio of outstanding revolving credit to the conforming base rate. Laredo is also required to pay an annual commitment fee on the unused portion of the bank's commitment of 0.375% to 0.5%.
2. Broad Oak Transaction
On July 1, 2011, Laredo LLC and Laredo completed the acquisition of Broad Oak, which became a wholly-owned subsidiary of Laredo. In connection with the transaction, Laredo LLC issued: (i) approximately 86.5 million preferred equity units to Warburg Pincus IX and WP IX Finance in exchange for the convertible preferred stock previously held in Broad Oak; and (ii) approximately 2.4 million preferred equity units to Broad Oak's management and directors in exchange for certain of the vested common stock and convertible preferred stock they previously held in Broad Oak. In addition, Laredo paid approximately $82 million in cash for
F-43
certain of the vested Broad Oak common stock, convertible preferred stock and all outstanding and vested Broad Oak options that certain Broad Oak directors and management and employees elected to sell. All unvested shares of Broad Oak common stock and unvested Broad Oak options were cancelled. Additionally, the Broad Oak Credit Facility was paid in full and terminated. Immediately following the consummation of such transaction, Laredo LLC assigned 100% of its ownership interest in Broad Oak to Laredo as a contribution to capital.
The cash portion of the transaction was funded under the amended and restated Laredo Senior Secured Credit Facility, as described in Note N.1 above.
Upon consummation of the acquisition of Broad Oak, Broad Oak was added as a guarantor under the Laredo Senior Secured Credit Facility and the 2019 Notes and its name was changed to Laredo Petroleum — Dallas, Inc.
In connection with the Broad Oak Transaction, the LLC Agreement was amended and restated (the "Amended and Restated LLC Agreement"). The amendment and restatement, among other things, created a new series of preferred units that were issued to Broad Oak's stockholders and three new series of restricted units which are subject to the same vesting requirements as the other Restricted Units.
On August 10, 2011, Laredo LLC granted an aggregate of approximately 5.3 million Series F Units to the legacy Company employees, including the named executive officers, and approximately 1.2 million Series G Units and approximately 0.7 million BOE Incentive Units to certain new employees from former Broad Oak, all of which were authorized pursuant to the Amended and Restated LLC Agreement.
3. IPO
On August 12, 2011, Laredo LLC formed Laredo Holdings, a new wholly-owned subsidiary, in anticipation of an IPO. Immediately prior to the effectiveness of the IPO, Laredo LLC will be merged into Laredo Holdings and Laredo Holdings will continue as the surviving corporation. The Amended and Restated LLC Agreement and related agreements will consequently be terminated as the ownership in Laredo LLC will be exchanged for shares of common stock of Laredo Holdings.
We have evaluated subsequent events for recognition or disclosure through August 23, 2011, which was the date the financial statements were filed with the SEC.
F-44
REPORT OF INDEPENDENT REGISTERED PUBLIC ACCOUNTING FIRM
Board
of Managers and Members
Laredo Petroleum, LLC
We have audited the accompanying combined balance sheets of Laredo Petroleum (the "Company") (the combined operations of Laredo Petroleum, LLC, Laredo Petroleum, Inc., Laredo Petroleum Texas, LLC, Laredo Gas Services, LLC and Broad Oak Energy, Inc. as described in Note A) as of December 31, 2010 and 2009, and the related combined statements of income, owners' equity, and cash flows for each of the three years in the period ended December 31, 2010. These financial statements are the responsibility of the Company's management. Our responsibility is to express an opinion on these financial statements based on our audits.
We conducted our audits in accordance with the standards of the Public Company Accounting Oversight Board (United States). Those standards require that we plan and perform the audit to obtain reasonable assurance about whether the financial statements are free of material misstatement. The Company is not required to have, nor were we engaged to perform an audit of its internal control over financial reporting. Our audit included consideration of internal control over financial reporting as a basis for designing audit procedures that are appropriate in the circumstances, but not for the purpose of expressing an opinion on the effectiveness of the Company's internal control over financial reporting. Accordingly, we express no such opinion. An audit also includes examining, on a test basis, evidence supporting the amounts and disclosures in the financial statements, assessing the accounting principles used and significant estimates made by management, as well as evaluating the overall financial statement presentation. We believe that our audits provide a reasonable basis for our opinion.
In our opinion, the combined financial statements referred to above present fairly, in all material respects, the financial position of Laredo Petroleum as of December 31, 2010 and 2009, and the results of its operations and its cash flows for each of the three years in the period ended December 31, 2010, in conformity with accounting principles generally accepted in the United States of America.
/s/ GRANT THORNTON LLP
Tulsa,
Oklahoma
August 23, 2011
F-45
Laredo Petroleum
Combined balance sheets
December 31, 2010 and 2009
(in thousands)
| |
2010 |
2009 |
||||||||
|---|---|---|---|---|---|---|---|---|---|---|
ASSETS |
||||||||||
CURRENT ASSETS: |
||||||||||
Cash and cash equivalents |
$ | 31,235 | $ | 14,987 | ||||||
Accounts receivable, net: |
||||||||||
Oil and gas sales |
31,773 | 14,160 | ||||||||
Joint operations |
12,031 | 5,621 | ||||||||
Other |
135 | 859 | ||||||||
Capital contributions receivable |
— | 50,000 | ||||||||
Materials and supplies |
4,154 | 559 | ||||||||
Prepaid expenses |
1,483 | 3,295 | ||||||||
Derivative financial instruments |
8,376 | 4,663 | ||||||||
Deferred income taxes |
11,229 | 5,749 | ||||||||
Total current assets |
100,416 | 99,893 | ||||||||
PROPERTY AND EQUIPMENT: |
||||||||||
Oil and gas properties, full cost method: |
||||||||||
Proved properties |
1,379,885 | 881,106 | ||||||||
Unproved properties not being amortized |
96,515 | 92,847 | ||||||||
Pipeline and gas gathering assets |
43,271 | 38,166 | ||||||||
Other fixed assets |
10,869 | 8,507 | ||||||||
|
1,530,540 | 1,020,626 | ||||||||
Less accumulated depreciation, depletion, amortization and impairment |
720,647 |
624,526 |
||||||||
Net property and equipment |
809,893 | 396,100 | ||||||||
OTHER ASSETS, net |
85 | 104 | ||||||||
MATERIALS AND SUPPLIES |
1,886 | 1,338 | ||||||||
DEFERRED INCOME TAXES |
143,723 | 123,391 | ||||||||
DERIVATIVE FINANCIAL INSTRUMENTS |
1,804 | 2,143 | ||||||||
DEFERRED LOAN COSTS, net |
10,353 | 2,375 | ||||||||
Total assets |
$ | 1,068,160 | $ | 625,344 | ||||||
LIABILITIES AND OWNERS' EQUITY |
||||||||||
CURRENT LIABILITIES: |
||||||||||
Accounts payable |
$ | 41,338 | $ | 34,284 | ||||||
Undistributed revenue and royalties |
10,664 | 9,929 | ||||||||
Accrued capital expenditures |
65,900 | 19,696 | ||||||||
Accrued compensation and benefits |
8,778 | 3,157 | ||||||||
Other accrued liabilities |
10,854 | 6,223 | ||||||||
Current portion of asset retirement obligations |
731 | 1,528 | ||||||||
Derivative financial instruments |
11,978 | 4,448 | ||||||||
Total current liabilities |
150,243 | 79,265 | ||||||||
LONG-TERM DEBT |
491,600 | 247,100 | ||||||||
GAS IMBALANCES |
1,093 | 1,108 | ||||||||
DERIVATIVE FINANCIAL INSTRUMENTS |
5,987 | 3,737 | ||||||||
ASSET RETIREMENT OBLIGATIONS |
7,547 | 4,317 | ||||||||
DEFERRED LEASE LIABILITY |
591 | 710 | ||||||||
Total liabilities |
657,061 | 336,237 | ||||||||
OWNERS' EQUITY, per accompanying statement |
411,099 | 289,107 | ||||||||
Total liabilities and owners' equity |
$ | 1,068,160 | $ | 625,344 | ||||||
The accompanying notes are an integral part of these combined financial statements.
F-46
Laredo Petroleum
Combined statements of operations
For the years ended December 31, 2010, 2009 and 2008
(in thousands)
| |
2010 |
2009 |
2008 |
||||||||||
|---|---|---|---|---|---|---|---|---|---|---|---|---|---|
REVENUES: |
|||||||||||||
Oil and gas sales |
$ | 239,783 | $ | 94,347 | $ | 73,883 | |||||||
Natural gas transportation and treating |
2,217 | 2,227 | 304 | ||||||||||
Drilling and production |
4 | 318 | 548 | ||||||||||
Total revenues |
242,004 | 96,892 | 74,735 | ||||||||||
COSTS AND EXPENSES: |
|||||||||||||
Lease operating expenses |
21,684 | 12,531 | 6,436 | ||||||||||
Production and ad valorem taxes |
15,699 | 6,129 | 5,481 | ||||||||||
Natural gas transportation and treating |
2,501 | 1,416 | 154 | ||||||||||
Drilling rig fees |
— | 1,606 | — | ||||||||||
Drilling and production |
344 | 1,076 | 23 | ||||||||||
General and administrative |
30,908 | 22,492 | 23,248 | ||||||||||
Bad debt expense |
— | 91 | — | ||||||||||
Accretion of asset retirement obligations |
475 | 406 | 170 | ||||||||||
Depreciation, depletion and amortization |
97,411 | 58,005 | 33,102 | ||||||||||
Impairment expense |
— | 246,669 | 282,587 | ||||||||||
Total costs and expenses |
169,022 | 350,421 | 351,201 | ||||||||||
OPERATING INCOME (LOSS) |
72,982 | (253,529 | ) | (276,466 | ) | ||||||||
NON-OPERATING INCOME (EXPENSE): |
|||||||||||||
Realized and unrealized gain (loss): |
|||||||||||||
Commodity derivative financial instruments, net |
11,190 | 5,744 | 40,569 | ||||||||||
Interest rate derivatives, net |
(5,375 | ) | (3,394 | ) | (6,274 | ) | |||||||
Interest expense |
(18,482 | ) | (7,464 | ) | (4,410 | ) | |||||||
Interest income |
150 | 223 | 781 | ||||||||||
Loss on disposal of assets |
(30 | ) | (85 | ) | (2 | ) | |||||||
Other |
1 | 4 | 38 | ||||||||||
Non-operating income (expense), net |
(12,546 | ) | (4,972 | ) | 30,702 | ||||||||
Income (loss) before income taxes |
60,436 | (258,501 | ) | (245,764 | ) | ||||||||
INCOME TAX (EXPENSE) BENEFIT: |
|||||||||||||
Current |
— | — | (12 | ) | |||||||||
Deferred |
25,812 | 74,006 | 53,729 | ||||||||||
Total income tax benefit, net |
25,812 | 74,006 | 53,717 | ||||||||||
NET INCOME (LOSS) |
$ | 86,248 | $ | (184,495 | ) | $ | (192,047 | ) | |||||
The accompanying notes are an integral part of these combined financial statements.
F-47
Laredo Petroleum
Combined statement of owners' equity
For the years ended December 31, 2010, 2009 and 2008
(in thousands)
| |
Broad Oak | Laredo | |
|
|||||||||||||||||||||||||||||||||||||
|---|---|---|---|---|---|---|---|---|---|---|---|---|---|---|---|---|---|---|---|---|---|---|---|---|---|---|---|---|---|---|---|---|---|---|---|---|---|---|---|---|---|
| |
Common Stock | Preferred Stock | Treasury Stock (at cost) |
Additional paid-in capital |
Series A | Restricted Units | Treasury Units (at cost) |
|
|
||||||||||||||||||||||||||||||||
| |
Accumulated deficit |
|
|||||||||||||||||||||||||||||||||||||||
| |
Shares |
Amount |
Shares |
Amount |
Units |
Amount |
Units |
Amount |
Total |
||||||||||||||||||||||||||||||||
BALANCE, December 31, 2007 |
186 | $ | — | 500 | $ | 1 | $ | — | $ | 47,600 | 14,000 | $ | 70,000 | 7,236 | $ | — | $ | $ | (7,894 | ) | $ | 109,707 | |||||||||||||||||||
Issuance of Series A units and stock |
— | — | 700 | 1 | — | 69,019 | 62,000 | 329,820 | — | — | — | — | 398,840 | ||||||||||||||||||||||||||||
Equity-based compensation |
— | — | — | — | — | — | — | — | 9,318 | 1,864 | — | — | 1,864 | ||||||||||||||||||||||||||||
Cancellation of restricted units |
— | — | — | — | — | — | — | — | (17 | ) | — | — | — | — | |||||||||||||||||||||||||||
Net loss |
— | — | — | — | — | — | — | — | — | — | — | (192,047 | ) | (192,047 | ) | ||||||||||||||||||||||||||
BALANCE, December 31, 2008 |
186 | — | 1,200 | 2 | — | 116,619 | 76,000 | 399,820 | 16,537 | 1,864 | — | (199,941 | ) | 318,364 | |||||||||||||||||||||||||||
Issuance of Series A units and stock |
63 | — | 300 | — | — | 29,581 | 20,000 | 125,000 | — | — | — | — | 154,581 | ||||||||||||||||||||||||||||
Purchase of units and stock |
— | — | — | — | (632 | ) | — | — | — | — | — | (300 | ) | — | (932 | ) | |||||||||||||||||||||||||
Cancellation of Series A Units |
— | — | — | — | — | — | (48 | ) | (120 | ) | — | — | 300 | — | 180 | ||||||||||||||||||||||||||
Equity-based compensation |
— | — | — | — | — | — | — | — | 10,694 | 1,419 | — | — | 1,419 | ||||||||||||||||||||||||||||
Purchase of restricted units |
— | — | — | — | — | — | — | — | — | — | (10 | ) | — | (10 | ) | ||||||||||||||||||||||||||
Cancellation of restricted units |
— | — | — | — | — | — | — | — | (272 | ) | (10 | ) | 10 | — | — | ||||||||||||||||||||||||||
Net loss |
— | — | — | — | — | — | — | — | — | — | — | (184,495 | ) | (184,495 | ) | ||||||||||||||||||||||||||
BALANCE, December 31, 2009 |
249 | — | 1,500 | 2 | (632 | ) | 146,200 | 95,952 | 524,700 | 26,959 | 3,273 | — | (384,436 | ) | 289,107 | ||||||||||||||||||||||||||
Issuance of Series A units and stock |
— | — | 100 | — | — | 10,000 | 4,000 | 25,000 | — | — | — | — | 35,000 | ||||||||||||||||||||||||||||
Purchase of units and stock |
— | — | — | — | — | — | — | — | — | — | (513 | ) | — | (513 | ) | ||||||||||||||||||||||||||
Cancellation of Series A Units |
— | — | — | — | — | — | (82 | ) | (513 | ) | — | — | 513 | — | — | ||||||||||||||||||||||||||
Reissuance of treasury stock as restricted stock |
— | — | — | — | 128 | (128 | ) | — | — | — | — | — | — | — | |||||||||||||||||||||||||||
Equity-based compensation |
— | — | — | — | — | 26 | — | — | 6,286 | 1,231 | — | — | 1,257 | ||||||||||||||||||||||||||||
Cancellation of restricted units |
— | — | — | — | — | — | — | — | (1,813 | ) | — | — | — | — | |||||||||||||||||||||||||||
Net income |
— | — | — | — | — | — | — | — | — | — | — | 86,248 | 86,248 | ||||||||||||||||||||||||||||
BALANCE, December 31, 2010 |
249 | $ | — | 1,600 | $ | 2 | $ | (504 | ) | $ | 156,098 | 99,870 | $ | 549,187 | 31,432 | $ | 4,504 | $ | — | $ | (298,188 | ) | $ | 411,099 | |||||||||||||||||
The accompanying notes are an integral part of these combined financial statements.
F-48
Laredo Petroleum
Combined statements of cash flows
For the years ended December 31, 2010, 2009 and 2008
(in thousands)
| |
2010 |
2009 |
2008 |
|||||||||||
|---|---|---|---|---|---|---|---|---|---|---|---|---|---|---|
CASH FLOWS FROM OPERATING ACTIVITIES: |
||||||||||||||
Net income (loss) |
$ | 86,248 | $ | (184,495 | ) | $ | (192,047 | ) | ||||||
Adjustments to reconcile net income (loss) to net cash provided by operating activities: |
||||||||||||||
Deferred income tax benefit |
(25,812 | ) | (74,006 | ) | (53,729 | ) | ||||||||
Depreciation, depletion and amortization |
97,411 | 58,005 | 33,102 | |||||||||||
Impairment expense |
— | 246,669 | 282,587 | |||||||||||
Non-cash equity-based compensation |
1,257 | 1,419 | 1,864 | |||||||||||
Accretion of asset retirement obligations |
475 | 406 | 170 | |||||||||||
Unrealized (gain) loss on derivative financial instruments, net |
11,648 | 46,003 | (27,174 | ) | ||||||||||
Premiums paid for derivative financial instruments |
(5,397 | ) | (6,283 | ) | (10,068 | ) | ||||||||
Amortization of premiums paid for derivative financial instruments |
155 | — | — | |||||||||||
Other non-cash compensation |
— | — | 100 | |||||||||||
Bad debt expense |
— | 91 | — | |||||||||||
Amortization of deferred loan costs |
2,132 | 546 | 120 | |||||||||||
Amortization of other assets |
19 | 9 | 3 | |||||||||||
Loss on disposal of assets |
30 | 85 | 2 | |||||||||||
Changes in assets and liabilities: |
||||||||||||||
Change in accounts receivable |
(23,299 | ) | 22,062 | (38,925 | ) | |||||||||
Change in materials and supplies |
(4,143 | ) | 2,887 | (5,574 | ) | |||||||||
Change in prepaid expenses |
1,812 | 3,303 | (6,370 | ) | ||||||||||
Change in other assets |
— | (98 | ) | (19 | ) | |||||||||
Change in accounts payable |
5,711 | (6,753 | ) | 27,353 | ||||||||||
Change in undistributed revenue and royalties |
735 | 1,905 | 6,540 | |||||||||||
Change in accrued compensation and benefits |
5,621 | (3,188 | ) | 4,359 | ||||||||||
Change in other accrued liabilities |
2,457 | 3,781 | 2,899 | |||||||||||
Change in deferred lease liability |
(17 | ) | 321 | 139 | ||||||||||
Net cash provided by operating activities |
157,043 | 112,669 | 25,332 | |||||||||||
CASH FLOWS FROM INVESTING ACTIVITIES: |
||||||||||||||
Acquisition of oil and gas properties |
— | — | (179,141 | ) | ||||||||||
Restricted cash |
— | 2,201 | (2,201 | ) | ||||||||||
Capital expenditures: |
||||||||||||||
Oil and gas properties |
(454,161 | ) | (340,636 | ) | (288,555 | ) | ||||||||
Pipeline and gathering assets |
(4,277 | ) | (19,995 | ) | (17,548 | ) | ||||||||
Other fixed assets |
(2,198 | ) | (3,071 | ) | (3,474 | ) | ||||||||
Proceeds from other fixed asset disposals |
89 | 168 | 22 | |||||||||||
Net cash used in investing activities |
(460,547 | ) | (361,333 | ) | (490,897 | ) | ||||||||
CASH FLOWS FROM FINANCING ACTIVITIES: |
||||||||||||||
Borrowings on revolving credit facilities |
250,300 | 114,400 | 104,100 | |||||||||||
Payments on revolving credit facilities |
(105,800 | ) | (15,900 | ) | — | |||||||||
Borrowings on term loan |
100,000 | — | — | |||||||||||
Proceeds from issuance of preferred stock, net |
10,000 | 29,580 | 69,079 | |||||||||||
Purchase of stock and units, net |
(513 | ) | (762 | ) | — | |||||||||
Capital contributions |
75,000 | 125,000 | 299,720 | |||||||||||
Payments for loan costs |
(9,235 | ) | (2,179 | ) | (759 | ) | ||||||||
Net cash provided by financing activities |
319,752 | 250,139 | 472,140 | |||||||||||
NET INCREASE IN CASH AND CASH EQUIVALENTS |
16,248 | 1,475 | 6,575 | |||||||||||
CASH AND CASH EQUIVALENTS, beginning of year |
14,987 | 13,512 | 6,937 | |||||||||||
CASH AND CASH EQUIVALENTS, end of year |
$ | 31,235 | $ | 14,987 | $ | 13,512 | ||||||||
NON-CASH FINANCING ACTIVITIES: |
||||||||||||||
Capital contributions receivable |
$ | — | $ | 50,000 | $ | 50,000 | ||||||||
SUPPLEMENTAL DISCLOSURE OF CASH FLOW INFORMATION: |
||||||||||||||
Cash paid during the period: |
||||||||||||||
Interest |
$ | 15,223 | $ | 7,096 | $ | 3,828 | ||||||||
The accompanying notes are an integral part of these combined financial statements.
F-49
Laredo Petroleum
Notes to the combined financial statements
December 31, 2010, 2009 and 2008
A—Organization
Laredo Petroleum, Inc. ("Laredo"), a Delaware corporation, was incorporated on October 10, 2006, for the purpose of acquiring, developing and operating oil and gas producing properties on its behalf and on the behalf of others. On October 20, 2006, Laredo entered into a consulting agreement with Warburg Pincus Private Equity IX, L.P. ("Warburg Pincus IX") under which Laredo, as an independent contractor, agreed to pursue and develop acquisition and investment opportunities in the oil and gas industry for the benefit of Warburg Pincus IX and certain of its affiliates, all formed by and under common control of Warburg Pincus LLC (collectively, the "Warburg Pincus Partnerships").
Laredo Petroleum Texas, LLC ("Laredo Texas"), a Texas limited liability company, was formed in 2007 and is a wholly-owned subsidiary of Laredo. Laredo Texas was formed to acquire ownership interest in certain oil and gas properties primarily in Hansford, Hutchinson, Roberts and Ochiltree Counties, Texas.
Laredo Gas Services, LLC ("Laredo Gas"), a Delaware limited liability company, was formed in 2007 and is a wholly-owned subsidiary of Laredo. Laredo Gas was formed to own and operate gathering and marketing assets and related facilities for Laredo and Laredo Texas.
In May 2007, certain investors of the Warburg Pincus Partnerships and Laredo management contributed their common stock in Laredo to Laredo Petroleum, LLC ("Laredo LLC"), a Delaware limited liability company, and Laredo became a wholly-owned subsidiary of Laredo LLC. The consulting agreement between Laredo and Warburg Pincus IX was consequently terminated. Laredo LLC is focused on the exploration, development and acquisition of oil and natural gas in the Mid-Continent and Permian regions of the United States.
In these notes, the "Company" refers to Laredo LLC, Laredo, Laredo Texas and Laredo Gas, collectively.
Broad Oak Energy, Inc. ("Broad Oak"), a Delaware corporation, was formed on May 11, 2006, and was engaged in the acquisition, exploration, development and production of oil and natural gas in the southwestern United States. Immediately upon formation, Broad Oak entered into a stock purchase agreement with Warburg Pincus IX and Broad Oak management.
On July 1, 2011, Laredo LLC and Laredo completed the acquisition of Broad Oak, which became a wholly-owned subsidiary of Laredo. In connection with the transaction, Laredo LLC issued: (i) approximately 86.5 million preferred equity units to Warburg Pincus IX and its affiliate in exchange for the convertible preferred stock previously held in Broad Oak; and (ii) approximately 2.4 million preferred equity units to Broad Oak's management and directors in exchange for certain of the vested common stock and convertible preferred stock previously held in Broad Oak. In addition, Laredo paid approximately $82 million in cash for certain Broad Oak vested common stock, convertible preferred stock and all outstanding and vested Broad Oak options that certain Broad Oak directors, management and employees elected to sell. All
F-50
unvested shares of Broad Oak common stock and unvested Broad Oak options were cancelled. Immediately following the consummation of this transaction, Laredo LLC assigned 100% of its ownership interest in Broad Oak to Laredo as a contribution to capital (the transactions described in this paragraph collectively, the "Broad Oak Transaction"). In connection with the Broad Oak Transaction, the Broad Oak Credit Facility was paid in full and terminated on July 1, 2011.
Because the Company and Broad Oak (collectively and including Laredo, Laredo Texas and Laredo Gas, the "Combined Company" or "Laredo Petroleum") are commonly controlled by Warburg Pincus Partnerships, the Broad Oak Transaction was accounted for in a manner similar to a pooling of interests. As a result, the combined historical financial statements give retrospective effect to the Broad Oak Transaction, whereby the assets and liabilities of the Company and Broad Oak are reflected at the historical carrying values and their operations are presented as if they were combined for all periods presented.
On August 12, 2011, Laredo LLC formed a new wholly-owned subsidiary, Laredo Petroleum Holdings, Inc. ("Laredo Holdings") in anticipation of an initial public offering ("IPO"). Immediately prior to the effectiveness of the IPO, Laredo LLC will be merged into Laredo Holdings and Laredo Holdings will continue as the surviving corporation.
B—Basis of presentation and significant accounting policies
1. Basis of presentation
The accompanying combined financial statements were derived from the historical accounting records of the Combined Company and reflect the historical financial position, results of operations and cash flows for the periods described herein. All material intercompany transactions and account balances have been eliminated in the combination of accounts. The accompanying combined financial statements have been prepared in accordance with accounting principles generally accepted in the United States of America ("GAAP"). The Combined Company operates oil and natural gas properties as one business segment, which explores, develops and produces oil and natural gas.
2. Use of estimates in the preparation of combined financial statements
The preparation of the accompanying combined financial statements in conformity with GAAP requires management of the Combined Company to make estimates and assumptions about future events. These estimates and the underlying assumptions affect the reported amounts of assets and liabilities and disclosure of contingent assets and liabilities at the date of the financial statements and the reported amounts of revenues and expenses during the reporting period. Although management believes these estimates are reasonable, actual results could differ from those estimates.
Significant estimates include, but are not limited to, estimates of the Combined Company's reserves of oil and natural gas, future cash flows from oil and natural gas properties, depreciation, depletion and amortization, asset retirement obligations, equity-based compensation, deferred income taxes, and fair values of commodity and interest rate derivatives. As fair value is a market-based measurement, it is determined based on the assumptions that market participants would use. These estimates and assumptions are based on management's best judgments. Management evaluates its estimates and assumptions on an
F-51
ongoing basis using historical experience and other factors, including the current economic environment, which management believes to be reasonable under the circumstances. Such estimates and assumptions are adjusted when facts and circumstances dictate. Illiquid credit markets and volatile equity and energy markets have combined to increase the uncertainty inherent in such estimates and assumptions. As future events and their effects cannot be determined with precision, actual results could differ from these estimates. Any changes in estimates resulting from continuing changes in the economic environment will be reflected in the financial statements in future periods.
3. Cash and cash equivalents
The Combined Company maintains cash and cash equivalents in bank deposit accounts and money market funds that may not be federally insured. The Combined Company has not experienced any losses in such accounts and believes it is not exposed to any significant credit risk on such accounts. The Combined Company defines cash and cash equivalents to include cash on hand, cash in bank accounts and highly liquid investments with original maturities of thirty days or less.
4. Accounts receivable
The Combined Company sells oil and gas to various customers and participates with other parties in the drilling, completion and operation of oil and gas wells. Joint interest and oil and gas sales receivables related to these operations are generally unsecured. Accounts receivable for joint interest billings are recorded as amounts billed to customers less an allowance for doubtful accounts. Amounts are considered past due after 30 days. The Combined Company determines joint interest operations accounts receivable allowances based on management's assessment of the creditworthiness of the joint interest owners and the Combined Company's ability to realize the receivables through netting of anticipated future production revenues. The Combined Company maintains an allowance for doubtful accounts for estimated losses inherent in its accounts receivable portfolio. In establishing the required allowance, management considers historical losses, current receivables aging, and existing industry and national economic data. The Combined Company reviews its allowance for doubtful accounts quarterly. Past due balances over 90 days and over a specified amount are reviewed individually for collectability. Account balances are charged off against the allowance after all means of collection have been exhausted and the potential for recovery is remote. Accounts receivable for joint operations are presented net of an allowance for doubtful accounts of approximately $0.1 million at December 31, 2010 and 2009, respectively.
5. Materials and supplies
Materials and supplies are comprised of equipment used in developing oil and gas properties. They are carried at the lower of cost or market using the average cost method. On a regular basis, the Combined Company reviews materials and supplies quantities on hand and records a provision for excess or obsolete materials and supplies, if necessary.
At December 31, 2009, the Combined Company reduced materials and supplies by approximately $0.8 million in order to reflect the balance at the lower of cost or market. Although management believes it has established adequate allowances, it is possible that additional losses on materials and supplies could occur in future periods. The Combined
F-52
Company determined a lower of cost or market adjustment was not necessary for materials and supplies at December 31, 2010.
6. Derivative financial instruments
The Combined Company uses derivative financial instruments to reduce exposure to fluctuations in the prices of oil and natural gas. By removing a significant portion of the price volatility associated with future production, the Combined Company expects to mitigate, but not eliminate, the potential effects of variability in cash flows from operations due to fluctuations in commodity prices. These transactions are primarily in the form of swaps, basis swaps, puts and collars. In addition, the Combined Company enters into derivative contracts in the form of interest rate derivatives to minimize the effects of fluctuations in interest rates.
Derivative instruments are recorded at fair value and are included on the combined balance sheets as assets or liabilities. The Combined Company netted the fair value of derivative instruments by counterparty in the accompanying combined balance sheets where the right of offset exists. The Combined Company determines the fair value of its derivative financial instruments utilizing pricing models for significantly similar instruments. Inputs to the pricing models include publicly available prices and forward price curves generated from a compilation of data gathered from third parties.
The Combined Company's derivatives at December 31, 2010, 2009 or 2008 were not designated as hedges for financial statement purposes. Realized and unrealized gains and losses on derivatives are included in cash flows from operating activities (see Note H).
7. Oil and natural gas properties
The Combined Company uses the full cost method of accounting for its oil and gas properties. Under this method, all acquisition, exploration and development costs, including certain related employee costs, incurred for the purpose of finding oil and gas are capitalized and amortized on a composite units of production method based on proved oil and natural gas reserves. Such amounts include the cost of drilling and equipping productive wells, dry hole costs, lease acquisition costs, delay rentals and other costs related to such activities. Costs, including related employee costs, associated with production and general corporate activities are expensed in the period incurred. Sales of oil and gas properties, whether or not being amortized currently, are accounted for as adjustments of capitalized costs, with no gain or loss recognized, unless such adjustments would significantly alter the relationship between capitalized costs and proved reserves of oil and gas.
The Combined Company computes the provision for depletion of oil and gas properties using the units of production method based upon production and estimates of proved reserve quantities. Unevaluated costs and related carrying costs are excluded from the amortization base until the properties associated with these costs are evaluated. Approximately $96.5 million and $92.8 million of such costs were excluded from the amortization base at December 31, 2010 and 2009, respectively. The amortization base includes estimated future development costs and dismantlement, restoration and abandonment costs, net of estimated salvage values. Total accumulated depletion for oil and gas properties was $713.1 million and $620.5 million for the years ended December 31, 2010 and 2009, respectively. Depletion expense for oil and gas properties was $93.8 million, $55.4 million, and $31.9 million for the years ended December 31, 2010, 2009 and 2008, respectively. Impairment expense net of abandoned and
F-53
plugged oil and gas properties was $245.9 million and $282.6 million for the years ended December 31, 2009 and 2008, respectively. There was no impairment recorded for year ended December 31, 2010. Depletion per barrel of oil equivalent for the Combined Company's oil and gas properties was $18.36, $16.56 and $20.69 for the years ended December 31, 2010, 2009 and 2008, respectively.
The Combined Company excludes the costs directly associated with acquisition and evaluation of unproved properties from the depletion calculation until it is determined whether or not proved reserves can be assigned to the properties. These properties are assessed at least quarterly to ascertain whether impairment has occurred. Such costs are transferred into the amortization base on an ongoing basis as projects are evaluated and proved reserves established or impairment is determined.
The Combined Company assesses all items classified as unevaluated property on a quarterly basis for possible impairment or reduction in value. The assessment includes consideration of the following factors, among others: intent to drill, remaining lease term, geological and geophysical evaluations, drilling results and activity, the assignment of proved reserves, and the economic viability of development if proved reserves are assigned. During any period in which these factors indicate an impairment, the cumulative drilling costs incurred to date for such property and all or a portion of the associated leasehold costs are transferred to the full cost pool and are then subject to amortization.
The full cost ceiling is based principally on the estimated future net cash flows from oil and natural gas properties discounted at 10%. Full cost companies are required to use the unweighted arithmetic average first-day-of-the-month price for each month within the 12-month period prior to the end of the reporting period, unless prices were defined by contractual arrangements, to calculate the discounted future revenues. Prior to December 31, 2009, the price was based on the single-day, period end price. In the event the unamortized cost of oil and natural gas properties being amortized exceeds the full cost ceiling, as defined by the Securities and Exchange Commission ("SEC"), the excess is charged to expense in the period during which such excess occurs. Once incurred, a write-down of oil and natural gas properties is not reversible.
At December 31, 2010, the full cost ceiling value of the Combined Company's reserves was calculated based on the unweighted arithmetic average first-day-of-the-month price for the 12-months ended December 31, 2010 of $4.15 per MMBtu for natural gas, adjusted by area for energy content, transportation fees, and regional price differentials by area, and the unweighted arithmetic average first-day-of-the-month price for the 12-months ended December 31, 2010 of $75.96 per barrel for oil, adjusted by area for energy content, transportation fees, and regional price differentials by area. Using these prices, the Combined Company's net book value of oil and natural gas properties did not exceed the full cost ceiling amount at December 31, 2010. Changes in production rates, levels of reserves, future development costs, and other factors will determine the Combined Company's actual full cost ceiling test calculation and impairment analyses in future periods.
At December 31, 2009, the full cost ceiling value of the Combined Company's reserves was calculated based on the unweighted arithmetic average first-day-of-the-month price for each month within the 12-month period ended December 31, 2009 price of $3.15 per MMBtu for natural gas, adjusted by lease for energy content, transportation fees, and regional price
F-54
differentials, on the unweighted arithmetic average first-day-of-the-month price for each month within the 12-month period ended December 31, 2009 price of $57.04 per barrel for oil, adjusted by lease for quality, transportation fees, and regional price differentials. Using these prices, the Combined Company's net book value of oil and natural gas properties at December 31, 2009, exceeded the full cost ceiling amount. As a result, the Combined Company recorded a non-cash full cost ceiling impairment of $245.9 million before income taxes and $159.8 million after taxes.
At December 31, 2008, the full cost ceiling value of the Combined Company's reserves was calculated based on the December 31, 2008 price of $4.68 per MMBtu for natural gas, adjusted by lease for energy content, transportation fees, and regional price differentials, and the posted price of $44.60 per barrel for oil, adjusted by area for quality, transportation fees, and regional price differentials. Using these prices, the Combined Company's net book value of oil and natural gas properties at December 31, 2008 exceeded the full cost ceiling amount. As a result, the Combined Company recorded a non-cash full cost ceiling impairment of $282.6 million before taxes and $183.7 million after taxes.
8. Pipeline and gas gathering assets
Pipeline and gas gathering assets are recorded at cost, net of accumulated depreciation and amortization ("DD&A"), and consist of gathering assets and related equipment. Depreciation of assets is provided using the shorter of the lease term or the straight-line method based on estimated useful lives of twenty years, as applicable. Expenditures for major renewals or betterments, which extend the useful lives of existing fixed assets, are capitalized and depreciated. Upon retirement or disposition, the cost and related accumulated depreciation and amortization are removed from the accounts and any gain or loss is recognized in other income in the combined statements of operations. DD&A expense for pipeline and gathering assets was $2.0 million, $1.5 million, and $0.5 million for the years ended December 31, 2010, 2009 and 2008, respectively. Pipeline and gathering assets consist of the following as of December 31:
| (in thousands) |
2010 |
2009 |
||||||
|---|---|---|---|---|---|---|---|---|
Pipeline and gas gathering assets |
$ | 43,271 | $ | 38,166 | ||||
Less accumulated depreciation and amortization |
3,928 | 1,946 | ||||||
Total, net |
$ | 39,343 | $ | 36,220 | ||||
9. Other fixed assets
Other fixed assets are recorded at cost net of accumulated depreciation and amortization and consist of furniture and fixtures, vehicles, leasehold improvements and computer hardware and software. Depreciation of other fixed assets is provided using the shorter of the lease term or the straight-line method based on estimated useful lives of three to ten years, as applicable. Leasehold improvements are capitalized and amortized over the shorter of the estimated useful lives of the assets or the terms of the related leases. Expenditures for major renewals or betterments, which extend the useful lives of existing fixed assets, are capitalized and depreciated. Upon retirement or disposition, the cost and related accumulated depreciation and amortization are removed from the accounts and any gain or loss is recognized in other income in the combined statements of operations. DD&A expense for other fixed assets was
F-55
$1.6 million, $1.1 million, and $0.6 million for the years ended December 31, 2010, 2009 and 2008.
Other property and equipment fixed assets consist of the following as of December 31:
| (in thousands) |
2010 |
2009 |
||||||
|---|---|---|---|---|---|---|---|---|
Computer hardware and software |
$ | 4,553 | $ | 3,430 | ||||
Leasehold improvements |
1,781 | 1,692 | ||||||
Drilling service assets |
1,839 | 1,425 | ||||||
Vehicles |
971 | 708 | ||||||
Furniture and fixtures |
673 | 586 | ||||||
Production equipment |
219 | 163 | ||||||
Other |
833 | 503 | ||||||
|
10,869 | 8,507 | ||||||
Less accumulated depreciation and amortization |
3,601 | 2,043 | ||||||
Total, net |
$ | 7,268 | $ | 6,464 | ||||
10. Environmental
The Combined Company is subject to extensive federal, state and local environmental laws and regulations. These laws, which are often changing, regulate the discharge of materials into the environment and may require the Combined Company to remove or mitigate the environmental effects of the disposal or release of petroleum or chemical substances at various sites. Environmental expenditures are expensed. Expenditures that relate to an existing condition caused by past operations and that have no future economic benefits are expensed. Liabilities for expenditures of a non-capital nature are recorded when environmental assessment or remediation is probable and the costs can be reasonably estimated. Such liabilities are generally undiscounted unless the timing of cash payments is fixed and readily determinable. Management believes no materially significant liabilities of this nature existed at December 31, 2010 or 2009.
11. Deferred loan costs
Loan origination fees are stated at cost, net of amortization, which are amortized over the life of the respective debt agreements on a basis that represents the effective interest method. The Combined Company capitalized $10.1 million and $2.2 million of deferred loan costs in 2010 and 2009, respectively. The Combined Company had total deferred loan costs of $10.4 million and $2.4 million, net of accumulated amortization of $2.8 million and $0.7 million, as of December 31, 2010 and 2009, respectively.
Subsequent to December 31, 2010, Laredo completed an offering of $350 million 91/2% Senior Notes due 2019 ("2019 Notes"). Of the $10.1 million capitalized during 2010, $0.9 million related to fees incurred in conjunction with the 2019 Notes offering. See Note O for additional discussion of the 2019 Notes offering.
F-56
Future amortization expense of deferred loan costs at December 31, 2010 is as follows:
| (in thousands) |
|
|||
|---|---|---|---|---|
2011 |
$ | 3,186 | ||
2012 |
3,186 | |||
2013 |
2,176 | |||
2014 |
1,368 | |||
2015 |
109 | |||
Thereafter |
328 | |||
Total |
$ | 10,353 | ||
12. Asset retirement obligations
Asset retirement obligations associated with the retirement of tangible long-lived assets, are recognized as a liability in the period in which they are incurred and become determinable. The associated asset retirement costs are part of the carrying amount of the long-lived asset. Subsequently, the asset retirement cost included in the carrying amount of the related long-lived asset is charged to expense through the depletion of the asset. Changes in the liability due to the passage of time are recognized as an increase in the carrying amount of the liability and as corresponding accretion expense. See Note I for fair value disclosures related to the Combined Company's asset retirement obligation.
The Combined Company is obligated by contractual and regulatory requirements to remove certain pipeline and gas gathering assets and perform other remediation of the sites where such pipeline and gas gathering assets are located upon the retirement of those assets. However, the fair value of the asset retirement obligation cannot currently be reasonably estimated because the settlement dates are indeterminate. The Combined Company will record an asset retirement obligation for pipeline and gas gathering assets in the periods in which settlement dates are reasonably determinable.
The following reconciles the Combined Company's asset retirement obligations liability as of December 31:
| (in thousands) |
2010 |
2009 |
|||||
|---|---|---|---|---|---|---|---|
Liability at beginning of year |
$ | 5,845 | $ | 3,829 | |||
Liabilities added due to acquisitions, drilling, and other |
1,291 | 1,401 | |||||
Liabilities removed due to sale of wells |
(34 | ) | (312 | ) | |||
Accretion expense |
475 | 406 | |||||
Liabilities settled upon plugging and abandonment |
(1,250 | ) | (156 | ) | |||
Revision of estimates |
1,951 | 677 | |||||
Liability at end of year |
$ | 8,278 | $ | 5,845 | |||
13. Fair value measurements
The carrying amounts reported in the Combined Balance Sheet for cash and cash equivalents, accounts receivable, prepaid expenses, accounts payable, undistributed revenue and royalties, and other accrued liabilities approximate their fair values. See Note D for fair value disclosures related to the Combined Company's debt obligations. The Combined Company carries its
F-57
derivative financial instruments at fair value. See Note H and Note I for details about the fair value of the Combined Company's derivative financial instruments.
14. Treasury stock
The Combined Company accounts for treasury stock at cost. See Note E for discussion of the Combined Company's treasury stock transactions.
15. Revenue recognition
Oil and gas revenues are recorded using the sales method. Under this method, the Combined Company recognizes revenues based on actual volumes of oil and gas sold to purchasers. The Combined Company and other joint interest owners may sell more or less than their entitlement share of the volumes produced. Under the sales method, when a working interest owner has overproduced in excess of its share of remaining estimated reserves, the overproduced party recognizes the excessive gas imbalance as a liability. If the underproduced working interest owner determines that an overproduced partner's share of remaining net reserves is insufficient to settle the imbalance, the underproduced owner recognizes a receivable, net of any allowance from the overproduced working interest owner.
The following tables reflect the Combined Company's natural gas imbalance positions as of December 31:
| (dollars in thousands) |
2010 |
2009 |
|||||
|---|---|---|---|---|---|---|---|
Natural gas imbalance current receivable (included in "Accounts receivable—Oil and gas sales") |
$ | 174 | $ | 172 | |||
Underproduced positions (Mcf) |
43,720 | 44,557 | |||||
Natural gas imbalance current liability (included in "Other accrued liabilities") |
$ |
15 |
$ |
24 |
|||
Overproduced positions (Mcf) |
3,839 | 6,145 | |||||
Natural gas imbalance long-term liability |
$ |
1,093 |
$ |
1,108 |
|||
Overproduced positions (Mcf) |
275,201 | 286,504 | |||||
| |
Twelve months ended December 31 |
||||||
|---|---|---|---|---|---|---|---|
| (dollars in thousands) |
2010 |
2009 |
|||||
Value of net underproduced (overproduced) positions arising during the period increasing oil and gas sales |
$ | 25 | $ | (311 | ) | ||
Net overproduced positions arising during the period (Mcf) |
(12,772 | ) | 63,229 | ||||
16. General and administrative expense
The Combined Company receives fees for the operation of jointly owned oil and gas properties and records such reimbursements as a reduction of general and administrative expenses. Such fees totaled approximately $1.5 million, $1.3 million and $0.5 million for the years ended December 31, 2010, 2009 and 2008, respectively.
F-58
17. Equity-based awards
The Combined Company recognizes equity-based awards as a charge against earnings over the requisite service period, in an amount equal to the fair value of equity-based awards granted to employees and directors. The fair value of the equity-based awards is computed at the date of grant. Refer to Note F for further information regarding the Combined Company's equity-based awards.
18. Income taxes
Income taxes in these financial statements are generally presented on an "as combined" basis. However, in light of the historic ownership structure of the combined entities, U.S. tax laws do not allow tax losses of one entity to offset income and losses of another entity until after the Broad Oak Transaction on July 1, 2011. As such, the financial accounting for the income tax consequences of each combined company is calculated separately in these combined financial statements.
Laredo LLC is a limited liability company treated as a partnership for federal and state income tax purposes. The taxable income of Laredo LLC is passed through to its members. As such, no recognition of federal or state income taxes for Laredo LLC has been provided for in the accompanying combined financial statements. Laredo LLC's subsidiaries and Broad Oak are separate taxable corporations and these corporations along with subsidiaries that are organized as limited liability companies, are subject to federal and state corporate income taxes. These income taxes are accounted for under the asset and liability method. Deferred tax assets and liabilities are recognized for the future tax consequences attributable to differences between the financial statement carrying amounts of existing assets and liabilities and their respective tax bases and operating losses and tax credit carry-forwards. Under this method, deferred tax assets and liabilities are measured using enacted tax rates expected to apply to taxable income in the years in which those temporary differences are expected to be recovered or settled. The effect on deferred tax assets and liabilities of a change in tax rates is recognized in income in the period that includes the enactment date. On a quarterly basis, management evaluates the need for and adequacy of valuation allowances based on the expected realizability of the deferred tax assets and adjusts the amount of such allowances, if necessary. Additionally, the Combined Company has not recorded any reserves for uncertain tax positions. See Note G for detail of amounts recorded in the combined financial statements.
19. Impairment of long-lived assets
Impairment losses are recorded on property and equipment used in operations and other long-lived assets when indicators of impairment are present and the undiscounted cash flows estimated to be generated by those assets are less than the assets' carrying amount. Impairment is measured based on the excess of the carrying amount over the fair value of the asset. See Note B.5 for disclosure of the 2009 write-down of materials and supplies and Note B.7 for disclosure of the 2009 and 2008 non-cash full cost ceiling impairment. Other than the aforementioned write-downs, for the years ended December 31, 2010, 2009 and 2008, the Combined Company did not record any additional impairment to property and equipment used in operations or other long-lived assets.
F-59
C—Acquisitions
The Combined Company makes various assumptions in estimating the fair values of assets acquired and liabilities assumed. As fair value is a market-based measurement, it is determined based on the assumptions that market participants would use. The most significant assumptions relate to the estimated fair values of proved and unproved oil and natural gas properties. The fair values of these properties are measured using valuation techniques that convert future cash flows to a single discounted amount. Significant inputs to the valuation include estimates of: (i) reserves; (ii) future operating and development costs; (iii) future commodity prices; and (iv) a market-based weighted average cost of capital rate. The market-based weighted average cost of capital rate is subjected to additional project-specific risk factors. To compensate for the inherent risk of estimating and valuing unproved properties, the discounted future net revenues of probable and possible reserves are reduced by additional risk-weighting factors. In addition, when appropriate, the Combined Company reviews comparable purchases and sales of oil and natural gas properties within the same regions, and uses that data as a proxy for fair market value (i.e., the amount a willing buyer and seller would agree to in exchange for such properties).
Any excess of the acquisition price over the estimated fair value of net assets acquired is recorded as goodwill while any excess of the estimated fair value of net assets acquired over the acquisition process is recorded in current earnings as a gain. Deferred taxes are recorded for any differences between the assigned values and the tax basis of assets and liabilities. Estimated deferred taxes are based on available information concerning the tax basis of assets acquired and liabilities assumed and loss carry-forwards at the acquisition date, although such estimates may change in the future as additional information becomes known.
On May 30, 2008, Laredo LLC, through its wholly-owned subsidiary Laredo, entered into two purchase and sale agreements with Linn Energy Holdings, LLC, Linn Operating, Inc., Mid-Continent I, LLC, Mid-Continent II, LLC, and Linn Exploration Midcontinent, LLC to acquire ownership interests in oil and gas properties located in the Verden area in Caddo, Grady and Comanche Counties, Oklahoma, for a total purchase price of $185 million, subject to customary purchase price adjustments. The first purchase and sale agreement had an effective date of July 1, 2008, and closed on August 15, 2008 and represented all but one of the acquired properties. The second purchase and sale agreement pertained to the remaining property and had an effective date of July 1, 2008 and closed on August 7, 2008. The second purchase and sale agreement enabled Laredo to take over drilling operations on this particular well on an earlier date. The properties (the "Assets") acquired include interests in the Verden field and other productive fields and were comprised of producing wells and units with approximately 38,000 net undeveloped acres. The Company began operating the Assets in August 2008.
On August 1, 2008, Laredo entered into an agreement with a counterparty to acquire 87.5% ownership interest in oil and gas leases and mineral leases in Glasscock County, Texas, for $1.6 million, subject to certain adjustments. The interest obtained relates to approximately 4,000 net mineral acres. Laredo agreed to jointly explore and operate the oil and gas leases with the counterparty.
Effective September 1, 2008, Laredo entered into an agreement with a counterparty to acquire additional ownership interest in certain oil and gas property leases in the Verden area in
F-60
Caddo, Grady and Comanche Counties, Oklahoma, for a purchase price of $2.3 million, subject to certain adjustments. The sale closed on November 3, 2008.
Effective December 1, 2008, Laredo entered into a purchase and sale agreement with a counterparty to acquire ownership interests in oil and gas properties located in Roger Mills County, Oklahoma, for a purchase price of $1.2 million, subject to certain adjustments.
D—Debt
Laredo
1. Credit facility
At December 31, 2010, Laredo had a $500.0 million revolving Senior Secured Credit Facility under its Second Amended and Restated Credit Agreement (the "Laredo Senior Secured Credit Facility"), dated July 7, 2010, between Laredo and certain financial institutions. As of December 31, 2010, the borrowing base under this facility was $220.0 million with an outstanding balance of $177.5 million. As of December 31, 2009, the borrowing base under this facility was $205.0 million with an outstanding balance of $202.5 million. The borrowing base is subject to a semi-annual redetermination based on the financial institutions' evaluation of Laredo's oil and gas reserves. The Laredo Senior Secured Credit Facility was available to Laredo until July 2014, at which time the outstanding balance will be due. As defined in the Laredo Senior Secured Credit Facility, the Adjusted Base Rate Advances and Eurodollar Advances under the facilities bear interest payable quarterly at an Adjusted Base Rate or Adjusted London Interbank Offered Rate ("LIBOR") plus an applicable margin based on the ratio of outstanding revolving credit to the conforming borrowing base. At December 31, 2010, the applicable margin rates were 2.25% for the adjusted base rate advances and 3.25% for the Eurodollar advances. The amount of the Laredo Senior Secured Credit Facility outstanding at December 31, 2010 was subject to an average interest rate of approximately 3.56%. Laredo is also required to pay an annual commitment fee on the unused portion of the bank's commitment of 0.5%.
The Laredo Senior Secured Credit Facility is secured by a first priority lien on Laredo's assets and stock, including oil and gas properties, constituting at least 80% of the present value of Laredo's proved reserves. Further, Laredo is subject to various financial and non-financial ratios at the Laredo LLC level on a consolidated basis, including a current ratio at the end of each calendar quarter, of not less than 1.00 to 1.00. As defined by the Laredo Senior Secured Credit Facility, the current ratio represents the ratio of current assets to current liabilities, inclusive of available capacity and exclusive of current balances associated with derivative positions. Additionally, at the end of each calendar quarter, Laredo LLC must maintain a ratio of its consolidated net income (a) plus each of the following: (i) any provision for (or less any benefit from) income or franchise taxes; (ii) consolidated net interest expense; (iii) depreciation, depletion and amortization expense; (iv) exploration expenses; and (v) other noncash charges, and (b) minus all non-cash income ("EBITDAX"), as defined in the Laredo Senior Secured Credit Facility, to the sum of net interest expense plus letter of credit fees of not less than 2.50 to 1.00, in each case for the four quarters then ending. Laredo LLC is also required to maintain at the end of each quarter, a total debt to consolidated EBITDAX ratio of not more than 4.00 to 1.00, in each case for the four quarters then ending, and a total estimated future revenues of proved reserves discounted by 10% ("PV-10") ratio as defined in the agreement, to total debt of not less than 1.50 to 1.00. At September 30, 2009, Laredo was in violation of its current ratio
F-61
covenant. This violation was waived in an amendment to the Laredo Senior Secured Credit Facility dated November 5, 2009. The Laredo Credit Facility contains both financial and non-financial covenants and Laredo was in compliance with these covenants at December 31, 2010 and December 31, 2009.
Additionally, the Laredo Senior Secured Credit Facility provides for the issuance of letters of credit, limited to the total capacity. At December 31, 2010, Laredo had one letter of credit outstanding totaling $0.03 million under the Laredo Senior Secured Credit Facility.
Subsequent to December 31, 2010, Laredo re-paid the Laredo Senior Secured Credit Facility in full using a portion of the proceeds from the issuance of its 2019 Notes. See Note O for additional discussion of the 2019 Notes and the subsequent amendments to the issuance of the Laredo Senior Secured Credit Facility.
2. Term loan
In addition to its Laredo Senior Secured Credit Facility, Laredo added a term loan under its Second Lien Term Loan Agreement (the "Term Loan"), dated July 7, 2010, between Laredo and certain financial institutions. At December 31, 2010, $100.0 million was outstanding under the Term Loan. Laredo used these funds to pay down its Laredo Senior Secured Credit Facility in July 2010. The Term Loan was due January 7, 2015, and at Laredo's election, was subject to a rate per annum equal to either (x) an Adjusted Base Rate plus a margin of 6.75% or (y) the sum of (i) the greater of LIBOR or 1.5% plus (ii) 7.75%. Laredo elected LIBOR pricing, and as such, the outstanding amount under the Term Loan was subject to an annual interest rate of 9.25% at December 31, 2010. Further, Laredo was subject to various financial and non-financial ratios at the Laredo LLC level on a consolidated basis, including a current ratio at the end of each calendar quarter, of not less than 0.85 to 1.00. As defined by the Laredo Senior Secured Credit Facility, the current ratio represented the ratio of current assets to current liabilities, inclusive of available capacity and exclusive of current balances associated with derivative positions. Additionally, at the end of each calendar quarter, Laredo LLC was required to maintain a ratio of its EBITDAX, as defined in the Term Loan, to the sum of net interest expense plus letter of credit fees of not less than 2.125 to 1.00, in each case for the four quarters then ending. Laredo LLC was also required to maintain at the end of each quarter, a ratio of total debt to consolidated EBITDAX of not more than 4.50 to 1.00, in each case for the four quarters then ending, and a total proved PV-10 ratio, as defined by the Term Loan, to total debt of not less than 1.50 to 1.00.
Subsequent to December 31, 2010, Laredo re-paid in full its $100 million outstanding balance under the Term Loan, using a portion of the proceeds from the issuance of its 2019 Notes and retired the loan. See Note O for additional discussion of 2019 Notes and the subsequent amendments to the Laredo Senior Secured Credit Facility.
3. Fair value of debt
At December 31, 2010 and 2009, the estimated fair value of Laredo's outstanding debt balance was approximately $278.7 million and $190.8 million, respectively. The fair values were estimated utilizing pricing models for similar instruments.
F-62
Broad Oak
1. Credit facility
At December 31, 2010, Broad Oak had a $600.0 million revolving credit facility under its Sixth Amendment to the Credit Agreement (the "Broad Oak Credit Facility"), dated April 11, 2008, between Broad Oak and certain financial institutions. As of December 31, 2010, the borrowing base under this facility was $250.0 million with an outstanding balance of $214.1 million. As of December 31, 2009, the borrowing base under this facility was $60.0 million and $44.6 million was outstanding. The borrowing base was subject to a semi-annual redetermination based on the financial institutions' evaluation of Broad Oak's oil and gas reserves. The Broad Oak Credit Facility was available to Broad Oak until April 2013, at which time the outstanding balance would have been due. As defined in the Broad Oak Credit Facility, the Adjusted Base Rate Advances and Eurodollar Advances under the facilities bore interest payable quarterly at an Adjusted Base Rate or Adjusted LIBOR plus an applicable margin based on the ratio of outstanding revolving credit to the conforming borrowing base. At December 31, 2010, the applicable margin rates were 2.125% for the Adjusted Base Rate advances and 3.0% for the Eurodollar advances. The amount of the Broad Oak Credit Facility outstanding at December 31, 2010 was subject to an average annual interest rate of approximately 4.265%. Broad Oak was also required to pay a quarterly commitment fee of 0.5% on the unused portion of the bank's commitment.
The Broad Oak Credit Facility was secured by a first priority lien on Broad Oak's oil and gas properties. Further, Broad Oak was subject to various financial and non-financial ratios, including a current ratio at the end of each calendar quarter, of not less than 1.00 to 1.00. As defined by the Broad Oak Credit Facility, the current ratio represents the ratio of current assets to current liabilities, inclusive of available capacity and exclusive of current balances associated with non-cash derivative positions. Additionally, at the end of each calendar quarter, Broad Oak must have maintained a ratio of debt to "Consolidated EBITDAX" ratio of not more than 3.50 to 1.00, based on the quarter then ended annualized. Consolidated EBITDAX was defined as consolidated net income plus the sum of (i) income or franchise taxes; (ii) consolidated net interest expense; (iii) depreciation, depletion and amortization expense; (iv) any non-cash losses or charges on any derivative positions; (v) other noncash charges; and (vi) costs associated with oil and gas capital expenditures that are expensed rather than capitalized, less, to the extent included in the calculation of Consolidated Net Income (as defined in the Broad Oak Credit Facility), the sum of (A) the income of any person (other than wholly-owned subsidiaries of such person) unless such income is received by such person in a cash distribution; (B) gains or losses from sales or other dispositions of assets (other than hydrocarbons produced in the normal course of business); (C) any non-cash gains on any hedge agreement resulting from the requirements of Accounting Standards Codification 815 for that period; (D) extraordinary or non-recurring gains, but not net of extraordinary or non-recurring "cash" losses; and (E) costs and expenses associated with, and attributable to, oil and gas capital expenditures that are expensed rather than capitalized. Broad Oak was in compliance with financial and non-financial covenants during each of the periods in the years ended December 31, 2010 and December 31, 2009.
Additionally, the Broad Oak Credit Facility provided for the issuance of letters of credit, limited to the total capacity. At December 31, 2010, Broad Oak had no letters of credit outstanding.
F-63
Subsequent to December 31, 2010, the borrowing base under the Broad Oak Credit Facility was increased to $375 million.
On July 1, 2011, Laredo paid the Broad Oak Credit Facility in full and the facility was terminated. The lenders under the Laredo Senior Secured Credit Facility now have a first priority lien on Broad Oak's oil and gas properties.
2. Fair value of debt
The carrying value of the Broad Oak Credit Facility approximates fair value as it is subject to short-term floating interest rates that represent the rates available to Broad Oak for those periods.
E—Owners' equity
Laredo
The Laredo LLC First Amended and Restated Limited Liability Company Agreement (the "LLC Agreement") provides for the issuance of two series of Series A units. First, it authorizes a total of 60 million Series A-1 Units of Laredo LLC for total consideration of $300 million, consisting of approximately $294.9 million from Warburg Pincus IX and $5.1 million from certain members of Laredo LLC's management team and Board of Managers. This portion was fully funded as of December 31, 2009. Secondly, it provides for a total of 48 million Series A-2 Units of Laredo LLC for total consideration of $300 million, initially consisting of approximately $288.5 million from Warburg Pincus X O&G, L.P. ("Warburg Pincus X"), $9.2 million from Warburg Pincus X Partners, L.P. ("Warburg Pincus X Partners") and $2.3 million from certain members of Laredo LLC's management team and Board of Managers. The Series A Units have a liquidation preference amount equal to the total capital then invested, plus a 7% cumulative return, compounded quarterly. The Series A Units 7% cumulative return has accumulated to approximately $88.5 million and $47.1 million as of December 31, 2010 and December 31, 2009, respectively. The cumulative return has not been declared by the Board of Managers and as such, is not reflected in the combined financial statements.
As of December 31, 2010, approximately $549.2 million had been contributed to Laredo LLC, net of Series A Unit repurchases by Laredo, of which approximately $294.9 million was from Warburg Pincus IX, $238.4 million was from Warburg Pincus X, $7.6 million was from Warburg Pincus X Partners, and $8.3 million from certain members of Laredo LLC's management and Board of Managers. A capital call of $50 million was approved by Laredo LLC's Board of Managers on December 21, 2009, which was paid on January 22, 2010. This amount is shown as "Capital contributions receivable" in the Combined Balance Sheet at December 31, 2009.
Laredo LLC is authorized to issue up to 16,923,077 Series B Units, up to 8,791,209 Series C Units, up to 13,538,462 Series D Units and up to 7,032,967 Series E Units under restricted unit agreements with management (collectively, the "Restricted Units"). The Series B Units are divided into two unit series, B-1 Units and B-2 Units. The Series B-1 Units have an initial threshold value of $0 and the Series B-2 Units have an initial threshold value of $1.25. The Series C Units have an initial threshold value of $10.00, the Series D Units have an initial threshold value of $1.25, and the Series E Units have an initial threshold value of $13.75.
F-64
The table below summarizes the outstanding restricted units by series as of December 31:
| (in thousands) |
Series B Units |
Series C Units |
Series D Units |
Series E Units |
Total Units |
|||||||
|---|---|---|---|---|---|---|---|---|---|---|---|---|
BALANCE, December 31, 2007 |
4,021 | 3,215 | — | — | 7,236 | |||||||
Issuance of restricted units |
4,753 | 4,565 | — | — | 9,318 | |||||||
Cancellation of restricted units |
(17 | ) | — | — | — | (17 | ) | |||||
BALANCE, December 31, 2008 |
8,757 | 7,780 | — | — | 16,537 | |||||||
Issuance of restricted units |
54 | — | 4,644 | 5,996 | 10,694 | |||||||
Cancellation of restricted units |
(113 | ) | (100 | ) | (49 | ) | (10 | ) | (272 | ) | ||
BALANCE, December 31, 2009 |
8,698 | 7,680 | 4,595 | 5,986 | 26,959 | |||||||
Issuance of restricted units |
— | — | 5,530 | 756 | 6,286 | |||||||
Cancellation of restricted units |
(700 | ) | (420 | ) | (513 | ) | (180 | ) | (1,813 | ) | ||
BALANCE, December 31, 2010 |
7,998 | 7,260 | 9,612 | 6,562 | 31,432 | |||||||
Any distributions made by Laredo LLC are allocated first to Series A-1 Units and A-2 Units until the holders of Series A-1 and A-2 Units have received their invested capital and aforementioned preference amount. Second, until the B-2 Unit "$1.25 Threshold" is met, all distributions are made to Series A-1 and Series B-1 Units in proportion to their unit ratios. Third, until the C Unit "$10.00 Threshold" has been met, the distributions are made to the holders of Series A-1 Units and A-2 Units, Series B-1 and B-2 Units and Series D Units in proportion to their unit ratios. Fourth, until the Series E Unit "$13.75 Threshold" has been met, the distributions are made to the holders of the Series A-1 and A-2 Units, Series B-1 and B-2 Units, Series C Units and Series D Units in proportion to their unit ratios. Finally, after the Series E Unit "$13.75 Threshold" has been met, the distributions will be made to the holders of the Series A-1 and A-2 Units, Series B-1 and B-2 Units, Series C Units, Series D Units, and Series E Units in proportion to their unit ratios. Each threshold represents the point when holders of Series A-1 and A-2 Units have received the preference amount plus $1.25, $10.00, and $13.75 per unit, respectively.
If future Series B-1, B-2, C, D, or E Units are issued with higher threshold values than prior units in that series, units having a higher threshold value will not share in distributions within the series until units having the lower threshold value have received distributions in an amount necessary to bring them into balance. Until the time that Series A-1 and A-2 unit investors have fully funded their capital commitments, distributions to holders of Series B-1, B-2, C, D and E Units are subject to being held back until the total of the amounts held back equals the total remaining commitment of Series A-1 and A-2 investors. The holdback amount is subject to distribution to holders of Series A-1 and A-2 Units if future returns are not sufficient to fund the Series A-1 and A-2 preference amounts. Series B-1, B-2, C, D and E Units are also subject to a claw-back (not to exceed distributions received, less taxes) if distributions to such units exceed their entitlement.
In connection with any qualified public offering, each outstanding Series A-1 and A-2 Units and Series B-1, B-2, C, D, or E Units will be converted into or exchanged (at values determined in the LLC Agreement) for shares of common stock of Laredo Holdings. The converted or exchanged units will receive value equal to the same proportion of the aggregate pre-IPO
F-65
value such that each holder of units will receive IPO securities having a value based on the provisions of the LLC Agreement.
Management may request the funding of capital calls under the amended investors' commitment for development activities, working capital and acquisitions, subject to the approval of the Board of Managers. All capital calls are subject to the approval of the Warburg Pincus Partnerships owning Laredo LLC units and must be for an amount not less than $5 million.
The approval of the Warburg Pincus Partnerships owning Laredo LLC units is required with respect to certain events, including material contracts and commitments, certain acquisitions and dispositions, certain expenditures and incurrence of debt, and amendments to Laredo's structure.
During 2010, Laredo LLC purchased and canceled two employee-investors' Series A-1 Units and Series A-2 Units.
On September 26, 2008, the Company received a note receivable in response to a capital call from an investor in the amount of $180,000. The note bore interest at a rate that corresponds with the Laredo Senior Secured Credit Facility effective interest rate with a maximum rate of 6%. At December 31, 2008, the Company recorded this note as a reduction in owners' equity. Effective May 15, 2009, the Company entered into a severance agreement with the aforementioned investor. In accordance with the severance agreement, the Company purchased and canceled all of the investor's Series A-1 Units and Series A-2 Units and netted the note receivable plus accrued interest against the purchase price of the investor's units; as a result, the note receivable was paid in full at the execution of the severance agreement.
As part of an employment agreement with one of the Company's officers, the Company agreed to make an interest free loan to the officer of up to $200,000 only to be used to purchase Series A Units. Initially, one half of the loan was forgiven upon the effective date of the officer's employment and the remaining one half was to be forgiven at the earlier of (a) the first anniversary of the date of the officer's employment or (b) a change in control of the ownership of Laredo LLC. On January 10, 2008, March 14, 2008 and May 15, 2008 the officer borrowed $40,000, $40,000, and $20,000, respectively, from the Company for the purchase of 20,000 Series A Units. This amount was forgiven and the Company recorded a total of $100,000 of non-cash compensation expense in 2008.
Broad Oak
The purchase terms, conditions and stockholders' rights of Broad Oak's Series A Preferred Stock were outlined in the Broad Oak Series A Preferred Stock Agreement, Stockholders' Agreement and Certificate of Designations dated May 16, 2006. The Series A Preferred Stock accrued dividends daily from the date of issue at a rate of 7% per annum through its termination on July 1, 2011. Dividends compound on a quarterly basis in arrears on March 31, June 30, September 30 and December 31 of each year. Dividends in arrears accumulated to approximately $32.9 million and $20.1 million as of December 31, 2010 and December 31, 2009, respectively. Since inception, dividends were not declared by the Board of Directors and as such, no liability was reflected in the combined financial statements.
F-66
The purchase price of the Series A Preferred Stock was $100 per share, subject to adjustment upon the occurrence of certain events. It ranked senior in rights of preference to the common stock or any other equity securities of Broad Oak and will receive all dividends paid by Broad Oak until the purchase price plus accrued dividends had been paid.
See Note O for additional discussion regarding the effect of the Broad Oak Transaction on Broad Oak's Series A Preferred Stock and Common Stock.
F—Equity-based compensation
Laredo
The Company recognizes the fair value of equity-based payments to employees and directors, including awards in the form of Restricted Units of Laredo LLC as a charge against earnings. The Company recognizes equity-based payment expense over the requisite service period. Laredo LLC's equity-based payment awards are accounted for as equity instruments. Equity-based compensation is included in "General and administrative expense" in the Combined Statements of Operations and amounted to $1.2 million, $1.4 million and $1.9 million for the years ended December 31, 2010, 2009 and 2008, respectively.
The fair value of unit-based compensation for restrictive equity was estimated on the date of grant using the Company's estimated market value. The Company calculates the estimated market value at the end of each calendar quarter and then applies the calculated value to each Series B-1, B-2, C, D and E Units granted during the current calendar quarter. The Company's determination of the fair value for Series B-1, B-2, C, D and E Units is calculated on the present value of the Company's proved reserves, adjusted for current market values of Laredo's other non-oil and gas assets and liabilities. The Company's determination of the fair value of each Series B-1, B-2, C, D and E Units is affected by the Company's proved reserves, current commodity prices, current values of the Company's non-oil and gas assets and liabilities, as well as assumptions regarding a number of complex and subjective variables. Although the fair value of the unit grants is determined in accordance with GAAP, that value may not be indicative of the fair value observed in a market transaction between a willing buyer and a willing seller.
Laredo LLC is authorized to issue equity incentive awards in the form of Restricted Units. Unvested Restricted Units may not be sold, transferred or assigned. The fair value of the Restricted Units is measured based upon the estimated market price of the underlying member units as of the date of grant. The Restricted Units are subject to the following vesting terms: 20% at the grant date and 20% annually thereafter. The fair value of the Restricted Units in excess of the amounts paid by the employee, which is zero, is amortized to expense over its applicable requisite service period using the straight-line method. In the event of a termination of employment for cause, all Restricted Units, including unvested Restricted Units and vested Restricted Units, and all rights arising from such Restricted Units and from being a holder thereof, are forfeited. In the event of a termination of employment without cause or a resignation, all unvested Restricted Units and all rights arising from such Restricted Units and from being a holder thereof, are forfeited. For a period of one year from the date of termination of employment, in the event of a termination of employment for cause, the Company may also elect to redeem the Series A-1 Units and Series A-2 Units at a price per unit equal to the lesser of the fair market value or original purchase price. In the event of a
F-67
termination without cause or a resignation, the Company may elect to redeem the Series A-1 Units and Series A-2 Units and vested Restricted Units at a price equal to the fair market value.
The table below summarizes activity relating to the unvested Restricted Units:
| (in thousands, except grant date fair values) |
Series B-1 restricted units |
Weighted average grant date fair value |
Series B-2 restricted units |
Weighted average grant date fair value |
Series C restricted Units |
Weighted average grant date fair value |
Series D restricted units |
Weighted average grant date fair value |
Series E restricted units |
Weighted average grant date fair value |
|||||||||||||||||||||
|---|---|---|---|---|---|---|---|---|---|---|---|---|---|---|---|---|---|---|---|---|---|---|---|---|---|---|---|---|---|---|---|
Outstanding at December 31, 2007 |
3,212 | $ | — | — | $ | — | 2,572 | $ | — | — | $ | — | — | $ | — | ||||||||||||||||
Granted |
2,284 | $ | 0.78 | 2,469 | $ | 2.16 | 4,565 | $ | — | — | $ | — | — | $ | — | ||||||||||||||||
Vested |
(1,258 | ) | $ | 0.28 | (494 | ) | $ | 2.16 | (1,556 | ) | $ | — | — | $ | — | — | $ | — | |||||||||||||
Forfeited |
(17 | ) | $ | — | — | $ | — | — | $ | — | — | $ | — | — | $ | — | |||||||||||||||
Outstanding at December 31, 2008 |
4,221 | $ | 0.34 | 1,975 | $ | 2.16 | 5,581 | $ | — | — | $ | — | — | $ | — | ||||||||||||||||
Granted |
— | $ | — | 54 | $ | — | — | $ | — | 4,644 | $ | — | 5,996 | $ | — | ||||||||||||||||
Vested |
(1,242 | ) | $ | 0.26 | (502 | ) | $ | 2.12 | (1,536 | ) | $ | — | (930 | ) | $ | — | (1,199 | ) | $ | — | |||||||||||
Forfeited |
(80 | ) | $ | 1.75 | (14 | ) | $ | 2.23 | (80 | ) | $ | — | (43 | ) | $ | — | (8 | ) | $ | — | |||||||||||
Outstanding at December 31, 2009 |
2,899 | $ | 0.33 | 1,513 | $ | 2.10 | 3,965 | $ | — | 3,671 | $ | — | 4,789 | $ | — | ||||||||||||||||
Granted |
— | $ | — | — | $ | — | — | $ | — | 5,530 | $ | — | 756 | $ | — | ||||||||||||||||
Vested |
(1,055 | ) | $ | 0.27 | (483 | ) | $ | 2.12 | (1,416 | ) | $ | — | (1,983 | ) | $ | — | (1,349 | ) | $ | — | |||||||||||
Forfeited |
(425 | ) | $ | 0.64 | (88 | ) | $ | 2.17 | (420 | ) | $ | — | (473 | ) | $ | — | (180 | ) | $ | — | |||||||||||
Outstanding at December 31, 2010 |
1,419 | $ | 0.36 | 942 | $ | 2.10 | 2,129 | $ | — | 6,745 | $ | — | 4,016 | $ | — | ||||||||||||||||
For the years ended December 31, 2010, 2009 and 2008, respectively, unrecognized equity-based compensation expense related to unvested Restricted Units was $2.1 million, $3.7 million and $5.3 million. That cost is expected to be recognized over a weighted average period of 1.8 years.
A summary of weighted average grant-date fair value and intrinsic value of vested Restricted Units are as follows:
| |
2010 |
2009 |
2008 |
||||||
|---|---|---|---|---|---|---|---|---|---|
B-1 Units |
|||||||||
Weighted average grant date fair value |
$ | 0.27 | $ | 0.26 | $ | 0.28 | |||
Total intrinsic value of units vested (in thousands) |
$ | 431 | $ | 15 | $ | 2,053 | |||
B-2 Units |
|||||||||
Weighted average grant date fair value |
$ | 2.12 | $ | 2.12 | $ | 2.16 | |||
Total intrinsic value of units vested (in thousands) |
$ | — | $ | — | $ | 1,068 | |||
C Units |
|||||||||
Weighted average grant date fair value |
$ | — | $ | — | $ | — | |||
Total intrinsic value of units vested (in thousands) |
$ | — | $ | — | $ | — | |||
D Units |
|||||||||
Weighted average grant date fair value |
$ | — | $ | — | $ | — | |||
Total intrinsic value of units vested (in thousands) |
$ | — | $ | — | $ | — | |||
E Units |
|||||||||
Weighted average grant date fair value |
$ | — | $ | — | $ | — | |||
Total intrinsic value of units vested (in thousands) |
$ | — | $ | — | $ | — | |||
|
|||||||||
F-68