Attached files
| file | filename |
|---|---|
| 8-K - FORM 8-K - TPC Group Inc. | d239173d8k.htm |
 A
market leader in value-added products based on petrochemical raw
materials Exhibit 99.1 |
 Forward-Looking Statements & Non-GAAP Financial Measures
This
presentation
may
contain
“forward-looking
statements”
within
the
meaning
of
the
securities
laws.
These
statements
include
assumptions,
expectations,
predictions,
intentions
or
beliefs
about
future
events,
particularly statements that may relate to future operating results, existing and
expected competition, market factors
that
may
impact
financial
performance,
and
plans
related
to
strategic
alternatives
or
future
expansion activities and capital expenditures. Although TPC Group believes
that such statements are based on reasonable assumptions, no assurance can
be given that such statements will prove to have been
correct.
A
number
of
factors
could
cause
actual
results
to
vary
materially
from
those
expressed
or
implied in any forward-looking statements, including risks and uncertainties
such as volatility in the petrochemicals industry, limitations on the
Company’s access to capital, the effects of competition, leverage and
debt service, general economic conditions, litigation and governmental investigations, and
extensive
environmental,
health
and
safety
laws
and
regulations.
More
information
about
the
risks
and
uncertainties relating to TPC Group and the forward-looking statements are
found in the Company’s SEC filings, including the Transition Report on
Form 10-K, which are available free of charge on the SEC’s website
at http://www.sec.gov . TPC Group
expressly disclaims any obligation to update any forward- looking
statements contained herein to reflect events or circumstances that may arise after the date of this
presentation.
This presentation may also include non-GAAP financial information. A
reconciliation of non-GAAP financial measures to the most directly
comparable GAAP financial measures, as well as additional detail regarding
the utility of such non-GAAP financial information, is included in the
Appendix. 2 |
 Overview
3 |
 4
Market Leader in
C4 Hydrocarbons
Attractive,
growing end-
user markets
Game-changing
growth
opportunities
Unique logistics
network
Strategically
located
Long-standing
customer/supplier
relationships
Stable, consistent
cash flows
Scalable asset,
infrastructure
platform
Disciplined,
experienced
management team
Overview |
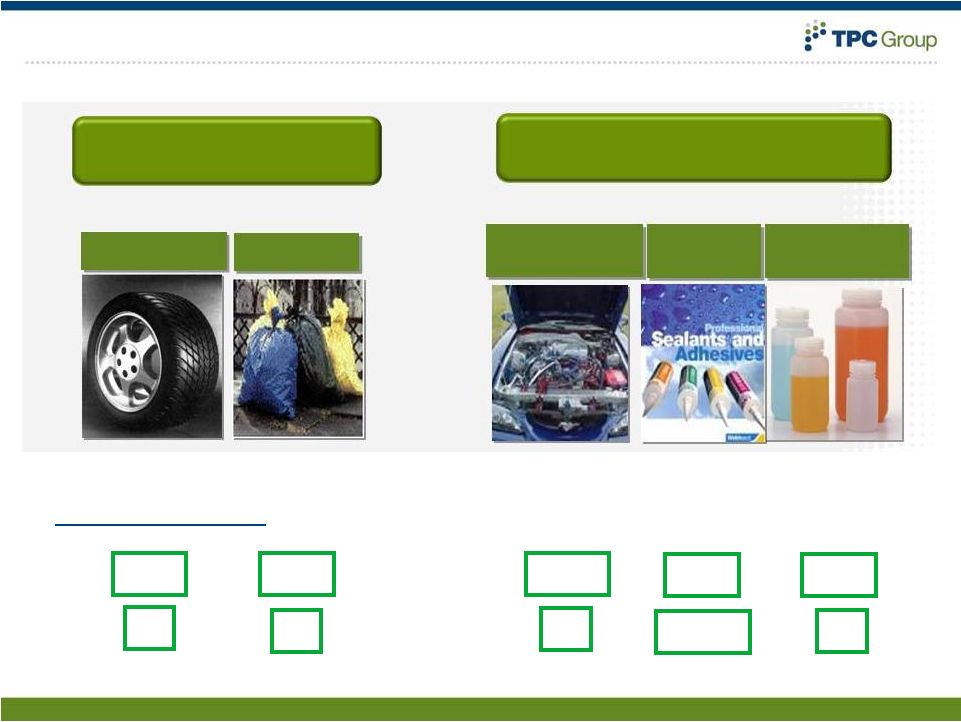
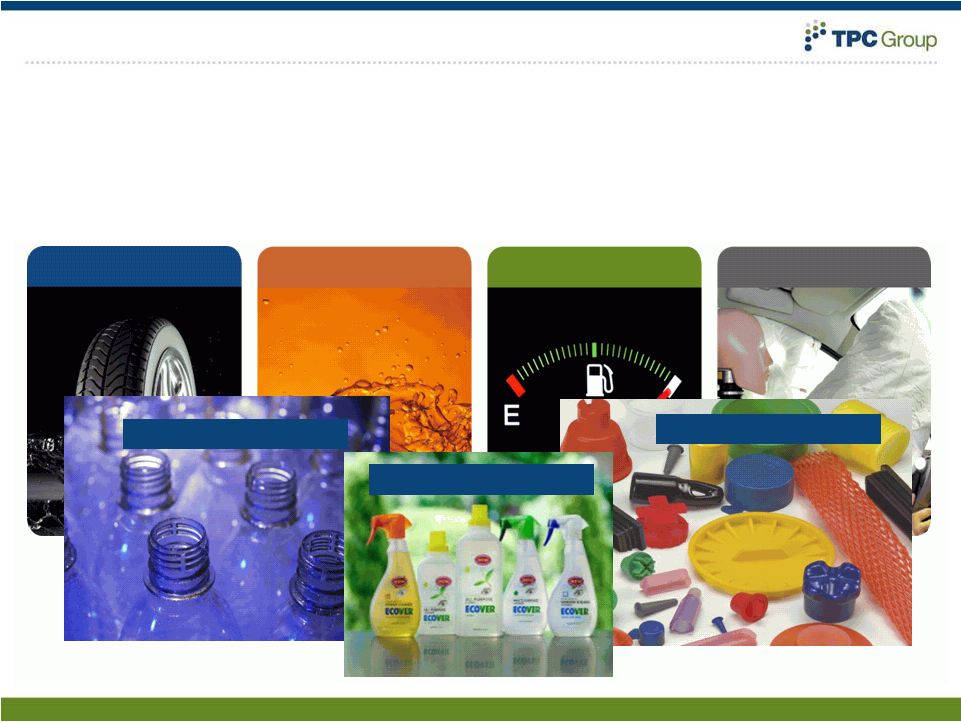 What
We Do 5
TPC Group Inc. is a leader in specialty chemicals, and provides products to
major chemical and petroleum companies worldwide.
Providing building blocks that help make the world’s tires, carpets,
gasoline additives and other essential items for daily lives.
Fuel & Lube Additives
Gasoline & Blendstocks
Nylons
Plastics
Surfactants
Additives
Tires |
 Leading Market Positions
6
C4 Processing Market
Share
Performance Products Market
Share
Butadiene
Butene-1
Isobutylene
Products
Polyisobutylene
(PIB)
Propylene
Derivatives
35%
35%
60%
25%
25%
U.S. Market Share:
#1
#1
#1
#1, #3
#3 |
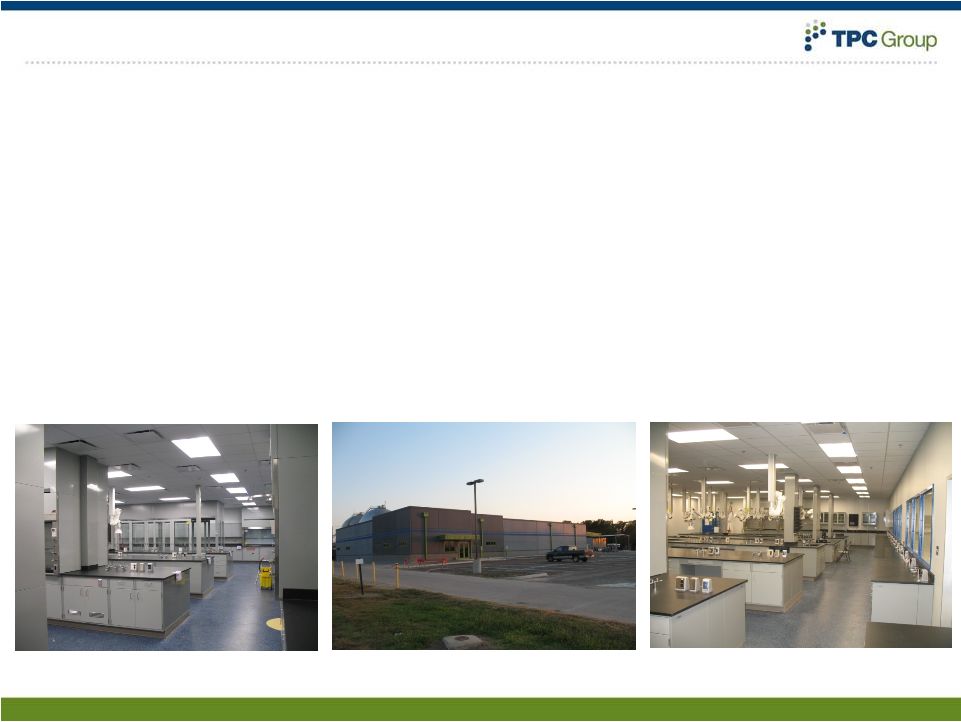 Commitment to Technology, Development
•
Opening of new multi-million dollar TPC Technical Center in Houston
•
Exploring new opportunities for proprietary product and process
technologies
–
Highly reactive PIB (patented)
–
Multiple processing technologies (e.g. TPC Group Oxo-D
TM
process)
–
Catalyst development and testing
•
Recent appointment of Senior Vice President -
Corporate Development
7 |
 Our
Competitive Advantages 8
Strategic
Location
(US “Petrochemical Corridor”)
Depth of
Expertise
Established, Integrated
Relationships
Unique, Valuable
Infrastructure
Strong,
Sustainable
Earnings
Growth |
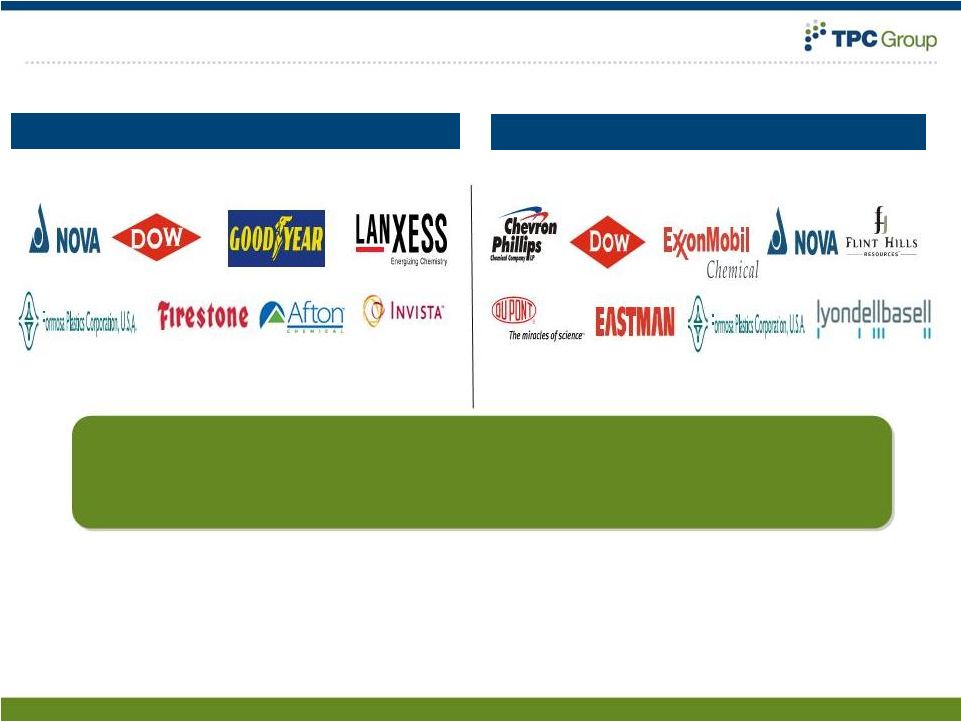 Established, Integrated Relationships
9
Customers
Feedstock Suppliers
Playing a Profitable Central Role in the Ethylene Value Chain
•
Crude C4 processor for every non-integrated North American ethylene
producer •
Deeply integrated into respective customer/supplier supply chains
•
Premier processing reliability record |
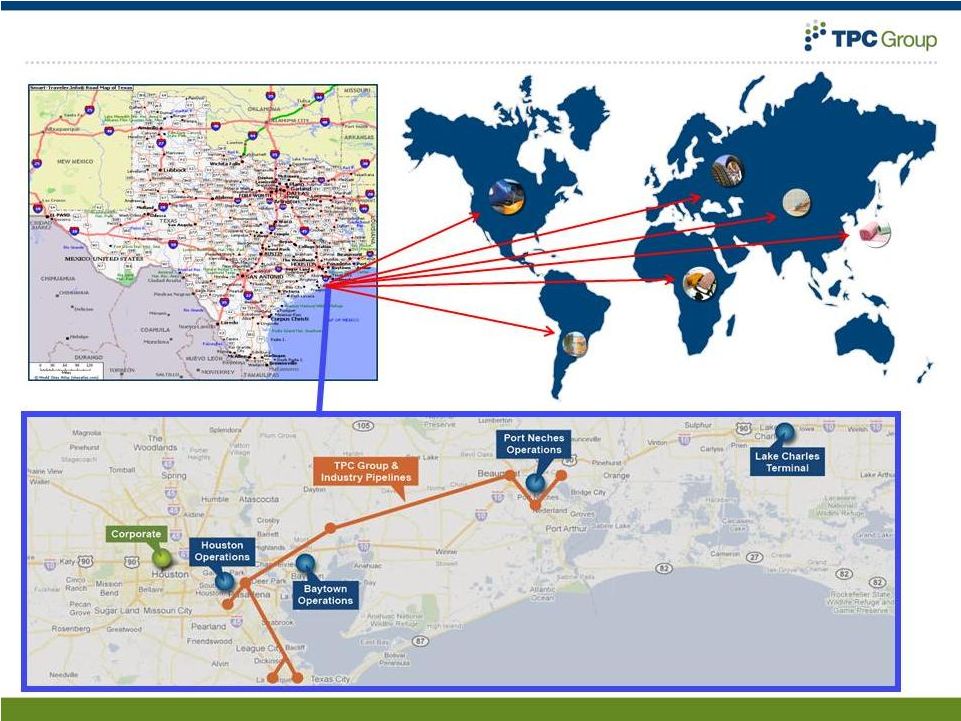 Strategically Located in the “Petrochemical Corridor”
10 |
 Michael T. McDonnell
President and Chief Executive Officer
Miguel A. Desdin
Senior Vice President & Chief Financial Officer
Luis E. Batiz
Senior Vice President of Operations
Russell T. Crockett
Senior Vice President, Commercial
Management Expertise
11
Gene Allspach
Senior
Vice
President
–
Corporate
Development
Driving Transformation at TPC Group |
 Past
(4
yr
avg.)
Present
(June
LTM)
Future
EBITDA ($MM)
$75
$158
2x-3x
EBITDA margin %
4.3%
6.8%
2x-3x
Total Assets
$819
$1,083
Shareholder Equity
$278
$305
TPC Group Transformation
12
Tactically-driven
“Me-to”
player
Narrow product slate
Toll-processing business
model
Strategically-driven
Market Leader
Broadened product slate
Services & Processing business
model
Driving a performance-based
culture
Operational excellence focus
Multiple revenue streams
Diverse business models
Full margin capture
Strong performance culture
-
ownership mentality
-
results driven
Fully utilized asset base
Past
Present
Future |
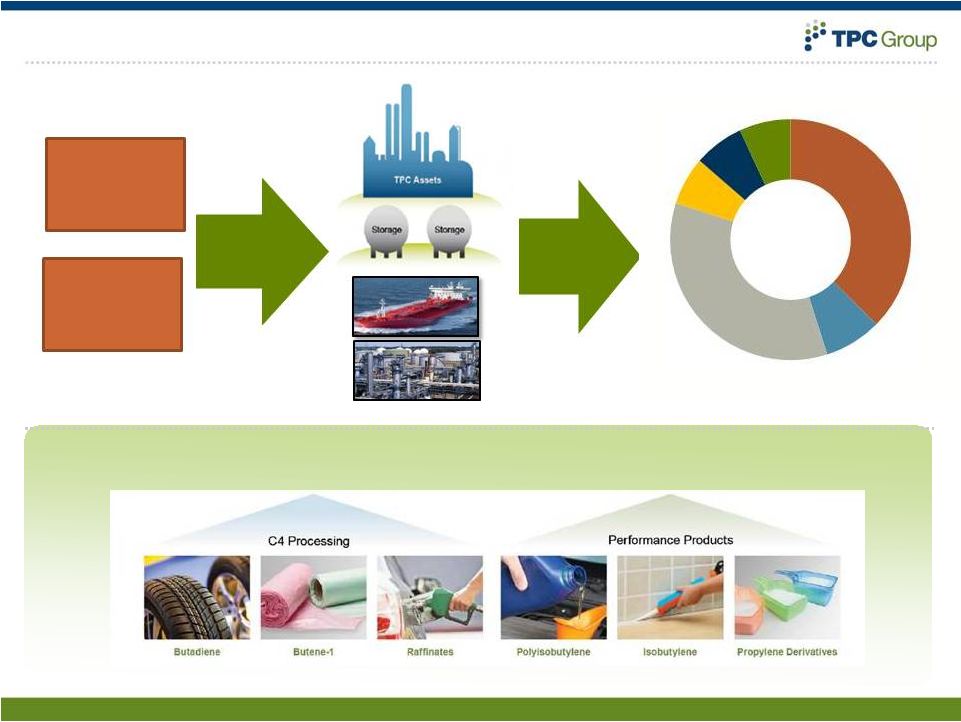 Unique, Valuable Infrastructure
13
13
Crude C4: non-core “by-product”
processed for a range of critical
“building blocks”
for diverse market use
Logistics & Infrastructure
TPC
Logistics
Operations
TPC Purity
Products
Propylene
Producers
Ethylene/Mixed
C4
Producers
Propylene
Derivative
7%
Raffinates
and Fuels
35%
Butadiene
37%
Polyisobutylene
6%
Butene-1
8%
DIB and HPIB
7% |
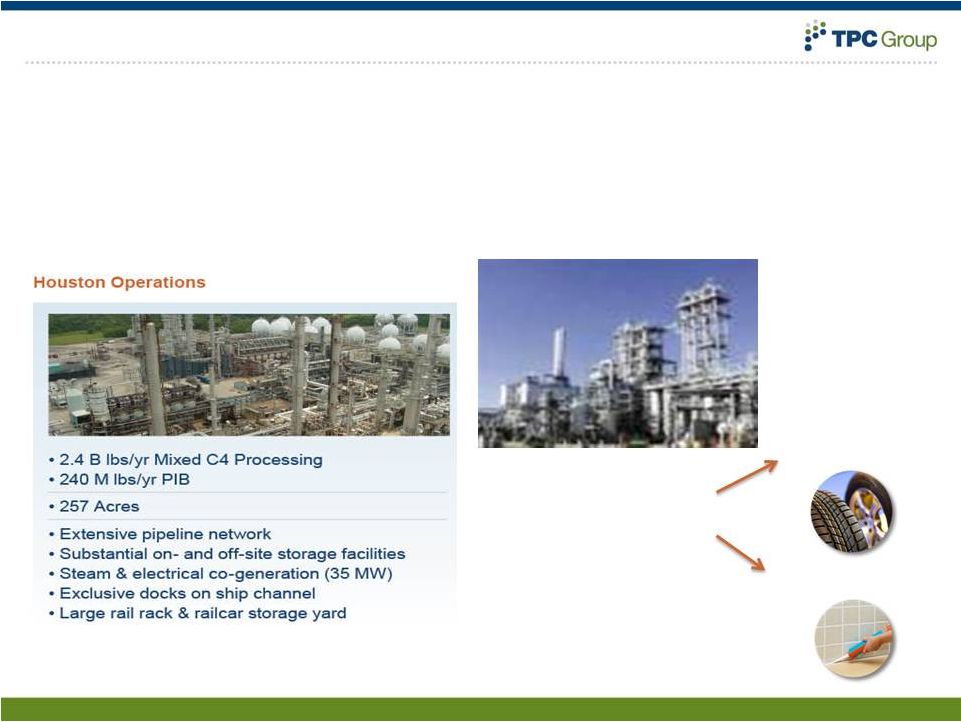
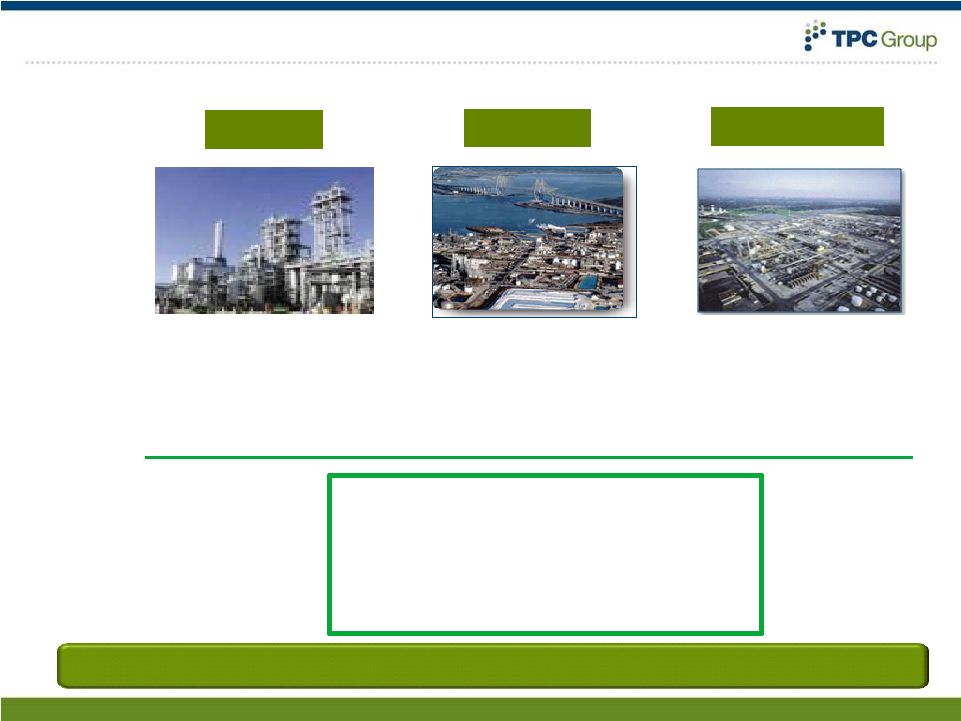 Unique, Valuable Infrastructure
14
Houston
Baytown
Port Neches
Facility
Capacity:
Footprint:
Key
Attributes:
2.4B
lbs/yr
-
Mixed
C4
240M
lbs/yr
-
PIB
85
M
lb/yr
-
Nonene
50M
lbs/yr
-
Tetramer
1.8B lbs/yr Mixed C4
257 Acres
133 Acres
154 Acres
Estimated replacement cost >$1.9B + value of idled assets
•
Extensive
pipeline
network
•
Substantial
storage
facilities
•
World-class
docking
and
rail
facilities
•
Terminaling
services |
 Near
Term Drivers of Performance 15
•
Margin expansion in C4 processing
•
Volume growth and margin expansion in Performance Products
•
High return/low risk capital projects
•
Operational Excellence |
 Market cap (6/30/11):
$626 million
Total cash:
$66 million
Net debt:
$282 million
Fully diluted shares:
16.2 million
Operating revenues:
$2,334 million
Net income:
$58 million
Earnings per fully diluted share:
$3.56
Adjusted EBITDA:
$158 million
ROIC
14%
Trailing 12m
(as of 6/30/11)
As of 6/30/11
EBITDA is a non-GAAP measure. See appendix for reconciliation of EBITDA to net
income. A Financial Platform for Growth
16 |
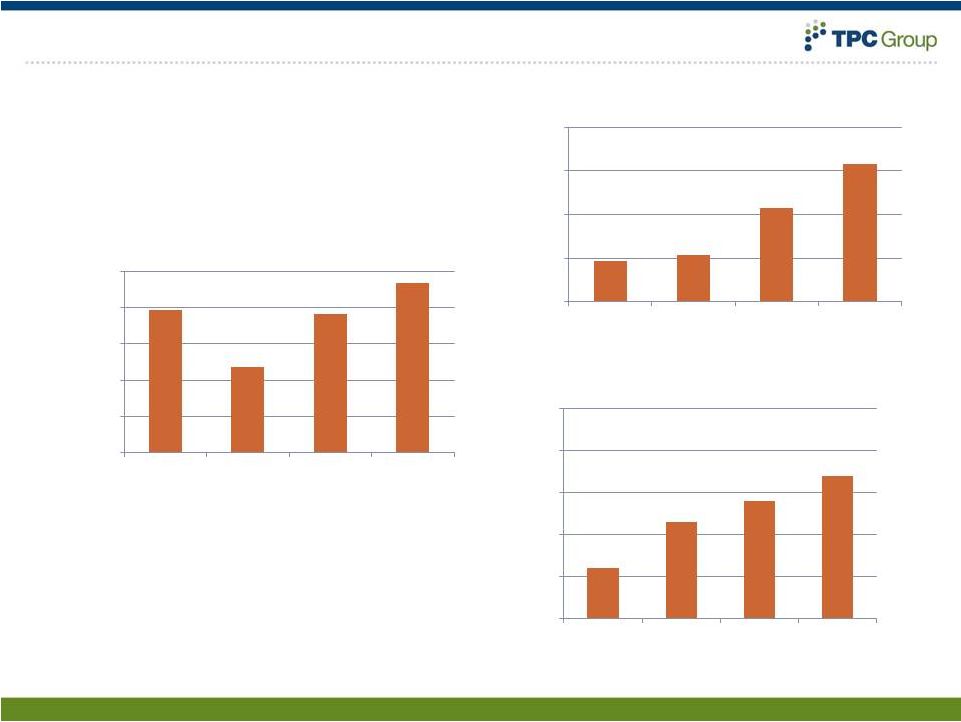 Financial Performance
17
1,973
1,179
1,918
2,334
0
500
1,000
1,500
2,000
2,500
2008
2009
2010
TTM
as of 6/30/11
Sales Revenue ($m)
47
54
108
158
0
50
100
150
200
2008
2009
2010
TTM
as of 6/30/11
Adjusted EBITDA ($m)
2.4%
4.6%
5.6%
6.8%
0.0%
2.0%
4.0%
6.0%
8.0%
10.0%
2008
2009
2010
TTM
as of 6/30/11
Adjusted EBITDA % |
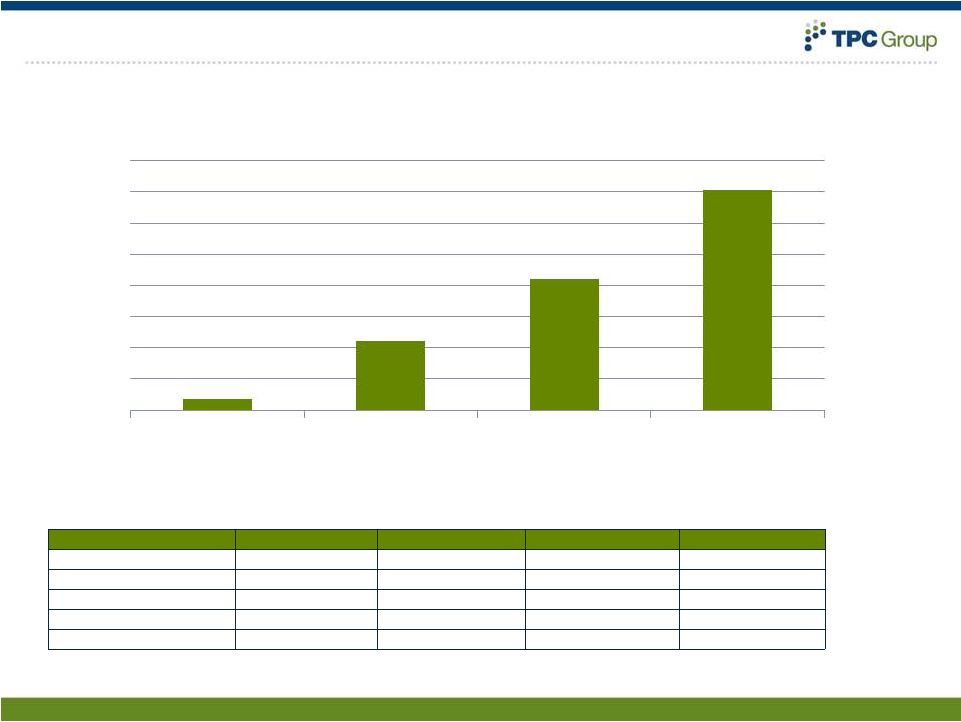 With
Improving Returns on Invested Capital 18
0.7%
4.4%
8.4%
14.1%
2008
2009
2010
LTM 6/2011
EBIT
6,436
38,194
68,206
116,597
Ave. Shareholders' Equity
286,900
279,859
298,492
295,936
Ave. Long-term Debt
299,875
290,000
280,597
314,753
Ave. Cash
3,136
1,614
52,293
72,469
ROIC
0.7%
4.4%
8.4%
14.1%
Components of ROIC:
2008
2009
2010
LTM Jun-11 |
 Business Model
19 |
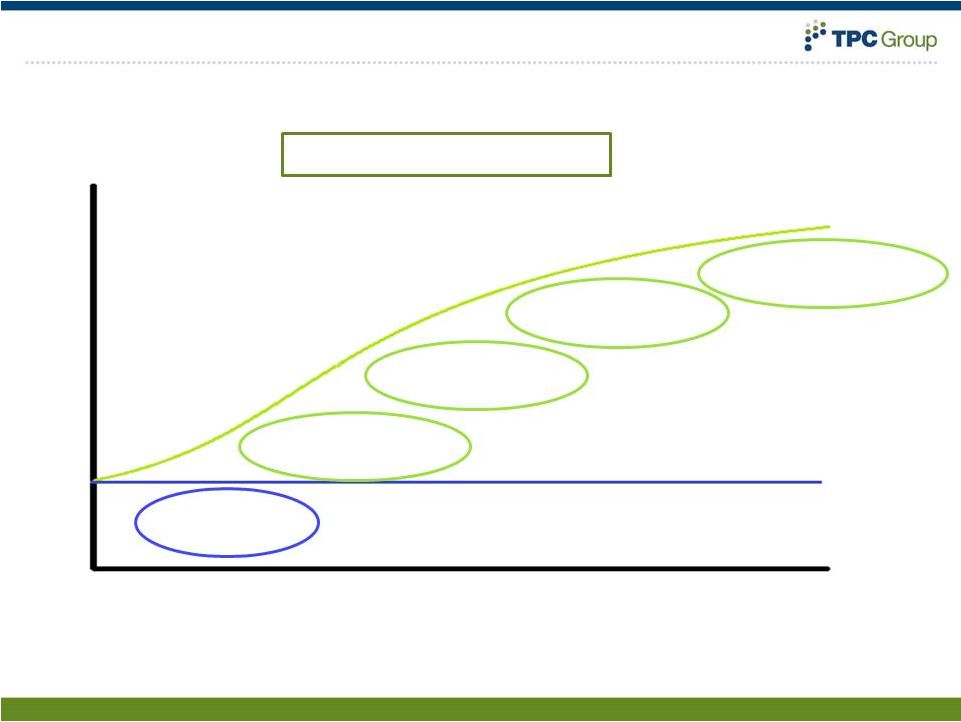 How
We Make Money 20
2008
2009
2010
2011 (first six months)
2.7
2.9
3.7
4.5
7.5
3.4
3.2
3.3
TOTAL MARGIN
Operational
excellence
Growth &
margin expansion
Core/Stable
Margins
BD price
changes
Fuel value in
price formulas
Margin
Cents
per
pound |
 With
a Business Model Based on Stable Core Margins 21
Feedstock
Supplies
TPC Processing
& Logistics
Services
Crude C4s from
Suppliers
Purchased Raw
Materials
Isobutylene
(IBL)
Propylene
Mixed
C4
End Products
Margin Structure
Butadiene (BD)
Stable: processing
margin & service fees
Butylenes:
•
Butene-1
(B-1)
•
Fuel Components
Contained Isobutylene
Stable: prices &
costs tied to
gasoline
High Purity
Isobutylene &
Derivatives
Stable: indexed
pricing based on
butane
(“formula pricing”)
Stable: costs tied to
gasoline
Propylene
Derivatives
Stable: indexed, pricing
based on propylene
(“formula pricing”) |
 Attractive, Stable Margin Model—Illustrative Example
22
Butadiene (45%)
Supplier Price
-
Monthly Contract Price
$ (1.00/lb)
+
Extraction Fee
$ 0.04
+
Energy Fee
85%
Selling Price
-
Monthly Contract Price
$ 1.00/lb
+
Service Fee
$ 0.05
TPCG Value
+
Extraction Fee
$ 0.04
+
Energy Fee
85%
+
Service Fee
$ 0.05
Butylene (55%)
Supplier Price
% of Unleaded Regular Gasoline
Selling Price
% + of Unleaded Regular Gasoline
TPCG Value
+ of Unleaded Regular Gasoline
Performance Products
Supplier Price
% of Butane
Selling Price
% + of Butane
TPCG Value
+ of Butane
Key Takeaway:
Relatively stable unit margins
Cash flow generation throughout the cycle |
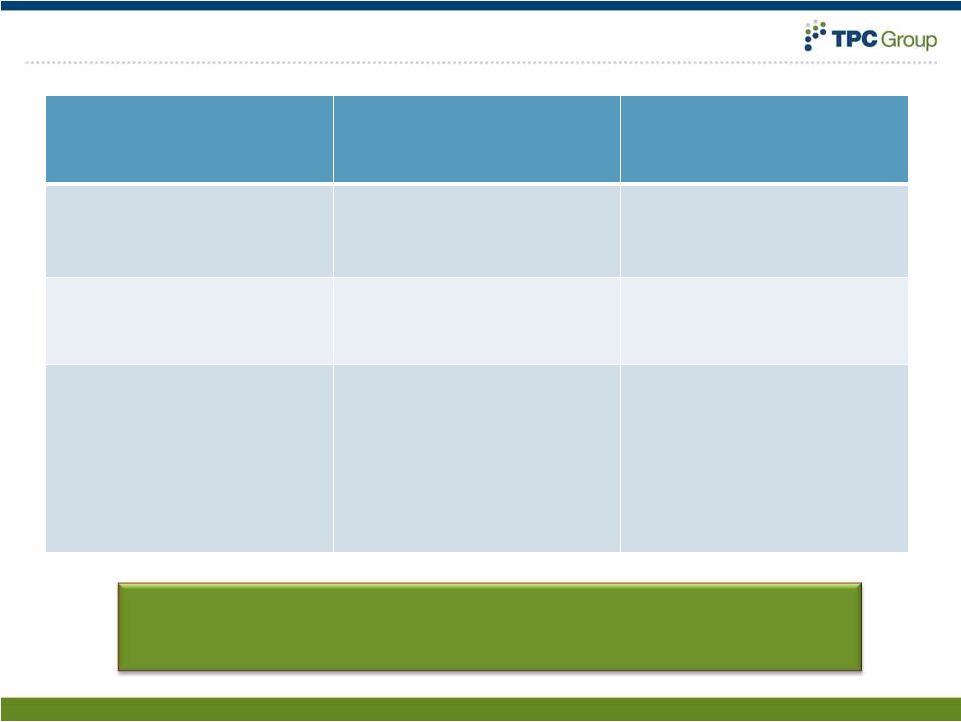 Key
Variable Sensitivities Key Variable
Key Indicators
Directional
Significance
Operating leverage
•
Cracker rates
•
Cracker feedslates
•
Enabled by significant,
underutilized capacity
Fuel values
•
Unleaded gasoline
•
Gasoline-to-butane
spread
•
Margins positively
correlated to fuel values
BD price level
•
End-market demand
•
Continued tightness in
supply
•
Driven by timing between
crude purchase and finished
BD sale
•
One-time impact: profits
retained once prices
stabilize
•
Core margin unaffected by
BD price changes
23
Inherently Stable “Core”
Margins
•
Autos, fuel demand |
 Strategy for Growth
24 |
 Fundamental Anchors of Our Strategy
25
Excellent Long-
Term Market
Fundamentals
Idled Assets and
Scalable
Infrastructure
Able to
Be Deployed
Mixed
C4
Key Products in
Structural Short
Supply
Cost-Advantaged
Raw Materials
(NGLs) in
Plentiful Supply |
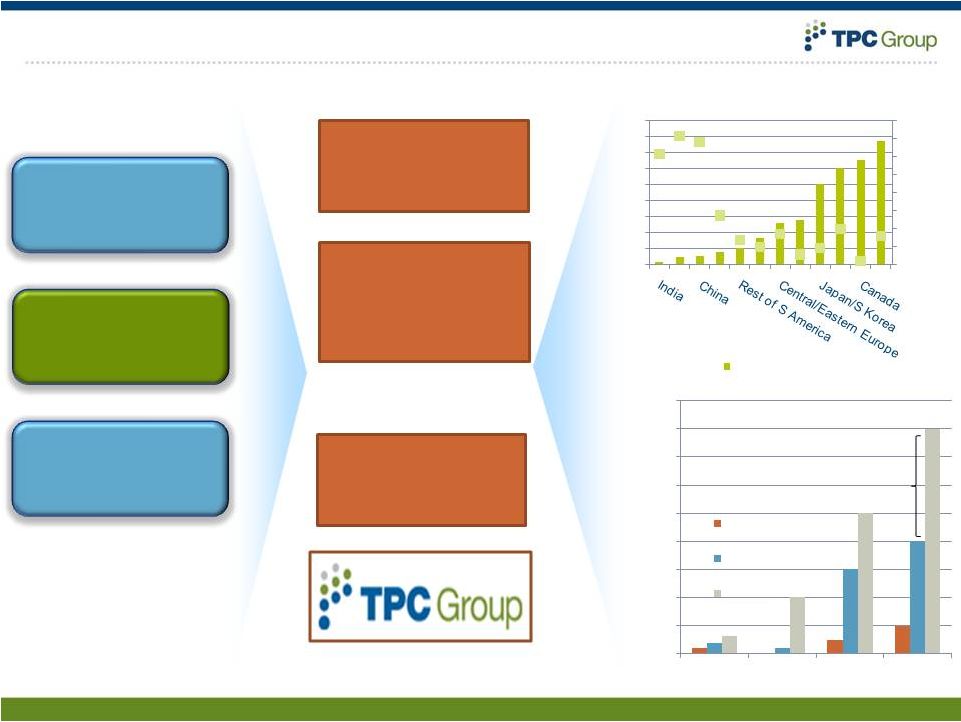 Excellent Long-term Market Fundamentals
26
Global Mobility
Rising Living
Standards
Environmental
Regulations
Tires:
-
Performance
-
Fuel economy
Fuels & Lubricants:
-
Engine life
-
Engine performance
-
Industrial Products:
-
Surfactants
-
Adhesives
Demand Drivers
TPC Products
Representative
Macro Trends
Source: Lanxess
Source: Michelin
People Entering Middle Class
26
0
200
400
600
800
1000
1200
1400
1600
0
100
200
300
400
500
600
700
800
900
Cars per 1K people
0
200
400
600
800
1000
1200
1400
1600
1800
Brazil
India
China
BRIC
2000
2010e
(m people)
~800 Million people
Emissions reductions
2020e |
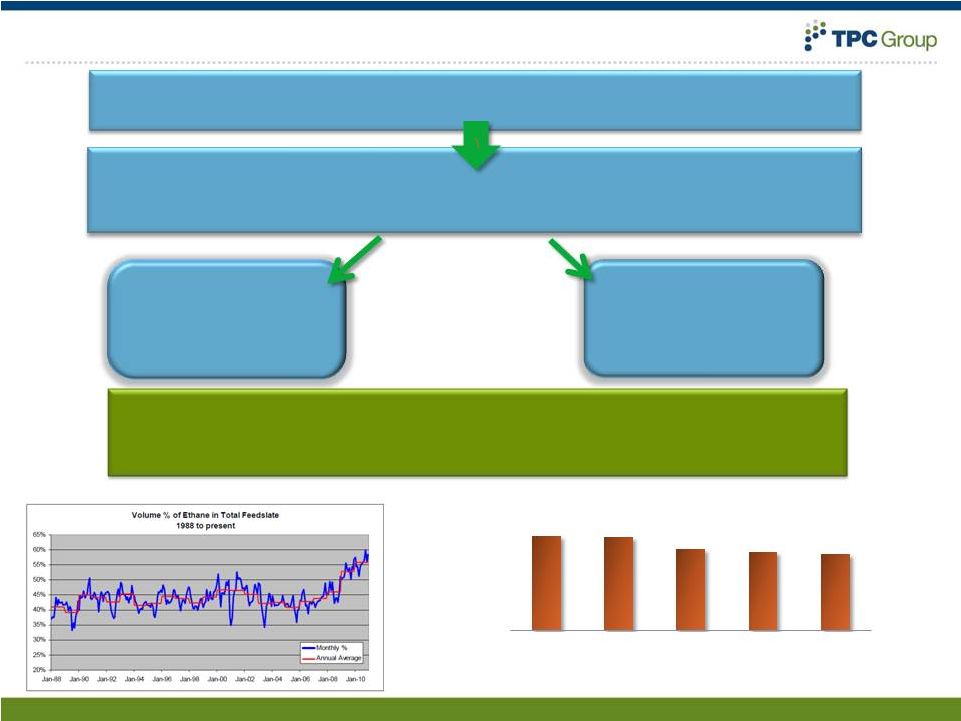 Key
Products in Structurally Short Supply 27
Causing shift from heavier (e.g. Naptha) to lighter (e.g. Ethane)
Ethylene Cracker Feedstocks
NA Ethylene Industry
now Globally
Competitive
Ethylene Production
now generates less Co-
Products, particularly
Butadiene
Structural shift in cracker feed stocks causing
critical product shortages in face of rising demand
% Ethane in Cracker Feedslate
B/E Ratio
Pounds of Butadiene for every 100 lbs of ethylene
Source: Hodson Report
Source: Hodson Report
Low-cost Ethane from NGLs resulting from Shale Drilling
7.8%
7.7%
6.7%
6.5%
6.2%
2007
2008
2009
2010
2011 ytd |
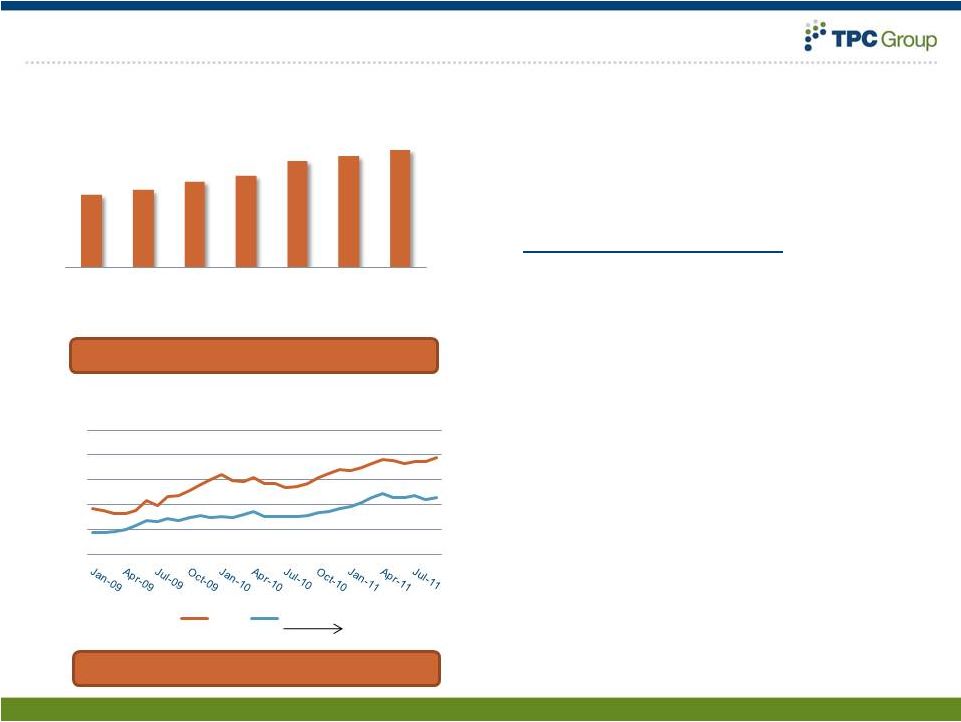 Plentiful Natural Gas Liquids Create Feedstock Advantage
28
‘wet-gas’
plays are favored by drillers
NGL
prices
are
de-coupling
from
crude
oil
Forecast
NGL Market Dynamics:
•
U.S. chemical producers will
maximize favorable NGL’s
•
NGL stream is yielding higher
ethane, butane and propane
•
Butane: a key feedstock for
TPC’s products
Source: Platts, OPIS
22.2
23.6
26.3
28.1
32.7
34.1
36.1
2008
2009
2015
2020
2025
2030
2035
U.S. Natural Gas Plant Liquids
Production
(Million MMcf)
Source: EIA
0.00
50.00
100.00
150.00
200.00
250.00
NGL vs. Crude Oil
¢
/ gal
$ / Barrel |
 Idled
TPC Dehydro Assets: A Perfect Fit 29
Dehydrogenation
Butadiene
Isobutylene
•
Dehydro assets located within TPC’s Houston plant
•
Can convert NGLs into valuable C4 products: butadiene and isobutylene
•
Utilizing
existing
dehydro
assets
greatly
reduces
capital
costs
vs.
greenfield
investment |
 Strategic Initiatives
30 |
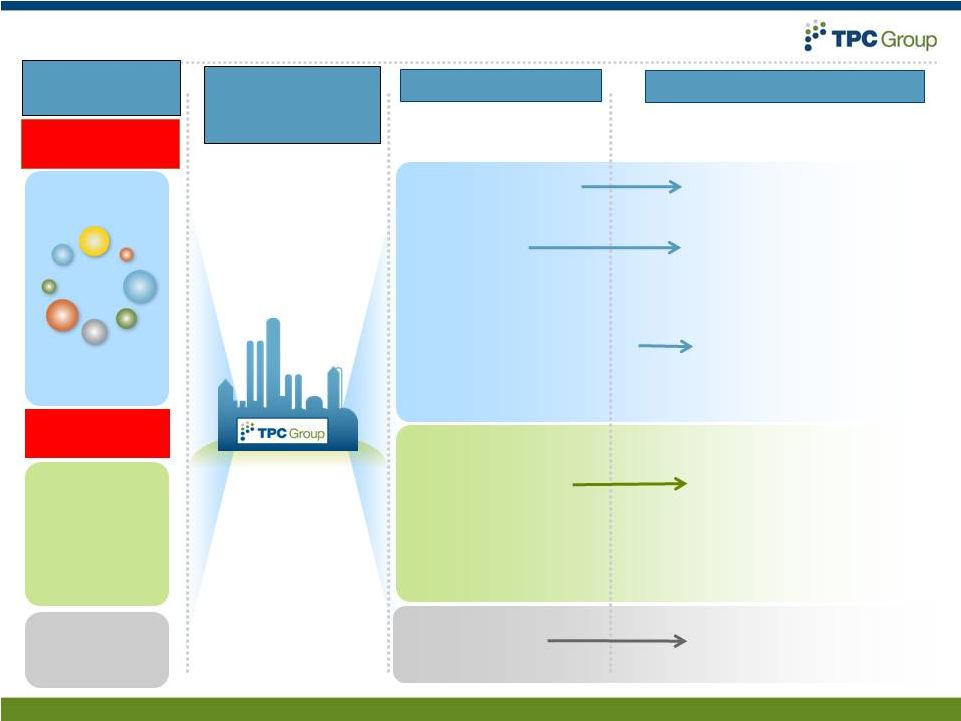
 Strategy Going Forward
Excellent Long-
Term Market
Fundamentals
Idled Assets
and Scalable
Infrastructure
Able to
Be Deployed
Key Products in
Structural Short
Supply
Cost-
Advantaged
Raw Materials
(NGLs) in
Plentiful
Supply
Solve long-term N.A. shortage of
butadiene utilizing idled
dehydro asset, proprietary
technology for on-purpose
production
Restart other idled dehydro
asset to provide lower-cost,
isobutylene feedstock for
Performance Products
Capitalize on cost-advantaged
NGL feedstocks to integrate
upstream and improve margins
Meet the Growing Demand for
On-Purpose Butadiene and Isobutylene
31 |
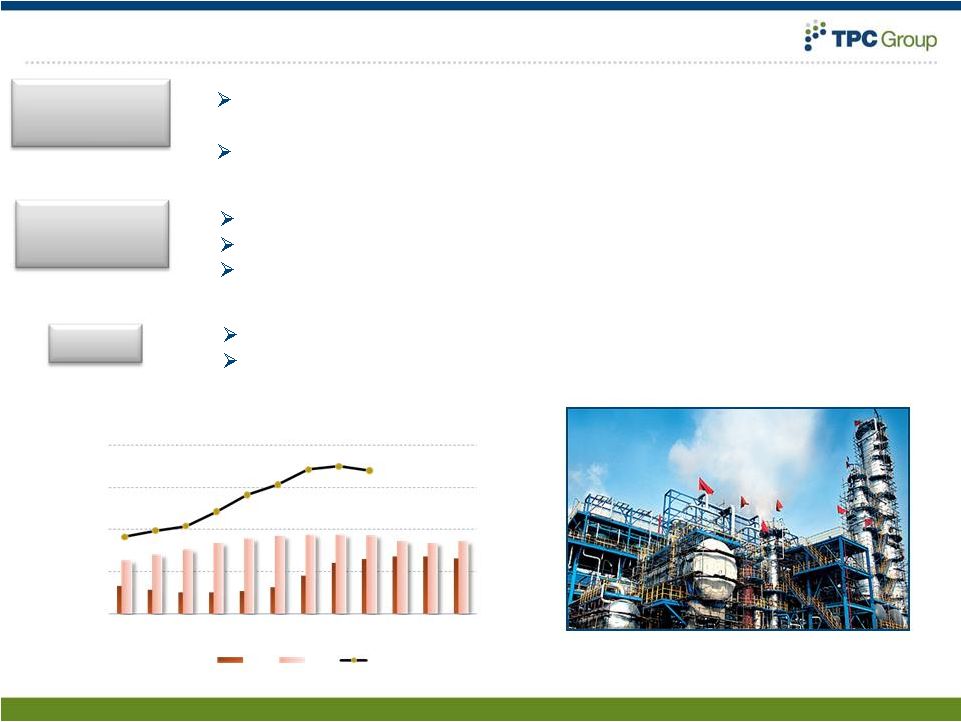 On-Purpose Butadiene Project
32
Restarting idled dehydro unit
Produce on-purpose butadiene from NGLs, capturing full margins
Ensure long-term security of supply of mission-critical product
Detailed engineering study to be completed by Q1 2012
Expected production of 600 million pounds of butadiene
Critical shortage of on-purpose BD facing relative to growing world
demand
Price decoupling between BD and crude oil = unique opportunity
-
50
100
150
200
Jan
Feb
Mar
Apr
May
Jun
Jul
Aug
Sep
Oct
Nov
Dec
2009
2010
2011
U.S. Butadiene Price
Market
Opportunity
Project
Description
Status |
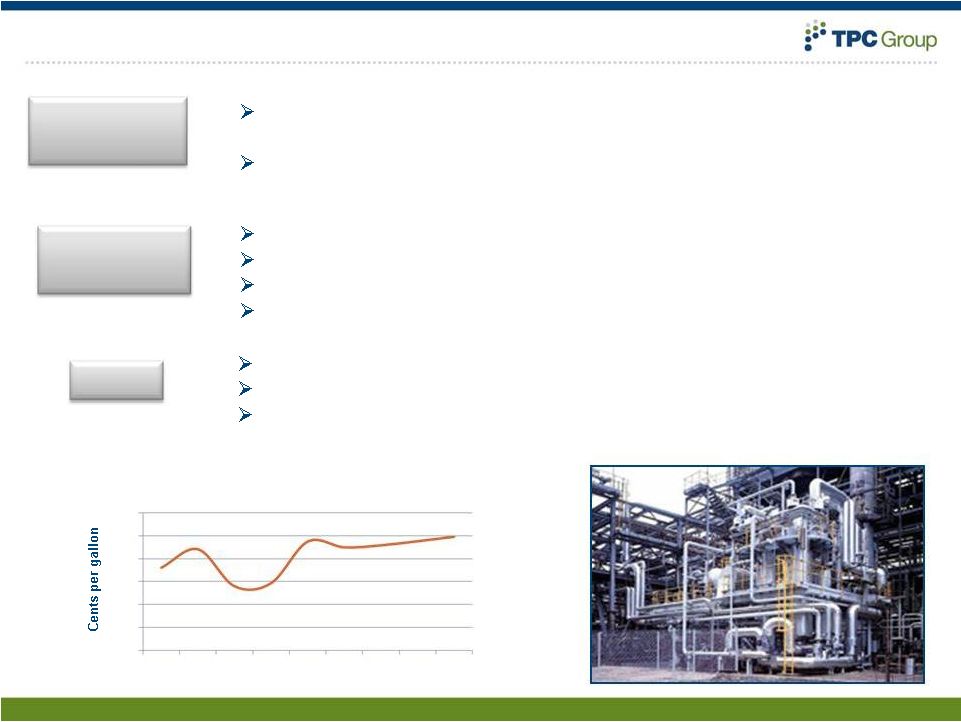 On-Purpose Isobutylene Project
33
Received operating permit
Completed primary engineering study
Proceeding with detailed engineering and initial
construction/refurbishment
Restart other idled dehydro unit
Produce isobutylene from NGLs
Ensure feedstock security for growth
Expand margins through upstream integration
Critical feedstock for Performance Products and Fuels Products
businesses
Currently outsourcing majority of requirements, unable to
capitalize on NGL economics
Source: CDI
0
20
40
60
80
100
120
2007
2008
2009
2010
2011
2012
2013
2014
2015
Unleaded Premium minus i-Butane Spread
Market
Opportunity
Project
Description
Status |
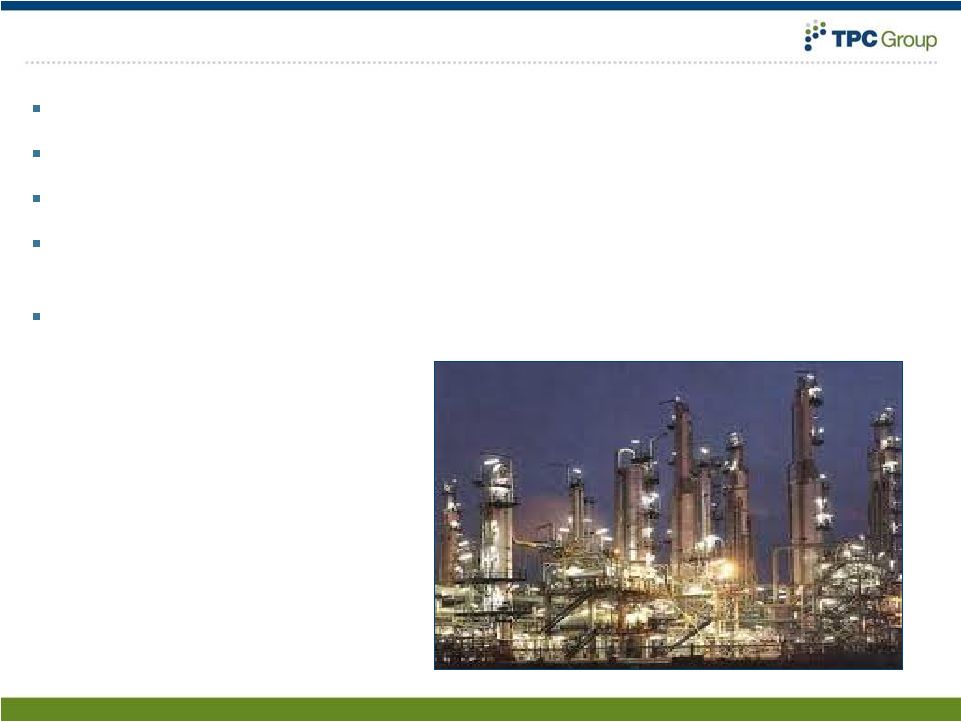 TPC
Group: Offering Strong Sustainable Earnings Growth 34
68 years of C4 expertise and experience
Unique
position
in
C4
industry
–
assets,
infrastructure,
location
Focus on operational excellence, performance culture
Well-positioned to capitalize on “game-changing”
growth
opportunities to enhance shareholder value
Experienced, disciplined management team |
 Financials
35
Appendix |
 2011
Capex Guidance (in millions)
2011 Base maintenance
$ 15
2011 New Lab
7
2011 Discretionary ROI
8
Engineering for Dehydro 1
5
2011 Capex Plan
$ 35
Potential Projects
Low Range
High Range
Dehydro 1 add’t spend
0
-
10
Dehydro 2 engineering
0
-
5
Total
$ 35
-
$ 50
Consistent through next few years
Improving infrastructure
Execute and replenish
Take advantage of NGL economics
36 |
 SEC
Disclosure Information ADJUSTED
EBITDA
–
REVISION
OF
PREVIOUSLY
REPORTED
AMOUNTS
37
6/30/2011
3/31/2011
12/31/2010
9/30/2010
6/30/2010
Adjusted EBITDA - as previously reported ($mm)
C4 Processing
15.7
$
23.8
$
26.1
$
Performance Products
9.2
14.6
17.2
Corporate
(5.9)
(5.3)
(7.8)
Total
19.0
$
33.1
$
35.5
$
Adjusted EBITDA - current definition ($mm)
C4 Processing
66.9
$
30.6
$
15.7
$
23.8
$
26.1
$
Performance Products
12.0
11.6
9.2
14.6
17.2
Corporate
(7.9)
(6.7)
(6.2)
(5.6)
(7.2)
Total
71.0
$
35.5
$
18.7
$
32.8
$
36.1
$
(Unaudited, in millions)
Quarter Ended
We calculate Adjusted EBITDA as earnings before interest, taxes, depreciation and amortization
(EBITDA), which is then adjusted to remove or add back certain items. These items are
identified below in the reconciliation of Adjusted EBITDA to Net Income (Loss) on Slide 39. Net Income (Loss) is the GAAP measure most
directly comparable to Adjusted EBITDA. As indicated in the table below, during the first quarter of
2011 we revised previously reported Adjusted EBITDA to no longer remove the effect of
non-cash stock-based compensation and unrealized gains and losses on derivative financial instruments, because they are recurring in
nature. Our calculation of Adjusted EBITDA may be different from the calculation used by other
companies; therefore, it may not be comparable to other companies. |
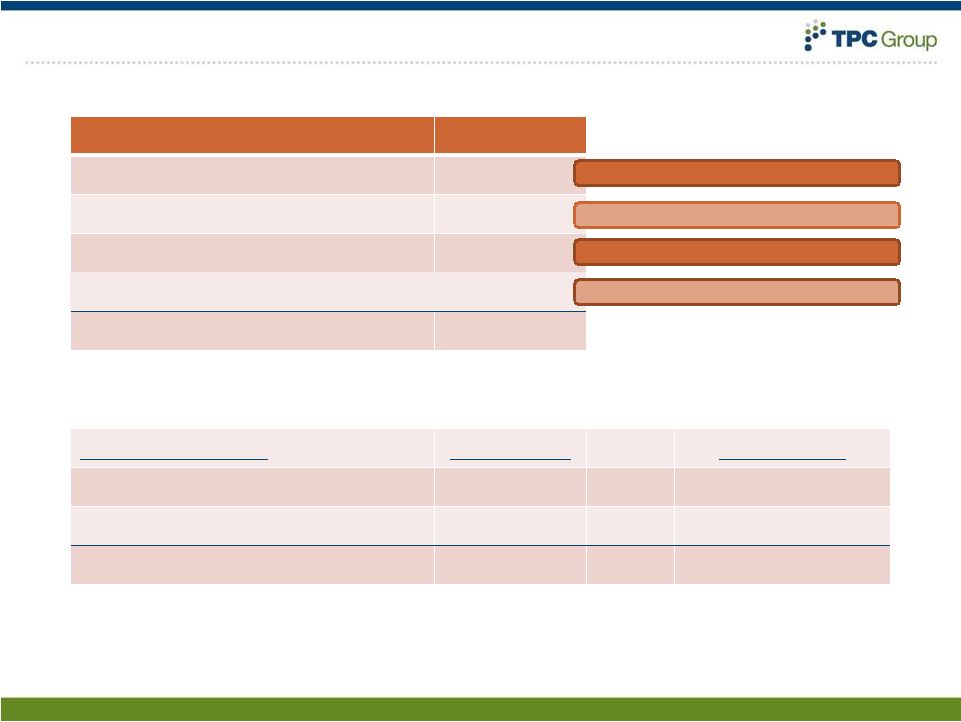
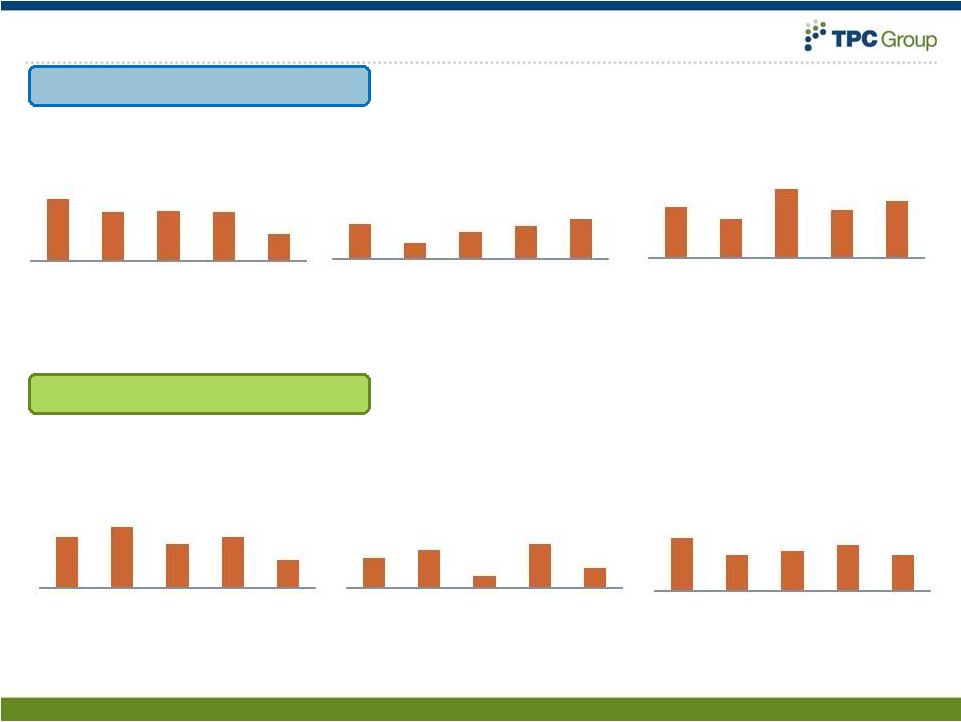 Financial Historical Trends
38
Volume, in thousands
Op. Margin, in thousands
Gross Profit %
Crude C4 Processing
Volume, in thousands
Op. Margin, in thousands
Gross Profit %
Performance Products
12.3%
9.3%
16.8%
11.7%
13.8%
2007
2008
2009
2010
2011 YTD
as of
6/30/11
25.5%
17.2%
19.3%
22.4%
17.4%
2007
2008
2009
2010
2011 YTD
as of
6/30/11
85
37
64
80
97
2007
2008
2009
2010
2011 YTD
as of
6/30/11
36
46
13
52
24
2007
2008
2009
2010
2011 YTD
as of
6/30/11
2,990
2,367
2,440
2,360
1,272
2007
2008
2009
2010
2011 YTD
as of
6/30/11
620
734
526
614
338
2007
2008
2009
2010
2011 YTD
as of
6/30/11 |
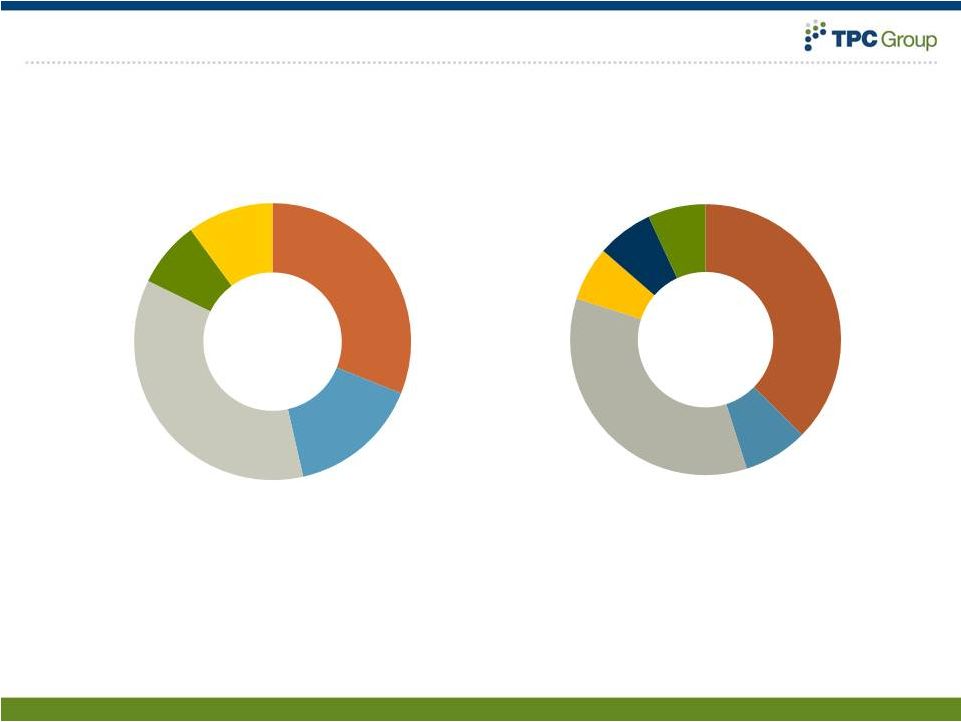 BD
37%
B-1
8%
Raffinates and
Fuels
35%
PIB
6%
DIB and HPIB
7%
Propylene
Derivatives
7%
TPC Sales by End-Market and Product
39
Sales by End Market
Sales by Product
Source: TPCG internal est
Synthetic Rubber
31%
Plastics
15%
Fuels
36%
Lube & Fuel
Additives
8%
Other
10% |
 40
Selected Market Data
6/30/2011
3/31/2011
12/31/2010
9/30/2010
6/30/2010
End of Qtr BD Contract Price ($/lb) (1)
1.53
1.04
0.86
0.93
0.92
Unleaded
Gasoline
Qtr
Avg
-
USGC
($/gal) (2)
3.07
2.61
2.18
2.00
2.11
US Ethylene Industry Capacity Utilization (%) (3)
89.1
92.5
88.0
92.3
87.6
US BD Production (mm lbs) (3)
795
833
813
838
820
(1) Source: CMAI
(2) Source: Platts
(3) Source: Hodson
Quarter Ended |
 41
Selected Financial Data
6/30/2011
3/31/2011
12/31/2010
9/30/2010
6/30/2010
Sales Volumes (mm lbs) (1)
859.8
750.7
738.2
748.7
802.7
Sales Revenue ($mm)
792.9
555.6
486.1
499.4
531.8
Adjusted EBITDA ($mm)
C4 Processing
66.9
30.6
15.7
23.8
26.2
Performance Products
12.0
11.6
9.2
14.6
17.2
Corporate
(7.9)
(6.7)
(6.2)
(5.6)
(7.3)
Adjusted EBITDA (2)
71.0
35.5
18.7
32.8
36.1
Adjusted EBITDA per pound
0.08
0.05
0.03
0.04
0.04
Operating Segment Adjusted EBITDA per pound (3)
0.09
0.06
0.03
0.05
0.05
Quarter Ended
(Unaudited)
(1) Does not include tolling volume.
(2) Adjusted EBITDA as set by current definition.
(3) Adjusted EBITDA for the C4 Processing and Performance
Products operating segments - i.e. total Adjusted EBITDA less Corporate. |
 42
6/30/2011
3/31/2011
12/31/2010
9/30/2010
6/30/2010
Net income (loss)
34.3
$
11.4
$
(0.7)
$
12.8
$
14.4
$
Income tax expense (benefit)
17.7
5.7
(1.6)
6.9
7.9
Interest expense, net
8.6
8.4
11.1
3.2
4.0
Depreciation and amortization
10.4
10.0
9.9
9.9
9.8
Adjusted EBITDA
71.0
$
35.5
$
18.7
$
32.8
$
36.1
$
Quarter Ended
(Unaudited, in millions)
Reconciliation of Adjusted EBITDA to Net Income
(*) Adjusted EBITDA is presented and discussed herein because management believes it enhances
understanding by investors and lenders of the Company’s financial performance.
Adjusted EBITDA is not a measure computed in accordance with GAAP. Accordingly it does not
represent cash flow from operations, nor is it intended to be presented herein as a substitute
for operating income or net income as indicators of the Company’s operating performance. Adjusted EBITDA is the primary performance measurement used by senior
management and our Board of Directors to evaluate operating results of, and to allocate capital
resources between, our business segments. We calculate Adjusted EBITDA as earnings
before interest, taxes, depreciation and amortization (EBITDA), which is then adjusted to remove or add back certain items. The items removed or added back have
historically consisted of items we consider to be non-recurring in nature and which we believe
distort comparability between periods. There were no such items identified in the
Reconciliations of Adjusted EBITDA to Net Income for the periods presented above. Our calculation of
Adjusted EBITDA may be different from calculations used by other companies; therefore, it may
not be comparable to other companies. |