Attached files
| file | filename |
|---|---|
| 8-K - FORM 8-K - STRATEGIC HOTELS & RESORTS, INC | d235550d8k.htm |
 fa
Investor Day Presentation
October 4
th
, 2011
Exhibit 99.1 |
 2
I.
BEE’s Unique Value Proposition
II.
Macroeconomic and Industry Update
III.
Company Overview
IV.
Organic Growth and ROI Opportunities
V.
Balance Sheet Recapitalization
VI.
Financial Results and Guidance
Agenda |
 3
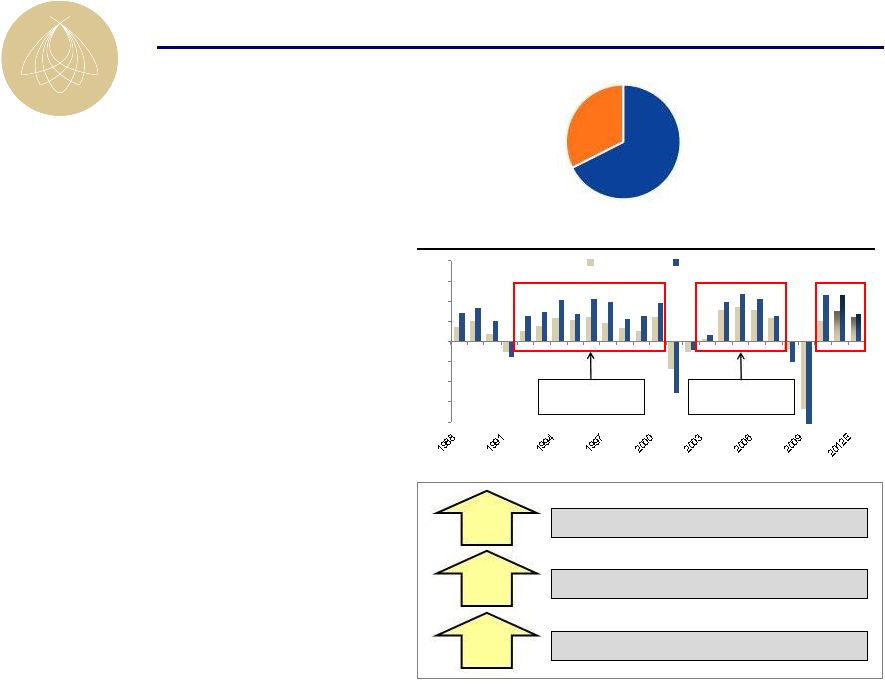
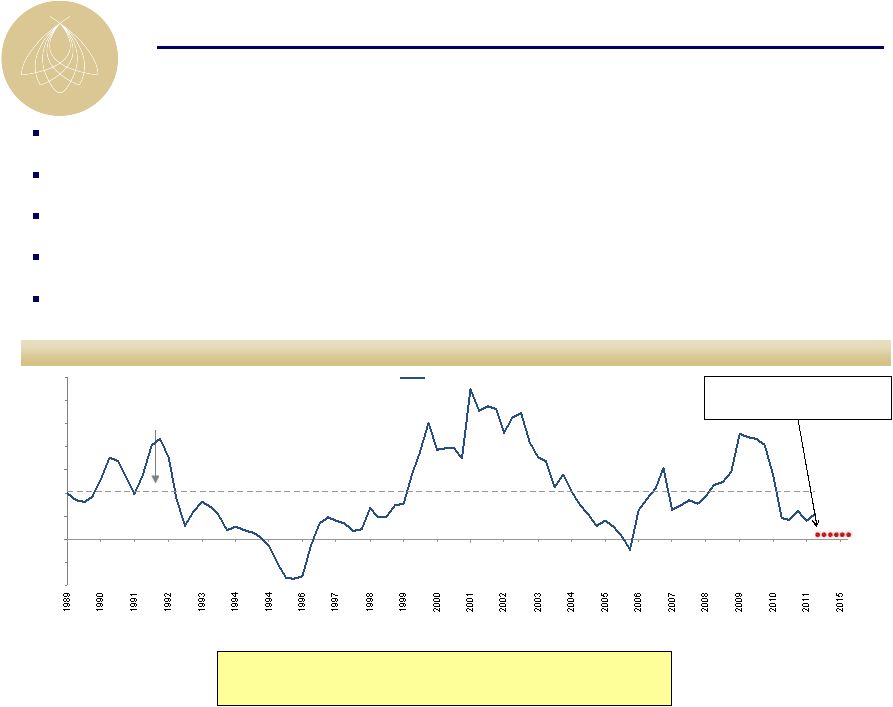
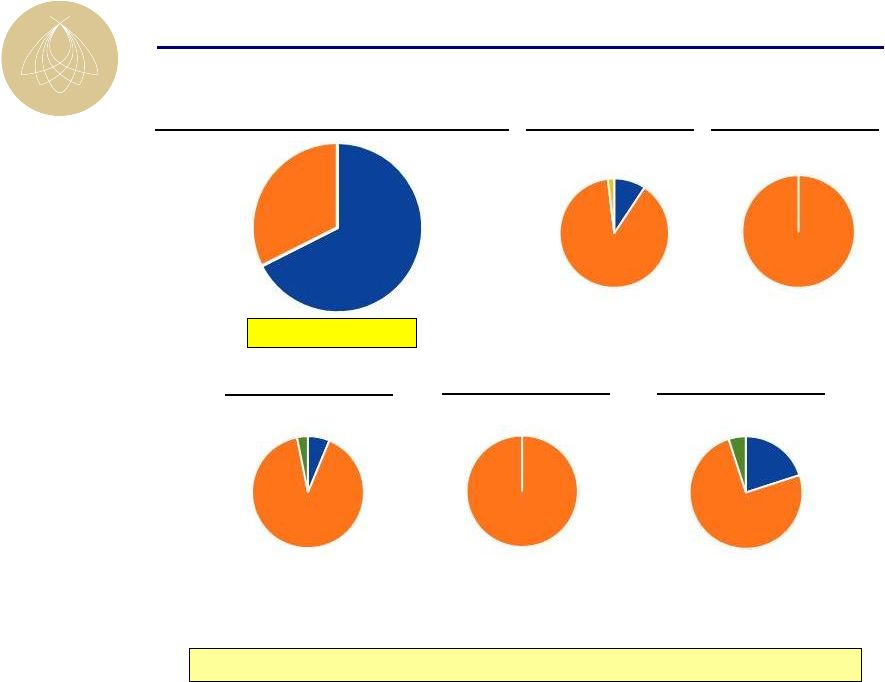
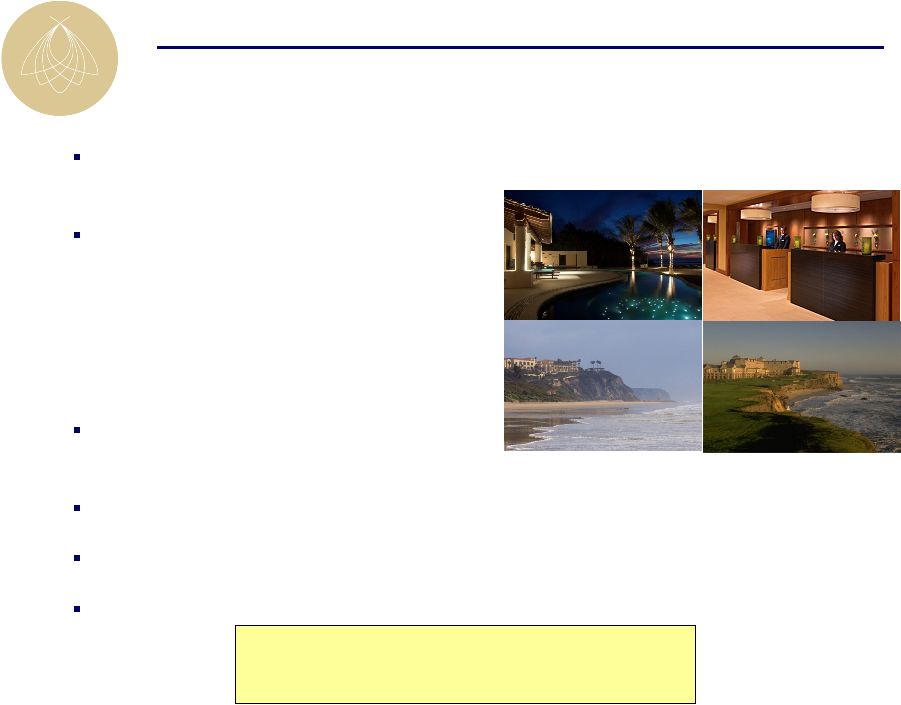
Luxury
68%
Upper-
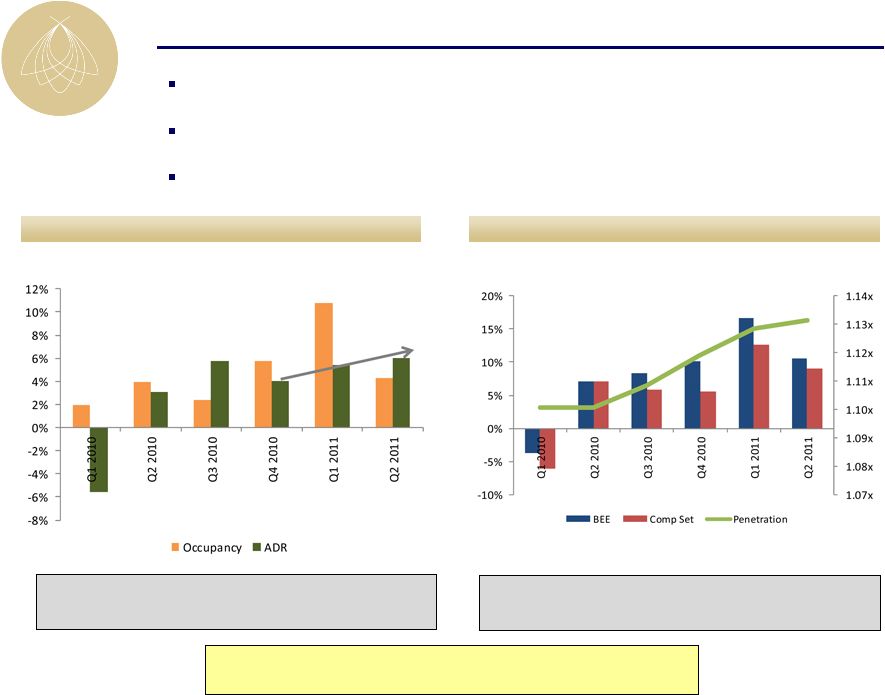
upscale
32%
BEE’s Unique Value Proposition
2010 RevPAR penetration
Q2 EBITDA Margin Expansion
2010 EBITDA growth / RevPAR Growth
Industry
leading
asset management expertise
The only 100% pure play
high-end lodging REIT
High-end outperforms
the industry in a recovery
-20%
-15%
-10%
-5%
0%
5%
10%
15%
20%
Total U.S.
Luxury
Luxury vs. Total U.S. Lodging Demand
8.5% Luxury
RevPAR CAGR
8.2% Luxury
RevPAR CAGR
2.6%
309
bps
2.6x |
 4
BEE’s Unique Value Proposition
Deferred
CapEx
Assets are in pristine
condition
>$30M of identified
ROI capital projects
Assets offer significant ROI
opportunities
$125
$150
$175
$200
$0
$50
$100
$150
$200
2007
2008
2009
2010
2011F
EBITDA
RevPAR
-27% from peak
EBITDA
Peak-to-Trough RevPAR and EBITDA Decline
EBITDA
RevPAR
Embedded organic growth
limits need for external growth
|
 5
BEE’s Unique Value Proposition
Balance sheet well positioned for
growth but prepared for volatility
$0.0
$100.0
$200.0
$300.0
$400.0
$500.0
2011
2012
2013
2014
2015
2016
2017
2018
2019
2020
2021
>$400M of liquidity
Debt Maturity Schedule & Liquidity
The best investment proposition in the
lodging space
Historically low supply
growth environment
(4%)
(2%)
0%
2%
4%
6%
8%
10%
12%
14%
YoY % supply growth
Supply Growth in
BEE Markets = 0.2%
Luxury Supply Growth
Replacement cost ~$700,000 per key
(excluding land)
Replacement Cost vs. Trading Value per Key
$700,000
$356,000
$0
$200,000
$400,000
$600,000
$800,000
Replacement Cost
Trading Value
(1)
(1) Reflects stock price as of 9/30/2011 of $4.31 |
 6
I.
BEE’s Unique Value Proposition
II.
Macroeconomic and Industry Update
Agenda |
 7
European sovereign debt crisis remains a catalyst for market volatility
Unemployment remains stubbornly high but persists primarily within those without a
college education Unemployment rate by education level
Macroeconomic Outlook
Primary BEE
customer
demographic
Unemployment rate for primary BEE customer demographic
only 4.4%; only 2.3% points above historical norm
Source: Bureau of Labor Statistics
2.3 % points |
 8
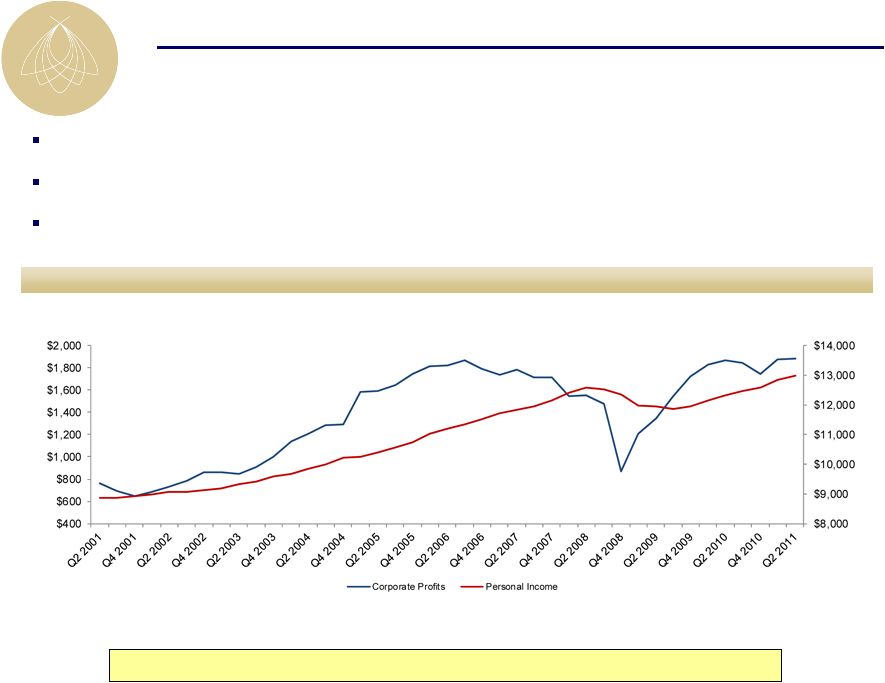
Corporate profits and personal income
GDP outlook is uncertain but corporate profits and personal income are at an
all-time high Corporate balance sheets are generally in good
condition Corporate
cash
balances
are
at
the
highest
level
since
1963
(1)
Macroeconomic Outlook
Corporate Profits
in billions
Personal Income
in billions
Corporate profits and personal income exceed pre-recession peaks
(1) As of the end of June 2011
Source: Federal Reserve and Bureau of Economic Analysis
|
 9
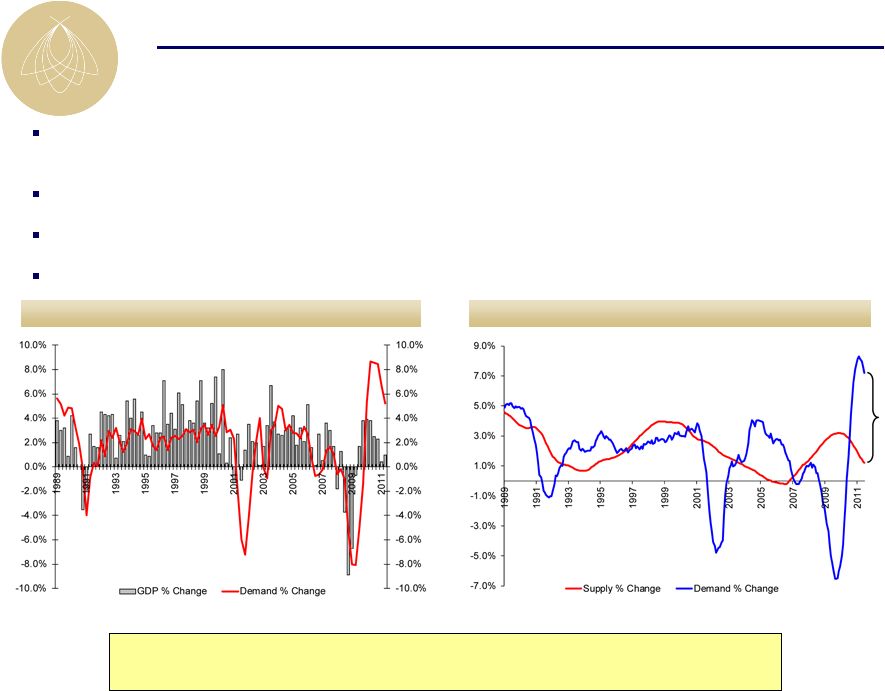
Total U.S. supply and demand change (TTM)
Lodging demand historically correlates with GDP (~80%) but potential exists for
near-term disconnect, particularly at the high-end
To date, little to no indication of a decline in group bookings or an increase in
group cancellations For September, transient demand was up 8% and transient
rate increased 10% Supply growth remains historically low and development
pipeline indicates muted supply going forward GDP and lodging demand change
(TTM) Lodging Outlook
+6.0%
Source: Smith Travel Research
Demand growth exceeds supply growth by 600 bps which could result in
a lower correlation of demand growth to GDP growth in the near-term |
 10
Source: Smith Travel Research
Note: Data represents trends within the United States
Luxury supply growth was lower leading into this downturn than past downturns and remains
minimal Projects in planning or under construction have decreased significantly
Only 0.2% new competitive luxury or upper-upscale supply projected in BEE markets
1-2 years estimated time to permit; 3 years estimated time to build a luxury hotel
New hotel construction economic proposition doubtful with replacement cost estimated at approximately
$700,000 per key
Quarterly luxury supply YoY % change
(4%)
(2%)
0%
2%
4%
6%
8%
10%
12%
14%
YoY % supply growth
1988 –
Q2 2011
Average: 4.1%
Favorable Supply Outlook
Supply Growth in
BEE Markets = 0.2%
Benign supply growth environment and no new
supply growth likely until after 2015
|
 11
Source: Smith Travel Research and PWC
Annual % change in RevPAR
Quarterly luxury room night demand
-20%
-15%
-10%
-5%
0%
5%
10%
15%
20%
Total U.S.
Luxury
Luxury
hotels
have
experienced
prolonged
RevPAR
growth
following
past
industry
downturns
–
1992
–
2000:
9
consecutive
years
of
annual
luxury
RevPAR
growth
totaling
109%
or
8.5%
annually
–
2002
–
2007:
5
consecutive
years
of
annual
luxury
RevPAR
growth
totaling
48%
or
8.2%
annually
Overall luxury room nights sold is at an all-time high; 24% higher than
2007 Luxury Hotels Outperform in a Recovery
Most luxury room
nights ever sold
Luxury
Outperformance:
2.2% CAGR
Luxury
Outperformance
: 4.1% CAGR
Luxury outperformed Total U.S. 2.0% -
4.0% in previous two downturns
Source: Smith Travel Research
24%
New luxury supply has been fully absorbed
Luxury room night demand currently at all-
time high |
 12
I.
BEE’s Unique Value Proposition
II.
Macroeconomic and Industry Update
III.
Company Overview
Agenda |
 13
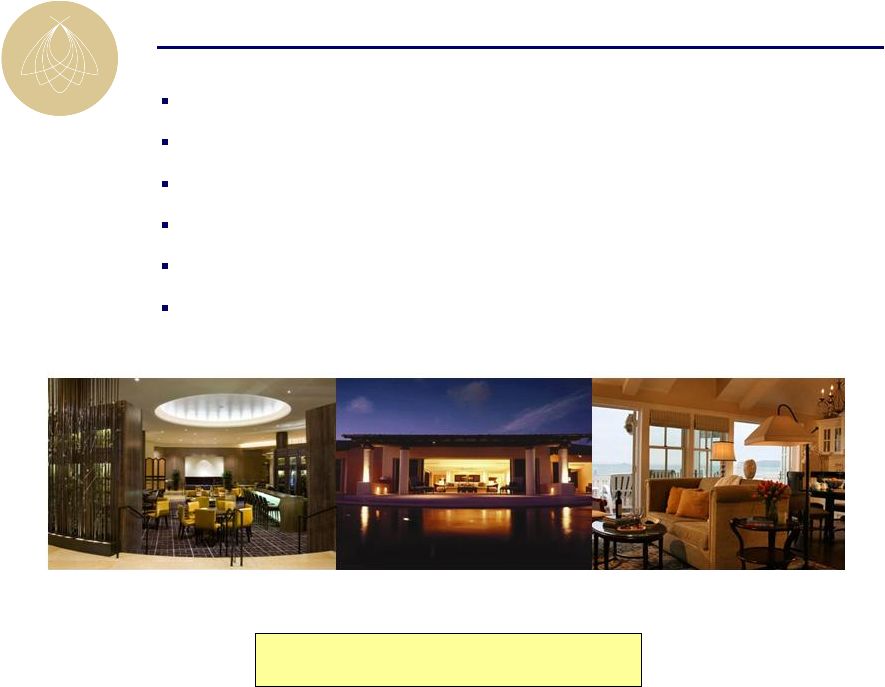
World-class luxury hotels supported by unique real estate value
Investment acumen and discipline
Industry leading asset management capabilities
Brand leadership experience
Value creating hotel management contract renegotiation expertise
Depth and breadth of long-term relationships throughout the hotel industry
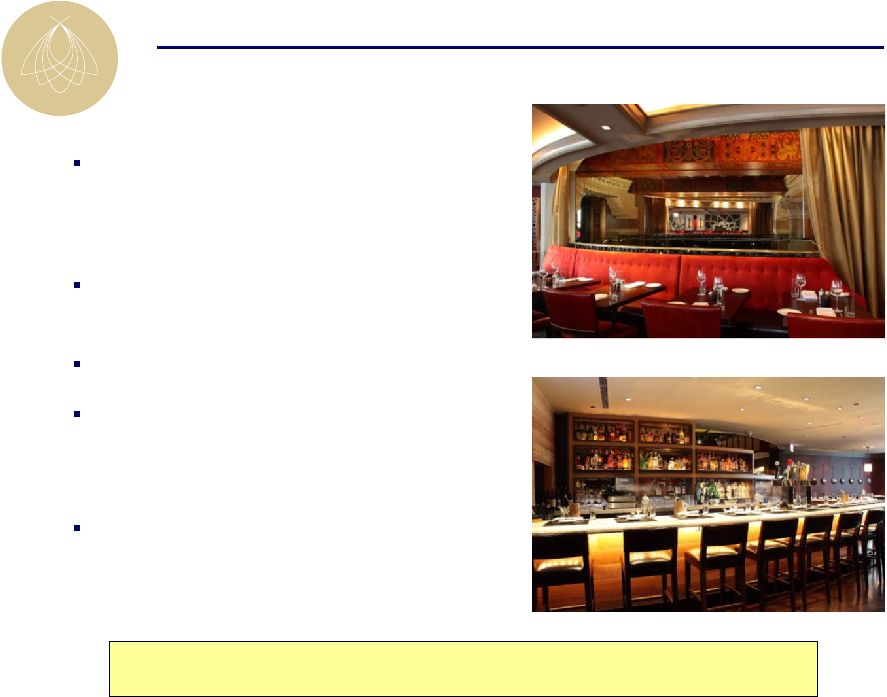
BEE Core Competencies
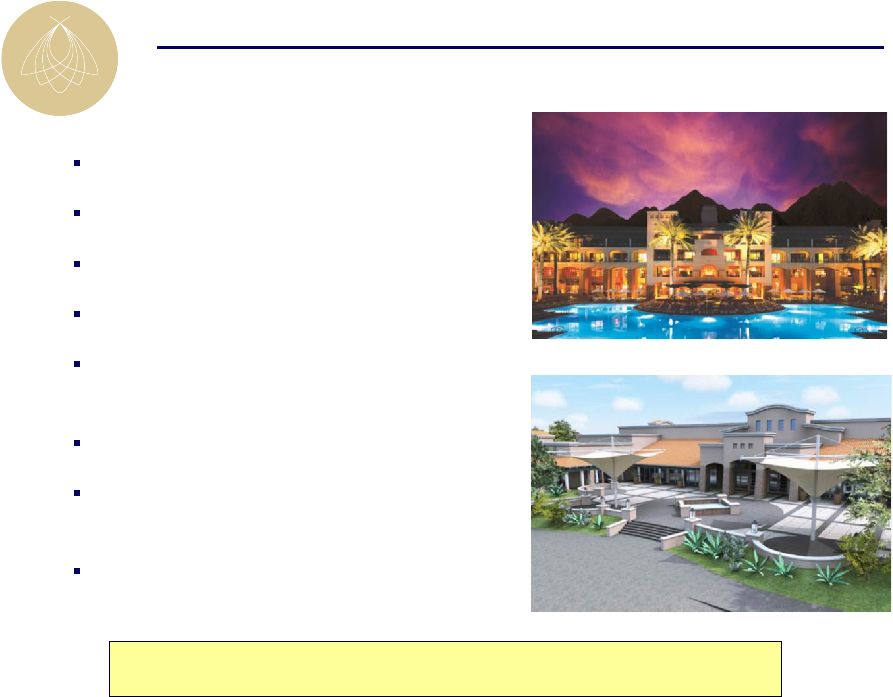
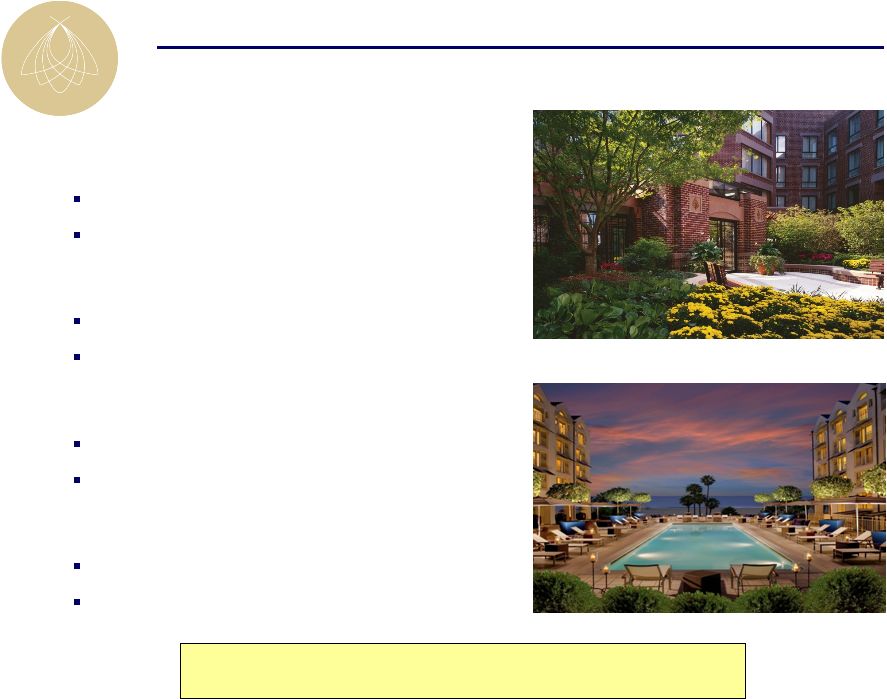
Fairmont Chicago
Lobby and ENO Wine Bar
Four Seasons Punta Mita
Coral Suite
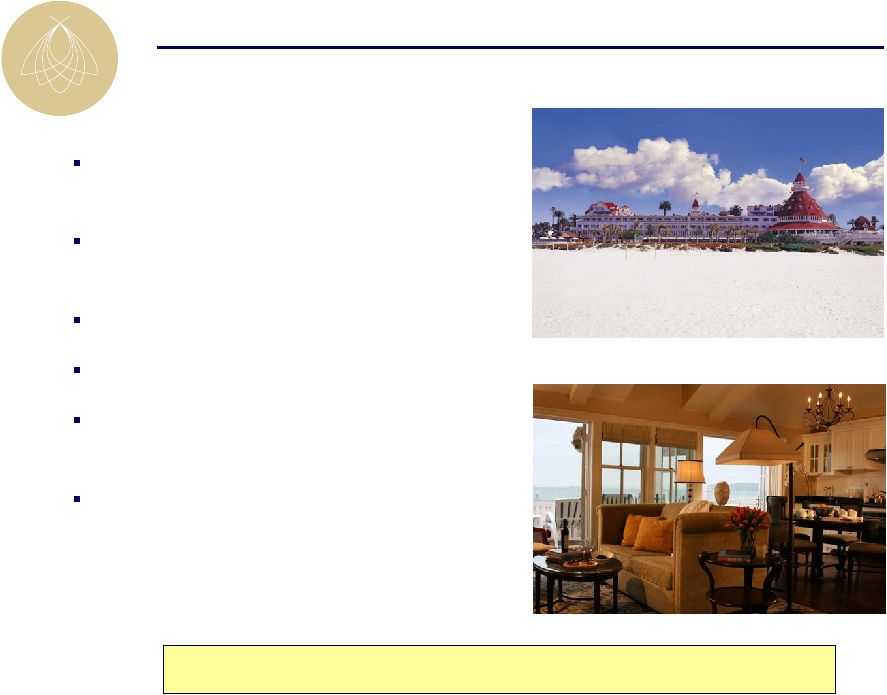
Hotel del Coronado
Beach Village
Nobody does luxury better |
 14
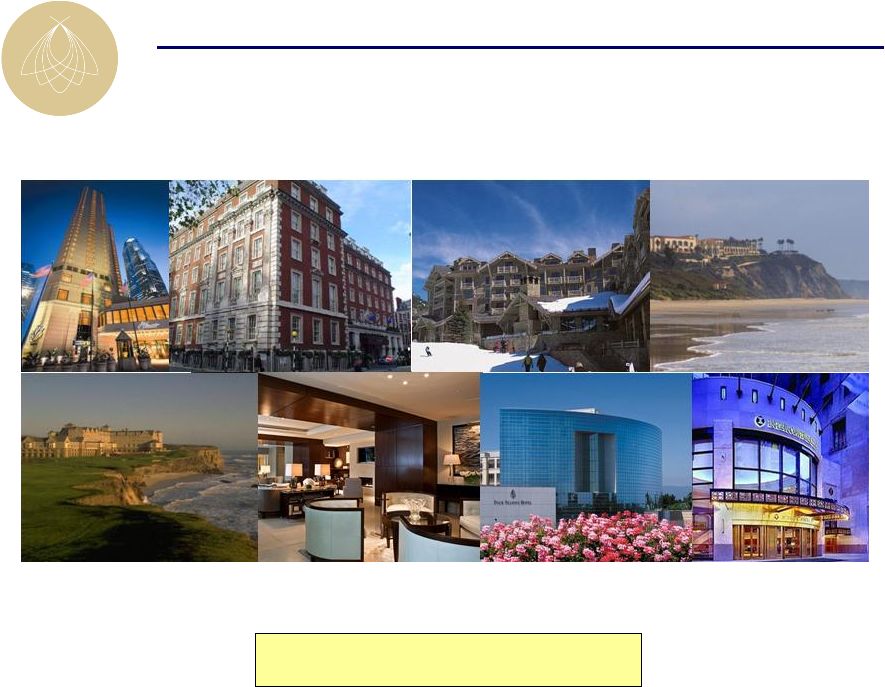
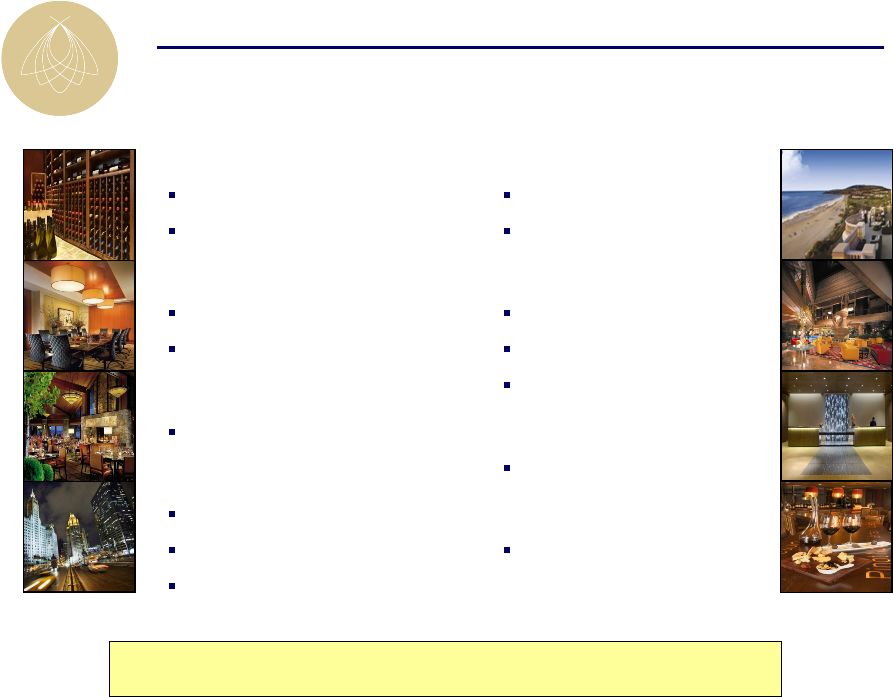
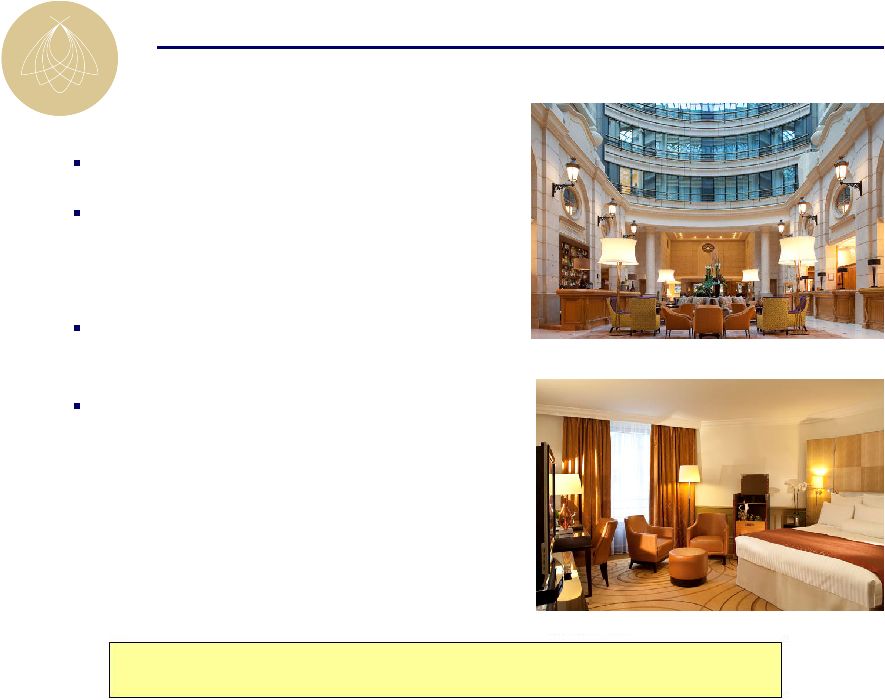
Unique and Irreplaceable Hotel Portfolio
Fairmont Chicago
Marriott Grosvenor Square
Four Seasons Jackson Hole
Ritz-Carlton Laguna Niguel
Ritz-Carlton Half Moon Bay
Four Seasons Washington, D.C.
Four Seasons Silicon Valley
InterContinental Chicago
Nobody owns a portfolio like ours! |
 15
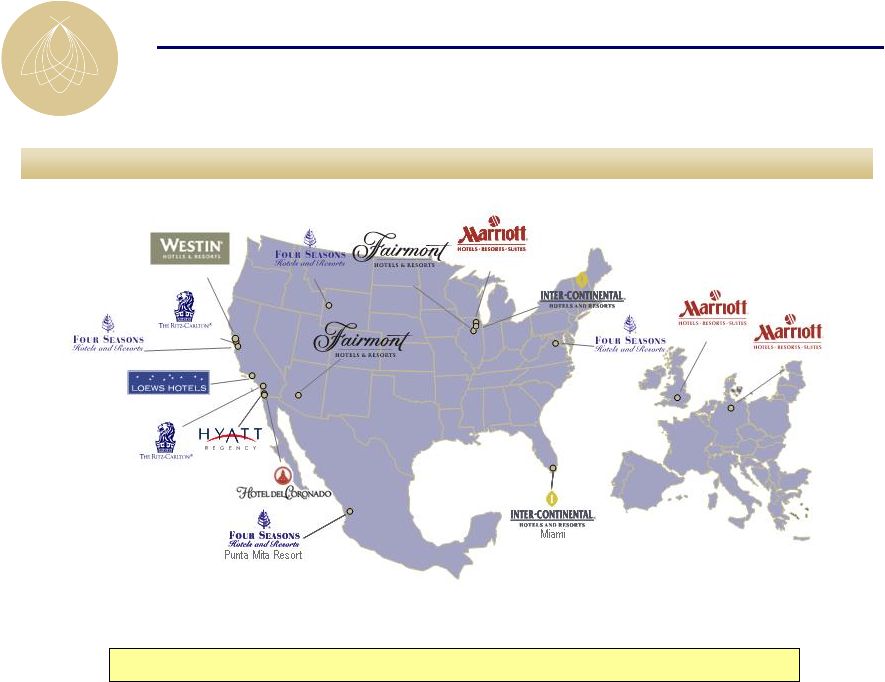
Hamburg, Germany
Chicago
Lincolnshire Resort
Chicago
Santa Monica Beach Hotel
Half Moon
Bay
La Jolla
Washington, D.C.
St. Francis
Laguna Niguel
London, England
Scottsdale
17 hotels and resorts with 7,762 rooms
Top-Tier Market Exposure
Jackson Hole
Silicon Valley
Assets located in primary gateway cities and high barrier to entry markets
|
 16
High-End Brand Focus
Strategic (BEE)
LaSalle (LHO)
Host (HST)
Sunstone (SHO)
DiamondRock (DRH)
Source: Deutsche Bank
Pebblebrook (PEB)
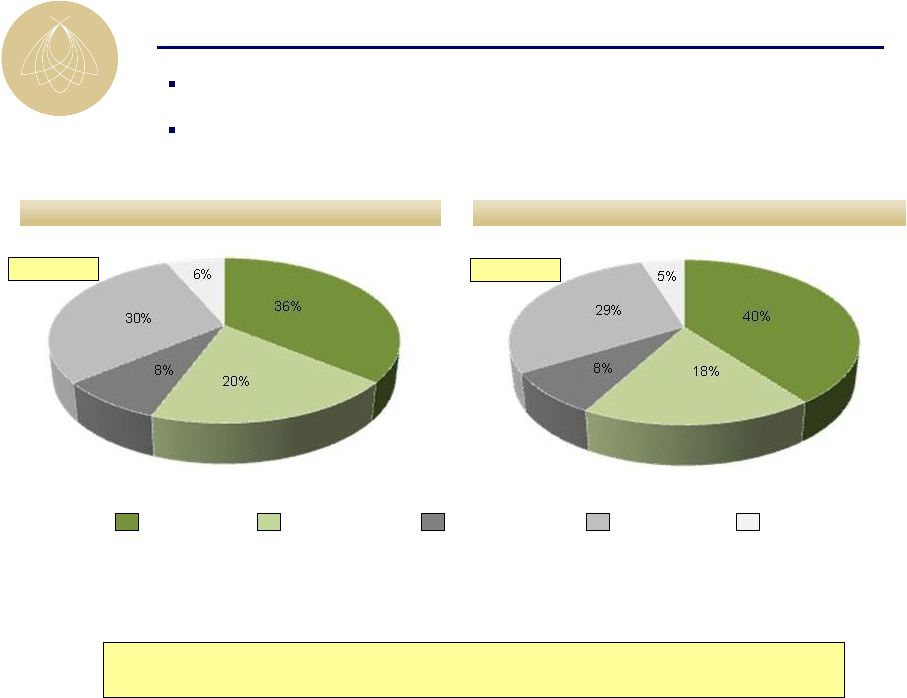
BEE is the only pure play high-end lodging REIT
*
*BEE’s Upper-Upscale assets per Smith Travel Research include:
Hyatt Regency La Jolla, Marriott Lincolnshire, Westin St. Francis, Marriott Grosvenor Square and
Marriott Hamburg 100% High-End
Chain Scale Mix
Luxury
68%
Upper-
upscale
32%
Upper-
upscale
100%
Luxury
6%
Upper-
upscale
91%
Upscale
3%
Upper-
upscale
100%
Luxury
20%
Upper-
upscale
75%
Upscale
5%
Below
Upscale
2%
Luxury
9%
Upper-
upscale
89% |
 17
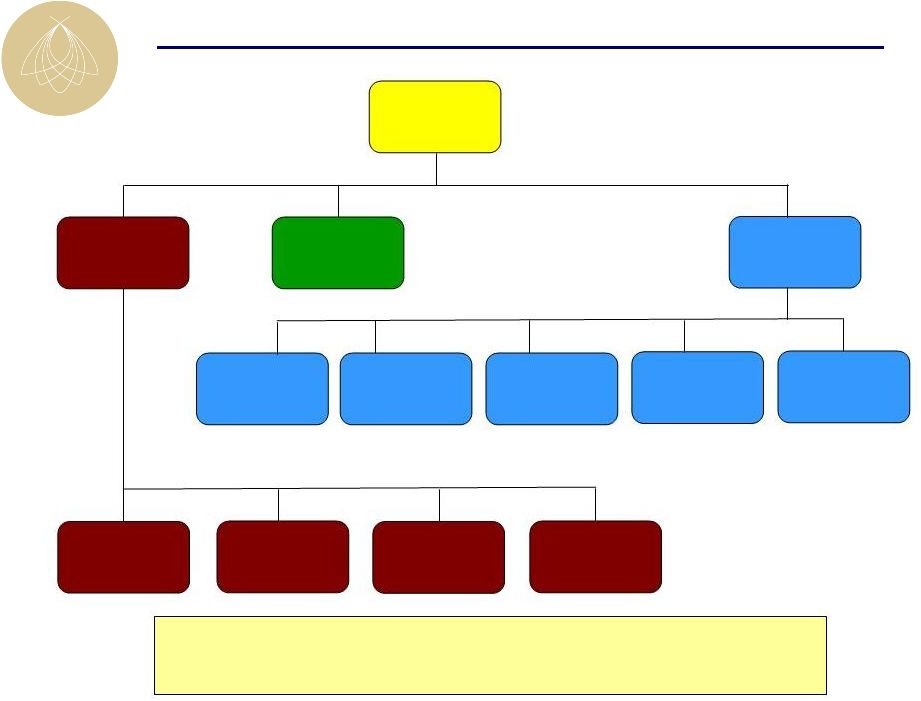
BEE Organizational Chart
Laurence Geller
President & CEO
Richard Moreau
EVP, Chief
Operating Officer
Diane Morefield
EVP, Chief Financial
Officer
Eric Hassberger
VP, Capital Markets
Bob McAllister
SVP, Tax
Jon Stanner
VP, Capital Markets
& Treasurer
Paula Maggio
SVP, General
Counsel
Ken Barrett
VP, Asset
Management
Bob Britt
VP, Asset
Management
Tom Healy
VP, Asset
Management
Dave Hogin
VP, Asset
Management
Cory Warning
VP, Investments
Stephen Briggs
SVP, Chief
Accounting Officer
Experienced hotel brand operators, asset management and investment professionals working tirelessly to maximize profits,
asset values and shareholder value |
 18
Laurence Geller
President & Chief Executive Officer
Prior
to
founding
Strategic
in
1997,
Mr.
Geller
was
Chairman
and
CEO
of
Geller
&
Co., a
gaming,
tourism
and
lodging
advisory
company
he
founded
in
1989.
Previously,
Mr.
Geller
held positions as EVP and COO of Hyatt Development Corporation, SVP of Holiday Inn
and Director of London’s Grand Metropolitan Hotels. Mr. Geller
has over 40 years of experience in
the
lodging
industry
and
has
received
numerous
awards
for
his
service
to
the
lodging
industry.
Richard Moreau
Executive Vice President, Chief Operating Officer
Mr. Moreau is responsible for the asset management of all Strategic’s
properties. Mr. Moreau has been in the hospitality industry for over
30 years in both property and multi-unit operation positions.
From
1992
until
he
joined
Strategic
in
November
1997,
Mr.
Moreau
was
a
principal
in Gremor Hospitality, a hotel asset management company. From 1988 until 1992, he
was a principal and Executive Vice President at Inn America Corporation, an
independent hotel management company.
Executive Management Team
Paula Maggio
Senior Vice President, Secretary and General Counsel
Ms. Maggio has been responsible for oversight of the company’s legal affairs
since 2004. Ms.
Maggio
played
a
critical
role
in
the
company’s
initial
public
offering
in
2004
and has
subsequently
executed
a
number
of
significant
transactions
for
the
company.
Prior
to
joining
Strategic in 2000, Ms. Maggio practiced law in private practice.
Diane Morefield
Executive Vice President, Chief Financial Officer
Prior to joining Strategic, Ms. Morefield served as chief financial officer of
Equity International, a privately-held investment company focused
exclusively on real estate related businesses operating outside of the
United States. From 1997 to 2006, Ms. Morefield was employed by Equity
Office Properties Trust (NYSE: EOP) (“EOP”), the largest publicly-traded office REIT
and owner of office buildings in the United States. Prior to EOP, Ms.
Morefield held senior positions at Deloitte and Barclays Bank.
|
 19
Kenneth Barrett
Vice President, Asset Management
Ken Barrett has held the position of Vice President, Asset Management since 2005.
Mr. Barrett's current and past portfolios have included most major brands:
Fairmont, Four Seasons, Hilton, Hyatt, Loews, Marriott and Embassy Suites.
Prior to joining Strategic, he served in property and corporate financial
roles, including Controller, Regional Controller and Director of Finance
Americas for Interstate Hotels and Resorts and InterContinental Hotels and
Resorts. Thomas Healy
Vice President, Asset Management
Thomas Healy has held the position of Vice President, Asset Management since 2006.
Mr. Healy’s current and past portfolios have included most major
brands: Four Seasons, Fairmont, Marriott, Intercontinental, Hyatt, and
Loews. Prior to joining Strategic, he served in several roles for
Starwood and Hyatt Hotels & Resorts. His most recent prior responsibilities
included
several
roles
for
Starwood
Hotels
as
Senior
Director
of
Development,
General
Manager for Westin Hotels & Resorts and General Manager for Sheraton Hotels.
Asset Management Team
David Hogin
Vice President, Asset Management
David Hogin holds the position of Vice President of Asset Management. Mr.
Hogin's current and past portfolios have included most major brands: Four
Seasons, Ritz-Carlton, Fairmont, Hyatt, InterContinental and Marriott.
Mr. Hogin is backed by eighteen years of hotel management experience,
having risen through the ranks in rooms operations with multiple branded
and independent flags. Prior to joining Strategic, he served in various property
operating roles, including General Manager, Hotel Manager and Director of Six
Sigma. |
 20
I.
BEE’s Unique Value Proposition
II.
Macroeconomic and Industry Update
III.
Company Overview
IV.
Organic Growth and ROI Opportunities
Agenda |
 21
Market share growth and revenue enhancement through market research based
programs
Exceptional asset management supported by internally developed operating
systems Aggressive and early cost cutting initiatives implemented in advance
of the 2008 / 2009 recession
Proactively maintaining fixed cost reduction at hotels during recovery phase
Rigorous oversight of brand managers to ensure alignment of interests
Evaluation and implementation of value add ROI projects; constant pipeline
Industry Leading Asset Management Capabilities
We are the industry standard for “best in class” asset management |
 22
EBITDA Growth to RevPAR Growth Ratio
Non –Rooms Revenue Per Available Room
RevPAR
ADR
Note: All metrics represent full-year 2010 results
BEE portfolio reflects Same Store North American portfolio as of 12/31/2010.
Source: Public filings
BEE Positioning Compared to Peers
BEE delivers industry leading results
BEE
BEE
BEE
BEE
$220
$183
$171
$155
$149
$0
$50
$100
$150
$200
$250
LHO
HST
DRH
SHO
$150
$137
$120
$109
$104
$0
$50
$100
$150
LHO
HST
DRH
SHO
$137
$72
$72
$59
$45
$0
$40
$80
$120
$160
LHO
HST
DRH
SHO
2.6x
2.1x
2.0x
1.0x
0.6x
0.0x
0.5x
1.0x
1.5x
2.0x
2.5x
3.0x
DRH
SHO
HST
LHO |
 23
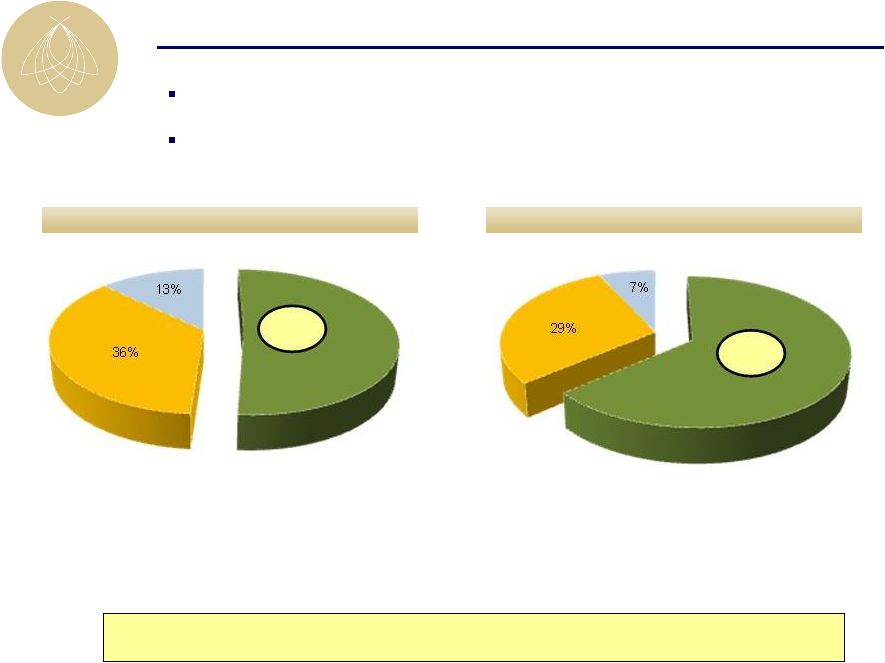
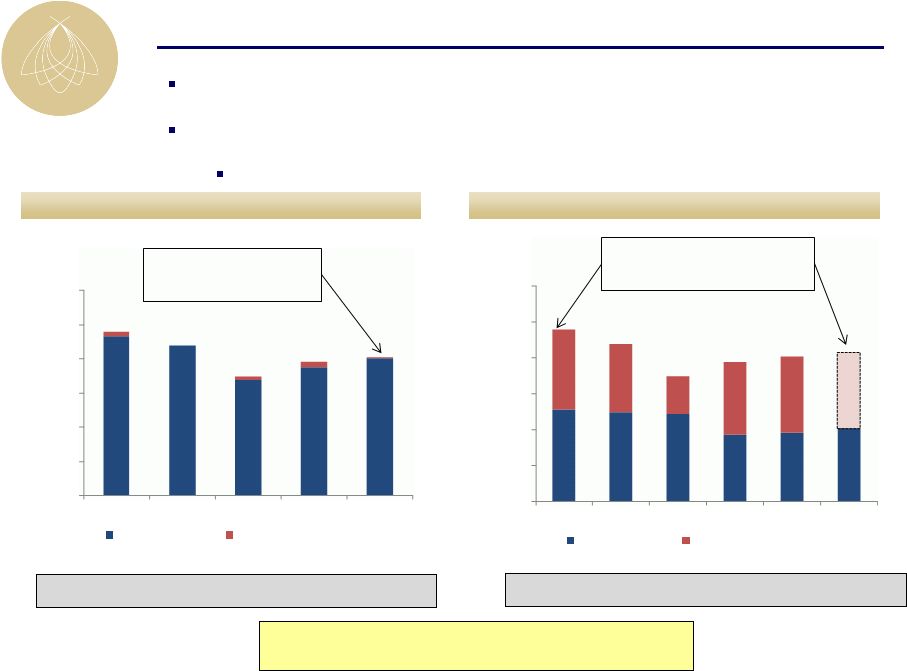
BEE Business Mix Compared to Peers
BEE revenue driven more heavily by non-rooms revenue relative to peers,
maximizing yield per square foot from our hotels
Rooms
64%
Food & Beverage
Other
BEE Total Revenue Mix
Peers Total Revenue Mix
BEE Total RevPAR is key top-line performance metric
BEE focus on maximizing yield per square foot
Rooms
51%
Food & Beverage
Other
Note: All metrics represent full-year 2010 results
Source: Public filings |
 24
BEE Revenue Mix
Transient - Other
Transient - Negotiated
Group - Association
Group - Corporate
Group - Other
44% Group
42% Group
56% Transient
58% Transient
Note: Statistics are for the full year 2010
BEE Occupied Room Nights Mix
BEE Room Revenue Mix
Targeted mix of business ~50%/50% group/transient
Group business typically yields higher non-rooms revenue than transient
business BEE total revenue driven heavily by group business and ancillary group spend;
still significant capacity to grow group business |
 25
Industry Leading Operating Margins
(1) Portfolio includes all North American hotels owned for the full year
2010 Peers include: HST, LHO, SHO, & DRH
Source: Public filings
4% better than peers
BEE
(1)
Peers
Peer margins
@ BEE
Revenue Mix
Average Daily Rate
$230
$167
Revenue
Rooms
51%
64%
51%
Food & Beverage
36%
29%
36%
Other
13%
7%
13%
Total
100%
100%
100%
Departmental Profit Margin
Rooms
71%
73%
73%
Food & Beverage
30%
26%
26%
EBITDA
20%
23%
16%
BEE’s margins significantly outperform when adjusted for same revenue
mix |
 26
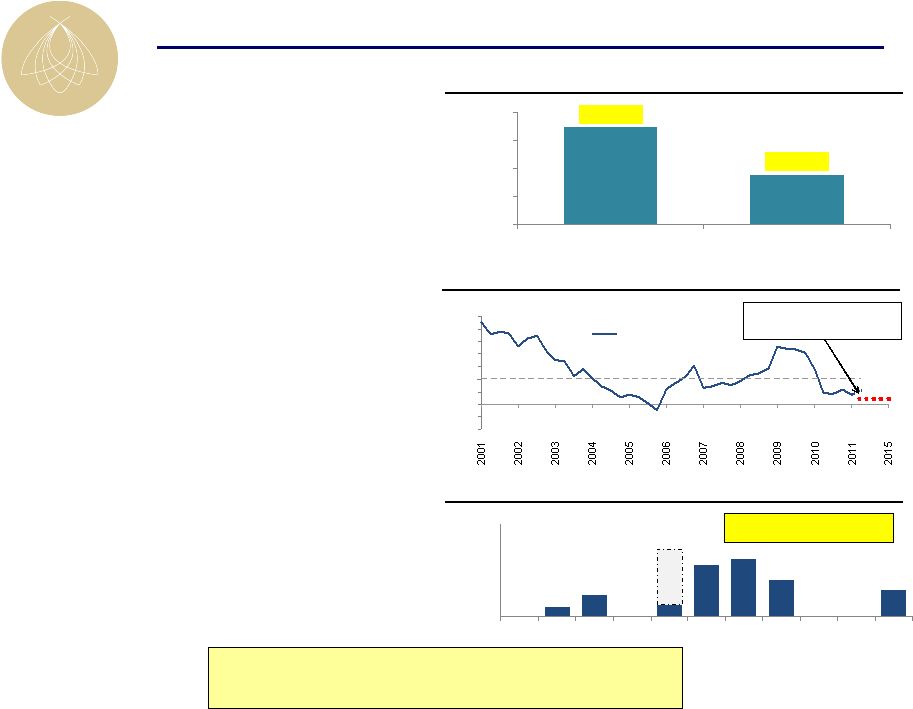
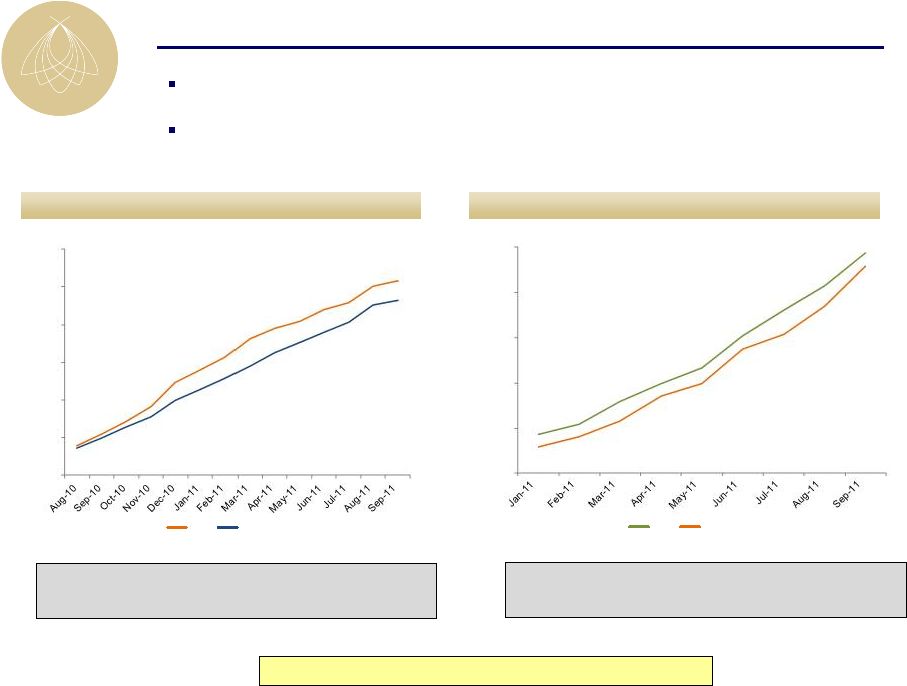
Group Booking Outlook
2012 group pace (bookings for the following year)
2011 group pace (bookings for the current year)
Room Nights
99% of 2011 budgeted
group room nights are
on the books
* 2011 room nights represents budget; 2012 room nights booked after 8/31 for
the following year assumes the same production as in 2011 Room Nights
Assuming similar production
as 2011, group room nights
would be down 13% to peak
2012 group pace currently 6% ahead of 2011
2011 group pace currently 7% ahead of 2010
Group pace remains the most reliable forward looking indicator
Booking window has shortened forcing more reliance on room nights booked ITYFTY
(“in-the-year-for-the-year”)
26% increase in second quarter ITYFTY rooms compared to second quarter 2007
Significant
capacity
to
grow
group
business
0
200,000
400,000
600,000
800,000
1,000,000
1,200,000
2007
2008
2009
2010
2011*
Definite as of 8/31
Production after 8/31
0
200,000
400,000
600,000
800,000
1,000,000
1,200,000
2007
2008
2009
2010
2011*
2012*
Definite as of 8/31
Production after 8/31 |
 27
Group Booking Outlook
2012 group booking production
2011 group booking production
YTD group booking production for 2012 is 6%
above 2011
TTM group booking production for 2011 is 8%
above 2010
Group production is monitored to identify any signs of a slowdown
Current production levels are trending higher than comparable periods in
2007 No evidence of a slowdown
300,000
400,000
500,000
600,000
700,000
800,000
900,000
2011
2010
200,000
250,000
300,000
350,000
400,000
450,000
2012
2011 |
 28
Focus on ADR Growth Drives Margin Outperformance
RevPAR
growth
RevPAR
penetration
RevPAR growth and penetration
BEE Occupancy and ADR
Occupancy growth typically leads a recovery
BEE ADR growth drives higher margins
BEE RevPAR penetration is best measurement of market share capture
Occupancy led the recovery; ADR growth
continues to improve
BEE has improved market share at all points
in the cycle
BEE hotels consistently outperform in market share
|
 29
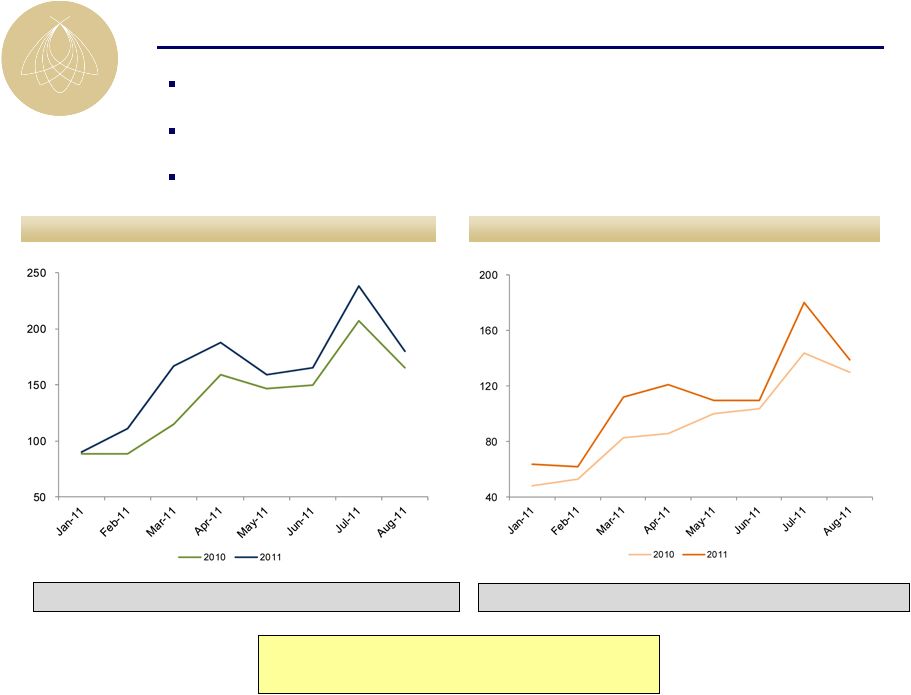
Compression Room Nights
90% compression room nights
80% compression room nights
Compression nights (occupancy 80%/90% or higher) drive higher rates
Average rate on 80% compression nights is up 7% year-to-date
Average rate on 90% compression nights is up 13% year-to-date
YTD 80% compression nights are up 16% in 2011 vs. 2010
YTD 90% compression nights are up 20% in 2011 vs. 2010
BEE ideally positioned for rate growth |
 30
$210
$220
$230
$240
$250
$260
$270
$280
62.0%
64.0%
66.0%
68.0%
70.0%
72.0%
74.0%
76.0%
78.0%
2007
2008
2009
2010
2011F
Occupancy
ADR
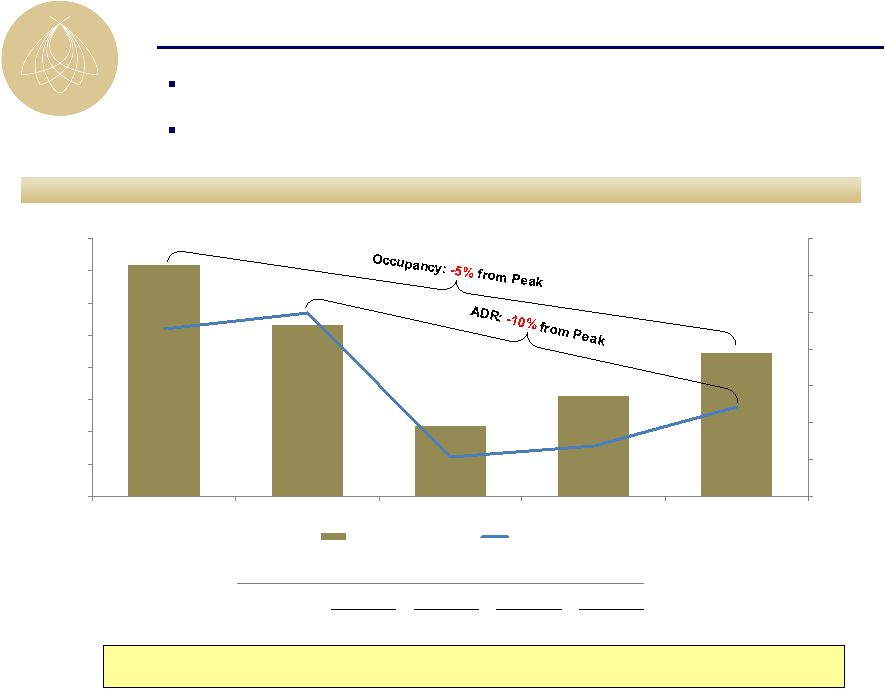
Embedded Portfolio Growth
ADR will be a bigger driver of RevPAR growth going forward and will likely
exceed peak in the future
Occupancy and ADR
Occupancy
Note: portfolio excludes: Hotel del Coronado, Fairmont Scottsdale Princess, Four
Seasons Jackson Hole, Four Seasons Silicon Valley ADR
Peak-to-trough ADR dropped 15% and is still 10% below peak
Peak-to-trough occupancy dropped 10 percentage points and is still 5
percentage points below peak
CAGR to Reach Peak by:
2012
2013
2014
2015
ADR
11.0%
5.4%
3.5%
3.5% |
 31
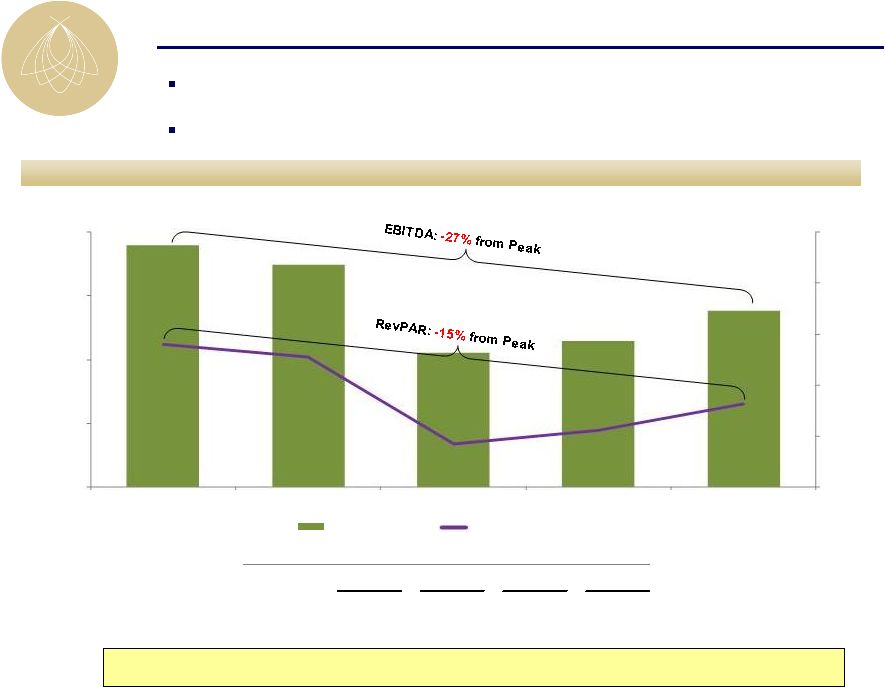
Embedded Portfolio Growth
Significant organic growth opportunity in existing portfolio
Note: portfolio excludes: Hotel del Coronado, Fairmont Scottsdale Princess, Four
Seasons Jackson Hole, Four Seasons Silicon Valley Property-level EBITDA and
RevPAR EBITDA (MM)
RevPAR
Peak-to-trough RevPAR dropped 22% and is still 15% below peak
Peak-to-trough property-level EBITDA dropped 39% and is still 27%
below peak CAGR to Reach Peak by:
2012
2013
2014
2015
RevPAR
17.5%
8.4%
5.5%
4.1%
EBITDA
36.9%
17.0%
11.0%
8.2%
$125
$150
$175
$200
$225
$250
$50
$100
$150
$200
2007
2008
2009
2010
2011F
EBITDA
RevPAR
$0 |
 32
Completed ROI Projects Enhance Future Growth |
 33
Notable 2008
capital
projects
Notable 2009
capital
projects
InterContinental
Miami
–
Guestroom
renovation
InterContinental
Chicago
–
Michael
Jordan’s
Steak
House
Four Seasons
Washington,
D.C
–
Retail
outlet
renovation
Marriott
Lincolnshire
–
Lobby
renovation
Westin
St.
Francis
–
Michael
Mina
Steakhouse
conversion
Four Seasons
Washington,
D.C.
–
Lobby
renovation,
11-room
expansion, new restaurant, 63-room and suite renovation
Westin
St.
Francis
–
Clock
Bar
Fairmont
Chicago
–
ENO
wine
tasting
room,
lobby
renovation,
guestroom renovation, new spa and fitness center
Four Seasons
Punta
Mita
–
New
lobby
bar
Ritz-Carlton
Half
Moon
Bay
–
ENO
wine
tasting
room,
restaurant and lounge renovation, suite renovation
Completed ROI Projects Enhance Future Growth
Notable 2010
capital
projects
2011 Projects
In progress
Fairmont Chicago Lobby
Four Seasons Washington, D.C.
Lobby
Westin St. Francis Michael Mina
Bourbon Steak
InterContinental Miami Guestroom
Proven track record of successful ROI projects |
 34
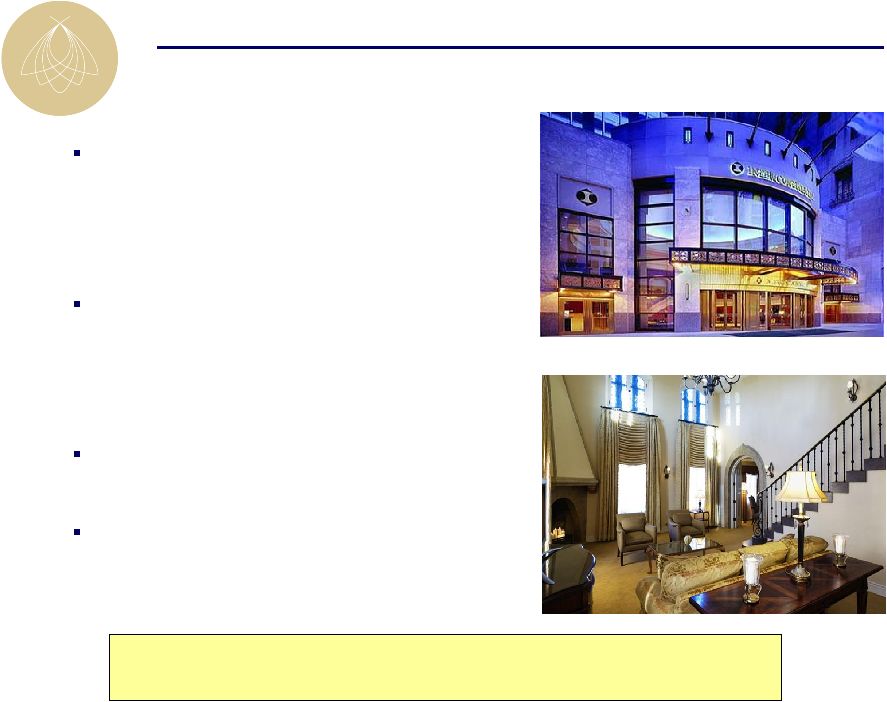
Four Seasons D.C.
ROI Capital Project Examples
ROI projects produce very attractive returns and maximize earnings
contribution from existing space
InterContinental Chicago
Hotel del Coronado
(1)
(1)
(1)
Represents 100% ownership
(1)
(1)
Description:
Bourbon Steakhouse
and 11-room expansion
ENO Wine Room &
Starbucks
North Beach
Development
Year of Project:
2008 - 2009
2006 - 2007
2007
Investment ($mm):
$8.4
$2.9
$68.4
2010 EBITDA Yield (%):
15%
28%
$113 million in unit sales revenue
~$45 million in unit sales profit
$6.6 million in 2010 EBITDA |
 35
$18 million guestroom renovation
Re-concept of guestrooms and corridors
New soft goods and case goods
Upgrade of bathroom
Integration of technology
Design based on in-depth consumer research
and meeting planner feedback
Project phased over 2011 and 2012;
approximately two-thirds complete
Long-term plan to incorporate a revitalization of
the hotel’s lobby and public space
2011 Capital Projects
Guestroom after
InterContinental Miami Guestroom Renovation
Guestroom before
Successful repositioning will regain market share penetration against significantly increased competition |
 36
$3.8 million restaurant revitalization
–
Replaced former Zest restaurant
–
Enhanced existing lobby bar
Licensing agreement with Cornerstone
Restaurant Group
Official grand opening was September 22
Estimated $9 million annual revenue
–
Approximately $30,000 revenue per night
during first weekend of operations
Target mid-teens cash yield on investment
2011 Capital Projects
Dining Area
Bar and lounge
InterContinental Chicago –
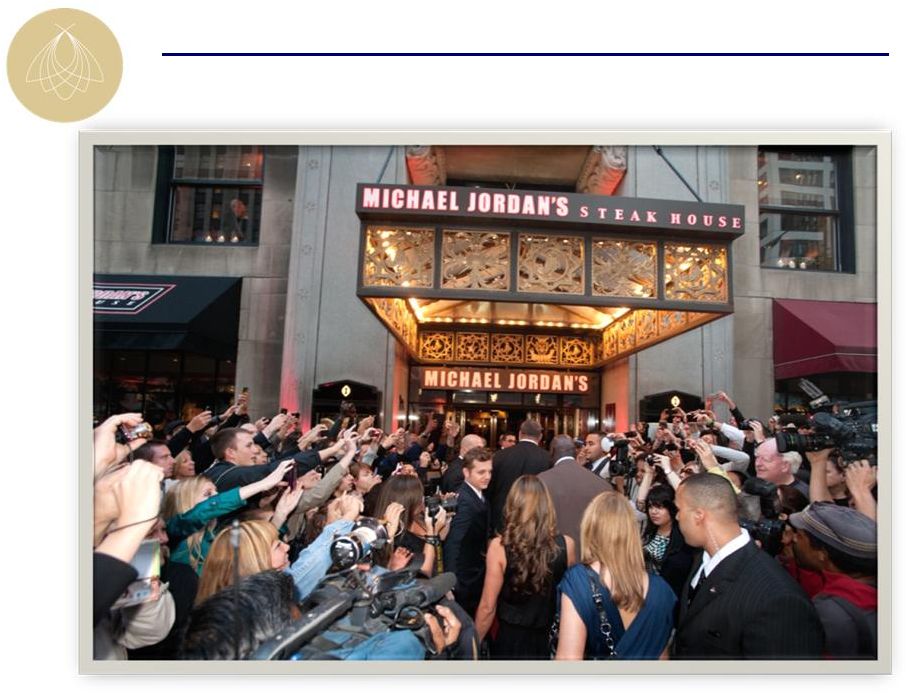
Michael Jordan’s Steak House
nd
Michael Jordan’s Steak House has significantly enhanced the public space of
the hotel and is expected to generate a significant return on investment |
 37
Four Seasons Washington, D.C.
ENO Wine Room
Retail space optimization
Four Seasons Silicon Valley
Quattro patio renovation
Meeting room renovation
Four Seasons Jackson Hole
Restaurant re-concept
InterContinental Chicago
North tower guestroom renovation
Meeting space expansion
Michigan Ave. frontage optimization
Potential Capital Projects in the Pipeline
Ritz-Carlton Laguna Niguel
35-room fire pit addition
Pool deck upgrades
InterContinental Miami
Public space revitalization
Meeting space renovation
Pool deck refurbishment
Fairmont Chicago
Meeting space renovation
Westin St. Francis
ENO wine room
Significant ROI capital investment opportunities within existing portfolio;
rigorous analysis and approval process for each project |
 38
I.
BEE’s Unique Value Proposition
II.
Macroeconomic and Industry Update
III.
Company Overview
IV.
Organic Growth and ROI Opportunities
V.
Balance Sheet Recapitalization
Agenda |
 39
2011 Debt Refinancing Strategy Objectives
Simultaneous negotiation of a new syndicated line of credit; substituting the
Ritz-Carlton Half Moon Bay for the Four Seasons Washington, D.C. in the
borrowing base Execute a competitive loan marketing process with goal to
close all loans in the first half of 2011
Stagger new loan maturities over a 10 year period; no more than 25% debt maturing
in a single year
Manage fixed versus floating rate debt mix in conjunction with existing swap
portfolio Reduce reliance on CMBS loans
Position company for payment of preferred dividends
Mission 100% Accomplished!
(1)
The decision was made not to early refinance the mortgage loan on the Hyatt
Regency La Jolla, owned in a joint venture with GIC, with the maturity date
remaining in September 2012 Deliberate, focused decision made in January 2011
to accelerate the refinancing of all 2011
/
2012
debt
maturities
(1) |
 40
($ in millions)
Note: Assumes full extension periods for all loans.
BEE’s balance sheet structured for growth, yet prepared for volatility
Strong Recapitalized Balance Sheet
Current
January 1, 2010 |
 41
January 1, 2010
(1)
Data reflects second quarter 2011 balances updated for property refinancing
activity. (2)
EBITDA assumed at mid-point of current guidance range.
(3)
Current TEV based on stock price as of close September 30, 2011 of $4.31.
Note: For Non-GAAP to GAAP reconciliations please see final slide of
presentation Significantly Improved Leverage Metrics
Successful balance sheet restructuring resulted in reduction of Net Debt /
EBITDA by over 7 turns
(2)
(3)
Current
(1)
Key Stats
Net Debt/EBITDA
14.3x
7.2x
Net Debt/TEV
76.9%
47.9%
Avg. Maturity (yrs)
3.4
5.2
Unencumbered assets
0
2
Liquidity (MM)
$105.0
$400.0
Fixed rate debt
86%
98%
Mix of Debt
Bank Debt
17.8%
38.0%
Life Insurance Co.
25.6%
31.5%
CMBS
56.6%
30.5% |
 42
Partial debt retirement through purchase at a
discount
Recapitalized as joint venture with Blackstone
and KSL
Retained 34.3% ownership
Reduced debt from $630 million to $425 million
Refinanced debt with first major CMBS floater;
5-year term @ LIBOR + 480 bps
Retained asset management fees and return-
based promote
Hotel del Coronado
Hotel del Coronado
Beach Village Guest Room
$630 million recapitalization / restructuring
Invested approximately $57 million at very attractive projected returns;
added Blackstone as a joint venture partner |
 43
Restructured existing CMBS loan
Recapitalized joint venture with Walton Street
Retained 50% ownership interest
Reduced debt from $180 million to $133 million
Maintained below market interest rate of
LIBOR + 36 bps
Extended debt maturity through April 2015
Restructured hotel management agreement and
ground lease
Committed to a $20 million, 23,000 sq. ft.
ballroom / conference center expansion
Fairmont Scottsdale Princess
Fairmont Princess pool at dusk
Rendering of ballroom expansion
$203 million recapitalization / restructuring
Invested approximately $35 million on very attractive terms with below
market debt and high growth profile of the Fairmont Scottsdale Princess |
 44
Disposed of leasehold position
Generated approximately $60 million disposition
proceeds
–
~18x 2010 EBITDA contribution
(1)
Effectively matched proceeds for investment in
Hotel del Coronado restructuring
Eliminated approximately $500,000 corporate
overhead related to the asset
Marriott Paris Champs Elysees
Lobby
Guestroom
$60 million disposition proceeds
(1) 2010 EBITDA contribution of $3.3 million.
Generated approximately $60 million from an asset that was generally
valued at less than $5 million |
 45
Acquired Four Seasons Jackson Hole & Four
Seasons Silicon Valley
–
Implied valuation of $95 million
($293,000 per key)
–
11x
2011
EBITDA
(1)
multiple
Issued 23.2 million shares of common stock at
$6.25 share price
$50 million in additional proceeds through PIPE
transaction with Woodbridge
Both assets are unencumbered
Four Seasons / Woodbridge Transaction
Four Seasons Jackson Hole
Four Seasons Silicon Valley
$145 million acquisition and equity issuance
(1) For Non-GAAP to GAAP reconciliations please see final slide of
presentation Accretive acquisition which deleveraged the company and added another significant, strategic long-term shareholder |
 46
Purchased 49% GIC interest for all-in price of
$288 million
–
~14.1x
forecasted
2011
EBITDA
(1)
–
~$364,000 per key
Funded $82 million investment with:
–
10.8 million shares of common stock at
$6.50 per share
–
$11.8 million cash
Completed the Michael Jordan’s Steak House in
September 2011
Subsequently refinanced with a 10-year fixed
rate loan
InterContinental Chicago / Government of Singapore
InterContinental entrance on Michigan Ave.
Presidential Suite
$288
million
acquisition
with
$70.2
million
private
placement
of
equity
(1) For Non-GAAP to GAAP reconciliations please see final slide of
presentation Acquired at attractive metrics and added another significant, strategic
long-term shareholder |
 47
$300 million revolving credit facility ($400 million
with accordion feature)
Secured by:
–
Four Seasons Punta Mita
–
Marriott Lincolnshire
–
Ritz-Carlton Laguna Niguel
–
Ritz-Carlton Half Moon Bay
Leveraged-based pricing currently at LIBOR +
300 bps
Favorable covenants
Reduced line banks from 21 to 10
Currently undrawn
Line of Credit Refinancing
$300 million credit facility
Improved pricing and
terms
Extended
maturity
Provides ample liquidity and
flexibility Ritz-Carlton Laguna Niguel
Ritz-Carlton Half Moon Bay
Marriott Lincolnshire
Four Seasons Punta Mita |
 48
Four Seasons Washington, D.C.
$130 million, 5-year bank syndicated loan
Interest Rate: LIBOR + 315 basis points
InterContinental Chicago
$145 million, 10-year CMBS
Interest rate: 5.61% fixed rate
InterContinental Miami
$85 million, 7-year bank loan
Interest rate: LIBOR + 350 basis points
Loews Santa Monica
$110 million, 7-year bank loan
Interest rate: LIBOR + 385 basis points
Property Level Debt Financings
Four Seasons Washington, D.C.
Loews Santa Monica
$470 million financing proceeds
Eliminated near-term maturity
risk
Generated approximately $70 million of net proceeds
|
 49
Summary
of
Results
–
Debt
Refinancing
Strategy
Completed accelerated refinancing of all 2011 and 2012 maturities
Executed highly complicated CMBS restructurings for the Hotel del Coronado
and Fairmont Scottsdale Princess
Effectively staggered debt maturities; managed fixed rate vs. floating rate
mix Competitive process provided best market terms and optimal mix of
lenders Estimated refinancing gap at the beginning of 2010 for 2011 / 2012
maturities was approximately $100 million
Raised ~$70 million in net proceeds through holistic approach
100% execution and prescient timing of overall debt refinancing strategy |
 50
Accrued preferred dividend approximately $93 million by year-end 2011
Approximately $400 million corporate liquidity at year-end 2011 (excluding
financeable unencumbered assets)
Currently able to pay accrued preferred dividend under line of credit
covenants Payment of accrued dividend likely accompanied by reinstatement of
current preferred dividend
Management to monitor 2012 outlook and determine appropriate timing of payment;
critical to cover quarterly dividends out of operating cash flow
Payment of preferred dividend positions company to reinstate a common
dividend in the future
Preferred Equity Dividend
Ample liquidity and no current covenant restrictions on payment of accrued
preferred dividend; management is closely monitoring 2012 outlook |
 51
I.
BEE’s Unique Value Proposition
II.
Macroeconomic and Industry Update
III.
Company Overview
IV.
Organic Growth and ROI Opportunities
V.
Balance Sheet Recapitalization
VI.
Financial Results and Guidance
Agenda |
 (EBITDA in
millions) (a)
Excludes Fairmont Scottsdale Princess, Four Seasons Jackson Hole, Four Seasons Silicon Valley, and
Hotel del Coronado Operations
Corporate
Results
(a)
Strong First Half 2011 Results
Comparable
EBITDA
$60.2
18.3%
$71.2
Comparable
FFO
/
share
$(0.07)
N/A
$0.03
(Same Store U.S. Portfolio)
1
st
Half
2010
ADR
$210
5.7%
$222
RevPAR
$136
14.7%
$156
Total RevPAR
EBITDA Margins
$260
15.9%
13.4%
410 bps
$295
20.0%
52
1
st
Half
2011 |
 53
EBITDA
$132
10%-17%
$145-$155
FFO / share
$0.05
60%-180%
$0.08-$0.14
2011 Guidance
(EBITDA in millions)
(b)
2010 results exclude $4.9 mm of real estate tax refunds and no adjustments for cancellation
fees (c)
2010 excludes $12.6 mm of VCP expense; 2011 VCP expense excluded
Operations
(a)
Corporate
Results
(c)
(b)
(a)
Portfolio excludes Fairmont Scottsdale Princess, Four Seasons Jackson Hole, Four Seasons Silicon
Valley, and Hotel del Coronado 2010
2011
Guidance
RevPAR
$153
8%-9.5%
$165-$167
Total RevPAR
$286
8%-9%
$309-$312
EBITDA Margins
19.0%
200
-
300bps
21%-22% |
 54
The only pure play high-end lodging REIT
High-end outperforms the industry in a recovery
Industry leading asset management expertise
Assets are in pristine condition and offer significant ROI opportunities
Embedded organic growth limits need for external growth
Replacement cost, excluding land, approximately $700,000 per key
Historically
low
supply
growth
environment,
particularly
in
BEE
markets
Balance sheet positioned for growth, yet prepared for volatility
BEE’s Unique Value Proposition
The best investment proposition in the lodging space |
 55
Q&A
Q&A |
 56
Disclaimer
Except for historical information, the matters discussed in this press release are
forward-looking statements subject to certain risks and uncertainties. Actual results
could differ materially from the Company's projections and forward-looking statements are
not guarantees of future performance. These forward looking statements are identified by looking their use
of terms and phrases such as “anticipate,” “believe,” “could,”
“estimate,” “expect,” “intend,” “may,” “plan,” “predict,” “project,”
“should,” “will,” “continue” and other similar terms and phrases,
including references to assumptions and forecasts of future results. Factors that
may contribute to these differences include, but are not limited to the following: ability to obtain,
refinance or restructure debt or comply with covenants contained in our debt facilities; volatility
in equity or debt markets; availability of capital; rising interest rates and operating costs;
rising insurance premiums; cash available for capital expenditures; competition; demand for
hotel rooms in our current and proposed market areas; economic conditions generally and in the
real estate market specifically, including deterioration of economic conditions and the extent of its
effect on business and leisure travel and the lodging industry; ability to dispose of existing
properties in a manner consistent with our disposition strategy; delays in construction and
development; the failure of closing conditions to be satisfied; risks related to natural
disasters; the effect of threats of terrorism and increased security precautions on travel
patterns and hotel bookings; the outbreak of hostilities and international political instability;
legislative or regulatory changes, including changes to laws governing the taxation of REITs;
and changes in generally accepted accounting principles, policies and guidelines applicable to
REITs. Certain of these risks and uncertainties are described in greater detail in our
filings with the Securities and Exchange Commission. Although we believe our current expectations to be
based upon reasonable assumptions, we can give no assurance that our expectations will be attained or
that actual results will not differ materially. We undertake no obligation to update any
forward-looking statement to conform the statement to actual results or changes in our
expectations.
|
 57
Non-GAAP to GAAP Reconciliations
Reconciliation of Net Debt / EBITDA
($ in 000s)
YE 2009
(a)
July 2011
(b)
Consolidated Debt
$1,658,745
$1,004,284
Pro rata share of unconsolidated debt
282,825
212,275
Pro rata share of consolidated debt
(107,065)
(45,548)
Cash and cash equivalents
(116,310)
(85,000)
Net Debt
$1,718,195
$1,086,011
Comparable EBITDA
$119,953
$150,000
Net Debt / EBITDA
14.3x
7.2x
(a) All figures taken from year-end 2009 financial statements.
(b) Balance sheet metrics updated to reflect closing of debt refinancings
Comparable EBITDA reflects mid-point of guidance range as of
Q2 2011. Reconciliation of Net Debt / TEV
($ in 000s)
YE 2009
(a)
Current
(b)
Consolidated Debt
$1,658,745
$1,004,284
Pro rata share of unconsolidated debt
282,825
212,275
Pro rata share of consolidated debt
(107,065)
(45,548)
Cash and cash equivalents
(116,310)
(85,000)
Net Debt
$1,718,195
$1,086,011
Market Capitalization
$144,966
$811,530
Total Debt
1,834,505
1,171,011
Preferred Equity
370,236
370,236
Cash and cash equivalents
(116,310)
(85,000)
Total Enterprise Value
$2,233,397
$2,267,777
Net Debt / EBITDA
76.9%
47.9%
(a) All figures taken from year-end 2009 financial statements.
(b) Balance sheet metrics updated to reflect closing of debt refinancings
Comparable EBITDA reflects mid-point of guidance range as of
Q2 2011. Reconciliation of Woodbridge Transaction EBITDA Multiple
($ in 000s)
2011
Net Income Attributable to Common Shareholders
$5,203
Depreciation & Amortization
3,417
Comparable EBITDA
$8,620
Implied Purchase Price
$95,000
2011 EBITDA Multiple
11.0x
Note: Depreciation and amortization estimate based on preliminary
purchase price allocation at the
time of closing. Reconciliation of InterContinental Chicago EBITDA Multiple
($ in 000s)
2011
Net Income Attributable to Common Shareholders
$5,934
Depreciation & Amortization
7,980
Interest Expense
5,413
Income Tax Expense
1,070
Comparable EBITDA
$20,397
Implied Purchase Price
$288,250
2011 EBITDA Multiple
14.1x
Note: Interest Expense estimate based on the LIBOR curve and refinancing
estimates at time of closing.
All figures represent 100% ownership
|
 |