Attached files
| file | filename |
|---|---|
| 8-K - 8-K - TRIMAS CORP | trs_091411x8k.htm |

Rieke Packaging Systems Analyst Day
September 14, 2011
NASDAQ • TRS
September 14, 2011
NASDAQ • TRS

Forward Looking Statements
Any “forward-looking” statements contained herein, including those relating to market conditions or the
Company’s financial condition and results, expense reductions, liquidity expectations, business goals and sales
growth, involve risks and uncertainties, including, but not limited to, risks and uncertainties with respect to
general economic and currency conditions, various conditions specific to the Company’s business and industry,
the Company’s substantial leverage, liabilities imposed by the Company’s debt instruments, market demand,
competitive factors, the Company’s ability to maintain compliance with the listing requirements of NASDAQ,
supply constraints, material and energy costs, technology factors, litigation, government and regulatory
actions, the Company’s accounting policies, future trends, and other risks which are detailed in the Company’s
Annual Report on Form 10-K for the fiscal year ending December 31, 2010, and in the Company’s Quarterly
Reports on Form 10-Q. These risks and uncertainties may cause actual results to differ materially from those
indicated by the forward-looking statements. All forward-looking statements made herein are based on
information currently available, and the Company assumes no obligation to update any forward-looking
statements.
2
This presentation is not intended to update or reaffirm the outlook provided on July 28, 2011 as part of the
TriMas Second Quarter 2011 Earnings materials.

Opening Remarks – Dave Wathen, TriMas CEO

Business Environment
• Management processes proven through the cycle
• “Choppy” demand levels; unclear macro-
economics
• Constant attention to capture opportunities and
mitigate risks
• Experienced, expert management teams at SBUs
• Diversified…Some end markets showing upside,
some downside
• Positioned for fast responses to customer needs
• Productivity and continuous improvement are
core to TriMas
4
Strategies in place remain consistent.
Opportunities
Risks

Strategic Aspirations
• High single-digit top-line growth
• Earnings growth faster than revenue growth
• 3% to 5% of total gross cost productivity gains
annually – utilize savings to fund growth
• Invest in growth programs that deliver new
products, new markets and expanded
geographies
• Increase revenues in fastest growing markets
• Ongoing improvement in capital turns and all
cycle times
• Continued decrease in leverage ratio
Strategic aspirations are the foundation for 2012.
5

Cequent
Engineered
Components
Revenue: $79.5
7.6% of Company
Aerospace &
Defense
EnergyPackaging
Revenue: $149.5
14.4% of Company
Revenue: $173.8
16.7% of Company
Revenue: $189.6
18.2% of Company
North America
Revenue: $368.9
35.5% of Company
($ in millions; from continuing operations)
6/30/11 LTM Revenue: $1,039.9
Balanced Diversification
Engineered product portfolio with diverse end markets.
Asia Pacific
Revenue: $78.6
7.6% of Company
Note: All figures are as 6/30/11 on a last 12 months (LTM) basis.
6

Rieke Introduction
• Strong management team
• Innovative spirit
• Long-term customer relationships
• Global footprint
• Proven track record of growth and margin expansion
7
Core growth platform for TriMas.
• Strong management team
• Innovative spirit
• Long-term customer relationships
• Global footprint
• Proven track record of growth and margin expansion
7
Core growth platform for TriMas.

Lynn Brooks – President, Rieke Packaging

Packaging Overview
• Diverse products designed to enhance customers’ ability to
store, transport, process and dispense
9
• Diverse products designed to enhance customers’ ability to
store, transport, process and dispense
9

Industrial Closure Systems
(Approx. 60% of historical segment revenue)
• Products include:
• Steel and plastic closure caps
• Drum and pail closures
• Rings and levers
• End markets include:
• Industrial chemicals
• Agricultural chemicals
• Sanitary and cleaning
chemicals
• Petroleum
• Paints and solvents
Specialty Systems
(Approx. 40% of historical segment revenue)
• Products include:
• Dispensing systems such as
pumps, foamers and specialty
sprayers
• Plastic closures for dry
products
• End markets include:
• Pharmaceutical/medical
• Food
• Beverage
• Personal Care
• Nutraceutical
10
Packaging Overview
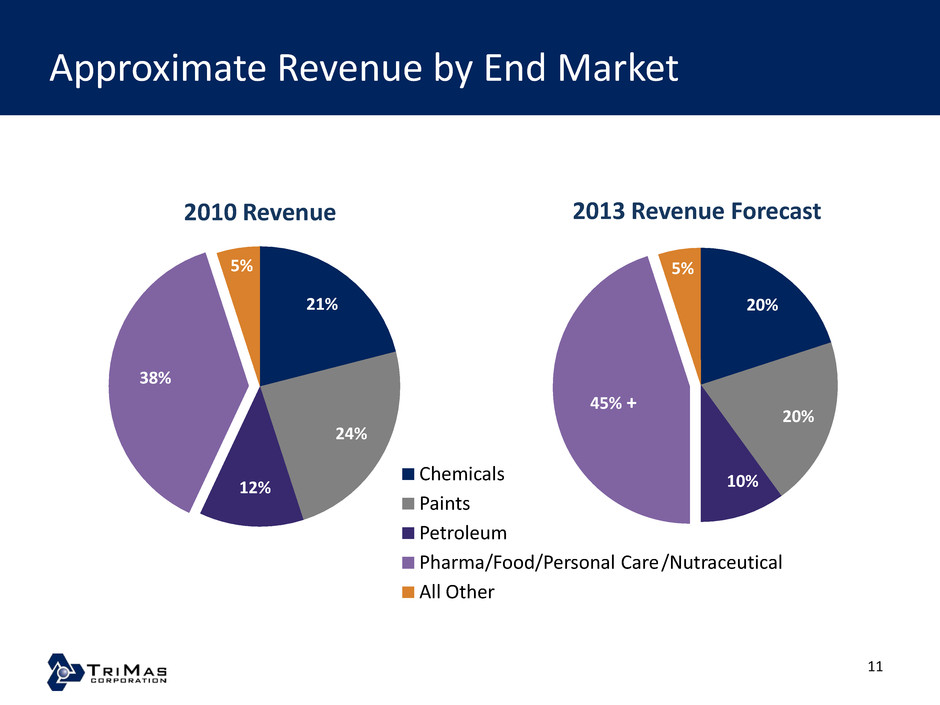
Approximate Revenue by End Market
25%
5%
21%
24%
12%
38%
5%
2010 Revenue
Chemicals
Paints
Petroleum
Pharma/Food/Personal Care
All Other
20%
20%
10%
45% +
5%
2013 Revenue Forecast
11
/Nutraceutical
25%
5%
21%
24%
12%
38%
5%
2010 Revenue
Chemicals
Paints
Petroleum
Pharma/Food/Personal Care
All Other
20%
20%
10%
45% +
5%
2013 Revenue Forecast
11
/Nutraceutical

Packaging Financial Overview
$161
$145
$171
2008 2009 2010
Net Sales
$32 $34
$49
2008 2009 2010
Operating Profit(1) and Margin
(1) Operating Profit excludes Special Items of $62.9 in 2008
and $0.6 in 2009
Consistent profitability despite economy.
12
19.6% 23.2% 28.5%
$ in millions
$161
$145
$171
2008 2009 2010
Net Sales
$32 $34
$49
2008 2009 2010
Operating Profit(1) and Margin
(1) Operating Profit excludes Special Items of $62.9 in 2008
and $0.6 in 2009
Consistent profitability despite economy.
12
19.6% 23.2% 28.5%
$ in millions
• Target “3x salary” in incremental profit to justify new
hires
• Constant review of cost footprint
• Re-engineering products and specs
• Ability to obtain fixed cost leverage
• Realize acquisition synergies
Culture of Productivity
13
Ability to fund growth and support business expansion.
hires
• Constant review of cost footprint
• Re-engineering products and specs
• Ability to obtain fixed cost leverage
• Realize acquisition synergies
Culture of Productivity
13
Ability to fund growth and support business expansion.

Production Locations
Warehouse/Sales Locations
Current Geographic Footprint
Rieke is a global business and will continue to expand geographic coverage.
14
Warehouse/Sales Locations
Current Geographic Footprint
Rieke is a global business and will continue to expand geographic coverage.
14

How Does Rieke Differentiate?
• Customized solution – focus on customer needs and
application vs. one size fits all
• Intellectual property
• Significant technical support and engineering
• Speed and delivery advantages – start to finish time
• Broader geographic presence
15
• Customized solution – focus on customer needs and
application vs. one size fits all
• Intellectual property
• Significant technical support and engineering
• Speed and delivery advantages – start to finish time
• Broader geographic presence
15

Industrial Closures
16
• Rieke historically focused on closures for industrial
customers – since 1921
• No. 1 or No. 2 market share in most industrial
products in North America and Europe
• End user specifications “pull” demand
• 90% of revenue is specified
• Intellectual property coverage on approximately 60%
of product sales
• Equipment in place at customer for insertion/closure
• Major end users include:

Industrial Closures
• Historical margins consistent with specialty
system products
• Slower growth business – moves with
industrial GDP
• Continue to maintain/grow market share
• Ensure products have barriers to
entry/intellectual property
• Continue to capture productivity
17
More significant growth opportunities in specialty systems and
geographic expansion.

Growth Strategies
• Target specialty dispensing and closure products into
higher end growth markets
• Pharmaceutical, medical, food, beverage, nutrition and
personal care
• Focus on Asian market and begin to cultivate other
geographic opportunities
• China, Southeast Asia, South America
• Consider value-add, bolt-on acquisitions
• Capture market first, then maximize profitability
• Increase low-cost country sourcing and manufacturing
18

Actual New Product Sales
Proven model for product development and growth.
Track Record of Growth in New Products
2001 2002 2003 2004 2005 2006 2007 2008 2009 2010
19
2001 2002 2003 2004 2005 2006 2007 2008 2009 2010
Proven model for product development and growth.
Track Record of Growth in New Products
2001 2002 2003 2004 2005 2006 2007 2008 2009 2010
19
2001 2002 2003 2004 2005 2006 2007 2008 2009 2010
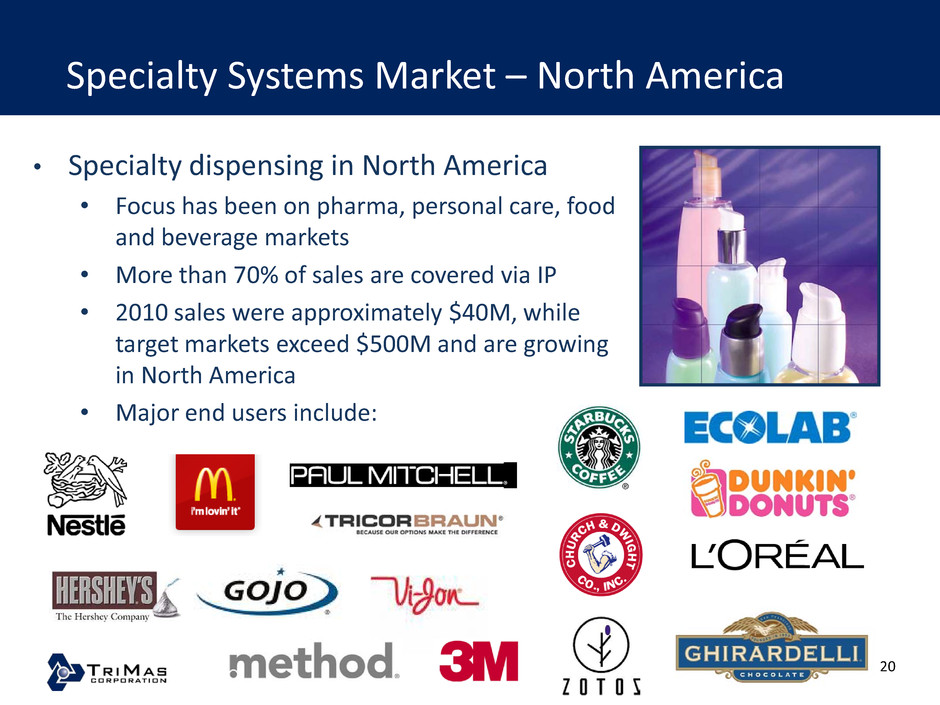
Specialty Systems Market – North America
• Specialty dispensing in North America
• Focus has been on pharma, personal care, food
and beverage markets
• More than 70% of sales are covered via IP
• 2010 sales were approximately $40M, while
target markets exceed $500M and are growing
in North America
• Major end users include:
20
• Specialty dispensing in North America
• Focus has been on pharma, personal care, food
and beverage markets
• More than 70% of sales are covered via IP
• 2010 sales were approximately $40M, while
target markets exceed $500M and are growing
in North America
• Major end users include:
20

Specialty Systems Market – Europe
• Specialty dispensing products in Europe
• Dispensing is more than half of Rieke sales in
Europe
• Leverage Rieke locations in France, Germany,
Italy and the United Kingdom
• Target market for specialty systems in Europe
is approximately $500M
• Major end users include:
Boots
21
• Specialty dispensing products in Europe
• Dispensing is more than half of Rieke sales in
Europe
• Leverage Rieke locations in France, Germany,
Italy and the United Kingdom
• Target market for specialty systems in Europe
is approximately $500M
• Major end users include:
Boots
21
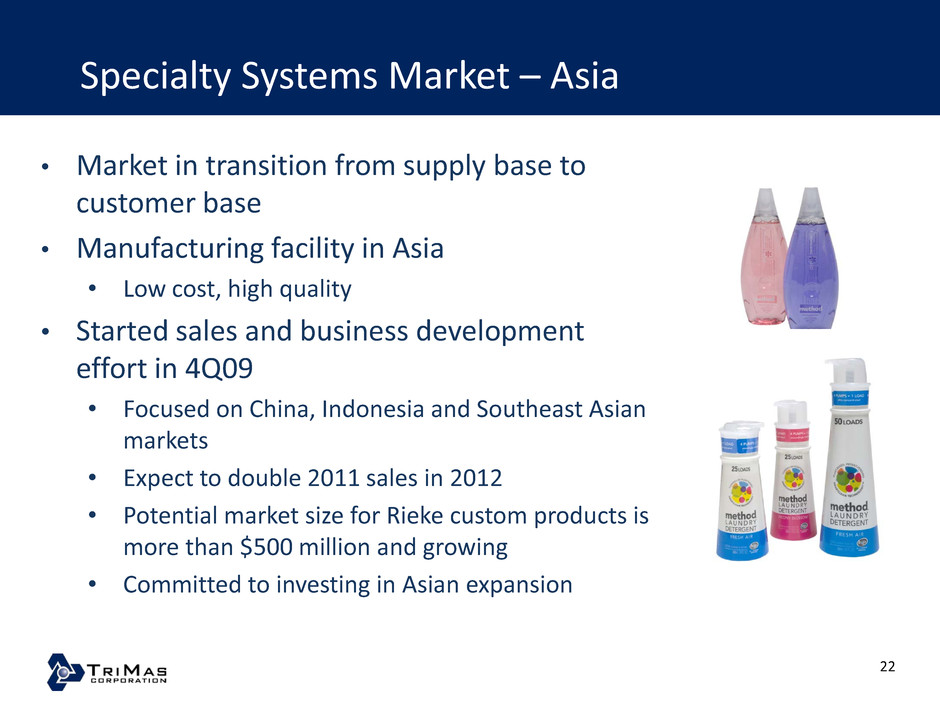
Specialty Systems Market – Asia
• Market in transition from supply base to
customer base
• Manufacturing facility in Asia
• Low cost, high quality
• Started sales and business development
effort in 4Q09
• Focused on China, Indonesia and Southeast Asian
markets
• Expect to double 2011 sales in 2012
• Potential market size for Rieke custom products is
more than $500 million and growing
• Committed to investing in Asian expansion
22

Bolt-on acquisition criteria:
• Provide new products, new markets
• Markets similar to our focus
• Intellectual property coverage
• Ability to leverage Rieke’s footprint to capture incremental
revenue
• Accretive – financials make sense
Bolt-on Acquisition Strategy
23
• Provide new products, new markets
• Markets similar to our focus
• Intellectual property coverage
• Ability to leverage Rieke’s footprint to capture incremental
revenue
• Accretive – financials make sense
Bolt-on Acquisition Strategy
23

Innovative Molding Acquisition
• Manufacturer of plastic closures for bottles and jars located in
California and Arkansas (primarily regional focus)
• Produces 360 million caps per year ranging in size from 28mm
to 120mm
• Holds numerous patents on closures, container finishes,
molds and tooling
• Customer base provides Rieke greater access to the food and
nutrition industries
• Generated approximately $28 million in revenue for 12
months ended May 31, 2011
Expanding our product portfolio to better meet our customers’ needs.
24
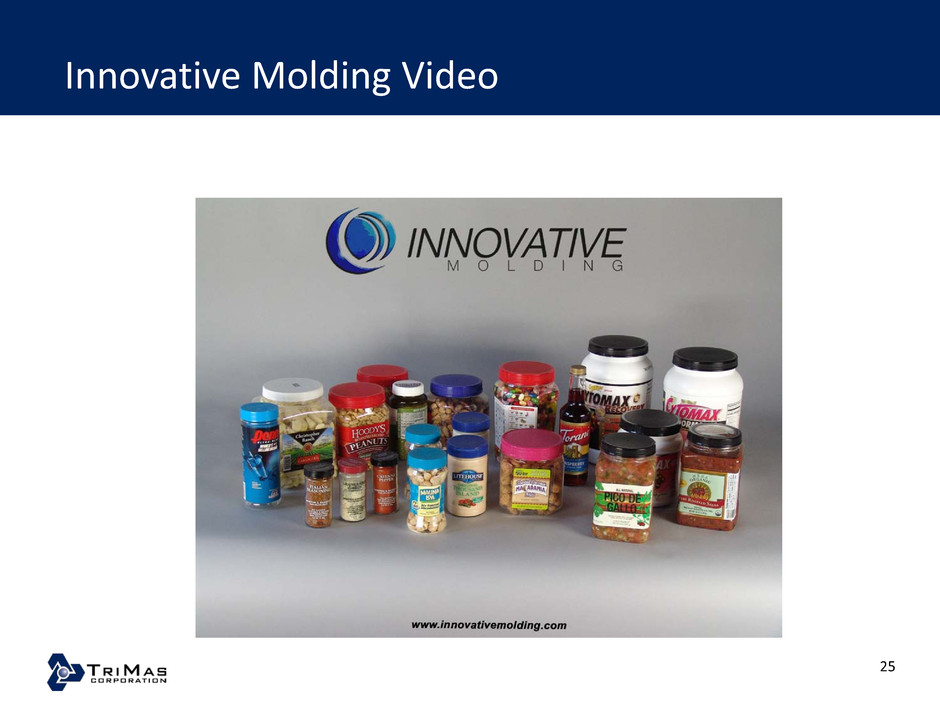
Innovative Molding Video
25
25

• Cross sell products of both companies
• Leverage Rieke’s assets to expand customer base
• Targeting Midwest and Southeast United States
• Potential opportunities in Mexico and China; reviewing South
America and Europe
• Potential cost efficiencies can be significant
• Potential introduction of smaller diameter closures
Innovative Molding Strategy
26

• Continue to focus on higher growth market sectors
• Maintain our position in industrial products
• Own our technology
• Innovate
• Expand geographically
• Pursue bolt-on acquisitions
• Continue to reduce costs and generate productivity
Summary
27
• Maintain our position in industrial products
• Own our technology
• Innovate
• Expand geographically
• Pursue bolt-on acquisitions
• Continue to reduce costs and generate productivity
Summary
27

Questions & Answers
