Attached files
| file | filename |
|---|---|
| 8-K - CURRENT REPORT - Samson Oil & Gas LTD | v234618_8k.htm |
| EX-99.1 - EXHIBIT 99.1 - Samson Oil & Gas LTD | v234618_ex99-1.htm |
Exhibit 99.2
|
ABN 25 009 069 005
FINANCIAL REPORT
30 June 2011
|
|
TABLE OF CONTENTS
|
TABLE OF CONTENTS
|
Corporate Directory
|
1
|
|
Directors’ Report
|
2
|
|
Auditors’ Independence Declaration
|
18
|
|
Corporate Governance Statement
|
19
|
|
Consolidated Statement of Comprehensive Income
|
25
|
|
Consolidated Balance Sheet
|
26
|
|
Consolidated Cash Flow Statement
|
27
|
|
Consolidated Statement of Changes in Equity
|
28
|
|
Notes to the Consolidated Financial Statements
|
29
|
|
Directors’ Declaration
|
76
|
|
Independent Auditor’s Report
|
77
|
|
Samson Oil & Gas Limited
|
Annual Report – 30 June 2011
|
|
CORPORATE DIRECTORY
|
CORPORATE DIRECTORY
|
Directors
|
Stock Exchange
|
|
V. Rudenno (Chairman)
|
Australian Securities Exchange Limited
|
|
T.M. Barr (Managing Director)
|
Code : SSN
|
|
D. Craig
|
|
|
K. Skipper
|
NYSE Amex
|
|
Code : SSN
|
|
|
Secretary
|
|
|
D.I. Rakich
|
|
|
Registered Office and Business Address
|
Australian Company Number
|
|
Level 36, Exchange Plaza
|
009 069 005
|
|
2 The Esplanade
|
|
|
Perth, Western Australia 6000
|
Australian Business Number
|
|
Telephone: (08) 9220 9830
|
25 009 069 005
|
|
Facsimile: (08) 9220 9820
|
Email
contact@samsonoilandgas.com.au
Web Site
www.samsonoilandgas.com.au
Share Registry
Security Transfer Registrars Pty Ltd
770 Canning Highway
Applecross, Western Australia 6953
Telephone: (08) 9315 2333
Facsimile: (08) 9315 2233
Bankers
Bank of New Zealand Australia
Utility Bay 13.03
100 St Georges Terrace
Perth, Western Australia 6000
Bank of the West
633 17th Street
Denver, Colorado, 80202
Macquarie Bank Limited
No 1. Martin Place
Sydney, New South Wales 2000
Solicitors
Minter Ellison
152 St Georges Terrace
Perth, Western Australia 6000
Davis Graham & Stubbs LLP
1550 Seventeenth Street, Suite 500
Denver, Colorado, 80202
Auditors
PricewaterhouseCoopers
250 St Georges Terrace
Perth, Western Australia 6000
|
Samson Oil & Gas Limited
|
Annual Report – 30 June 2011
|
Page 1 of 78
|
DIRECTORS’ REPORT
|
|
30 June 2011
|
DIRECTORS’ REPORT
In accordance with a resolution of Directors, the Directors submit their report with respect to the results of the operations of Samson Oil & Gas Limited (“the Company”) and its controlled entities (“the Consolidated Entity” or “Group”) for the year ended 30 June 2011 and the state of its affairs at that time.
DIRECTORS
The names and details of the Directors of the Company in office during the whole financial year and until the date of this report, unless noted otherwise, are:
Dr. Victor Rudenno
Chairman – appointed 1 July 2011
Dr. Rudenno was appointed as a Director of the Company in April 2007. In 1984, Dr. Rudenno transitioned to the investment industry as a rated mining and energy analyst working for firms such as James Capel, DBSM and Prudential Bache. In 1995, he moved to the corporate side of investment banking and worked for a number of leading firms including Macintosh Corporate, Deutsche Bank, Hartley Poynton and CIBC. In 2002, Dr. Rudenno co-founded Equity Capital Markets Ltd, an investment bank specialising in corporate advice and capital raising which merged with Interfinancial in 2005 and subsequently was acquired by Tolhurst, an ASX listed broker in 2007. He is currently an Executive Director of Revaluate Pty Limited. He is a Senior Fellow of the Financial Services Institute of Australasia and a Fellow of the Australasian Institute of Mining and Metallurgy. Dr. Rudenno holds a Bachelor of Mining Engineering degree, a Master of Commerce degree and a Doctor of Philosophy for his thesis on Mining Economics. During his earlier academic career, Dr. Rudenno lectured both at the University of New South Wales and part time at University of Sydney, predominantly on mining economics, geostatistics, operations research and thermodynamics. He is the author of the textbook “Mining Valuation Handbook”.
Dr Rudenno is a member of the audit committee.
On 25 August 2010, Dr Rudenno was appointed a non-executive Director of Pilbara Minerals Limited (a publicly listed company.
Dr Rudenno has not held any directorships, other than those disclosed above in the past three years.
Mr Neil Thacker MacLachlan
Chairman – resigned 30 June 2011
Mr MacLachlan has over 30 years’ investment banking experience in Europe, South East Asia and Australia. He was also a former director of Wardley Holdings and James Capel & Co. Limited, investment banking subsidiaries of The Hong Kong and Shanghai Banking Corporation. More recently from 1993 until 1997 he was employed by Barrick Gold Corporation as Executive Vice President, Asia. Mr MacLachlan was also an executive director of Ambrian Partners Ltd (2004-2007) the London based investment bank specialising in natural resources. Mr MacLachlan was appointed a director of the Company on 18 June 1998. Mr MacLachlan was appointed Chairman of the Company effective 19 December 2007. Mr MacLachlan resigned as Director and Chairman of the Board effective 30 June 2011.
Mr MacLachlan was also a member of the Audit Committee.
During the past three years, Mr MacLachlan has also served as a director of the following other listed companies:
|
|
·
|
Kestrel Energy Inc
|
|
|
·
|
Eurogold Ltd*
|
|
|
·
|
Cambridge Mineral Resources plc
|
|
Samson Oil & Gas Limited
|
Annual Report – 30 June 2011
|
Page 2 of 78
|
DIRECTORS’ REPORT
|
|
30 June 2011
|
|
|
·
|
Extract Resources Ltd*
|
|
|
·
|
Oklo Uranium Ltd*
|
|
|
·
|
Kalahari Minerals Plc*
|
|
|
·
|
Brinkley mining plc*
|
|
|
·
|
Ambrian Capital Plc (formerly Golden Prospect Plc)
|
*denotes current directorships
Mr Terence Maxwell Barr
Managing Director
Mr Barr is a petroleum geologist with over 30 years’ experience, including 11 years with Santos. He is credited with the discovery of significant oil and gas reserves during his career. In recent years, Mr Barr has specialised in tight gas exploration, drilling and completion and is considered an expert in this field. This experience and expertise is invaluable given the exposure the Company has to tight gas opportunities in Wyoming and other parts of United States of America. Mr Barr was appointed managing director of the Company on 25 January 2005.
Mr Barr has not held any other directorships in the past three years.
Mr Keith Skipper
Non Executive Director
Mr. Skipper was appointed as director of the Company on 15 September 2008. Mr. Skipper holds a B.Sc (Hons) degree in Geology from Reading University (United Kingdom) and a Master of Science from McMaster University (Canada). He commenced his career with Amoco Canada Petroleum Limited in 1970. Mr. Skipper’s experience includes ten years with Bridge Oil Ltd and several years with Pan Canadian Petroleum Limited (now part of Encana Corporation) and Antrim Energy Inc. in management and senior executive positions. He is a resident of Australia.
Mr Skipper is a member of the audit committee.
During the last three years, Mr. Skipper has been a Director of the following publicly listed companies:
|
|
·
|
Rawson Resources Limited*
|
|
|
·
|
Red Sky Energy Limited
|
|
|
·
|
Circumpacific Energy Corporation
|
* denotes current directorships
Dr DeAnn Craig
Non Executive Director – appointed 11 July 2011
Dr Craig was appointed as a Director of the Company on 11 July 2011. Dr Craig holds an Interdisciplinary PhD with emphasis in Petroleum Engineering and Operations Research from the Colorado School of Mines (USA). She has also earned several degrees from Colorado School of Mines including Masters of International Political Economy of Resources, Masters of Science Mineral Economics and Business and a Bachelor of Science Chemical and Petroleum Refining Engineering. In addition Dr Craig holds an MBA from Regis University in Denver, Colorado. During her career Dr. Craig has been a drilling engineer, a reservoir engineer responsible for reserves determination and property valuation, and progressed to senior management in several companies, including Phillips Petroleum, now ConocoPhillips, and CNX Gas. She is a registered professional engineer in the state of Colorado.
In the previous five years she has served as Senior Vice President, Asset Assessment CNX Gas Corporation, served as an Adjunct Professor in the Petroleum Engineering Department at the Colorado School of Mines and was appointed by the Governor of Colorado to serve on the Colorado Oil and Gas Conservation Commission. Currently she is consulting to the oil and gas industry.
|
Samson Oil & Gas Limited
|
Annual Report – 30 June 2011
|
Page 3 of 78
|
DIRECTORS’ REPORT
|
|
30 June 2011
|
Dr Craig is a member of the Audit Committee.
Dr Craig has not held any other directorships in the past three years.
Unless indicated otherwise, all Directors held their positions as Directors throughout the year and up to the date of this report.
COMPANY SECRETARY
Mr Denis Ivan Rakich F.C.P.A
Mr Rakich is an accountant and Company Secretary with extensive corporate experience within the petroleum services, petroleum and mineral production and exploration industries. Mr Rakich is responsible for the corporate management of Samson Oil & Gas Limited and the maintenance of the Company’s ASX listing. He is a member of the Australian Society of Accountants and is currently Company Secretary for another public Company in the resources sector.
DIRECTORS’ SHAREHOLDINGS
At the date of this report, the interests of the Directors in shares and share options in the Company are:
|
Number of Ordinary
Shares
|
Number of Options
over Ordinary
Shares
|
|||||||
|
T.M. Barr
|
10,026,142 | 10,512,960 | ||||||
|
V. Rudenno
|
4,236,502 | 6,800,000 | ||||||
|
K. Skipper
|
736,502 | 6,500,000 | ||||||
|
D. Craig
|
- | - | ||||||
PRINCIPAL ACTIVITIES
The principal activities during the year of entities within the Consolidated Entity were oil and gas exploration, development and production in the United States of America. There have been no significant changes in the nature of these activities during the year.
The Company’s focus in the future will continue to be on oil and gas exploration, development and production in the USA. The Company will look to developing existing acreage, whilst continuing to identify potential project acquisitions.
OPERATING AND FINANCIAL REVIEW
Financial Results
The Consolidated Entity made a gross profit of $2,624,678 (2010: $846,895) from continuing operations, for the financial year ended 30 June 2011 despite several delays experienced in the fracture stimulation of two wells in the North Stockyard Field.
The result for the financial year ended 30 June 2011 from continuing operations, after provision for income tax was a profit attributable to members of the parent of $45,770,082 (2010: $1,197,240). Included in the current year result is exploration expenditure expensed of $403,826 (2010: $1,569,456). This has been expensed in line with the Consolidated Entity’s accounting policy to expense all exploration expenditure until such time as it is expected that the future economic benefit will flow from the expenditure.
In September 2010 the Company sold a portion of interests in acreage in Goshen County, Wyoming. The Company recognised $73,199,687 (2010: $nil) in profit from sale of assets.
|
Samson Oil & Gas Limited
|
Annual Report – 30 June 2011
|
Page 4 of 78
|
DIRECTORS’ REPORT
|
|
30 June 2011
|
In March 2011, the Company sold its interests in the Jonah and Lookout Wash Fields for $6,300,000. The Company recognised a $159,196 profit on this sale before tax. This has been recognised in discontinued operations. This sale gave rise to an income tax benefit of $7,911,211 which has also been allocated to discontinued operations.
The Company has also recognised an income tax expense/(benefit) of $13,100,577 (2010: ($6,317,000)), including the benefit allocated to discontinued operations. This relates to the recognition of net operating losses that are likely to be used to offset the income tax payable is a result of the sale of a portion of the Company’s Goshen County acreage.
Discontinued operations
During the current year, the Company sold its interests in its Jonah and Lookout Wash fields. These fields contributed to approximately 65% of gas revenues for the Company and thus the properties have been treated as discontinued operations. The sale of the properties was effective 1 January 2011. For the year ended 30 June 2011, the Company recorded a pre tax loss from discontinued operations of $6,356,108 (2010: $380,007), including $6,678,940 (2010: $1,226,664) in impairment losses. The impairment loss in the current year is primarily as a result of the sale of the properties. No value was given in the sale to the proved undeveloped locations previously carried on the Balance Sheet. This sale gave rise to an income tax benefit of $7,911,211 which has also been allocated to discontinued operations.
Corporate Activities
During the year, the Company incorporate Samson Oil and Gas Montana USA, Inc. This company was incorporated in Colorado and is a 100% owned subsidiary of Samson Oil and Gas USA, Inc.
Development Activities
Bakken Field, Williams County, North Dakota
Gary #1-24H
In May 2010, the Company drilled its third Bakken well, the Gary #1-24H. This well was successfully fracced in September 2010 and has commenced production with an initial production rate of 2,780 barrels of oil equivalent per day (“BOEPD”). This initial production has declined as expected. This well averaged 121 barrels of oil per day (“BOPD”) during July 2011.
Rodney #1-14H
In July 2010, the Company successfully drilled its forth Bakken well, the Rodney #1-14H. This well was successfully fracced and commenced production with an initial production rate of 1,100 BOPD. In July 2011, this well averaged 365 BOPD.
Earl #1 - 13H
This well was drilled in October 2010 and was successfully fracced and commenced production in March 2011 with an initial production rate of 1,300 BOPD. During July 2011, this well averaged 520 BOPD.
Exploration Activities
Niobrara formation, Goshen County, Wyoming
In June 2010, the Company agreed to sell a portion of its acreage in Goshen County, Wyoming to an Chesapeake Energy Corporation for $3,275 per acre. This sale was completed in November 2010 with Samson recognising a net profit from the sale of $73,199,687.
In January 2011, Samson entered into a three way participation agreement with Halliburton Energy Services and its existing private company partner for the evaluation and development of the Niobrara Formation and other conventional targets in the Denver-Julesburg Basin for a working interest in part of the Company’s Hawk Springs project in Goshen County, Wyoming. Under the agreement, Samson and its partner will be free carried through the drilling and completion of two wells. The first of these two wells is the Defender US 33 #2-29H, a 4,300 foot horizontal well at a depth of 7,450 feet, which is currently being drilled. The second well is expected to be drilled in November 2011.
|
Samson Oil & Gas Limited
|
Annual Report – 30 June 2011
|
Page 5 of 78
Production Activities
During the year the Consolidated Entity produced approximately 64,405 (2010: 30,719) barrels of oil and 423,077 (2010: 668,848) Mcf of gas.
Reserves
The Company has determined its hydrocarbon reserves (as defined in the ASX listing rules) at an effective date of 1 July 2011 to be as follows:
|
Oil Mbbls
|
Gas MMcf
|
MBOE
|
NPV10* US$’000’s
|
|||||||||||||
|
Proved
|
505 | 1,349 | 729 | 20,121 | ||||||||||||
|
Probable
|
- | - | - | - | ||||||||||||
|
Total
|
505 | 1,349 | 729 | 20,121 | ||||||||||||
*NPV10 – this is the Net Present Value of the future cash flows, discounted at 10%.
2010 Reserves
|
Oil Mbbls
|
Gas MMcf
|
MBOE
|
NPV10* US$’000’s
|
|||||||||||||
|
Proved
|
465 | 10,445 | 2,205 | 24,812 | ||||||||||||
|
Probable
|
5 | 494 | 87 | 1,443 | ||||||||||||
|
Total
|
470 | 10,939 | 2,293 | 26,255 | ||||||||||||
*NPV10 – this is the Net Present Value of the future cash flows, discounted at 10%.
The increase in the proved oil reserves is as a result of the successful drilling in the Company’s North Stockyard field in North Dakota. The decrease in the proved gas reserves is a result of the sale of the Company’s interest in the Jonah and Lookout Wash fields during the year.
The estimate has used the NYMEX forward curve as at 30 June 2011 less an appropriate differential to take into account the difference between the NYMEX pricing and the price received by the Company at its various sales points.
DIVIDENDS
No dividend was paid or recommended for payment during the year (2010: $Nil).
SHARE OPTIONS
As at the date of this report, there were 320,665,565 (2010: 347,940,277) unissued ordinary shares under option. All option exercise prices are denominated in Australian Dollars unless noted otherwise.
5,500,000 options were granted on 22 May 2006 to Directors. These options had an exercise price of 45 cents and expired unexercised on 31 May 2011.
3,000,000 options were granted on 7 June 2006 to employees and other parties. These options had an exercise price of 45 cents and expired unexercised on 31 May 2011. 2,000,000 of these options with an exercise price of 45 cents were issued to an executive who left the Company’s employment. These options expired on 3 November 2007, unexercised.
4,000,000 options were granted on 11 October 2007 to key management personnel. These options have an exercise price of 30 cents per share, an expiry date of 10 October 2012 and vested immediately.
2,000,000 options were granted on 12 May 2008 to key management personnel. These options have an exercise price of 25 cents per share and an expiry date of 11 May 2013. 600,000 options vested immediately, 600,000 vested following twelve months of service by the employee on 1 April 2009, and the remainder vested on 1 April 2010, following 24 months of employment service.
3,379,077 options were granted on 10 October 2007 to participants of a capital raising, completed at the same time. These options have an exercise price of 30 cents per share, an expiry date of 10 October 2012 and vested immediately.
|
Samson Oil & Gas Limited
|
Annual Report – 30 June 2011
|
Page 6 of 78
344,431,144 options were granted on 6 November 2009, in conjunction with the rights offering completed at that time. An additional 12,500,007 options with the same terms and conditions were issued in January 2010. The options have an exercise price of 1.5 cents per share, an expiry date of 31 December 2012 and vested immediately. 109,144,663 of these options have been exercised to the date of this report.
29,000,000 options were granted on 18 November 2010 to the Directors of the Company. These options have an exercise price of 8 cents per share and an expiry date of 31 October 2014. They vested immediately.
32,000,000 options were granted on 17 December 2010 to employees of the Company. These options have an exercise price of 8 cents per share and an expiry date of 31 December 2014. One third of these options vested upon grant, another third will vest on 31 January 2012, with the remainder vesting on 31 January 2013, provided the employee is still employed with the Company on the vesting dates. 500,000 of the vested options were exercised in April 2011.
4,000,000 options were granted on 1 July 2011 to an employee of the Company. These options have an exercise price 16.4 cents and an expiry date of 31 December 2014. One third of these options vested on 31 July 2011, another third will vest on 31 July 2012 with the remainder vesting on 31 July 2013, provided the employee is still employed with the Company on the vesting dates.
Option holders do not have any right, by virtue of the option, to participate in any share issue of the Company.
Shares issued as a result of the exercise of options
86,819,821 1.5 cent options have been exercised from 1 July 2010 to the date of this report.
500,000 8 cent options have been exercised from 1 July 2010 to the date of this report.
Remuneration Report
The remuneration report is set out under the following headings:
A Principles used to determine the nature and amount of remuneration
B Details of remuneration
C Service agreements
D Company performance
The information provided in this remuneration report has been audited as required by section 308 (3C) of the Corporations Act 2001.
A Principles used to determine the nature and amount of remuneration
The objective of the Consolidated Entity’s executive reward framework is to ensure reward for performance is competitive and appropriate for the results delivered. The performance of the Company depends upon the quality of its Directors and executives. To be successful and maximise shareholder wealth, the Company must attract, motivate and retain highly skilled Directors and executives.
Remuneration packages applicable to the executive Directors, senior executives and non-executive Directors are established with due regard to:
|
|
·
|
Performance against set goals
|
|
|
·
|
Ability to attract and retain qualified and experienced Directors and senior executives.
|
Due to the size and nature of the Company’s operations, the Directors do not believe the establishment of a remuneration committee is warranted. The Board of Directors is responsible for determining and reviewing compensation arrangements for Directors and executives. The Board assesses the appropriateness of the nature and amount of remuneration of Directors and executives on a periodic basis by reference to relevant employment market conditions with the overall objective of ensuring maximum stakeholder benefit from the retention of a high quality Board and executive team.
|
Samson Oil & Gas Limited
|
Annual Report – 30 June 2011
|
Page 7 of 78
Non-executive Directors
Fees and payments to non-executive Directors reflect the demands which are made on, and the responsibilities of, the Directors. Non-executive Directors’ fees and payments are reviewed annually by the board. The Chair’s fees are determined independently of the other non-executive Directors. The Chair is not present at any discussions relating to determination of his own remuneration.
The ASX Listing Rules specify that the aggregate remuneration of non-executive Directors shall be determined from time to time by a general meeting. An amount not exceeding the amount determined is then divided between Directors as agreed. The latest determination was at the Annual General Meeting held on 18 November 2010 when shareholders approved an aggregate remuneration of A$500,000 per annum. The amount of aggregate remuneration sought to be approved by shareholders and the manner in which it is apportioned amongst Directors is reviewed annually.
Non-executive Directors are encouraged by the Board to hold shares in the Company (purchased by Directors on market). It is considered good governance for Directors to have a stake in the Company on whose Board they sit.
Remuneration Incentives
The Company does not have a policy in place limiting the Directors exposure to risk in relation to the Company’s options.
The remuneration of non-executive Directors for the period ending 30 June 2011 and 2010 is detailed in Table 1 and Table 2.
Executive Pay
The Company aims to reward executives with a level and mix of remuneration commensurate with their position and responsibilities within the Company and so as to:
|
|
·
|
Align the interests of executives with those of shareholders;
|
|
|
·
|
Link reward with strategic goals and performance of the Company; and
|
|
|
·
|
Ensure total remuneration is competitive by market standards.
|
Base pay for executives is reviewed on the contract renewal date to ensure the base pay is set to reflect the market for a comparable role. There are no guaranteed base pay increases included in any executives’ contracts.
Remuneration consists of fixed remuneration and remuneration incentives in the form of options issued in the Company.
The level of fixed remuneration is reviewed annually by the Board having due regard to performance against goals set for the year and relevant comparative information. The Board has access to external advice independent of management if required.
Remuneration Incentives
Directors’ remuneration is not linked to either long term or short term incentives. The Board feels that the expiry date and exercise price of the options issued to the Directors in the current and prior years are sufficient to align the goals of the Directors and executives with those of the shareholders to maximise shareholder wealth. There are no performance criteria or service conditions attached to options issued to Directors.
During the prior year, the Board agreed that vesting conditions should be included in relation to the options issued to new executives. Previously, similar to the Directors incentives detailed above, no conditions were placed on options issued to executives.
|
Samson Oil & Gas Limited
|
Annual Report – 30 June 2011
|
Page 8 of 78
|
DIRECTORS’ REPORT
|
|
30 June 2011
|
A bonus structure is in place for the calendar year 2011 for all employees. The bonus is payable dependent on the movement in the volume weighted average share price (from trades on the Australian Securities Exchange and NYSE Amex, adjusted for the impact of foreign exchange) from December 2010 compared to December 2011. No bonus is payable if the share price decreases from December 2010 or does not increase above 25%. The maximum bonus is payable if the share price increases by 100% from December 2010 to December 2011. A total bonus of $1,353,170 may be paid if the combined volume weighted average share price during December 2011, as calculated on individual trades across both exchanges is greater than 100% of 6.3 cents (AUD). This was the volume weighted average price calculated in December 2010 based on individual trades on the ASX and NYSE Amex. The value of trades on the NYSE Amex were translated to AUD based on the exchange rate on each trading day in December from the Reserve Bank of Australia website.
No bonuses were paid by the Company for the year ended 30 June 2010.
B Details of Remuneration
Amounts of remuneration
Details of remuneration of the Directors and executives of the Company and Consolidated Entity in accordance with the requirements of the Corporations Act 2001 and its Regulations are set out in the following tables.
For the purposes of this report, Key Management Personnel (KMP) of the Consolidated Entity are defined as those persons having authority and responsibility for planning, directing and controlling the major activities of the Company and the Consolidated Entity, directly or indirectly, including any director (whether executive or otherwise) of the Parent Company, and includes the four executives in the Parent and Consolidated Entity receiving the highest remuneration.
For the purposes of this report, the term “executive” encompasses the Chief Executive Officer, Company Secretary, Chief Financial Officer, Vice President – Exploration and Vice President - Engineering. There are no further employees employed by either the Company or its subsidiaries who meet the definition of executive, therefore only the five executives detailed above are included in this report. These five employees constitute the Top 5 highest paid executives for the purposes of this report. During the year and as at the date of this report, unless stated otherwise, the key management personnel were:
|
Neil MacLachlan
|
Chairman (resigned effective 30 June 2011)
|
|
Terry Barr
|
Managing Director
|
|
Victor Rudenno
|
Non-executive Director (appointed Chairman effective 1 July 2011)
|
|
Keith Skipper
|
Non-executive Director
|
|
Denis Rakich
|
Company Secretary
|
|
Robyn Lamont
|
Chief Financial Officer
|
|
David Ninke
|
Vice President – Exploration
|
|
Dan Gralla
|
Vice President – Engineering (appointed 1 January 2011)
|
|
Samson Oil & Gas Limited
|
Annual Report – 30 June 2011
|
Page 9 of 78
|
DIRECTORS’ REPORT
|
|
30 June 2011
|
Table 1: Key Management Personnel compensation for the year ended 30 June 2011
|
Short Term
|
|
Share-based Payments
|
|
|
||||||||||||||||||||||||||||||||
|
Salary &
Fees
$
|
Bonus
$
|
Non-monetary
Benefits
$
|
Accrual for
possible
bonus*
$
|
Post
Employment
Super -annuation$
|
Options
$
|
Ordinary
Shares
$
|
Total
$ |
Total
Performance
Related
% |
||||||||||||||||||||||||||||
|
Directors
|
||||||||||||||||||||||||||||||||||||
|
T.Barr
|
333,169 | 262,500 | 3,826 | 132,000 | 14,752 | 360,000 | 54,439 | 1,160,686 | 42.3 | % | ||||||||||||||||||||||||||
|
N. MacLachlan
|
71,630 | - | - | - | - | 252,000 | 19,403 | 343,033 | 73.5 | % | ||||||||||||||||||||||||||
|
K. Skipper
|
23,070 | - | - | - | 26,330 | 216,000 | 6,314 | 271,714 | 79.5 | % | ||||||||||||||||||||||||||
|
V. Rudenno
|
49,400 | - | - | - | - | 216,000 | 6,314 | 271,714 | 79.5 | % | ||||||||||||||||||||||||||
|
Executives
|
||||||||||||||||||||||||||||||||||||
|
D. Rakich1
|
108,261 | 16,796 | - | 28,800 | 10,826 | 91,900 | 15,784 | 272,367 | 44.3 | % | ||||||||||||||||||||||||||
|
R. Lamont1
|
211,477 | 30,000 | 1,986 | 55,920 | 15,621 | 128,660 | 24,386 | 468,050 | 39.4 | % | ||||||||||||||||||||||||||
|
D. Ninke1
|
241,479 | 135,000 | - | 72,480 | 15,125 | 128,660 | 23,378 | 616,122 | 32.6 | % | ||||||||||||||||||||||||||
|
D. Gralla1, 2
|
132,648 | - | - | 67,200 | 7,350 | 128,660 | - | 335,858 | 58.3 | % | ||||||||||||||||||||||||||
|
Total
|
1,171,134 | 444,296 | 5,812 | 356,400 | 90,004 | 1,521,880 | 150,018 | 3,739,544 | ||||||||||||||||||||||||||||
* This expense relates to the current year expense associated with the calendar year 2011 bonus plan. Based on probability analysis, using Monte Carlo simulation, 60% of the total bonus is expected to be paid out. This expense represents the accrual from 1 January 2011 to 30 June 2011. No cash has been paid in relation to this bonus.
1 These options were issued during the year ended 30 June 2011; however are subject to a vesting schedule dependent on each employee’s continued employment with the Company. This value represents the portion of the expense recognised during the current year.
2 Mr Gralla was appointed Vice President – Engineering, effective 1 January 2011. Prior to that he was working for the Company on a contract basis. Whitehall Engineering (an entity he controlled) was paid $158,952 for his services, including a bonus of $42,500.
|
Samson Oil & Gas Limited
|
Annual Report – 30 June 2011
|
Page 10 of 78
|
DIRECTORS’ REPORT
|
|
30 June 2011
|
Table 2: Key Management Personnel compensation for the years ended 30 June 2010
|
Short Term
|
|
Share-based
Payments
|
|
|
||||||||||||||||||||||||||||
|
Salary &
Fees
$
|
Bonus
$
|
Non-monetary
Benefits
$
|
Post
Employment
Superannuation$
|
Options
$
|
Ordinary
Shares
|
Total
$ |
Total Performance
Related
% |
|||||||||||||||||||||||||
|
Directors
|
||||||||||||||||||||||||||||||||
|
T.Barr
|
212,644 | - | - | 10,966 | - | 38,735 | 262,345 | 0 | % | |||||||||||||||||||||||
|
N. MacLachlan
|
68,371 | - | - | - | - | 6,015 | 74,386 | 0 | % | |||||||||||||||||||||||
|
K. Skipper
|
25,089 | - | - | 2,259 | 2,755 | 4,010 | 34,113 | 8.07 | % | |||||||||||||||||||||||
|
V. Rudenno
|
27,348 | - | - | - | 2,755 | 4,010 | 34,113 | 8.07 | % | |||||||||||||||||||||||
|
Executives
|
||||||||||||||||||||||||||||||||
|
D. Rakich
|
84,541 | - | - | 6,837 | - | 10,025 | 101,403 | 0 | % | |||||||||||||||||||||||
|
R. Lamont
|
134,728 | - | 6,307 | 10,419 | - | 17,351 | 168,805 | 0 | % | |||||||||||||||||||||||
|
D. Ninke*
|
168,860 | - | 3,873 | 12,818 | 14,218 | 16,634 | 216,403 | 7.69 | % | |||||||||||||||||||||||
|
Total
|
721,581 | - | 10,180 | 43,299 | 19,728 | 96,780 | 891,568 | |||||||||||||||||||||||||
*These options were issued during the year ended 30 June 2008, however a portion vested during the current year, therefore the expense has been recognised in line with the vesting of these options.
|
Samson Oil & Gas Limited
|
Annual Report – 30 June 2011
|
Page 11 of 78
|
DIRECTORS’ REPORT
|
|
for the year ended 30 June 2011
|
Table 3 Compensation options: Granted and vested during the year (Consolidated) – in Australian Dollars
|
Name
|
Grant
Number
|
Grant
Date
|
Fair
value
per
option
at grant
date
$
|
Exercise
price per
option
$
|
Expiry
date
|
First
Exercise
Date
|
Last
exercise
date
|
Vested
No.*
|
Vested
%
|
|||||||||||||||||
|
Directors
|
||||||||||||||||||||||||||
|
T. Barr
|
10,000,000 |
18 Nov 2010
|
0.036 | 0.08 |
31 Oct 2014
|
19 Nov 2010
|
31 Oct 2014
|
10,000,000 | 100 | |||||||||||||||||
|
N. MacLachlan
|
7,000,000 |
18 Nov 2010
|
0.036 | 0.08 |
31 Oct 2014
|
19 Nov 2010
|
31 Oct 2014
|
7,000,000 | 100 | |||||||||||||||||
|
V. Rudenno
|
6,000,000 |
18 Nov 2010
|
0.036 | 0.08 |
31 Oct 2014
|
19 Nov 2010
|
31 Oct 2014
|
6,000,000 | 100 | |||||||||||||||||
|
K. Skipper
|
6,000,000 |
18 Nov 2010
|
0.036 | 0.08 |
31 Oct 2014
|
19 Nov 2010
|
31 Oct 2014
|
6,000,000 | 100 | |||||||||||||||||
|
Executives
|
||||||||||||||||||||||||||
|
D. Rakich*
|
5,000,000 |
17 Dec 2010
|
0.031 | 0.08 |
31 Dec 2014
|
31 Jan 2011
|
31 Dec 2014
|
1,666,666 | 33 | |||||||||||||||||
|
R. Lamont*
|
7,000,000 |
17 Dec 2010
|
0.031 | 0.08 |
31 Dec 2014
|
31 Jan 2011
|
31 Dec 2014
|
2,333,333 | 33 | |||||||||||||||||
|
D. Ninke*
|
7,000,000 |
17 Dec 2010
|
0.031 | 0.08 |
31 Dec 2014
|
31 Jan 2011
|
31 Dec 2014
|
2,333,333 | 33 | |||||||||||||||||
|
D. Gralla*
|
7,000,000 |
17 Dec 2010
|
0.031 | 0.08 |
31 Dec 2014
|
31 Jan 2011
|
31 Dec 2014
|
2,333,333 | 33 | |||||||||||||||||
|
Total
|
55,000,000 |
-
|
- | - |
-
|
37,666,665 | - | |||||||||||||||||||
* These options have the following vesting schedule, assuming the employee is still employed by the Company – one third vested on 31 January 2011, one third will vest on 31 January 2012 with the remaining third vesting on 31 January 2013.
Table 4 Compensation options: Granted and vested during the prior year (Consolidated) – in Australian Dollars
|
Name
|
Grant
Number
|
Grant
Date
|
Fair
value
per
option
at grant
date
(cents)
|
Exercise
price per
option
$
|
Expiry
date
|
First
Exercise
Date
|
Last
exercise
date
|
Vested
No.*
|
Vested
%
|
|||||||||||||||||||||||||||
|
Directors
|
||||||||||||||||||||||||||||||||||||
|
T. Barr
|
- | - | - | - | - | - | - | - | - | |||||||||||||||||||||||||||
|
N. MacLachlan
|
- | - | - | - | - | - | - | - | - | |||||||||||||||||||||||||||
|
V. Rudenno
|
500,000 |
18 Nov 2009
|
0.006 | 0.20 |
30 Nov 2013
|
19 Nov 2009
|
30 Nov 2013
|
500,000 | 100 | |||||||||||||||||||||||||||
|
K. Skipper
|
500,000 |
18 Nov 2009
|
0.006 | 0.20 |
30 Nov 2013
|
19 Nov 2009
|
30 Nov 2013
|
500,000 | 100 | |||||||||||||||||||||||||||
|
Executives
|
||||||||||||||||||||||||||||||||||||
|
D. Rakich
|
- | - | - | - | - | - | - | - | - | |||||||||||||||||||||||||||
|
R. Lamont
|
- | - | - | - | - | - | - | - | - | |||||||||||||||||||||||||||
|
D. Ninke*
|
- | - | - | 0.25 | - | - | - | 800,000 | 40 | |||||||||||||||||||||||||||
|
Total
|
1,000,000 | - | - | - | - | 1,800,000 | - | |||||||||||||||||||||||||||||
* 600,000 options vested at grant date, 600,000 options vested following the completion of twelve months employment by Mr Ninke on 1 April 2009. The remaining 800,000 options vested following the completion of twenty four months employment by Mr Ninke on 1 April 2010.
500,000 remuneration options were exercised during the year. The company received cash of A$40,000/US$42,216 in relation to this exercise.
|
Samson Oil & Gas Limited
|
Annual Report – 30 June 2011
|
Page 12 of 78
|
DIRECTORS’ REPORT
|
|
for the year ended 30 June 2011
|
C Service Agreements
It is the Board’s policy that employment contracts are only entered into with the managing director and senior executives. As such contracts have been entered into for Mr. Barr, Mr. Gralla, Mr. Ninke and Ms Lamont. Details of these contracts are included below.
Mr. Barr – Chief Executive Officer
Effective 1 January 2011, Mr Barr has been retained by the Company to act as the Company’s President, Managing Director and Chief Executive officer for a period of three years with an option to extend the contract for an additional three years. The contract allows for total compensation of $440,000 (cash and non cash benefits) with a bonus payable of up to $440,000 for the calendar year 31 December 2011, based on the Company’s share price performance from December 2010 to December 2011. The bonus structure for the remaining years of the contract has not yet been set but provision has been made in the contract for a bonus to be payable.
Mr. Ninke – Vice President Exploration
Effective 1 January 2011, Mr Ninke has been retained by the Company to act as Vice President - Exploration for a period of three years with an option to extend the contract for an additional three years. The contract allows for total compensation of $302,000 (cash and non cash benefits) with a bonus payable of up to $241,600 for the calendar year 31 December 2011, based on the Company’s share price performance from December 2010 to December 2011. The bonus structure for the remaining years of the contract has not yet been set but provision has been made in the contract for a bonus to be payable. Mr Ninke also retains the right to receive a 1% revenue royalty from production from prospects identified and recommended prior to 31 March 2011, being the Diamondback prospect. This prospect has yet to be drilled.
Ms Lamont – Chief Financial Officer
Effective 1 January 2011, Ms Lamont has been retained by the Company to act as the Vice President – Finance and Chief Financial Officer for a period of three years with an option to extend the contract for an additional three years. The contract allows for total compensation of $233,009 (cash and non cash benefits) with a bonus payable of up to $186,407 for the calendar year 31 December 2011, based on the Company’s share price performance from December 2010 to December 2011. The bonus structure for the remaining years of the contract has not yet been set but provision has been made in the contract for a bonus to be payable.
Mr Gralla – Vice President Engineering
Effective 1 January 2011, Mr Gralla has been retained by the Company to act as the Vice President – Engineering for a period of three years with an option to extend the contract for an additional three years. The contract allows for total compensation of $280,000 (cash and non cash benefits) with a bonus payable of up to $224,000 for the calendar year 31 December 2011, based on the Company’s share price performance from December 2010 to December 2011. The bonus structure for the remaining years of the contract has not yet been set but provision has been made in the contract for a bonus to be payable.
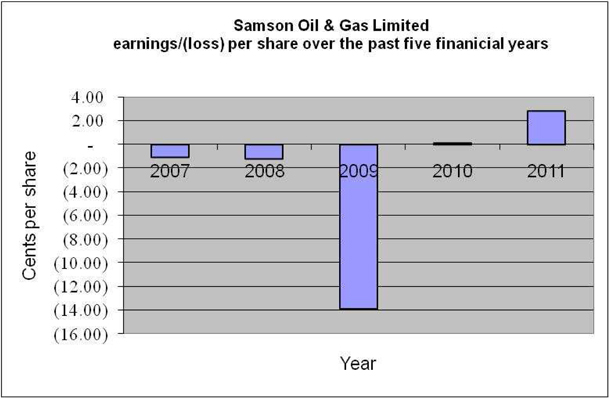
D Company Performance
The Company’s performance is reflected in the movement in the Company’s earnings/(loss) per share (EPS) over time. The graph below shows Samson Oil & Gas Limited’s basic EPS history for the past five years, including the current period.
EPS for the years ended 30 June 2011, 2010, 2009, 2008 and 2007 has been measured based on the net loss as calculated by the application of Australian Accounting Standards.
|
Samson Oil & Gas Limited
|
Annual Report – 30 June 2011
|
Page 13 of 78
|
DIRECTORS’ REPORT
|
|
for the year ended 30 June 2011
|
CORPORATE STRUCTURE
Samson Oil & Gas Limited is a Company limited by shares that is incorporated and domiciled in Australia.
EMPLOYEES
The Consolidated Entity employed 8 employees at 30 June 2011 (2010: 7 employees).
LIKELY DEVELOPMENTS AND EXPECTED RESULTS
The likely developments of the Consolidated Entity during the next financial year involve the ongoing principal activities of oil and gas exploration, development and production in the United States of America.
The Consolidated Entity plans to pursue three objectives.
|
|
1)
|
The appraisal and development of the retained acreage in the Hawks Springs Project, Goshen County, Wyoming
|
|
|
2)
|
The appraisal and development of newly acquired acreage in the Roosevelt Project, Roosevelt County, Montana and
|
|
|
3)
|
The continued production of the Company’s North Stockyard Bakken Formation project.
|
SIGNIFICANT CHANGES IN THE STATE OF AFFAIRS
Since the Company’s listing on the NYSE Amex in January 2008, it has been classified as a Foreign Private Issuer by the Securities Exchange Commission (“SEC”) in the United States. This classification granted the Company relief from some reporting obligations in the US, in particular the Company did not have to comply with US Generally Accepted Accounting Principles (“US GAAP”) or to file a 10-K Annual Report or 10-Q quarterly reports with the SEC.
Following the migration of greater than 50% of the outstanding share ownership to US holders as at 31 December 2010 (the SEC’s annual test date), the Company changed its Foreign Private Issuer status with the SEC, effective 1 July 2011 and became a US Domestic issuer. This has a number of implications for the Company as the SEC now views Samson Oil & Gas Limited as a US Domestic issuer despite the Company’s home exchange being the ASX. The Company is now required to file with the SEC its 10-K Annual Report for the year ended 30 June 2011 within 75 days of the end of the fiscal year. The10-K utilises US GAAP rather than IFRS will be filed simultaneously with this report in the United States. This change in status is expected to increase compliance and regulatory costs for the Company but is expected to provide greater comparability and transparency in reporting amongst its US peers.
|
Samson Oil & Gas Limited
|
Annual Report – 30 June 2011
|
Page 14 of 78
|
DIRECTORS’ REPORT
|
|
for the year ended 30 June 2011
|
Other than the changes mentioned above in the operating review or below in significant events after balance date that have occurred during the year, there has not been any matter or circumstance that has occurred during the year or that has arisen since the end of the financial year that has significantly affected, or may significantly affect:
|
|
·
|
the operations;
|
|
|
·
|
the results of those operations;
|
|
|
·
|
or the state of affairs of the Consolidated Entity in subsequent financial years.
|
ENVIRONMENTAL REGULATIONS AND PERFORMANCE
The Consolidated Entity has various permits and licenses to operate in different states within the United States of America.
There have been no significant known breaches of the Consolidated Entity’s licence or permit conditions during the year ended 30 June 2011.
DIRECTORS’ MEETINGS
The numbers of meetings of the Company’s board of Directors and of the audit committee held during the year ended 30 June 2011, and the numbers of meetings attended by each director were:
|
Full meetings of Directors
|
Audit Committee Meetings
|
|||||||||||||||
|
No. of Meetings
held while in office
|
Meetings
attended
|
No. of Meetings
held while in office
|
Meetings
attended
|
|||||||||||||
|
T.M. Barr
|
18 | 18 | *** | *** | ||||||||||||
|
N.T. MacLachlan
|
18 | 18 | 3 | 3 | ||||||||||||
|
K. Skipper
|
18 | 18 | 3 | 3 | ||||||||||||
|
V. Rudenno
|
18 | 18 | 3 | 3 | ||||||||||||
*** Not a member of the audit committee
INDEMNIFICATION AND INSURANCE OF DIRECTORS
During the financial year, the Consolidated Entity incurred a premium of $85,000 (2010: $65,000) to insure Directors and officers of the Consolidated Entity.
The liabilities insured include costs and expenses that may be incurred in defending civil or criminal proceedings that may be brought against the officers in their capacity as officers of the Consolidated Entity, and any other payments arising from liabilities incurred by the officers in connection with such proceedings. This does not include such liabilities that arise from conduct involving a wilful breach of duty by the officers or the improper use by the officers of their position or of any information to gain advantage for themselves or someone else or to cause detriment to the Company. It is not possible to apportion the premium between amounts relating to insurance against legal costs and those relating to other liabilities.
CORPORATE GOVERNANCE
The Directors of Samson Oil & Gas Limited aspire to maintain the standards of corporate governance appropriate to the size of the Company. The Company’s corporate governance statement is contained within the next section of this report.
|
Samson Oil & Gas Limited
|
Annual Report – 30 June 2011
|
Page 15 of 78
|
DIRECTORS’ REPORT
|
|
for the year ended 30 June 2011
|
AUDIT COMMITTEE
The members of the audit committee during the year were Dr Victor Rudenno, Mr Neil MacLachlan and Mr Keith Skipper. Mr MacLachlan resigned as a member of the Board of Directors and therefore of the audit committee effective 30 June 2011. He was replaced by Dr DeAnn Craig on the Audit Committee, when she was appointed on 10 July 2011.
See detail under Directors Meetings for details of Audit Committee meetings attended by the Directors.
SIGNIFICANT EVENTS AFTER THE BALANCE DATE
Acquisition of acreage in Roosevelt County, Montana
In July 2011, the Consolidated Entity closed on the purchase of 20,028 acres of oil and gas leases in the Fort Peck Indian Reservation in Roosevelt County, Montana from the Fort Peck Energy Company. This acquisition was the first tranche of a three tranche purchase of the Roosevelt Project for the Company. The first tranche includes a two well drilling commitment. Once the two wells have been drilled, Samson has the option to acquire 100% working interest in an additional 20,000 acres from Fort Peck Energy Company. Following the drilling of the two appraisal wells in Tranche 1, FPEC will have the right to back into a 33.34% position in both tranches by reimbursing Samson’s acreage and drilling costs to the extent of that equity. In such an event, Samson will have a 66.66% working interest and a 53.34% net revenue interest. Tranche 3 is a 50,000 acre area covered by an Area of Mutual Interest where Samson and FPEC have agreed to jointly acquire additional leases, with Samson holding a 66.66% working interest (53.34% net revenue interest) and FPEC a 33.34% working interest. The first of these wells will be Australia II and is expected to be drilled in October 2011.
Defender US33 #2-29
In August 2011, the Consolidated Entity commenced drilling operations on its first appraisal well in the Hawk Springs project. Samson has a 37.5% working interest in this well, though is being carried on all costs by Halliburton Energy Services.
Acquisition of additional Hawk Springs acreage, Wyoming
In August 2011, Samson was advised that has been awarded, on a conditional basis, approximately 956 net acres of leasehold offered by competitive tender from the University of Wyoming. This land is part of the University’s agricultural research facility. The Consolidated Entity has also been successful in acquiring additional acreage in the State of Wyoming’s lease sales as well as leasing acreage from fee owners. Accordingly, the Consolidated Entity has now increased its holding to 17,489 net acres in the Hawk Springs area. This holding assumes that Samson’s farminee exercises its full right to earn a 25% interest within the farmin area.
NON-AUDIT SERVICES
The Company may decide to employ the auditor on assignments additional to their statutory audit duties where the auditor’s expertise and experience with the Company are important.
The Directors when considering the auditor for non audit services, will ensure that they are satisfied the provision of non-audit services is compatible with the general standard of independence for auditors imposed by the Corporations Act 2001. The nature and scope of each type of non-audit service provided did not compromise auditor independence.
The board of Directors has considered the position and, in accordance with advice received from the Audit Committee, is satisfied that the provision of non-audit services is not incompatible with the general standard of independence for auditors imposed by the Corporations Act 2001. The Directors are satisfied that the provision of non-audit services by the auditor, as set out below, did not compromise the auditor independence requirements of the Corporations Act 2001 for the following reasons:
|
|
·
|
all non-audit services have been reviewed by the Audit Committee to ensure they do not impact the impartiality and objectivity of the auditor
|
|
|
·
|
none of the services undermine the general principles relating to auditor independence as set out in APES 110 Code of Ethics for Professional Accountants
|
For the year ended 30 June 2011, PricewaterhouseCoopers received or were due to receive the following amounts for the provision of non-audit services:
Advisory services $nil (2010: $33,930)
|
Samson Oil & Gas Limited
|
Annual Report – 30 June 2011
|
Page 16 of 78
|
DIRECTORS’ REPORT
|
|
for the year ended 30 June 2011
|
AUDITOR INDEPENDENCE
A copy of the auditor’s independence declaration as required under section 307C of the Corporations Act 2001 is set out on page 18.
Signed in accordance with a resolution of the Board of Directors.

Terence M. Barr
Director
Denver, Colorado
14 September 2011
|
Samson Oil & Gas Limited
|
Annual Report – 30 June 2011
|
Page 17 of 78
|
AUDITORS INDEPENDENCE DECLARATION
|
|
for the year ended 30 June 2011
|
AUDITORS INDEPENDENCE DECLARATION
|
Samson Oil & Gas Limited
|
Annual Report – 30 June 2011
|
Page 18 of 78
|
CORPORATE GOVERNANCE STATEMENT
|
|
for the year ended 30 June 2011
|
CORPORATE GOVERNANCE STANDARD
Samson Oil & Gas Limited (“the Company”) and the board are committed to achieving and demonstrating the highest standards of Corporate Governance. The Board continues to review the framework and practices to ensure they meet the interests of shareholders. The Company and its controlled entity together are referred to as the Consolidated Entity in this statement.
A description of the Consolidated Entity’s main corporate governance practice is set out below. All these practices, unless stated otherwise, were in place for the entire year. They comply with the August 2007 ASX Principles of Good Corporate Governance and Best Practice Recommendations.
Principle 1 – Lay solid foundations for management and oversight.
The relationship between the board and senior management is critical to the Consolidated Entity’s long term success. The Directors are responsible to the shareholders for the performance of the Consolidated Entity in both the short and longer term and seek to balance often competing objectives in the best interests of the Consolidated Entity as a whole. Their focus is to enhance the interests of the shareholders and other key stakeholders and to ensure the Consolidated Entity is properly managed.
The responsibilities of the Board include:
|
·
|
contributing to developing and approving the corporate strategy;
|
|
·
|
reviewing and approving business plans, the annual budget and financial plans including available resources and major capital expenditure initiatives;
|
|
·
|
overseeing and monitoring
|
|
|
·
|
organisational performance and the achievement of the Consolidated Entity’s strategic goals and objectives
|
|
|
·
|
compliance with Company’s code of conduct
|
|
|
·
|
progress of major capital expenditures and other significant corporate projects including acquisitions and divestitures
|
|
·
|
ensuring there are effective management processes in place and approving major corporate initiatives
|
|
·
|
overseeing the operation of the Company’s system for compliance and risk management
|
|
·
|
monitoring financial performance including the approval of the annual and half year financial reports and liaison with the Company’s auditors
|
|
·
|
appointment, performance assessment and, if necessary, removal of the Managing Director
|
|
·
|
ensuring appropriate resources are available to senior management.
|
Day to day management of the Company’s affairs and the implementation of the corporate strategy and policy initiatives are formally delegated by the Board to the Managing Director and senior executives.
Principle 2 – Structure the Board to add value
The board operates in accordance with the broad principles set out in its charter which is available from the corporate governance information section of the company’s website at www.samsonoilandgas.com. The charter details the board’s composition and responsibilities.
Board composition
The charter states:
|
·
|
the board is to be comprised of both executive and non-executive Directors with a majority of non-executive Directors. Non-executive Directors bring a fresh perspective to the board’s consideration to strategic, risk and performance matters
|
|
·
|
in recognition of the importance of independent views and the board’s role in supervising the activities of management, the Chair must be independent of management and all Directors are required to exercise independent judgement and review and constructively challenge the performance of management
|
|
·
|
the Chair is elected by the full board and is required to meet regularly with the Managing Director
|
|
·
|
the Company is to maintain a mix of Directors on the board from different backgrounds with complementary skills and experience.
|
|
Samson Oil & Gas Limited
|
Annual Report – 30 June 2011
|
Page 19 of 78
|
CORPORATE GOVERNANCE STATEMENT
|
|
for the year ended 30 June 2011
|
The board seeks to ensure that:
|
·
|
at any point in time, its membership represents an appropriate balance between Directors with experience and knowledge of the Consolidated Entity and Directors with an external or fresh perspective
|
|
·
|
the size of the board is conducive to effective discussion and efficient decision-making.
|
Directors’ Independence
The board has adopted specific principles in relation to Directors’ independence. These state that when determining independence, a director must be a non-executive and the board should consider whether the director:
|
·
|
is a substantial shareholder of the Company or an officer or, or otherwise associated directly with, a substantial shareholder of the Company
|
|
·
|
is or has been employed in an executive capacity by the Company or any other Consolidated Entity member within three years before commencing to serve on the board
|
|
·
|
within the last year has been a principal of a material professional adviser or material consultant to the Company or any other Consolidated Entity member, or an employee materially associated with the service provided
|
|
·
|
is a material supplier or customer of the Company or any other Consolidated Entity member, or an officer or otherwise associated directly or indirectly with a material supplier or customer
|
|
·
|
has a material contractual relationship with the Company or a controlled entity other than as director of the Consolidated Entity
|
|
·
|
is free from any business or other relationship which could, or could reasonably be perceived to, materially interfere with the director’s independent exercise of their judgement.
|
“Materiality” for these purposes is determined on a qualitative basis. A transaction of any amount or a relationship is deemed material if knowledge of it may impact the shareholders’ understanding of the director’s performance.
Recent thinking on corporate governance has introduced the view that a director’s independence may be perceived to be impacted by lengthy service on the board. To avoid any potential concerns, the board has determined that a director will not be deemed independent if he or she has served on the board of the Company for more than ten years. The board continues to monitor developments on this issue.
The board assess independence each year. To enable this process, the Directors must provide all information to the Chief Financial Officer that may be relevant to the assessment.
Board members
Details of the members of the board, their experience, expertise, qualifications, term of office and their independent status are set out in the Directors report under the heading “Directors”. At the date of signing the Directors’ report, there is one executive director and three non-executive Directors. All non-executive Directors are deemed to be independent.
Term of office
The Company’s Constitution specifies that all non-executive Directors appointed during the year, automatically retire at the next annual general meeting (“AGM”) and are eligible for re-election at that general meeting. Any director that has been appointed during the year and is subject to automatic retirement at the AGM is not taken into account in the automatic retirement of one third of the Directors as detail below.
At each annual general meeting:
(a) one third (or if that is not a whole number, the whole number nearest to one third) of the Directors who are not:
(i) appointed, and required to retire, as detailed above; or
(ii) the Managing Director; or
(iii) Directors only because they are Alternates; and
(b) any Director who would, if that Director remained in office until the nextannual general meeting, have held that office for more than 3 years must retire from office and is eligible for re-election.
|
Samson Oil & Gas Limited
|
Annual Report – 30 June 2011
|
Page 20 of 78
|
CORPORATE GOVERNANCE STATEMENT
|
|
for the year ended 30 June 2011
|
Chair and Chief Executive Officer
The Chair is responsible for leading the board, ensuring Directors are properly briefed in all matters relevant to their role and responsibilities, facilitating board discussions and managing the board’s relationship with the Company’s senior executives. In accepting the position, the Chair has acknowledged that it will require a significant time commitment and has confirmed that other positions would not hinder his effective performance in the role of Chair.
The CEO is responsible for implementing the Consolidated Entity’s strategies and policies. The board charter specifies that these are separate roles to be undertaken by separate people. The CEO role is performed by the Managing Director.
Commitment
The board held 18 meetings (including those held by circulating resolution) during the year. The number of meetings of the Company’s board of Directors and of each board committee held during the year ended 30 June 2011, and the number of meetings attended by each director is disclosed on page 15.
It is the Company’s practice to allow its executive Directors to accept appointments outside the Company with prior written approval of the board. No appointments of this nature were requested during the year.
Prior to appointment or being submitted for re-election, each non-executive director is required to specifically acknowledge that they will have and continue to have the time available to discharge their responsibilities to the Company.
Independent professional advice
Directors and board committees have the right, in connection with their duties and responsibilities, to seek independent professional advice at the Company’s expense. Prior written approval of the Chair is required, but this will not be unreasonably withheld.
Performance assessment
In order to ensure that the board continues to discharge its responsibilities in an appropriate manner, the performance of all Directors is reviewed annually by the Chair. Directors whose performance is unsatisfactory are asked to retire. The board has not formally documented the results of performance evaluations to date.
Board committees
The board has established an audit committee to assist in the execution of the supervision of the audit by the Board. Effective 28 July 2011, the Board also formed a Compensation Committee
Audit Committee
The audit committee consists entirely of independent Directors, including DeAnn Craig, Keith Skipper and Victor Rudenno. Neil MacLachlan was a member of this committee until his resignation on 30 June 2011. The Audit Committee operates in accordance with a formal written charter, a copy of which is available on the Company’s website. This committee oversees, reviews and acts on reports to the board on various auditing and accounting matters, selects the independent auditors and oversees the scope of annual audits, fees to be paid to the independent auditors, the performance of the independent auditors and our accounting practices. In addition, the Audit Committee oversees the Company’s compliance programs relating to legal and regulatory requirements.
It is the board’s responsibility to ensure that an effective internal control framework exists within the entity. This includes internal controls to deal with both the effectiveness and efficiency of significant business processes. This also includes the safeguarding of assets, the maintenance of proper accounting records, and the reliability of financial information.
Nomination Committee
The Company does not have a formally appointed nomination committee, as the Directors believe the size of the Company’s operations does not warrant the establishment of such a committee.
|
Samson Oil & Gas Limited
|
Annual Report – 30 June 2011
|
Page 21 of 78
|
CORPORATE GOVERNANCE STATEMENT
|
|
for the year ended 30 June 2011
|
Principle 3 – Promote ethical and responsible decision making
Code of Conduct
The Company has developed a Code of Conduct (“the Code”) which has been fully endorsed by the board and applies to all Directors and employees. The Code is regularly reviewed and updated as necessary to ensure it reflects the highest standards of behaviour and professionalism and the practices necessary to maintain confidence in the Consolidated Entity’s integrity and to take into account legal obligations and reasonable expectations of the Company’s stakeholders.
In summary, the Code requires that at all times all Company personnel act with the utmost integrity, objectivity and in compliance with the letter and the spirit of the law and Company policies.
The purchase and sale of Company securities by Directors and employees is only permitted during non-black out periods. Black out periods are defined in the Company’s Insider Trading Policy. Any transactions undertaken must be notified to the CEO or CFO prior to being entered into.
The Code and the Company’s trading policy is discussed with each new employee. Further training is periodically provided and all employees are asked to sign an annual declaration confirming their compliance with the Code and trading policy.
The Code requires employees who are aware of unethical practices with the Consolidated Entity or breaches of the Company’s trading policy to report these using the Company’s whistleblower program.
The Directors are satisfied that the Consolidated Entity has complied with its policies on ethical standards, including trading in securities.
A copy of the Code and the Insider Trading Policy are available on the Company’s website.
Principle 4 – Safeguard integrity in financial reporting
Audit committee
The Audit Committee consists of the following non-executive Directors:
D. Craig
K. Skipper
V. Rudenno
N. MacLachlan (resigned 30 June 2011)
Details of these Directors’ qualifications and attendance at Audit Committee meetings are set out in the Directors report on pages 2, 3 and 15.
All members of the Audit Committee are financially literate and have an appropriate understanding of the oil and gas industry. Dr Rudenno and Dr Craig are both deemed to be financial experts.
The Audit Committee operates in accordance with a charter which is available on the Company’s website. The main responsibilities of the committee are to:
|
|
·
|
review, assess and approve the annual report, Form 10K, the half-year financial report and all other financial information published by the Company or released to the market
|
|
|
·
|
assist the board in reviewing the effectiveness of the organisation’s internal control environment covering:
|
|
|
·
|
effectiveness and efficiency of operations
|
|
|
·
|
reliability of financial reporting
|
|
|
·
|
compliance with applicable laws and regulations
|
|
|
·
|
oversee the effective operation of the risk management framework
|
|
|
·
|
recommend to the board the appointment, removal and remuneration of the external auditors and review the terms of their engagement, the scope and quality of the audit and assess performance
|
|
|
·
|
consider the independence and competence of the external auditor on an on-going basis
|
|
Samson Oil & Gas Limited
|
Annual Report – 30 June 2011
|
Page 22 of 78
|
CORPORATE GOVERNANCE STATEMENT
|
|
for the year ended 30 June 2011
|
|
|
·
|
review and approve the level of non-audit services provided by the external auditors and ensure it does not adversely impact on auditor independence
|
|
|
·
|
review and monitor related party transactions and assess their propriety
|
|
|
·
|
report to the board on matters relevant to the committee’s role and responsibilities.
|
In fulfilling its responsibilities, the Audit Committee:
|
|
·
|
receives regular reports from management and the external auditors
|
|
|
·
|
meets with external auditors at least twice a year, or more frequently if necessary
|
|
|
·
|
reviews the processes the CEO and CFO have in place to support their certifications to the board
|
|
|
·
|
reviews any significant disagreements between the auditors and management, irrespective of whether they have been resolved
|
|
|
·
|
is given the opportunity to meet with external auditors without the presence of management if required
|
|
|
·
|
provides the external auditors with a clear line of communication at any time to the either the audit committee or the Chair of the board.
|
The Audit Committee has authority, within the scope of its responsibilities, to seek any information it requires from any employee or external party.
External auditors
The Company’s and Audit Committee’s policy is to appoint external auditors who clearly demonstrate quality and independence. The performance of the external auditor is reviewed annually and applications for tender of external audit services are requested as deemed appropriate, taking into consideration assessment of performance, existing value and tender costs. The external audit was put to tender in 2008 with PricewaterhouseCoopers being appointed external auditors in October 2008. It is PricewaterhouseCoopers policy to rotate audit engagement partners on listed companies at least every five years.
An analysis of fees paid to the external auditors, including a break-down of fees for non-audit services, is provided in the Directors’ report and in note 25 to the financial statements. It is the policy of the external auditors to provide an annual declaration of their independence to the Audit Committee.
The external auditor will attend the annual general meeting and be available to answer shareholder questions about the conduct of the audit and the preparation and content of the audit report.
Principle 5 and 6 – Make timely and balanced disclosures and respect the rights of shareholders
The Company recognises the importance of ensuring its continuous disclosure requirements are met, and has procedures in place to ensure this happens, however has not formally documented them.
The Company Secretary has been nominated as the person responsible for communications with the Australian Stock Exchange (“ASX”). This role includes responsibility for ensuring compliance with the continuous disclosure requirements in the ASX Listing Rules and overseeing and co-ordinating information disclosure to the ASX, analysts, brokers, shareholders, the media and the public.
All information disclosed to the ASX is posted on the Company’s website as soon as it is disclosed to the ASX. When analysts are briefed on aspects of the Consolidated Entity’s operations, the material used in the presentation is released to the ASX and posted on the Company’s website. Procedures have also been established for reviewing whether any price sensitive information has been inadvertently disclosed and, if so, this information is also immediately released to the market.
From 30 June 2009, shareholders could elect whether or not they wished to receive a hard copy of the Annual Report. A copy of the Annual Report is sent to all shareholders who elected to receive one. All shareholders receive the Notice of Meeting for the Company’s Annual General Meeting.
The Company actively promotes communication with shareholders through a variety of measures, including the use of the Company’s website and email. The Company’s reports and ASX announcements may be viewed and downloaded from its website: www.samsonoilandgas.com or the ASX website: asx.com.au under ASX code “SSN”. The Company also maintains an email list for the distribution of the Company’s announcements via email in a timelier manner.
|
Samson Oil & Gas Limited
|
Annual Report – 30 June 2011
|
Page 23 of 78
|
CORPORATE GOVERNANCE STATEMENT
|
|
for the year ended 30 June 2011
|
Principle 7- Recognise and manage risk
The board, through the Audit Committee, is responsible for ensuring there are adequate policies in relation to risk management, compliance and internal control systems. In summary, the Company policies are designed to ensure strategic, operational, legal, reputational and financial risks are identified, assessed, effectively and efficiently managed and monitored to enable achievement of the Consolidated Entity’s business objectives.
Considerable importance is placed on maintaining a strong control environment. There is an organisation structure with clearly drawn lines of accountability and delegation of authority. Adherence to the Code of Conduct is required at all times and the board actively promotes a culture of quality and integrity. The Company has an Enterprise Risk Policy though a formal Risk Management Committee has not been established. The Company believes that the regular communication between senior management and the board ensures that risks are identified and dealt with, when appropriate, in a timely manner.
Environmental Risk System
The Company recognises the importance of environmental risk management and is committed to the highest level of sound environmental management. The Company has established best practice environmental policies for those fields that it operates and seeks to ensure the operators of its non-operated properties operate in an environmentally sound manner.
Corporate reporting
The Managing Director and CFO have made the following certifications to the board:
|
|
·
|
that the Company’s financial reports are complete and present a true and fair view, in all material respects, of the financial condition and operational results of the Consolidated Entity are in accordance with relevant Accounting Standards
|
|
|
·
|
that the above statement is founded on a sound system of risk management and internal compliance and control which implements the policies adopted by the board and that the Company’s risk management and internal compliance and control is operating efficiently and effectively in all material respects in relation to financial reporting risks.
|
Principle 8 – Remunerate fairly and responsibly
A Compensation Committee was formed subsequent to the end of the year. During the year ended 30 June 2011, and prior to the formation of this Committee, the board was responsible for determining and reviewing compensation arrangements for the Directors. Further detail in relation to the Company’s remuneration policies can be found in the Remuneration Report included within the Directors’ Report.
Members of the senior executive team sign a formal employment contract at the time of their appointment covering a range of matters including their duties, rights, responsibilities and any entitlements on termination. The standard contract refers to a specific formal job description.
Further information on Directors’ and executives’ remuneration, including principles used to determine remuneration, is set out in the Directors’ report under the heading “Remuneration report”.
The board also assumes responsibility for overseeing management succession planning.
|
Samson Oil & Gas Limited
|
Annual Report – 30 June 2011
|
Page 24 of 78
|
Statement of Comprehensive Income
|
|
for the year ended 30 June 2011
|
STATEMENT OF COMPREHENSIVE INCOME
|
Consolidated Entity
|
|||||||||||
|
Note
|
2011
|
2010
|
|||||||||
| $ | $ | ||||||||||
|
Revenue from operations
|
|||||||||||
|
Sale of oil and gas
|
3 (a) | 5,968,776 | 2,891,937 | ||||||||
|
Finance income
|
3 (a) | 368,251 | 24,318 | ||||||||
|
Total Revenue
|
6,337,027 | 2,916,255 | |||||||||
|
Cost of Sales
|
(3,712,349 | ) | (2,069,360 | ) | |||||||
|
Gross Profit
|
2,624,678 | 846,895 | |||||||||
|
Other Income
|
3 (a) | 73,510,103 | 287,324 | ||||||||
|
Exploration and evaluation expense
|
(403,826 | ) | (1,569,456 | ) | |||||||
|
General and administrative expenses
|
3 (b) | (7,886,650 | ) | (3,336,914 | ) | ||||||
|
(Impairment expense)/reversal of impairment expense of oil and gas properties
|
3 (e) | (25,643 | ) | 82,801 | |||||||
|
Finance costs
|
3 (c) | (1,036,792 | ) | (1,430,410 | ) | ||||||
|
Profit/(Loss) before income tax
|
66,781,870 | (5,119,760 | ) | ||||||||
|
Income tax (expense)/benefit
|
4 | (21,011,788 | ) | 6,317,000 | |||||||
|
Profit after income tax from continuing operations
|
45,770,082 | 1,197,240 | |||||||||
|
Gain/(Loss) from discontinued operations
|
34 | 1,555,103 | (380,007 | ) | |||||||
|
Net profit for the year attributable to owners of Samson Oil & Gas Limited
|
18 | 47,325,185 | 817,233 | ||||||||
|
Other comprehensive income/(expense)
|
|||||||||||
|
Currency translation differences
|
1,263,145 | (62,732 | ) | ||||||||
|
Total comprehensive income for the year attributable to the owners of Samson Oil & Gas Limited
|
48,588,330 | 754,501 | |||||||||
|
Basic earnings per share (cents) from continuing operations attributable to ordinary equity holds of the Company
|
26 | 2.72 | 0.12 | ||||||||
|
Diluted earnings per share (cents)
|
26 | 2.33 | 0.11 | ||||||||
|
Basic earnings per share for profit attributable to the ordinary equity holders of the company
|
26 | 2.81 | 0.08 | ||||||||
|
Diluted earnings per share (cents)
|
26 | 2.41 | 0.07 | ||||||||
The above statement of comprehensive income should be read in conjunction with the accompanying notes.
|
Samson Oil & Gas Limited
|
Annual Report – 30 June 2011
|
Page 25 of 78
|
BALANCE SHEET
|
|
As at 30 June 2011
|
BALANCE SHEET
|
Consolidated Entity
|
|||||||||||
|
Note
|
2011
|
2010
|
|||||||||
|
$
|
$
|
||||||||||
|
Current assets
|
|||||||||||
|
Cash and cash equivalents
|
6 | 58,448,477 | 5,885,735 | ||||||||
|
Trade and other receivables
|
7 | 1,696,697 | 4,932,270 | ||||||||
|
Pipe inventory
|
489,526 | - | |||||||||
|
Tax receivable
|
4 | 2,579,626 | - | ||||||||
|
Financial assets at fair value through profit and loss
|
8 | - | 40,165 | ||||||||
|
Derivative financial instruments
|
19a | 22,268 | 46,824 | ||||||||
|
Prepayments
|
9 | 592,805 | 1,454,271 | ||||||||
|
Total current assets
|
63,829,399 | 12,359,265 | |||||||||
|
Non-current assets
|
|||||||||||
|
Restricted cash
|
12 | 172,504 | 178,291 | ||||||||
|
Trade and other receivables
|
7 | 34,175 | 27,122 | ||||||||
|
Plant and equipment
|
10 | 2,592,178 | 2,552,816 | ||||||||
|
Exploration and evaluation assets
|
11 | 3,347,738 | - | ||||||||
|
Oil and gas properties
|
13 | 10,518,663 | 18,135,453 | ||||||||
|
Deferred tax asset
|
4 | - | 6,317,000 | ||||||||
|
Total non-current assets
|
16,665,258 | 27,210,682 | |||||||||
|
Total assets
|
80,494,657 | 39,569,947 | |||||||||
|
Current liabilities
|
|||||||||||
|
Trade and other payables
|
14 | 3,406,377 | 2,318,778 | ||||||||
|
Borrowings
|
16 | - | 11,283,999 | ||||||||
|
Total current liabilities
|
3,406,377 | 13,602,777 | |||||||||
|
Non-current liabilities
|
|||||||||||
|
Borrowings
|
29,770 | - | |||||||||
|
Provisions
|
15 | 526,218 | 851,502 | ||||||||
|
Total non-current liabilities
|
555,988 | 851,502 | |||||||||
|
Total Liabilities
|
3,962,365 | 14,454,279 | |||||||||
|
Net assets
|
76,532,292 | 25,115,668 | |||||||||
|
Equity
|
|||||||||||
|
Contributed equity
|
17 | 76,925,795 | 75,714,264 | ||||||||
|
Accumulated losses
|
18 | (7,519,490 | ) | (54,844,675 | ) | ||||||
|
Reserves
|
17 | 7,125,987 | 4,246,079 | ||||||||
|
Total equity
|
76,532,292 | 25,115,668 | |||||||||
The above balance sheet should be read in conjunction with the accompanying notes.
|
Samson Oil & Gas Limited
|
Annual Report – 30 June 2011
|
Page 26 of 78
|
CASH FLOW STATEMENT
|
|
for the year ended 30 June 2011
|
CASH FLOW STATEMENT
|
Consolidated Entity
|
|||||||||||
|
Note
|
2011
|
2010
|
|||||||||
|
$
|
$
|
||||||||||
|
Cash flows from operating activities
|
|||||||||||
|
Receipts from customers
|
6,281,825 | 5,022,548 | |||||||||
|
Cash received from commodity derivative financial instruments
|
152,171 | 34,435 | |||||||||
|
Payments to suppliers & employees
|
(7,073,109 | ) | (4,978,917 | ) | |||||||
|
Interest received
|
368,251 | 24,234 | |||||||||
|
Interest paid
|
(878,528 | ) | (1,312,380 | ) | |||||||
|
Income taxes paid
|
(9,360,000 | ) | - | ||||||||
|
Net cash flows used in operating activities
|
23 (b) | (10,509,390 | ) | (1,210,080 | ) | ||||||
|
Cash flows from investing activities
|
|||||||||||
|
Proceeds from sale of listed shares
|
49,040 | 65,156 | |||||||||
|
Proceeds from sale of exploration acreage
|
73,199,687 | - | |||||||||
|
Proceeds from sale of oil and gas properties
|
6,262,374 | - | |||||||||
|
Payments for furniture and fittings
|
(280,663 | ) | - | ||||||||
|
Payments for plant & equipment
|
(1,247,943 | ) | (748,736 | ) | |||||||
|
Payments for exploration and evaluation
|
(3,751,769 | ) | (1,569,456 | ) | |||||||
|
Payments for oil and gas properties
|
(4,792,620 | ) | (3,581,518 | ) | |||||||
|
Net cash flows from/(used in) investing activities
|
69,438,106 | (5,834,554 | ) | ||||||||
|
Cash flows from financing activities
|
|||||||||||
|
Proceeds from issue of share capital
|
3,969,374 | 18,326,542 | |||||||||
|
Repayment of borrowings
|
(11,386,247 | ) | (5,673,753 | ) | |||||||
|
Payments for costs associated with capital raising
|
(244,282 | ) | (1,381,002 | ) | |||||||
|
Net cash flows (used in)/from financing activities
|
(7,661,155 | ) | 11,271,787 | ||||||||
|
Net increase in cash and cash equivalents
|
51,267,561 | 4,227,153 | |||||||||
|
Cash and cash equivalents at the beginning of the financial year
|
5,885,735 | 1,522,632 | |||||||||
|
Effects of exchange rate changes on cash and cash equivalents
|
1,295,181 | 135,950 | |||||||||
|
Cash and cash equivalents at end of year
|
23 (a) | 58,448,477 | 5,885,735 | ||||||||
The above cash flow statement should be read in conjunction with the accompanying notes.
|
Samson Oil & Gas Limited
|
Annual Report – 30 June 2011
|
Page 27 of 78
|
STATEMENT OF CHANGES IN EQUITY
|
|
for the year ended 30 June 2011
|
STATEMENT OF CHANGES IN EQUITY
|
Attributable to equity holders of the parent
|
||||||||||||||||||||||||
|
CONSOLIDATED
|
Issued
Capital
|
Accumulated
Losses
|
Foreign
Currency
Translation
Reserve
|
Equity
Reserve
|
Share Based
Payments
Reserve
|
Total Equity
|
||||||||||||||||||
|
$
|
$
|
$
|
$
|
$
|
$
|
|||||||||||||||||||
|
Balance at 1 July 2009
|
55,985,941 | (55,661,908 | ) | 2,987,161 | (1,097,780 | ) | 2,399,702 | 4,613,116 | ||||||||||||||||
|
Profit for the year
|
- | 817,233 | - | - | - | 817,233 | ||||||||||||||||||
|
Other comprehensive income
|
- | - | (62,732 | ) | - | - | (62,732 | ) | ||||||||||||||||
|
Total comprehensive income/(expense) for the period
|
- | 817,233 | (62,732 | ) | - | - | 754,501 | |||||||||||||||||
|
Transactions with owners in their capacity as owners:
|
||||||||||||||||||||||||
|
Options vested
|
- | - | - | - | 19,728 | 19,728 | ||||||||||||||||||
|
Share Based Payments – value of employee services
|
100,817 | - | - | - | - | 100,817 | ||||||||||||||||||
|
Issue of share capital
|
21,227,372 | - | - | - | - | 21,227,372 | ||||||||||||||||||
|
Share issue costs
|
(1,599,866 | ) | - | - | - | - | (1,599,866 | ) | ||||||||||||||||
|
Balance at 30 June 2010
|
75,714,264 | (54,844,675 | ) | 2,924,429 | (1,097,780 | ) | 2,419,430 | 25,115,668 | ||||||||||||||||
|
Balance at 1 July 2010
|
75,714,264 | (54,844,675 | ) | 2,924,429 | (1,097,780 | ) | 2,419,430 | 25,115,668 | ||||||||||||||||
|
Profit for the year
|
- | 47,325,185 | - | - | - | 47,325,185 | ||||||||||||||||||
|
Other comprehensive income
|
- | - | 1,263,145 | - | - | 1,263,145 | ||||||||||||||||||
|
Total comprehensive income/(expense) for the period
|
- | 47,325,185 | 1,263,145 | - | - | 48,588,330 | ||||||||||||||||||
|
Transactions with owners in their capacity as owners:
|
||||||||||||||||||||||||
|
Options vested
|
- | - | - | - | 1,616,763 | 1,616,763 | ||||||||||||||||||
|
Share Based Payments – value of employee services
|
150,617 | - | - | - | - | 150,617 | ||||||||||||||||||
|
Issue of share capital
|
1,098,028 | - | - | - | - | 1,098,028 | ||||||||||||||||||
|
Share issue costs
|
(37,114 | ) | - | - | - | - | (37,114 | ) | ||||||||||||||||
|
Balance at 30 June 2011
|
76,925,795 | (7,519,490 | ) | 4,187,574 | (1,097,780 | ) | 4,036,193 | 76,532,292 | ||||||||||||||||
The above statement of changes in equity should be read in conjunction with the accompanying notes.
|
Samson Oil & Gas Limited
|
Financial Statements – 30 June 2011
|
Page 28 of 78
|
NOTES TO THE CONSOLIDATED FINANCIAL STATEMENTS
|
|
for 30 June 2011
|
NOTES TO THE CONSOLDIATED FINANCIAL STATEMENTS
NOTE 1. CORPORATE INFORMATION
The financial statements of the Company for the year ended and as at 30 June 2011 were authorised for issue in accordance with a resolution of the Directors on 13 September 2011. The financial statements include the financial statements for the Consolidated Entity comprised of Samson Oil & Gas Limited and it’s subsidiaries, referred to hereafter as the Consolidated Entity.
Samson Oil & Gas Limited is a Company limited by shares incorporated in Australia whose shares are publicly traded on the Australian Securities Exchange. Samson also trades an American Depository Share (“ADS”) on NYSE AMEX under the symbol "SSN". Each ADR represents 20 fully paid Ordinary Shares of Samson.
The nature of the operations and principal activities of the Consolidated Entity are described in Note 22 Segment Reporting.
NOTE 2. SUMMARY OF SIGNIFICANT ACCOUNTING POLICIES
The principal accounting policies adopted in the preparation of these consolidated financial statements are set out below. These policies have been consistently applied to all the years presented, unless stated otherwise. The financial statements are for the consolidated entity consisting of Samson Oil & Gas Limited and its subsidiaries.
Basis of preparation
These general purpose financial statements have been prepared in accordance with Australian Accounting Standards, other authoritative pronouncements of Australian Accounting Standards Board, Urgent Issues Group Interpretations and the Corporations Act 2001.
Historical cost convention
These financial statements have been prepared under the historical cost convention, except for assets held for trading and derivative instruments, which have been measured at fair value.
Critical accounting estimates
The preparation of financial statements requires the use of certain critical accounting estimates. It also requires management to exercise its judgement in the process of the applying the Consolidated Entity’s accounting policies. The areas involving a higher degree of judgement or complexity, or areas where assumptions and estimates are significant to the financial statements are discussed at d) below.
Presentation currency
The Presentation Currency is the United States Dollar (“US$”). All dollar values in this report are expressed as US$’s unless noted otherwise. All Australian dollar references are noted by ‘A$’.
|
a)
|
Compliance Statement
|
The consolidated financial statements of the Consolidated Entity also comply with International Financial Reporting Standards (IFRS) as issued by International Accounting Standards Board (IASB).
|
b)
|
New accounting standards adopted by the Consolidated Entity
|
|
The following new standards and amendments to standards are mandatory for the first time for the financial year beginning 1 July 2010:
|
|
|
·
|
AASB 2009-5 Further Amendments to Australian Accounting Standards arising from the Annual Improvements Project
|
|
|
·
|
AASB 2009-8 Amendments to Australian Accounting Standards – Group Cash-settled Share-based Payment Transactions
|
|
|
·
|
AASB 2009-10 Amendments to Australian Accounting Standards – Classification of Rights Issues
|
|
|
·
|
AASB Interpretation 19 Extinguishing Financial Liabilities with Equity Instruments and AASB 2009-13 Amendments to Australian Accounting Standards arising from Interpretation 19, and
|
|
Samson Oil & Gas Limited
|
Financial Statements – 30 June 2011
|
Page 29 of 78
|
NOTES TO THE CONSOLIDATED FINANCIAL STATEMENTS
|
|
for 30 June 2011
|
|
|
·
|
AASB 2010-3 Amendments to Australian Accounting Standards arising from the Annual Improvements Project
|
The adoptions of these standards did not have any impact on the current period or any prior period and is not likely to affect future periods.
|
c)
|
Principles of Consolidation
|
The consolidated financial statements incorporate the assets and liabilities of all subsidiaries of Samson Oil & Gas Limited (“parent entity” or “Company”) as at 30 June 2011 and the results of all subsidiaries for the year then ended. Samson Oil & Gas Limited and its subsidiaries together are referred to in this financial report as the group or Consolidated Entity.
Subsidiaries are all those entities over which the Consolidated Entity has the power to govern the financial and operating policies, generally accompanying a shareholding of more than one-half of the voting rights. The existence and effect of potential voting rights that are currently exercisable or convertible are considered when assessing whether the Consolidated Entity controls another entity.
Subsidiaries are fully consolidated from the date on which control is transferred to the Consolidated Entity. They are deconsolidated from the date that control ceases.
The acquisition method of accounting is used to account for the acquisition of subsidiaries by the Consolidated Entity (refer to note 2bb).
All intercompany balances and transactions, including unrealised profits arising from intra-group transactions, have been eliminated in full. Unrealised losses are eliminated unless costs cannot be recovered.
The financial statements of subsidiaries are prepared for the same reporting period as the parent entity, using consistent accounting policies.
Minority interests not held by the Consolidated Entity are allocated their share of net profit after tax in the profit and loss and are presented within equity in the consolidated balance sheet, separately from parent shareholders’ equity.
The Consolidated Entity treats transactions with non-controlling interests that do not result in a loss of control as transactions with equity owners of the Consolidated Entity. A change in ownership interest results in an adjustment between the carrying amounts of the controlling and non-controlling interests to reflect their relative interests in the subsidiary. Any difference between the amount of the adjustment to non-controlling interests and any consideration paid or received is recognised in a separate reserve within equity attributable to owners of Samson Oil & Gas Limited.
When the Consolidated Entity ceases to have control, joint control or significant influence, any retained interest in the entity is remeasured to its fair value with the change in carrying amount recognised in profit or loss. The fair value is the initial carrying amount for the purposes of subsequently accounting for the retained interest as an associate, jointly controlled entity or financial asset. In addition, any amounts previously recognised in other comprehensive income in respect of that entity are accounted for as if the Consolidated Entity had directly disposed of the related assets or liabilities. This may mean that amounts previously recognised in other comprehensive income are reclassified to profit or loss.
If the ownership interest in a jointly-controlled entity or an associate is reduced but joint control or
significant influence is retained, only a proportionate share of the amounts previously recognised in other comprehensive income are reclassified to profit or loss where appropriate.
|
d)
|
Significant accounting judgments, estimates and assumptions
|
Estimates and judgements are continually evaluated and are based on historical experience and other factors, including expectations of future events that may have a financial impact on the entity and that are believed to be reasonable under the circumstances.
|
Samson Oil & Gas Limited
|
Financial Statements – 30 June 2011
|
Page 30 of 78
|
NOTES TO THE CONSOLIDATED FINANCIAL STATEMENTS
|
|
for 30 June 2011
|
Critical judgements in applying the entity’s accounting policies
Management has identified the following critical accounting policies for which significant judgments, estimates and assumptions are made. Actual results may differ from these estimates under different assumptions and conditions and may materially affect financial results of the financial position reported in future periods. Further details of the nature of these assumptions and conditions may be found in the relevant notes to the financial statements.
Exploration and evaluation
The Consolidated Entity’s accounting policy for exploration and evaluation is set out in Note 2 (q). The application of this policy necessarily requires management to make certain estimates and assumptions as to future events and circumstances, in particular the assessment of whether economic quantities of reserves have been found. Any such estimates and assumptions may change as new information becomes available. If, after having capitalised expenditure under our policy, we conclude that we are unlikely to recover the expenditure by future exploitation or sale, then the relevant capitalised amount will be written off to the profit and loss.
When assessing whether deferred exploration expenditure should be carried forward from the prior year the Consolidated Entity reviews each project on an individual basis, taking into account, but not limited, to the ongoing activity in relation to that field, including any new agreements or contracts entered into during the year and the Consolidated Entity’s near future plans for the field or prospect.
The Consolidated Entity believes that exploration expenditures are incurred with the intent of making further investment decisions and are not directly related to the revenue producing activities of the Consolidated Entity and are therefore more appropriately presented as investing activities.
Critical accounting estimates and assumptions
The carrying amounts of certain assets and liabilities are often determined based on estimates and assumptions of future events. The resulting accounting estimates will, by definition, seldom equal the related actual results. The key estimates and assumptions that have a significant risk of causing a material adjustment to the carrying amounts of certain assets and liabilities within the next annual reporting period are:
Share-based payment transactions
The Consolidated Entity measures the cost of equity-settled transactions with employees by reference to the fair value of the equity instruments at the date at which they are granted. The fair value is determined using a black scholes option pricing model.
The value of equity-settled transactions with other service providers, excluding employees, are measured based on the value of the service received by the Consolidated Entity. If a value for this cannot be reasonably measured, the value will be measured by reference to the fair value of the equity instruments at the date services are provided. The Consolidated Entity also uses a black scholes option pricing model to determine this fair value, where appropriate.
Impairment of Assets
In determining the recoverable amount of assets, in the absence of quoted market prices, estimations are made regarding the present value of future cash flows using asset specific discount rates. For oil and gas properties, expected future cash flow estimation is based on proved and probable reserves, future production profiles, commodity prices and costs. The estimates of future cash flows are made as at each balance date, using the price estimates from the forward curve as at that date. The impact of future income taxes has not been considered in the future cash flows as to date, the Consolidated Entity has been able to use carry forward tax losses to offset any tax payable. This position is reviewed each balance date and will adjusted when it is probable that the Consolidated Entity’s tax losses are no longer sufficient to offset tax payable.
Restoration obligations
The Consolidated Entity estimates the future removal costs of oil and gas wells and production facilities at the time of installation of the assets. In most instances, the removal of assets will occur many years into the future. This requires judgmental assumptions regarding removal data, future environmental legislation, the extent of reclamation activities required, the engineering methodology for estimating future cost, future removal technologies in determining the removal cost, and liability specific discount rates to determine the present value of these cash flows. For more detail regarding the policy in respect of the provision for restoration refer to Note 2 (v).
|
Samson Oil & Gas Limited
|
Financial Statements – 30 June 2011
|
Page 31 of 78
|
NOTES TO THE CONSOLIDATED FINANCIAL STATEMENTS
|
|
for 30 June 2011
|
Reserves estimates
Estimates of recoverable quantities of proven and probable reserves, that are used to review the carrying value of oil and gas properties, include assumptions regarding commodity prices, exchange rates, discount rates, production and transportation costs for future cash flows. It also requires interpretation of complex and difficult geological and geophysical models in order to make an assessment of the size, shape, depth and quality of reservoirs and their anticipated recoveries. The economic, geological and technical factors used by the Consolidated Entity to estimate reserves may change from period to period. Changes in reserves can impact asset carrying values, the provision for restoration and the recognition of deferred tax assets, due to changes in estimated future cash flows. Reserves are integral to the amount of depreciation, depletion, amortisation and impairment charged to the profit and loss.
Reserve estimates are prepared by internal engineers and external independent third parties in accordance with guidelines prepared by the Society of Petroleum Engineers. The reserve estimates as at 30 June 2011 and 30 June 2010 were prepared by independent reserve engineers, Ryder Scott Company.
Units of production method of depreciation and amortisation
The Consolidated Entity applies the units of production method for depreciation of its oil and gas properties and assets based on hydrocarbons produced. These calculations require the use of estimates and assumptions. Significant judgment is required in assessing the available reserves and future production associated with the assets to be depreciated under this method. Factors that must be considered in determining reserves and future production are the Company’s history of exploiting reserves and the relevant time frames, markets and future developments. When these factors change or become known in the future, such differences will impact pre-tax profit and carrying values of assets. It is impracticable to quantify the effect of these changes in these estimates and assumptions in future periods. The reassessment of rates occurs at 31 December and 30 June each and is performed consistently from period to period.
Income taxes
The Consolidated Entity has recognised deferred tax assets relating to carried forward tax losses to the extent that it is considered probable sufficient taxable temporary differences (deferred tax liabilities) relating to the same taxation authority and the same subsidiary against which the unused tax losses can be utilised.
However, utilisation of the tax losses also depends on the ability of the entity to satisfy certain tests at the time the losses are recouped. The deferred tax losses have been recognised in relation to the Consolidated Entity’s sale of a portion of its acreage interests in Goshen County, Wyoming.
|
e)
|
Revenue Recognition
|
Revenue is recognised and measured at the fair value of the consideration received or receivable to the extent it is probable that the economic benefits will flow to the Consolidated Entity and the revenue can be reliably measured. Amounts disclosed as revenue are net of rebates and amounts collected on behalf of third parties.
The following specific recognition criteria must also be met before revenue is recognised:
Sale of oil and gas
Revenue is recognised when the significant risks and rewards of ownership of the product have passed to the buyer and the amount of revenue can be measured reliably. Risks and rewards are considered to have passed to the buyer at the time of delivery of the product to the customer.
Gas imbalances occur when the Consolidated Entity sells more or less than its entitled ownership percentage of total gas production. Any amount received in excess of the Consolidated Entity’s share is treated as a liability. If the Company receives less than its entitled share, the underproduction is recorded as a receivable.
|
Samson Oil & Gas Limited
|
Financial Statements – 30 June 2011
|
Page 32 of 78
|
NOTES TO THE CONSOLIDATED FINANCIAL STATEMENTS
|
|
for 30 June 2011
|
Interest income
Revenue is recognised as the interest accrues using the effective interest method. This is a method of calculating the amortised cost (including allowances for impairment) of a financial asset and allocating the interest income over the relevant period using the effective interest rate, which is the rate that exactly discounts estimates of future cash receipts through the expected life of the financial asset to the net carrying amount of the financial asset.
Dividend income
Revenue is recognised when the Consolidated Entity’s right to receive the payment is established.
|
f)
|
Borrowing Costs
|
Borrowing costs are recognised as an expense when incurred unless they relate to a qualifying asset being constructed. In that case they are capitalised during the period required to complete and prepare the asset for intended use or sale.
|
g)
|
Leases
|
The determination of whether an arrangement is or contains a lease is based on the substance of the arrangement and requires an assessment of whether the fulfilment of the arrangement is dependent on the use of a specific asset or assets and whether the arrangement conveys a right to use the asset.
Consolidated Entity as lessee
Finance leases, which transfer to the Consolidated Entity substantially all the risks and benefits incidental to ownership of the leased item, are capitalised at the inception of the lease at the fair value of the leased property or, if lower, at the present value of the minimum lease payments. Lease payments are apportioned between the finance charges and reduction of the lease liability so as to achieve a constant rate of interest on the remaining balance of the liability. Finance charges are recognised as an expense in profit or loss.
Capitalised leased assets are depreciated over the shorter of the estimated useful life of the asset and the lease term if there is no reasonable certainty that the Consolidated Entity will obtain ownership by the end of the lease term.
Operating lease payments are recognised as an expense in the profit and loss on a straight line basis over the lease term. Operating lease incentives are recognised as a liability when received and subsequently reduced by allocating lease payments between rental expense and reduction of the liability.
|
h)
|
Cash and cash equivalents
|
Cash and cash equivalents in the balance sheet comprise cash at bank and in hand and short-term deposits with an original maturity of three months or less that are readily convertible to known amounts of cash and which are subject to an insignificant risk of changes in value.
For the purposes of Cash Flow Statement, cash and cash equivalents consist of cash and cash equivalents as defined above, net of outstanding bank overdrafts. Bank overdrafts are included within borrowings in current liabilities on the balance sheet.
Cash and cash equivalents exclude restricted cash.
|
i)
|
Restricted cash
|
The Consolidated Entity may be required to place funds with third parties as bonds for environmental restoration. These bonds are carried as non-current receivables when the release of cash is not expected to occur within twelve months. The bonds are represented by cash and are valued as cash.
|
Samson Oil & Gas Limited
|
Financial Statements – 30 June 2011
|
Page 33 of 78
|
NOTES TO THE CONSOLIDATED FINANCIAL STATEMENTS
|
|
for 30 June 2011
|
|
j)
|
Trade and other receivables
|
Trade receivables are recognised initially at fair value and subsequently measures at amortised using the effective interest rate method, less provision for impairment. Trade receivables are generally due for settlement within 30-90 days. They are presented as current assets unless collection is not expected for more than 12 months from reporting date.
Collectability of trade receivables is reviewed on an ongoing basis. Debts that are known to be uncollectible are written off by reducing the carrying amount directly. An allowance account (provision for impairment of trade receivables) is used when there is objective evidence that the Consolidated Entity will not be able to collect all amounts due according to the original terms of the receivables. Significant financial difficulties in the debtor, probability that the debtor will enter bankruptcy or financial reorganisation, and default or delinquency in payments (more than 60 days overdue) are considered indicators that the trade receivable is impaired. The amount of the impairment allowance is the difference between the asset’s carrying amount and the present value of estimated future cash flows, discounted at the original effective interest rate. Cash flows relating to short-term receivables are not discounted if the effect of discounting is immaterial.
The amount of the impairment loss is recognised in profit and loss within other expenses. When a trade receivable for which an impairment allowance had been recognised becomes uncollectible in a subsequent period, it is written off against the allowance account. Subsequent recoveries of amounts previously written off are credited against other expenses in profit and loss.
|
k)
|
Prepayments
|
Prepayments relate to certain goods and services whereby the payment has been made and the resultant benefit is derived over future periods.
|
l)
|
Foreign currency translation
|
(I) Functional and presentation currency
The functional currency of Samson Oil & Gas Limited (parent) is Australian Dollars, the reason for this being the main operations of the Parent Entity are performed in Australia. The functional and presentation currency of Samson Oil & Gas USA, Inc and Samson Oil and Gas USA Montana, Inc is United States Dollars. The presentation currency of the Consolidated Entity is United States Dollars. Each entity in the Consolidated Entity determines its own functional currency and items included in the financial statements of each entity are measured using that functional currency.
(ii)Transaction and balances
Foreign currency transactions are translated into the functional currency using the exchange rates prevailing at the dates of the transactions. Foreign exchange gains and losses resulting from the settlement of such transactions and from the translation at year end exchange rates of monetary assets and liabilities denominated in foreign currencies are recognised in profit or loss, except when they are deferred in equity as qualifying cash flow hedges and qualifying net investment hedges or are attributable to part of the net investment in a foreign operation.
Foreign exchange gains and losses that relate to borrowings are presented in the profit and loss, within finance costs. All other foreign exchange gains and losses are presented in the profit and loss on a net basis within other income or other expenses.
Non-monetary items that are measured at fair value in a foreign currency are translated using the exchange rates at the date when the fair value was determined. Translation differences on assets and liabilities carried at fair value are reported as part of the fair value gain or loss. For example, translation differences on non-monetary assets and liabilities such as equities held at fair value through profit or loss are recognised in profit or loss as part of the value gain or loss and translation differences on non-monetary assets such as equities classified as available-for-sale financial assets are recognised in other comprehensive income.
(iii) Translation of Consolidated Entity Companies’ functional currency to presentation currency
The results and financial position of Consolidated Entity entities (none of which has the currency of a hyperinflationary economy) that have a functional currency different from the presentation currency are translated into the presentation currency as follows:
|
Samson Oil & Gas Limited
|
Financial Statements – 30 June 2011
|
Page 34 of 78
|
NOTES TO THE CONSOLIDATED FINANCIAL STATEMENTS
|
|
for 30 June 2011
|
|
|
·
|
Assets and liabilities for each balance sheet presented are translated at the closing rate at the date of that balance sheet
|
|
|
·
|
Income and expense for each profit and loss are translated at average exchange rates (unless this is not a reasonable approximation of the cumulative effect of the rates prevailing on transaction dates, in which case income and expenses are translated at the dates of the transactions)
|
|
|
·
|
Equity is translated at the historical exchange rate that approximates the rate in effect at the date of the transaction, and
|
|
|
·
|
All resulting exchange differences are recognised in other comprehensive income.
|
On consolidation, exchange differences arising from the translation of any net investment in foreign entities, and of borrowings and other financial instruments designated as hedges of such investments, are taken to shareholders’ equity. When a foreign operation is sold or any borrowings forming part of the net investment are repaid, a proportionate share of such exchange differences are recognised in profit and loss, as part of the gain or loss on sale where applicable.
Goodwill and fair value adjustments arising on the acquisition of a foreign entity are treated as assets and liabilities of the foreign entities and translated at the closing rate.
|
m)
|
Income tax
|
The income tax expense or revenue for the period is the tax payable on the current period’s taxable income based on the applicable income tax rate for each jurisdiction adjusted by changes in deferred tax assets and liabilities attributable to temporary differences and to unused tax losses.
The current income tax charge is calculated on the basis of the tax laws enacted or substantively enacted at the end of the reporting period in the countries where the company’s subsidiaries operate and generate taxable income. Management periodically evaluates positions taken in tax returns with respect to situations in which applicable tax regulation is subject to interpretation. It establishes provisions where appropriate on the basis of amounts expected to be paid to the tax authorities.
Deferred income tax is provided in full, using the liability method, on temporary differences arising between the tax bases of assets and liabilities and their carrying amounts in the consolidated financial statements. However, the deferred income tax is not accounted for if it arises from initial recognition of an asset or liability in a transaction other than a business combination that at the time of the transaction affects neither accounting nor taxable profit nor loss. Deferred income tax is determined using tax rates (and laws) that have been enacted or substantially enacted by the reporting date and are expected to apply when the related deferred income tax asset is realised or the deferred income tax liability is settled.
Deferred tax assets are recognised for deductible temporary differences and unused tax losses only if it is probable that future taxable amounts will be available to utilise those temporary differences and losses.
Deferred tax assets and liabilities are offset when there is a legally enforceable right to offset current tax assets and liabilities and when the deferred tax balances relate to the same taxation authority. Current tax assets and tax liabilities are offset where the entity has a legally enforceable right to offset and intends either to settle on a net basis, or to realise the asset and settle the liability simultaneously.
Current and deferred tax is recognised in profit or loss, except to the extent that it relates to items recognised in other comprehensive income or directly in equity. In this case, the tax is also recognised in other comprehensive income or directly in equity, respectively.
|
n)
|
Goods and Services Tax (GST)
|
Revenues, expenses and assets are recognised net of the amount of associated GST, unless the GST incurred is not recoverable from the taxation authority. In this case it is recognised as part of the cost of acquisition of the asset or as part of the expense.
|
Samson Oil & Gas Limited
|
Financial Statements – 30 June 2011
|
Page 35 of 78
|
NOTES TO THE CONSOLIDATED FINANCIAL STATEMENTS
|
|
for 30 June 2011
|
Receivables and payables are stated inclusive of the amount of GST receivable or payable. The net amount of GST recoverable from, or payable to, the taxation authority is included with other receivables or payables in the balance sheet.
Cash flows are presented on a gross basis. The GST components of cash flows arising from investing or financing activities which are recoverable from, or payable to the taxation authority, are presented as operating cash flows.
|
o)
|
Plant and equipment
|
Plant and equipment is stated at historical cost less accumulated depreciation and any accumulated impairment losses. Such cost includes the cost of replacing parts that are eligible for capitalisation when the cost of replacing the parts is incurred. Similarly, when each major overhaul is performed its cost is recognised in the carrying amount of plant and equipment as a replacement only if it is eligible for capitalisation. All other repairs and maintenance are recognised in profit or loss as incurred.
Depreciation expense is estimated over the useful life of the assets as follows:
Furniture and fittings – over two to five years using the straight line method
Computer equipment – over two to five years using the straight line method
Motor vehicles – over three to five years using the straight line method
Lease and well equipment – over the life of the reserve (usually 3-25 years) – approximated using the units of production method.
The assets’ residual values, useful lives and amortisation methods are reviewed, and adjusted if appropriate, at each financial year end.
Refer Note 2s) for the Consolidated Entity’s policy in relation to Impairment of Non-Financial Assets.
Derecognition and disposal
An item of plant and equipment is derecognised upon disposal or when no further future economic benefits are expected from its use or disposal.
Any gain or loss arising on derecognition (calculated as the difference between the net disposal proceeds and the carrying amount of the asset) is included in profit and loss in the year the asset is derecognised.
|
p)
|
Oil and gas properties
|
Oil and gas properties include capitalised project expenditure and development expenditure.
The Consolidated Entity uses the units of production method to amortise costs carried forward in relation to its oil and gas properties. For this approach, the calculations are based on proved and probable reserves as determined by our reserves determination.
Impairment on the carrying value of oil and gas properties is based on proved and probable reserves and is assessed on a field by field basis.
|
q)
|
Exploration and evaluation assets
|
Exploration and evaluation expenditure in respect of each area of interest is accounted for using the successful efforts method of accounting. The successful efforts method requires all exploration and evaluation expenditure to be expensed in the period in which it is incurred, except the costs of successful wells and the costs of acquiring interests in new exploration assets, which are capitalised as intangible exploration and evaluation assets. The costs of wells are initially capitalised pending the results of the well.
An area of interest refers to an individual geographical area where the presence of oil or a natural gas field is considered favourable or has been proved to exist, and in most cases will comprise an individual oil or gas field.
|
Samson Oil & Gas Limited
|
Financial Statements – 30 June 2011
|
Page 36 of 78
|
NOTES TO THE CONSOLIDATED FINANCIAL STATEMENTS
|
|
for 30 June 2011
|
This means all exploration and evaluation costs, including general permit activity, geological and geophysical costs are expensed as incurred except where:
|
|
·
|
the expenditure or asset acquired relates to an exploration discovery, that at balance date, the assessment of whether or not an economically recoverable reserve is not yet complete and active and significant operations in relation to the area of interest is continuing; or
|
|
|
·
|
it is expected that the expenditure or asset acquired will be recouped through successful exploitation, or alternatively, by its sale.
|
Exploration costs are classified as cash flows from investing activities in the cash flow statement.
Exploration and evaluation assets are assessed for impairment when facts and circumstances indicate that the carrying amount of an exploration and evaluation asset may exceed its recoverable amount. When assessing for impairment consideration is given to but not limited to the following:
|
|
·
|
the period for which the Consolidated Entity has the right to explore
|
|
|
·
|
planned and budgeted future exploration expenditure
|
|
|
·
|
activities incurred during the year, and
|
|
|
·
|
activities planned for future periods.
|
|
r)
|
Investments and other financial assets
|
Investments and financial assets in the scope of AASB 139 Financial Instruments: Recognition and Measurement are categorised as either financial assets at fair value through profit or loss, loans and receivables, or available-for-sale financial assets. The classification depends on the purpose for which the investments were acquired. Designation is re-evaluated at each financial year end, but there are restrictions on reclassifying to other categories.
When financial assets are recognised initially, they are measured at fair value, plus in the case of assets not at fair value through profit or loss, directly attributable transaction costs.
Recognition and Derecognition
Regular purchases and sales of financial assets are recognised on trade-date – the date on which the group commits to purchase or sell the asset. Financial assets are derecognised when the rights to receive cash flows from the financial assets have expired or have been transferred and the group has transferred substantially all the risks and rewards of ownership.
When securities classified as available-for-sale are sold, the accumulated fair value adjustments recognised in other comprehensive income are reclassified to profit or loss as gains and losses from investment securities.
Measurement
At initial recognition, the group measures a financial asset at its fair value plus, in the case of a financial asset not at fair value through profit or loss, transaction costs that are directly attributable to the acquisition of the financial asset. Transaction costs of financial assets carried at fair value through profit or loss are expensed in profit or loss.
Loans and receivables and held-to-maturity investments are subsequently carried at amortised cost using the effective interest method.
Available-for-sale financial assets and financial assets at fair value through profit or loss are subsequently carried at fair value. Gains or losses arising from changes in the fair value of the ‘financial assets at fair value through profit or loss’ category are presented in profit or loss within other income or other expenses in the period in which they arise. Dividend income from financial assets at fair value through profit or loss is recognised in profit or loss as part of revenue from continuing operations when the Consolidated Entity’s right to receive payments is established. Interest income from these financial assets is included in the net gains/(losses).
|
Samson Oil & Gas Limited
|
Financial Statements – 30 June 2011
|
Page 37 of 78
|
NOTES TO THE CONSOLIDATED FINANCIAL STATEMENTS
|
|
for 30 June 2011
|
Changes in the fair value of monetary securities denominated in a foreign currency and classified as available-for-sale are analysed between translation differences resulting from changes in amortised cost of the security and other changes in the carrying amount of the security. The translation differences related to changes in the amortised costs are recognised in profit or loss, and other changes in carrying amount are recognised in other comprehensive income. Changes in the fair value of other monetary and no-monetary securities classified as available-for-sale are recognised in the other comprehensive income.
(i) Financial assets at fair value through profit or loss
Financial assets classified as held for trading are included in the category ‘financial assets at fair value through profit or loss’. Financial assets are classified as held for trading in that they are acquired for the purpose of selling in the near term with the intention of making a profit. Derivatives are also classified as held for trading unless they are designated as effective hedging instruments. Gains or losses on financial assets held for trading are recognised in profit or loss and the related assets are classified as current assets in the balance sheet.
(ii) Loans and Receivables
Loans and receivables are non-derivative financial assets with fixed determinable payments that are not quoted in an active market. Such assets are carried at amortised cost using the effective interest rate method. Gains and losses are recognised in the profit and loss when the loans and receivables are derecognised or impaired. These are included in current assets, except for those with maturities greater than 12 months after the balance date, which are classified as non-current.
Impairment
The Consolidated Entity assesses at each reporting period whether there is objective evidence that a financial asset or group of financial assets is impaired. A financial asset or group of financial assets is impaired and impairment losses are incurred only if there is objective evidence of impairment as result of one more events that occurred after the initial recognition of the asset (a ‘loss event’) and that loss event (or events) has an impact on the estimated future cash flows of the financial asset or group of financial assets that can be reliability estimated. In the case of equity investments classified as available-for-sale, a significant or prolonged decline in the fair value of the security below its cost is considered an indicator that the assets are impaired. Impairment losses are recognised through the profit and loss.
|
|
(i)
|
Assets carried at amortised cost
|
For loans and receivables, the amount of the loss is measured as the difference between the asset’s carrying amount and the present value of estimated future cash flows (excluding future credit losses that have not been incurred) discounted at the financial asset’s original effective interest rate. The carrying amount of the asset is reduced and the amount of the loss is recognised in the consolidated profit and loss. If a loan or held-to-maturity investment has a variable interest rate, the discount rate for measuring any impairment loss is the current effective interest rate determined under the contract. As a practical expedient, the Consolidated Entity may measure impairment on the basis of an instrument’s fair value using an observable market price.
If, in a subsequent period, the amount of the impairment loss decreases and the decrease can be related objectively to an event occurring after the impairment was recognised (such as an improvement in a debtor’s credit rating), the reversal of the previously recognised impairment loss is recognised in the consolidated profit and loss.
|
|
(ii)
|
Assets classified as available-for-sale
|
If there is objective evidence of impairment for available-for-sale financial assets, the cumulative loss –measured as the difference between the acquisition cost and the current fair value, less any impairment loss on that financial asset previously recognised in profit or loss – is removed from equity and recognised in profit or loss.
Impairment losses on equity instruments that were recognised in profit or loss are not reversed through profit or loss in a subsequent period.
If the fair value of a debt instrument classified as available-for-sale increases in a subsequent period and the increase can be objectively related to an event occurring after the impairment loss was recognised in profit or loss, the impairment loss is reversed through profit or loss.
|
Samson Oil & Gas Limited
|
Financial Statements – 30 June 2011
|
Page 38 of 78
|
NOTES TO THE CONSOLIDATED FINANCIAL STATEMENTS
|
|
for 30 June 2011
|
|
s)
|
Impairment of non-financial assets
|
The Consolidated Entity assesses at each reporting date whether there is an indication that an asset may be impaired. If any such indication exists, or when annual impairment testing for an asset is required, the Consolidated Entity makes an estimate of the asset’s recoverable amount. An asset’s recoverable amount is the higher of its fair value less costs to sell and its value in use and is determined for an individual asset, unless the asset does not generate cash inflows that are largely independent of those from other assets of groups or assets and the asset’s value in use cannot be estimated to be close to its fair value. In such cases the asset is tested for impairment as part of the cash-generating unit to which it belongs. When the carrying amount of an asset or cash-generating unit exceeds its recoverable amount, the asset or cash-generating unit is considered impaired and is written down to its recoverable amount. Impairment losses relating to continuing operations are recognised in profit and loss.
In assessing value in use, the estimated future cash flows are discounted to their present value using a pre-tax discount rate that reflects current market assessments of the time value of money and the risks specific to the asset. Impairment losses relating to continuing operations are recognised in those expense categories consistent with the function of the impaired assets.
An assessment is also made at each reporting date as to whether there is any indication that previously recognised impairment losses may no longer exist or may have decreased. If such an indication exists, the recoverable amount is estimated. A previously recognised impairment loss is reversed only if there has been a change in the estimates used to determine the asset’s recoverable amount since the last impairment loss was recognised. If that is the case the carrying amount of the asset is increased to its recoverable amount. That increased amount cannot exceed the carrying amount that would have been determined, net of depreciation, had no impairment loss been recognised for the asset in prior years. Such reversal is recognised in profit or loss. After such a reversal the depreciation charge is adjusted in future periods to allocate the asset’s revised carrying amount, less any residual value, on a systematic basis over its remaining useful life.
|
t)
|
Trade and other payables
|
These amounts represent liabilities for goods and services provided to the Consolidated Entity prior to the end of the financial year which are unpaid. These amounts are unsecured and are usually paid within 30 days of recognition. Trade and other payables are presented as current liabilities unless payment is not due within 12 months from the reporting date. They are recognised initially at their fair value and subsequently measured at amortised cost using the effective interest method.
|
u)
|
Provisions
|
Provisions for legal claims and make good obligations are recognised when the Consolidated Entity has a present legal or constructive obligation as a result of past events, it is probable that an outflow of resources will be required to settle the obligation and the amount has been reliably estimated. Provisions are not recognised for future operating losses.
Where there are a number of similar obligations, the likelihood that an outflow will be required in settlement is determined by considering the class of obligations as a whole. A provision is recognised even if the likely of an outflow with respect to any one item including in the same class of obligations may be small.
Provisions are measured at the present value of management’s best estimate of the expenditure required to settle the present obligation at the end of the reporting period. The discount rate used to determine the present value is a pre-tax rate that reflects current market assessments of the time value of money and the risks specific to the liability. The increase in the provision due to the passage of time is recognised as interest expense.
|
v)
|
Restoration costs
|
The Consolidated Entity records the present value of the estimated cost of legal and constructive obligations to restore operating locations in the period in which the obligation arises. The nature of restoration activities includes the removal of facilities, abandonment of wells and rehabilitation of affected areas.
|
Samson Oil & Gas Limited
|
Financial Statements – 30 June 2011
|
Page 39 of 78
|
NOTES TO THE CONSOLIDATED FINANCIAL STATEMENTS
|
|
for 30 June 2011
|
Typically, the obligation arises when the asset is installed at the production location. When the liability is initially recorded, the estimated cost is capitalised by increasing the carrying amount of the related oil and gas properties. Over time, the liability is increased for the change in present value based on a risk adjusted pre-tax discount rate appropriate to the risks inherent in the liability. The unwinding of the discount is recorded as an accretion charge within finance costs. The carrying amount capitalised in oil and gas properties is depreciated over the useful life of the related asset.
Each year, the Consolidated Entity reviews the estimated restoration costs and the estimated period in which the obligation is likely to occur to ensure that they are appropriate. The Consolidated Entity also reviews the discount rate to ensure it is still appropriate. If changing any of these variables results in a decrease in the liability the difference is recorded against the corresponding asset, which is included in oil and gas properties in the balance sheet.
Costs incurred that relate to an existing condition caused by past operations, and that do not have a future economic benefit, are expensed.
|
w)
|
Employee leave benefits
|
Wages, salaries, annual leave and sick leave
Liabilities for wages and salaries, including non-monetary benefits, annual leave and accumulating sick leave expected to be settled within 12 months of the reporting date are recognised in other payables in respect of employee’s services up to the reporting date. They are measured at the amounts expected to be paid when the liabilities are settled. Liabilities for non-accumulating sick leave are recognised when the leave is taken and measured at the rates paid or payable. The liability for annual leave and all other short-term employee benefit obligations is presented in payables.
Long service leave
The liability for long service is recognised in the provision for employee benefits and measured as the fair value of expected future payments to be made in respect of services provided by employees up to the reporting date using the projected unit credit method. Consideration is given to expected future wage and salary levels, experience of employee departures and periods of service. Expected future payments are discounted using market yields at the reporting date on national government bonds with terms to maturities and currencies that match, as closely as possible, the estimated future cash outflows.
|
x)
|
Share-based payment transactions
|
Equity settled transactions:
The Consolidated Entity provides benefits to employees (including senior executives) of the Consolidated Entity in the form of share based payments, whereby employees render services in exchange for shares or rights over shares (equity-settled transactions).
During the current year, the Consolidated Entity filed a Form S-8 with the Securities Exchange Commission. The Form S-8 is a registration statement used by U.S. public companies to register securities to be offered pursuant to employee benefit plans; in this case the ordinary shares issuable and reserved for issuance underlying the options which may be issued pursuant to the Samson Oil & Gas Limited Stock Option Plan were registered.
The cost of equity-settled transactions with employees is measured by reference to the fair value of the equity instruments at the date at which they are granted. The fair value at grant date is determined using a binomial option pricing model that takes into account the exercise price, the term of the option, the impact of dilution, the share price at grant date and expected price volatility of the underlying share, the expected dividend yield and the risk free interest rate for the term of the option.
In valuing equity settled transactions, no account is taken of any performance conditions, other than conditions linked to the price of the shares of Samson Oil & Gas Limited (market conditions) if applicable.
|
Samson Oil & Gas Limited
|
Financial Statements – 30 June 2011
|
Page 40 of 78
|
NOTES TO THE CONSOLIDATED FINANCIAL STATEMENTS
|
|
for 30 June 2011
|
The cost of equity-settled transactions is recognised, together with a corresponding increase in equity, over the period, if any, in which the performance and/or services conditions are fulfilled, ending on the date on which the relevant employees become fully entitled to the award (the vesting period).
At each subsequent reporting date until vesting, the cumulative charge to profit and loss is the product of:
|
|
i.
|
The grant date fair value of the award;
|
|
|
ii.
|
The current best estimate of the number of awards that will vest, taking into account such factors as the likelihood of employee turnover during the vesting period and the likelihood of non-market performance conditions being met; and
|
|
|
iii.
|
The expired portion of the vesting period.
|
The charge to profit and loss for the period is the cumulative amount as calculated above, less the amounts already charged in previous periods. There is a corresponding entry to equity.
Until an award has vested, any amounts recorded are contingent and will be adjusted if more or fewer awards vest than originally anticipated to do so. Any award subject to a market condition is considered to vest irrespective of whether or not that market condition is fulfilled, provided that all other conditions are satisfied.
If the terms of an equity-settled award are modified, as a minimum, an expense is recognised as if the terms had not been modified. In addition, an expense is recognised for any modification that increases the total fair value of the share-based payment arrangement, or is otherwise beneficial to the employee, as measured at the date of modification.
If an equity-settled award is cancelled, it is treated as if it had vested on the date of cancellation, and any expense not yet recognised for the award is recognised immediately. However, if a new award is substituted for the cancelled award and designated as a replacement award on the date that it is granted, the cancelled and the new award are treated as they were a modification of the original award, as described in the previous paragraph.
The dilutive effect, if any, of the outstanding options is reflected as additional share dilution in the computation of earnings per share.
The expense for share based payments in relation to Directors and executives is recognised in the parent entity.
|
y)
|
Contributed equity
|
Ordinary shares are classified as equity. Incremental costs directly attributable to the issue of new shares or options are shown in equity as a deduction, net of tax, from the proceeds.
Where any member of the Consolidated Entity purchases the Company’s equity instruments, for example as a result of a share buy-back or share based payment plan, the consideration paid, including any directly attributable incremental costs (net of income taxes) is deducted from equity attributable to the owners of Samson Oil & Gas Limited. Where such ordinary shares are subsequently reissued, any consideration received, net of any directly attributable incremental transaction costs and the related income tax effects, is included in equity attributable of the owners of Samson Oil & Gas Limited.
|
z)
|
Earnings per share
|
|
|
i)
|
Basic earnings per share
|
Basic earnings per share is calculated by dividing:
|
|
·
|
The result attributable to equity holders of the Company, excluding any costs of servicing equity other than ordinary shares
|
|
|
·
|
By the weighted average number of ordinary shares outstanding during the financial year, adjusted for bonus elements in ordinary shares issued during the year and excluding treasury shares (note 26).
|
|
Samson Oil & Gas Limited
|
Financial Statements – 30 June 2011
|
Page 41 of 78
|
NOTES TO THE CONSOLIDATED FINANCIAL STATEMENTS
|
|
for 30 June 2011
|
|
|
ii)
|
Diluted earnings per share
|
Diluted earnings per share adjusts the figures used in the determination of basic earnings per share to take into account:
|
|
·
|
The after income tax effect of interest and other financing costs associated dilutive potential ordinary shares, and
|
|
|
·
|
The weighted average number of additional ordinary shares that would have been outstanding assuming the conversion of all dilutive potential ordinary shares.
|
|
aa)
|
Joint Ventures
|
Jointly controlled assets
Interests in jointly controlled assets are reported in the financial statements by including the Consolidated Entity’s share of assets employed in the joint ventures, the share of liabilities incurred in relation to the joint ventures and the share of any expenses incurred in relation to the joint ventures in their respective classification categories.
|
bb)
|
Business Combinations
|
The acquisition method of accounting is used to account for all business combinations, including business combinations involving entities or businesses under common control, regardless of whether equity instruments or other assets are acquired. The consideration transferred for the acquisition of a subsidiary comprises the fair values of the assets transferred, the liabilities incurred and the equity interests issued by the group. The consideration transferred also includes the fair value of any contingent consideration arrangement and the fair value of any pre-existing equity interest in the subsidiary. Acquisition related costs are expensed as incurred. Identifiable assets acquired and liabilities and contingent liabilities assumed in a business combination are, with limited exceptions, measured initially at their fair values at the acquisition date. On an acquisition by acquisition basis, the group recognises any non-controlling interesting in the acquiree either at fair value or at the non-controlling interest’s proportionate share of the acquiree’s net identifiable assets.
The excess of the consideration transferred, the amount of any non-controlling interest in the acquiree and the acquisition-date fair value of any previous equity interest in the acquiree over the fair value of the group’s share of the net identifiable assets acquired is recorded as goodwill. If those amounts are less than the fair value of the net identifiable assets of the subsidiary acquired and the measurement of all amounts has been reviewed, the different is recognised directly in profit or loss as a bargain purchase.
Where settlement of any part of cash consideration is deferred, the amounts payable in the future are discounted to their present value as at the date of exchange. The discount rate used is the entity’s incremental borrowing rate, being the rate at which similar borrowing could be obtained from an independent financier under comparable terms and conditions.
Contingent consideration is classified either as equity or a financial liability. Amounts classified as a financial liability are subsequently remeasured to fair value with changes in fair value recognised in profit or loss.
|
cc)
|
Segment Reporting
|
Operating segments are reported in a manner consistent with the internal reporting provided to the chief operating decision maker. The chief operating decision maker, who is responsible for allocating resources and assessing performance of operating segments, has been identified as the Board of Directors.
|
dd)
|
Derivative Financial Instruments
|
The Consolidated Entity uses derivative financial instruments, such as fixed forward swaps to manage price risk. Such derivative financial instruments are initially recognised at fair value on the date on which a derivative contract is entered into and subsequently remeasured to fair value. Derivatives are carried as assets when their fair value is positive and as liabilities when their fair value is negative.
|
Samson Oil & Gas Limited
|
Financial Statements – 30 June 2011
|
Page 42 of 78
|
NOTES TO THE CONSOLIDATED FINANCIAL STATEMENTS
|
|
for 30 June 2011
|
Any gains or losses arising from changes in the fair value are taken directly to the profit and loss.
|
ee)
|
Borrowings
|
Borrowings are classified as current liabilities unless the Consolidated Entity has an unconditional right to defer settlement of the liability for at least 12 months after the reporting date.
Interest
Interest is classified as an expense consistent with the balance sheet classification of the related debt instrument.
|
ff)
|
Discontinued Operations
|
Non-current assets and disposal groups are classified as held for sale and measured at the lower of their carrying amount and fair value less costs to sell if their carrying amount will be recovered principally through a sale transaction. They are not depreciated or amortised. For an asset or disposal group to be classified as held for sale it must be available for immediate sale in its present condition and its sale must be highly probable.
An impairment loss is recognised for any initial or subsequent write-down of the asset (or disposal group) to fair value less costs to sell. A gain is recognised for any subsequent increases in fair value less costs to sell of an asset (or disposal group), but not in excess of any cumulative impairment loss previously recognised. A gain or loss not previously recognised by the date of the sale of the non-current asset (or disposal group) is recognised at the date of derecognition.
Non-current assets (including those that are part of a disposal group) are not depreciated or amortised while they are classified as held for sale. Interest and other expenses are attributable to the liabilities of a disposal group classified as held for sale continue to be recognised.
Non-current assets classified as held for sale and the assets of a disposal group classified as held for sale are presented separately from other assets in the balance sheet.
A discontinued operation is a component of the entity that has been disposed of or is classified as held for sale and that represents a separate major line of business or geographical area of operations, is part of a single co-ordinated plan to dispose of such a line of business or area of operations, or is a subsidiary acquired exclusively with a view to resale. The results of discontinued operations are presented separately on the face of the statement of comprehensive income and the assets and liabilities are presented separately on the face of the balance sheet.
|
gg)
|
Parent entity financial information
|
The financial information for the parent entity, Samson Oil & Gas Limited, disclosed in note 33 has been prepared on the same basis as the consolidated financial statements, except as set out below.
|
|
(i)
|
Investments in subsidiaries, associates and joint venture entities
|
Investments in subsidiaries, associates and joint venture entities are accounted for at cost in the financial statements of Samson Oil & Gas Limited.
The Consolidated Entity does not meet the definition of a Group for the purposes of Tax Consolidation therefore there are no tax sharing or funding agreements in place.
|
hh)
|
New accounting standards and interpretations
|
Certain new accounting standards and interpretations have been published that are not mandatory for 30 June 2011 reporting periods. The Consolidated Entity’s assessment of the impact of these new standards and interpretations is set out below.
|
Samson Oil & Gas Limited
|
Financial Statements – 30 June 2011
|
Page 43 of 78
|
NOTES TO THE CONSOLIDATED FINANCIAL STATEMENTS
|
|
for 30 June 2011
|
|
|
(i)
|
AASB 9 Financial Instruments, AASB 2009-11 Amendments to Australian Accounting Standards arising from AASB 9 and AASB 2010-7 Amendments to Australian Accounting Standards arising from AASB 9 (December 2010)(effective from 1 January 2013) AASB 9 Financial Instruments addresses the classification, measurement and derecognition of financial assets and financial liabilities. The standard is not applicable until 1 January 2013 but is available for early adoption. When adopted, the standard will affect the Consolidated Entity’s accounting for its available for sale financial assets (if any are held), since AASB 9 only permits the recognition of fair value gains and losses in other comprehensive income if they relate to equity instruments that are not held for trading. Fair value gains and losses on available for sale debt instruments, for example, will therefore have to be recognised directly in profit or loss.
|
There will be no impact on the Consolidated Entity’s accounting for financial liabilities, as the new requirements only affect the accounting for financial liabilities that are designated at fair value through profit or loss and the Consolidated Entity does not have any such liabilities. The derecognition rules have been transferred from AASB 139 Financial Instruments: Recognition and Measurement and have not been changed. The Consolidated Entity has not yet decided when to adopt AASB 9.
|
|
(ii)
|
AASB 1053 Application of Tiers of Australian Accounting Standards and AASB 2010-2 Amendments to Australian Accounting Standards arising from Reduced Disclosure Requirements (effective from 1 July 2013)
|
On 30 June 2010 the AASB officially introduced a revised differential reporting framework in Australia. Under this framework, a two-tier differential reporting regime applies to all entities that prepare general purpose financial statements. Samson Oil & Gas Limited is listed on the ASX and is not eligible to adopt the new Australian Accounting Standards – Reduced Disclosure Requirements. The two standards will therefore have no impact on the financial statements of the entity.
|
Samson Oil & Gas Limited
|
Financial Statements – 30 June 2011
|
Page 44 of 78
|
NOTES TO THE CONSOLIDATED FINANCIAL STATEMENTS
|
|
for 30 June 2011
|
|
NOTE 3.
|
REVENUE AND EXPENSES
|
|
Consolidated Entity
|
||||||||
|
2011
|
2010
|
|||||||
|
$
|
$
|
|||||||
|
Revenue and Expenses from Continuing Operations
|
||||||||
|
a Revenue
|
||||||||
|
Sale of oil and gas
|
||||||||
|
Oil sales
|
5,038,446 | 1,956,193 | ||||||
|
Gas sales
|
930,330 | 915,086 | ||||||
|
Other liquids
|
- | 20,658 | ||||||
| 5,968,776 | 2,891,937 | |||||||
|
Finance Income
|
||||||||
|
Interest income
|
368,251 | 24,318 | ||||||
|
Total Revenue
|
6,337,027 | 2,916,255 | ||||||
|
Other Income
|
||||||||
|
Gain on sale of assets
|
73,199,687 | - | ||||||
|
Gain on fixed forward swaps
|
152,171 | 34,435 | ||||||
|
Movement in fair value of derivative instruments
|
- | 147,279 | ||||||
|
Movement in fair value of held for trading investments
|
5,494 | 46,681 | ||||||
|
Movement in asset retirement obligation provision due to change in unwind rate
|
150,505 | - | ||||||
|
Other
|
2,246 | 58,929 | ||||||
|
Total Other Income
|
73,510,103 | 287,324 | ||||||
|
Consolidated Entity
|
||||||||
|
|
2011
|
2010
|
||||||
|
$
|
$
|
|||||||
|
b General and Administration
|
||||||||
|
Employee Benefits
|
||||||||
|
Salary and employee benefits
|
(2,659,004 | ) | (1,058,013 | ) | ||||
|
Share based payments
|
(1,767,380 | ) | (119,890 | ) | ||||
|
Total Employee Expense Benefits
|
(4,426,384 | ) | (1,177,903 | ) | ||||
|
Other General and Administration
|
||||||||
|
Consultants’ fees
|
(808,969 | ) | (446,794 | ) | ||||
|
Lease payments
|
(132,425 | ) | (142,202 | ) | ||||
|
Legal costs
|
(572,798 | ) | (211,444 | ) | ||||
|
Assurance, accounting and taxation advice
|
(756,975 | ) | (695,178 | ) | ||||
|
Travel and accommodation
|
(313,017 | ) | (66,126 | ) | ||||
|
Filing and listing fees
|
(23,663 | ) | (27,317 | ) | ||||
|
Insurance
|
(191,660 | ) | (139,943 | ) | ||||
|
Investor and public relations
|
(216,093 | ) | (124,098 | ) | ||||
|
Printing, postage and stationery
|
(33,319 | ) | (29,558 | ) | ||||
|
Movement in fair value of derivative instruments
|
(24,557 | ) | - | |||||
|
Other
|
(386,790 | ) | (276,351 | ) | ||||
|
Total Other General and Administration Expenses
|
(3,460,266 | ) | (2,159,011 | ) | ||||
| (7,886,650 | ) | (3,336,914 | ) | |||||
|
Samson Oil & Gas Limited
|
Financial Statements – 30 June 2011
|
Page 45 of 78
|
NOTES TO THE CONSOLIDATED FINANCIAL STATEMENTS
|
|
for 30 June 2011
|
|
Consolidated Entity
|
||||||||
|
|
2011
|
2010
|
||||||
|
$
|
$
|
|||||||
|
c Finance costs
|
||||||||
|
Unwinding of discount associated with restoration obligation
|
(55,488 | ) | (6,472 | ) | ||||
|
Amortised borrowing costs
|
(102,249 | ) | (111,545 | ) | ||||
|
Interest expense
|
(879,055 | ) | (1,312,393 | ) | ||||
|
Total Finance Costs
|
(1,036,792 | ) | (1,430,410 | ) | ||||
|
Consolidated Entity
|
||||||||
|
2011
|
2010
|
|||||||
|
$
|
$
|
|||||||
|
d Depreciation and amortisation, included in the profit and loss
|
||||||||
|
Included in cost of sales:
|
||||||||
|
Depreciation on lease and well equipment
|
(388,483 | ) | (226,150 | ) | ||||
|
Depletion of oil and gas properties
|
(1,645,355 | ) | (934,927 | ) | ||||
| (2,033,838 | ) | (1,161,077 | ) | |||||
|
Depreciation of furniture and fittings
|
(50,532 | ) | (65,387 | ) | ||||
| (2,084,370 | ) | (1,226,464 | ) | |||||
|
e Impairment movements
|
||||||||
|
(Impairment expense)/Reversal of impairment expense of oil and gas properties
|
(25,643 | ) | 82,801 | |||||
|
Total Impairment Expense
|
(25,643 | ) | 82,801 | |||||
|
Consolidated Entity
|
||||||||
|
2011
|
2010
|
|||||||
|
$
|
$
|
|||||||
|
f Included in exploration expenditure
|
||||||||
|
General exploration expense
|
(403,826 | ) | - | |||||
|
Deferred exploration expenditure written off
|
- | (774,665 | ) | |||||
|
Dry Hole Costs
|
- | (794,791 | ) | |||||
| (403,826 | ) | (1,569,456 | ) | |||||
|
Samson Oil & Gas Limited
|
Financial Statements – 30 June 2011
|
Page 46 of 78
|
NOTES TO THE CONSOLIDATED FINANCIAL STATEMENTS
|
|
for 30 June 2011
|
|
NOTE 4.
|
INCOME TAX
|
|
Consolidated Entity
|
||||||||
|
2011
|
2010
|
|||||||
|
$
|
$
|
|||||||
|
The major components of income tax benefit/(expense) are:
|
||||||||
|
Profit and Loss
|
||||||||
|
Current income tax
|
(6,783,577 | ) | - | |||||
|
Recognition of deferred income tax asset
|
(6,317,000 | ) | 6,317,000 | |||||
|
Income tax benefit reported in the profit and loss
|
(13,100,577 | ) | 6,317,000 | |||||
|
Continuing operations
|
(21,011,788 | ) | - | |||||
|
Discontinued operations
|
7,911,211 | - | ||||||
| (13,100,577 | ) | - | ||||||
|
Income (loss) from continuing operations
|
66,781,870 | (5,119,760 | ) | |||||
|
Income (loss) from discontinued operations
|
(6,356,108 | ) | (380,007 | ) | ||||
|
Income (loss) before income tax
|
60,425,762 | (5,499,767 | ) | |||||
|
At the Australian statutory income tax rate of 30% (2010: 30%)
|
(18,127,728 | ) | 1,649,930 | |||||
|
Expenditure not allowable for income tax purposes
|
(452,334 | ) | (35,967 | ) | ||||
|
Income not assessable for income tax purposes
|
- | 44,184 | ||||||
|
Effect of US tax rate differential
|
(3,021,288 | ) | 405,887 | |||||
|
Deferred tax assets not brought to account as realisation is not considered probable
|
7,538,392 | (2,064,034 | ) | |||||
|
Prior year losses not previously recognised bought to account
|
962,381 | 6,317,000 | ||||||
|
Aggregate income tax benefit
|
(13,100,577 | ) | 6,317,000 | |||||
|
Balance Sheet
|
Profit and Loss
|
|||||||||||||||
|
Consolidated
|
2011
|
2010
|
2011
|
2010
|
||||||||||||
| $ | $ | $ | $ | |||||||||||||
|
Deferred Income Tax
|
||||||||||||||||
|
Deferred income tax at 30 June relates to the following:
|
||||||||||||||||
|
Deferred tax liabilities
|
||||||||||||||||
|
Hedge Liability
|
7,963 | 18,262 | 10,299 | - | ||||||||||||
|
Loan fees
|
- | 665 | 665 | (725 | ) | |||||||||||
|
Gross deferred tax liabilities
|
7,963 | 18,927 | ||||||||||||||
|
Deferred tax assets
|
||||||||||||||||
|
Losses available to offset against future taxable income
|
3,702,894 | 10,544,782 | (6,841,888 | ) | (2,064,034 | ) | ||||||||||
|
Assets held for trading
|
- | - | - | 145 | ||||||||||||
|
Oil and gas properties
|
15,423 | 9,142,423 | (9,127,000 | ) | 105,002 | |||||||||||
|
Share issue costs
|
370,861 | 283,710 | 312,698 | (270,618 | ) | |||||||||||
|
Hedge liability
|
- | - | - | 57,439 | ||||||||||||
|
Other
|
231,404 | - | 231,404 | - | ||||||||||||
|
Deferred tax assets not brought to account as realisation is not regarded as probable
|
(4,312,619 | ) | (13,634,988 | ) | 9,096,822 | 4,144,209 | ||||||||||
|
Gross deferred tax assets
|
7,963 | 6,335,927 | ||||||||||||||
|
Deferred tax benefit
|
- | - | (6,317,000 | ) | - | |||||||||||
|
Net deferred tax recognised in the balance sheet
|
- | 6,317,000 | ||||||||||||||
|
Samson Oil & Gas Limited
|
Financial Statements – 30 June 2011
|
Page 47 of 78
|
NOTES TO THE CONSOLIDATED FINANCIAL STATEMENTS
|
|
for 30 June 2011
|
The Consolidated Entity has tax losses carried forward arising in Australia of $5,567,121 (2010: $4,108,810). The benefit of these losses of $1,670,136 (2010: $1,232,643) will only be obtained in future years if:
|
|
i.
|
the Consolidated Entity and the Parent Entity derive future assessable income of a nature and an amount sufficient to enable the benefit from the deduction for the losses to be realised; and
|
|
|
ii.
|
the Consolidated Entity and the Parent Entity have complied and continue to comply with the conditions for deductibility imposed by law; and
|
|
|
iii.
|
no changes in tax legislation adversely affect the Consolidated Entity and the Parent Entity in realising the benefit from deduction for the losses.
|
The Consolidated Entity has Federal net operating tax losses in the United States of approximately $5,242,426 (2010: $26,040,658). The current utilisation is approximately $20,798,232 (2010: $6,317,000) and future years are limited to an estimated $403,194 (2010: $403,194) per year as a result of a change in ownership of the one of the subsidiaries which occurred in January 2005. If not utilised, the tax net operating losses will expire during the period from 2008 to 2025.
In the prior year, the Consolidated Entity recognised a deferred income tax asset in relation to these losses of $6,317,000 as realisation of this benefit was probable due to the Goshen County Transaction. In the current year, the Consolidated Entity has recognised income tax expense of $13,100,577.
In addition to the above mentioned Federal carried forward losses in the United States, the Company also has approximately $19,720,456 (2010: $21,081,709) of State carried forward tax losses, with expiry dates between June 2010 and June 2030. A deferred income tax asset in relation to these losses has not been recognised as realization of the benefit is not regarded as probable.
The deferred tax benefit the Consolidated Entity will ultimately realise is dependent both upon the loss recoupment legislation in the United States and taxable income at the time recoupment.
The Consolidated Entity does not meet the definition of a group for the purposes of applying tax consolidation.
|
NOTE 5.
|
DIVIDENDS
|
No dividends have been declared during the year (2010: $Nil).
The balance of the franking account at the end of the year was nil (2010: Nil).
|
NOTE 6.
|
CASH AND CASH EQUIVALENTS
|
|
Consolidated Entity
|
||||||||
|
2011
|
2010
|
|||||||
|
$
|
$
|
|||||||
|
Cash at bank and on hand
|
58,448,477 | 5,885,735 | ||||||
Cash at bank earns interest at floating interest rates based on daily bank deposit rates.
a) Risk exposure
The Consolidated Entity’s exposure to interest rate risk is discussed in note 31. The maximum exposure to credit risk at the reporting date is the carrying amount of cash mentioned above.
|
Samson Oil & Gas Limited
|
Financial Statements – 30 June 2011
|
Page 48 of 78
|
NOTES TO THE CONSOLIDATED FINANCIAL STATEMENTS
|
|
for 30 June 2011
|
|
NOTE 7.
|
TRADE AND OTHER RECEIVABLES
|
|
Consolidated Entity
|
||||||||||
|
Note
|
2011
|
2010
|
||||||||
|
$
|
$
|
|||||||||
|
CURRENT
|
||||||||||
|
Trade receivables (i)
|
1,265,222 | 742,246 | ||||||||
|
Receivables – capital raising (ii)
|
- | 4,070,746 | ||||||||
|
Net GST Receivable
|
19,418 | 41,410 | ||||||||
|
Receivable – JV partner (iii)
|
390,578 | |||||||||
|
Other receivables (iv)
|
21,479 | 77,868 | ||||||||
| 1,696,697 | 4,932,270 | |||||||||
|
(i)
|
These receivables relate to the sale of oil and gas. They are non-interest bearing, unsecured and are generally on 30-90 day terms.
|
|
(ii)
|
These receivables relate to applications received for the Company’s share purchase plan for which the cash had not yet been cleared into the Consolidated Entity’s bank account.
|
|
(iii)
|
This receivable relates to monies to be recovered from a privately held company who participated in the Consolidated Entity’s acquisition of 3D seismic data in the Hawk Springs Project, Goshen County Wyoming. These funds are non-interest bearing, unsecured and were received prior to the signing of this report.
|
|
(vi)
|
These receivables are non-interest bearing, unsecured and are due for repayment within the next twelve months.
|
|
a)
|
Foreign exchange and interest rate risk - current receivables
|
Information about the Consolidated Entity’s exposure to foreign currency risk and interest rate risk in relation to trade and other receivables is provided in note 31.
|
b)
|
Fair value and credit risk – current receivables
|
Due to the short-term nature of these receivables, their carrying amount is assumed to approximate their fair value.
The maximum exposure to credit risk at the reporting date is the carrying amount of each class of receivables mentioned above. All receivables are unsecured. Refer to note 31 for more information on the risk management policy of the Consolidated Entity and the credit quality of trade receivables.
No receivables are past due. No impairment has been recognised in respect of any of these receivables.
|
Consolidated Entity
|
||||||||
|
2011
|
2010
|
|||||||
|
$
|
$
|
|||||||
|
NON CURRENT
|
||||||||
|
Other receivables (iv)
|
34,175 | 27,122 | ||||||
| 34,175 | 27,122 | |||||||
|
(iv)
|
These receivables are non-interesting bearing, unsecured and not due for repayment within the twelve months. The carrying value of these receivables approximates their fair value.
|
|
c)
|
Risk Exposure – non current receivables
|
Information about the Consolidated Entity’s exposure to credit risk, foreign exchange and interest rate risk is provided in note 31. The maximum exposure to credit risk at the reporting date is the carrying amount of the receivables mentioned above.
|
Samson Oil & Gas Limited
|
Financial Statements – 30 June 2011
|
Page 49 of 78
|
NOTES TO THE CONSOLIDATED FINANCIAL STATEMENTS
|
|
for 30 June 2011
|
|
NOTE 8.
|
FINANCIAL ASSETS AT FAIR VALUE THROUGH PROFIT OR LOSS
|
Financial assets at fair value through profit and loss are all held for trading and include:
|
Consolidated Entity
|
||||||||
|
2011
|
2010
|
|||||||
|
$
|
$
|
|||||||
|
CURRENT
|
||||||||
|
At fair value
|
||||||||
|
Shares – Australian listed
|
- | 40,165 | ||||||
| - | 40,165 | |||||||
Held for trading investments consist of investments in ordinary shares, and therefore have no fixed maturity date or coupon rate. These investments were sold during the current year.
Changes in fair values of financial assets at fair value through profit or loss are recorded in other income or general administrative expense in the profit and loss (notes 3a and b).
Information about the Consolidated Entity’s exposure to price risk and about the methods and assumptions used in determining fair value is provided in Note 31.
|
NOTE 9.
|
PREPAYMENTS
|
Prepayments include:
|
Consolidated Entity
|
||||||||
|
2011
|
2010
|
|||||||
|
$
|
$
|
|||||||
|
CURRENT
|
||||||||
|
Prepaid drilling expenses
|
515,934 | 1,378,798 | ||||||
|
Other prepaid expenses
|
76,871 | 75,473 | ||||||
| 592,805 | 1,454,271 | |||||||
Prepaid drilling expenses include cash advanced to the operators of the drilling operations in advance of the drilling commencing.
|
NOTE 10.
|
PLANT & EQUIPMENT
|
|
Consolidated Entity
|
||||||||
|
2011
$
|
2010
$
|
|||||||
|
Office Equipment
|
||||||||
|
Cost
|
544,402 | 514,287 | ||||||
|
Accumulated depreciation
|
(192,139 | ) | (364,248 | ) | ||||
| 352,263 | 150,039 | |||||||
|
At 1 July, net of accumulated depreciation
|
150,039 | 208,665 | ||||||
|
Additions
|
280,663 | 6,761 | ||||||
|
Disposals
|
(27,907 | ) | - | |||||
|
Depreciation charge for the year
|
(50,532 | ) | (65,387 | ) | ||||
|
At 30 June, net of accumulated depreciation and impairment
|
352,263 | 150,039 | ||||||
|
Lease and Well Equipment
|
||||||||
|
Cost
|
3,752,408 | 3,874,638 | ||||||
|
Accumulated depreciation and impairment
|
(1,512,493 | ) | (1,471,861 | ) | ||||
| 2,239,915 | 2,402,777 | |||||||
|
Samson Oil & Gas Limited
|
Financial Statements – 30 June 2011
|
Page 50 of 78
|
NOTES TO THE CONSOLIDATED FINANCIAL STATEMENTS
|
|
for 30 June 2011
|
|
Consolidated Entity
|
||||||||
|
|
2011
|
2010
|
||||||
|
|
$
|
$
|
||||||
|
At 1 July, net of accumulated depreciation and impairment
|
||||||||
|
Additions
|
1,247,943 | 741,975 | ||||||
|
Depreciation charge
|
(435,046 | ) | (325,614 | ) | ||||
|
Impairment charge
|
(9,625 | ) | - | |||||
|
Disposals
|
(966,134 | ) | - | |||||
|
At 30 June, net of accumulated depreciation and impairment
|
2,239,915 | 2,402,777 | ||||||
|
Total Plant and Equipment
|
2,592,178 | 2,552,816 | ||||||
|
NOTE 11.
|
EXPLORATION AND EVALUATION ASSETS
|
|
Consolidated Entity
|
||||||||
|
2011
|
2010
|
|||||||
|
$
|
$
|
|||||||
|
Balance at the beginning of the year
|
- | - | ||||||
|
Expenditure capitalised
|
3,347,738 | - | ||||||
| 3,347,738 | - | |||||||
The exploration expenditure capitalised relates to the Company’s acreage in the Hawk Springs Project, Goshen County, Wyoming and the Roosevelt Project, Roosevelt County, Montana. 3 wells are expected to be drilled within the Hawk Springs Project area and 2 wells are expected to be drilled within the Roosevelt Project area prior to 31 December 2011. The evaluation of the carrying value of this exploration expenditure will be reviewed following the drilling of these wells.
The recoverability of the carrying value of deferred exploration and evaluation expenditure is dependent on the successful exploitation, or alternatively sale, of the respective areas of interest.
|
NOTE 12.
|
RESTRICTED CASH
|
|
Consolidated Entity
|
||||||||
|
2011
|
2010
|
|||||||
|
$
|
$
|
|||||||
|
Non Current
|
||||||||
|
Bonds paid to state authorities in relation to exploration permits held
|
172,504 | 178,291 | ||||||
| 172,504 | 178,291 | |||||||
These bonds are interest bearing and will be repaid to the Consolidated Entity following the relinquishment of the related permit by the Company. This is not expected to occur within the next twelve months. The average interest rate applicable to these bonds is 0.1% (2010: 0.1%).
|
NOTE 13.
|
OIL AND GAS PROPERTIES
|
|
Consolidated Entity
|
||||||||
|
2011
|
2010
|
|||||||
|
$
|
$
|
|||||||
|
Proved developed producing properties at cost
|
17,197,676 | 38,106,585 | ||||||
|
Accumulated depletion
|
(4,320,103 | ) | (6,133,300 | ) | ||||
|
Impairment
|
(2,358,910 | ) | (17,769,492 | ) | ||||
| 10,518,663 | 14,203,793 | |||||||
|
Samson Oil & Gas Limited
|
Financial Statements – 30 June 2011
|
Page 51 of 78
|
NOTES TO THE CONSOLIDATED FINANCIAL STATEMENTS
|
|
for 30 June 2011
|
|
Consolidated Entity
|
||||||||
|
2011
|
2010
|
|||||||
|
$
|
$
|
|||||||
|
Proved undeveloped properties at cost
|
- | 10,081,671 | ||||||
|
Impairment
|
- | (6,150,011 | ) | |||||
| - | 3,931,660 | |||||||
|
Total
|
10,518,663 | 18,135,453 | ||||||
|
Proved Developed Producing Properties
|
||||||||
|
At 1 July, net of accumulated depreciation and impairment
|
14,203,793 | 14,250,874 | ||||||
|
Additions
|
6,309,640 | 2,179,831 | ||||||
|
Net impairment expense
|
(4,660,830 | ) | (801,291 | ) | ||||
|
Disposals
|
(3,752,358 | ) | - | |||||
|
Transfer from proved undeveloped properties
|
268,171 | - | ||||||
|
Depreciation charge
|
(1,849,753 | ) | (1,425,621 | ) | ||||
|
At 30 June, net of accumulated depreciation and impairment
|
10,518,663 | 14,203,793 | ||||||
|
Proved Undeveloped Properties
|
||||||||
|
At 1 July, net of accumulated depreciation and impairment
|
3,931,660 | 4,257,682 | ||||||
|
Additions
|
- | 16,549 | ||||||
|
Transfer to proved developed producing properties
|
(268,171 | ) | - | |||||
|
Disposals
|
(1,629,362 | ) | - | |||||
|
Net impairment expense
|
(2,034,127 | ) | (342,571 | ) | ||||
|
At 30 June, net of accumulated depreciation and impairment
|
- | 3,931,660 | ||||||
a) Assets pledged as security
In the prior year, Macquarie Bank Limited held a first charge mortgage over all assets (including the oil and gas properties) of the Consolidated Entity. This collateral was provided as part of the funding facility provided by Macquarie Bank Limited to Samson Oil & Gas USA Inc. Refer to Note 16 for further details relating to this facility.
|
Consolidated Entity
|
||||||||
|
2011
|
2010
|
|||||||
|
$
|
$
|
|||||||
|
The written down value of assets pledged as security was:
|
||||||||
|
Producing properties, including lease and well equipment
|
- | 16,606,570 | ||||||
|
Non producing properties
|
- | 3,931,660 | ||||||
| - | 20,538,230 | |||||||
b) Impairment of oil and gas properties
At 30 June 2011, the Consolidated Entity reviewed the carrying value of its oil and gas properties for impairment. An independent review was performed to assess the recoverable amount based on the net present value of the Consolidated Entity’s assets (by cash generating unit). The discount rate used to assess the recoverable amount (based on the value in use) was 10% (2010: 10%). The value in use has been based on the expected lives of the respective fields. The effect of future income taxes on discounted cashflows has not been considered in relation to the value of the current properties due the entity’s considerable tax losses and other tax deductions available to the Consolidated Entity.
|
Samson Oil & Gas Limited
|
Financial Statements – 30 June 2011
|
Page 52 of 78
|
NOTES TO THE CONSOLIDATED FINANCIAL STATEMENTS
|
|
for 30 June 2011
|
The value of oil and gas properties was reviewed on a field by field basis and has resulted in net impairment expense of $25,643 (2010:$1,143,863). It is the Consolidated Entity’s policy to use proved and probable reserves to support the carrying value of its properties. During the half year ended 31 December 2010, the Consolidated Entity recognised $6,678,940 in impairment expense in relation to its Jonah and Lookout Wash fields. These fields were sold in March 2011, and this impairment has been included in discontinued operations.
|
NOTE 14.
|
TRADE AND OTHER PAYABLES
|
|
Consolidated Entity
|
||||||||
|
2011
|
2010
|
|||||||
|
$
|
$
|
|||||||
|
Trade payables (i)
|
2,855,106 | 1,040,977 | ||||||
|
Payables - from capital raising (ii)
|
- | 1,169,916 | ||||||
|
Accrual of bonus payable (iii)
|
390,000 | - | ||||||
|
Other payables (iv)
|
161,271 | 107,885 | ||||||
| 3,406,377 | 2,318,778 | |||||||
|
|
(i)
|
Trade payables are non-interest bearing and normally settled on 30 day terms.
|
|
|
(ii)
|
This is a result of the board deciding to accept 75% of the Share Purchase Plan therefore refunds needed to be made.
|
|
|
(iii)
|
This accrual relates to the current year expense associated with the calendar year 2011 bonus plan. Based on probability analysis, using Monte Carlo simulation, 60% of the total bonus is expected to be paid out. This expense represents the accrual from 1 January 2011 to 30 June 2011. No cash has been paid in relation to this bonus.
|
|
|
(iv)
|
Other payables include accruals for annual leave. The entire obligation is presented as current, since the Consolidated Entity does not have an unconditional right to defer settlement. Based on past experience, the Consolidated Entity expects employees to take the full amount of accrued leave within the next twelve months.
|
|
NOTE 15.
|
PROVISIONS
|
|
Consolidated Entity
|
||||||||
|
2011
|
2010
|
|||||||
|
$
|
$
|
|||||||
|
Non-current
|
||||||||
|
Provision for Restoration
|
526,218 | 851,502 | ||||||
| 526,218 | 851,502 | |||||||
A provision for restoration is recognised in relation to the oil and gas activities for costs such as reclamation, plugging wells and other costs associated with the restoration of oil and gas properties. Estimates of the restoration obligations are based on anticipated technology and legal requirements and future costs, which have been discounted to their present value. In determining the restoration provision, the entity has assumed no significant changes will occur in the relevant government legislation in relation to the restoration of such oil and gas properties in the future.
|
Samson Oil & Gas Limited
|
Financial Statements – 30 June 2011
|
Page 53 of 78
|
NOTES TO THE CONSOLIDATED FINANCIAL STATEMENTS
|
|
for 30 June 2011
|
|
Consolidated Entity
|
||||||||
|
2011
|
2010
|
|||||||
|
$
|
$
|
|||||||
|
Provision for Restoration
|
||||||||
|
Balance at beginning of year
|
851,502 | 827,577 | ||||||
|
Recognised upon acquisition of new assets
|
29,510 | 17,453 | ||||||
|
Decrease in liability due to change in liability date
|
(207,058 | ) | - | |||||
|
Released from provision upon sale of assets
|
(194,938 | ) | - | |||||
|
Reduction in provision relating to wells plugged and abandoned during the year
|
(8,286 | ) | - | |||||
|
Unwinding of discount
|
55,488 | 6,472 | ||||||
|
Balance at end of the year
|
526,218 | 851,502 | ||||||
|
NOTE 16.
|
BORROWINGS
|
|
Consolidated Entity
|
||||||||
|
Current
|
2011
|
2010
|
||||||
|
$
|
$
|
|||||||
|
Secured
|
||||||||
|
Debt facility with Macquarie Bank Limited
|
- | 11,283,999 | ||||||
| - | 11,283,999 | |||||||
Consolidated Entity
On 26 May 2006, the Consolidated Entity drew down on a funding facility provided by Macquarie Bank Limited. The loan was denominated in US$. This loan was repaid in full, at its maturity on 31 May 2011.
This loan comprised two tranches:
Tranche A
Face Value: $nil
Coupon rate: 9.25%
Maturity date: 31 May 2011
This tranche had a face value of $11,000,000. In addition, 11,000,000 options were granted to Macquarie Bank Limited by the parent entity as part of the loan agreement. These options were convertible at Macquarie Bank Limited’s discretion anytime until the maturity date of the loan. The conversion price of the options was 40.81 cents per share, being the volume weighted average share price of the Company for the 90 trading days prior to 30 May 2006. These options were cancelled on 13 March 2009 pursuant to an agreement with Macquarie Bank Limited. See below for further details.
Tranche B
Face Value: $nil
Coupon rate: 9.7%
Maturity date: 31 May 2011
|
Samson Oil & Gas Limited
|
Financial Statements – 30 June 2011
|
Page 54 of 78
|
NOTES TO THE CONSOLIDATED FINANCIAL STATEMENTS
|
|
for 30 June 2011
|
This tranche of the loan was originally drawn down for $10,000,000. On 30 June 2006, the Company repaid $1,000,000. In June 2008, the Company repaid an additional $2,940,000. During the year, the Company repaid $5,673,752 of this debt facility. 10,000,000 options were also granted to Macquarie Bank Limited by the parent entity as part of the loan agreement. These options were exercisable at Macquarie Bank Limited’s discretion between 31 May 2009 and 31 May 2011. The conversion price of these options was 120% of the volume weighted average trading price of Samson’s share price for the 90 trading days prior to 31 May 2009, and were subject to adjustment in accordance with customary market practice. The conversion options were embedded in the convertible loan. These options were also cancelled pursuant to the agreement signed with Macquarie Bank Limited on 13 March 2009.
Both tranches of this loan were secured against all assets of the Consolidated Entity.
This loan was repaid in full at maturity on 30 May 2011.
|
NOTE 17.
|
CONTRIBUTED EQUITY AND RESERVES
|
(a) Issued and paid up capital
|
Contributed Equity
|
Consolidated Entity
|
|||||||
|
2011
|
2010
|
|||||||
|
$
|
$
|
|||||||
|
1,732,043,789 ordinary fully paid shares including shares to be issued
|
76,925,795 | 75,714,264 | ||||||
|
(2010 – 1,654,959,087 ordinary fully paid shares including shares to be issued)
|
||||||||
|
Movements in contributed
equity for the year
|
2011
|
2010
|
||||||||||||||
|
No. of shares
|
$
|
No. of shares
|
$
|
|||||||||||||
|
Opening balance
|
1,440,429,587 | 75,714,264 | 238,394,216 | 55,985,941 | ||||||||||||
|
Capital Raising (i)
|
214,414,880 | - | 1,168,700,926 | 20,922,451 | ||||||||||||
|
Shares issued upon exercise of options (ii)
|
70,554,301 | 1,098,028 | 22,344,842 | 304,921 | ||||||||||||
|
Share based payment (iii)
|
6,580,021 | 150,617 | 3,489,603 | 100,817 | ||||||||||||
|
Shares issued to Macquarie Bank Limited (v)
|
- | - | 7,500,000 | - | ||||||||||||
|
Transaction costs incurred
|
(37,114 | ) | - | (1,599,866 | ) | |||||||||||
|
Shares on issue at balance date
|
1,731,978,789 | 76,925,795 | 1,440,429,587 | 75,714,264 | ||||||||||||
|
Shares to be issued as part of capital raising (i)
|
- | - | 214,414,880 | - | ||||||||||||
|
Shares to be issued upon exercise of options (ii)
|
49,620 | - | ||||||||||||||
|
Shares to be issued as part of Kestrel acquisition (iv)
|
65,000 | - | 65,000 | - | ||||||||||||
|
Closing Balance
|
1,732,043,789 | 76,925,795 | 1,654,959,087 | 75,714,264 | ||||||||||||
|
(i)
|
In October 2009, the Company issued 920,171,519 ordinary shares at A$ 1.2 cents per share/US$ 1.08 cents per share to raise US$9,974,639
|
In January 2010 the Company issued 124,999,995 ordinary shares at A$ 1.2 cents per share/US$ 1.09 cents per share to raise US$1,367,099
In May 2010 the Company issued 123,529,412 ordinary shares at A$ 3.4 cents per share/US$ 2.8 cents per share to raise US$3,502,508.
In June 2010 the Company completed a share purchase plan. All share applications were received prior to 30 June 2010 though some funds were not received into the Consolidated Entity’s bank account until post 30 June 2010. The shares were issued on 9 July 2010. The Company issued 205,189,880 ordinary shares at A$ 3.4 cents per share/US$ 0.027 cents per share to raise US$5,817,133.
|
Samson Oil & Gas Limited
|
Financial Statements – 30 June 2011
|
Page 55 of 78
|
NOTES TO THE CONSOLIDATED FINANCIAL STATEMENTS
|
|
for 30 June 2011
|
In June 2010 the Company placed 9,225,000 ordinary shares at $ 3.4 cents per share/US $ 2.8 cents per share to raise US$261,528. The funds were received prior to year end however the shares were not issued until 9 July 2010.
|
(ii)
|
During the course of the year the Company issued 70,554,301 (2010: 22,394,462) ordinary shares upon the exercise of 70,554,301 (2010: 22,394,462) options.
|
The exercise price of 500,000 of these options was A$0.08 per share/US$0.084 per share (average price based on the exchange rate on the date of exercise) to raise US$42,216 (2010:nil).
The exercise price of 70,054,301 of the options exercised was A$0.015 cents per share/US$0.015 cents per shares (average price based on the exchange rate on the date of exercise) (2010:A$0.015/US$0.0104 cents per share) to raise US$1,055,812 (2010: US$304,921).
In the prior year cash was received in relation to the exercise of 49,620 options prior to year end however these shares were not issued until 2 July 2010.
|
(iii)
|
During the year ended 30 June 2011, in conjunction with the reduction in salaries accepted by all employees and Directors of the Company, the Company issued 6,580,021 shares to employees and Directors. These shares were valued at the volume weighted average share price across the ASX and NYSE Amex for the period being compensated for being 1 October 2009 to 30 April 2010, being US$ 2.3 cents per share.
|
During the year ended 30 June 2010, in conjunction with the reduction in salaries accepted by all employees and Directors of the Company, the Company issued 3,489,603 shares to employees and Directors. These shares were valued at the volume weighted average share price across the ASX and NYSE Amex for the period being compensated for being 1 May 2009 to 30 September 2009, being US$ 2.8 cents per share.
|
(iv)
|
These shares were issued to Kestrel shareholders throughout the year as part of the offer to non-US resident shareholders whereby they received five Samson shares for every one Kestrel share held. The Samson share price on the date the acceptance of the offer was received was deemed to be the fair value of the share. As at balance date acceptances had been received for 65,000 (2010:65,000) shares which have not yet been issued. These shares will be issued upon the presentation of Kestrel Share Certificates by the owner of the shares.
|
|
(v)
|
On 13 March 2009, the Company entered into an agreement with Macquarie Bank Limited to cancel the options outstanding in relation to the Company’s facility agreement. See note 16 for further details in relation to the facility and the cancellation of the options. Macquarie were granted 36,800,000 shares at no cost to them. The grant date of these shares was 13 March 2009, being the date the agreement was signed. 29,300,000 shares were issued on 16 March 2009. An additional 2,000,000 were issued on 1 July 2009. The remaining 5,500,000 were issued on 6 November 2009.
|
|
(b)
|
Share Options
|
All references to exercise price and deemed value of options are in Australian Dollars.
|
|
On 14 June 2006, 8,500,000 options were issued to employees, Directors and other parties not related to the Company. These options vested immediately, had an exercise price of 45 cents and expired, unexercised on 31 May 2011. During the prior year, 2,000,000 of these options expired following the resignation of the employee to which they were granted.
|
|
|
On 11 October 2007, 3,379,077 options were issued to the participants of the share issue completed in the current year with an exercise price of 30 cents per share and an expiry date of 10 October 2012. These options vested immediately.
|
|
|
On 11 October 2007, 4,000,000 options were issued to key management personnel. These options have an exercise price of 30 cents per share and an expiry date of 10 October 2012. These options vested immediately.
|
On 12 May 2008, 2,000,000 options were granted to key management personnel. These options have an exercise price of 25 cents per share and an expiry date of 11 May 2013. 600,000 options vested immediately, 600,000 vest following twelve months of service by the employee, with the remaining 800,000 vested on 1 April 2010, following twenty four months of service.
|
Samson Oil & Gas Limited
|
Financial Statements – 30 June 2011
|
Page 56 of 78
|
NOTES TO THE CONSOLIDATED FINANCIAL STATEMENTS
|
|
for 30 June 2011
|
In October and November 2009, 344,431,141 options were issued in conjunction with a rights offering completed by the Company at the same time. These options have an exercise price of 1.5 cents and expire on 31 December 2012. During the year ended 30 June 2011, 70,004,681 (2010: 22,394,462) of these options were exercised.
In November 2009, 1,000,000 options were issued to certain Directors. These options have an exercise price of 20 cents and an expiry of 30 December 2013. These options vested immediately.
In November 2010, 29,000,000 options were issued to the Directors. These options have an exercise price of 8 cents per share and an expiry date of 31 October 2014. These options vested immediately.
In December 2010, 32,000,000 options were issued to employees of the Company. These options have an exercise price of 8 cents and an expiry date of 31 December 2014. One third of the options vested on 31 January 2011, one third will vest on 31 January 2012 with the remaining third vesting on 31 January 2013. 500,000 of these options were exercised during the year.
At the end of the year there were 322,911,075 (2010: 337,435,756) unissued ordinary shares in respect of which options were outstanding. Option holders do not have any right by virtue of the option to participate in any share issue of the Company.
|
(c)
|
Terms and Conditions of Contributed Equity
|
|
|
Ordinary shares have the right to receive dividends as declared and, in the event of winding up the Company, to participate in the proceeds from the sale of all surplus assets in proportion to the number of and amounts paid up on shares held.
|
Ordinary shares entitle their holder to one vote, either in person or by proxy, at a meeting of the Company.
|
(d)
|
Reserves
|
|
Consolidated Entity
|
||||||||
|
Reserves
|
2011
|
2010
|
||||||
|
$
|
$
|
|||||||
|
Foreign currency translation reserve
|
4,187,574 | 2,924,429 | ||||||
|
Equity reserve
|
(1,097,780 | ) | (1,097,780 | ) | ||||
|
Share based payments reserve
|
4,036,193 | 2,419,430 | ||||||
| 7,125,987 | 4,246,079 | |||||||
Nature and purpose of reserves
Foreign currency translation reserve
The foreign currency translation reserve is used to record exchange rate differences arising from the translation of financial statements of the parent entity with a functional currency that differs to the presentation currency of the Consolidated Entity.
Share Based Payments Reserve
This reserve is used to record the value of share based payments granted.
Equity Reserve
This reserve is used to recognise the difference between the consideration paid and book value of minority interests’ acquired.
|
Samson Oil & Gas Limited
|
Financial Statements – 30 June 2011
|
Page 57 of 78
|
NOTES TO THE CONSOLIDATED FINANCIAL STATEMENTS
|
|
for 30 June 2011
|
|
NOTE 18.
|
ACCUMULATED LOSSES
|
|
Consolidated Entity
|
||||||||
|
2011
|
2010
|
|||||||
|
$
|
$
|
|||||||
|
Balance previously reported at the beginning of the year
|
(54,844,675 | ) | (55,661,908 | ) | ||||
|
Net profit attributable to members of Samson Oil & Gas Limited, after income tax
|
47,325,185 | 817,233 | ||||||
|
Balance at the end of the year
|
(7,519,490 | ) | (54,844,675 | ) | ||||
|
NOTE 19.
|
DERIVATIVE FINANCIAL INSTRUMENTS
|
|
Consolidated Entity
|
||||||||
|
a) Asset
|
2011
|
2010
|
||||||
|
$
|
$
|
|||||||
|
Current Asset
|
||||||||
|
Fixed forward swaps/collars – at fair value
|
22,268 | 46,824 | ||||||
| 22,268 | 46,824 | |||||||
Refer to Note 27 for further details in relation to the terms, conditions and valuation of the fixed forward swap and derivative collars.
|
NOTE 20.
|
COMMITMENTS
|
|
(a)
|
Exploration Commitments
|
Due to the nature of the Consolidated Entity’s operations in exploring and evaluating areas of interest, it is very difficult to accurately forecast the nature or amount of future expenditure, although it will be necessary to incur expenditure in order to retain present interests. Expenditure commitments on mineral tenure for the Consolidated Entity can be reduced by selective relinquishment of exploration tenure or by the renegotiation of expenditure commitments.
The minimum level of exploration commitments expected as at year ending 30 June 2011 is $45,000 (2010: $100,000), which includes the minimum amounts required to retain tenure. It is anticipated that the exploration expenditure commitments in the ensuing periods will be at a similar level.
|
(b)
|
Development Expenditure
|
At year end, the Company had committed to capital development expenditure of $1,943,133 (2010:$2,297,649). $1,024,360 of these funds was paid prior to the end of the period and has been recorded as a prepayment. As at the end of the period $305,379 (2010:$1,378,978) was remaining to be spent.
|
(c)
|
Operating Lease Commitments – Consolidated Entity as lessee
|
The Parent and its subsidiaries have entered into operating leases for the lease of its office space in Perth, Western Australia and Denver, Colorado.
|
Samson Oil & Gas Limited
|
Financial Statements – 30 June 2011
|
Page 58 of 78
|
NOTES TO THE CONSOLIDATED FINANCIAL STATEMENTS
|
|
for 30 June 2011
|
Future minimum rentals payable under non-cancellable operating leases as at 30 June are as follows:
|
Consolidated Entity
|
||||||||
|
2011
$
|
2010
$
|
|||||||
|
Minimum lease payments
|
||||||||
|
- not later than one year
|
159,091 | 117,587 | ||||||
|
- later than one year and not later than five years
|
516,956 | 64,667 | ||||||
|
Aggregate lease expenditure contracted for at balance date
|
676,047 | 182,254 | ||||||
|
(d)
|
Remuneration commitments
|
Commitments for the payment of salaries and other remuneration under long-term employment contracts in existence at the reporting date but not recognised as payables:
|
Consolidated Entity
|
||||||||
|
2011
$
|
2010
$
|
|||||||
|
Within one year:
|
1,255,009 | 223,735 | ||||||
|
Within two to five years:
|
1,882,514 | - | ||||||
| 3,137,523 | 223,735 | |||||||
Amounts disclosed as remuneration commitments include commitments arising from service contracts of Directors and executives referred to in Note 21 that are not recognised as liabilities and are not included in the Directors’ or executives’ remuneration.
A bonus structure is in place for the calendar year 2011 for all employees. The bonus is payable dependent on the movement in the volume weighted average share price (from trades on the Australian Securities Exchange and NYSE Amex, adjusted for the impact of foreign exchange) from December 2010 compared to December 2011. No bonus is payable if the share price decreases from December 2010 or does not increase above 25%. The maximum bonus is payable if the share price increases by 100% from December 2010 to December 2011. A total bonus of $1,353,170 may be paid if the combined volume weighted average share price during December 2011, as calculated on individual trades across both exchanges is greater than 100% of 6.3 cents (AUD). This was the volume weighted average price calculated in December 2010 based on individual trades on the ASX and NYSE Amex. The value of trades on the NYSE Amex were translated to AUD based on the exchange rate on each trading day in December from the Reserve Bank of Australia website. $390,000 has been recognized in relation to this bonus, based on a Monte Carlo simulation.
NOTE 21. DIRECTOR AND EXECUTIVE DISCLOSURES
|
a)
|
Compensation by category: key management personnel
|
|
Consolidated Entity
|
||||||||
|
2011
$
|
2010
$
|
|||||||
|
Short Term
|
1,977,642 | 731,761 | ||||||
|
Post Employment
|
90,004 | 43,299 | ||||||
|
Share-based Payments
|
1,671,898 | 116,508 | ||||||
| 3,739,544 | 891,568 | |||||||
Detailed remuneration disclosures are provided in the remuneration report on pages 8 to 14.
|
Samson Oil & Gas Limited
|
Financial Statements – 30 June 2011
|
Page 59 of 78
|
NOTES TO THE CONSOLIDATED FINANCIAL STATEMENTS
|
|
for 30 June 2011
|
|
b)
|
Option holdings of key management personnel
|
|
30 June 2011
|
Balance at
beginning
of period
1 July 2010
|
Exercised
during the
year
|
Expired
during the
year
|
Granted as
compensation
|
Net change
other
|
Balance at
end of period
30 June 2011
|
Options
vested at
30 June
2011*
|
|||||||||||||||||||||
|
Directors
|
||||||||||||||||||||||||||||
|
N. MacLachlan
|
1,500,000 | - | (500,000 | ) | 7,000,000 | - | 8,000,000 | 8,000,000 | ||||||||||||||||||||
|
T. Barr
|
4,512,960 | - | (4,000,000 | ) | 10,000,000 | - | 10,512,960 | 10,512,960 | ||||||||||||||||||||
|
V. Rudenno
|
800,000 | - | - | 6,000,000 | - | 6,800,000 | 6,800,000 | |||||||||||||||||||||
|
K. Skipper
|
500,000 | - | - | 6,000,000 | - | 6,500,000 | 6,500,000 | |||||||||||||||||||||
|
Executives
|
||||||||||||||||||||||||||||
|
D. Rakich
|
- | - | - | 5,000,000 | - | 5,000,000 | 1,666,666 | |||||||||||||||||||||
|
R. Lamont
|
2,030,000 | - | - | 7,000,000 | 9,030,000 | 4,363,333 | ||||||||||||||||||||||
|
D. Ninke
|
2,000,000 | - | - | 7,000,000 | - | 9,000,000 | 4,333,333 | |||||||||||||||||||||
|
D. Gralla
|
- | (500,000 | ) | - | 7,000,000 | - | 6,500,000 | 1,833,333 | ||||||||||||||||||||
|
Total
|
11,342,960 | (500,000 | ) | (4,500,000 | ) | 55,000,000 | 61,342,960 | 44,009,625 | ||||||||||||||||||||
|
30 June 2010
|
Balance at
beginning
of period
1 July 2009
|
Exercised
during the
year
|
Expired
during the
year
|
Granted as
compensation
|
Net change
other
|
Balance at
end of period
30 June 2010
|
Options
vested at
30 June
2010*
|
|||||||||||||||||||||
|
Directors
|
||||||||||||||||||||||||||||
|
N. MacLachlan
|
1,000,000 | - | (500,000 | ) | - | 1,000,000 | 1,500,000 | 1,500,000 | ||||||||||||||||||||
|
T. Barr
|
8,000,000 | - | (4,000,000 | ) | - | 512,960 | 4,512,960 | 4,512,960 | ||||||||||||||||||||
|
V. Rudenno
|
- | - | - | 500,000 | 300,000 | 800,000 | 800,000 | |||||||||||||||||||||
|
K. Skipper
|
- | - | - | 500,000 | - | 500,000 | 500,000 | |||||||||||||||||||||
|
Executives
|
||||||||||||||||||||||||||||
|
D. Rakich
|
1,000,000 | - | (1,000,000 | ) | - | - | - | - | ||||||||||||||||||||
|
R. Lamont
|
2,100,000 | - | (100,000 | ) | 30,000 | 2,030,000 | 2,030,000 | |||||||||||||||||||||
|
D. Ninke
|
2,000,000 | - | - | - | - | 2,000,000 | 2,000,000 | |||||||||||||||||||||
|
Total
|
14,100,000 | - | (5,600,000 | ) | 1,000,000 | 1,842,960 | 11,342,960 | 11,342,960 | ||||||||||||||||||||
|
c)
|
Shares issued on exercise of options
|
500,000 options were exercised during the year ended 30 June 2011 (2010: nil)
|
Samson Oil & Gas Limited
|
Financial Statements – 30 June 2011
|
Page 60 of 78
|
NOTES TO THE CONSOLIDATED FINANCIAL STATEMENTS
|
|
for 30 June 2011
|
|
d)
|
Shareholdings of key management personnel
|
Ordinary Shares held in Samson Oil & Gas Limited (number)
|
30 June 2011
|
Balance at
beginning of
period
1 July 2010
|
Granted as
compensation
|
On exercise of
options
|
Net change
other
|
Balance at
end of
period
30 June 2011
|
|||||||||||||||
|
Directors
|
||||||||||||||||||||
|
N. MacLachlan
|
12,020,719 | 810,397 | - | 330,882 | 13,161,998 | |||||||||||||||
|
T. Barr
|
7,372,482 | 2,300,580 | - | 353,080 | 10,026,142 | |||||||||||||||
|
V. Rudenno
|
3,638,813 | 266,807 | - | 330,882 | 4,236,502 | |||||||||||||||
|
K. Skipper
|
138,813 | 266,807 | - | 330,882 | 736,502 | |||||||||||||||
|
Executives
|
||||||||||||||||||||
|
D. Rakich
|
- | 667,018 | - | (667,018 | ) | - | ||||||||||||||
|
R. Lamont
|
1,000,617 | 1,030,561 | - | 330,882 | 2,362,060 | |||||||||||||||
|
D. Ninke
|
765,786 | 987,956 | - | 330,882 | 2,084,624 | |||||||||||||||
|
D. Gralla
|
- | - | 500,000 | - | 500,000 | |||||||||||||||
|
Total
|
24,937,230 | 6,330,126 | 500,000 | 1,340,472 | 33,107,828 | |||||||||||||||
|
30 June 2010
|
Balance at
beginning of
period
1 July 2009
|
Granted as
compensation
|
On exercise of
options
|
Net change
other
|
Balance at
end of
period
30 June 2010
|
|||||||||||||||
|
Directors
|
||||||||||||||||||||
|
N. MacLachlan
|
1,812,500 | 208,219 | - | 10,000,000 | 12,020,719 | |||||||||||||||
|
T. Barr
|
902,090 | 1,340,792 | - | 5,129,600 | 7,372,482 | |||||||||||||||
|
V. Rudenno
|
500,000 | 138,813 | - | 3,000,000 | 3,638,813 | |||||||||||||||
|
K. Skipper
|
- | 138,813 | - | - | 138,813 | |||||||||||||||
|
Executives
|
||||||||||||||||||||
|
D. Rakich
|
- | 347,032 | - | (347,032 | ) | - | ||||||||||||||
|
R. Lamont
|
100,000 | 600,617 | - | 300,000 | 1,000,617 | |||||||||||||||
|
D. Ninke
|
- | 575,786 | - | 190,000 | 765,786 | |||||||||||||||
|
Total
|
3,314,590 | 3,350,072 | - | 18,272,568 | 24,937,230 | |||||||||||||||
All equity transactions with key management personnel other than those arising from the exercise of compensation options have been entered into under terms and conditions no more favourable than those the Consolidated Entity would have adopted if dealing at arms length.
g) Loans to key management personnel (Consolidated)
No loans have been granted to key management personnel during the current or prior year.
h) Other transactions and balances with key management personnel
There were no transactions with key management personnel or their related parties during the current or prior year other than those mentioned above.
|
Samson Oil & Gas Limited
|
Financial Statements – 30 June 2011
|
Page 61 of 78
|
NOTES TO THE CONSOLIDATED FINANCIAL STATEMENTS
|
|
for 30 June 2011
|
NOTE 22. SEGMENT REPORTING
The Consolidated Entity has applied AASB 8 Operating Segments from 1 July 2009. AASB 8 requires a “management approach” under which segment information is presented on the same basis as that used for internal reporting purposes. This has not changed the number of reportable segments as presented in previous years.
Operating segments are now reported in a manner that is consistent with the internal reporting provided to the chief operating decision maker. The chief operating decision maker has been identified as the Board of Directors.
The group operates in one business segment being oil and gas exploration, development and production in the United States of America.
The following table presents revenue and loss information regarding geographic segments for the year ended 30 June 2010 and 30 June 2009 as presented to the Board of Directors.
|
United States of America –
continuing operations
|
United States of America
– discontinued
operations
|
Unallocated
|
Consolidated
|
|||||||||||||||||||||||||||||
|
2011
|
2010
|
2011
|
2010
|
2011
|
2010
|
2011
|
2010
|
|||||||||||||||||||||||||
|
Segment revenue from external customers
|
6,095,169 | 5,101,537 | 751,565 | 2,196,140 | 241,858 | 10,858 | 7,088,592 | 5,112,395 | ||||||||||||||||||||||||
|
Segment result before amortisation and impairment
|
71,421,107 | (2,986,677 | ) | 573,796 | 1,436,818 | (2,529,224 | ) | (989,421 | ) | 69,465,679 | (2,539,280 | ) | ||||||||||||||||||||
|
(Impairment)/Reversal of impairment
|
(25,643 | ) | 82,901 | (6,678,940 | ) | (1,226,664 | ) | - | - | (6,704,583 | ) | (1,143,863 | ) | |||||||||||||||||||
|
Depreciation and amortisation
|
(2,081,755 | ) | (1,225,974 | ) | (250,964 | ) | (590,161 | ) | (2,615 | ) | (489 | ) | (2,335,334 | ) | (1,816,624 | ) | ||||||||||||||||
|
Total Segment result
|
69,313,709 | (4,129,850 | ) | (6,356,108 | ) | (380,007 | ) | (2,531,839 | ) | (989,910 | ) | 60,425,762 | (5,499,767 | ) | ||||||||||||||||||
|
Total Segment Assets
|
74,002,746 | 18,900,885 | - | 13,230,100 | 6,491,911 | 7,438,962 | 80,494,657 | 39,569,947 | ||||||||||||||||||||||||
|
Additions to non current assets
|
11,185,984 | 2,850,950 | - | 92,132 | - | 2,034 | 11,185,984 | 2,945,116 | ||||||||||||||||||||||||
|
Total Segment Liabilities
|
(3,697,674 | ) | (12,882,173 | ) | - | (211,400 | ) | (264,691 | ) | (1,360,706 | ) | (3,962,365 | ) | (14,454,279 | ) | |||||||||||||||||
|
Samson Oil & Gas Limited
|
Financial Statements – 30 June 2011
|
Page 62 of 78
|
NOTES TO THE CONSOLIDATED FINANCIAL STATEMENTS
|
|
for 30 June 2011
|
NOTE 22. SEGMENT REPORTING (CONT)
Segment revenue reconciles to total revenue from continuing operations as follows:
|
Consolidated Entity
|
||||||||
|
2011
$
|
2010
$
|
|||||||
|
Total segment revenue
|
7,088,592 | 5,112,395 | ||||||
|
Revenue attributed to discontinued operations
|
(751,565 | ) | (2,196,140 | ) | ||||
|
Total revenue from continuing operations (note 3a)
|
6,337,027 | 2,916,255 | ||||||
NOTE 23. CASH FLOW STATEMENT
|
Consolidated Entity
|
||||||||
|
2011
$
|
2010
$
|
|||||||
|
(a) Reconciliation of cash
|
||||||||
|
Cash balance comprises:
- cash at bank and on hand
|
58,448,477 | 5,885,735 | ||||||
|
(b) Reconciliation of the net profit/(loss) after tax to the net cash flows from operations
|
||||||||
|
Net profit/(loss) after tax
|
47,325,185 | 817,233 | ||||||
|
Net (gain)/loss recognised on re-measurement to fair-value of investments held for trading
|
(5,494 | ) | (46,681 | ) | ||||
|
Depreciation of non-current assets
|
2,335,330 | 1,816,623 | ||||||
|
Share based payments
|
1,767,380 | 119,890 | ||||||
|
Movement in asset retirement obligation provision due to change in unwind rate
|
(150,505 | ) | - | |||||
|
Exploration expenditure
|
403,826 | 1,569,456 | ||||||
|
Net (gain)/loss on fair value movement of fixed forward swaps
|
24,557 | (147,279 | ) | |||||
|
Impairment losses/(reversals) of oil and gas properties
|
6,704,583 | 1,143,863 | ||||||
|
Net gain on sale of assets
|
(73,358,883 | ) | - | |||||
|
Changes in assets and liabilities:
|
||||||||
|
(Increase)/decrease in receivables
|
(3,102,602 | ) | (423,614 | ) | ||||
|
(Increase) in deferred tax asset
|
6,317,000 | (6,317,000 | ) | |||||
|
Increase/(decrease) in employee benefits
|
53,386 | 25,728 | ||||||
|
Increase/(Decrease) in payables
|
1,176,847 | 231,701 | ||||||
|
NET CASH FLOWS USED IN OPERATING ACTIVITIES
|
(10,509,390 | ) | (1,210,080 | ) | ||||
| - | ||||||||
|
c) Non-Cash Financing and Investing Activities
|
- | - | ||||||
|
Samson Oil & Gas Limited
|
Financial Statements – 30 June 2011
|
Page 63 of 78
|
NOTES TO THE CONSOLIDATED FINANCIAL STATEMENTS
|
|
for 30 June 2011
|
NOTE 24. RELATED PARTY DISCLOSURES
The consolidated financial statements include the financial statements of Samson Oil & Gas Limited and the following subsidiaries:
|
|
% Equity Interest
|
Investment
|
||||||||||||||||
|
Name
|
Country of
Incorporation
|
2011
|
2010
|
2011
$
|
2010
$
|
|||||||||||||
|
Samson Oil & Gas USA Inc
|
United States
|
100.0 | 100.0 | 6,067,403 | 4,815,390 | |||||||||||||
|
Samson Oil and Gas Montana USA, Inc (100% owned subsidiary of Samson Oil & Gas USA Inc)
|
United States
|
100.0 | - | 52,058 | - | |||||||||||||
| 6,119,461 | 4,815,390 | |||||||||||||||||
Ultimate parent
Samson Oil & Gas Limited is the ultimate parent Company.
Other related party transactions
During the year Mr Fearis was an alternate Director for Mr Neil MacLachlan, though was not required to act in this capacity. Minter Ellison, the law firm at which Mr Fearis is Special Counsel was paid $18,853 (2010:$98,016) for the provision of services provided by Mr Fearis. These services were charged on normal commercial terms.
During the year the Consolidated Entity paid $158,952 (including a bonus of $42,500) (2010:$nil) to Whitehall Engineering, an entity controlled by Mr Dan Gralla for the provision of this services. Mr Gralla became an employee of the Consolidated Entity, effective 1 January 2011.
There were no other related party transactions during 2011 and 2010.
|
NOTE 25.
|
AUDITORS’ REMUNERATION
|
|
Consolidated Entity
|
||||||||
|
2011
$
|
2010
$
|
|||||||
|
Amounts received or due and receivable by PricewaterhouseCoopers (Australia) for:
|
||||||||
|
· an audit or review of the financial report of the entity and any other entity in the Consolidated Entity
|
118,369 | 233,057 | ||||||
|
· other services in relation to the entity and any other entity in the Consolidated Entity
|
- | 33,930 | ||||||
| 118,369 | 266,987 | |||||||
|
Amounts received or due and receivable by other member firms of PricewaterhouseCoopers International for:
|
||||||||
|
· an audit or review of the financial report of subsidiaries
|
510,115 | 165,120 | ||||||
| 628,484 | 432,107 | |||||||
|
Samson Oil & Gas Limited
|
Financial Statements – 30 June 2011
|
Page 64 of 78
|
NOTES TO THE CONSOLIDATED FINANCIAL STATEMENTS
|
|
for 30 June 2011
|
|
NOTE 26.
|
EARNINGS/(LOSS) PER SHARE
|
Basic earnings/(loss) per share amounts are calculated by dividing net result for the year attributable to ordinary equity holders of the parent by the weighted average number of ordinary shares outstanding during the year.
Diluted earnings/(loss) per share amounts are calculated by dividing the net result attributable to ordinary equity holders of the parent by the weighted average number of ordinary shares outstanding during the year plus the weighted average number of ordinary shares that would be issued on the conversion of all dilutive potential ordinary shares into ordinary shares.
The following reflects the income and share data used in the basic and diluted earnings/(loss) per share computations:
|
Consolidated Entity
|
||||||||
|
Basic
|
||||||||
|
2011
$
|
2010
$
|
|||||||
|
Net profit/(loss) from continuing operations attributable to ordinary equity holders of the parent Company (used in calculating basic and diluted earnings per share)
|
47,325,185 | 1,197,240 | ||||||
|
Number of Shares
|
||||||||
|
Weighted average number of ordinary shares used as the denominator in calculating basic earnings per share
|
1,680,247,878 | 978,983,187 | ||||||
|
Adjustments for calculation of diluted earnings per share:
|
||||||||
|
Options
|
261,317,567 | 87,719,020 | ||||||
|
Bonus element for rights issue
|
26,488,246 | 26,488,246 | ||||||
|
Weighted average number of ordinary shares and potential ordinary shares used as the denominator in calculating diluted earnings per share
|
1,968,053,691 | 1,093,190,453 | ||||||
At the end of year there are 312,482,381 (2010:337,435,756) potential ordinary shares on issue. These potential ordinary shares are dilutive for 30 June 2011.
There have been no transactions involving ordinary shares that would significantly change the number of ordinary shares or potential ordinary shares outstanding between the reporting date and the date of completion of these financial statements.
|
NOTE 27.
|
FINANCIAL INSTRUMENTS
|
a) Guarantees
There are no guarantees in place (2010 $nil).
b) Derivatives
On 13 November 2009, the Company entered into the following new hedges:
Oil – Ratio Collar priced at West Texas Intermediate
|
Date
|
Call/Put
|
Volume – barrels
|
Price – $ per Barrel
|
|||||||
|
Dec 2009 – Dec 2011
|
Put
|
21,431 | 60.00 | |||||||
|
Dec 2009 – Dec 2011
|
Call
|
21,431 | 102.90 | |||||||
Natural Gas – Ratio Collar priced at Henry Hub
|
Date
|
Call/Put
|
Volume – mmbtu
|
Price – $ per MCF
|
|||||||
|
Dec 2009 – Dec 2011
|
Put
|
125,149 | 4.75 | |||||||
|
Dec 2009 – Dec 2011
|
Call
|
125,149 | 6.15 | |||||||
|
Samson Oil & Gas Limited
|
Financial Statements – 30 June 2011
|
Page 65 of 78
|
NOTES TO THE CONSOLIDATED FINANCIAL STATEMENTS
|
|
for 30 June 2011
|
Natural Gas – Ratio Collar priced at Colorado Interstate Gas
|
Date
|
Call/Put
|
Volume – mmbtu
|
Price – $ per MCF
|
|||||||
|
Dec 2009 – Dec 2011
|
Put
|
440,884 | 4.25 | |||||||
|
Dec 2009 – Dec 2011
|
Call
|
440,884 | 5.80 | |||||||
These terms of these derivative arrangements are in line with Master International Swaps and Derivatives Agreement.
The fair value of these derivative instruments is recorded in the current year balance sheet as a current or non current asset depending on the maturity date of the swaps. They have been valued by the Consolidated Entity with reference to the forward curve for the Colorado Interstate Gas price, Henry Hub Gas price or West Texas Intermediate for oil, for the relevant time period. Any movement in its fair value is taken directly to the profit and loss. At balance date the instruments were a net asset valued at $22,268 (2010: $46,824) and the Consolidated Entity recorded a loss in relation to the fair value movement of these instruments of $24,557 (2010: gain $147,279).
Following the sale of the interests in the Jonah and Lookout Wash properties the Consolidated Entity’s exposure to natural gas prices decreased significantly. On 6 July 2011, the Consolidated Entity closed out the remaining gas derivative positions. The termination of these positions resulted in Macquarie Bank Limited (the counter party to the hedges) paying Samson $36,500 in July.
|
NOTE 28.
|
CONTINGENCIES
|
A bonus structure is in place for the calendar year 2011 for all employees. The bonus is payable dependent on the movement in the volume weighted average share price (from trades on the Australian Securities Exchange and NYSE Amex, adjusted for the impact of foreign exchange) from December 2010 compared to December 2011. No bonus is payable if the share price decreases from December 2010 or does not increase above 25%. The maximum bonus is payable if the share price increases by 100% from December 2010 to December 2011. A total bonus of $1,353,170 may be paid if the combined volume weighted average share price during December 2011, as calculated on individual trades across both exchanges is greater than 100% of 6.3 cents (AUD). This was the volume weighted average price calculated in December 2010 based on individual trades on the ASX and NYSE Amex. The value of trades on the NYSE Amex were translated to AUD based on the exchange rate on each trading day in December from the Reserve Bank of Australia website.
Other than the bonus plan mentioned above, there are no other unrecorded contingent assets or liabilities in place for the Consolidated Entity at balance date (2010: $Nil).
|
NOTE 29.
|
INTEREST IN JOINTLY CONTROLLED ASSETS
|
The Consolidated Entity has an interest in the following joint venture operations whose principal activities are oil and gas exploration and production.
|
Name
|
Percentage of
Interest Held
|
Percentage of
Interest Held
|
|||||||
|
%
2011
|
%
2010
|
||||||||
|
Exploration
|
|||||||||
|
Baxter Shale
|
United States of America
|
10.0 | 10.0 | ||||||
|
Hawk Springs
|
United States of America
|
25-100 | 50.0 | ||||||
|
Gold Coast Unit CBM
|
United States of America
|
50.0 | 50.0 | ||||||
|
South Goose Lake
|
United States of America
|
25.0 | 25.0 | ||||||
|
Roosevelt
|
United States of America
|
100.00 | - | ||||||
|
Production
|
|||||||||
|
Big Hand
|
United States of America
|
4.0 | 4.0 | ||||||
|
Bird Canyon
|
United States of America
|
16.0 | 16.0 | ||||||
|
Deep Draw
|
United States of America
|
5.0 | 5.0 | ||||||
|
Hilight
|
United States of America
|
9.0 | 9.0 | ||||||
|
Samson Oil & Gas Limited
|
Financial Statements – 30 June 2011
|
Page 66 of 78
|
NOTES TO THE CONSOLIDATED FINANCIAL STATEMENTS
|
|
for 30 June 2011
|
|
Name
|
Percentage of
Interest Held
|
Percentage of
Interest Held
|
|||||||
|
Jalmat
|
United States of America
|
60.0 | 60.0 | ||||||
|
Jayson Unit
|
United States of America
|
2.0 | 2.0 | ||||||
|
Jonah
|
United States of America
|
- | 21.0 | ||||||
|
Kicken Draw
|
United States of America
|
15.0 | 15.0 | ||||||
|
LA Ward
|
United States of America
|
3.0 | 3.0 | ||||||
|
Look Out Wash
|
United States of America
|
- | 17.0 | ||||||
|
Neta
|
United States of America
|
13.0 | 13.0 | ||||||
|
Pierce
|
United States of America
|
99.0 | 99.0 | ||||||
|
Powder River Basin
|
United States of America
|
18.0 | 18.0 | ||||||
|
San Simon
|
United States of America
|
27.0 | 27.0 | ||||||
|
Scribner
|
United States of America
|
28.0 | 28.0 | ||||||
|
Wagensen
|
United States of America
|
8.0 | 8.0 | ||||||
|
North Stockyard
|
United States of America
|
34.5 | 34.5 | ||||||
|
Sabretooth
|
United States of America
|
12.5 | 12.5 | ||||||
Oil and gas properties held as jointly controlled assets total $12,758,578 (2010: $20,538,230).
NOTE 30. EVENTS SUBSEQUENT TO BALANCE DATE
Acquisition of acreage in Roosevelt County, Montana
In July 2011, the Consolidated Entity closed on the purchase of 20,028 acres of oil and gas leases in the Fort Peck Indian Reservation in Roosevelt County, Montana from the Fort Peck Energy Company. This acquisition was the first tranche of a three tranche purchase of the Roosevelt Project for the Company. The first tranche includes a two well drilling commitment. Once the two wells have been drilled, Samson has the option to acquire 100% working interest in an additional 20,000 acres from Fort Peck Energy Company. Following the drilling of the two appraisal wells in Tranche 1, FPEC will have the right to back into a 33.34% position in both tranches by reimbursing Samson’s acreage and drilling costs to the extent of that equity. In such an event, Samson will have a 66.66% working interest and a 53.34% net revenue interest. Tranche 3 is a 50,000 acre area covered by an Area of Mutual Interest where Samson and FPEC have agreed to jointly acquire additional leases, with Samson holding a 66.66% working interest (53.34% net revenue interest) and FPEC a 33.34% working interest. The first of these wells will be Australia II and is expected to be drilled in October 2011.
Defender US33 #2-29
In August 2011, the Consolidated Entity commenced drilling operations on its first appraisal well in the Hawk Springs project. Samson has a 37.5% working interest in this well, though is being carried on all costs by Halliburton Energy Services.
Acquisition of additional Hawk Springs acreage, Wyoming
In August 2011, Samson was advised that has been awarded, on a conditional basis, approximately 956 net acres of leasehold offered by competitive tender from the University of Wyoming. This land is part of the University’s agricultural research facility. The Consolidated Entity has also been successful in acquiring additional acreage in the State of Wyoming’s lease sales as well as leasing acreage from fee owners. Accordingly, the Consolidated Entity has now increased its holding to 17,489 net acres in the Hawk Springs area. This holding assumes that Samson’s farminee exercises its full right to earn a 25% interest within the farmin area.
The Directors are not aware of any matters or circumstances not otherwise dealt with in this report that have significantly or may significantly affect the operations of the Consolidated Entity, the results of those operations or the state of affairs of the Consolidated Entity in the subsequent financial years.
NOTE 31. FINANCIAL RISK MANAGEMENT OBJECTIVES AND POLICIES
The Consolidated Entity’s principal financial assets and financial liabilities comprise receivables, payables, cash and derivatives.
|
Samson Oil & Gas Limited
|
Financial Statements – 30 June 2011
|
Page 67 of 78
|
NOTES TO THE CONSOLIDATED FINANCIAL STATEMENTS
|
|
for 30 June 2011
|
The Consolidated Entity manages its exposure to key financial risk in accordance with the Board’s financial risk management strategy. The objective of the strategy is to support the delivery of the Consolidated Entity’s financial targets whilst protecting future financial security.
The Consolidated Entity enters into derivative transactions, principally oil and gas price fixed forward swaps, to manage the price risk arising from the Consolidated Entity’s operations. These derivatives do not qualify for hedge accounting.
The main risks arising from the Consolidated Entity’s financial instruments are interest rate risk, foreign currency risk, credit risk, price risk and liquidity risk. The Consolidated Entity uses different methods to measure and manage the different types of risks to which it is exposed. These include monitoring levels of exposure to foreign currency and price risk and assessments of market forecasts for foreign exchange and commodity prices. Ageing analysis and monitoring of specific debtors are undertaken to manage credit risk and liquidity risk is monitored through the development of future rolling cash flow forecasts.
Primary responsibility for identification and control of financial risks rests with the executive management group, specifically the Chief Executive Officer and Chief Financial Officer, under the authority of the Board. The Board reviews and approves policies and strategies for managing each of the risks identified below.
Risk Exposures and Responses
Capital Management
When managing capital, management’s objective is to ensure the entity continues as a going concern as well as to maintain optimal returns to shareholders and benefits for other stakeholders. The Consolidated Entity funds its activities through capital raisings and debt funding, where appropriate. The Consolidated Entity is not subject to any externally imposed capital requirements.
|
Consolidated Entity
|
||||||||
|
2011
$
|
2010
$
|
|||||||
|
Debt facility
|
- | 11,283,999 | ||||||
|
Less cash and cash equivalents
|
- | (5,885,735 | ) | |||||
|
Net debt
|
- | 5,398,264 | ||||||
|
Total equity
|
- | 18,798,668 | ||||||
|
Total capital
|
- | 24,196,932 | ||||||
|
Gearing Ratio
|
- | 22.31 | % | |||||
The Consolidated Entity repaid all of its outstanding debt during the year and remains debt free at year end, therefore the Gearing Ratio is not applicable in 2011.
Interest rate risk
The Consolidated Entity continually reviews its interest rate exposure. Consideration is given to potential restructuring of its existing positions and alternative financing.
The Consolidated Entity has no interest rate risk in relation to its financial liabilities as the Consolidated Entity has no borrowings that are subject to interest.
The Consolidated Entity’s cash assets are exposed to minimal interest rate risk. The Consolidated Entity’s cash accounts are primarily held in low or no interest rate accounts. Interest revenue is not a significant income item for the Consolidated Entity and the Consolidated Entity does not rely on the cash generated from interest income.
|
Samson Oil & Gas Limited
|
Financial Statements – 30 June 2011
|
Page 68 of 78
|
NOTES TO THE CONSOLIDATED FINANCIAL STATEMENTS
|
|
for 30 June 2011
|
|
Consolidated Entity
|
||||||||
|
2011
$
|
2010
$
|
|||||||
|
Cash exposed to Australian interest rates
|
6,415,736 | 4,928,728 | ||||||
|
Cash exposed to United States of America interest rates
|
52,032,741 | 957,007 | ||||||
| 58,448,477 | 5,885,735 | |||||||
The average floating interest rate for the Consolidated Entity in the United States was 0.5% per annum (2010: 0.5%).
The average fixed interest rate for the Consolidated Entity in the United States was 0.08%. The Consolidated Entity did not have any cash exposed to fixed interest rates in the prior year.
The average floating interest rate for the Consolidated Entity in Australia was 2.4% per annum (2010: 1.0%)
The average fixed interest rate for the Consolidated Entity in Australia was 4.4% per annum. The Consolidated Entity did not have any cash exposed to fixed interest rates in the prior year.
At year end, the Consolidated Entity has $15,619,812 (2010: $nil) in short term deposits that have fixed interest rates. These term deposits have terms no longer than 120 days. $5,611,021 (2010: $nil) is held in an AUD term deposit and has an interest rate of approximately 5.33%. $10,008,791 (2010: $nil) is held in an USD term deposit and has an interest rate of approximately 0.18%.
At 30 June 2011 if interest rates had moved, as illustrated in the table below (estimated from historical movements), with all other variables held constant, the impact would be:
|
Post Tax Result
Higher/(Lower)
|
Other Equity
Higher/(Lower)
|
|||||||||||||||
|
2011
$
|
2010
$
|
2011
$
|
2010
$
|
|||||||||||||
|
Cash exposed to AUS interest rates
|
||||||||||||||||
|
+ 0.25% (25 basis points)
|
14,180 | 5,430 | - | - | ||||||||||||
|
- 0.50% (50 basis points)
|
(28,360 | ) | (10,857 | ) | - | - | ||||||||||
|
Post Tax Result
Higher/(Lower)
|
Other Equity
Higher/(Lower)
|
|||||||||||||||
|
2011
$
|
2010
$
|
2011
$
|
2010
$
|
|||||||||||||
|
Cash exposed to US interest rates
|
||||||||||||||||
|
+ 0.10% (10 basis points)
|
26,495 | 1,198 | - | - | ||||||||||||
|
- 0.25% (25 basis points)
|
(66,238 | ) | (2,996 | ) | - | - | ||||||||||
Foreign Currency Risk
As a result of significant operations in the United States, the Consolidated Entity’s financial statements can be affected significantly by movements in the US$/A$ exchange rates.
The majority of the transactions (both revenue and expenses) of the United States subsidiaries are denominated in US dollars.
The Consolidated Entity does not have any foreign currency cash flow hedges.
|
Samson Oil & Gas Limited
|
Financial Statements – 30 June 2011
|
Page 69 of 78
|
NOTES TO THE CONSOLIDATED FINANCIAL STATEMENTS
|
|
for 30 June 2011
|
At balance date, the Consolidated Entity had the following exposure to A$ foreign currency that is not designated in cash flow hedges:
|
Consolidated Entity
|
||||||||
|
2011
$
|
2010
$
|
|||||||
|
Financial Assets
|
||||||||
|
Cash and cash equivalents
|
6,415,736 | 4,928,728 | ||||||
|
Trade and other receivables
|
40,896 | 1,226,113 | ||||||
|
Investments held for trading
|
- | 40,165 | ||||||
|
Financial Liabilities
|
||||||||
|
Trade and other payables
|
174,297 | 1,360,706 | ||||||
|
Net Exposure
|
6,282,335 | 4,834,300 | ||||||
At 30 June 2011 if foreign exchange rates had moved, as illustrated in the table below (estimated from historical movements), with all other variable held constant, the impact would be:
|
Post tax result
Higher/(lower)
|
Other Equity
Higher/(lower)
|
|||||||||||||||
|
2011
$
|
2010
$
|
2011
$
|
2010
$
|
|||||||||||||
|
Consolidated
|
||||||||||||||||
|
A$:US$ +10%
|
- | - | 625,842 | 486,440 | ||||||||||||
|
A$:US$ -10%
|
- | - | (625,841 | ) | (486,440 | ) | ||||||||||
Consolidated Entity
The impact of the foreign exchange on the Consolidated Entity relates to the value of assets, net of liabilities that are held in the Consolidated Entity which are held in the Parent Entity, which has a functional currency of Australian Dollars.
For the Consolidated Entity, the change in foreign exchange rate does not have any impact on the profit and loss of the entity as the impact of the foreign exchange movements is recorded in the foreign exchange reserve.
Management believes the balance date risk exposures are representative of the risk exposure inherent in the financial instruments.
Price risk
Price risk arises from the Consolidated Entity’s exposure to oil and gas prices. These commodity prices are subject to wide fluctuations and market uncertainties due to a variety of factors that are beyond the control of the Consolidated Entity. Sustained weakness in oil and natural gas prices may adversely affect the Consolidated Entity’s financial condition.
The Consolidated Entity manages this risk by continually monitoring the oil and gas price and the external factors that may affect it. The Board reviews the risk profile associated with commodity price risk periodically to ensure that it is appropriately managing this risk. Derivatives are used to manage this risk where appropriate. The Board must approve any derivative contracts that are entered into by the Company.
The Consolidated Entity has entered into fixed forward swap contracts with Macquarie Bank Limited covering both the oil and gas production of the Consolidated Entity.
Whilst a decrease in the price of commodities will have a negative impact on the sales income from natural gas and oil, this will be partially offset by an increase in the gain from fixed forward swaps. The movement in the fair market value of outstanding fixed forward swaps would also decrease if gas prices were to decrease.
|
Samson Oil & Gas Limited
|
Financial Statements – 30 June 2011
|
Page 70 of 78
|
NOTES TO THE CONSOLIDATED FINANCIAL STATEMENTS
|
|
for 30 June 2011
|
Conversely if oil and gas prices were to rise, sales income from natural gas and oil would increase, however this would be partially offset by a decrease in the gain from fixed forward swaps. Similarly the movement in the fair value of outstanding fixed forward swaps is likely to increase.
At 30 June 2011 if the price of natural gas and oil, as determined by the price at Colorado Interstate Gas price point and at Nymex, had moved, as illustrated in the table below (estimated from historical movements), with all other variable held constant, the impact would be:
|
Post tax result
Higher/(lower)
|
Other Equity
Higher/(lower)
|
|||||||||||||||
|
2011
$
|
2010
$
|
2011
$
|
2010
$
|
|||||||||||||
|
Consolidated
|
||||||||||||||||
|
Gas price + 10%
|
152,170 | 273,322 | - | - | ||||||||||||
|
Gas price – 20%
|
(304,340 | ) | (546,645 | ) | - | - | ||||||||||
|
Post tax result
Higher/(lower)
|
Other Equity
Higher/(lower)
|
|||||||||||||||
|
2011
$
|
2010
$
|
2010
$
|
2009
$
|
|||||||||||||
|
Consolidated
|
||||||||||||||||
|
Oil price + 10%
|
510,628 | 207,338 | - | - | ||||||||||||
|
Oil price – 20%
|
(1,021,256 | ) | (414,676 | ) | - | - | ||||||||||
Credit Risk
The Consolidated Entity manages its credit risk through constantly monitoring its credit exposure, to ensure it is acceptable.
Credit risk arises from the financial assets of the Consolidated Entity, which comprise cash and cash equivalents, trade and other receivables, and financial assets at fair value through profit and loss. The Consolidated Entity’s exposure to credit risk arises from potential default of the counter party, with a maximum exposure equal to the carrying amount of these instruments. Exposure at balance date is addressed in each applicable note.
The Consolidated Entity does not hold any credit derivatives to offset its credit exposure.
The Consolidated Entity trades only with recognised, creditworthy third parties, and as such collateral is not requested nor is it the Consolidated Entity’s policy to securitise its trade and other receivables.
The Consolidated Entity holds its cash with large well respected banks, with no history of default and therefore its credit exposure to cash is minimal.
Receivables balances are monitored on an ongoing basis with the result that the Consolidated Entity’s exposure to bad debts is not significant.
Whilst a small number of debtors account for a large percentage of the Consolidated Entity’s receivable balance, the Board does not consider this a significant risk to the Consolidated Entity as the debtors are all creditworthy with no history of default. As at the date of this report, the Consolidated Entity does not have any receivables which are past their due date and the Consolidated Entity has not recorded any impairment in relation to its receivables.
Liquidity Risk
The Consolidated Entity’s objective is to fund future development through cash flow from operations, equity and debt, where appropriate. It is the Consolidated Entity’s policy to review the cash flow forecasts regularly to ensure that the Consolidated Entity can meet its obligations when they fall due.
|
Samson Oil & Gas Limited
|
Financial Statements – 30 June 2011
|
Page 71 of 78
|
NOTES TO THE CONSOLIDATED FINANCIAL STATEMENTS
|
|
for 30 June 2011
|
The table below reflects all contractual repayments and interest resulting from recognised financial liabilities, including derivative instruments as of 30 June 2011. For derivative financial instruments the market value is presented, whereas for the other obligations the undiscounted cash flows for the respective upcoming fiscal years are presented. Cash flows for financial liabilities without fixed amounts or timing are based on the conditions existing at 30 June 2011.
The remaining contractual maturities of the Consolidated Entity’s financial liabilities are:
|
Consolidated Entity
|
||||||||
|
2011
$
|
2010
$
|
|||||||
|
6 months or less
|
2,737,880 | 3,814,778 | ||||||
|
6-12 months
|
- | 10,412,248 | ||||||
|
1-5 years
|
29,770 | - | ||||||
| 2,767,650 | 14,227,026 | |||||||
The Consolidated Entity monitors rolling forecasts of liquidity reserve on the basis of expected cash flow.
At balance date, the Consolidated Entity does not have any unused credit facility (2010: $nil).
Fair Value
The methods for estimating fair value and the fair value of the financial assets and liabilities are outlined in the relevant notes to the financial statements.
Set out below is a comparison by category of carrying amounts and fair values of the Consolidated Entity’s financial instruments recognised in the financial statements.
Market values have been used to determine the fair value of listed held-for-trading investments.
The fair values of borrowings have been calculated by discounting the expected future cash flows at prevailing market interest rates.
The carrying amount of trade receivables and payables approximates their fair value.
|
Carrying Amount
|
Fair Value
|
|||||||||||||||
|
Consolidated
|
2011
$
|
2010
$
|
2011
$
|
2010
$
|
||||||||||||
|
Financial Assets
|
||||||||||||||||
|
Cash
|
58,448,477 | 5,885,735 | 58,448,477 | 5,885,735 | ||||||||||||
|
Income tax receivable
|
2,579,626 | - | 2,579,626 | - | ||||||||||||
|
Trade and other receivables
|
1,730,872 | 4,959,392 | 1,730,872 | 5,015,853 | ||||||||||||
|
Assets held for trading
|
- | 40,165 | - | 40,165 | ||||||||||||
|
Restricted funds
|
172,504 | 178,291 | 172,504 | 178,291 | ||||||||||||
|
Derivatives
|
22,268 | 46,824 | 22,268 | 46,824 | ||||||||||||
|
Financial Liabilities
|
||||||||||||||||
|
Trade and other payables
|
3,406,377 | 2,318,778 | 3,406,377 | 2,295,101 | ||||||||||||
|
Debt facility
|
- | 11,283,999 | - | 11,283,999 | ||||||||||||
NOTE 32. SHARE BASED PAYMENT PLANS
The Consolidated Entity provides benefits to employees (including senior executives) of the Consolidated Entity in the form of share based payments, whereby employees render services in exchange for shares or rights over shares (equity-settled transactions).
During the current year, the Consolidated Entity filed a Form S-8 with the Securities Exchange Commission. The Form S-8 is a registration statement used by U.S. public companies to register securities to be offered pursuant to employee benefit plans; in this case the ordinary shares issuable and reserved for issuance underlying the options which may be issued pursuant to the Samson Oil & Gas Limited Stock Option Plan were registered.
|
Samson Oil & Gas Limited
|
Financial Statements – 30 June 2011
|
Page 72 of 78
|
NOTES TO THE CONSOLIDATED FINANCIAL STATEMENTS
|
|
for 30 June 2011
|
All references to inputs in this note are in Australian Dollars as they refer to Australian listed securities, unless noted otherwise.
During the year ended 30 June 2011, the following share based payments were made:
Shares issued to employees and Directors
During the year ended 30 June 2011, in conjunction with the reduction in salaries accepted by all employees and Directors of the Company, the Company issued 6,580,021 shares to employees and Directors. These shares were valued at the volume weighted average share price across the ASX and NYSE Amex for the period being compensated for being 1 October 2009 to 30 April 2010, being US$ 2.3 cents per share.
Options issued to Directors
On 18 November 2010, 29,000,000 options were issued to four Directors. These options have an expiry date of 31 October 2014 and an exercise price of 8 cents per share. These options have been valued at 3.6 cents per option, using the Black-Scholes option pricing model, which takes into account the following variables:
|
Share price at grant date (cents)
|
6.40 | |||
|
Exercise price (cents)
|
8.00 | |||
|
Time to expiry (years)
|
4 | |||
|
Risk free rate (%)
|
5.25 | |||
|
Share price volatility (%)
|
75 | |||
|
Dividend yield
|
Nil
|
|||
The value of these options has been expensed in the current period as these options vested immediately.
On 17 December 2010, 32,000,000 options were granted to employees of the Company. These options have an expiry date of 31 December 2014. These options have been valued at 3.1 cents per option, using the Black-Scholes option pricing model which takes into account the following variables:
|
Share price at grant date (cents)
|
5.90 | |||
|
Exercise price (cents)
|
8.00 | |||
|
Time to expiry (years)
|
4 | |||
|
Risk free rate (%)
|
5.25 | |||
|
Share price volatility (%)
|
75 | |||
|
Dividend yield
|
Nil
|
|||
One third of these options vested on 31 January 2011, another third will vest on 31 January 2012 with the remaining third vesting on 31 January 2013. The expense associated with these options will be recognised in line with the vesting schedule.
During the year ended 30 June 2010, the following share based payments were made:
Shares issued to employees and Directors
On 3 December 2009, in conjunction with the reduction in salaries accepted by all employees and Directors of the Company, the Company issued 3,489,603 shares to employees and Directors. These shares were valued at the volume weighted average share price across the ASX and NYSE Amex for the period being compensated for being 1 May 2009 to 30 September 2009, being US$ 2.8 cents per share.
Options issued to Directors
On 18 November 2009, 1,000,000 options were issued to two Directors. These options have an expiry date of 30 November 2013 and an exercise price of 20 cents per share. These options have been valued at 0.6 cents per option, using the Binomial pricing model, which takes into account the following variables:
|
Share price at grant date (cents)
|
2.00 | |||
|
Exercise price (cents)
|
20.00 | |||
|
Time to expiry (years)
|
5 | |||
|
Risk free rate (%)
|
6.5 | |||
|
Share price volatility (%)
|
100 | * |
*The volatility is estimated from historical movement in the share price compared to the market.
|
Samson Oil & Gas Limited
|
Financial Statements – 30 June 2011
|
Page 73 of 78
|
NOTES TO THE CONSOLIDATED FINANCIAL STATEMENTS
|
|
for 30 June 2011
|
The value of these options was expensed at grant.
At year end there were 69,879,077 (2010: 12,699,600) options outstanding that had been granted to employees, Directors and other service providers. The weighted average exercise price was 10 cents (2010: 31 cents) per option.
6,500,000 options with an exercise price of 45 cents expired on 31 May 2011, unexercised. No options were forfeited or cancelled during the prior year.
The weighted average remaining contractual life for the share options outstanding as at 30 June 2011 is between 1 and 4 years (2010: between 1 and 3 years).
The range of exercise prices for options outstanding at the end of the year was 8 – 30 cents. (2010: 20 – 45 cents).
The weighted average fair value of options granted during the year was 3.3 cents per option (2010: 0.6 cents).
NOTE 33. PARENT ENTITY FINANCIAL INFORMATION
|
|
(a)
|
Summary financial information
|
The individual financial statements for the parent entity show the following aggregate amounts:
|
2011
$
|
2010
$
|
|||||||
|
Balance Sheet
|
||||||||
|
Current assets
|
6,456,632 | 6,195,006 | ||||||
|
Total assets
|
12,138,867 | 22,375,612 | ||||||
|
Current liabilities
|
233,491 | 1,360,707 | ||||||
|
Total liabilities
|
233,491 | 1,360,707 | ||||||
|
Net assets
|
11,905,376 | 21,014,905 | ||||||
|
Shareholders’ equity
|
||||||||
|
Issued capital
|
76,925,795 | 75,714,263 | ||||||
|
Reserves
|
||||||||
|
Share based payments reserve
|
4,036,193 | 2,419,430 | ||||||
|
Foreign currency translation reserve
|
3,800,842 | 2,596 | ||||||
|
Accumulated Losses
|
(72,857,454 | ) | (57,121,385 | ) | ||||
|
Net shareholders’ equity
|
11,905,376 | 21,014,905 | ||||||
|
Loss for the year
|
(15,736,069 | ) | (3,168,233 | ) | ||||
|
Total comprehensive income
|
11,937,823 | 1,755,299 | ||||||
|
|
(b)
|
Guarantees entered into by the parent entity.
|
Samson Oil & Gas Limited has guaranteed the bank debt of its subsidiary, Samson Oil & Gas USA, Inc. As at 30 June 2011, the outstanding face value of the debt was $nil (2010: $11,386,248). No liability has been recognised in regard to this guarantee by the parent entity in the current year as the debt has been repaid. No liability was recognised in the prior year as the fair value of the guarantee was immaterial.
|
|
(c)
|
Contingent liabilities of the parent entity
|
The parent entity did not have any contingent liabilities at 30 June 2011 or 30 June 2010. For information about guarantees given by the parent, please see above.
|
Samson Oil & Gas Limited
|
Financial Statements – 30 June 2011
|
Page 74 of 78
|
NOTES TO THE CONSOLIDATED FINANCIAL STATEMENTS
|
|
for 30 June 2011
|
NOTE 34. DISCONTINUED OPERATIONS
In March 2011, the Consolidated Entity sold its interests in the Jonah and Look Out Wash Fields in Wyoming for $6,300,000. The Consolidated Entity’s interest in this field consisted of 21% working interest in 240 acres in the Jonah field, located in Sweetwater County, Wyoming and 17% working interest in approximately 20 wells in the Lookout Wash Field, Carbon County, Wyoming. The Consolidated Entity recognised a gain before income tax of $159,196 in relation to this sale. These assets were written down the value of the sale at 31 December 2010. The value of assets sold was $6,300,000 following this impairment. The profit made on the sale was a result of the Consolidated Entity releasing the asset retirement obligation previously provided for these properties.
All assets were part of the United States of America geographical reporting segment.
|
Consolidated Entity
|
||||||||
|
Revenue and Expenses from Discontinuing Operations
|
2011
$
|
2010
$
|
||||||
|
Revenue
|
||||||||
|
Sale of oil and gas
|
||||||||
|
Oil sales
|
67,831 | 117,193 | ||||||
|
Gas sales
|
590,031 | 1,818,139 | ||||||
|
Other
|
93,703 | 260,808 | ||||||
|
Total Revenue
|
751,565 | 2,196,140 | ||||||
|
Expenses
|
||||||||
|
Cost of sales
|
(587,930 | ) | (1,349,483 | ) | ||||
|
Impairment expense
|
(6,678,940 | ) | (1,226,664 | ) | ||||
|
Net loss before income tax from discontinuing operations
|
(6,515,305 | ) | (380,007 | ) | ||||
|
Gain on sale of oil and gas properties
|
159,196 | - | ||||||
|
Income tax benefit
|
7,911,211 | - | ||||||
|
Net gain after income tax from discontinuing operations
|
1,555,102 | (380,007 | ) | |||||
|
Basic earnings/(loss) per share from discontinuing operations - cents
|
0.09 | (0.03 | ) | |||||
|
Diluted earnings/(loss) per share from discontinuing operations - cents
|
0.08 | (0.03 | ) | |||||
|
Cash Flow Information
|
||||||||
|
Net cash flows from operating activities
|
414,600 | 1,436,818 | ||||||
|
Net cash flows (used in) investing activities
|
- | (92,132 | ) | |||||
|
Net cash flows from financing activities
|
6,300,000 | - | ||||||
|
Samson Oil & Gas Limited
|
Financial Statements – 30 June 2011
|
Page 75 of 78
|
DIRECTORS’DECLARATION
|
|
30 June 2011
|
DIRECTORS’ DECLARATION
In accordance with a resolution of the Directors of Samson Oil & Gas Limited, I state that:
In the opinion of the Directors:
|
|
(a)
|
the financial statements and notes set out on pages 25 to 75 are in accordance with the Corporations Act 2001, including :
|
|
|
(i)
|
giving a true and fair view of the Consolidated Entity’s financial position as at 30 June 2011 and of its performance for the financial year ended on that date; and
|
|
|
(ii)
|
complying with Accounting Standards, Corporations Regulations 2001 and other mandatory professional reporting requirements
|
|
|
(b)
|
there are reasonable grounds to believe that the Company will be able to pay its debts as and when they become due and payable.
|
Note 2(a) confirms that the financial statements also comply with International Financial Reporting Standards as issued by the International Accounting Standards Board.
The Directors have been given the declarations by the chief executive officer and chief financial officer required by section 295A of the Corporations Act 2001.
On behalf of the Board
Terence M. Barr
Director
Denver, Colorado
14 September 2011
|
Samson Oil & Gas Limited
|
Financial Statements – 30 June 2011
|
Page 76 of 78
|
INDEPENDENT AUDIT REPORT
|
|
for the year ended 30 June 2011
|
INDEPENDENT AUDIT REPORT
|
Samson Oil & Gas Limited
|
Financial Statements – 30 June 2011
|
Page 77 of 78
|
INDEPENDENT AUDIT REPORT
|
|
for the year ended 30 June 2011
|
|
Samson Oil & Gas Limited
|
Financial Statements – 30 June 2011
|
Page 78 of 78