Attached files
| file | filename |
|---|---|
| 8-K - FORM 8-K - ASSOCIATED BANC-CORP | c66166e8vk.htm |
EXHIBIT 99.1
| Barclays Capital Global Financial Services Conference September 2011 |
| Forward-Looking Statements Important Note Regarding Forward-Looking Statements: Statements made in this presentation which are not purely historical are forward-looking statements, as defined in the Private Securities Litigation Reform Act of 1995. This includes plans, objectives, or goals for future operations, products or services, and forecasts of its revenues, earnings, or other measures of performance. Forward-looking statements are based on current management expectations and, by their nature, are subject to risks and uncertainties. These statements may be identified by the use of words “anticipate”, “plan”, “estimate”, expressions. Outcomes related to such statements are subject to numerous risk factors and uncertainties recent Form10-K and any subsequent Form 10-Q. |
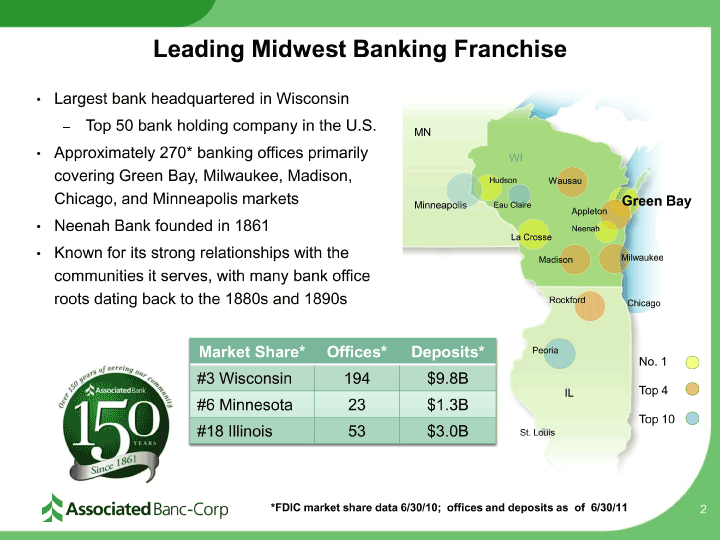
| Leading Midwest Banking Franchise • Largest bank headquartered in Wisconsin — Top 50 bank holding company in the U.S. MN • Approximately 270* banking offices primarily WI covering Green Bay, Milwaukee, Madison, Hudson Wausau Chicago, and Minneapolis markets Green Bay Minneapolis Eau Claire Appleton • Neenah Bank founded in 1861 Neenah La Crosse • Known for its strong relationships with the Milwaukee Madison communities it serves, with many bank office roots dating back to the 1880s and 1890s Rockford Chicago Market Share* Offices* Deposits* Peoria No. 1 #3 Wisconsin 194 $9.8B Top 4 #6 Minnesota 23 $1.3B IL Top 10 #18 Illinois 53 $3.0B St. Louis |
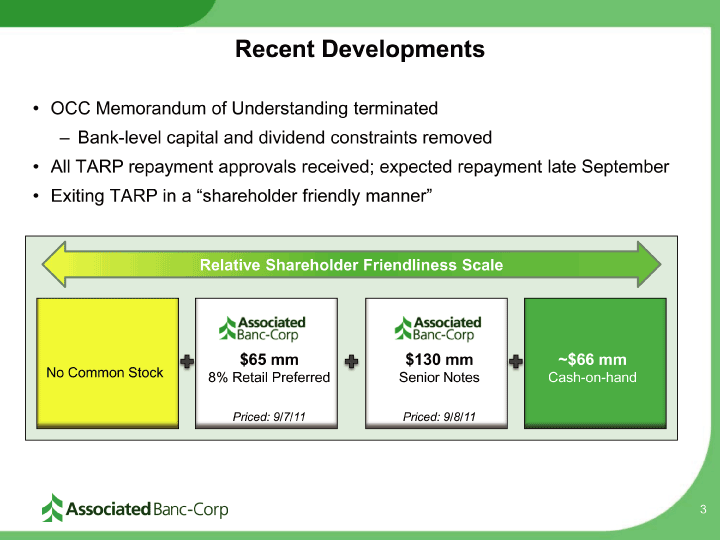
| Recent Developments •OCC Memorandum of Understanding terminated —Bank-level capital and dividend constraints removed •All TARP repayment approvals received; expected repayment late September •Exiting TARP in a “shareholder Relative Shareholder Friendliness Scale No Common Stock $65 mm $130 mm ~$66 mm 8% Retail Preferred Senior Notes Cash-on-hand Priced: 9/7/11 Priced: 9/8/11 |
| ASBC Vision Statement Associated Banc-Corp will be the most admired Midwestern financial services company, distinguished by sound, value-added financial solutions with personal service for our customers, built upon a strong commitment to our colleagues and the communities we serve, resulting in exceptional value for our shareholders. |
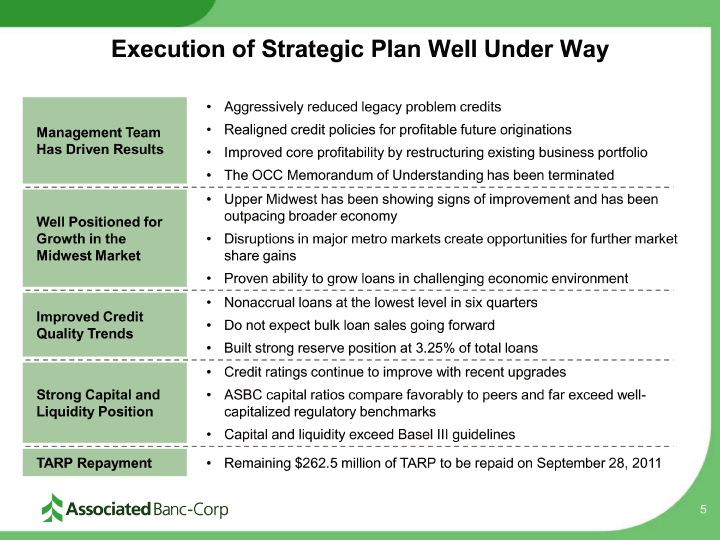
| Execution of Strategic Plan Well Under Way • Aggressively reduced legacy problem credits Management Team • Realigned credit policies for profitable future originations Has Driven Results • Improved core profitability by restructuring existing business portfolio • The OCC Memorandum of Understanding has been terminated • Upper Midwest has been showing signs of improvement and has been Well Positioned for outpacing broader economy Growth in the • Disruptions in major metro markets create opportunities for further market Midwest Market share gains • Proven ability to grow loans in challenging economic environment • Nonaccrual loans at the lowest level in six quarters Improved Credit • Do not expect bulk loan sales going forward Quality Trends • Built strong reserve position at 3.25% of total loans • Credit ratings continue to improve with recent upgrades Strong Capital and • ASBC capital ratios compare favorably to peers and far exceed well-Liquidity Position capitalized regulatory benchmarks • Capital and liquidity exceed Basel III guidelines TARP Repayment • Remaining $262.5 million of TARP to be repaid on September 28, 2011 |
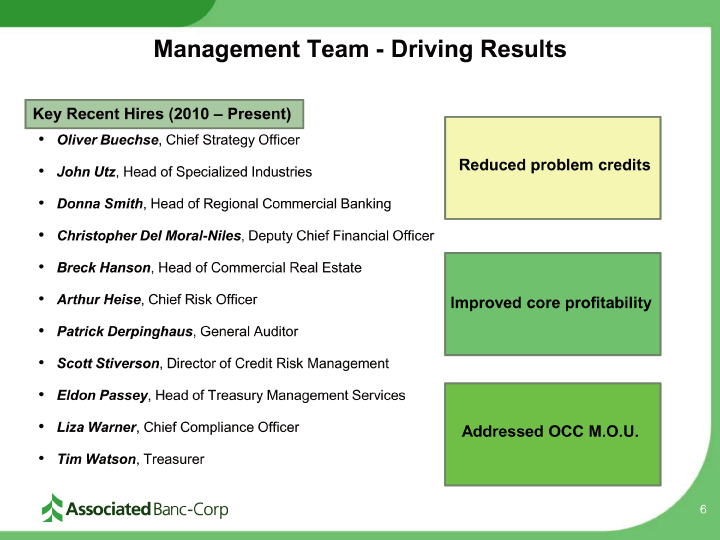
| Management Team — Driving Results Key Recent Hires (2010 —Present) •Oliver Buechse, Chief Strategy Officer Reduced problem credits •John Utz, Head of Specialized Industries •Donna Smith, Head of Regional Commercial Banking •Christopher Del Moral-Niles, Deputy Chief Financial Officer •Breck Hanson, Head of Commercial Real Estate •Arthur Heise, Chief Risk Officer Improved core profitability •Patrick Derpinghaus, General Auditor •Scott Stiverson, Director of Credit Risk Management •Eldon Passey, Head of Treasury Management Services •Liza Warner, Chief Compliance Officer Addressed OCC M.O.U. •Tim Watson, Treasurer |
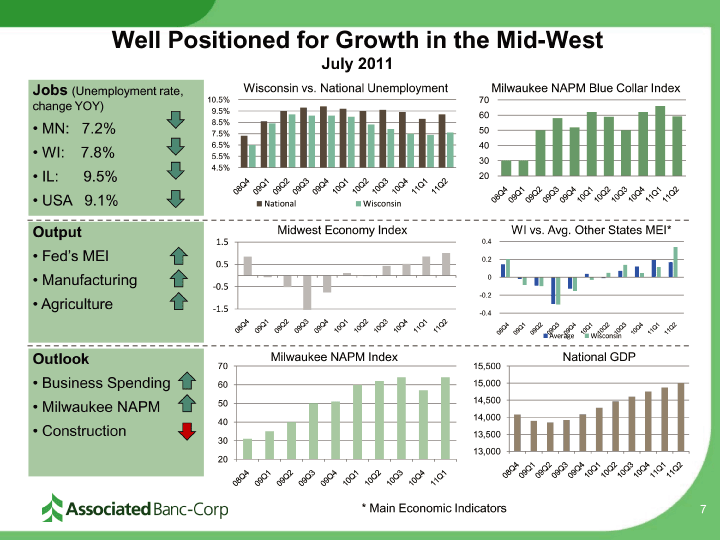
| Well Positioned for Growth in the Mid-West July 2011 Jobs (Unemployment rate, Wisconsin vs. National Unemployment Milwaukee NAPM Blue Collar Index 10.5% 70 change YOY) 9.5% 8.5% 60 •MN: 7.2% 7.5% 50 6.5% 40 •WI: 7.8% 5.5% 4.5% 30 •IL: 9.5% 20 •USA 9.1% National Wisconsin Output Midwest Economy Index WI vs. Avg. Other States MEI* 1.5 0.4 •Fed’s MEI 0.2 0.5 •Manufacturing 0 -0.5 -0.2 •Agriculture -1.5 -0.4 Average Wisconsin Outlook 70 Milwaukee NAPM Index 15,500 National GDP •Business Spending 60 15,000 •Milwaukee NAPM 50 14,500 14,000 40 •Construction 30 13,500 20 13,000 * Main Economic Indicators |
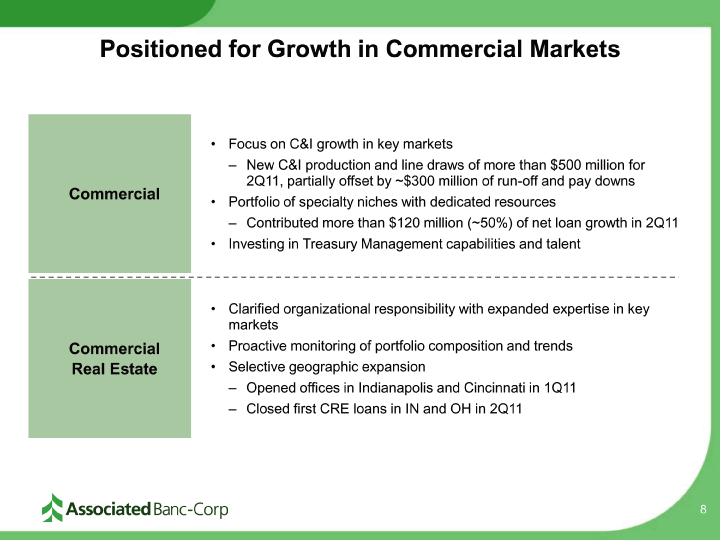
| Positioned for Growth in Commercial Markets • Focus on C&I growth in key markets — New C&I production and line draws of more than $500 million for Commercial 2Q11, partially offset by ~$300 million of run-off and pay downs • Portfolio of specialty niches with dedicated resources — Contributed more than $120 million (~50%) of net loan growth in 2Q11 • Investing in Treasury Management capabilities and talent • Clarified organizational responsibility with expanded expertise in key markets Commercial • Proactive monitoring of portfolio composition and trends Real Estate • Selective geographic expansion — Opened offices in Indianapolis and Cincinnati in 1Q11 — Closed first CRE loans in IN and OH in 2Q11 |
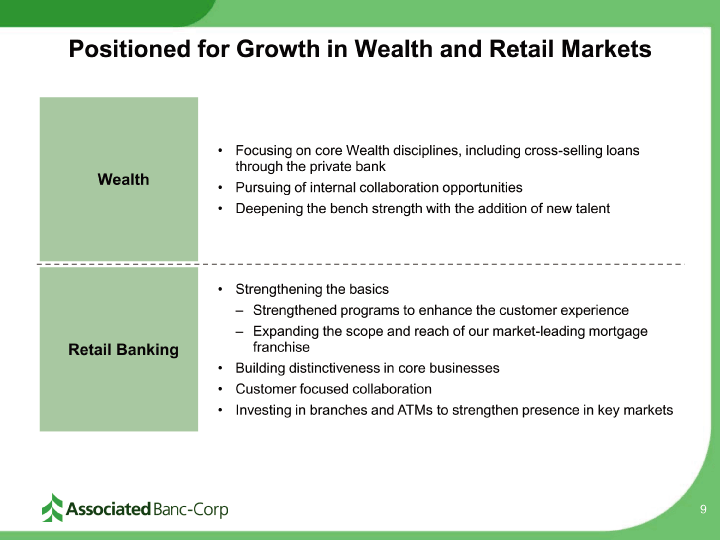
| Positioned for Growth in Wealth and Retail Markets • Focusing on core Wealth disciplines, including cross-selling loans Wealth through the private bank • Pursuing of internal collaboration opportunities • Deepening the bench strength with the addition of new talent • Strengthening the basics — Strengthened programs to enhance the customer experience — Expanding the scope and reach of our market-leading mortgage Retail Banking franchise • Building distinctiveness in core businesses • Customer focused collaboration • Investing in branches and ATMs to strengthen presence in key markets |
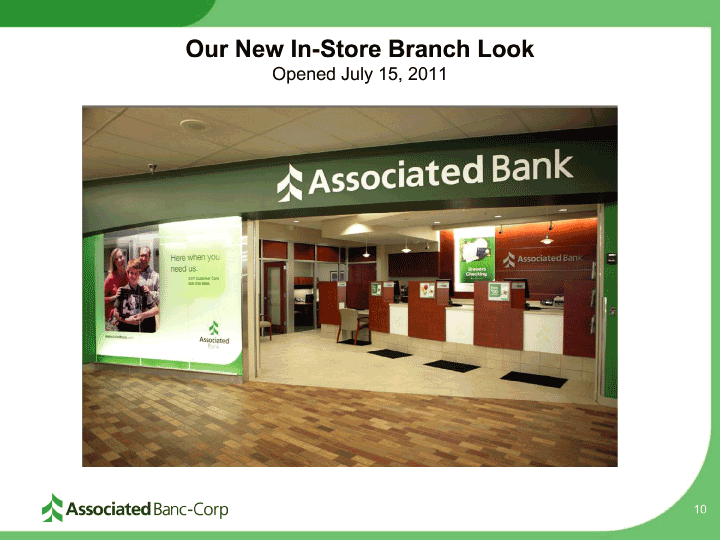
| Our New In-Store Branch Look Opened July 15, 2011 |
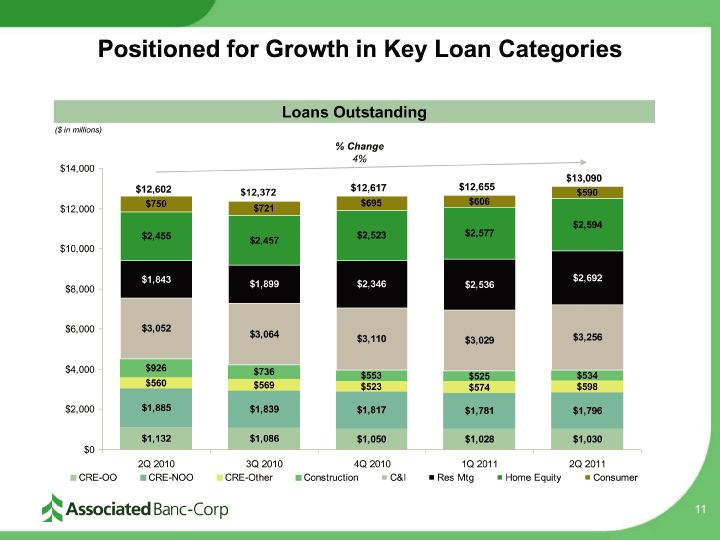
| Positioned for Growth in Key Loan Categories Loans Outstanding ($ in millions) % Change 4% $14,000 $12,655 $13,090 $12,602 $12,617 $12,372 $590 $750 $695 $606 $12,000 $721 $2,577 $2,594 $2,455 $2,523 $10,000 $2,457 $1,843 $2,692 $1,899 $2,346 $2,536 $8,000 $6,000 $3,052 $3,064 $3,256 $3,110 $3,029 $4,000 $926 $736 $553 $525 $534 $560 $569 $523 $598 $574 $2,000 $1,885 $1,839 $1,817 $1,781 $1,796 $1,132 $1,086 $1,050 $1,028 $1,030 $0 2Q 2010 3Q 2010 4Q 2010 1Q 2011 2Q 2011 CRE-OO CRE-NOO CRE-Other Construction C&I Res Mtg Home Equity Consumer |
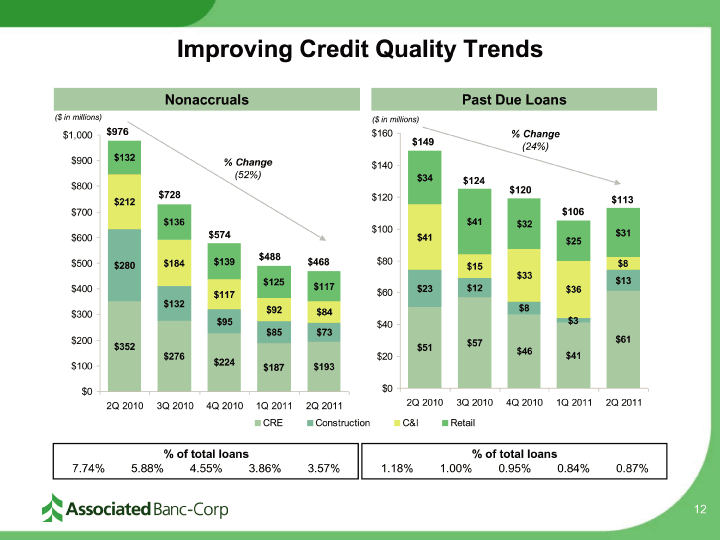
| Improving Credit Quality Trends Nonaccruals Past Due Loans ($ in millions) ($ in millions) $1,000 $976 $160% Change $149 (24%) $900 $132% Change $140 (52%) $34 $124 $800 $728 $120 $120 $113 $212 $700 $106 $136 $41 $32 $100 $31 $600 $574 $41 $25 $488 $500 $184 $139 $468 $80 $8 $280 $15 $33 $125 $13 $400 $117 $23 $12 $36 $117 $60 $132 $92 $84 $8 $300 $95 $40 $3 $85 $73 $200 $57 $61 $352 $51 $46 $276 $20 $41 $100 $224 $187 $193 $0 $0 2Q 2010 3Q 2010 4Q 2010 1Q 2011 2Q 2011 2Q 2010 3Q 2010 4Q 2010 1Q 2011 2Q 2011 CRE Construction C&I Retail % of total loans % of total loans 7.74% 5.88% 4.55% 3.86% 3.57% 1.18% 1.00% 0.95% 0.84% 0.87% |
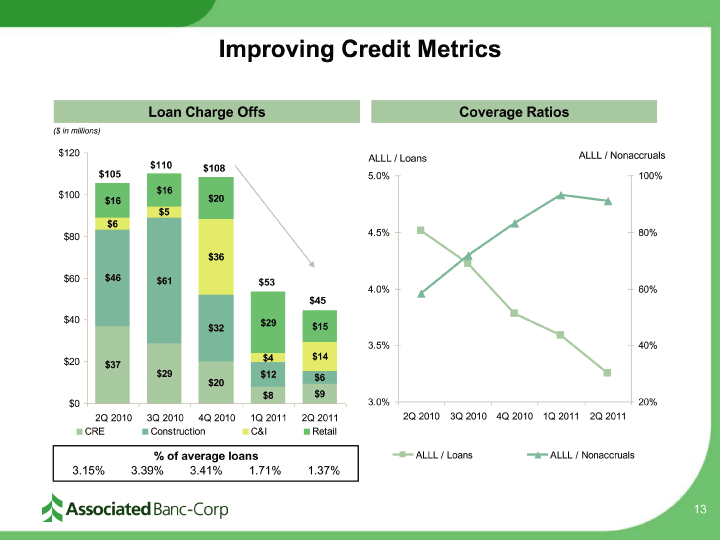
| Improving Credit Metrics Loan Charge Offs Coverage Ratios ($ in millions) $120 ALLL / Nonaccruals ALLL / Loans $105 $110 $108 5.0% 100% $16 $100 $20 $16 $5 $6 4.5% 80% $80 $36 $60 $46 $61 $53 4.0% 60% $45 $40 $29 $32 $15 3.5% 40% $4 $14 $20 $37 $29 $20 $12 $6 $8 $9 3.0% 20% $0 2Q 2010 3Q 2010 4Q 2010 1Q 2011 2Q 2011 2Q 2010 3Q 2010 4Q 2010 1Q 2011 2Q 2011 CRE Construction C&I Retail % of average loans ALLL / Loans ALLL / Nonaccruals 3.15% 3.39% 3.41% 1.71% 1.37% |
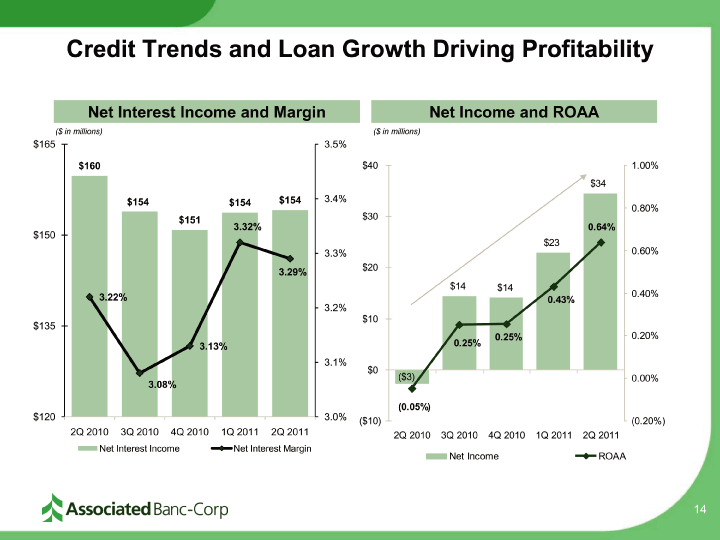
| Credit Trends and Loan Growth Driving Profitability Net Interest Income and Margin Net Income and ROAA ($ in millions) ($ in millions) $165 3.5% $160 $40 1.00% $34 $154 $154 $154 3.4% $30 0.80% $151 $150 3.32% 0.64% $23 0.60% 3.3% $20 3.29% $14 $14 3.22% 0.40% 3.2% 0.43% $10 $135 0.25% 0.20% 3.13% 0.25% 3.1% $0 ($3) 0.00% 3.08% (0.05%) $120 3.0% ($10) (0.20%) 2Q 2010 3Q 2010 4Q 2010 1Q 2011 2Q 2011 2Q 2010 3Q 2010 4Q 2010 1Q 2011 2Q 2011 Net Interest Income Net Interest Margin Net Income ROAA |
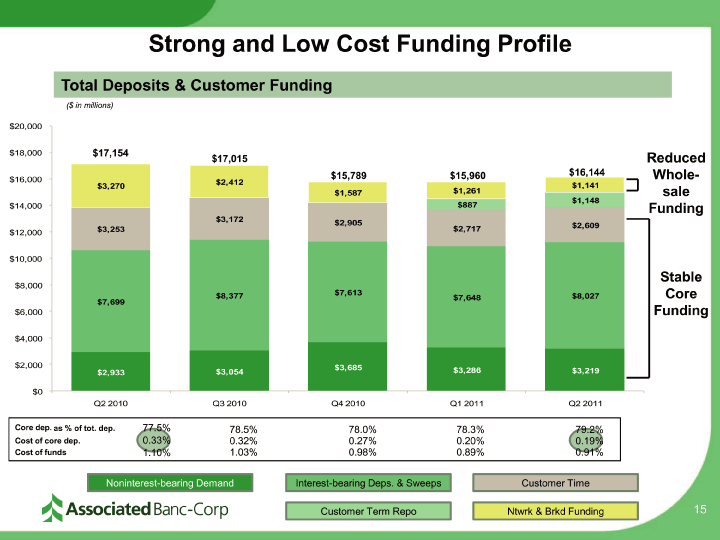
| Strong and Low Cost Funding Profile Total Deposits & Customer Funding ($ in millions) $20,000 $18,000 $17,154 $17,015 Reduced $16,000 $15,789 $15,960 $16,144 Whole- $2,412 $1,141 $3,270 $1,587 $1,261 sale $1,148 $14,000 $887 Funding $3,172 $2,905 $2,609 $3,253 $2,717 $12,000 $10,000 $8,000 Stable $8,377 $7,613 Core $7,648 $8,027 $7,699 $6,000 Funding $4,000 $2,000 $3,685 $2,933 $3,054 $3,286 $3,219 $0 Q2 2010 Q3 2010 Q4 2010 Q1 2011 Q2 2011 Core dep. as % of tot. dep. 77.5% 78.5% 78.0% 78.3% 79.2% Cost of core dep. 0.33% 0.32% 0.27% 0.20% 0.19% Cost of funds 1.10% 1.03% 0.98% 0.89% 0.91% Noninterest-bearing Demand Interest-bearing Deps. & Sweeps Customer Time Customer Term Repo Ntwrk & Brkd Funding 15 |
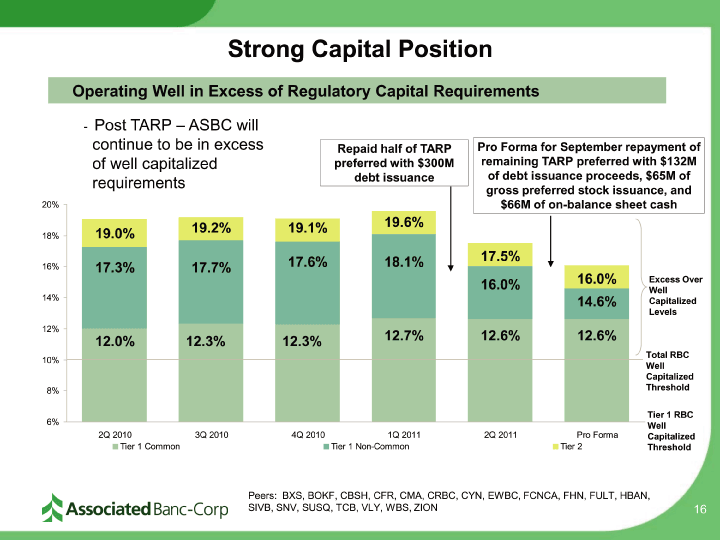
| Strong Capital Position Operating Well in Excess of Regulatory Capital Requirements — Post TARP —ASBC will continue to be in excess Repaid half of TARP Pro Forma for September repayment of of well capitalized preferred with $300M remaining TARP preferred with $132M requirements debt issuance of debt issuance proceeds, $65M of gross preferred stock issuance, and 20% $66M of on-balance sheet cash 19.2% 19.1% 19.6% 18% 19.0% 17.6% 18.1% 17.5% 16% 17.3% 17.7% 16.0% 16.0% Excess Over 14% Well 14.6% Cap italized Levels 12% 12.0% 12.3% 12.3% 12.7% 12.6% 12.6% Total RBC 10% Well Capitalized 8% Threshold Tier 1 RB C 6% Well 2Q 2010 3Q 2010 4Q 2010 1Q 2011 2Q 2011 Pro Forma Capitalized Tier 1 Common Tier 1 Non-Common Tier 2 Threshold Peers: BXS, BOKF, CBSH, CFR, CMA, CRBC, CYN, EWBC, FCNCA, FHN, FULT, HBAN, SIVB, SNV, SUSQ, TCB, VLY, WBS, ZION 16 |
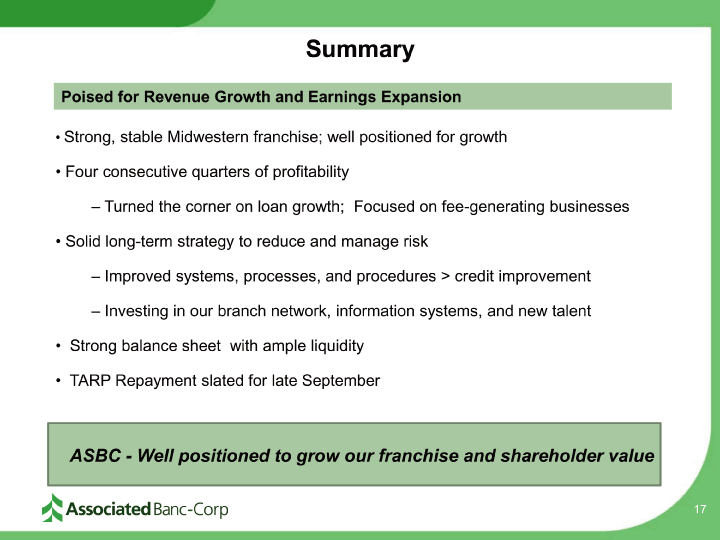
| Summary Poised for Revenue Growth and Earnings Expansion •Strong, stable Midwestern franchise; well positioned for growth •Four consecutive quarters of profitability —Turned the corner on loan growth; Focused on fee-generating businesses •Solid long-term strategy to reduce and manage risk —Improved systems, processes, and procedures > credit improvement —Investing in our branch network, information systems, and new talent •Strong balance sheet with ample liquidity •TARP Repayment slated for late September ASBC — Well positioned to grow our franchise and shareholder value |
