Attached files
| file | filename |
|---|---|
| EX-21 - ZYGO CORP | c66867_ex21.htm |
| EX-31.1 - ZYGO CORP | c66867_ex31-1.htm |
| EX-32.1 - ZYGO CORP | c66867_ex32-1.htm |
| EX-32.2 - ZYGO CORP | c66867_ex32-2.htm |
| EX-23.1 - ZYGO CORP | c66867_ex23-1.htm |
| EX-31.2 - ZYGO CORP | c66867_ex31-2.htm |
|
|
|
UNITED STATES |
|
SECURITIES AND EXCHANGE COMMISSION |
|
WASHINGTON, D.C. 20549 |
FORM 10-K
|
|
|
|
(Mark One) |
|
|
x |
Annual Report Pursuant to Section 13 or 15(d) of the Securities Exchange Act of 1934 |
|
|
For the fiscal year ended June 30, 2011 |
|
Or |
|
|
o |
Transition Report Pursuant to Section 13 or 15(d) of the Securities Exchange Act of 1934 |
|
|
For the transition period from ______________________________ to ______________________________ |
Commission file number 0-12944
|
|
|
ZYGO CORPORATION |
|
|
|
(Exact name of registrant as specified in its charter) |
|
|
|
|
|
Delaware |
|
06-0864500 |
|
|
|
|
|
(State or other jurisdiction of |
|
(IRS Employer Identification Number) |
|
|
|
Laurel Brook Road, Middlefield, Connecticut 06455-1291 |
|
|
|
(Address of principal executive offices) (Zip Code) |
|
|
|
(860) 347-8506 |
|
|
|
(Registrant’s telephone number, including area code:) |
|
|
|
Securities registered pursuant to Section 12(b) of the Act: |
|
|
|
None |
|
|
|
Securities registered pursuant to Section 12(g) of the Act: |
|
|
|
Common Stock, $.10 Par Value |
|
|
|
Indicate by check mark if the registrant is a well-known seasoned issuer, as defined in Rule 405 of the Securities Act. |
|
YES o NO x |
|
|
|
Indicate by check mark if the registrant is not required to file reports pursuant to Section 13 or Section 15(d) of the Act. |
|
YES o NO x |
|
|
|
Indicate by check mark whether the registrant (1) has filed all reports required to be filed by Section 13 or 15(d) of the Securities Exchange Act of 1934 during the preceding 12 months (or for such shorter period that the registrant was required to file such reports), and (2) has been subject to such filing requirements for the past 90 days. |
|
YES x NO o |
|
|
|
Indicate by check mark whether the registrant has submitted electronically and posted on its corporate Web site, if any, every Interactive Data File required to be submitted and posted pursuant to Rule 405 of Regulation S-T (§ 229.405 of this chapter) during the preceding 12 months (or for such shorter period that the registrant was required to submit and post such files). (1) |
|
YES o NO o |
|
|
|
Indicate by check mark if disclosure of delinquent filers pursuant to Item 405 of Regulation S-K (§ 229.405 of this chapter) is not contained herein, and will not be contained, to the best of registrant’s knowledge, in definitive proxy or information statements incorporated by reference in Part III of this Form 10-K or any amendment to this Form 10-K. |
|
x |
Indicate by check mark whether the registrant is a large accelerated filer, an accelerated filer, a non-accelerated filer, or a smaller reporting company. See the definitions of “large accelerated filer,” “accelerated filer” and “smaller reporting company” in rule 12b-2 of the Exchange act. (Check one):
|
|
|
|
Large accelerated filer o |
Accelerated filer x |
|
Non-accelerated filer o (Do not check if a smaller reporting company) |
Smaller reporting company o |
(1) The registrant is not currently required to submit Interactive Data Files pursuant to Rule 405 of Regulation S-T.
Indicate by check mark whether the registrant is a shell company (as defined in Rule 12b-2 of the Act). YES o NO x
The aggregate market value of the registrant’s Common Stock held by non-affiliates, based upon the closing price of the Common Stock on December 31, 2010, as reported by the NASDAQ National Market, was $113,046,969. Shares of Common Stock held by each executive officer and director and by each person who owns 5% or more of the outstanding Common Stock, based on filings with the Securities and Exchange Commission, have been excluded since such persons may be deemed affiliates. This determination of affiliate status is not necessarily a conclusive determination for other purposes.
Indicate the number of shares outstanding of each of the registrant’s classes of Common Stock, as of the latest practicable date.
17,848,608 Shares of Common Stock, $.10 Par Value, at August 26, 2011
Documents incorporated by reference: Specified portions of the registrant’s Proxy Statement related to the registrant’s 2011 Annual Meeting of Stockholders, to be filed pursuant to Regulation 14A of the Securities Exchange Act of 1934 with the Securities and Exchange Commission, are incorporated by reference into Part II (Item 5) and Part III (Items 10-14) of this Annual Report on Form 10-K to the extent stated herein.
TABLE OF CONTENTS
As used in this Annual Report on Form 10-K, unless the context otherwise requires, the terms “we,” “us,” “our,” “Company,” and “Zygo” refer to Zygo Corporation, a Delaware corporation.
All statements other than statements of historical fact included in this Annual Report regarding our financial position, business strategy, plans, anticipated revenues, bookings, market acceptance, growth rates, market opportunities and objectives of management for future operations are forward-looking statements. These forward-looking statements include without limitation statements under “Business,” “Management’s Discussion and Analysis of Financial Condition and Results of Operations” and “Risk Factors.” Forward-looking statements are intended to provide management’s current expectations or plans for the future operating and financial performance based upon information currently available and assumptions currently believed to be valid. Forward-looking statements can be identified by the use of words such as “anticipate,” “believe,” “estimate,” “expect,” “intend,” “plan(s),” “strategy,” “project” and other words of similar meaning in connection with a discussion of future operating or financial performance. Actual results could differ materially from those contemplated by the forward-looking statements as a result of certain factors such as those disclosed under “Risk Factors.” Such statements reflect our current views with respect to future events and are subject to these and other risks, uncertainties and assumptions relating to the operations, results of operations and our growth strategy.
Any forward-looking statements included in this Annual Report speak only as of the date of this document. Zygo undertakes no obligation to publicly update or revise forward-looking statements to reflect events or circumstances occurring after the date of this Annual Report on Form 10-K.
1
OVERVIEW
Zygo Corporation (“Zygo,’’ “we,’’ “us,’’ “our,’’ or “Company’’) designs, develops, and manufactures ultra-high precision measurement solutions to improve our customers’ manufacturing yields, and top-tier optical sub-systems and components for original equipment manufacturers (“OEM”) and end-user applications. We operate within two divisions. Our Metrology Solutions Division (also referred to herein as the “Metrology Solutions segment”) manufactures products to improve quality, increase productivity, and decrease the overall cost of product development and manufacturing for high-technology companies. Our Optical Systems Division (also referred to herein as the “Optical Systems segment”) provides leading-edge product development and manufacturing services that leverage a variety of core technologies across semiconductor, defense, laser fusion research, life-sciences, and other industrial markets. The Metrology Solutions segment, has manufacturing locations in Middlefield, Connecticut; Montreal, Canada; and Shanghai, China. The Optical Systems segment has manufacturing locations in Middlefield, Connecticut; Tucson, Arizona; Costa Mesa, California; and Richmond, California.
We focus on markets around the world that are engaged in research and manufacture of high volume precision components used to support emerging and growing high technology applications in industries such as consumer electronics, automotive engineering, LED lighting, life-sciences, military and defense. We have expanded our geographic reach in recent years, particularly in the Pacific Rim by continued investment in our joint venture in China and other selected acquisitions.
During the second quarter of fiscal 2011, we completed a transaction with ASML US, Inc. (“ASML”) where we purchased substantially all the assets of ASML’s Richmond, California operation, including a 55,300 square-foot manufacturing facility. In addition, we hired key management and employees working at the former ASML Richmond facility and formed our Extreme Precision Optics group (“EPO”), which is included in our Optical Systems segment. With this acquisition, we have considerably expanded and improved our optical manufacturing capabilities. Combined with our existing leadership position in metrology, large flat optics production and electro-optical design and manufacturing, EPO provides highly synergistic capabilities that address new applications in semiconductor, defense and the life-sciences markets.
During fiscal 2010 and 2009, we divested our Semiconductor and Flat Panel Display (“FPD”) product lines and shut down our integrated circuit packaging operations in Singapore in order to concentrate on our core technologies. We continue to manufacture and sell sensor heads on an OEM basis related to semiconductor and FPD systems. In October 2009, we announced a strategic business partnership with Toho Technology Corporation (“Toho”) of Nagoya, Japan, pursuant to which Toho will have the exclusive right to Zygo’s technology in the manufacture and distribution of products to the large substrate FPD market.
In January 2010, Dr. Chris L. Koliopoulos was appointed President and Chief Executive Officer and subsequently became Chairman of the Board of Directors of Zygo. On January 22, 2010, we completed the acquisition of Zemetrics, Inc. (“Zemetrics”), a small interferometric metrology company in which Dr. Koliopoulos was a major shareholder. The acquisition of Zemetrics, which has recently introduced an advanced product in the optical instrumentation market, further strengthened our offering in our core markets, which is a strategic focus for us. The Zemetrics operation is included in the Metrology Solutions segment. During the third quarter of fiscal 2011, we announced the appointment of John P. Jordan to the position of Vice President, Chief Financial Officer and Treasurer.
Zygo was incorporated in 1970 under the laws of the State of Delaware. The address of our principal executive offices is Laurel Brook Road, Middlefield, Connecticut, 06455-1291. Our telephone number at this address is (860) 347-8506. Our website address is www.zygo.com. The information on our website is not part of this Annual Report on Form 10-K.
2
Business Segments & Products
The products and services in our two reportable segments are based on our core technologies, process knowledge and extensive experience in optical design, mechanical engineering, software and algorithms and optical fabrication. Most products are proprietary or incorporate proprietary technology in their design.
|
|
|
|
|
Metrology Solutions Segment |
|
|
Our Metrology Solutions segment includes 3-Dimensional surface metrology products, precision positioning systems and custom engineered solutions. We offer a comprehensive line of metrology products and solutions to address requirements of precision manufacturing industries and advanced research. Our systems are commonly used to measure surface characteristics and critical parameters, including topography and roughness, shape, dimension, thickness, optical characteristics and defects. |
|
|
|
|
|
Zygo metrology products provide precise measurements for quality control, process feedback and machine control. There are many applications in a variety of markets where precision and consistency are critical to the process or the enablement of advanced research and process development, including the automotive, consumer electronics, medical, aerospace, military, materials research, optics, flat panel displays and semiconductor industries. The inherent precision, reliability and speed of Zygo’s metrology measurement technologies help to reduce cost of ownership, which is a significant factor for many users. Demand for our products is driven by advancement of next generation devices and technology, complex processing methods and tighter manufacturing tolerances across many industries. |
|
|
|
|
|
The Metrology Solutions segment markets products under the Zygo and Zemetrics major brand names. Products under the Zemetrics brand include the ZeGage and ZeScope family of products. These products complement the Zygo NewView product brand by offering industrial-capable non-contact 3D surface measurements. Both Zygo and Zemetrics products are often developed using common research and development and engineering resources. Each brand is targeted to a different customer segment, with the Zygo brand providing a high-end feature-rich product offering and the Zemetrics brand addressing mid-level, industrial market needs. Both brands provide customers a progressive choice of products addressing their full range of metrology needs. |
|
|
|
|
|
Zygo is considered to be a world leader in optical interferometry with a portfolio of over 450 patents issued worldwide, many of which are related to the broad field of interferometry and its practical application. We continually strive to strengthen our product offerings and advance our competitive position by developing new products and solutions to meet our customers’ needs. |
|
|
|
|
|
Major product introductions: |
|
|
|
|
|
DynaFiz-dynamic laser interferometer: Developed for challenging testing environments that may have turbulent air and extreme vibration, the DynaFiz interferometer provides reliable optical metrology for the measurement of optical components and complex optical systems in uncontrolled environments that would perturb traditional techniques. Markets include defense and industrial segments, as well as the R&D market. DynaFiz contains patented, state of the art technology which provides a unique value for customers seeking high accuracy metrology during fabrication and alignment of optical elements and systems. |
|
|
|
|
|
ZeGage-2D-3D optical profiler family: Designed for non-contact nanometer-level surface height measurements without the requirement of vibration isolation, ZeGage provides unique capabilities tailored to the industrial market segment. ZeGage uses a combination of scanning white light interferometry and patent pending scanning methods, to provide very strong performance that is competitively positioned against contact stylus instruments traditionally used in the industrial machine tool market. The instrument also utilizes ZeMaps™ software, and features a range of 2D and 3D surface parameters including form, step height, and ISO/EN 25178 compliant surface roughness parameter standardization. This product family is being marketed primarily to the industrial factory market, adding a new price point and customer base to the Zygo NewView line of products. |
|
|
|
|
|
AccuFlat-precision surface interferometer: Designed primarily to address the unique metrology needs of critical surfaces such as those required for the data storage market, AccuFlat demonstrates Zygo’s ability to develop products and technology tailored to high value metrology applications. With an ability to measure transparent optical elements that are as thin as 100 micro meters in thickness, AccuFlat provides highly accurate measurements of form, and waviness critical in the manufacture of hard disk drives. |
3
|
|
|
|
|
Markets |
|
|
Automotive Industry |
|
|
|
|
|
The automotive industry is striving to improve fuel economy and decrease environmental pollution to meet customer demand and adhere to government regulation. Improving both requires more efficient engines, including the fuel injection system. Our measurement-based process control and yield-enhancement systems are used in the development and high-precision manufacture of high-pressure valves and sealing surfaces incorporated into fuel injection systems. |
|
|
|
|
|
NewView™ Series 3D Optical Profilers |
|
|
Our high precision metrology equipment is well suited for fuel injector components, which are ground or lapped to tolerances of one-hundred billionths of a meter. Our patented “FDA” data acquisition system for the NewView optical profiler meets this high-precision measurement requirement. |
|
|
|
|
|
ZeGage |
|
|
The newly introduced ZeGage addresses applications with the need to measure and visualize a wide variety of materials, including rubber, paper, metal, plastic and ceramics, further addressing the needs of the automotive market. We believe the ZeGage price point will have broader appeal to first time buyers of optical metrology. |
|
|
|
|
|
Consumer Electronics |
|
|
|
|
|
Consumer electronics, including tablets, smart phones, digital cameras, DVD and CD players, and optical computer drives, have significant optical content. Consumer electronics optics, which provide imaging and data storage, are manufactured in quantities in the hundreds of thousands to millions of components per year. These complex miniature optical systems require precise optical testing - from development to in-line process control, which our measurement-based process control and yield enhancement systems are designed to perform. |
|
|
|
|
|
VeriFire™ Asphere System |
|
|
The VeriFire Asphere provides high resolution 3-Dimensional surface metrology for aspheric shaped surfaces using patented non-contact interferometric techniques for production and process control. Aspheres are important in consumer electronics products, cameras, military/defense optics, and commercial optics and represent a growing segment in the optics markets due to improved optical performance in the devices in comparison to traditional spherical lenses. |
|
|
|
|
|
VeriFire™ Systems |
|
|
The development of new optical systems for any application requires flexible and easy to use test equipment. The Zygo VeriFire systems are the latest products in our established product family that has improved optical testing and continues to evolve to meet changing requirements. Consumer electronics production applications for larger optics, greater than a 25 millimeter diameter, and research and development for any size application rely on these products for critical developmental data and process-control feedback in production. These products are widely used for their configuration flexibility in hardware set ups and Zygo’s MetroPro™ data analysis software. |
|
|
|
|
|
Defense/Aerospace |
|
|
|
|
|
GPI™ and VeriFire™ Systems |
|
|
Developing state-of-the-art optical designs and manufacturing technology for the defense/aerospace market also requires leading edge metrology systems for manufacturing process control and development. Our industry standard VeriFire optical interferometers test the optical components as well as the systems for design compliance. Our VeriFire Asphere rapidly measures asphere shaped optics in a production environment without the need for specialized tooling. Our VeriFire QPZ continues our move to the production floor, providing laboratory-level results in a production environment. Using patented methods, the VeriFire QPZ removes the degrading effects of vibration from the measurement without the need for additional expensive isolation hardware. This system is primarily used in qualification of optical elements during the production of military and commercial optics. We are also active in designing and manufacturing custom test systems for defense/aerospace applications, especially interferometers that operate at infrared wavelengths, which are unique to this market. |
4
|
|
|
|
|
Semiconductor Products |
|
|
|
|
|
The transistor and associated integrated circuit have transformed the way people work, live and play, creating several multi-billion dollar industries that thrive through innovation, technology, and ultra-large scale integration of micro/nano circuitry. These industries provide components used in everyday appliances, including the more modern mobile phones and wireless internet devices. State-of-the-art microprocessors may contain in excess of a billion transistors comprised of components that have physical dimensions as small as 22 nanometers. |
|
|
|
|
|
In June 2009, we agreed to a supply agreement with Nanometrics, under which we supply certain interferometer sensors to Nanometrics for incorporation into the UniFire™ line of automated metrology systems. The UniFire product line, the in-line semiconductor systems we developed, is now being manufactured, sold and serviced through Nanometrics. The system is designed to help semiconductor and data storage customers control their high volume manufacturing process. |
|
|
|
|
|
Precision Positioning Systems |
|
|
The layers of circuit patterns must overlay each other to nanometer precision during the wafer lithography process. To achieve nanometer precision overlay, the silicon wafer must be repeatably positioned to one-tenth the overlay tolerance. Photolithography systems, mask and reticle writers, and yield improvement metrology tools rely on displacement measuring interferometers to provide precise feedback to control the position of the silicon wafer. Our Metrology Solutions segment’s ZMI™ 7700 series precision positioning feedback systems are designed primarily for photolithography systems. They are also used in a broad range of semiconductor metrology and back-end process tools. |
|
|
|
|
|
Printed Circuit Board Substrates |
|
|
Printed circuit substrates interface IC flip chip packages to printed circuit boards. These substrates make the circuit connection via arrays of miniature solder bumps, and balls and Zygo manufactures several tools to measure these bump and ball arrays for process control and yield improvement. Several products serve this market, including the Nano™ CSP2000 and Nano2 ™ series, providing high-throughput, fully-automated 100% 2D/3D inspection of C4 bumps for chip scale packaging (CSPs) strips to support high-volume manufacturing and process yields. |
|
|
|
|
|
Technology Development Projects |
|
|
Photolithography scanners image the electronic circuit pattern through a precision projection lens. The optical performance of the lenses required for next-generation photolithography scanners often exceeds the capabilities of commercially available measurement systems. Our expertise in optical interferometer technology, and the practical skills needed to apply this technology, make us well suited to deliver custom solutions to leading photolithography equipment suppliers. |
|
|
|
|
|
In the third quarter of fiscal 2010, we acquired Zemetrics, Inc. (“Zemetrics”), an Arizona-based manufacturer of optical metrology systems. The acquisition of Zemetrics provided us with additional innovative technology and complementary product portfolio that we believe will provide opportunities for future growth in several key markets, including data storage, high brightness light-emitting diode and consumer electronics. We believe that the addition of the product lines from Zemetrics will expand the opportunities for our existing products, as well as the acquired products, through exposure to new markets and applications. We also plan to leverage the acquired technology to bring more innovative and differentiated product solutions to market. |
|
|
|
|
|
Optical Systems Segment |
|
|
Zygo’s Optical Systems segment designs, develops and manufactures high precision optical components and electro-optical systems used in the semiconductor, defense, life-sciences and research markets. Our optical components and systems are manufactured to high levels of precision and are intended to meet the demands of both internal and external customers. The primary value we bring to the market place is the ability to meet exacting specifications from our customers in a volume production environment. Examples of our products include aspheric lenses, mirrors, objective assemblies, machined glass structures and windows used in applications ranging from semiconductor lithography to ophthalmic surgical devices to aerial reconnaissance. We provide products used across a broad spectral range including ultra-violet (“UV”), visible and mid-infrared that are fabricated from materials such as fused silica, sapphire, silicon, calcium fluoride and precision optical glasses. Representative programs and products include volume manufacturing of meter class laser fusion optics for the National Ignition Facility, development and manufacturing of Advanced Helmet Mounted Displays for military flight simulation and precision optics used in extreme UV semiconductor lithography equipment. |
5
|
|
|
|
|
Markets |
|
|
Defense/Aerospace |
|
|
|
|
|
Defense and aerospace companies use optical technology in a broad range of applications that are often deemed mission critical and, therefore, have become a major component of military spending. Examples include tactical information gathering through the use of fixed wing, rotary and space-based aerial reconnaissance, fire-control systems used for targeting or threat detection and navigation systems necessary for all-weather combat readiness. We manufacture a variety of defense-related products, including lenses, windows, freeform optics and assemblies. These products have been integrated on several prominent platforms, including the Joint Strike fighter, Predator and Global Hawk drones, F/A-18C Distributed Mission Training system and the F16 Internal FLIR Targeting System. In addition to traditional defense applications, we are a leading manufacturer of meter class optical components used in high energy laser fusion development for the United States Department of Energy nuclear stockpile governance and a similar program for the French Atomic Energy Commission. Considered two of the largest optical programs ever created, we have become a major provider within this application space. We have also delivered electro-optical systems used in high resolution surveillance and protection of civilian targets such as nuclear power reactors, airports and shipping ports. |
|
|
|
|
|
Life-sciences |
|
|
|
|
|
The life-sciences market is growing rapidly. Increased demand for high precision medical devices continues to be driven by an aging population and consumers’ desire to improve their quality of life. We address this demand with specialized design and assembly services tailored to producing high-precision research, diagnostic and surgical devices. Key application areas include ophthalmic, dental, dermatology and DNA analysis. Product manufacturing strengths include high performance objectives used in laser delivery and fluorescent imaging systems, integration of full systems utilizing light sources, optics and detectors, and stand alone medical devices built to customer specification. Examples of customer products include laser eye correction, dental 3D imaging and genomic analysis instruments. In addition, the group offers a variety of process control advantages considered critical to medical device customers. These include ISO 13485:2003 and FDA registration as a medical-device manufacturer. |
|
|
|
|
|
Semiconductor and Electronics |
|
|
|
|
|
Semiconductor lithography demands in many cases the ultimate in optical manufacturing technology. It is a critical driver for meeting the industry demands of Moore’s law. With over 20 years of experience in extreme ultraviolet lithography and proceeding nodes, we routinely participate in the advancement and deployment of new lithographic platforms. As a supplier to the world’s leading semiconductor lithography companies, we provide custom components and assemblies used in high precision stages, illumination optics and objectives. Our products are typically used in the manufacture of semiconductor chips for deployment in all types of computer-driven equipment. Key manufacturing strengths include high precision machining used in the production of reticle and wafer stages, advanced polishing methods such as ion beam figuring of off-axis mirrors and unique metrology necessary to meet specifications down to one nanometer in accuracy. In addition to semiconductor lithography, we also support customers involved in semiconductor metrology and electronics through the production of high precision objective assemblies and laser sub systems. These systems are often developed in collaboration with our customers who rely heavily on our optical engineering capabilities to achieve both performance and cost objectives. |
|
|
|
|
|
Manufacturing Technology and Processes |
|
|
|
|
|
Our strategic advantages in the market place derive heavily from the development of unique manufacturing technology and processes. Key areas of focus include deterministic polishing, high precision machining and grinding, coating, assembly and metrology. Within these areas we have developed highly refined processes and equipment for the manufacture of meter class plano windows and mirrors, aspheric and free-form lenses, complex ceramic machining up to one meter and large aperture coating. Given the unique nature of our offerings, much of the equipment used in our manufacturing has been developed or modified internally. Our ability to provide accurate metrology in the final inspection to the customer, as well as for in-process control are strategic to our success in manufacturing. In this regard, the Optical Systems segment works closely with the Metrology segment to produce unique metrology tools that improve the quality and yield of our products. |
6
Sales, Marketing and Service
We market our full range of products throughout the United States and in most foreign markets. Our revenues are largely generated through our direct worldwide sales force, as well as through independent agents and distributors. We have sales and service centers positioned closely to our major customers or concentrations and business opportunity throughout the Americas, Europe and Asia. We believe that our business relationships with the major customers in all of our key markets are generally favorable, and that we are in a good position to respond promptly to variations in customer requirements and technology trends.
We require our sales representatives to have technical expertise and a thorough understanding of the businesses of our customers and our prospective customers. In a typical sale process, one of our representatives will provide a potential customer with information about our products, including specifications and performance data, as well as a product demonstration using samples provided by the customer. The sales cycle for our systems typically ranges from three to twelve months, but can be longer for complex system sales or when our customers are evaluating new applications of our technology.
Our products are supported by a global service organization of factory trained technicians and engineers, and generally backed by a standard twelve month warranty. We also offer customers optional service contracts for our products of one year or more in duration after expiration of any warranty.
Competition
We participate in markets that are highly dynamic and globally competitive across all our divisions. Additionally, many of the markets for our products are subject to constant change, due largely to evolving customer needs. As we attempt to respond to this change, the competition landscape as well as the specific strategies of competitors likewise may change. Moreover, one or more of our competitors might achieve a technological advancement that could put us at a competitive disadvantage.
Although there are no firms that compete with us across our full range of product lines and services, we face competition in each business segment in domestic and foreign markets. Certain of our competitors have substantially greater resources than we do, or may be smaller regional producers with lower overhead costs and profit requirements, particularly in Asia. Our strategy is to offer technologically advanced products that are price competitive in our markets, and to link the product offerings with market knowledge and customer service. We believe this serves to differentiate our products in many markets. Due to the critical mass necessary to support our large installed base of systems, as well as the highly specialized nature of our products, we have experienced minimal competition in our service business.
Our overall focus is typically on niche and value-added segments where we can differentiate our products from our competition’s products, through technological and product value advantage. The following further discusses the competitive landscape in each of our strategic business segments.
|
|
|
|
|
Metrology Solutions Segment |
|
|
Our principal competitors for the sale of metrology products and services include Bruker Corporation, Ametek, Agilent, KLA-Tencor and 4D Technology. We believe the key competitive factors are performance, range of features, reliability, price and service. We believe that we are competitive with respect to each of these factors, although we have faced increasing pressure on purchase price due to aggressive pricing practices of competitors. Our ability to remain competitive depends in part upon our success in developing new and enhanced systems, leveraging our intellectual property and introducing these systems at competitive prices on a timely basis. Intense price competition in the sale of metrology products in the past has adversely affected our profit margins. |
|
|
|
|
|
Our Metrology Solutions segment offers products which we believe are leaders in most of the segments it serves, including semiconductor, flat panel displays, precision machining, research and optics. A key strategy in this segment is to continue to develop and produce precise 3D surface metrology products that are technology leaders in the markets where they participate, particularly as the need for more advanced application use is demanded, and where adoption and volume is continuously growing. On a regional basis, this segment participates in North America, Europe and Asia. It faces competition in each of these locations from a wide variety of companies, from very large multinational manufacturers to much smaller, regional companies. As with our other segment, this segment must address the continual threat of commoditization, particularly with respect to products that have matured in their life cycle. |
7
|
|
|
|
|
Optical Systems Segment |
|
|
Our Optical Systems segment offers precision optical products and integrated electro-optical systems that serve the critical needs of the military, defense, medical and semiconductor markets. We have a strong reputation and presence worldwide, particularly in North America and Europe. Our business also includes government contract and consulting work. We have multiple competitors across our served markets. We typically compete on price and delivery, as well as quality and service. Our experience in design and manufacture of complex optical systems design is a core competence, and we are committed to protecting our intellectual property and designs, particularly in regions where such laws are not as strictly enforced. We also strive to continuously differentiate our product offerings, to help avoid commoditization of certain products. Competitors include, but are not limited to, L-3 Tinsley, Exotic Electro-Optics, Sagem, JenOptik and Ratheon Elcan Optical Technologies. |
Research and Development
We maintain our position as a market leader in metrology and optics through continuous and focused investment in research and development of new technology, products and applications. Research and development activities constitute an important and vital part of our overall business strategy as the markets we serve are typically characterized by rapid technological changes and advances. Accordingly, the success of our strategy, depends in part on our ability to develop market-leading products and solutions, which is primarily driven by close relationships with our customers, together with efforts in research and development.
Through continual investment in research and development, we seek to expand our leadership position in metrology products and optical subsystems. In order to remain as a market leader in our core market segments, Zygo works with our customers to address their current needs, as well as their evolving requirements, to remain designed into their product lifecycle. In addition, as part of our development efforts, we focus on lowering the production costs of our products.
We hold over 450 active patents and have additional patent applications on file related to both business segments. The patents are of varying duration and provide some protection from competition. Although we vigorously defend our patents, we believe that our patents are most valuable when combined with our products, technology, competencies and customer-focused, value-added solutions. On occasion, we also engage in joint research and development projects with some of our customers and other parties. We also own a number of registered and unregistered trademarks and have acquired certain technology that we believe to be of importance to our business. We believe that continued enhancement, development, and commercialization of new and existing products and systems are essential to maintaining and improving our position in the markets in which we operate.
Patents and Other Intellectual Property
Our success and ability to compete depend substantially on our technology. We have been developing a portfolio of intellectual property for over 30 years, and we rely on a combination of patent, copyright, trademark, trade secret laws, and license agreements to establish and protect our proprietary rights for our products.
Since we introduced the first optical interferometer in 1972, we have had over 500 United States and foreign patents issued, of which over 450 are currently active. We have over 200 United States and foreign patent applications pending. In addition, we have a number of registered and unregistered trademarks. While we rely on patent, copyright, trademark, and trade secret laws to protect our technology, we also believe that the technological and creative skills of our personnel, new product developments, frequent product enhancements, and reliable product maintenance are essential to establishing and maintaining a technology leadership position. We do not expect expirations in the near future related to our active patents to have a material effect on our business.
|
|
|
BACKLOG AND BOOKINGS |
|
Backlog at June 30, 2011 was $62.0 million, an increase of $17.1 million compared with $44.9 million at June 30, 2010. The fiscal 2011 year-end backlog consisted of $31.4 million, or 51%, in the Metrology Solutions segment and $30.6 million, or 49%, in the Optical Systems segment. Bookings for the fiscal year ended June 30, 2011 totaled $167.2 million and consisted of $103.0 million, or 62%, in the Metrology Solutions segment and $64.2 million, or 38%, in the Optical Systems segment. |
8
|
|
|
MARKETING AND SALES |
|
Our sales and marketing strategy is to establish and/or solidify strategic relationships with leading OEMs and end-users in targeted sectors within our markets. The selling process for our products is performed through our worldwide sales organization operating out of regional sales and service offices in California, China, Connecticut, Germany, Japan, Singapore and Taiwan. Supporting this core sales team are business development, marketing and engineering specialists representing our various optics and metrology units in Connecticut, Arizona, California, and Canada. Product promotion is through trade shows, printed and e-business advertising and industry technical organizations. |
The following table sets forth the percentage of our total revenue by region (based on shipping destination, including sales delivered through distributors) during the past three years:
|
|
|
|
|
|
|
|
|
|
|
|
|
|
|
Fiscal Year Ended June 30, |
|
|||||||
|
|
|
|
|
|||||||
|
|
|
2011 |
|
2010 |
|
2009 |
|
|||
|
|
|
|
|
|
|
|
|
|||
|
Americas |
|
|
54 |
% |
|
54 |
% |
|
48 |
% |
|
|
|
|
|
|
|
|
|
|
|
|
|
Far East: |
|
|
|
|
|
|
|
|
|
|
|
Japan |
|
|
21 |
% |
|
18 |
% |
|
23 |
% |
|
Pacific Rim |
|
|
13 |
% |
|
15 |
% |
|
17 |
% |
|
|
|
|
|
|
|
|
|
|
|
|
|
Total Far East |
|
|
34 |
% |
|
33 |
% |
|
40 |
% |
|
|
|
|
|
|
|
|
|
|
|
|
|
Europe |
|
|
12 |
% |
|
13 |
% |
|
12 |
% |
|
|
|
|
|
|
|
|
|
|
|
|
|
Total |
|
|
100 |
% |
|
100 |
% |
|
100 |
% |
|
|
|
|
|
|
|
|
|
|
|
|
Customer service is an essential part of our business, since product up-time is critical given its effect on our customers’ production efficiency. As of June 30, 2011, our global sales customer support and service organization consisted of 77 people skilled in sales, marketing, optical and electro component repair, software, application and system integration, diagnostics and problem-solving capabilities.
|
|
|
MANUFACTURING, RAW MATERIALS AND SOURCES OF SUPPLY |
|
Our principal manufacturing activities are conducted at our facilities in Middlefield, Connecticut; Richmond, California; and Tucson, Arizona. We also perform manufacturing activities in our Costa Mesa, California; Canada; and China facilities. |
We maintain an advanced optical components manufacturing facility in Middlefield, Connecticut, specializing in the fabrication, polishing and coating of plano, or flat, optics for sales to third parties, as well as the manufacture of a wide variety of optics that are used in our metrology products. Our manufacturing activities for metrology products consist primarily of assembling and testing components and sub-assemblies supplied by us and third-party vendors, and then integrating these components and sub-assemblies into our finished products.
Our optical assembly manufacturing activities are conducted in our Costa Mesa, California; Richmond, California; and Tucson, Arizona facilities. We integrate our optics, optics from third party vendors and mechanical sub-systems utilizing our metrology in these facilities.
Certain components and sub-assemblies incorporated into our systems are obtained from a limited group of suppliers. We routinely monitor limited-source supply parts, and we endeavor to ensure that adequate inventory is available to maintain manufacturing schedules should the supply of any part be interrupted. Although we seek to reduce our dependence on limited source suppliers, we have not qualified a second source for some of these products, and the partial or complete loss of certain of these sources could have a negative impact on our results of operations and damage customer relationships.
9
|
|
|
AVAILABLE INFORMATION |
|
We make available free of charge through our website, www.zygo.com, our annual reports on Form 10-K, quarterly reports on Form 10-Q, current reports on Form 8-K, proxy statements and all amendments to those reports as soon as reasonably practicable after such material is electronically filed with the Securities and Exchange Commission (“SEC”). These reports may also be obtained without charge by contacting Investor Relations, Zygo Corporation, Corporate Headquarters, Laurel Brook Road, Middlefield, Connecticut 06455-1291, phone: (860) 347-8506. Our internet website and the information contained therein or incorporated therein are not intended to be incorporated into this Annual Report on Form 10-K. In addition, the public may read and copy any materials we file with the SEC at its Public Reference Room at 100 F Street, NE, Room 1580, Washington, DC 20549 or may obtain information by calling the SEC at 800-SEC-0330. Moreover, the SEC maintains an internet website that contains reports, proxy and information statements, or other information regarding reports that we file electronically with them at http://www.sec.gov. |
|
|
|
EMPLOYEES |
|
At June 30, 2011, we employed 537 people and 16 temporary and independent contractors worldwide. We employed 266 in manufacturing, 127 in research and development, 77 in sales and marketing and 67 in management and administration. Our employees are not represented by a labor union or a collective bargaining agreement. We regard our employee relations as good to excellent. |
|
|
|
Chris L. Koliopoulos – age 58 – Chairman, President and Chief Executive Officer |
|
Dr. Koliopoulos joined our Company in January 2010 and serves as our Chairman, President and Chief Executive Officer. Previously he has served as President and CEO of ADE Corporation from 2002 to 2006, and as a private investor, director and advisor to Zemetrics, Inc. from 2007 to 2010. |
|
|
|
John P. Jordan – age 65 – Vice President, Chief Financial Officer and Treasurer |
|
Mr. Jordan joined our Company in February 2011 and serves as our Vice President, Chief Financial Officer and Treasurer. Prior to joining Zygo, Mr. Jordan spent four years with Baldwin Technology Company, Inc., as Vice President, Chief Financial Officer and Treasurer. |
|
|
|
John M. Stack – age 46 - President, Optical Systems Division |
|
Mr. Stack joined our Company in November 2006 and has served as President of the Optical Systems Division since December 2006. Previously he spent 18 years with Edmund Optics Inc., a supplier of optics and optical components, where his most recent position was President and Chief Operating Officer from 2001 to 2006. Prior to that Mr. Stack held several management positions at Edmund Optics Inc. including Executive Vice President, Director of Engineering and Application Engineering Manager. |
|
|
|
Douglas J. Eccleston – age 62 – Senior Vice President, Worldwide Operations |
|
Mr. Eccelston has served as Senior Vice President, Worldwide Operations since July 2009, Senior Vice President, Precision Positioning Systems from February 2007 to July 2009 and as Vice President, Precision Positioning Systems from March 2003 to January 2007. From 1977 to 2002, he held various management positions with Corning Incorporated, including most recently as a Business General Manager for the Photonic Technologies division. |
|
|
|
John A. Tomich - age 53 - Vice President, General Counsel and Secretary |
|
Mr. Tomich joined our Company in August 2010 as Vice President and General Counsel. In November 2010, Mr. Tomich was also appointed the Corporate Secretary of the Company. Prior to joining Zygo, Mr. Tomich was Vice President, General Counsel and Secretary for Doctors Research Group, Inc., from 2008 to 2010, and Assistant Clinical Professor of Law and Supervising Patent Attorney for the University of Connecticut, School of Law from 2006 to 2008. Prior to teaching, Mr. Tomich was General Counsel and Secretary for CUNO Incorporated. |
|
|
|
David F. Basila - age 52 - Vice President, Business Development |
|
Mr. Basila has served as Vice President of Business Development since February 2010. Previously he served as Vice President of ADE Corporation from 2002 to 2006, and as a private investor and director of Zemetrics, Inc. from 2007 to 2010. |
|
|
|
William H. Bacon – age 61 – Vice President, Corporate Quality and Support Services |
|
Mr. Bacon has served as Vice President, Corporate Quality and Support Services since March 2003. Previously, he served as our Vice President, Manufacturing from April 2002 to March 2003, Vice President, Metrology Manufacturing from April 2000 to April 2002 and Vice President, Corporate Quality from January 1996 to April 2000. From November 1993 to January 1996, Mr. Bacon was Director of Total Quality and also served as Manager of Instrument Manufacturing from June 1987 to November 1993. |
|
|
|
Under the by-laws, executive officers serve for a term of one year and until their successors are chosen and qualified unless earlier removed. |
10
|
|
|
|
|
We are subject to numerous known and unknown risks, many of which are described below and elsewhere in this Annual Report. Any of the events described below could have a material adverse effect on our business, financial condition and results of operations. Additional risks and uncertainties that we are not aware of, or that we currently deem to be immaterial, could also impact our business and results of operations. |
|
|
|
General economic conditions and the related deterioration in the global business environment could have a material adverse effect on our business, operating results and financial condition. |
|
Global consumer confidence has eroded amid concerns over, among other things, declining asset values, inflation, volatility in energy costs, geopolitical issues, the availability and cost of credit, high unemployment and the stability and solvency of financial institutions, financial markets, businesses and sovereign nations. These concerns have slowed global economic growth and have resulted in recessions in numerous countries, including many of those in North America, Europe and Asia, where the Company does substantially all of its business. In addition, the on-going European debt crisis and the recent downgrade of the United States’ long term sovereign credit rating have negatively affected the financial markets and could continue to weigh on the global business environment. As these economic conditions continue to persist, or if they worsen, a number of negative effects on our business could result, including customers or potential customers reducing or delaying orders, the insolvency of key suppliers which could result in production delays, the inability of customers to obtain credit and the insolvency of one or more customers, certain of which we have already experienced. Any of these effects could impact our ability to effectively manage inventory levels and collect receivables, create unabsorbed costs due to lower net revenues and ultimately decrease our net revenues and profitability, as well as cause us to write-down certain of our assets. |
|
|
|
We could suffer significant business interruptions. |
|
Our customers, suppliers and operations may be vulnerable to interruption by natural disasters such as earthquakes, tsunamis, typhoons, or floods, or other disasters such as fires, explosions, acts of terrorism or war, disease or failures of our management information or other systems. If a business interruption occurs, our business could be materially and adversely affected. On March 11, 2011, an earthquake occurred near the northeastern coast of Japan creating a tsunami that caused extensive damage. In August 2011, a hurricane produced large scale power outages throughout major portions of the East Coast of the United States. While we do not anticipate that these events will have a material impact on the Company’s consolidated financial statements or continuing operations, we cannot predict the long-term consequences of those disasters on our operations. |
|
|
|
We are subject to environmental laws and regulations and may have liabilities arising from environmental matters. |
|
We are subject to a variety of environmental regulations relating to the use, storage, discharge and disposal of hazardous chemicals used during our manufacturing processes. Any failure by us to comply with applicable regulations could subject us to future liabilities or the suspension of production. We are aware of certain levels of contamination on our property which are below reportable levels. In addition, we are aware of certain contamination on an adjacent property that we formerly owned. The future effect of environmental matters, including potential liabilities, is often difficult to estimate. We are unable to determine or reasonably estimate the amount of cost, if any, that we might incur or for which we may potentially be responsible to remediate the situation or for damages which may have resulted or result from the situation. In addition, environmental regulations could restrict our ability to expand our facilities or could require us to acquire costly equipment or to incur other significant expenses to comply with such regulations. |
|
|
|
We are dependent on the semiconductor industry which, as a whole, is volatile. |
|
Our business is somewhat dependent on capital expenditures and component requirements for manufacturers in the semiconductor industry. This industry is cyclical and has historically experienced periods of oversupply, resulting in significantly reduced demand for capital equipment, including the products manufactured and marketed by us. For the foreseeable future, our operations will continue to be dependent on the capital expenditures in this industry, which in turn is largely dependent on the market demand in the semiconductor markets. |
|
|
|
Recent changes to senior management could affect the operation of the Company. |
|
In January 2010, we announced the appointment of Dr. Koliopoulos as our President and Chief Executive Officer. In February 2011, we announced the appointment of John P. Jordan as our Vice President, Chief Financial Officer and Treasurer. The changes in senior management could adversely impact the Company due to a lack of historical knowledge and familiarity with all aspects of the Company’s business and operations by new senior management. |
11
|
|
|
We have been dependent on sales to one large customer; the loss of this customer or expected near-term reduction in bookings from this customer has and would materially affect our revenues and profitability. |
|
During fiscal 2011, 2010, and 2009, sales to Canon Inc., our largest customer in each of those periods, accounted for 13%, 9%, and 14% of our net revenues, respectively. We expect that sales to Canon will continue to represent a significant percentage of our net revenues for the near future. Canon is an original investor in our Company, the owner at June 30, 2011 of approximately 7% of our outstanding shares of common stock, and is a distributor of certain of our products in the Japanese market. A reduction or delay in orders from this customer, including reductions or delays due to market, economic, or competitive conditions in the industries which we or our customer serves, could have a material adverse effect upon our results of operations. Our customers, including Canon, generally do not enter into long-term agreements obligating them to purchase our products. |
|
|
|
Our substantial international revenues are subject to risk. |
|
We sell our products internationally, primarily to customers in Japan and throughout the Pacific Rim. Net revenues to customers outside the United States accounted for approximately 46%, 46% and 52% of our net revenues in each of the fiscal years ended June 30, 2011, 2010 and 2009, respectively, and are expected to continue to account for a substantial percentage of our net revenues. |
|
|
|
International revenues and foreign operations are subject to inherent risks. These risks include the economic conditions in various foreign countries and their trading partners, political instability, longer payment cycles, potential difficulty in accounts receivable collection, compliance with foreign laws, changes in regulatory requirements, tariffs or other barriers, difficulties in obtaining export licenses, staffing and managing foreign operations, exposure to currency exchange fluctuations, transportation delays and potentially adverse tax consequences. |
|
|
|
Our revenues and costs are negotiated and paid primarily in U.S. dollars. However, changes in the values of foreign currencies relative to the value of the U.S. dollar can render our products comparatively more expensive to the extent locally produced alternative products are available. Such conditions could negatively affect international revenues of our products and foreign operations, as would changes in the general economic conditions in those markets. For our revenues that are recorded in local currency, we are exposed to foreign exchange fluctuations from the time customers are invoiced in local currency until collection occurs. For fiscal 2011, approximately 23% of our revenues were denominated in foreign currencies. We hedge certain intercompany transactions by entering into forward contracts to reduce the impact of adverse fluctuations on earnings associated with foreign currency exchange rate changes. We do not enter into any derivative transactions for speculative purposes nor do we designate such hedges for hedge accounting purposes. These contracts are entered into for periods consistent with the currency transaction exposures, generally three to nine months. Any gains and losses on the fair value of these contracts are expected to be largely offset by gains and losses on the underlying transactions. There can be no assurance that risks inherent in international revenues and foreign operations will not have a material adverse effect on our results of operations in the future. |
|
|
|
Acquisitions may entail certain operational and financial risks. |
|
Our growth strategy includes expanding our products and services, and we may seek acquisitions or make internal investments to strategically expand our business. We regularly review potential acquisitions of businesses, technologies, or products complementary to our business and periodically engage in discussions regarding such possible acquisitions. Acquisitions involve numerous risks, including some or all of the following: substantial cash expenditures and capital investments; potentially dilutive issuance of equity securities; incurrence of debt and contingent liabilities; amortization of certain intangible assets; difficulties in assimilating the operations and products of the acquired companies; diverting management’s attention away from other business concerns; risks of entering markets in which we have limited or no direct experience; the inability to manage the growth expected for various acquisitions; potential loss of key employees of the acquired companies in the process of integrating personnel with disparate business backgrounds; and combining different corporate cultures. |
|
|
|
We cannot provide assurance that any acquisition, including the acquisitions of Zemetrics, Solvision, Inc. and the assets of ASML Inc.’s Richmond, California operation, Zemetrics and Solvision, Inc. will result in long-term benefits to us, or that our management will be able to effectively manage the acquired businesses. We may also incorrectly judge the value or worth of an acquired company or business or of a line of business to which we devote internal resources and funding. We have previously disposed of or divested several companies or lines of business that previously were acquired by us or in which we internally invested, at a significant net loss to us. |
12
|
|
|
Our quarterly operating results fluctuate and may continue to fluctuate in the future. |
|
Our quarterly and annual operating results have varied in the past and may vary significantly in the future depending on factors such as: budgeting cycles of our customers; the size, timing and recognition of revenue from significant orders; increased competition; our ability to develop innovative products; the timing of new product releases by us or our competitors; market acceptance of our products; changes in our and our competitors’ pricing policies; changes in operating expenses and personnel changes; the effect of our acquisitions and consequent integration; changes in our business strategy; and general economic factors. |
|
|
|
Due to these and other factors, we believe that quarter-to-quarter comparisons of our operating results may not be meaningful. Our results for one quarter should not be relied upon as an indication of our future performance. In future periods, our operating results may be below the expectations of public market analysts or investors. If this occurs, the price of our common stock would likely decrease. Current conditions in the domestic and global economies are extremely uncertain. As a result, it is difficult to estimate the level of growth for the economy as a whole or of capital expenditures in the semiconductor and industrial markets. Because various components of our budgeting and forecasting are dependent on estimates of spending within these markets, the prevailing economic uncertainty renders estimates of future revenue and expenses more difficult to make. |
|
|
|
Our scheduled backlog may not result in future revenues. |
|
We schedule the production of our systems based in part upon order backlog. Due to possible customer changes in delivery schedules and cancellations of bookings, our backlog at any particular date is not necessarily indicative of actual revenues for any succeeding period. There can be no assurance that amounts included in our backlog will ultimately result in future revenues. We have experienced push-outs and cancellations in the semiconductor capital equipment and electro-optics sectors. A reduction in backlog during any particular period, or the failure of our backlog to result in future revenues could adversely affect our results of operations. |
|
|
|
Our lengthy revenue cycle could affect our manufacturing schedule and cause us to incur expenses without realizing sales. |
|
Our lengthy and variable qualification and sales cycle makes it difficult to predict the timing of a sale or whether a sale will be made, which may cause us to have excess manufacturing capacity or inventory and negatively affect our operating results. As is typical in the industry, our customers generally expend significant efforts in evaluating and qualifying our products and manufacturing process. This evaluation and qualification process frequently results in a lengthy sales cycle, typically ranging from three to six months and sometimes longer. While our customers are evaluating our products and before they place an order with us, we may incur substantial sales, marketing and research and development expenses, expend significant management efforts, increase manufacturing capacity and order long-lead-time supplies prior to receiving a booking. Even after this evaluation process, it is possible that a potential customer will not purchase our products. In addition, product purchases are frequently subject to unplanned processing and other delays, particularly with respect to larger customers for which our products represent a very small percentage of their overall purchasing activity. |
|
|
|
If we increase capacity and order supplies in anticipation of an order that does not materialize, our gross margins may be negatively impacted, and we may have to carry or write off excess inventory. Even if we receive an order, the additional manufacturing capacity that we add to service the customer’s requirements may be underutilized in a subsequent quarter. Either situation could cause our results of operations to be adversely affected. Our long sales cycles also may cause our revenues and operating results to vary significantly and unexpectedly from quarter to quarter and make us more susceptible to the effects of general economic downturns. |
|
|
|
We face risks associated with manufacturing forecasts. |
|
If we fail to predict our manufacturing requirements accurately, we could incur additional costs or experience manufacturing delays, which could cause us to lose orders or customers and result in lower net revenues. We currently use a rolling 12-month forecast based primarily on our anticipated product orders and our product order history to help determine our requirements for components and materials. It is very important that we accurately predict both the demand for our products and the lead-time required to obtain the necessary components and raw materials. Lead times for materials and components that we order vary significantly and depend on factors such as the specific supplier, the size of the order, contract terms and demand for each component at a given time. If we underestimate our requirements, we may have inadequate manufacturing capacity or inventory, which could interrupt manufacturing of our products and result in delays in shipments and net revenues. If we overestimate our requirements, we could have excess inventory of parts. In addition, delays in the manufacturing of our products could cause us to lose orders or customers. |
13
|
|
|
Our stock price may fluctuate significantly due to a variety of risks. |
|
We believe that factors such as the announcement of new products or technologies by us or our competitors, market conditions in the semiconductor and industrial markets and quarterly fluctuations in financial results can be expected to cause the market price of our common stock to vary substantially. Further, our net revenues or results of operations in future quarters may be below the expectations of public market securities analysts and investors. In such event, the price of our common stock would likely decline. In addition, the stock market has historically experienced price and volume fluctuations that have particularly affected the market prices for many high technology companies; these variations have often been unrelated to the operating performance of such companies. The market volatility may adversely affect the market price of shares of our common stock. Furthermore, our common stock trading price may be more susceptible to market fluctuations due to the relatively small public float and trading volume of our stock and our dependence on a limited number of industries. |
|
|
|
We operate in a highly competitive industry. |
|
We face competition from a number of companies in all our markets, many of which have greater manufacturing and marketing capabilities and greater financial, technological and personnel resources. In addition, we compete with the internal development efforts of our current and prospective customers, some of which may attempt to become vertically integrated. Our competitors can be expected to continue to improve the design and performance of their products and to introduce new products with competitive price/performance characteristics. Competitive pressures may necessitate price reductions, which can adversely affect results of operations. Although we believe that we have certain technical and other advantages over some of our competitors, maintaining such advantages will require a continued high level of investment by our Company in research and development and sales, marketing and service. There can be no assurance that we will have sufficient resources to continue to make such investments or that we will be able to make the technological advances necessary to maintain such competitive advantages. In addition, due to historical relationships and possible prior investments by potential customers in competitive product lines, it may be more difficult for us to realize certain of our growth strategies and initiatives. There can be no assurance that the basis of competition in the industries in which we compete will not shift. |
|
|
|
Our inability to anticipate and keep pace with rapidly changing technological developments in the markets in which we operate could have a material adverse effect on our business. |
|
The market for our products is characterized by rapidly changing technology. Our future success will continue to depend upon our ability to enhance our current products and to develop and introduce new products that keep pace with technological developments and evolving industry standards, respond to changes in customer requirements and achieve market acceptance. The development of new technologically advanced products is a complex and uncertain process requiring high levels of innovation, as well as the accurate anticipation of technological and market trends. With continuing advances in technology, potential product advancements require an increasing allocation of resources, including potentially more resources than we then would have available. |
|
|
|
We commit significant financial and personnel resources on a continuous basis to redesign and enhance our instruments, systems and components and upgrade the proprietary software technology incorporated in our products. Any failure to anticipate or respond adequately to technological developments and customer requirements, or any significant delays in product development or introduction, could have a material adverse effect on our business and impact our relationships with customers. This could have an impact on customers’ willingness to share proprietary information about their requirements and participate in collaborative efforts with us. There can be no assurance that our customers will continue to provide us with timely access to such information, that we will be successful in developing and marketing new products and services or product and service enhancements on a timely basis, or respond effectively to technological changes or new product announcements by others. In addition, there can be no assurance the new products and services or product enhancements, if any, which we developed will achieve market acceptance. |
|
|
|
We may be unable to enforce or defend our ownership and use of proprietary technology. |
|
Our success is heavily dependent upon our proprietary technology. There can be no assurance that the steps we take to protect our proprietary technology will be adequate to prevent misappropriation of our technology by third parties or will be adequate under the laws of some foreign countries; those laws may not protect our proprietary rights to the same extent as do laws of the United States. We have been experiencing an increased level of revenue in China and other foreign countries which historically have created concerns for various companies. In addition, the possibility remains that others will “reverse engineer” our products in order to determine their method of operation and introduce competing products, or that others will independently develop competing technology. Any such circumstances could have a material adverse effect on our results of operations. |
14
|
|
|
Our business depends on management and technical personnel who are in great demand. |
|
Our success depends in large part upon the continued services of many of our highly skilled personnel involved in management, research, development and engineering, sales and marketing, manufacturing and support and upon our ability to attract and retain additional highly qualified employees. Our employees may voluntarily terminate their employment with us at any time. At times, competition for these individuals from a variety of employers, including our competitors and companies in computer or technology-related industries, is intense. We cannot provide assurance that we will be able to retain our existing personnel or attract and retain additional personnel. |
|
|
|
We are exposed to significant delays and additional costs if we do not receive adequate or timely supplies of raw materials and other supplies upon which we depend. |
|
We are dependent on suppliers for raw materials and various electrical, mechanical and optical supplies. Although we enter, either directly or through our contract manufacturers, into purchase orders with our suppliers based on our forecasts, we do not have any guaranteed supply arrangements with these suppliers. Moreover, as our demand for supplies increases, we may not be able to obtain these supplies in a timely manner. If any relationship with a key supplier is terminated or if a supplier fails or is unable to provide reliable services or equipment and we are unable to reach suitable alternative solutions quickly, we may experience significant delays and additional costs in the manufacture of our products. If our key suppliers cease manufacturing the supplies we require, if their manufacturing operations are interrupted for any significant period of time, or if they are unable or unwilling to supply us for any other reason, including capacity constraints, then we may be at least temporarily unable to obtain these supplies, thus exposing us to significant delays and additional costs. Currently there are only a limited number of companies that are capable of supplying optical materials in the quantity and of the quality we require. Although we seek to reduce our dependence on limited source suppliers, we have not qualified a second source for some of these products, and the partial or complete loss of certain of these sources could have a negative impact on our results of operations and damage customer relationships. |
|
|
|
Our products may contain defects that are undetected until after our products are installed, which may lead to a loss of reputation and customers. |
|
Our products are deployed in large and complex systems and may contain defects that are not detected until after our products have been installed, which could damage our reputation and cause us to lose customers. We design some of our products for deployment in large and complex optical networks. Because of the nature of these products, they can only be fully tested for reliability when deployed in networks for long periods of time. Our customers may discover defects in our products only after they have been fully deployed and operated under peak stress conditions. In addition, our products are combined with products from other vendors. As a result, should problems occur, it could be difficult to identify the source of the problem. These conditions increase the risk that we could experience, among other things: loss of customers; damage to our brand reputation; failure to attract new customers or achieve market acceptance; diversion of development and engineering resources; and legal actions by our customers. The occurrence of any one or more of the foregoing factors could cause us to experience losses, incur liabilities and cause our net revenues to decline. |
|
|
|
|
|
We have received no written comments regarding our periodic or current reports from the staff of the SEC that were issued 180 days or more preceding the end of our fiscal year 2011 that remain unresolved. |
15
We own our principal manufacturing facility and corporate headquarters, which is located on Laurel Brook Road in Middlefield, Connecticut. This facility consists of one 153,500-square-foot building on approximately 13 acres. As part of the acquisition of substantially all of the assets of ASML’s Richmond operation we acquired a 55,300 square-foot manufacturing facility. The following table sets forth information with respect to our facilities which are used by both of our operating segments, except as identified otherwise below:
|
|
|
|
|
|
|
|
|
|
|
|
|
|
|
Square Footage |
|
Owned / Leased |
|
|||||
|
|
|
|
|
|
||||||
|
Operation/Location |
|
Manufacturing |
|
Total |
|
|
||||
|
|
|
|
|
|
|
|
|
|||
|
Corporate Headquarters, Eastern Regional Sales Office and Metrology and Optics Manufacturing |
|
|
|
|
|
|
|
|
|
|
|
Middlefield, Connecticut |
|
|
89,000 |
|
|
153,500 |
|
|
Owned |
|
|
|
||||||||||
|
Zygo Extreme Precision Optics Group |
|
|
|
|
|
|
|
|
|
|
|
Richmond, California |
|
|
44,300 |
|
|
55,300 |
|
|
Owned |
|
|
|
||||||||||
|
Zygo - Optical Systems |
|
|
|
|
|
|
|
|
|
|
|
Tucson, Arizona |
|
|
14,560 |
|
|
22,560 |
|
|
Leased - 08/31/12 |
|
|
|
||||||||||
|
Zygo Lamda |
|
|
|
|
|
|
|
|
|
|
|
China |
|
|
3,552 |
|
|
12,206 |
|
|
Leased - 09/16/12 |
|
|
|
||||||||||
|
Zygo Canada, Inc. |
|
|
|
|
|
|
|
|
|
|
|
Canada |
|
|
2,447 |
|
|
6,851 |
|
|
Leased - 07/31/13 |
|
|
|
||||||||||
|
Zygo - Optical Systems |
|
|
|
|
|
|
|
|
|
|
|
Costa Mesa, California |
|
|
0 |
|
|
13,714 |
|
|
Leased - 4/30/12 |
|
|
|
||||||||||
|
Western Regional Sales Office and R&D Center |
|
|
|
|
|
|
|
|
|
|
|
Fremont, California |
|
|
0 |
|
|
5,975 |
|
|
Leased - 02/01/12 |
|
|
|
||||||||||
|
Semiconductor Process Metrology Office |
|
|
|
|
|
|
|
|
|
|
|
Hillsboro, Oregon |
|
|
0 |
|
|
6,410 |
|
|
Leased - 12/31/12 |
|
|
|
||||||||||
|
Zygo - Laser Technology Metrology (R&D) |
|
|
|
|
|
|
|
|
|
|
|
Watsonville, California |
|
|
0 |
|
|
1,452 |
|
|
Leased - 03/31/13 |
|
|
|
||||||||||
|
Zygo PTE Ltd |
|
|
|
|
|
|
|
|
|
|
|
Singapore |
|
|
0 |
|
|
2,174 |
|
|
Leased - 12/31/12 |
|
|
|
||||||||||
|
Zygo Taiwan |
|
|
|
|
|
|
|
|
|
|
|
Sales and Service Offices |
|
|
0 |
|
|
2,023 |
|
|
Leased - 04/30/12 |
|
|
|
||||||||||
|
ZygoLOT |
|
|
|
|
|
|
|
|
|
|
|
Germany |
|
|
0 |
|
|
3,702 |
|
|
Leased - 10/01/11 |
|
|
|
||||||||||
|
Zygo KK |
|
|
|
|
|
|
|
|
|
|
|
Japan |
|
|
0 |
|
|
1,705 |
|
|
Leased - 07/31/11 |
|
|
Demo Room |
|
|
0 |
|
|
500 |
|
|
Leased - 03/31/13 |
|
|
|
|
|
|
|
|
|
|
|
|
|
|
|
|
|
|
|
|
|
|
|
|
|
|
Total |
|
|
153,859 |
|
|
288,072 |
|
|
|
|
|
|
|
|
|
|
|
|
|
|
|
|
From time to time, we are subject to certain legal proceedings and claims that arise in the normal course of our business. In the opinion of management, we are not party to any litigation that we believe could have a material effect on our financial condition, results of operations or liquidity.
16
Item 5. Market for the Registrant’s Common Equity, Related Stockholder Matters and Issuer Purchases of Equity Securities
Our shares of common stock are traded over-the-counter and are quoted on the NASDAQ/National Market under the symbol “ZIGO.” The following table provides information about the high and low sales prices of the Company’s common stock by quarter for fiscal 2011 and 2010.
|
|
|
|
|
|
|
|
|
|
|
|
|
|
|
|
|
|
Fiscal Year Ended June 30, 2011 |
|
Fiscal Year Ended June 30, 2010 |
|
||||||||
|
|
|
|
|
|
|
||||||||
|
|
|
High |
|
Low |
|
High |
|
Low |
|
||||
|
|
|
|
|
|
|
|
|
|
|
||||
|
First quarter |
|
$ |
9.88 |
|
$ |
7.10 |
|
$ |
7.44 |
|
$ |
4.69 |
|
|
Second quarter |
|
$ |
12.95 |
|
$ |
9.47 |
|
$ |
7.82 |
|
$ |
6.35 |
|
|
Third quarter |
|
$ |
16.20 |
|
$ |
10.38 |
|
$ |
10.88 |
|
$ |
7.22 |
|
|
Fourth quarter |
|
$ |
14.95 |
|
$ |
11.05 |
|
$ |
10.00 |
|
$ |
6.56 |
|
These over-the-counter market quotations reflect inter-dealer prices, without retail mark-up, mark-down or commission and may not necessarily represent actual transactions.
The number of record holders of our common stock at August 26, 2011 was 411. Our closing stock price as of June 30, 2011 was $13.22.
We have never declared or paid a cash dividend on our capital stock and do not anticipate declaring or paying any cash dividends in the foreseeable future.
In August 2007, our Board of Directors authorized the repurchase of up to $25.0 million of our outstanding common stock. As of June 30, 2011, we repurchased outstanding common shares having an aggregate market value of $20.0 million (determined at the time of their respective repurchases). Repurchases occur from time to time as market conditions warrant through transactions in the open market. The share repurchases are effected pursuant to a plan in conformity with Rule 10b5-1 under the Securities Exchange Act of 1934. This rule allows public companies to adopt written, pre-arranged stock trading plans when they do not have material, non-public information in their possession. The adoption of this stock trading plan allows us to repurchase our shares during periods when we otherwise might be prevented from doing so under insider trading laws or because of self-imposed trading blackout periods. There were no repurchases under this stock trading plan in fiscal 2011, 2010 or 2009.
In January 2010, the Company entered into an agreement to purchase all of the outstanding stock and to retire the outstanding shareholder notes of Zemetrics, Inc., an Arizona corporation (“Zemetrics”), in exchange for 361,217 unregistered shares of the Company’s common stock.
We also at times grant restricted stock awards. These awards generally allow recipients to sell a portion of the stock award back to us, in order to cover tax liabilities resulting from the vesting of the award.
Common stock repurchases under our authorized purchase plan and restricted stock repurchases in connection with the surrender of shares to cover taxes upon vesting in each quarter of fiscal 2011 were as follows:
|
|
|
|
|
|
|
|
|
|
|
|
|
|
|
|
Period |
|
Total number of |
|
Average price |
|
Total number of |
|
Aproximate dollar |
|
||||
|
|
|
|
|
|
|
|
|
|
|
||||
|
|
|
|
|
|
|
|
|
|
|
|
|
|
|
|
July 1, 2010 - September 30, 2010 |
|
|
32,140 |
|
$ |
7.49 |
|
|
— |
|
$ |
5.0 |
|
|
October 1, 2010 - December 31, 2010 |
|
|
3,713 |
|
$ |
11.12 |
|
|
— |
|
$ |
5.0 |
|
|
January 1, 2011 - March 31, 2011 |
|
|
— |
|
$ |
0.00 |
|
|
— |
|
$ |
5.0 |
|
|
April 1, 2011 - June 30, 2011 |
|
|
3,142 |
|
$ |
14.30 |
|
|
— |
|
$ |
5.0 |
|
17
Common stock repurchases under our authorized purchase plan and restricted stock repurchases in connection with the surrender of shares to cover taxes upon vesting in the fourth quarter of fiscal year 2011 were as follows:
|
|
|
|
|
|
|
|
|
|
|
|
|
|
|
|
Period |
|
Total number of |
|
Average price |
|
Total number of |
|
Approximate dollar |
|
||||
|
|
|
|
|
|
|
|
|
|
|
||||
|
|
|
|
|
|
|
|
|
|
|
||||
|
April 1, 2011 - April 30, 2011 |
|
|
2,790 |
|
$ |
14.50 |
|
|
— |
|
$ |
5.0 |
|
|
May 1, 2011 - May 31, 2011 |
|
|
352 |
|
$ |
12.73 |
|
|
— |
|
$ |
5.0 |
|
|
June 1, 2011 - June 30, 2011 |
|
|
— |
|
|
— |
|
|
— |
|
$ |
5.0 |
|
PERFORMANCE GRAPH
The Stock Price Performance graph below and related information shall not be deemed solicitating material or to be”filed” with the Securities and Exchange Commission, nor shall such information be incorporated by reference into any filing under the Securities Act of 1933, as amended, or under the Securities Exchange Act of 1934, as amended, except to the extent Zygo specifically incorporates this information by reference.
The graph below compares cumulative total return of our common stock with the cumulative total return of (i) the NASDAQ Composite and (ii) a group of peer companies weighted to reflect differing market capitalizations. Companies in the new peer group are LeCroy Corporation, Nanometrics, Inc., Rudolph Technologies, Inc., II-VI, Incorporated, Electro Scientific Industries, Inc., Faro Technologies, Inc., Cognex Corp., FEI Co. and Ultratech, Inc. Companies in the old peer group are Nanometrics, Inc., Rudolph Technologies, Inc., II-VI, Incorporated, Electro Scientific Industries, Inc., Faro Technologies, Inc., Cognex Corp., FEI Co. and Ultratech, Inc. The new peer group consists of issuers selected primarily based on market capitalization and the markets they serve.
|
|
|
|
|
|
|
|
|
|
|
|
|
|
|
|
|
|
|
|
|
|
|
|
|
|
|
|
|
|
|
|
|
|
|
|
||||||
|
|
|
06/30/06 |
|
06/30/07 |
|
06/30/08 |
|
06/30/09 |
|
06/30/10 |
|
06/30/11 |
|
||||||
|
|
|
|
|
|
|
|
|
|
|
|
|
|
|
||||||
|
ZYGO CORPORATION |
|
|
100.00 |
|
|
87.19 |
|
|
59.97 |
|
|
28.43 |
|
|
49.48 |
|
|
86.94 |
|
|
NASDAQ COMPOSITE |
|
|
100.00 |
|
|
120.72 |
|
|
107.21 |
|
|
86.71 |
|
|
100.61 |
|
|
133.66 |
|
|
NEW PEER GROUP |
|
|
100.00 |
|
|
114.77 |
|
|
101.12 |
|
|
73.19 |
|
|
88.39 |
|
|
164.24 |
|
|
OLD PEER GROUP |
|
|
100.00 |
|
|
116.85 |
|
|
102.84 |
|
|
75.22 |
|
|
90.74 |
|
|
167.72 |
|
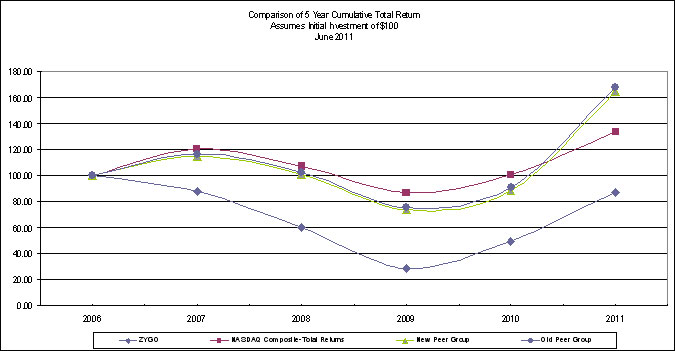
18
Item 6. Selected Financial Data
The financial data set forth below should be read in conjunction with “Management’s Discussion and Analysis of Financial Condition and Results of Operations” and with our Consolidated Financial Statements and notes thereto included elsewhere in this Form 10-K.
(Thousands, except per share, number of employees, percentages and ratio amounts)
|
|
|
|
|
|
|
|
|
|
|
|
|
|
|
|
|
|
|
|
|
Fiscal Year Ended June 30, |
|
|||||||||||||
|
|
|
|
|
|||||||||||||
|
|
|
2011 |
|
2010 |
|
2009 |
|
2008 |
|
2007 |
|
|||||
|
|
|
|
|
|
|
|
|
|
|
|
|
|||||
|
Net revenues |
|
$ |
150,126 |
|
$ |
101,330 |
|
$ |
114,734 |
|
$ |
158,463 |
|
$ |
180,988 |
|
|
Gross profit |
|
|
70,793 |
|
|
41,969 |
|
|
32,433 |
|
|
64,681 |
|
|
77,183 |
|
|
Gross margin |
|
|
47 |
% |
|
41 |
% |
|
28 |
% |
|
41 |
% |
|
43 |
% |
|
Net earnings (loss) from continuing operations |
|
|
20,592 |
|
|
(2,668 |
) |
|
(61,210 |
) |
|
3,337 |
|
|
16,118 |
|
|
Net earnings (loss) from discontinued operations, net of tax |
|
|
91 |
|
|
(2,669 |
) |
|
(4,059 |
) |
|
(700 |
) |
|
— |
|
|
|
|
|
|
|
|
|
|
|
|
|
|
|
|
|
|
|
|
Net earnings (loss) including noncontrolling interest |
|
|
20,683 |
|
|
(5,337 |
) |
|
(65,269 |
) |
|
2,637 |
|
|
16,118 |
|
|
Less: Net earnings attributabe to noncontrolling interest |
|
|
1,604 |
|
|
957 |
|
|
795 |
|
|
1,398 |
|
|
976 |
|
|
|
|
|
|
|
|
|
|
|
|
|
|
|
|
|
|
|
|
Net earnings (loss) attributable to Zygo Corporation |
|
$ |
19,079 |
|
$ |
(6,294 |
) |
$ |
(66,064 |
) |
$ |
1,239 |
|
$ |
15,142 |
|
|
|
|
|
|
|
|
|
|
|
|
|
|
|
|
|
|
|
|
% of net revenues |
|
|
13 |
% |
|
-6 |
% |
|
-58 |
% |
|
1 |
% |
|
8 |
% |
|
|
|
|
|
|
|
|
|
|
|
|
|
|
|
|
|
|
|
Net earnings (loss) from continuing operations attributable to Zygo Corporation |
|
$ |
18,988 |
|
$ |
(3,625 |
) |
$ |
(62,005 |
) |
$ |
1,939 |
|
$ |
15,142 |
|
|
|
|
|
|
|
|
|
|
|
|
|
|
|
|
|
|
|
|
% of net revenues |
|
|
13 |
% |
|
-4 |
% |
|
-54 |
% |
|
1 |
% |
|
8 |
% |
|
Basic - Net earnings (loss) per share attributable to Zygo Corporation: |
|
|
|
|
|
|
|
|
|
|
|
|
|
|
|
|
|
Continuing operations |
|
$ |
1.08 |
|
($ |
0.21 |
) |
($ |
3.68 |
) |
$ |
0.11 |
|
$ |
0.83 |
|
|
Discontinued operations |
|
|
— |
|
|
(0.16 |
) |
|
(0.24 |
) |
|
(0.04 |
) |
|
— |
|
|
|
|
|
|
|
|
|
|
|
|
|
|
|
|
|
|
|
|
Net earnings (loss) per share |
|
$ |
1.08 |
|
($ |
0.37 |
) |
($ |
3.92 |
) |
$ |
0.07 |
|
$ |
0.83 |
|
|
|
|
|
|
|
|
|
|
|
|
|
|
|
|
|
|
|
|
Diluted - Net earnings (loss) per share attributable to Zygo Corporation: |
|
|
|
|
|
|
|
|
|
|
|
|
|
|
|
|
|
Continuing operations |
|
$ |
1.05 |
|
($ |
0.21 |
) |
($ |
3.68 |
) |
$ |
0.11 |
|
$ |
0.81 |
|
|
Discontinued operations |
|
|
— |
|
|
(0.16 |
) |
|
(0.24 |
) |
|
(0.04 |
) |
|
— |
|
|
|
|
|
|
|
|
|
|
|
|
|
|
|
|
|
|
|
|
Net earnings (loss) per share |
|
$ |
1.05 |
|
($ |
0.37 |
) |
($ |
3.92 |
) |
$ |
0.07 |
|
$ |
0.81 |
|
|
|
|
|
|
|
|
|
|
|
|
|
|
|
|
|
|
|
|
Weighted average number of shares: |
|
|
|
|
|
|
|
|
|
|
|
|
|
|
|
|
|
Basic |
|
|
17,639 |
|
|
17,183 |
|
|
16,843 |
|
|
17,295 |
|
|
18,156 |
|
|
Diluted |
|
|
18,140 |
|
|
17,183 |
|
|
16,843 |
|
|
17,648 |
|
|
18,601 |
|
|
|
|
|
|
|
|
|
|
|
|
|
|
|
|
|
|
|
|
Research, development and engineering |
|
$ |
14,990 |
|
$ |
14,284 |
|
$ |
23,234 |
|
$ |
23,971 |
|
$ |
22,038 |
|
|
Capital expenditures |
|
$ |
1,522 |
|
$ |
1,441 |
|
$ |
4,255 |
|
$ |
6,580 |
|
$ |
10,149 |
|
|
Depreciation and amortization |
|
$ |
6,431 |
|
$ |
6,125 |
|
$ |
7,960 |
|
$ |
7,352 |
|
$ |
6,519 |
|
|
|
|
|
|
|
|
|
|
|
|
|
|
|
|
|
|
|
|
|
|
June 30, |
|
|||||||||||||
|
|
|
|
|
|||||||||||||
|
|
|
2011 |
|
2010 |
|
2009 |
|
2008 |
|
2007 |
|
|||||
|
|
|
|
|
|
|
|
|
|
|
|
|
|||||
|
Working capital |
|
$ |
95,201 |
|
$ |
72,485 |
|
$ |
69,742 |
|
$ |
104,851 |
|
$ |
107,834 |
|
|
Current ratio |
|
|
4.5 |
|
|
4.2 |
|
|
4.3 |
|
|
5.7 |
|
|
4.3 |
|
|
Total assets |
|
$ |
159,604 |
|
$ |
125,165 |
|
$ |
124,099 |
|
$ |
190,008 |
|
$ |
211,594 |
|
|
Stockholders’ equity |
|
$ |
124,720 |
|
$ |
98,403 |
|
$ |
98,583 |
|
$ |
162,524 |
|
$ |
177,594 |
|
|
Price-earnings ratio |
|
|
13 |
|
|
— |
|
|
— |
|
|
140 |
|
|
18 |
|
|
Number of employees at year-end |
|
|
537 |
|
|
454 |
|
|
484 |
|
|
595 |
|
|
575 |
|
|
Revenue per employee – average |
|
$ |
280 |
|
$ |
223 |
|
$ |
237 |
|
$ |
266 |
|
$ |
315 |
|
|
Book value per share |
|
$ |
7.02 |
|
$ |
5.63 |
|
$ |
5.83 |
|
$ |
9.71 |
|
$ |
9.74 |
|
|
Market price per share at year-end |
|
$ |
13.22 |
|
$ |
8.11 |
|
$ |
4.66 |
|
$ |
9.83 |
|
$ |
14.29 |
|
19
Item 7. Management’s Discussion and Analysis of Financial Condition and Results of Operations
CRITICAL ACCOUNTING POLICIES, SIGNIFICANT JUDGMENTS AND ESTIMATES
The discussion and analysis of our financial condition and results of operations are based upon our consolidated financial statements, which have been prepared in accordance with accounting principles generally accepted in the United States of America. The preparation of these consolidated financial statements requires us to make estimates and judgments that affect the reported amounts of assets, liabilities, revenues and expenses and related disclosures at the date of our consolidated financial statements. On an on-going basis, management evaluates its estimates and judgments, including those related to bad debts, inventories, marketable securities, share-based compensation, warranty obligations, self-insured healthcare claims, income taxes, discontinued operations and long-lived assets. Management bases its estimates and judgments on historical experience and current market conditions and on various other factors that are believed to be reasonable under the circumstances, the results of which form the basis for making judgments about the carrying values of assets and liabilities that are not readily apparent from other sources. Actual results may differ from these estimates under different assumptions or conditions. We consider certain accounting policies related to revenue recognition and allowance for doubtful accounts, discontinued operations, inventory valuation, valuation of marketable securities, share-based compensation, warranty costs, self-insured health insurance costs, accounting for income taxes and valuation of long-lived assets to be critical policies due to the estimates and judgments involved in each.
Revenue Recognition and Allowance for Doubtful Accounts
We recognize revenue
based on guidance provided in SEC Staff Accounting Bulletin (“SAB”) No. 104,
“Revenue Recognition” and in accordance with authoritative guidance issued by
the Financial Accounting Standard Board (“FASB”) pertaining to revenue
arrangements with multiple deliverables. We recognize revenue when persuasive
evidence of an arrangement exists, delivery has occurred or services have been
rendered, our price is fixed or determinable and collectability is reasonably
assured. We recognize revenue on our standard products when title passes to the
customer upon shipment. While our standard products generally require
installation, the installation is considered a perfunctory performance
obligation. Standard products do not have customer acceptance criteria.
Generally, software is a component of our standard product and, as such, is not
separately recognized as revenue. We have standard rights of return for
defective products that we account for as a warranty provision under
authoritative guidance of accounting for contingencies. We do not have any
price protection agreements or other post shipment obligations. For custom
equipment where customer acceptance is part of the sales agreement, revenue is
recognized when the customer has accepted the product. In cases where custom
equipment does not have customer acceptance as part of the sales agreement, we
recognize revenue upon shipment as long as the system meets the specifications
as agreed upon with the customer. Certain transactions have multiple
deliverables, with the deliverables clearly defined. To the extent that the
secondary deliverables are other than perfunctory, we recognize the revenue on
each deliverable, if separable, or on the completion of all deliverables, if
not separable, all in a manner consistent with SAB No. 104 and related
authoritative guidance. Standalone software products are recognized as revenue
when they are shipped.
Certain customer transactions include payment terms whereby we receive a partial payment of the total order amount prior to the related sale being recognized in our financial statements. These advance payments are included in accrued progress payments and deferred revenue in the consolidated balance sheet. Generally, these progress payments relate to orders for custom equipment that require a lengthy build cycle and, in some cases, acceptance by the customer. We may negotiate payment terms with these customers on these particular orders and secure certain payments prior to or on shipment of the equipment. These payments remain in accrued progress payments and deferred revenue until our applicable revenue recognition criteria have been met.
We maintain an allowance for doubtful accounts based on a continuous review of customer accounts, payment patterns and specific collection issues. We perform on-going credit evaluations of our customers and do not require collateral from our customers. For many of our international customers, we require an irrevocable letter of credit from our customer before a shipment is made. If the financial condition of our customers were to deteriorate, resulting in an impairment of their ability to make payments, additional allowances may be required.
20
Discontinued Operations
The Company classifies
operations as discontinued when the operations have either ceased, or are
expected to be disposed of in a sale transaction in the near term and the operations
and cash flows of all discontinued operations have been eliminated or will be
eliminated upon consummation of the expected sale transaction and the Company
will not have any significant continuing involvement in the discontinued
operations. Authoritative guidance related to the impairment or disposal of
long-lived assets requires the calculation of estimated fair value less cost to
sell long-lived assets for assets held for sale. The calculation of estimated
fair value less cost to sell includes significant estimates and assumptions,
including, but not limited to: operating projections; discount rate; excess
working capital levels; property values; and the anticipated costs involved in
the selling process. As more fully described in Note 20, “Discontinued
Operations”, we have discontinued the Singapore IC packaging operations of our
vision systems product line, which was included in our Metrology Solutions
segment.
Inventory Valuation
Inventories are valued
at the lower of cost or market, cost being determined on a first-in, first-out
basis. Management evaluates the need to record adjustments for impairment of
inventory on a quarterly basis. Our policy is to assess the valuation of all
inventories, including raw materials, work-in-process and finished goods.
Obsolete inventory or inventory in excess of management’s estimated future
usage, over a reasonable period of time, is written down to its estimated
market value, if less than its cost. Contracts with fixed prices are evaluated
to determine if estimated total costs will exceed revenues. A loss provision is
recorded when the judgment is made that actual costs incurred plus estimated
costs remaining to be incurred based on management’s estimates will exceed
total revenues from the contract. Inherent in the estimates of market value are
management’s estimates related to current economic trends, future demand for
our products and technological obsolescence. Management estimates future
product sales and service requirements and evaluates technological changes and
other possible uses to determine if inventory is excess or obsolete. If actual
market conditions are different than those projected by management, additional
inventory adjustments affecting earnings may be required.
Other Than Temporary Impairment of Marketable Securities
Marketable securities
have been primarily classified as held-to-maturity, which requires them to be
carried at amortized cost. We also have certain securities that are classified
as trading. Management evaluates the need to record adjustments for impairment
of marketable securities on a quarterly basis. Marketable securities with
unrealized depreciation in fair value for twelve or more consecutive months and
other securities with unrealized losses are reviewed to determine whether the
decline in fair value is other than temporary. Investment ratings,
company-specific events, general economic conditions and other reasons are
evaluated in determining if the decline in fair value is other than temporary.
If it is judged that a decline in fair value is other than temporary, the
marketable security is valued at the current fair value and an impairment
charge is reflected in earnings.
Share-Based Compensation
We calculate
share-based compensation expense in accordance with authoritative guidance
pertaining to share-based payment using the Black-Scholes option-pricing model
to calculate the fair value of share-based awards. The key assumptions for this
valuation method include the expected term of an option grant, stock price
volatility, risk-free interest rate and dividend yield. The determination of
these assumptions is based on history and future expectations and is subject to
a high level of judgment. To the extent any of the assumptions were to change
from year to year, the fair value of new option grants may vary significantly.
Warranty Costs
We provide for the
estimated cost of product warranties at the time revenue is recognized. We
consider historical warranty costs actually incurred together with specifically
identified circumstances to establish the warranty liability. The warranty
liability is reviewed on a quarterly basis. Should actual costs differ from
management’s estimates, revisions to the estimated warranty liability may be
required. A one percent change in warranty liability would have an immaterial
impact on our financial condition and results of operations.
21
Accounting for Income Taxes
Deferred income tax
assets and liabilities are recognized for the future tax consequences
attributable to differences between the financial statement carrying amounts of
existing assets and liabilities and their respective income tax basis and
operating loss and tax credit carryforwards. Authoritative guidance issued by
the FASB pertaining to accounting for income taxes requires the establishment
of a valuation allowance to reflect the likelihood of the realization of
deferred tax assets. We record a valuation allowance to reduce our deferred tax
assets to an estimated realizable amount based on historical and forecasted
results. Management has considered future taxable income and ongoing prudent
and feasible tax planning strategies in assessing the need for the valuation
allowance. In fiscal 2009, management determined that it is more likely than
not that we would not be able to realize our deferred tax assets in the future,
and an adjustment to record a full valuation allowance was charged to income
tax expense. The Company maintains the valuation allowance at June 30, 2011.
Should management determine that it would be able to realize all or part of its
net deferred tax assets in the future, an adjustment to the valuation allowance
would increase income in the period such determination was made. Our effective
tax rate may vary from period to period based on changes to the valuation allowance,
changes in pre-tax income between jurisdictions that have higher or lower tax
rates, changes to federal, state, or foreign tax laws and deductibility of
certain costs and expenses by jurisdiction.
Valuation of Long-Lived Assets
In accordance with
authoritative guidance issued by the FASB pertaining to accounting for the
impairment or disposal of long-lived assets, the carrying value of intangible
assets and other long-lived assets is reviewed on a regular basis for the
existence of facts or circumstances, both internally and externally, that may
suggest impairment. Some factors we consider important, which could trigger the
impairment review, include a significant decrease in the market value of an
asset, a significant change in the extent or manner in which an asset is used,
a significant adverse change in the business climate that could affect the
value of an asset, an accumulation of costs for an asset in excess of the
amount originally expected, a current period operating loss or cash flow decline
combined with a history of operating loss or cash flow uses or a projection
that demonstrates continuing losses and a current expectation that it is more
likely than not that a long-lived asset will be disposed of at a loss before
the end of its estimated useful life.
If one or more of such facts or circumstances exist, we evaluate the carrying value of long-lived assets to determine if an impairment exists based upon estimated undiscounted future cash flows over the remaining useful life of the assets and compare that value to the carrying value of the assets. If the carrying value of the assets is greater than the estimated future cash flows, the assets are written down to the estimated fair value. We determine the estimated fair value of the assets based on a current market value of the assets. If a current market value is not readily available, a projected discounted cash flow method is applied using a discount rate determined by management to be commensurate with the risk inherent in the current business model. Our cash flow estimates contain management’s best estimates, using appropriate and customary assumptions and projections at the time. During fiscal 2011, we recorded an impairment charge on property, plant and equipment. During fiscal 2010, we recorded an impairment charge on goodwill. During fiscal 2009, we recorded impairment charges on property, plant and equipment, intangible assets and marketable securities.
Health Insurance
We are self-insured
for the majority of our group health insurance. We rely on claims experience in
determining an adequate liability for claims incurred, but not reported. To the
extent actual claims exceed estimates, we may be required to record additional
expense. A five percent change in actual claims would have an immaterial impact
on our financial condition and results of operations.
22
OVERVIEW
Zygo Corporation is a worldwide supplier of optical metrology instruments, precision optics and electro-optical design and manufacturing services, serving customers in the semiconductor capital equipment and industrial markets. Optical instruments products encompass non-contact optical measurement instruments. Optics products consist of high performance macro-optics components, optical coatings and optical system assemblies. We conduct the majority of our manufacturing in our 153,500 square foot facility in Middlefield, Connecticut, our 55,300 square foot facility in Richmond, California and a 22,560 square foot leased facility in Tucson, Arizona.
During the second quarter of fiscal 2011, we completed a transaction with ASML US, Inc. (“ASML”) to purchase substantially all the assets of ASML’s Richmond, California operation, including a 55,300 square-foot manufacturing facility. The assets were acquired for $7.1 million in cash and future consideration with a net present value of $5.3 million, based on the projected level of shipments to ASML over the next three years beginning January 1, 2011. In addition, we hired key management and employees working at the former ASML Richmond facility and formed our Extreme Precision Optics group (“EPO”), which is included in our Optical Systems segment. With this acquisition, we have considerably expanded our optical manufacturing capabilities. Combined with our existing leadership position in metrology, large flat optics production and electro-optical design and manufacturing, EPO provides highly synergistic capabilities that address new applications in semiconductor, defense and the life-sciences markets.
The fair value of the Richmond assets acquired was greater than the purchase price, resulting in a gain on acquisition of $2.0 million which was recorded in other income. In addition, a deferred tax liability of $0.7 million was recorded in the opening balance sheet, which had the effect of reducing the gain on acquisition to $1.3 million. The fair value of the assets was determined based on management’s review of the value of the assets at the time of the acquisition.
Our revenues increased 48% in fiscal 2011 from fiscal 2010 and our earnings per diluted share increased to $1.05 in fiscal 2011 from a loss of $0.37 per diluted share in fiscal 2010. Fiscal 2011 results include a gain on acquisition of $0.11 per diluted share, net of tax. Fiscal 2010 results include the impact of (i) costs for the acquisition of Zemetrics, including the charge relating to the impairment of goodwill as part of the purchase price valuation, (ii) the Company’s evaluation of an unsolicited stock offer, (iii) search cost for a new chief executive officer and (iv) inventory adjustments. The net effect of these charges was to reduce net earnings from continuing operations in fiscal 2010 by $5.6 million, or $0.32 per diluted share. Our fiscal 2011 results reflected strong revenue growth in both our segments. The revenue growth in the Optical Systems segment included revenues from EPO, which we established in fiscal 2011.
Our backlog at June 30, 2011 was $62.0 million, an increase of $17.1 million from June 30, 2010. Net bookings were $44.2 million in the fourth quarter of fiscal 2011. Net bookings for the fourth quarter from the Metrology Solutions segment accounted for 61% of the bookings received; the Optical Systems segment accounted for the remaining 39%. For fiscal 2011, bookings were $167.2 million, an increase of 55% over fiscal 2010 as a result of increased activity across all product lines resulting from our continued product and market diversification and the strength in our markets, as well as the addition of EPO.
We have assessed the impact on our business resulting from the earthquake, tsunami and nuclear disaster in Japan and do not believe that these events have had nor will have a material impact on the Company’s consolidated financial statements or continuing operations. Our activities in Japan resumed full operation shortly after the events. Indications at this time are that shipments both into Japan and from our Japanese operation will not be seriously affected. In addition, to date, our supply chain has been unaffected by the events in Japan.
23
RESULTS OF OPERATIONS
Fiscal 2011 Compared with Fiscal 2010
Net Revenues by Segment
|
|
|
|
|
|
|
|
|
|
|
|
|
|
|
|
|
|
Year Ended |
|
||||||||||
|
|
|
|
|
||||||||||
|
(Dollars in millions) |
|
June 30, 2011 |
|
June 30, 2010 |
|
||||||||
|
|
|
|
|
|
|
||||||||
|
|
|
Amount |
|
Percentage of |
|
Amount |
|
Percentage
of |
|
||||
|
|
|
|
|
|
|
|
|
|
|
||||
|
Metrology Solutions |
|
$ |
92.9 |
|
|
62 |
% |
$ |
65.8 |
|
|
65 |
% |
|
Optical Systems |
|
|
57.2 |
|
|
38 |
% |
|
35.5 |
|
|
35 |
% |
|
|
|
|
|
|
|
|
|
|
|
|
|
|
|
|
Total |
|
$ |
150.1 |
|
|
100 |
% |
$ |
101.3 |
|
|
100 |
% |
|
|
|
|
|
|
|
|
|
|
|
|
|
|
|
Revenues for fiscal 2011 increased 48% compared with the prior year period, reflecting increases in the Metrology Solutions segment revenues of 41% and the increase in Optical Systems segment revenue of 61%. The increase in the Metrology Solutions segment revenues was primarily due to volume increases in instruments of $14.2 million and lithography stage metrology of $14.1 million. The increase in instruments was due to volume increases in large aperture and microscope products. We generated revenue increases across all our regions. Large aperture revenues were especially strong in the Americas and China (included in our Pacific Rim geographic region). The increase in lithography stage metrology is due to strength in the semiconductor market.
The increase in the Optical Systems segment revenues was primarily due to revenues of $14.4 million generated by EPO since the formation of the group in the second quarter of fiscal 2011. We also generated increases in contract manufacturing of $4.3 million and precision optics of $3.3 million. The increase in contract manufacturing revenue was due to higher helmet mounted display unit volumes which more than offset declines in laser vision systems and dental wands.
Approximately 77% of all fiscal 2011 net revenues were denominated in U.S. dollars, compared with 76% in fiscal 2010. Significant changes in the values of foreign currencies relative to the value of the U.S. dollar can influence the revenues of our products in export markets, as would changes in the general economic conditions in those markets.
Gross Margin by Segment
|
|
|
|
|
|
|
|
|
|
|
|
|
|
|
|
|
|
Year Ended |
|
||||||||||
|
|
|
|
|
||||||||||
|
(Dollars in millions) |
|
June 30, 2011 |
|
June 30, 2010 |
|
||||||||
|
|
|
|
|
|
|
||||||||
|
|
|
|
|
|
|
|
|
|
|
||||
|
|
|
Gross Profit |
|
Gross Margin |
|
Gross Profit |
|
Gross Margin |
|
||||
|
|
|
|
|
|
|
|
|
|
|
||||
|
Metrology Solutions |
|
$ |
50.9 |
|
|
55 |
% |
$ |
33.7 |
|
|
51 |
% |
|
Optical Systems |
|
|
19.9 |
|
|
35 |
% |
|
8.3 |
|
|
23 |
% |
|
|
|
|
|
|
|
|
|
|
|
|
|
|
|
|
Total |
|
$ |
70.8 |
|
|
47 |
% |
$ |
42.0 |
|
|
41 |
% |
|
|
|
|
|
|
|
|
|
|
|
|
|
|
|
Gross margin for fiscal 2011 was 47%, which represents an increase of six percentage points from the comparable prior year period. Within the Metrology Solutions segment, gross margin increased to 55% for the twelve months ended June 30, 2011 compared with the prior year comparable period of 51%, primarily due to improved absorption of factory costs due to increased revenues and the reduced level of inventory reserves taken in fiscal 2011 compared with fiscal 2010. Within the Optical Systems segment, the gross margin increased to 35% for the twelve months ended June 30, 2011 compared with 23% in the comparable prior year period. The Optical Systems segment gross margin increase for the twelve months ended June 30, 2011 was primarily due to improved absorption of factory costs due to increased revenues.
24
Selling, General and Administrative Expenses (“SG&A”)
|
|
|
|
|
|
|
|
|
|
|
|
|
|
|
|
|
|
Year Ended |
|
||||||||||
|
|
|
|
|
||||||||||
|
(Dollars in millions) |
|
June 30, 2011 |
|
June 30, 2010 |
|
||||||||
|
|
|
|
|
|
|
||||||||
|
|
|
Amount |
|
Percentage of |
|
Amount |
|
Percentage
of |
|
||||
|
|
|
|
|
|
|
|
|
|
|
||||
|
|
|
|
|
|
|
|
|
|
|
|
|
|
|
|
|
|
$ |
34.7 |
|
|
23 |
% |
$ |
29.5 |
|
|
29 |
% |
|
|
|
|
|
|
|
|
|
|
|
|
|
|
|
SG&A expenses increased in fiscal 2011 by $5.2 million from the comparable prior year period. The prior year expense includes approximately $2.6 million of expenses related to the Company’s evaluation of an unsolicited offer to purchase the outstanding stock of the Company, Zemetrics acquisition costs, the retirement of our former chief executive officer, the search costs for a new chief executive officer and severance charges, which were partially offset by a reversal in provision for bad debt reserve. The increase was primarily due to employee compensation expenses, which included terminating pay reductions and restoring performance-based programs. The decrease in SG&A as a percentage of revenue was due to management’s efforts to control expenses over a significant increase in the revenue base.
Research, Development and Engineering Expenses (“RD&E”)
|
|
|
|
|
|
|
|
|
|
|
|
|
|
|
|
|
|
Year Ended |
|
||||||||||
|
|
|
|
|
||||||||||
|
|
|
June 30, 2011 |
|
June 30, 2010 |
|
||||||||
|
|
|
|
|
|
|
||||||||
|
(Dollars in millions) |
|
Amount |
|
Percentage of |
|
Amount |
|
Percentage
of |
|
||||
|
|
|
|
|
|
|
|
|
|
|
||||
|
|
|
|
|
|
|
|
|
|
|
|
|
|
|
|
|
|
$ |
15.0 |
|
|
10 |
% |
$ |
14.3 |
|
|
14 |
% |
|
|
|
|
|
|
|
|
|
|
|
|
|
|
|
RD&E expense increased slightly in fiscal 2011 by $0.7 million from the comparable prior year period primarily related to new product costs in the instruments group and the addition of EPO RD&E expenses. RD&E expenses as a percent of revenue decreased four percentage points due to management’s efforts to control expenses over a significant increase in the revenue base.
Impairment of Goodwill
|
|
|
|
|
|
|
|
|
|
|
|
|
|
|
|
|
|
Year Ended |
|
||||||||||
|
|
|
|
|
||||||||||
|
|
|
June 30, 2011 |
|
June 30, 2010 |
|
||||||||
|
|
|
|
|
|
|
||||||||
|
(Dollars in millions) |
|
Amount |
|
Percentage of |
|
Amount |
|
Percentage
of |
|
||||
|
|
|
|
|
|
|
|
|
|
|
||||
|
|
|
|
|
|
|
|
|
|
|
|
|
|
|
|
|
|
$ |
— |
|
|
— |
|
$ |
2.0 |
|
|
2 |
% |
|
|
|
|
|
|
|
|
|
|
|
|
|
|
|
The Company recorded an impairment charge of $2.0 million in fiscal 2010 relating to the goodwill acquired in connection with its acquisition of Zemetrics. The Zemetrics reporting unit had minimal sales history and cumulative losses since inception. In addition, the fair value of common stock issued as consideration on the closing date was $10.80 per share, which was in excess of the implied value per share in the formula used in the purchase agreement to determine the number of common shares issued as consideration (which was based on the market price per share during the 40-day period prior to closing). In consideration of these factors, management determined that the carrying value of the reporting unit exceeded its fair value and that the implied fair value of goodwill was zero at March 31, 2010.
25
Other Income
|
|
|
|
|
|
|
|
|
|
|
|
|
|
|
|
|
|
Year Ended |
|
||||||||||
|
|
|
|
|
||||||||||
|
(Dollars in millions) |
|
June 30, 2011 |
|
June 30, 2010 |
|
||||||||
|
|
|
|
|
|
|
||||||||
|
|
|
Amount |
|
Percentage of |
|
Amount |
|
Percentage
of |
|
||||
|
|
|
|
|
|
|
|
|
|
|
||||
|
|
|
|
|
|
|
|
|
|
|
|
|
|
|
|
|
|
$ |
0.8 |
|
|
— |
|
$ |
0.1 |
|
|
— |
|
|
|
|
|
|
|
|
|
|
|
|
|
|
|
|
Other income for fiscal 2011 increased by $0.7 million over the prior year balance, primarily due to the gain on acquisition recorded on the purchase of substantially all the assets of ASML’s Richmond, California operation, partially offset by the amortization of the ASML discount liability associated with the acquisition.
Income Tax Benefit (Expense)
|
|
|
|
|
|
|
|
|
|
|
|
|
|
|
|
|
|
Year Ended |
|
||||||||||
|
|
|
|
|
||||||||||
|
(Dollars in millions) |
|
June 30, 2011 |
|
June 30, 2010 |
|
||||||||
|
|
|
|
|
|
|
||||||||
|
|
|
Amount |
|
Tax Rate |
|
Amount |
|
Tax
Rate |
|
||||
|
|
|
|
|
|
|
|
|
|
|
||||
|
|
|
|
|
|
|
|
|
|
|
|
|
|
|
|
|
|
$ |
(1.3 |
) |
|
6 |
% |
$ |
1.0 |
|
|
28 |
% |
|
|
|
|
|
|
|
|
|
|
|
|
|
|
|
In fiscal 2011, income tax expense is related primarily to foreign and state income tax expense. There is no current United States federal income tax expense due to our net operating loss (NOL) carryforwards and the valuation allowance on those NOLs. During fiscal 2011, we also recognized $725 of tax benefit from the adjustment of valuation allowances on our deferred tax assets associated with the Richmond asset purchase. The deferred tax liability recorded in connection with the gain on acquisition reduced our net deferred tax assets which, in turn, reduced our valuation allowance. The reduction in the valuation allowance was recorded as a current period tax benefit. We continue to maintain a valuation allowance on our net deferred tax assets as of June 30, 2011. In future periods, the valuation allowance could be reduced based upon sufficient evidence indicating that it is more likely than not that a portion of the deferred tax assets will be realized.
During fiscal 2010, we were also able to realize an income tax benefit for refund claims associated with NOL carryforwards and research and development credits due to changes in the United States tax regulations. In addition, we realized a benefit from the reversal of liabilities related to uncertain tax positions as such positions were settled in fiscal 2010. These income tax benefits were partially offset by income tax expense in foreign jurisdictions and state income taxes in the United States.
Net Earnings (Loss) from Continuing Operations Attributable To Zygo Corporation
|
|
|
|
|
|
|
|
|
|
|
|
|
|
|
|
|
|
Year Ended |
|
||||||||||
|
|
|
|
|
||||||||||
|
(Dollars in millions) |
|
June 30, 2011 |
|
June 30, 2010 |
|
||||||||
|
|
|
|
|
|
|
||||||||
|
|
|
Amount |
|
Percentage of |
|
Amount |
|
Percentage
of |
|
||||
|
|
|
|
|
|
|
|
|
|
|
||||
|
|
|
|
|
|
|
|
|
|
|
||||
|
|
|
$ |
19.0 |
|
|
13 |
% |
$ |
(3.6 |
) |
|
-4 |
% |
|
|
|
|
|
|
|
|
|
|
|
|
|
|
|
Net earnings from continuing operations attributable to Zygo Corporation in fiscal 2011 was $19.0 million compared with a net loss from continuing operations attributable to Zygo Corporation of $3.6 million in the prior year. Net earnings from continuing operations attributable to Zygo Corporation per diluted share was $1.05 for fiscal 2011, compared with a net loss from continuing operations attributable to Zygo Corporation of $0.21 per diluted share for fiscal 2010.
The net earnings in fiscal 2011 included seven months of operating activity of EPO as well as the effects of management’s efforts to control expenses over a significant increase in the revenue base. Net earnings in fiscal 2011 also included the effects of the restoration of employee compensation programs, including restoration of the pay and performance-based programs.
The net loss in fiscal 2010 included $5.6 million in significant charges, net of taxes, which included asset impairment charges and reserves on various other balance sheet items. These charges were incurred primarily as a result of the economic downturn and recent changes in our business strategy and operations resulting in re-evaluation of certain of our assets.
26
Net Earnings (Loss) from Discontinued Operations, net of tax
|
|
|
|
|
|
|
|
|
|
|
|
|
|
|
|
|
|
Year Ended |
|
||||||||||
|
|
|
|
|
||||||||||
|
(Dollars in millions) |
|
June 30, 2011 |
|
June 30, 2010 |
|
||||||||
|
|
|
|
|
|
|
||||||||
|
|
|
Amount |
|
Percentage of |
|
Amount |
|
Percentage
of |
|
||||
|
|
|
|
|
|
|
|
|
|
|
||||
|
|
|
$ |
0.1 |
|
|
— |
|
$ |
(2.7 |
) |
|
-3 |
% |
|
|
|
|
|
|
|
|
|
|
|
|
|
|
|
The loss from discontinued operations for fiscal 2010 of $2.7 million was due to severance and other closure costs, primarily related to the closure of our Singapore IC packaging operations of our vision systems product line in the first quarter.
Backlog
Backlog at June 30, 2011 was $62.0 million, an increase of $17.1 million from June 30, 2010. The year-end fiscal 2011 backlog consisted of $31.4 million, or 51%, in the Metrology Solutions segment and $30.6 million, or 49%, in the Optical Systems segment. Bookings for fiscal 2011 totaled $167.2 million. Bookings by segment for fiscal 2011 consisted of $103.0 million, or 62%, in the Metrology Solutions segment and $64.2 million, or 38%, in the Optical Systems segment.
Fiscal 2010 Compared with Fiscal 2009
Net Revenues
|
|
|
|
|
|
|
|
|
|
|
|
|
|
|
|
|
|
Year Ended |
|
||||||||||
|
|
|
|
|
||||||||||
|
(Dollars in millions) |
|
June 30, 2010 |
|
June 30, 2009 |
|
||||||||
|
|
|
|
|
|
|
||||||||
|
|
|
Amount |
|
Percentage of |
|
Amount |
|
Percentage
of |
|
||||
|
|
|
|
|
|
|
|
|
|
|
||||
|
Metrology Solutions |
|
$ |
65.8 |
|
|
65 |
% |
$ |
82.8 |
|
|
72 |
% |
|
Optical Systems |
|
|
35.5 |
|
|
35 |
% |
|
31.9 |
|
|
28 |
% |
|
|
|
|
|
|
|
|
|
|
|
|
|
|
|
|
Total |
|
$ |
101.3 |
|
|
100 |
% |
$ |
114.7 |
|
|
100 |
% |
|
|
|
|
|
|
|
|
|
|
|
|
|
|
|
Revenues for fiscal 2010 decreased 12% compared with the prior year period, reflecting decreases in the Metrology Solutions segment revenues of 21%, partially offset by the Optical Systems segment revenue increase of 11%. The decrease in Metrology Solutions segment revenues was primarily due to volume decreases in display solutions of $10.8 million, instruments of $6.8 million and lithography of $2.9 million, partially offset by increased revenues in vision systems of $1.9 million. New business in the Metrology Solutions segment related to OEM heads increased revenues by $2.4 million. The decrease in display solution revenues was due to the arrangement entered into with Toho Technology Corporation (“Toho”) in October 2009. The volume decreases in instruments and lithography revenues, in large measure, were due to a reduction in bookings that appeared to be tied directly to the general global economic downturn, most notably in the semiconductor industry. A decrease in bookings from Canon accounted for the majority of the decrease in lithography revenues. The increase in the Optical Systems segment revenues was primarily due to increases in optical component revenues of $2.0 million.
Approximately 76% of all fiscal 2010 net revenues were denominated in U.S. dollars, compared with 77% in fiscal 2009. Significant changes in the values of foreign currencies relative to the value of the U.S. dollar can influence the revenues of our products in export markets, as would changes in the general economic conditions in those markets.
27
Gross Margin by Segment
|
|
|
|
|
|
|
|
|
|
|
|
|
|
|
|
|
|
Year Ended |
|
||||||||||
|
|
|
|
|
||||||||||
|
(Dollars in millions) |
|
June 30, 2010 |
|
June 30, 2009 |
|
||||||||
|
|
|
|
|
|
|
||||||||
|
|
|
|
|
|
|
||||||||
|
|
|
Gross Profit |
|
Gross Margin |
|
Gross Profit |
|
Gross Margin |
|
||||
|
|
|
|
|
|
|
|
|
|
|
||||
|
Metrology Solutions |
|
$ |
33.7 |
|
|
51 |
% |
$ |
28.4 |
|
|
34 |
% |
|
Optical Systems |
|
|
8.3 |
|
|
23 |
% |
|
4.0 |
|
|
13 |
% |
|
|
|
|
|
|
|
|
|
|
|
|
|
|
|
|
Total |
|
$ |
42.0 |
|
|
41 |
% |
$ |
32.4 |
|
|
28 |
% |
|
|
|
|
|
|
|
|
|
|
|
|
|
|
|
Gross margin for fiscal 2010 was 41%, which represents an increase of thirteen percentage points from the comparable prior year period which included charges for severance, inventory adjustments and impairment charges totaling $11.1 million. Excluding these charges, the gross margin in the prior year period would have been 38%. Within the Metrology Solutions segment, gross margin increased to 51% for the twelve months ended June 30, 2010 compared with the prior year comparable period of 34%. The comparable prior year period included $9.1 million of the charges referred to above. Excluding those charges the fiscal 2009 metrology gross margin would have been 45%. The increase to 51% gross margin in the period in the Metrology segment was primarily due to improved factory costs and a decrease in low-margin display revenues. Within the Optical Systems segment, the gross margin increased to 23% for the twelve months ended June 30, 2010 compared with 13% in the comparable prior year period. The Optical Systems segment gross margin for the twelve months ended June 30, 2010 was negatively impacted by production issues experienced in the first quarter of fiscal 2010 related to certain optics, resulting in negative gross margins.
Selling, General and Administrative Expenses (“SG&A”)
|
|
|
|
|
|
|
|
|
|
|
|
|
|
|
|
|
|
Year Ended |
|
||||||||||
|
|
|
|
|
||||||||||
|
(Dollars in millions) |
|
June 30, 2010 |
|
June 30, 2009 |
|
||||||||
|
|
|
|
|
|
|
||||||||
|
|
|
Amount |
|
Percentage of |
|
Amount |
|
Percentage
of |
|
||||
|
|
|
|
|
|
|
|
|
|
|
||||
|
|
|
|
|
|
|
|
|
|
|
|
|
|
|
|
|
|
$ |
29.5 |
|
|
29 |
% |
$ |
49.2 |
|
|
43 |
% |
|
|
|
|
|
|
|
|
|
|
|
|
|
|
|
SG&A in fiscal 2010 compared with fiscal 2009 decreased $19.7 million. SG&A in fiscal 2010 and 2009 included significant charges of $2.6 million and $14.0 million, respectively. The decrease to $26.9 million from $35.2 million is primarily related to costs eliminated with the sale of our semiconductor and display product lines, as well as employee headcount and salary reductions. The large significant charges for fiscal 2010 included $1.4 million in costs related to an unsolicited merger offer, $0.9 million in CEO search and retirement costs, $0.5 million of Zemetrics acquisition expenses and $0.5 million in severance expense, partially offset by $0.7 million reversal in bad debt reserve. The large significant charges for fiscal 2009 included $8.3 million in terminated merger-related expenses, $2.9 million in bad debt reserves, $1.3 million in legal accruals, $0.5 million in intangible asset impairment charges related to the vision systems business and $1.0 million in severance.
Research, Development and Engineering Expenses (“RD&E”)
|
|
|
|
|
|
|
|
|
|
|
|
|
|
|
|
|
|
Year Ended |
|
||||||||||
|
|
|
|
|
||||||||||
|
(Dollars in millions) |
|
June 30, 2010 |
|
June 30, 2009 |
|
||||||||
|
|
|
|
|
|
|
||||||||
|
|
|
Amount |
|
Percentage of |
|
Amount |
|
Percentage
of |
|
||||
|
|
|
|
|
|
|
|
|
|
|
||||
|
|
|
|
|
|
|
|
|
|
|
|
|
|
|
|
|
|
$ |
14.3 |
|
|
14 |
% |
$ |
23.2 |
|
|
20 |
% |
|
|
|
|
|
|
|
|
|
|
|
|
|
|
|
RD&E costs decreased $8.9 million in fiscal 2010 compared with the prior year period. Fiscal 2010 included charges related to severance costs of $0.4 million. Fiscal 2009 included charges related to intangible asset and fixed asset impairment charges of $2.2 million and severance costs of $0.2 million. The decrease in RD&E was primarily due to the elimination of costs related to the semiconductor and display product lines in June and October 2009, respectively.
28
Impairment of Goodwill
|
|
|
|
|
|
|
|
|
|
|
|
|
|
|
|
|
|
Year Ended |
|
||||||||||
|
|
|
|
|
||||||||||
|
(Dollars in millions) |
|
June 30, 2010 |
|
June 30, 2009 |
|
||||||||
|
|
|
|
|
|
|
||||||||
|
|
|
Amount |
|
Percentage of |
|
Amount |
|
Percentage
of |
|
||||
|
|
|
|
|
|
|
|
|
|
|
||||
|
|
|
|
|
|
|
|
|
|
|
|
|
|
|
|
|
|
$ |
2.0 |
|
|
2 |
% |
$ |
— |
|
|
— |
|
|
|
|
|
|
|
|
|
|
|
|
|
|
|
|
The Company recorded an impairment charge of $2.0 million during the three months ended March 31, 2010 relating to acquired goodwill in connection with its acquisition of Zemetrics. The Zemetrics reporting unit had minimal sales history and cumulative losses since inception. In addition, the fair value of common stock issued as consideration on the closing date was $10.80 per share, which was in excess of the implied value per share in the formula used in the purchase agreement to determine the number of common shares issued as consideration (which was based on the market price per share during the 40-day period prior to closing). In consideration of these factors, management determined that the carrying value of the reporting unit exceeded its fair value and that the implied fair value of goodwill was zero at March 31, 2010.
Other Income
|
|
|
|
|
|
|
|
|
|
|
|
|
|
|
|
|
|
Year Ended |
|
||||||||||
|
|
|
|
|
||||||||||
|
(Dollars in millions) |
|
June 30, 2010 |
|
June 30, 2009 |
|
||||||||
|
|
|
|
|
|
|
||||||||
|
|
|
Amount |
|
Percentage of |
|
Amount |
|
Percentage
of |
|
||||
|
|
|
|
|
|
|
|
|
|
|
||||
|
|
|
|
|
|
|
|
|
|
|
|
|
|
|
|
|
|
$ |
0.1 |
|
|
— |
|
$ |
1.0 |
|
|
1 |
% |
|
|
|
|
|
|
|
|
|
|
|
|
|
|
|
Other income for fiscal 2010 decreased by $0.9 million, compared with the prior year period, primarily due to a decrease in investment income. We changed our investment portfolio and have a low-risk government security portfolio, which carries a significantly lower interest rate than corporate bonds, and a greater percentage of cash is invested in money market accounts.
Income Tax Benefit (Expense)
|
|
|
|
|
|
|
|
|
|
|
|
|
|
|
|
|
|
Year Ended |
|
||||||||||
|
|
|
|
|
||||||||||
|
(Dollars in millions) |
|
June 30, 2010 |
|
June 30, 2009 |
|
||||||||
|
|
|
|
|
|
|
||||||||
|
|
|
Amount |
|
Tax Rate |
|
Amount |
|
Tax
Rate |
|
||||
|
|
|
|
|
|
|
|
|
|
|
||||
|
|
|
|
|
|
|
|
|
|
|
|
|
|
|
|
|
|
$ |
1.0 |
|
|
28 |
% |
$ |
(22.2 |
) |
|
57 |
% |
|
|
|
|
|
|
|
|
|
|
|
|
|
|
|
Income tax expense in fiscal 2009 included an increase in the valuation allowance of $36.9 million against net deferred tax assets. The valuation allowance increased in 2010 to recognize changes in deferred assets for the 2010 fiscal year. These changes in gross deferred assets would otherwise have increased tax expense. Fiscal 2010 does not include any tax benefit associated with the net operating loss for the fiscal years or tax credits earned in the fiscal year.
During fiscal 2010, the Company was able to realize an income tax benefit for refund claims associated with net operating loss carryforwards and research and development credits due to changes in the United States tax regulations. In addition, we realized a benefit from the reversal of liabilities related to uncertain tax positions, as those positions were settled in fiscal 2010. These income tax benefits were partially offset by income tax expense in foreign jurisdictions and state income taxes in the United States.
29
Net Loss from Continuing Operations Attributable To Zygo Corporation
|
|
|
|
|
|
|
|
|
|
|
|
|
|
|
|
|
|
Year Ended |
|
||||||||||
|
|
|
|
|
||||||||||
|
(Dollars in millions) |
|
June 30, 2010 |
|
June 30, 2009 |
|
||||||||
|
|
|
|
|
|
|
||||||||
|
|
|
Amount |
|
Percentage of |
|
Amount |
|
Percentage
of |
|
||||
|
|
|
|
|
|
|
|
|
|
|
||||
|
|
|
|
|
|
|
|
|
|
|
|
|
|
|
|
|
|
$ |
(3.6 |
) |
|
-4 |
% |
$ |
(62.0 |
) |
|
-54 |
% |
|
|
|
|
|
|
|
|
|
|
|
|
|
|
|
Net loss from continuing operations attributable to Zygo Corporation in fiscal 2010 was $3.6 million, compared with a net loss from continuing operations attributable to Zygo Corporation of $62.0 million in the prior year. Net loss from continuing operations attributable to Zygo Corporation per diluted share was $0.21 for fiscal 2010, compared with a net loss from continuing operations attributable to Zygo Corporation of $3.68 per diluted share for fiscal 2009. The net loss in fiscal 2010 included $5.6 million in significant charges, net of taxes, which included asset impairment charges and reserves on various other balance sheet items. The net loss in fiscal 2009 included $49.8 million in significant charges, net of taxes, which included asset impairment charges, write-downs and reserves on various other balance sheet items and a valuation allowance on our deferred tax assets. These charges were incurred primarily as a result of the economic downturn and changes in our business strategy and operations resulting in re-evaluation of certain of our assets.
Net Earnings (Loss) from Discontinued Operations, net of tax
|
|
|
|
|
|
|
|
|
|
|
|
|
|
|
|
|
|
Year Ended |
|
||||||||||
|
|
|
|
|
||||||||||
|
(Dollars in millions) |
|
June 30, 2010 |
|
June 30, 2009 |
|
||||||||
|
|
|
|
|
|
|
||||||||
|
|
|
Amount |
|
Percentage of |
|
Amount |
|
Percentage
of |
|
||||
|
|
|
|
|
|
|
|
|
|
|
||||
|
|
|
|
|
|
|
|
|
|
|
|
|
|
|
|
|
|
$ |
(2.7 |
) |
|
-3 |
% |
$ |
(4.1 |
) |
|
-4 |
% |
|
|
|
|
|
|
|
|
|
|
|
|
|
|
|
The net loss from discontinued operations resulted from the closure of our Singapore IC packaging metrology operations in fiscal 2010. Net loss from discontinued operations in fiscal 2010 was $2.7 million compared with a net loss from discontinued operations of $4.1 million in the prior year. Net loss from discontinued operations per diluted share was $0.16 per diluted share for fiscal 2010 compared with $0.24 per diluted share in fiscal 2009. The fiscal 2010 net loss from discontinued operations of $2.7 million included $0.8 million of severance and related termination expense and $0.7 million of inventory reserves. The fiscal 2009 net loss from discontinued operations of $4.1 million included $1.4 million of inventory reserves and $1.1 million of asset impairment charges.
Backlog
Backlog at June 30, 2010 totaled $44.9 million, an increase of $6.8 million from June 30, 2009. The year-end fiscal 2010 backlog consisted of $21.4 million, or 48%, in the Metrology Solutions segment and $23.5 million, or 52%, in the Optical Systems segment. Bookings for fiscal 2010 totaled $108.1 million. Bookings by segment for fiscal 2010 consisted of $68.7 million, or 64%, in the Metrology Solutions segment and $39.4 million, or 36%, in the Optical Systems segment.
TRANSACTIONS WITH STOCKHOLDER
Sales to Canon Inc., a stockholder, customer and distributor of certain of our products in Japan, amounted to $19.7 million (13% of net revenues), $8.8 million (9% of net revenues) and $16.2 million (14% of net revenues) for the years ended June 30, 2011, 2010 and 2009, respectively. Selling prices of products sold to Canon are based, generally, on the normal terms customarily given to distributors. At June 30, 2011 and 2010, there was in the aggregate $2.6 million and $0.7 million, respectively, of trade accounts receivable from Canon.
30
LIQUIDITY AND CAPITAL RESOURCES
We assess our liquidity in terms of our ability to generate cash to fund our operating, investing and financing activities. Our principal source of liquidity is operating cash flows. In addition to operating cash flows, other significant factors that affect our overall liquidity include: capital expenditures, customer credit requirements, investments in businesses and the availability of bank lines of credit.
Fiscal 2011 Compared with Fiscal 2010
At June 30, 2011, cash, cash equivalents and marketable securities were $61.0 million, an increase of $13.5 million from $47.5 million at June 30, 2010, of which $16.0 million is located in foreign jurisdictions subject to repatriation restrictions. Our marketable securities consist of $1.0 million in a United States treasury bill. As of June 30, 2011, $0.3 million of standby letters of credit were outstanding. These letters of credit are used primarily overseas to cover certain warranty periods or to cover future product shipments. These letters of credit are expected to expire at varying dates through January 2012. The cash equivalents balance in our money market account, which is invested primarily in U.S. government securities, was $19.9 million as of June 30, 2011. We do not believe there is any risk to liquidity in the money market account, nor are there currently any limits on redemptions.
Cash flow from operating activities from continuing operations for the year ended June 30, 2011 of $20.7 million was primarily due to an increase in net earnings, excluding non-cash items, partially offset by an increase in receivables and inventories.
Cash flow used by investing activities for the year ended June 30, 2011 increased by $10.4 million compared with the prior year period. This increase was primarily related to the purchase of ASML’s Richmond, California assets for $7.1 million and a net decrease in proceeds from sales and maturities of marketable securities.
Cash flow provided by financing activities in the year ended June 30, 2011 of $0.7 million was primarily due to an increase in proceeds from stock option exercises partially offset by dividend payments of $0.8 million to noncontrolling interests.
We currently have no debt or lines of credit. In the future, if the need for debt or credit lines arose, there is no assurance that we would be able to secure such financing. We believe we have sufficient operating flexibility and cash reserves to maintain adequate amounts of liquidity and to meet our future liquidity requirements for at least the next twelve months.
Fiscal 2010 Compared with Fiscal 2009
At June 30, 2010, cash, cash equivalents and marketable securities were $47.5 million, an increase of $10.8 million from $36.7 million at June 30, 2009. Our marketable security consisted of $1.0 million in a United States Treasury Bill as security for bank guarantees and standby letters of credit. These letters of credit were used primarily overseas to cover certain warranty periods and were valued at 10% of the associated contract value. As of June 30, 2010, $0.1 million in standby letters of credit are outstanding and were expected to expire at varying dates through July 2011. The cash equivalents balance in our money market account, which was invested primarily in U.S. government securities, was $22.1 million as of June 30, 2010.
Cash flows provided by operating activities from continuing operations were $15.1 million for fiscal 2010 compared with cash flows used for operating activities from continuing operations of $4.4 million in fiscal 2009. Operating cash flows in fiscal 2010 were impacted primarily by decreases in our net loss and a reduction of inventories.
Cash flows provided by investing activities for fiscal 2010 decreased by $13.3 million compared with the prior year period. This decrease was primarily related to a net decrease in proceeds and purchases of marketable securities of $16.9 million, partially offset by a decrease in fixed asset and intangible additions of $3.2 million.
Cash flows used for financing activities in the year ended June 30, 2010 decreased by $1.3 million compared with the prior year period. In fiscal 2009, there was a dividend payment of $1.3 million to a minority interest partner. A dividend was not paid in fiscal 2010 but was declared after June 30, 2010. The amount of that dividend payment is approximately $0.7 million.
31
CONTRACTUAL OBLIGATIONS
The following table summarizes our significant contractual obligations at June 30, 2011 and the effect such obligations are expected to have on our liquidity and cash flows in future periods.
|
|
|
|
|
|
|
|
|
|
|
|
|
|
|
|
|
|
|
|
|
Payments Due By Period |
|
|||||||||||||
|
|
|
Total |
|
Less
than |
|
1-3 years |
|
3-5 years |
|
More
than |
|
|||||
|
|
|
|
|
|
|
|
|
|
|
|
|
|||||
|
Operating leases |
|
$ |
1.3 |
|
$ |
0.8 |
|
$ |
0.5 |
|
$ |
— |
|
$ |
— |
|
|
|
||||||||||||||||
|
Deferred compensation and non-compete agreements |
|
|
1.4 |
|
|
0.6 |
|
|
0.6 |
|
|
0.2 |
|
|
— |
|
|
|
||||||||||||||||
|
Consulting agreement |
|
|
0.3 |
|
|
0.1 |
|
|
0.2 |
|
|
— |
|
|
— |
|
|
|
|
|
|
|
|
|
|
|
|
|
|
|
|
|
|
|
|
Total |
|
$ |
3.0 |
|
$ |
1.5 |
|
$ |
1.3 |
|
$ |
0.2 |
|
$ |
— |
|
|
|
|
|
|
|
|
|
|
|
|
|
|
|
|
|
|
|
OFF-BALANCE SHEET ARRANGEMENTS
We have not created and are not party to any special-purpose or off-balance sheet entities for the purpose of raising capital, incurring debt, or operating parts of our business that are not consolidated in our financial statements. We have not guaranteed any obligations of a third party.
32
Item 7A. Quantitative and Qualitative Disclosures about Market Risk
The following discussion about our market risk involves forward-looking statements. Actual results could differ materially from those projected in the forward-looking statements. We are exposed to market risk related to changes in interest rates, changes in the investment grade of marketable securities and foreign currency exchange rates. We do not use derivative financial instruments for speculative or trading purposes.
Interest Rate Sensitivity
We currently maintain a portfolio of cash equivalents
consisting of an institutional money market fund and marketable securities
consisting primarily of a government agency security and mutual fund. The
institutional money market fund, with a balance of $19.9 million, consists
primarily of U.S. treasury securities. The $1.0 million government agency
security consists of a U.S. government treasury bill. The mutual fund of $1.0
million, which is related to our deferred compensation program, consists of
corporate securities. Our interest income is sensitive to changes in the
general level of U.S. interest rates, particularly on our short-term
instruments. There is little downward exposure on our interest income. To the
extent interest rates increase or we change our investment strategy, there
could be an increase in investment income. The table below presents investment
amounts and related weighted average interest rates by year of maturity for our
investment portfolio.
|
|
|
|
|
|
|
|
|
|
|
|
|
Fair value of investments
as of June 30, 2011 maturing in: |
|
|||||||||
|
|
|
|
|
|
|
|
|
|
|
|
|
|
|
2012 |
|
2013 |
|
Thereafter |
|
|||
|
|
|
|
|
|
|
|
|
|||
|
Marketable securities |
|
|
|
|
|
|
|
|
|
|
|
Fixed rate investments |
|
$ |
1 |
|
$ |
0 |
|
$ |
0 |
|
|
Weighted average interest rate |
|
|
0.0 |
% |
|
0.0 |
% |
|
0.0 |
% |
|
|
|
|
|
|
|
|
|
|
|
|
Marketable Securities Fair Market Value
Sensitivity
We have reviewed current investment ratings, company
specific events and general economic conditions in determining whether there is
a significant decline in fair value that is other than temporary.
Exchange Rate Sensitivity
Approximately 77% of our fiscal 2011 net revenues were
denominated in U.S. dollars. At June 30, 2011, our backlog included bookings in
U.S. dollars of $57.0 million, or 92%, of the total backlog. Substantially all
of our costs are negotiated and paid in U.S. dollars. Significant changes in
the values of foreign currencies relative to the value of the U.S. dollar can
impact sales of our products in export markets as would changes in the general
economic conditions in those markets. For our net revenues that are based in
local currency, we are exposed to foreign exchange fluctuations from the time customers
are invoiced in local currency until collection occurs.
We enter into forward contracts to reduce the impact of adverse fluctuations on earnings associated with foreign currency exchange rate changes. We do not enter into any derivative transactions for speculative purposes. These forward contracts are entered into for periods consistent with the currency transaction exposures, generally three to nine months. Any gains and losses on the fair value of these contracts would largely offset corresponding losses and gains on the underlying transactions. The majority of our foreign currency transactions and foreign operations are denominated in the Japanese yen and euro. In the absence of a substantial increase in sales orders in currencies other than U.S. dollars, we believe a 5% appreciation or depreciation of the U.S. dollar against the euro and yen would have an immaterial impact on our consolidated financial position and results of operations.
Item 8. Financial Statements and Supplementary Data
Financial statements and supplementary data required pursuant to this item begin on Page F-1 of this Annual Report on Form 10-K.
Item 9. Changes in and Disagreements With Accountants on Accounting and Financial Disclosure
None.
33
Item 9A. Controls and Procedures
Our management, with the participation of our Chief Executive Officer and Chief Financial Officer, carried out an evaluation, as of the end of the period covered by this report, of the effectiveness of our disclosure controls and procedures (as such term is defined in Rules 13a-15(e) and 15d-15(e) under the Exchange Act). Based upon their evaluation, the Chief Executive Officer and Chief Financial Officer concluded that, as of the end of such period, our disclosure controls and procedures were effective in recording, processing, summarizing and reporting on a timely basis information required to be disclosed by us in the reports that we file or submit under the Exchange Act and were effective in ensuring that information required to be disclosed by us in the reports that we file or submit under the Exchange Act is accumulated and communicated to our management, including the Chief Executive Officer and Chief Financial Officer, as appropriate to allow timely decisions regarding required disclosure.
Report of Management on Zygo Corporation’s Internal Control Over Financial Reporting
We, as members of management of Zygo Corporation (the “Company”), are responsible for establishing and maintaining adequate internal control over financial reporting, as such term is identified in Exchange Act Rule 13a-15(f). The Company’s internal control over financial reporting is a process designed to provide reasonable assurance to the Company’s management and Board of Directors regarding the reliability of financial reporting and the preparation of financial statements for external purposes in accordance with accounting principles generally accepted in the United States of America. Internal control over financial reporting includes those policies and procedures that (1) pertain to the maintenance of records that, in reasonable detail, accurately and fairly reflect the transactions and dispositions of the assets of the Company; (2) provide reasonable assurance that transactions are recorded as necessary to permit preparation of financial statements in accordance with accounting principles generally accepted in the United States of America and that receipts and expenditures of the Company are being made only in accordance with authorizations of management and directors of the Company; and (3) provide reasonable assurance regarding prevention or timely detection of unauthorized acquisition, use, or disposition of the Company’s assets that could have a material effect on the consolidated financial statements.
Because of its
inherent limitations, internal control over financial reporting may not prevent
or detect misstatements. A control system, no matter how well conceived and
operated, can provide only reasonable, not absolute, assurance that the
objectives of the control system are met. Because of the inherent limitations
in all control systems, no evaluation of controls can provide absolute
assurance that all control issues and instances of fraud, if any, have been
detected. In addition, projections of any evaluation of effectiveness to future
periods are subject to the risk that controls may become inadequate because of
changes in conditions, or that the degree of compliance with the policies and
procedures may deteriorate.
On May 14, 2010, we reported that we had identified
a material weakness in our internal controls over financial reporting, which is
an integrated component of our disclosure controls and procedures, related to
inadequate controls regarding our accounting for unusual or complex
transactions. In light of this material weakness, we concluded that our
disclosure controls and procedures were not effective as of such date and
subsequently concluded that our internal control over financial reporting was
not effective at June 30, 2010.
We developed and implemented additional controls and new procedures in our financial reporting process in the fourth quarter of fiscal 2010 and first six months of fiscal 2011, including adding control processes to aid in identifying transactions that might include unusual or complex accounting issues as well as a process to enhance our analysis of accounting for unusual or complex transactions as they arise in accordance with accounting principles generally accepted in the United States of America. During the third quarter of fiscal 2011 we were able to complete our implementation of activities of controls and procedures that were designed to remediate the material weakness. These activities have been incorporated into our internal control structure and were in place as of March 31, 2011 and will be sustained going forward, such that the control deficiency that led to the material weakness had been remediated as of March 31, 2011 and, therefore, the material weakness no longer existed as of March 31, 2011.
34
The controls and remedial actions that were implemented include the following:
|
|
|
|
• |
Utilization of external accounting resources to review our accounting for unusual or complex transactions. |
|
• |
Implementation of clear procedures and sustainable processes for researching, reviewing assumptions used in estimates and calculations, and reviewing the work, assumptions and calculations used by outside service providers. |
|
• |
Implementation of controls to review potential impact of an unusual item on existing assets or liabilities. |
|
• |
Implementation of controls to review proper presentation and disclosure in the financial statements as it relates to unusual or complex transactions. |
Under the supervision and with the participation of management, including our principal executive and financial officers, we assessed the Company’s internal control over financial reporting as of June 30, 2011, based on criteria for effective internal control over financial reporting established in Internal Control - Integrated Framework issued by the Committee of Sponsoring Organizations of the Treadway Commission. Based on this assessment, we concluded that the Company maintained effective internal control over financial reporting as of June 30, 2011 based on the specified criteria.
There were no changes in our internal controls over financial reporting that occurred during our most recent fiscal quarter that have materially affected, or are reasonably likely to materially affect, our internal control over financial reporting.
Deloitte & Touche LLP, the independent registered public accounting firm that also audited the Company’s consolidated financial statements included in this Form 10-K, audited the operating effectiveness of internal control over financial reporting and issued their attestation report which is included on page F-2.
|
|
|
|
|
|
|
|
Zygo Corporation |
|
|
|
|
|
|
|
September 13, 2011 |
By: |
/s/ Chris L. Koliopoulos |
|
|
|
|
|
|
|
|
|
Chris L. Koliopoulos |
|
|
|
|
Chairman, President and Chief Executive Officer |
|
|
|
|
|
|
|
September 13, 2011 |
By: |
/s/ John P. Jordan |
|
|
|
|
|
|
|
|
|
John P. Jordan |
|
|
|
|
Vice President, Chief Financial Officer and Treasurer |
|
|
|
|
|
|
None.
35
Item 10. Directors, Executive Officers and Corporate Governance
Except for the information concerning executive officers which is set forth in Part I of this Annual Report on Form 10-K, information required by this item will be included under the captions “Election of Board of Directors” and “Corporate Governance” in our Proxy Statement to be filed pursuant to Regulation 14A for use in connection with our Company’s 2011 Annual Meeting of Stockholders (referred to below as our “2011 Proxy Statement”) and is incorporated herein by reference.
Item 11. Executive Compensation
Information required by this item will be included in our 2011 Proxy Statement under the captions “Compensation of Executive Officers” and “Corporate Governance” and is incorporated herein by reference.
Item 12. Security Ownership of Certain Beneficial Owners and Management and Related Stockholder Matters
Information required by this item will be included in our 2011 Proxy Statement under the captions “Equity Compensation Plan Information,” and “Security Ownership of Certain Beneficial Owners” and is incorporated herein by reference.
Item 13. Certain Relationships and Related Transactions, and Director Independence
Information required by this item will be included in our 2011 Proxy Statement under the captions “Certain Relationships and Related Transactions,” “Election of Board of Directors,” and “Corporate Governance” and is incorporated herein by reference.
Item 14. Principal Accountant Fees and Services
Information required by this item will be included in our 2011 Proxy Statement under the caption “Relationship with Independent Public Accountants” and is incorporated herein by reference.
36
Item 15. Exhibits, Financial Statement Schedules
|
|
|
|
|
(a) |
The following documents are filed as part of this report: |
|
|
|
|
|
|
|
1. and 2. |
Consolidated Financial Statements and Financial Statement Schedule: |
|
|
|
|
|
|
|
An index to the consolidated financial statements and financial statement schedule filed is located on page F-1. |
|
|
|
|
|
|
3. |
EXHIBITS |
|
|
|
|
|
|
3.(i) |
Restated Certificate of Incorporation of the Company and amendments thereto (Exhibit 3.(i) to the Company’s Annual Report on Form 10-K for its year ended June 30, 1993)* |
|
|
|
|
|
|
3.(ii) |
Certificate of Amendment of Certificate of Incorporation, filed June 3, 1996 (Exhibit 3.(ii) to the Company’s Annual Report on Form 10-K 405 for its year ended June 30, 1996)* |
|
|
|
|
|
|
3.(iii) |
By-laws of the Company (Exhibit (3)(b) to Registration No. 2-87253 on Form S-1 hereinafter “Registration No. 2-87253”)* |
|
|
|
|
|
|
10.1 |
Confidentiality and Non-Competition Agreement dated October 25, 1983, between the Company and Carl A. Zanoni (Exhibit (10)(b) to Registration No. 2-87253)* |
|
|
|
|
|
|
10.2 |
Agreement dated November 20, 1980, between the Company and Canon Inc. regarding exchange of information (Exhibit (10)(y) to Registration No. 2-87253)* |
|
|
|
|
|
|
10.3 |
Amended and Restated Zygo Corporation Profit Sharing Plan (Exhibit 10.15 to the Company’s Annual Report on Form 10-K 405 for its year ended June 30, 1995)* |
|
|
|
|
|
|
10.4 |
Zygo Corporation Amended and Restated Non-Qualified Stock Option Plan ratified and approved by the Company’s Stockholders on November 19, 1992 (Exhibit 10.30 to the Company’s Annual Report on Form 10-K for its year ended June 30, 1993)* |
|
|
|
|
|
|
10.5 |
Zygo Corporation Non-Employee Director Stock Option Plan ratified and approved by the Company’s Stockholders on November 17, 1994 (Exhibit 10.30 to the Company’s Annual Report on Form 10-K 405 for its year ended June 30, 1995)* |
|
|
|
|
|
|
10.6 |
Employment Agreement dated January 15, 1999, between Zygo Corporation and J. Bruce Robinson (Exhibit 10.34 to the Company’s Annual Report on Form 10-K 405 for its year ended June 30, 1999)* |
|
|
|
|
|
|
10.7 |
Zygo Corporation Amended and Restated Non-Employee Director Stock Option Plan ratified and approved by the Company’s Stockholders on November 17, 1999 (Exhibit to the Company’s Definitive Proxy Statement for its year ended June 30, 1999)* |
|
|
|
|
|
|
10.8 |
Subcontract B519044 between The Regents of The University of California Lawrence Livermore National Laboratory and Zygo Corporation dated January 14, 2002 (Exhibit 10.25 to the Company’s Annual Report on Form 10-K for its year ended June 30, 2002)* |
|
|
|
|
|
|
10.9 |
Zygo Corporation 2002 Equity Incentive Plan Restricted Stock Agreement. (Exhibit 10.1 to the Company’s Quarterly Report on Form 10-Q for its quarterly period ended September 30, 2005)* |
|
|
|
|
|
|
10.10 |
Zygo Corporation 2002 Equity Incentive Plan Stock Option Agreement. (Exhibit 10.2 to the Company’s Quarterly Report on Form 10-Q for its quarterly period ended September 30, 2005)* |
|
|
|
|
|
|
10.11 |
Employment contract dated November 20, 2006 between Zygo Corporation and John Stack. (Exhibit 10.2 to the Company’s Quarterly Report on Form 10-Q for its quarterly period ended December 31, 2006)* |
37
|
|
|
|
|
|
10.12 |
Agreement dated February 8, 2007 between Zygo Corporation and Carl A. Zanoni (Exhibit 10.1 to the Company’s Quarterly Report on Form 10-Q for its quarterly period ended March 31, 2007)* |
|
|
|
|
|
|
10.13 |
Employment contract dated June 15, 2007 between Zygo Corporation and Walter A. Shephard (Exhibit 10.23 to the Company’s Annual Report on Form 10-K for its year ended June 31, 2007)* |
|
|
|
|
|
|
10.14 |
Employment Agreement dated November 19, 2007 between Zygo Corporation and Douglas J. Eccleston (Exhibit 99.1 to the Company’s Current report on Form 8-K dated November 20, 2007)* |
|
|
|
|
|
|
10.15 |
Restricted Stock Unit Agreement dated January 31, 2008 between Zygo Corporation and J. Bruce Robinson (Exhibit 10.1 to the Company’s Quarterly Report on Form 10-Q for its quarterly period ended March 31, 2008)* |
|
|
|
|
|
|
10.16 |
Agreement and Plan of Merger and Reorganization between by and among Electro Scientific Industries, Inc., Zirkon Merger Sub, LLC, and Zygo Corporation (Exhibit 2.1 to the Company’s Current Reports on Form 8-K dated October 21, 2008)* |
|
|
|
|
|
|
10.17 |
Employment agreement amendments between Zygo Corporation and J. Bruce Robinson, and John M. Stack, dated October 21, 2008 (Exhibit 10.1 and 10.3, respectively, to the Company’s Current Reports on Form 8-K dated October 21, 2008)* |
|
|
|
|
|
|
10.18 |
Settlement Agreement and Mutual Release, dated as of April 2, 2009, by and among Electro Scientific Industries, Inc., Zirkon Merger Sub, LLC, and Zygo Corporation (Exhibit 2.1 to the Company’s Current Report on Form 8-K dated April 3, 2009)* |
|
|
|
|
|
|
10.19 |
Asset Transfer Agreement, dated as of June 17, 2009, by and between Zygo Corporation and Nanometrics Corporation (Exhibit 10.30 to the Company’s Annual Report on Form 10-K/A, Amendment No. 2, dated December 23, 2009 for its year ended June 30, 2009)* ** |
|
|
|
|
|
|
10.20 |
Supply Agreement, dated as of June 17, 2009, by and between Zygo Corporation and Nanometrics Corporation (Exhibit 10.31 to the Company’s Annual Report on Form 10-K/A, Amendment No. 2, dated December 23, 2009 for its year ended June 30, 2009)* ** |
|
|
|
|
|
|
10.21 |
Employment contract dated November 16, 2007 between Zygo Corporation and David Person (Exhibit 10.32 to the Company’s Annual Report on Form 10-K for its year ended June 30, 2009)* |
|
|
|
|
|
|
10.22 |
Employment agreement amendment between Zygo Corporation and John M. Stack, dated September 1, 2009 (Exhibit 99.1 to the Company’s Current Report on Form 8-K dated September 4, 2009)* |
|
|
|
|
|
|
10.23 |
Employment agreement amendment between Zygo Corporation and John M. Stack, dated September 8, 2009 (Exhibit 99.1 to the Company’s Current Report on Form 8-K dated September 11, 2009)* |
|
|
|
|
|
|
10.24 |
Employment agreement amendment (transition plan) between Zygo Corporation and J. Bruce Robinson, dated October 21, 2009 (Exhibit 99.1 to the Company’s Current Report on Form 8-K dated October 27, 2009)* ** |
|
|
|
|
|
|
10.25 |
Employment and Stock Option Agreement between Zygo Corporation and Dr. Chris L. Koliopoulos, dated January 18, 2010 (Exhibit 10.1 and 10.3 to the Company’s Current Report on Form 8-K dated January 22, 2010)* |
|
|
|
|
|
|
10.26 |
Zemetrics, Inc. acquisition agreement between ZMI Acquisition Corporation, a wholly-owned subsidiary of Zygo Corporation, and Zemetrics, Inc, dated January 18, 2010 (Exhibit 10.2 to the Company’s Current Report on Form 8-K dated January 22, 2010)* |
|
|
|
|
|
|
10.27 |
Asset Purchase Agreement, dated as of October 27, 2010, by and among Zygo Corporation, Zygo Richmond, and ASML, US, Inc. (Exhibit 10.1 to the Company’s Current Report on Form 10-Q for its quarter ending December 31, 2010)* ** |
38
|
|
|
|
|
|
10.28 |
Employment Agreement between Zygo Corporation and John P. Jordan, dated February 17, 2011 (Exhibit 10.1 to the Company’s Current Report on Form 8-K dated February 22, 2011)* |
|
|
|
|
|
|
14. |
Zygo Corporation Code of Ethics (Exhibit 14.1 to the Company’s Quarterly Report on Form 10-Q for its quarterly period ended March 26, 2004)* |
|
|
|
|
|
|
21. |
Subsidiaries of Registrant |
|
|
|
|
|
|
23.1 |
Consent of Independent Registered Public Accounting Firm |
|
|
|
|
|
|
24. |
Power of Attorney (included in the signature page) |
|
|
|
|
|
|
31.1 |
Certification Pursuant to Rule 13A-14(a) or 15D-14(a) of the Securities Exchange Act of 1934, as adopted pursuant to Section 302 of the Sarbanes-Oxley Act of 2002 |
|
|
|
|
|
|
31.2 |
Certification Pursuant to Rule 13A-14(a) or 15D-14(a) of the Securities Exchange Act of 1934, as adopted pursuant to Section 302 of the Sarbanes-Oxley Act of 2002 |
|
|
|
|
|
|
32.1 |
Certification Pursuant to 18 U.S.C. Section 1350, as adopted pursuant to Section 906 of the Sarbanes-Oxley Act of 2002 |
|
|
|
|
|
|
32.2 |
Certification Pursuant to 18 U.S.C. Section 1350, as adopted pursuant to Section 906 of the Sarbanes-Oxley Act of 2002 |
|
|
|
|
|
|
Exhibit numbers 10.3, 10.4, 10.5, 10.6, 10.7, 10.9, 10.10, 10.11, 10.13, 10.14, 10.15, 10.17, 10.21, 10.22, 10.23, 10.24, 10.25 and 10.28 are management contracts, compensatory plans or compensatory arrangements. |
|
|
|
|
|
|
* |
Incorporated herein by reference. |
|
|
|
|
|
|
** |
Confidential treatment has been requested for portions of this exhibit. Omitted portions have been filed separately with the Securities and Exchange Commission pursuant to Rule 24b-2 of the Securities Exchange Act of 1934, as amended. |
|
39
Pursuant to the requirements of Section 13 or 15(d) of the Securities Exchange Act of 1934, the registrant has duly caused this report to be signed on its behalf by the undersigned, thereunto duly authorized.
|
|
|
|
|
|
|
|
ZYGO CORPORATION |
|
|
|
|
|
|
|
|
|
|
|
|
|
Registrant |
|
|
|
|
|
|
|
|
|
|
|
|
|
By |
/s/ John P. Jordan |
|
Date |
September 13, 2011 |
|
|
|
|
|
|
|
|
|
|
John P. Jordan |
|
|
|
|
|
|
Vice President and Chief |
|
|
|
|
|
|
Financial Officer |
|
|
|
|
Know all persons by these presents, that each person whose signature appears below constitutes and appoints Chris L. Koliopoulos and John P. Jordan, jointly and severally, his attorneys-in-fact, each with the power of substitution, for each of them in any and all capacities, to sign any amendments to this report on Form 10-K, and to file the same, with exhibits thereto and other documents in connection therewith, with the Securities and Exchange Commission, hereby ratifying and confirming all that each of said attorney’s-in-fact, or his substitute or substitutes, may do or cause to be done by virtue hereof.
Pursuant to the requirements of the Securities Exchange Act of 1934, this report has been signed below by the following persons on behalf of the registrant and in the capacities and on the dates indicated.
|
|
|
|
|
|
|
/s/ Chris L. Koliopoulos |
|
Chairman, President, Chief Executive Officer (principal executive officer) and Director |
|
September 13, 2011 |
|
|
|
|
|
|
|
Chris L. Koliopoulos |
|
|
|
|
|
|
|
|
|
|
|
/s/ John P. Jordan |
|
Vice President and Chief Financial Officer (principal financial officer) |
|
September 13, 2011 |
|
|
|
|
|
|
|
John P. Jordan |
|
|
|
|
|
|
|
|
|
|
|
/s/ Stephen D. Fantone |
|
Director |
|
September 13, 2011 |
|
|
|
|
|
|
|
Stephen D. Fantone |
|
|
|
|
|
|
|
|
|
|
|
/s/ Samuel H. Fuller |
|
Director |
|
September 13, 2011 |
|
|
|
|
|
|
|
Samuel H. Fuller |
|
|
|
|
|
|
|
|
|
|
|
/s/ Seymour E. Liebman |
|
Director |
|
September 13, 2011 |
|
|
|
|
|
|
|
Seymour E. Liebman |
|
|
|
|
|
|
|
|
|
|
|
/s/ Robert B. Taylor |
|
Director |
|
September 13, 2011 |
|
|
|
|
|
|
|
Robert B. Taylor |
|
|
|
|
|
|
|
|
|
|
|
/s/ Carol P. Wallace |
|
Director |
|
September 13, 2011 |
|
|
|
|
|
|
|
Carol P. Wallace |
|
|
|
|
|
|
|
|
|
|
|
/s/ Gary K. Willis |
|
Director |
|
September 13, 2011 |
|
|
|
|
|
|
|
Gary K. Willis |
|
|
|
|
40
ZYGO CORPORATION AND CONSOLIDATED SUBSIDIARIES
Index to Consolidated Financial Statements and Schedule
|
|
|
|
|
Page |
|
|
|
|
|
|
|
|
|
|
|
F-2 |
|
|
|
|
|
|
|
F-3 |
|
|
|
|
|
|
|
F-4 |
|
Consolidated statements of operations for the years ended June 30, 2011, 2010, and 2009 |
|
|
|
|
|
F-5 |
|
|
|
|
|
|
|
F-6 |
|
Consolidated statements of cash flows for the years ended June 30, 2011, 2010, and 2009 |
|
|
|
|
|
F-7 to F-30 |
|
|
|
|
|
|
|
|
|
Supplemental Schedules |
|
|
|
|
|
S-1 |
|
|
|
|
|
|
All other schedules have been omitted since the required information is not present or not present in amounts sufficient to require submission of the schedules or the information required is included in the consolidated financial statements or notes thereto. |
F - 1
REPORT OF INDEPENDENT REGISTERED PUBLIC ACCOUNTING FIRM
To the Board
of Directors and Stockholders of Zygo Corporation
Middlefield, Connecticut
We have audited the accompanying consolidated balance sheets of Zygo Corporation and subsidiaries (the “Company”) as of June 30, 2011 and 2010, and the related consolidated statements of operations, equity and comprehensive income (loss), and cash flows for each of the three years in the period ended June 30, 2011. Our audits also included the consolidated financial statement schedule of the Company listed on page F-1 of this Annual Report on Form 10-K. We also have audited the Company’s internal control over financial reporting as of June 30, 2011, based on criteria established in Internal Control — Integrated Framework issued by the Committee of Sponsoring Organizations of the Treadway Commission. The Company’s management is responsible for these financial statements and financial statement schedule, for maintaining effective internal control over financial reporting, and for its assessment of the effectiveness of internal control over financial reporting, included in the accompanying “Report of Management on Zygo Corporation’s Internal Control over Financial Reporting” (Item 9A). Our responsibility is to express an opinion on these financial statements and financial statement schedule and an opinion on the Company’s internal control over financial reporting based on our audits.
We conducted our audits in accordance with the standards of the Public Company Accounting Oversight Board (United States). Those standards require that we plan and perform the audit to obtain reasonable assurance about whether the financial statements are free of material misstatement and whether effective internal control over financial reporting was maintained in all material respects. Our audits of the financial statements included examining, on a test basis, evidence supporting the amounts and disclosures in the financial statements, assessing the accounting principles used and significant estimates made by management, and evaluating the overall financial statement presentation. Our audit of internal control over financial reporting included obtaining an understanding of internal control over financial reporting, assessing the risk that a material weakness exists, and testing and evaluating the design and operating effectiveness of internal control based on the assessed risk. Our audits also included performing such other procedures as we considered necessary in the circumstances. We believe that our audits provide a reasonable basis for our opinions.
A company’s internal control over financial reporting is a process designed by, or under the supervision of, the company’s principal executive and principal financial officers, or persons performing similar functions, and effected by the company’s board of directors, management, and other personnel to provide reasonable assurance regarding the reliability of financial reporting and the preparation of financial statements for external purposes in accordance with generally accepted accounting principles. A company’s internal control over financial reporting includes those policies and procedures that (1) pertain to the maintenance of records that, in reasonable detail, accurately and fairly reflect the transactions and dispositions of the assets of the company; (2) provide reasonable assurance that transactions are recorded as necessary to permit preparation of financial statements in accordance with generally accepted accounting principles, and that receipts and expenditures of the company are being made only in accordance with authorizations of management and directors of the company; and (3) provide reasonable assurance regarding prevention or timely detection of unauthorized acquisition, use, or disposition of the company’s assets that could have a material effect on the financial statements.
Because of the inherent limitations of internal control over financial reporting, including the possibility of collusion or improper management override of controls, material misstatements due to error or fraud may not be prevented or detected on a timely basis. Also, projections of any evaluation of the effectiveness of the internal control over financial reporting to future periods are subject to the risk that the controls may become inadequate because of changes in conditions, or that the degree of compliance with the policies or procedures may deteriorate.
In our opinion, the consolidated financial statements referred to above present fairly, in all material respects, the consolidated financial position of Zygo Corporation and subsidiaries as of June 30, 2011 and 2010, and the consolidated results of their operations and their cash flows for each of the three years in the period ended June 30, 2011, in conformity with accounting principles generally accepted in the United States of America. Also, in our opinion, such financial statement schedule, when considered in relation to the basic consolidated financial statements taken as a whole, presents fairly, in all material respects, the information set forth therein. Also, in our opinion, the Company maintained, in all material respects, effective internal control over financial reporting as of June 30, 2011, based on the criteria established in Internal Control — Integrated Framework issued by the Committee of Sponsoring Organizations of the Treadway Commission.
/s/ Deloitte & Touche LLP
Hartford, Connecticut
September 13, 2011
F - 2
CONSOLIDATED
BALANCE SHEETS
(Thousands of dollars, except share amounts)
|
|
|
|
|
|
|
|
|
|
|
|
June 30, 2011 |
|
June 30, 2010 |
|
||
|
|
|
|
|
|
|
||
|
Assets |
|
|
|
|
|
|
|
|
Current assets: |
|
|
|
|
|
|
|
|
Cash and cash equivalents |
|
$ |
60,039 |
|
$ |
46,536 |
|
|
Marketable securities (note 4) |
|
|
1,000 |
|
|
1,000 |
|
|
Receivables, net of allowance for doubtful accounts of $1,399 and $1,975, respectively (notes 6 and 17) |
|
|
31,424 |
|
|
19,948 |
|
|
Inventories (note 7) |
|
|
28,379 |
|
|
25,220 |
|
|
Prepaid expenses and other current assets |
|
|
1,745 |
|
|
1,643 |
|
|
Income tax receivable (note 15) |
|
|
— |
|
|
1,050 |
|
|
Current assets of discontinued operations (note 20) |
|
|
— |
|
|
17 |
|
|
|
|
|
|
|
|
|
|
|
Total current assets |
|
|
122,587 |
|
|
95,414 |
|
|
Marketable securities (note 4) |
|
|
980 |
|
|
922 |
|
|
Property, plant and equipment, net (note 8) |
|
|
30,195 |
|
|
23,029 |
|
|
Intangible assets, net (note 9) |
|
|
5,842 |
|
|
5,387 |
|
|
Other assets |
|
|
— |
|
|
413 |
|
|
|
|
|
|
|
|
|
|
|
Total assets |
|
$ |
159,604 |
|
$ |
125,165 |
|
|
|
|
|
|
|
|
|
|
|
Liabilities and Equity |
|
|
|
|
|
|
|
|
Current liabilities: |
|
|
|
|
|
|
|
|
Accounts payable |
|
$ |
7,120 |
|
$ |
8,426 |
|
|
Accrued progress payments and deferred revenue |
|
|
4,706 |
|
|
5,700 |
|
|
Accrued salaries and wages |
|
|
8,636 |
|
|
3,173 |
|
|
Other accrued expenses (note 10) |
|
|
6,093 |
|
|
5,191 |
|
|
Income taxes payable |
|
|
550 |
|
|
152 |
|
|
Current liabilities of discontinued operations (note 20) |
|
|
281 |
|
|
287 |
|
|
|
|
|
|
|
|
|
|
|
Total current liabilities |
|
|
27,386 |
|
|
22,929 |
|
|
|
|
|
|
|
|
|
|
|
Other long-term liabilities |
|
|
4,131 |
|
|
1,359 |
|
|
Long-term liabilities of discontinued operations (note 20) |
|
|
— |
|
|
281 |
|
|
|
|
|
|
|
|
|
|
|
Commitments and contingencies (note 11) |
|
|
|
|
|
|
|
|
|
|
|
|
|
|
|
|
|
Equity (notes 13 and 14): |
|
|
|
|
|
|
|
|
Common stock, $.10 par value per share: |
|
|
|
|
|
|
|
|
40,000,000 shares authorized; |
|
|
|
|
|
|
|
|
19,985,631 shares issued (19,663,414 in 2010); |
|
|
|
|
|
|
|
|
17,763,346 shares outstanding (17,480,219 in 2010) |
|
|
1,999 |
|
|
1,966 |
|
|
Additional paid-in capital |
|
|
168,662 |
|
|
163,052 |
|
|
Accumulated deficit |
|
|
(20,765 |
) |
|
(39,844 |
) |
|
Accumulated other comprehensive income (loss): |
|
|
|
|
|
|
|
|
Currency translation effects |
|
|
1,197 |
|
|
(728 |
) |
|
Less treasury stock, at cost; 2,222,285 common shares (2,183,195 in 2010) |
|
|
26,373 |
|
|
26,043 |
|
|
|
|
|
|
|
|
|
|
|
Total stockholders’ equity - Zygo Corporation |
|
|
124,720 |
|
|
98,403 |
|
|
Noncontrolling interests |
|
|
3,367 |
|
|
2,193 |
|
|
|
|
|
|
|
|
|
|
|
Total equity |
|
|
128,087 |
|
|
100,596 |
|
|
|
|
|
|
|
|
|
|
|
Total liabilities and equity |
|
$ |
159,604 |
|
$ |
125,165 |
|
|
|
|
|
|
|
|
|
|
See accompanying notes to consolidated financial statements.
F - 3
CONSOLIDATED
STATEMENTS OF OPERATIONS
(Thousands except per share amounts)
|
|
|
|
|
|
|
|
|
|
|
|
|
|
|
Fiscal Year Ended June 30, |
|
|||||||
|
|
|
|
|
|||||||
|
|
|
2011 |
|
2010 |
|
2009 |
|
|||
|
|
|
|
|
|
|
|
|
|||
|
|
|
|
|
|
|
|
|
|
|
|
|
Net revenues |
|
$ |
150,126 |
|
$ |
101,330 |
|
$ |
114,734 |
|
|
Cost of goods sold |
|
|
79,333 |
|
|
59,361 |
|
|
82,301 |
|
|
|
|
|
|
|
|
|
|
|
|
|
|
Gross profit |
|
|
70,793 |
|
|
41,969 |
|
|
32,433 |
|
|
|
|
|
|
|
|
|
|
|
|
|
|
Selling, general and administrative expenses |
|
|
34,705 |
|
|
29,520 |
|
|
49,243 |
|
|
Research, development and engineering expenses |
|
|
14,990 |
|
|
14,284 |
|
|
23,234 |
|
|
Impairment of goodwill |
|
|
— |
|
|
2,003 |
|
|
— |
|
|
|
|
|
|
|
|
|
|
|
|
|
|
Operating profit (loss) |
|
|
21,098 |
|
|
(3,838 |
) |
|
(40,044 |
) |
|
|
|
|
|
|
|
|
|
|
|
|
|
|
|
|
|
|
|
|
|
|
|
|
|
Other income: |
|
|
|
|
|
|
|
|
|
|
|
Interest income |
|
|
26 |
|
|
87 |
|
|
885 |
|
|
Miscellaneous income, net |
|
|
784 |
|
|
51 |
|
|
142 |
|
|
|
|
|
|
|
|
|
|
|
|
|
|
Total other income |
|
|
810 |
|
|
138 |
|
|
1,027 |
|
|
|
|
|
|
|
|
|
|
|
|
|
|
Earnings (loss) from continuing operations before income tax expense, including noncontrolling interest |
|
|
21,908 |
|
|
(3,700 |
) |
|
(39,017 |
) |
|
Income tax (expense) benefit (note 15) |
|
|
(1,316 |
) |
|
1,032 |
|
|
(22,193 |
) |
|
|
|
|
|
|
|
|
|
|
|
|
|
Net earnings (loss) from continuing operations |
|
|
20,592 |
|
|
(2,668 |
) |
|
(61,210 |
) |
|
Net earnings (loss) from discontinued operations, net of tax (note 20) |
|
|
91 |
|
|
(2,669 |
) |
|
(4,059 |
) |
|
|
|
|
|
|
|
|
|
|
|
|
|
Net earnings (loss) including noncontrolling interests |
|
|
20,683 |
|
|
(5,337 |
) |
|
(65,269 |
) |
|
Less: Net earnings attributable to noncontrolling interests |
|
|
1,604 |
|
|
957 |
|
|
795 |
|
|
|
|
|
|
|
|
|
|
|
|
|
|
Net earnings (loss) attributable to Zygo Corporation |
|
$ |
19,079 |
|
$ |
(6,294 |
) |
$ |
(66,064 |
) |
|
|
|
|
|
|
|
|
|
|
|
|
|
|
|
|
|
|
|
|
|
|
|
|
|
Basic - Earnings (loss) per share attributable to Zygo Corporation: |
|
|
|
|
|
|
|
|
|
|
|
Continuing operations |
|
$ |
1.08 |
|
$ |
(0.21 |
) |
$ |
(3.68 |
) |
|
Discontinued operations |
|
|
— |
|
|
(0.16 |
) |
|
(0.24 |
) |
|
|
|
|
|
|
|
|
|
|
|
|
|
Net earnings (loss) per share |
|
$ |
1.08 |
|
$ |
(0.37 |
) |
$ |
(3.92 |
) |
|
|
|
|
|
|
|
|
|
|
|
|
|
|
|
|
|
|
|
|
|
|
|
|
|
Diluted - Earnings (loss) per share attributable to Zygo Corporation: |
|
|
|
|
|
|
|
|
|
|
|
Continuing operations |
|
$ |
1.05 |
|
$ |
(0.21 |
) |
$ |
(3.68 |
) |
|
Discontinued operations |
|
|
— |
|
|
(0.16 |
) |
|
(0.24 |
) |
|
|
|
|
|
|
|
|
|
|
|
|
|
Net earnings (loss) per share |
|
$ |
1.05 |
|
$ |
(0.37 |
) |
$ |
(3.92 |
) |
|
|
|
|
|
|
|
|
|
|
|
|
|
|
|
|
|
|
|
|
|
|
|
|
|
Weighted average number of shares: |
|
|
|
|
|
|
|
|
|
|
|
Basic |
|
|
17,639 |
|
|
17,183 |
|
|
16,843 |
|
|
|
|
|
|
|
|
|
|
|
|
|
|
Diluted |
|
|
18,140 |
|
|
17,183 |
|
|
16,843 |
|
|
|
|
|
|
|
|
|
|
|
|
|
|
Amounts Attributable to Zygo Corporation |
|
|
|
|
|
|
|
|
|
|
|
Net earnings (loss) from continuing operations attributable to Zygo Corporation |
|
$ |
18,988 |
|
$ |
(3,625 |
) |
$ |
(62,005 |
) |
|
Discontinued operations, net of tax (note 20) |
|
|
91 |
|
|
(2,669 |
) |
|
(4,059 |
) |
|
|
|
|
|
|
|
|
|
|
|
|
|
Net earnings (loss) attributable to Zygo Corporation |
|
$ |
19,079 |
|
$ |
(6,294 |
) |
$ |
(66,064 |
) |
|
|
|
|
|
|
|
|
|
|
|
|
See accompanying notes to consolidated financial statements.
F - 4
CONSOLIDATED
STATEMENTS OF EQUITY AND COMPREHENSIVE INCOME (LOSS)
(Dollars and shares in thousands)
|
|
|
|
|
|
|
|
|
|
|
|
|
|
|
|
|
|
|
|
|
|
|
|
|
|
|
|
|
|
|
|
|
|
|
|
|
|
|
|
|
|
|
|
|
Retained
Earnings |
|
Accumulated
Other |
|
|
|
|
|
|
|
Comprehensive |
|
|||||||||||||||
|
|
|
Common Stock |
|
Additional |
|
Treasury Stock |
|
|
|
Total |
|
Non- |
|
Total |
|
|
||||||||||||||||||
|
|
|
|
|
|
|
|
|
|
|
|
|
|
||||||||||||||||||||||
|
|
|
Shares |
|
Amount |
|
|
Shares |
|
Amount |
|
|
|
|
|
|
|
||||||||||||||||||
|
|
|
|
|
|
|
|
|
|
|
|
|
|
|
|
|
|
|
|
|
|
|
|
|
|||||||||||
|
Balance at July 1, 2008 |
|
|
16,732 |
|
$ |
1,882 |
|
$ |
152,663 |
|
|
2,092 |
|
$ |
(25,390 |
) |
$ |
32,514 |
|
$ |
855 |
|
$ |
162,524 |
|
$ |
2,266 |
|
$ |
164,790 |
|
|
|
|
|
|
||||||||||||||||||||||||||||||||||
|
Comprehensive income (loss): |
|
|
|
|
|
|
|
|
|
|
|
|
|
|
|
|
|
|
|
|
|
|
|
|
|
|
|
|
|
|
|
|
|
|
|
Net earnings (loss) |
|
|
— |
|
|
— |
|
|
— |
|
|
— |
|
|
— |
|
|
(66,064 |
) |
|
— |
|
|
(66,064 |
) |
|
795 |
|
|
(65,269 |
) |
$ |
(66,064 |
) |
|
Unrealized gain (loss) on marketable securities |
|
|
— |
|
|
— |
|
|
— |
|
|
— |
|
|
— |
|
|
— |
|
|
39 |
|
|
39 |
|
|
— |
|
|
39 |
|
|
39 |
|
|
Foreign currency translation |
|
|
— |
|
|
— |
|
|
— |
|
|
— |
|
|
— |
|
|
— |
|
|
(1,200 |
) |
|
(1,200 |
) |
|
(315 |
) |
|
(1,515 |
) |
|
(1,200 |
) |
|
|
|
|
|
|
|
|
|
|
|
|
|
|
|
|
|
|
|
|
|
|
|
|
|
|
|
|
|
|
|
|
|
|
|
|
|
|
|
|
|
|
|
|
|
|
|
|
|
|
|
|
|
|
|
|
|
|
|
|
|
|
|
|
|
|
|
|
|
$ |
(67,225 |
) |
|
|
|
|
|
|
|
|
|
|
|
|
|
|
|
|
|
|
|
|
|
|
|
|
|
|
|
|
|
|
|
|
|
|
|
|
|
Share based compensation |
|
|
— |
|
|
— |
|
|
2,924 |
|
|
— |
|
|
— |
|
|
— |
|
|
— |
|
|
2,924 |
|
|
— |
|
|
2,924 |
|
|
|
|
|
Employee stock purchase |
|
|
26 |
|
|
3 |
|
|
204 |
|
|
— |
|
|
— |
|
|
— |
|
|
— |
|
|
207 |
|
|
— |
|
|
207 |
|
|
|
|
|
Tax effect of redeemed restricted stock |
|
|
136 |
|
|
17 |
|
|
(17 |
) |
|
37 |
|
|
(251 |
) |
|
— |
|
|
— |
|
|
(251 |
) |
|
— |
|
|
(251 |
) |
|
|
|
|
Exercise of employee stock options and related tax effect |
|
|
21 |
|
|
2 |
|
|
402 |
|
|
— |
|
|
— |
|
|
— |
|
|
— |
|
|
404 |
|
|
— |
|
|
404 |
|
|
|
|
|
Dividend Paid |
|
|
— |
|
|
— |
|
|
— |
|
|
— |
|
|
— |
|
|
— |
|
|
— |
|
|
— |
|
|
(1,302 |
) |
|
(1,302 |
) |
|
|
|
|
|
|
|
|
|
|
|
|
|
|
|
|
|
|
|
|
|
|
|
|
|
|
|
|
|
|
|
|
|
|
|
|
|
|
|
|
Balance at June 30, 2009 |
|
|
16,915 |
|
$ |
1,904 |
|
$ |
156,176 |
|
|
2,129 |
|
$ |
(25,641 |
) |
$ |
(33,550 |
) |
$ |
(306 |
) |
$ |
98,583 |
|
$ |
1,444 |
|
$ |
100,027 |
|
|
|
|
|
|
|
|
|
|
|
|
|
|
|
|
|
|
|
|
|
|
|
|
|
|
|
|
|
|
|
|
|
|
|
|
|
|
|
|
|
Comprehensive income (loss): |
|
|
|
|
|
|
|
|
|
|
|
|
|
|
|
|
|
|
|
|
|
|
|
|
|
|
|
|
|
|
|
|
|
|
|
Net earnings (loss) |
|
|
— |
|
|
— |
|
|
— |
|
|
— |
|
|
— |
|
|
(6,294 |
) |
|
— |
|
|
(6,294 |
) |
|
957 |
|
|
(5,337 |
) |
$ |
(6,294 |
) |
|
Foreign currency translation |
|
|
— |
|
|
— |
|
|
— |
|
|
— |
|
|
— |
|
|
— |
|
|
(422 |
) |
|
(422 |
) |
|
(208 |
) |
|
(630 |
) |
|
(422 |
) |
|
|
|
|
|
|
|
|
|
|
|
|
|
|
|
|
|
|
|
|
|
|
|
|
|
|
|
|
|
|
|
|
|
|
|
|
|
|
|
|
|
|
|
|
|
|
|
|
|
|
|
|
|
|
|
|
|
|
|
|
|
|
|
|
|
|
|
|
|
$ |
(6,716 |
) |
|
|
|
|
|
|
|
|
|
|
|
|
|
|
|
|
|
|
|
|
|
|
|
|
|
|
|
|
|
|
|
|
|
|
|
|
|
Share based compensation |
|
|
— |
|
|
— |
|
|
2,556 |
|
|
— |
|
|
— |
|
|
— |
|
|
— |
|
|
2,556 |
|
|
— |
|
|
2,556 |
|
|
|
|
|
Issuance - acquisition |
|
|
361 |
|
|
36 |
|
|
3,865 |
|
|
— |
|
|
— |
|
|
— |
|
|
— |
|
|
3,901 |
|
|
— |
|
|
3,901 |
|
|
|
|
|
Tax effect of redeemed restricted stock |
|
|
147 |
|
|
22 |
|
|
(22 |
) |
|
54 |
|
|
(407 |
) |
|
— |
|
|
— |
|
|
(407 |
) |
|
— |
|
|
(407 |
) |
|
|
|
|
Exercise of employee stock options and related tax effect |
|
|
57 |
|
|
4 |
|
|
477 |
|
|
— |
|
|
5 |
|
|
— |
|
|
— |
|
|
486 |
|
|
— |
|
|
486 |
|
|
|
|
|
|
|
|
|
|
|
|
|
|
|
|
|
|
|
|
|
|
|
|
|
|
|
|
|
|
|
|
|
|
|
|
|
|
|
|
|
Balance at June 30, 2010 |
|
|
17,480 |
|
$ |
1,966 |
|
$ |
163,052 |
|
|
2,183 |
|
$ |
(26,043 |
) |
$ |
(39,844 |
) |
$ |
(728 |
) |
$ |
98,403 |
|
$ |
2,193 |
|
$ |
100,596 |
|
|
|
|
|
|
|
|
|
|
|
|
|
|
|
|
|
|
|
|
|
|
|
|
|
|
|
|
|
|
|
|
|
|
|
|
|
|
|
|
|
Comprehensive income (loss): |
|
|
|
|
|
|
|
|
|
|
|
|
|
|
|
|
|
|
|
|
|
|
|
|
|
|
|
|
|
|
|
|
|
|
|
Net earnings (loss) |
|
|
— |
|
|
— |
|
|
— |
|
|
— |
|
|
— |
|
|
19,079 |
|
|
— |
|
|
19,079 |
|
|
1,604 |
|
|
20,683 |
|
$ |
19,079 |
|
|
Foreign currency translation |
|
|
— |
|
|
— |
|
|
— |
|
|
— |
|
|
— |
|
|
— |
|
|
1,925 |
|
|
1,925 |
|
|
393 |
|
|
2,318 |
|
|
1,925 |
|
|
|
|
|
|
|
|
|
|
|
|
|
|
|
|
|
|
|
|
|
|
|
|
|
|
|
|
|
|
|
|
|
|
|
|
|
|
|
|
|
|
|
|
|
|
|
|
|
|
|
|
|
|
|
|
|
|
|
|
|
|
|
|
|
|
|
|
|
|
$ |
21,004 |
|
|
|
|
|
|
|
|
|
|
|
|
|
|
|
|
|
|
|
|
|
|
|
|
|
|
|
|
|
|
|
|
|
|
|
|
|
|
Share based compensation |
|
|
— |
|
|
— |
|
|
3,965 |
|
|
— |
|
|
— |
|
|
— |
|
|
— |
|
|
3,965 |
|
|
— |
|
|
3,965 |
|
|
|
|
|
Tax effect of redeemed restricted stock |
|
|
116 |
|
|
15 |
|
|
(15 |
) |
|
39 |
|
|
(330 |
) |
|
— |
|
|
— |
|
|
(330 |
) |
|
— |
|
|
(330 |
) |
|
|
|
|
Exercise of employee stock options and related tax effect |
|
|
167 |
|
|
18 |
|
|
1,660 |
|
|
— |
|
|
— |
|
|
— |
|
|
— |
|
|
1,678 |
|
|
— |
|
|
1,678 |
|
|
|
|
|
Dividends paid |
|
|
— |
|
|
— |
|
|
— |
|
|
— |
|
|
— |
|
|
— |
|
|
— |
|
|
— |
|
|
(823 |
) |
|
(823 |
) |
|
|
|
|
|
|
|
|
|
|
|
|
|
|
|
|
|
|
|
|
|
|
|
|
|
|
|
|
|
|
|
|
|
|
|
|
|
|
|
|
Balance at June 30, 2011 |
|
|
17,763 |
|
$ |
1,999 |
|
$ |
168,662 |
|
|
2,222 |
|
$ |
(26,373 |
) |
$ |
(20,765 |
) |
$ |
1,197 |
|
$ |
124,720 |
|
$ |
3,367 |
|
$ |
128,087 |
|
|
|
|
|
|
|
|
|
|
|
|
|
|
|
|
|
|
|
|
|
|
|
|
|
|
|
|
|
|
|
|
|
|
|
|
|
|
|
|
See accompanying notes to consolidated financial statements.
F - 5
CONSOLIDATED
STATEMENTS OF CASH FLOWS
(Thousands of dollars)
|
|
|
|
|
|
|
|
|
|
|
|
|
|
|
Fiscal Year Ended June 30, |
|
|||||||
|
|
|
|
|
|||||||
|
|
|
2011 |
|
2010 |
|
2009 |
|
|||
|
|
|
|
|
|
|
|
|
|||
|
Cash provided by (used for) operating activities: |
|
|
|
|
|
|
|
|
|
|
|
Net earnings (loss) including noncontrolling interests |
|
$ |
20,683 |
|
$ |
(5,337 |
) |
$ |
(65,269 |
) |
|
Adjustments to reconcile net earnings (loss) to cash provided by (used for) operating activities: |
|
|
|
|
|
|
|
|
|
|
|
(Earnings) loss from discontinued operations |
|
|
(91 |
) |
|
2,669 |
|
|
4,059 |
|
|
Depreciation and amortization |
|
|
6,431 |
|
|
6,125 |
|
|
7,960 |
|
|
Gain on acquisition |
|
|
(1,296 |
) |
|
— |
|
|
— |
|
|
Deferred income taxes |
|
|
(780 |
) |
|
(789 |
) |
|
20,990 |
|
|
Impairment of marketable securities |
|
|
— |
|
|
— |
|
|
309 |
|
|
Impairment and disposal of property, plant and equipment |
|
|
549 |
|
|
67 |
|
|
4,656 |
|
|
Impairment and disposal of intangible assets |
|
|
4 |
|
|
2,003 |
|
|
3,983 |
|
|
Restructuring charges |
|
|
— |
|
|
— |
|
|
452 |
|
|
Inventory valuation adjustment |
|
|
— |
|
|
543 |
|
|
3,567 |
|
|
Provision for doubtful accounts |
|
|
(298 |
) |
|
(586 |
) |
|
3,157 |
|
|
Compensation cost related to share-based payment arrangements |
|
|
3,965 |
|
|
2,492 |
|
|
2,885 |
|
|
Excess tax benefits from share-based payment arrangements |
|
|
(173 |
) |
|
(33 |
) |
|
(9 |
) |
|
Other |
|
|
(677 |
) |
|
(379 |
) |
|
(392 |
) |
|
Changes in operating accounts, excluding the effect of acquisition: |
|
|
|
|
|
|
|
|
|
|
|
Receivables |
|
|
(10,381 |
) |
|
1,446 |
|
|
10,661 |
|
|
Inventories |
|
|
(125 |
) |
|
5,314 |
|
|
(208 |
) |
|
Prepaid expenses and other current assets |
|
|
1,494 |
|
|
1,247 |
|
|
(86 |
) |
|
Accounts payable, accrued expenses and taxes payable |
|
|
1,340 |
|
|
270 |
|
|
(1,111 |
) |
|
|
|
|
|
|
|
|
|
|
|
|
|
Net cash provided by (used for) operating activities from continuing operations |
|
|
20,645 |
|
|
15,052 |
|
|
(4,396 |
) |
|
|
|
|
|
|
|
|
|
|
|
|
|
Net cash used for operating activities from discontinued operations |
|
|
(263 |
) |
|
(1,542 |
) |
|
(2,034 |
) |
|
|
|
|
|
|
|
|
|
|
|
|
|
Cash provided by (used for) investing activities: |
|
|
|
|
|
|
|
|
|
|
|
Additions to property, plant and equipment |
|
|
(1,522 |
) |
|
(1,441 |
) |
|
(4,255 |
) |
|
Purchase of marketable securities |
|
|
(1,998 |
) |
|
(2,288 |
) |
|
(8,174 |
) |
|
Additions to intangibles and other assets |
|
|
(906 |
) |
|
(505 |
) |
|
(950 |
) |
|
Investments and acquisitions, excluding cash acquired |
|
|
(7,142 |
) |
|
11 |
|
|
— |
|
|
Proceeds from the sale and maturity of marketable securities |
|
|
2,136 |
|
|
5,000 |
|
|
27,812 |
|
|
Proceeds from the sale of other assets and the formation of the joint venture |
|
|
63 |
|
|
291 |
|
|
11 |
|
|
|
|
|
|
|
|
|
|
|
|
|
|
Net cash provided by (used for) investing activities |
|
|
(9,369 |
) |
|
1,068 |
|
|
14,444 |
|
|
|
|
|
|
|
|
|
|
|
|
|
|
Cash provided by (used for) financing activities: |
|
|
|
|
|
|
|
|
|
|
|
Dividend payments to noncontrolling interests |
|
|
(823 |
) |
|
— |
|
|
(1,301 |
) |
|
Employee stock purchase |
|
|
— |
|
|
— |
|
|
207 |
|
|
Excess tax benefits from share-based payment arrangements |
|
|
173 |
|
|
33 |
|
|
9 |
|
|
Restricted stock vesting and related tax benefits |
|
|
(330 |
) |
|
(407 |
) |
|
(251 |
) |
|
Exercise of employee stock options |
|
|
1,678 |
|
|
486 |
|
|
185 |
|
|
|
|
|
|
|
|
|
|
|
|
|
|
Net cash provided by (used for) financing activities |
|
|
698 |
|
|
112 |
|
|
(1,151 |
) |
|
|
|
|
|
|
|
|
|
|
|
|
|
Effect of exchange rate changes on cash and cash equivalents |
|
|
1,792 |
|
|
(877 |
) |
|
(561 |
) |
|
|
|
|
|
|
|
|
|
|
|
|
|
Net increase in cash and cash equivalents |
|
|
13,503 |
|
|
13,813 |
|
|
6,302 |
|
|
Cash and cash equivalents, beginning of year |
|
|
46,536 |
|
|
32,723 |
|
|
26,421 |
|
|
|
|
|
|
|
|
|
|
|
|
|
|
Cash and cash equivalents, end of year |
|
$ |
60,039 |
|
$ |
46,536 |
|
$ |
32,723 |
|
|
|
|
|
|
|
|
|
|
|
|
|
See accompanying notes to consolidated financial statements.
F - 6
NOTES TO CONSOLIDATED FINANCIAL STATEMENTS
Years Ended June 30, 2011, 2010, and 2009
(Dollars in thousands, except for per share amounts)
NOTE 1: SUMMARY OF SIGNIFICANT ACCOUNTING POLICIES
Description of Operations and Principles of
Consolidation
Zygo Corporation is a worldwide supplier of optical
metrology instruments, precision optics, and electro-optical design and
manufacturing services, serving customers in the semiconductor capital
equipment and industrial markets. The accompanying consolidated financial
statements are prepared in conformity with accounting principles generally
accepted in the United States of America (U.S. “GAAP”) and include the accounts
of Zygo Corporation and its subsidiaries (“Zygo,” “we,” “us,” “our” or
“Company”). All transactions and accounts with the subsidiaries have been
eliminated from the consolidated financial statements. Noncontrolling interest
related to our ownership interests of less than 100% is reported as
noncontrolling interest in subsidiaries in the consolidated balance sheets. Net
earnings attributable to the noncontrolling interest, net of
tax, is reported as Net earnings attributable to noncontrolling interest in the
consolidated statements of operations.
Discontinued Operations
The Company classifies operations as discontinued when
the operations have either ceased, or are expected to be disposed of in a sale
transaction in the near term, the operations and cash flows of all discontinued
operations have been eliminated or will be eliminated upon the ceasing of
operations or the consummation of an expected sale transaction, and the Company
will not have any significant continuing involvement in the discontinued
operations. Impairment or disposal of long-lived assets requires the
calculation of estimated fair value less cost to sell of long-lived assets for
assets held for sale. The calculation of estimated fair value less cost to sell
includes significant estimates and assumptions, including, but not limited to:
operating projections; excess working capital levels; property values; and the
anticipated costs involved in the selling process.
As more fully described in Note 20, “Discontinued Operations”, we have discontinued the Singapore Integrated Circuit (“IC”) packaging metrology operations of our Vision Systems product line, which was included in our Metrology Solutions segment.
Reclassifications
Certain amounts have been reclassified to conform to
current-year presentations related to assets measured at fair value.
Translation of Foreign Currency Financial
Statements
Zygo’s reporting currency is the U.S. dollar. The
functional currency of our foreign subsidiaries is their local currency and
amounts included in the consolidated statements of operations are translated at
the weighted-average exchange rates prevailing during the period. Assets and
liabilities are translated at the rates of exchange in effect at the balance
sheet date, and resulting foreign exchange translation adjustments are recorded
in the consolidated balance sheets as a component of accumulated other
comprehensive income (loss).
Foreign Currency Transactions
Monetary assets and liabilities denominated in
currencies other than the functional currency are remeasured into their
respective functional currencies at exchange rates in effect at the balance
sheet date. The resulting exchange gain or loss is included in our consolidated
statements of operations as miscellaneous income, net.
Cash and Cash Equivalents
We consider cash and investments in securities with
maturities at the date of purchase of three months or less to be cash and cash
equivalents.
Marketable Securities
We consider investments in securities with maturities
at the date of purchase in excess of three months as marketable securities.
Marketable securities consist of government agency and corporate securities.
Securities held by us at June 30, 2011 and 2010 were classified as
held-to-maturity and trading. The held-to-maturity investments are recorded at
amortized cost. Trading investments are recorded at fair value and adjusted
through the statements of operations.
F - 7
Inventories
Inventories include the costs of material, labor and
overhead and are stated at the lower of cost (determined on a first-in,
first-out basis) or market. Obsolete inventory or inventory in excess of
management’s estimated future usage is written down to its estimated market
value, if less than its cost.
Property, Plant and Equipment
Property, plant and equipment are stated at cost.
Maintenance and repairs are charged to expense as incurred. Management
evaluates the carrying value of our property, plant and equipment, on an
ongoing basis, and makes adjustments when impairments are identified.
Depreciation is based on the estimated useful lives of the various classes of
assets and is computed using the straight-line method.
Intangible Assets
Intangible assets include patents, trademarks, license
agreements, acquired technology and customer lists. The cost of intangible
assets is amortized on a straight-line basis, over estimated useful lives
ranging from 5-17 years.
Valuation of Long-Lived Assets
The carrying values of intangible assets and other
long-lived assets are reviewed on a regular basis for the existence of facts or
circumstances, both internally and externally, that may suggest impairment.
Some factors considered important, which could trigger an impairment review,
include a significant decrease in the market value of an asset, a significant
change in the extent or manner in which an asset is used, a significant adverse
change in the business climate that could affect the value of an asset, an
accumulation of costs for an asset in excess of the amount originally expected,
a current period operating loss or cash flow decline combined with a history of
operating losses or cash flow uses or a projection that demonstrates continuing
losses and a current expectation that, it is more likely than not, a long-lived
asset will be disposed of at a loss before the end of its estimated useful
life.
If any such facts or circumstances exist, the carrying values of long-lived assets are evaluated to determine if impairment exists based upon estimated undiscounted future cash flows over the remaining useful life of the assets and comparing that value to the carrying value of the assets. If the carrying value of the assets is greater than the estimated future cash flows, the assets are written down to the estimated fair value. The estimated fair value of the assets is based on a current market value of the assets. If a current market value is not readily available, a projected discounted cash flow method is applied using a discount rate determined by management to be commensurate with the risk inherent in the current business model. Our cash flow estimates contain management’s best estimates, using appropriate and customary assumptions and projections at the time. During fiscal 2011, we recorded an impairment charge on property, plant and equipment. During fiscal 2010, we recorded an impairment charge on goodwill. During fiscal 2009, we recorded impairment charges on property, plant, and equipment, intangible assets and marketable securities.
Income Taxes
Income taxes are accounted for under the asset and
liability method. Deferred tax assets and liabilities are recognized for the
future tax consequences attributable to differences between the financial
statement carrying amounts of existing assets and liabilities and their
respective tax bases and operating loss and tax credit carryforwards. Deferred
tax assets and liabilities are measured using enacted rates expected to apply
to taxable income in the years in which those temporary differences are
expected to be recovered or settled. Deferred tax assets are reduced by
valuation allowances to an amount that is more likely than not to be realized
if it is determined that it is more likely than not that the deferred tax asset
will not be realized. The effect on deferred tax assets and liabilities of a
change in tax rates is recognized in income in the period that includes the
enactment date.
Uncertainty in income taxes is accounted for by applying a more likely than not threshold to the recognition and de-recognition of tax benefits. The calculation of the tax liabilities involves dealing with uncertainties in the application of complex tax regulations in a multitude of jurisdictions across our global operations. We also recognize potential liabilities for anticipated tax audit issues in the U.S. and other tax jurisdictions based on an estimate of whether it is more likely than not additional taxes will be due.
Revenue Recognition
We recognize revenue when persuasive evidence of an
arrangement exists, delivery has occurred or services have been rendered, our
price is fixed or determinable and collectibility is reasonably assured. We
recognize revenue on our standard products when title passes to the customer
upon shipment. While our standard products generally require installation, the
installation is considered a perfunctory performance obligation. The standard
products do not have customer acceptance criteria. Generally, software is a
component of our standard product and, as such, is not separately recognized as
revenue. Standalone software products are recognized as revenue when they are
shipped. We have standard rights of return for defective products that we
account for as a warranty provision. We do not have any price protection
agreements or other post shipment
F - 8
obligations. For custom equipment where customer acceptance is part of the sales agreement, revenue is recognized when the customer has accepted the product. In cases where custom equipment does not have customer acceptance as part of the sales agreement, we recognize revenue upon shipment, as long as the system meets the specifications as agreed upon with the customer. Certain transactions have multiple deliverables, with the deliverables clearly defined. To the extent that the secondary deliverables are other than perfunctory, we recognize the revenue on each deliverable, if separable, or on the completion of all deliverables, if not separable.
Certain customer transactions include payment terms whereby we receive a partial payment of the total order amount prior to the related sale being recognized in our financial statements. These advance payments are included in accrued progress payments and deferred revenue in the consolidated balance sheet. Generally, these progress payments relate to orders for custom equipment that require a lengthy build cycle and, in some cases, acceptance by the customer. We may negotiate payment terms with these customers on these particular orders and secure certain payments prior to or on shipment of the equipment. These payments remain in accrued progress payments and deferred revenue until our applicable revenue recognition criteria have been met.
Research and Development
Research and development costs are expensed as
incurred. For fiscal 2011, 2010, and 2009, we expensed $7,899, $8,566 and
$14,385 of research and development costs. Reimbursements from customers for
research and development costs are recorded as offsets to the expenses.
Reimbursed research and development costs of $33 were recorded in fiscal 2010
and none were recorded in fiscal 2011 and 2009.
Earnings Per Share
Basic Earnings per share (“EPS) is computed based on
the weighted average number of common stock outstanding during the period.
Diluted EPS is computed based on the weighted average number of shares of
common stock plus the effect of dilutive potential common shares outstanding
during the period using the treasury stock method. Dilutive potential common
shares include outstanding stock options and restricted stock units. The
following table sets forth the reconciliation of weighted average shares
outstanding and diluted weighted average shares outstanding:
|
|
|
|
|
|
|
|
|
|
|
|
|
|
|
June 30, 2011 |
|
June 30, 2010 |
|
June 30, 2009 |
|
|||
|
|
|
|
|
|
|
|
|
|||
|
|
|
|
|
|
|
|
|
|
|
|
|
Weighted average shares outstanding |
|
|
17,638,635 |
|
|
17,183,224 |
|
|
16,843,186 |
|
|
Dilutive effect of stock options and restricted stock units |
|
|
501,739 |
|
|
— |
|
|
— |
|
|
|
|
|
|
|
|
|
|
|
|
|
|
Diluted weighted average shares outstanding |
|
|
18,140,374 |
|
|
17,183,224 |
|
|
16,843,186 |
|
|
|
|
|
|
|
|
|
|
|
|
|
For fiscal 2011, 2010 and 2009, 814,741, 2,036,759 and 2,170,002, respectively, of the Company’s outstanding stock options and restricted stock awards were excluded from the calculation of diluted earnings per share because they were antidilutive.
Share-Based Compensation
We have two share-based compensation plans which are
described in Note 13. Share-based compensation expense for the fiscal year
ended June 30, 2011 was $3,965, with a related tax benefit of $1,427. This
increased cost of goods sold by $650, selling, general and administrative
expenses by $2,416 and research, development and engineering expenses by $899.
Share-based compensation expense for the fiscal year ended June 30, 2010 was
$2,492, with a related tax benefit of $897. This increased cost of goods sold
by $316, selling, general and administrative expenses by $1,770 and research,
development and engineering expenses by $406. Share-based compensation expense
for the fiscal year ended June 30, 2009 was $2,885, with a related tax benefit
of $1,039. This increased cost of goods sold by $346, selling, general and
administrative expenses by $2,161, and research, development and engineering
expenses by $378. Restricted stock awards generally allow recipients to sell a
portion of the stock award back to us, in order to cover tax liabilities
resulting from the vesting of the award.
Fair Value of Financial Instruments
We account for marketable securities and foreign
currency hedges at fair value. The carrying amounts of cash, accounts
receivable, accounts payable and accrued expenses approximate fair value
because they are short-term in nature.
F - 9
Use of Estimates
Management has made a number of estimates and
assumptions relating to the reporting of assets, liabilities, revenues and
expenses and the disclosure of contingent assets and liabilities to prepare
these consolidated financial statements in conformity with U.S. GAAP. On an
ongoing basis, management evaluates its estimates and judgments, including
those related to allowances for bad debts, reserves for excess and obsolete
inventories, impairments and recoverability of long-lived assets, share-based
compensation, income taxes and warranty obligations. Actual results could
differ from those estimates.
Adoption of New Accounting Pronouncements
In October 2009, the FASB issued authoritative
guidance on revenue recognition that became effective for us on July 1, 2010.
Under the new guidance on arrangements that include software elements, tangible
products that have software components that are essential to the functionality
of the tangible product will no longer be within the scope of the software
revenue recognition guidance and software-enabled products will now be subject
to other relevant revenue recognition guidance. Additionally, the FASB issued
authoritative guidance on revenue arrangements with multiple deliverables that
are outside the scope of the software revenue recognition guidance. Under the
new guidance, when vendor specific objective evidence or third party evidence
for deliverables in an arrangement cannot be determined, a best estimate of the
selling price is required to separate deliverables and allocate arrangement
consideration using the relative selling price method. The new guidance
includes new disclosure requirements on how the application of the relative
selling price method affects the timing and amount of revenue recognition. The
adoption of this new guidance did not have a material impact on our
consolidated financial statements.
In June 2009, the FASB issued authoritative guidance on the consolidation of variable interest entities which became effective for us on July 1, 2010. The new guidance requires revised evaluations of whether entities represent variable interest entities, ongoing assessments of power over such entities, and additional disclosures for variable interests. The adoption of this new guidance did not have a material impact on our consolidated financial statements.
Recent Accounting Guidance Not Yet Adopted
In January 2010, the FASB issued amended standards
that require additional fair value disclosures. These disclosure requirements
are effective in two phases. On January 1, 2010, we adopted the requirements
for disclosures about inputs and valuation techniques used to measure fair
value as well as disclosures about significant transfers. The adoption of this
portion of the guidance did not have a material impact on our consolidated
financial statements. Beginning in fiscal 2012, the balance of these amended
standards will require presentation of disaggregated activity within the
reconciliation for fair value measurements using significant unobservable
inputs (Level 3). We believe the adoption of the balance of these amended
standards will not have a material impact on our consolidated financial
statements.
In December 2010, the FASB also issued guidance to clarify the reporting of pro forma financial information related to business combinations of public entities and to expand certain supplemental pro forma disclosures. This guidance is effective prospectively for business combinations that occur on or after the beginning of the fiscal year beginning on or after December 15, 2010, with early adoption permitted. It is applicable to our fiscal year beginning July 1, 2011. We are currently evaluating this guidance, but do not expect its adoption to have a material effect on our consolidated financial statements.
In May 2011, the FASB issued guidance to amend certain measurement and disclosure requirements related to fair value measurements to improve consistency with international reporting standards. This guidance is effective prospectively for public entities for interim and annual reporting periods beginning after December 15, 2011, with early adoption by public entities prohibited, and is applicable to our fiscal quarter beginning January 1, 2012. We are currently evaluating this guidance, but do not expect its adoption to have a material effect on our consolidated financial statements.
In June 2011, the FASB issued new guidance on the presentation of comprehensive income that will require presentation of components of net income and other comprehensive income in one continuous statement or in two separate, but consecutive statements. There are no changes to the components that are recognized in net income or other comprehensive income under current GAAP. This guidance is effective for fiscal years, and interim periods within those fiscal years, beginning after December 15, 2011, with early adoption permitted. It is applicable to our fiscal year beginning July 1, 2012. We are currently evaluating this guidance, but do not expect its adoption will have a material effect on our consolidated financial statements.
F - 10
NOTE 2: ACQUISITIONS
Richmond, California
On November 12, 2010, we completed a transaction
with ASML US, Inc. (“ASML”) to purchase substantially all the assets of their
Richmond, California operations, including a 55,300 square-foot manufacturing
facility. This acquisition expanded our optical manufacturing capabilities. The
assets were acquired for $12,475, of which $7,142 was in cash, and the balance
was future consideration, with a net present value of $5,333 using a discount
factor of 14%, based on the level of shipments to ASML over the subsequent
three years beginning January 1, 2011. On the acquisition date, the future
consideration was recorded as a liability, with $1,127 recorded as a current
liability and $4,206 recorded as a long-term liability. The future
consideration represented a supply agreement that was entered into with ASML
that provided for a volume discount. In addition, we hired key management and
employees working at the Richmond facility. These activities resulted in a newly
formed operation known as the Extreme Precision Optics group (“EPO”) which is
included in our Optical Systems segment. On June 30, 2011, we recorded a final
valuation adjustment that increased property and equipment and gain on
acquisition by $7, respectively.
This transaction met the conditions of a business combination as defined by Accounting Standards Codification (“ASC”) 805 and, as such, is accounted for under ASC 805 using the purchase method of accounting. ASC 805 defines the three elements of a business as Input, Process and Output. As a result of the acquisition of substantially all the Richmond facility assets, Zygo acquired the machinery and equipment utilized in the processes to manufacture product, the building that houses the entire operation and intellectual property needed in the process to manufacture the product. The ASML employees hired by Zygo in connection with the acquisition brought with them the skills, experience and know-how necessary to provide the operational processes that, when applied to the acquired assets, represent processes being applied to inputs to create outputs. Having met all three elements of a business as defined in ASC 805, we determined that the acquisition of substantially all the assets of ASML’s Richmond, California operation should be accounted for as a business acquisition.
The results of EPO are included in our consolidated statements of operations from the acquisition date. Zygo performed a preliminary fair value exercise to allocate the purchase price to the acquired assets and liabilities at November 12, 2010. The fair value exercise was completed on June 30, 2011. The following table summarizes the consideration paid for the business and the final fair values of the assets acquired at the date of acquisition:
|
|
|
|
|
|
|
|
|
Final Fair |
|
|
|
|
|
|
|
|
|
Consideration: |
|
|
|
|
|
Cash |
|
$ |
7,142 |
|
|
Future consideration |
|
|
5,333 |
|
|
|
|
|
|
|
|
Purchase price |
|
$ |
12,475 |
|
|
|
|
|
|
|
|
|
|
|
|
|
|
Assets Acquired: |
|
|
|
|
|
Inventories |
|
$ |
2,399 |
|
|
Property and equipment |
|
|
11,474 |
|
|
Technology and customer relationships |
|
|
623 |
|
|
|
|
|
|
|
|
Total assets |
|
|
14,496 |
|
|
|
|
|
|
|
|
Less: gain on acquisition |
|
|
2,021 |
|
|
|
|
|
|
|
|
Purchase price |
|
$ |
12,475 |
|
|
|
|
|
|
|
In addition to recording the fair values of the assets acquired and the future consideration liability, we also recorded a gain on acquisition of $2,021 in the consolidated statement of operations within miscellaneous income in accordance with ASC 805 using the purchase method of accounting. The gain on acquisition was primarily due to the difference between market value of the acquired real estate and its book value and the desire of ASML to sell the assets. In addition, a deferred tax liability of $725 was recorded in the opening balance sheet, which had the effect of reducing the gain on acquisition to $1,296. We maintain a
F - 11
full valuation allowance on our net deferred tax assets. Therefore, we recorded a tax benefit to reduce the valuation allowance to the net deferred tax asset balance. Prior to recording the gain, we reassessed whether we had correctly identified all of the assets acquired and all of the liabilities assumed. Additionally, we also reviewed the procedures used to measure the amounts of the identifiable assets acquired, liabilities assumed and consideration transferred.
The purchased inventory was comprised of raw materials and work in process. The fair value for work in process was $1,833 and was determined by considering the sales price of finished units to represent fair value. The fair value for the building and land was $6,080 and was determined by using the sales comparison approach to value the land and a combination of the sales and cost approach for the building and improvements. The fair value of the equipment was determined by the market approach to be $5,394. Fair value of customer relationships was determined to be $23 by using the multi-period excess earnings method. The fair value of technology was $600 and was determined using the relief from royalty method.
From the date of the acquisition through June 30, 2011, EPO contributed revenue and net earnings of $14,444 and $4,069, respectively. Acquisition-related expenses of $406 were recognized in administration expense in the twelve months ended June 30, 2011.
Proforma financial information of revenues and net earnings for the operation is impractical to provide. Prior to the acquisition, the Richmond operations were accounted for as a cost center within ASML. Therefore, revenues were not recorded at the Richmond level within ASML and separate financial statements for the Richmond operations were not prepared. While ASML provided financial information sufficient for Zygo to conclude that the acquisition was not significant under Regulation S-X rule 3-05, ASML did not provide and Zygo does not have access to financial information for the appropriate periods to present pro forma financial information.
The following disclosure presents certain information regarding the intangible assets acquired from ASML as of June 30, 2011. All acquired intangible assets were valued by the income approach and are being amortized over their initial estimated useful lives of five years for both customer relationships and technology, in both instances with no estimated residual values. We review our intangible assets for impairment annually.
|
|
|
|
|
|
|
|
|
|
|
|
|
|
|
Customer |
|
Technology |
|
Total |
|
|||
|
|
|
|
|
|
|
|
|
|||
|
|
|
|
|
|
|
|
|
|
|
|
|
Balance at November 12, 2010 |
|
$ |
23 |
|
$ |
600 |
|
$ |
623 |
|
|
|
|
|
|
|
|
|
|
|
|
|
|
Accumulated amortization |
|
|
(3 |
) |
|
(76 |
) |
|
(79 |
) |
|
|
|
|
|
|
|
|
|
|
|
|
|
|
|
|
|
|
|
|
|
|
|
|
|
Balance at June 30, 2011 |
|
$ |
20 |
|
$ |
524 |
|
$ |
544 |
|
|
|
|
|
|
|
|
|
|
|
|
|
Zemetrics
In January 2010, the Company entered into an agreement
to purchase all of the outstanding stock and to retire the outstanding
shareholder notes of Zemetrics, Inc., an Arizona corporation (“Zemetrics”), in
exchange for 361,217 shares of the Company’s common stock. The value of the
common stock issued was $3,901, based on the fair value of the common stock on
the closing date of $10.80. In accordance with the purchase agreement, the
number of shares delivered was calculated by taking the sum of $1,941 and the
outstanding shareholder notes (including accrued interest) of $856 divided by
the average of the closing prices of the Company’s common stock reported by the
NASDAQ Stock Market during the forty trading days ended two days prior to the
closing date of January 22, 2010 of $7.74 (the “Average Trading Price”).
Dr. Chris L. Koliopoulos, Zygo’s President and CEO, was a major shareholder of Zemetrics stock as well as being the major holder of Zemetrics’ outstanding shareholder notes. Dr. Koliopoulos received a total of 195,790 shares of Company common stock consisting of 106,233 shares of Company common stock as consideration for the purchase of his shares of Zemetrics stock and 89,557 shares of Company common stock in payment of $680 principal amount of outstanding shareholder notes (plus accrued interest thereon) issued by Zemetrics to Dr. Koliopoulos.
F - 12
Acquisition costs for the twelve months ended June 30, 2010 were $457, and are included in selling, general & administrative expenses.
The following is the final purchase price allocation based on the estimated fair values of the assets acquired and liabilities assumed as of the date of acquisition on January 22, 2010:
|
|
|
|
|
|
|
Cash |
|
$ |
11 |
|
|
Inventories |
|
|
403 |
|
|
Prepaid expenses |
|
|
18 |
|
|
Property and equipment |
|
|
15 |
|
|
Customer relationships |
|
|
112 |
|
|
Technology |
|
|
1,428 |
|
|
Goodwill |
|
|
2,003 |
|
|
|
|
|
|
|
|
Total assets |
|
|
3,990 |
|
|
|
|
|
|
|
|
Less: Liabilities assumed |
|
|
89 |
|
|
|
|
|
|
|
|
Total |
|
$ |
3,901 |
|
|
|
|
|
|
|
In addition, net deferred tax assets of $360 were recorded in the opening balance sheet at zero value, net of a full valuation allowance. Based on the Company’s expectations of future U.S. taxable income, the Company believes it is more likely than not that such net deferred tax assets could not be realized.
The purchase price was allocated to the underlying assets acquired and liabilities assumed based on their fair values. Analyses supporting the purchase price allocation include a valuation of assets and liabilities as of the closing date, an analysis of intangible assets and a detailed review of the opening balance sheet to determine other significant adjustments required to recognize assets and liabilities at fair value. Intangible assets of technology and customer relationships were valued on an income approach based on future earnings projections.
The following disclosure presents certain information regarding the Company’s acquired intangible assets as of June 30, 2010. All acquired intangible assets were valued by the income approach and are being amortized over their initial estimated useful lives of three years for customer relationships and seven years for technology with no estimated residual values. We review our intangible assets for impairment annually.
|
|
|
|
|
|
|
|
|
|
|
|
|
|
|
Customer |
|
Technology |
|
Total |
|
|||
|
|
|
|
|
|
|
|
|
|||
|
|
|
|
|
|
|
|
|
|
|
|
|
Balance at January 22, 2010 |
|
$ |
112 |
|
$ |
1,428 |
|
$ |
1,540 |
|
|
|
|
|
|
|
|
|
|
|
|
|
|
Amortization expense |
|
|
(16 |
) |
|
(85 |
) |
|
(101 |
) |
|
|
|
|
|
|
|
|
|
|
|
|
|
Balance at June 30, 2010 |
|
$ |
96 |
|
$ |
1,343 |
|
$ |
1,439 |
|
|
|
|
|
|
|
|
|
|
|
|
|
The Company recorded an impairment charge of $2,003 relating to acquired goodwill in the quarter ended March 31, 2010 subsequent to the acquisition date. The Zemetrics reporting unit had minimal sales history and cumulative losses since inception. In addition, the fair value of common stock issued as consideration on the closing date was $10.80 per share, which was significantly in excess of the implied value per share in the formula used in the purchase agreement to determine the number of common shares issued as consideration (which was based on the market price per share during the 40-day period prior to closing). In consideration of these factors, management determined the carrying value of the reporting unit exceeded its fair value, and that the implied fair value of goodwill was zero at March 31, 2010.
F - 13
From the date of acquisition, the Zemetrics reporting unit had revenues of $103 and an operating loss of $2,658 (including the aforementioned $2,003 goodwill impairment charge), which are included in the consolidated financial statements in fiscal 2010. The following unaudited proforma condensed financial information presents the results of operations for the years ended June 30, 2010 and 2009 as though the acquisition of Zemetrics had occurred at the beginning of each respective fiscal year. The proforma information is presented for informational purposes only and is not necessarily indicative of the results of operations that actually would have been achieved had the acquisition been consummated as of that time:
|
|
|
|
|
|
|
|
|
|
|
|
Year ended June 30, |
|
||||
|
|
|
|
|
||||
|
|
|
2010 |
|
2009 |
|
||
|
|
|
|
|
|
|
||
|
|
|
|
|
|
|
||
|
Net revenues |
|
$ |
101,330 |
|
$ |
114,734 |
|
|
Net loss attributable to Zygo Corporation |
|
$ |
(3,565 |
) |
$ |
(63,169 |
) |
|
|
|
|
|
|
|
|
|
|
Loss per share amounts: |
|
|
|
|
|
|
|
|
Basic and Diluted - Loss per share |
|
$ |
(0.21 |
) |
$ |
(3.75 |
) |
|
Diluted - Loss per share |
|
$ |
(0.21 |
) |
$ |
(3.75 |
) |
Solvision, Inc.
On February 28, 2008, we acquired certain assets of
Solvision, Inc. (“Solvision”), a Canadian-based company, including the shares
of its Singapore subsidiary for $4,155, net of cash received, under the
purchase method of accounting with the purchase price allocation being
finalized in fiscal 2009. This final consideration consisted of $4,240 of cash
and $17 representing the value of assets received for the forgiveness of a
$1,500 note extended to Solvision. In fiscal 2009 (as part of the final
purchase price allocation) and 2008, $924 and $559, respectively, of the note
was charged to bad debt expense. This acquisition was integrated into the
Metrology segment. The results of operations of this acquisition have been
included in the consolidated statement of operations since on February 28,
2008.
During the quarter ended September 30, 2009, we determined to sell or otherwise close down the Singapore IC packaging metrology operations of our Vision Systems product line, included in our Metrology Solutions segment. As of September 30, 2009, operations had ceased at this location. The results of operations for the aforementioned operations are presented in the Company’s Consolidated Financial Statements as discontinued operations. We have restated the financial presentation and related footnotes for fiscal 2009 to show the effects of the discontinued operations.
During our fiscal 2009 annual review of intangible assets, we determined, based on the downturn in the business climate for this product line and the level of its then operating losses, that all of the acquired intangible assets resulting from the acquisition of Solvision in the prior year were impaired. Of the $2,149 of impairment charges in fiscal 2009, $1,048 was related to continuing operations and $1,101 related to discontinued operations.
Fiscal 2009 Merger Termination
On October 16, 2008, we and Electro Scientific Industries,
Inc. (“ESI”) jointly announced the execution of a definitive agreement,
providing for the two companies to merge in an all stock transaction, subject
to the prior satisfaction of certain enumerated conditions precedent. On
January 20, 2009, Zygo announced that it notified ESI of Zygo’s Board of
Directors’ withdrawal of its recommendation in favor of the previously
announced merger agreement with ESI. On April 2, 2009, ESI and Zygo agreed to
terminate their previously executed merger agreement. Pursuant to the terms of
the settlement agreement, Zygo paid ESI a break-up fee of $5,400. During fiscal
2009, we paid an additional $2,900 related to the merger in legal and various
other related expenses. The break-up fee, legal and other expenses are included
in selling, general and administrative expenses in fiscal 2009.
F - 14
NOTE 3: RESTRUCTURING AND RELATED COSTS
During fiscal 2009, we initiated restructuring actions related to cost reduction efforts comprised of workforce reductions and the consolidation of manufacturing operations in Tucson, Arizona. In fiscal 2010, we recorded restructuring and related charges totaling $661 ($383 in selling, general and administrative expenses, and $278 in research, development and engineering expenses). There were no additional charges during fiscal 2011. The severance-related costs are part of the Metrology Solutions segment, and the facility consolidation costs are related to the Optical Systems segment
The following table summarizes the accrual balances and utilization by cost type for the fiscal 2011 and 2010 restructuring actions:
|
|
|
|
|
|
|
|
|
|
|
|
|
|
|
Severance |
|
June 30, 2011 |
|
Total |
|
|||
|
|
|
|
|
|
|
|
|
|||
|
Balance at June 30, 2010 |
|
$ |
290 |
|
$ |
227 |
|
$ |
517 |
|
|
Payments |
|
|
(290 |
) |
|
(194 |
) |
|
(484 |
) |
|
|
|
|
|
|
|
|
|
|
|
|
|
Balance at June 30, 2011 |
|
$ |
— |
|
$ |
33 |
|
$ |
33 |
|
|
|
|
|
|
|
|
|
|
|
|
|
|
|
|
|
|
|
|
|
|
|
|
|
|
|
|
Severance |
|
June
30, 2010 |
|
Total |
|
|||
|
|
|
|
|
|
|
|
|
|||
|
Balance at June 30, 2009 |
|
$ |
262 |
|
$ |
452 |
|
$ |
714 |
|
|
Restructuring charges |
|
|
661 |
|
|
— |
|
|
661 |
|
|
Payments |
|
|
(633 |
) |
|
(225 |
) |
|
(858 |
) |
|
|
|
|
|
|
|
|
|
|
|
|
|
Balance at June 30, 2010 |
|
$ |
290 |
|
$ |
227 |
|
$ |
517 |
|
|
|
|
|
|
|
|
|
|
|
|
|
We expect the remaining restructuring liabilities at June 30, 2011 to be paid within the next three months.
NOTE 4: MARKETABLE SECURITIES
Marketable securities consisted primarily of government agency securities and a mutual fund, consisting of corporate securities, for fiscal 2011 and 2010. The Company classifies these securities as held-to-maturity and trading. Dividend and interest income is recognized when earned. Straight-line amortization related to discounts and premiums on the purchase of marketable securities is recorded in interest income. Realized gains and losses are included in earnings and are derived using the specific identification method for determining the cost of securities sold.
At June 30, 2011 and 2010, the held-to-maturity securities consisted of a government treasury bill. We have both the intent and the ability to hold the government treasury bill to maturity. The amortized cost, gross unrealized gains and losses and fair value of held-to-maturity securities at June 30, 2011 and 2010 were as follows:
|
|
|
|
|
|
|
|
|
|
|
|
|
|
|
|
|
|
Amortized |
|
Gross |
|
Gross |
|
Fair |
|
||||
|
|
|
|
|
|
|
|
|
|
|
||||
|
At June 30, 2011 |
|
|
|
|
|
|
|
|
|
|
|
|
|
|
Government treasury bill |
|
$ |
1,000 |
|
$ |
— |
|
$ |
— |
|
$ |
1,000 |
|
|
|
|
|
|
|
|
|
|
|
|
|
|
|
|
|
|
|
|
|
|
|
|
|
|
|
|
|
|
|
|
At June 30, 2010 |
|
|
|
|
|
|
|
|
|
|
|
|
|
|
Government treasury bill |
|
$ |
1,000 |
|
$ |
— |
|
$ |
— |
|
$ |
1,000 |
|
|
|
|
|
|
|
|
|
|
|
|
|
|
|
|
F - 15
Trading securities consist of a mutual fund investment corresponding to elections made in our deferred compensation program. In December 2010, we began quarterly distributions in accordance with the deferred compensation program agreement. The cost, gross unrealized gains and losses, contributions, redemptions and fair value of trading securities at June 30, 2011 and 2010 were as follows:
|
|
|
|
|
|
|
|
|
|
|
|
|
|
|
|
|
|
|
|
|
|
|
|
Beginning |
|
Gross |
|
Gross |
|
Contri- |
|
Redemp- |
|
Ending |
|
||||||
|
|
|
|
|
|
|
|
|
|
|
|
|
|
|
||||||
|
June 30, 2011 |
|
|
|
|
|
|
|
|
|
|
|
|
|
|
|
|
|
|
|
|
Mutual Fund |
|
$ |
922 |
|
$ |
210 |
|
$ |
(16 |
) |
$ |
— |
|
$ |
(136 |
) |
$ |
980 |
|
|
|
|
|
|
|
|
|
|
|
|
|
|
|
|
|
|
|
|
|
|
|
|
|
|
|
|
|
|
|
|
|
|
|
|
|
|
|
|
|
|
|
|
June 30, 2010 |
|
|
|
|
|
|
|
|
|
|
|
|
|
|
|
|
|
|
|
|
Mutual Fund |
|
$ |
499 |
|
$ |
191 |
|
$ |
(58 |
) |
$ |
290 |
|
$ |
— |
|
$ |
922 |
|
|
|
|
|
|
|
|
|
|
|
|
|
|
|
|
|
|
|
|
|
|
Maturities of investment securities classified as held-to-maturity at June 30, 2011 and 2010 were as follows:
|
|
|
|
|
|
|
|
|
|
|
|
|
|
|
|
|
|
June 30, 2011 |
|
June 30, 2010 |
|
||||||||
|
|
|
|
|
|
|
||||||||
|
|
|
Amortized |
|
Fair |
|
Amortized |
|
Fair |
|
||||
|
|
|
|
|
|
|
|
|
|
|
||||
|
Due within one year |
|
$ |
1,000 |
|
$ |
1,000 |
|
$ |
1,000 |
|
$ |
1,000 |
|
|
|
|
|
|
|
|
|
|
|
|
|
|
|
|
There were no securities in a continuous unrealized loss position at June 30, 2011 and 2010.
In determining whether investment holdings are other than temporarily impaired, we consider the nature, cause, size and duration of the impairment. We and our investment advisors use analyst reports, credit ratings and other items as part of our review.
F - 16
NOTE 5: FAIR VALUE MEASUREMENTS
Fair value measurements uses a valuation hierarchy for disclosure of the inputs to valuation used to measure fair value. This hierarchy prioritizes the inputs into three broad levels. Level 1 inputs are quoted prices (unadjusted) in active markets for identical assets or liabilities. Level 2 inputs are quoted prices for similar assets and liabilities in active markets or inputs that are observable for the asset or liability, either directly or indirectly through market corroboration, for substantially the full term of the financial instrument. Level 3 inputs are unobservable inputs based on the management’s assumptions used to measure assets and liabilities at fair value. A financial asset or liability’s classification within the hierarchy is determined based on the lowest level input that is significant to the fair value measurement.
The following table provides the assets and liabilities carried at fair value measured on a recurring and nonrecurring basis as of June 30, 2011:
|
|
|
|
|
|
|
|
|
|
|
|
|
|
|
|
|
|
|
Assets Measured at Fair Value: |
|
|
|
|
|
|
|
|
|
|
|
|
|
|
|
|
|
(Dollars in thousands) |
|
|
|
|
Fair value measurements at June 30, 2011 |
|
|
|
|
|||||||
|
|
|
|
|
|
|
|
|
|
|
|||||||
|
|
|
Total carrying |
|
Quoted prices |
|
Significant |
|
Significant |
|
|
|
|
||||
|
|
|
|
|
|
|
|
|
|
|
|
|
|
||||
|
Money market funds |
|
$ |
19,930 |
|
$ |
19,930 |
|
$ |
— |
|
$ |
— |
|
|
|
|
|
Trading securities |
|
|
980 |
|
|
980 |
|
|
— |
|
|
— |
|
|
|
|
|
Foreign currency hedge |
|
|
(82 |
) |
|
— |
|
|
(82 |
) |
|
— |
|
|
|
|
|
|
|
|
|
|
|
|
|
|
|
|
|
|
|
|
|
|
|
Total |
|
$ |
20,828 |
|
$ |
20,910 |
|
$ |
(82 |
) |
$ |
— |
|
|
|
|
|
|
|
|
|
|
|
|
|
|
|
|
|
|
|
|
|
|
|
|
|
|
|
|
|
|
|
|
|
|
|
|
||||
|
Assets Measured at Fair Value on a Nonrecurring Basis: |
|
|
|
|
|
|
|
|
|
|
||||||
|
(Dollars in thousands) |
|
|
|
|
Fair value measurements at June 30, 2011 |
|
|
|
|
|||||||
|
|
|
|
|
|
|
|
|
|
|
|||||||
|
|
|
Total carrying |
|
Quoted prices |
|
Significant |
|
Significant |
|
Total Gains |
|
|||||
|
|
|
|
|
|
|
|
|
|
|
|
|
|||||
|
Property, plant and equipment (1) |
|
$ |
— |
|
$ |
— |
|
$ |
— |
|
$ |
— |
|
$ |
(563 |
) |
|
|
|
|
|
|
|
|
|
|
|
|
|
|
|
|
|
|
|
Total |
|
$ |
— |
|
$ |
— |
|
$ |
— |
|
$ |
— |
|
$ |
(563 |
) |
|
|
|
|
|
|
|
|
|
|
|
|
|
|
|
|
|
|
(1) See Note 8: Property, Plant and Equipment
F - 17
The following table provides the assets and liabilities carried at fair value measured on a recurring and nonrecurring basis as of June 30, 2010:
|
|
|
|
|
|
|
|
|
|
|
|
|
|
|
|
|
|
|
Assets Measured at Fair Value: |
|
|
|
|
|
|
|
|
|
|
|
|
|
|
|
|
|
|
|
|
|
|
Fair value measurements at June 30, 2010 |
|
|
|
|
|||||||
|
|
|
|
|
|
|
|
|
|
|
|||||||
|
|
|
Total carrying |
|
Quoted prices |
|
Significant |
|
Significant |
|
|
|
|
||||
|
|
|
|
|
|
|
|
|
|
|
|
|
|
||||
|
Money market funds |
|
$ |
22,141 |
|
$ |
22,141 |
|
$ |
— |
|
$ |
— |
|
|
|
|
|
Trading securities |
|
|
922 |
|
|
922 |
|
|
— |
|
|
— |
|
|
|
|
|
Foreign currency hedge |
|
|
(70 |
) |
|
— |
|
|
(70 |
) |
|
— |
|
|
|
|
|
|
|
|
|
|
|
|
|
|
|
|
|
|
|
|
|
|
|
Total |
|
$ |
22,993 |
|
$ |
23,063 |
|
$ |
(70 |
) |
$ |
— |
|
|
|
|
|
|
|
|
|
|
|
|
|
|
|
|
|
|
|
|
|
|
|
|
|
|
|
|
|
|
|
|
|
|
|
|
|
|
|
|
|
Assets Measured at Fair Value on a Nonrecurring Basis: |
||||||||||||||||
|
|
|
|
|
|
|
|
|
|
|
|
|
|
|
|
|
|
|
|
|
Total carrying |
|
Quoted prices |
|
Significant |
|
Significant |
|
Total Gains |
|
|||||
|
|
|
|
|
|
|
|
|
|
|
|
|
|||||
|
Goodwill (1) |
|
|
— |
|
|
— |
|
|
— |
|
|
— |
|
|
(2,003 |
) |
|
|
|
|
|
|
|
|
|
|
|
|
|
|
|
|
|
|
|
Total |
|
$ |
— |
|
$ |
— |
|
$ |
— |
|
$ |
— |
|
$ |
(2,003 |
) |
|
|
|
|
|
|
|
|
|
|
|
|
|
|
|
|
|
|
(1) See Note 2: Acquisitions
When available, the Company uses quoted market prices to determine the fair value of its marketable securities included in Level 1. When quoted market prices are unobservable, the Company uses quotes from independent pricing vendors based on recent trading activity and other relevant information.
The carrying value of other financial instruments, including cash, accounts receivable, accounts payable and accrued liabilities approximate fair value due to their short maturities. The remainder of our marketable securities at June 30, 2011 are accounted for as held-to-maturity investments and are recorded at amortized cost of $1,000.
F - 18
NOTE 6: RECEIVABLES
At June 30, 2011 and 2010, receivables were as follows:
|
|
|
|
|
|
|
|
|
|
|
|
June 30, 2011 |
|
June 30, 2010 |
|
||
|
|
|
|
|
|
|
||
|
Trade |
|
$ |
32,515 |
|
$ |
21,314 |
|
|
Other |
|
|
308 |
|
|
609 |
|
|
|
|
|
|
|
|
|
|
|
|
|
|
32,823 |
|
|
21,923 |
|
|
Allowance for doubtful accounts |
|
|
(1,399 |
) |
|
(1,975 |
) |
|
|
|
|
|
|
|
|
|
|
|
|
$ |
31,424 |
|
$ |
19,948 |
|
|
|
|
|
|
|
|
|
|
NOTE 7: INVENTORIES
At June 30, 2011 and 2010, inventories were as follows:
|
|
|
|
|
|
|
|
|
|
|
|
June 30, 2011 |
|
June 30, 2010 |
|
||
|
|
|
|
|
|
|
||
|
Raw materials and manufactured parts |
|
$ |
13,265 |
|
$ |
12,682 |
|
|
Work in process |
|
|
10,742 |
|
|
9,322 |
|
|
Finished goods |
|
|
4,372 |
|
|
3,216 |
|
|
|
|
|
|
|
|
|
|
|
|
|
$ |
28,379 |
|
$ |
25,220 |
|
|
|
|
|
|
|
|
|
|
NOTE 8: PROPERTY, PLANT AND EQUIPMENT
At June 30, 2011 and 2010, property, plant and equipment, at cost, were as follows:
|
|
|
|
|
|
|
|
|
|
|
|
|
|
|
June 30, 2011 |
|
June 30, 2010 |
|
Estimated |
|
|||
|
|
|
|
|
|
|
|
|
|||
|
|
|
|
|
|
|
|
|
|||
|
Land and improvements |
|
$ |
2,930 |
|
$ |
615 |
|
|
— |
|
|
Building and improvements |
|
|
21,265 |
|
|
17,390 |
|
|
15-40 |
|
|
Machinery, equipment and office furniture |
|
|
58,157 |
|
|
56,136 |
|
|
3-8 |
|
|
Leasehold improvements |
|
|
989 |
|
|
1,002 |
|
|
1-5 |
|
|
Construction in progress |
|
|
357 |
|
|
332 |
|
|
— |
|
|
|
|
|
|
|
|
|
|
|
|
|
|
|
|
|
83,698 |
|
|
75,475 |
|
|
|
|
|
Less accumulated depreciation |
|
|
(53,503 |
) |
|
(52,446 |
) |
|
|
|
|
|
|
|
|
|
|
|
|
|
|
|
|
|
|
$ |
30,195 |
|
$ |
23,029 |
|
|
|
|
|
|
|
|
|
|
|
|
|
|
|
|
Depreciation expense for the fiscal years ended June 30, 2011, 2010, and 2009 was $5,363, $5,318 and $7,245, respectively. In fiscal 2011, we utilized a future discounted cash flow model over five years to assess the net realizable value of our property, plant and equipment and concluded that an impairment charge of $563 should be recorded in selling, general and administrative expenses related to the Vision systems product line in our Metrology Solutions segment. In fiscal 2009, we recorded impairment charges on our plant, property and equipment of $4,460 including $4,004 related to the precision positioning systems product line in our Metrology Solutions segment. We utilized a future discounted cash flow model over five years to assess the net realizable value of our property, plant and equipment in our precision positioning systems product line. These charges were included in cost of sales ($2,911), selling, general and administrative expenses ($82), and research, development and engineering expenses ($1,467) on the statement of operations for fiscal 2009.
F - 19
NOTE 9: INTANGIBLE ASSETS
Intangible assets, at cost, at June 30, 2011 and 2010 were as follows:
|
|
|
|
|
|
|
|
|
|
|
|
|
|
|
June 30, 2011 |
|
June 30, 2010 |
|
Estimated Useful |
|
|||
|
|
|
|
|
|
|
|
|
|||
|
|
|
|
|
|
|
|
|
|
|
|
|
Patents and trademarks |
|
$ |
6,774 |
|
$ |
5,882 |
|
|
5-17 |
|
|
Customer relationships and technology |
|
|
2,163 |
|
|
1,540 |
|
|
3-7 |
|
|
Covenant not-to-compete |
|
|
851 |
|
|
851 |
|
|
4 |
|
|
|
|
|
|
|
|
|
|
|
|
|
|
|
|
|
9,788 |
|
|
8,273 |
|
|
|
|
|
Accumulated amortization |
|
|
(3,946 |
) |
|
(2,886 |
) |
|
|
|
|
|
|
|
|
|
|
|
|
|
|
|
|
Total |
|
$ |
5,842 |
|
$ |
5,387 |
|
|
|
|
|
|
|
|
|
|
|
|
|
|
|
|
Amortization expense related to intangible assets for the fiscal years ended June 30, 2011, 2010 and 2009 was $1,070, $793, and $687, respectively. Amortization expense is estimated to be approximately $992 in fiscal 2012 and approximately $852, $746, $729 and $635 annually in fiscal 2013-2016, respectively. Amortization expense related to patents and trademarks is included in cost of goods sold in the consolidated statements of operations. Amortization expense related to customer relationships, technology and covenant not-to-compete is included in selling, general and administrative expense in the consolidated statements of operations.
A non-compete agreement went into effect with the retirement of the chief technology officer of the Company in February 2009. This agreement requires payments totaling $878 over four years, including imputed interest of $27.
In fiscal 2009, we recorded an impairment charge of $2,935 on our patents related to our precision positioning systems product line in our metrology segment that was included in cost of sales on the consolidated statement of operations as result of our review of our business operations in the economic downturn. We utilized a future discounted cash flow model over five years to assess the net realizable value of our patents in our precision positioning systems product line.
In addition, in fiscal 2009, we recorded an impairment charge of $1,048 on the total value of our customer relationships and technology related to our vision systems product line in our metrology segment that was included in selling, general and administrative expenses and research, development and engineering expenses on the consolidated statement of operations, as noted in Note 2.
NOTE 10: WARRANTY LIABILITY
We provide a limited warranty on our products for periods typically ranging from 3 to 24 months, and allowances for estimated warranty costs are recorded during the period of sale. The determination of such allowances requires management to make estimates of product return rates and expected costs to repair or replace products under warranty. If actual return rates or repair and replacement costs, or both, differ significantly from management’s estimates, adjustments to recognize additional expense may be required.
The following is a reconciliation of the beginning and ending balances of the accrued warranty liability, which is included in “other accrued expenses” in the consolidated balance sheets:
|
|
|
|
|
|
|
|
|
|
|
|
June 30, 2011 |
|
June 30, 2010 |
|
||
|
|
|
|
|
|
|
||
|
Beginning balance |
|
$ |
1,360 |
|
$ |
1,614 |
|
|
Reductions for payments made |
|
|
(1,083 |
) |
|
(881 |
) |
|
Changes in accruals related to warranties issued in the current period |
|
|
920 |
|
|
1,236 |
|
|
Changes in accrual related to pre-existing warranties |
|
|
136 |
|
|
(609 |
) |
|
|
|
|
|
|
|
|
|
|
Ending balance |
|
$ |
1,333 |
|
$ |
1,360 |
|
|
|
|
|
|
|
|
|
|
F - 20
NOTE 11: COMMITMENTS AND CONTINGENCIES
From time to time, we are subject to certain legal proceedings and claims that arise in the normal course of our business. At June 30, 2011, we did not have a reserve for any contingencies. We are not party to any litigation that we believe could have a material effect on our financial condition, results of operation or liquidity. During fiscal 2011, we settled and paid a royalty claim in the amount of $1,400.
We are aware of certain levels of contamination on our property in Connecticut which are below reportable levels. In addition, we are aware of certain contamination on an adjacent property that we formerly owned. The future effect of environmental matters, including potential liabilities, is often difficult to estimate. Testing of both properties has not shown contaminants above reportable levels. We are unable to determine or reasonably estimate the amount of costs, if any, that we might incur or for which we may ultimately become responsible. We will record a reserve if it is both probable that a liability has been incurred, and the amount of any liability can be reasonably estimated, whether or not a claim has been asserted.
We lease certain manufacturing equipment and facilities under operating leases, some of which include cost escalation clauses, expiring on various dates through fiscal 2016. Total lease expense, net, charged to operations was $1,330, $1,295 and $2,340 in fiscal 2011, 2010 and 2009, respectively. At June 30, 2011, the minimum future lease commitments under noncancellable leases payable over the remaining lives of the leases are as follows:
|
|
|
|
|
|
|
Year ending June 30, |
|
Minimum |
|
|
|
|
|
|
|
|
|
2012 |
|
$ |
774 |
|
|
2013 |
|
|
358 |
|
|
2014 |
|
|
108 |
|
|
2015 |
|
|
43 |
|
|
2016 |
|
|
19 |
|
|
|
|
|
|
|
|
Total minimum lease payments |
|
$ |
1,302 |
|
|
|
|
|
|
|
Our Oregon facility is subleased for approximately $90 per year through March 2013.
NOTE 12: PROFIT-SHARING PLAN
We maintain a profit-sharing plan in which substantially all full-time employees are eligible to participate. The profit-sharing plan consists of cash distributions determined annually at the discretion of the Board of Directors. We also maintain a 401(k) tax deferred payroll deduction program, under which employees may contribute a tax-deferred amount of up to 60% of their compensation, as defined. In fiscal 2009, we contributed to the 401(k) program based on matching up to 4% of an employee’s contributions. There was no company 401(k) match in either fiscal 2011 or 2010. Our expenses related to the plans for the years ended June 30, 2011, 2010 and 2009 amounted to $2,526, $0 and $967, respectively.
F - 21
NOTE 13: SHARE-BASED COMPENSATION PLANS
|
|
|
Share-Based Compensation Plans |
|
The Zygo Corporation 2002 Equity Incentive Plan (“2002 Plan”), as amended in 2006, permits the granting of stock options to purchase shares of common stock and the granting of restricted stock units. The number of shares authorized under the Plan was 3,300,000 shares, of which 545,000 remain available for grant at June 30, 2011. The exercise price per share of common stock covered by an option may not be less than the par value per share on the date of grant, and in the case of an incentive stock option, the exercise price may not be less than the market value per share on the date of grant. Options and grants of restricted stock units generally vest over a four year period at a rate of 25% each year. Restricted stock awards granted prior to January 1, 2011 vest 50% after three years and 50% after four years. |
The 2002 Plan will expire on August 27, 2012. Pursuant to the terms of the 2002 Plan, the Board of Directors may also amend the 2002 Plan to authorize the grant of other types of equity-based awards, without further action by our stockholders. As part of a director’s compensation for services to the company, non-employee directors are granted 5,000 restricted shares, and a non-employee chairman of the board is granted 7,500 restricted shares, which vest on an annual basis after one year and each new non-employee director is granted options to purchase 16,000 shares of common stock on his or her first day of service, at the market value per share on the date of grant. These options vest over a four year period at a rate of 25% each year.
On June 26, 2001, the Board of Directors granted a warrant to purchase 25,000 shares of our common stock to the Zetetic Institute, a non-profit organization that provided assistance to us in connection with certain research and development activities. The warrant had an exercise price of $18.64 per share, the closing price of the common stock on the date of the grant, and vested in equal annual increments over the four-year period following the date of grant. The warrant expired on June 26, 2011.
We use the Black-Scholes option-pricing model to calculate the fair value of stock option awards. The key assumptions for this valuation method include the expected term of the option, stock price volatility, risk-free interest rate, dividend yield, and exercise price. Under the assumptions indicated below, the weighted-average fair value of stock option grants for fiscal 2011, 2010 and 2009 were $5.68, $4.45 and $3.77, respectively. The table below indicates the key assumptions used in the option valuation calculations for options granted in fiscal 2011, 2010 and 2009, and a discussion of our methodology for developing each of the assumptions used in the valuation model:
|
|
|
|
|
|
|
|
|
|
|
|
|
|
|
Fiscal Year Ended June 30, |
|
|||||||
|
|
|
|
|
|||||||
|
|
|
2011 |
|
2010 |
|
2009 |
|
|||
|
|
|
|
|
|
|
|
|
|||
|
Term |
|
|
4.1-5.1 Years |
|
|
4.1-5.1 Years |
|
|
4-4.6 Years |
|
|
Volatility |
|
|
45.7 - 57.1% |
|
|
45.7 - 60.9% |
|
|
45.5% |
|
|
Dividend yield |
|
|
0.0% |
|
|
0.0% |
|
|
0.0% |
|
|
Risk-free interest rate |
|
|
1.1-2.6% |
|
|
2.0-2.5% |
|
|
0.5-2.9% |
|
Term – This is the period of time over which the options granted are expected to remain outstanding. Options granted generally have a maximum term of ten years. An increase in the expected term would increase compensation expense.
Volatility – This is a measure of the amount by which a price has fluctuated or is expected to fluctuate. Volatilities are based on implied volatilities from traded options of Zygo’s shares and historical volatility of Zygo’s shares. An increase in the expected volatility will increase compensation expense.
Risk-Free Interest Rate – This is the U.S. Treasury rate at the time of the grant having a term equal to the expected term of the option. An increase in the risk-free interest rate would increase compensation expense.
Dividend Yield – We did not make any dividend payments during the last five fiscal years and we have no plans to pay dividends in the foreseeable future. An increase in the dividend yield would decrease compensation expense.
F - 22
Stock Options
The following table summarizes information about our stock options granted under our share-based compensation plans for fiscal 2011, 2010 and 2009. Included in the information below are outstanding options from the Zygo Corporation Amended and Restated Non-Qualified Stock Option Plan which expired in fiscal 2003, to the extent the options remain exercisable.
|
|
|
|
|
|
|
|
|
|
|
|
|
|
|
|
|
|
|
|
|
|
|
|
June 30, 2011 |
|
June 30, 2010 |
|
June 30, 2009 |
|
||||||||||||
|
|
|
|
|
|
|
|
|
||||||||||||
|
|
|
Shares |
|
Weighted |
|
Shares |
|
Weighted |
|
Shares |
|
Weighted |
|
||||||
|
|
|
|
|
|
|
|
|
|
|
|
|
|
|
||||||
|
Options - Outstanding at beginning of year |
|
|
1,976,892 |
|
$ |
20.14 |
|
|
1,908,572 |
|
$ |
22.72 |
|
|
2,058,639 |
|
$ |
25.33 |
|
|
Granted |
|
|
100,000 |
|
$ |
12.13 |
|
|
515,000 |
|
$ |
9.75 |
|
|
169,000 |
|
$ |
9.61 |
|
|
Exercised |
|
|
(166,852 |
) |
$ |
10.05 |
|
|
(57,300 |
) |
$ |
8.39 |
|
|
(21,125 |
) |
$ |
8.65 |
|
|
Expired or cancelled |
|
|
(473,800 |
) |
$ |
51.07 |
|
|
(389,380 |
) |
$ |
29.60 |
|
|
(297,942 |
) |
$ |
37.01 |
|
|
|
|
|
|
|
|
|
|
|
|
|
|
|
|
|
|
|
|
|
|
|
Options - Outstanding at end of year |
|
|
1,436,240 |
|
$ |
10.57 |
|
|
1,976,892 |
|
$ |
20.14 |
|
|
1,908,572 |
|
$ |
22.72 |
|
|
|
|
|
|
|
|
|
|
|
|
|
|
|
|
|
|
|
|
|
|
|
Options vested or expected to vest |
|
|
1,402,221 |
|
$ |
10.56 |
|
|
1,878,816 |
|
$ |
20.68 |
|
|
1,846,583 |
|
$ |
23.10 |
|
|
|
|
|
|
|
|
|
|
|
|
|
|
|
|
|
|
|
|
|
|
|
Options - Exercisable at end of year |
|
|
925,990 |
|
$ |
10.70 |
|
|
1,297,492 |
|
$ |
25.46 |
|
|
1,573,272 |
|
$ |
25.19 |
|
|
|
|
|
|
|
|
|
|
|
|
|
|
|
|
|
|
|
|
|
|
Outstanding options at June 30, 2011, had an intrinsic value of $4,282 with a weighted average remaining contractual life of 5.4 years. Exercisable options at the end of the year had an intrinsic value of $2,659 with a weighted average remaining contractual life of 3.7 years.
The following table summarizes information about our stock options granted under our share-based compensation plans as of June 30, 2011.
|
|
|
|
|
|
|
|
|
|
|
|
|
|
|
|
|
|
|
|
|
Options Outstanding |
|
Options Exercisable |
|
|||||||||||
|
|
|
|
|
|
|
|||||||||||
|
Range of |
|
Number |
|
Weighted |
|
Weighted |
|
Number |
|
Weighted |
|
|||||
|
|
|
|
|
|
|
|
|
|
|
|
|
|||||
|
$ 5.09 - $8.80 |
|
|
307,305 |
|
|
5.5 |
|
$ |
6.72 |
|
|
166,305 |
|
$ |
6.39 |
|
|
$ 9.01 - $12.51 |
|
|
855,331 |
|
|
5.6 |
|
$ |
10.58 |
|
|
536,081 |
|
$ |
10.43 |
|
|
$12.53 - $14.74 |
|
|
151,950 |
|
|
3.9 |
|
$ |
13.72 |
|
|
151,950 |
|
$ |
13.72 |
|
|
$14.90 - $20.09 |
|
|
121,654 |
|
|
5.9 |
|
$ |
16.25 |
|
|
71,654 |
|
$ |
16.29 |
|
|
|
|
|
|
|
|
|
|
|
|
|
|
|||||
|
$ 5.09 - $20.09 |
|
|
1,436,240 |
|
|
5.4 |
|
$ |
7.06 |
|
|
925,990 |
|
$ |
10.70 |
|
|
|
|
|
|
|
|
|
|
|
|
|
|
|||||
As of June 30, 2011, there was $1,246 of total unrecognized compensation cost related to stock options. These costs are expected to be recognized over a weighted average period of 1.93 years.
The total intrinsic value of stock options exercised was $449, $109 and $56 and the total fair value of stock awards vested was $959, $478 and $754 during the fiscal years ended June 30, 2011, 2010 and 2009, respectively.
Cash received from stock option exercises and the associated tax benefit for the fiscal years ended June 30, 2011, 2010 and 2009 was $1,834, $520 and $203, respectively.
F - 23
Restricted Stock
The following table summarizes information about restricted stock units
granted under share-based compensation plans for the fiscal years ended June
30, 2011, 2010, and 2009:
|
|
|
|
|
|
|
|
|
|
|
|
|
|
|
|
|
|
|
|
|
|
|
|
June 30, 2011 |
|
June 30, 2010 |
|
June 30, 2009 |
|
||||||||||||
|
|
|
|
|
|
|
|
|
||||||||||||
|
|
|
Shares |
|
Weighted |
|
Shares |
|
Weighted |
|
Shares |
|
Weighted |
|
||||||
|
|
|
|
|
|
|
|
|
|
|
|
|
|
|
||||||
|
Non vested balance at beginning of year |
|
|
588,093 |
|
$ |
9.04 |
|
|
551,650 |
|
$ |
11.46 |
|
|
635,147 |
|
$ |
12.23 |
|
|
Granted |
|
|
362,500 |
|
$ |
8.28 |
|
|
309,000 |
|
$ |
6.06 |
|
|
189,200 |
|
$ |
9.72 |
|
|
Vested |
|
|
(172,865 |
) |
$ |
8.89 |
|
|
(205,194 |
) |
$ |
11.28 |
|
|
(213,060 |
) |
$ |
11.63 |
|
|
Forfeited |
|
|
(63,753 |
) |
$ |
9.06 |
|
|
(67,363 |
) |
$ |
8.71 |
|
|
(59,637 |
) |
$ |
11.87 |
|
|
|
|
|
|
|
|
|
|
|
|
|
|
|
|
|
|
|
|
|
|
|
Non vested balance at end of year |
|
|
713,975 |
|
$ |
8.00 |
|
|
588,093 |
|
$ |
9.04 |
|
|
551,650 |
|
$ |
11.46 |
|
|
|
|
|
|
|
|
|
|
|
|
|
|
|
|
|
|
|
|
|
|
As of June 30, 2011, there was $2,973 of total unrecognized compensation costs related to restricted stock awards. These costs are expected to be recognized over a weighted average period of 2.4 years.
At June 30, 2011, an aggregate of 545,065 shares remained available for future grants under our share-based compensation plans, which cover stock awards and stock options. We issue shares to satisfy stock option exercises and restricted stock awards, as applicable.
NOTE 14: EMPLOYEE STOCK PURCHASE PLAN
Under the Employee Stock Purchase Plan (“ESPP”), employees who elected to participate had the ability to purchase common stock at a 5% discount from the market value of such stock through payroll deductions of an amount between 1% and 10% of compensation. The total number of shares of common stock available under the ESPP was 500,000. In July 2008, we issued approximately 13,072 shares of common stock. In January 2009, we issued 12,897 shares of common stock under the plan. Participation in the Plan was cancelled during fiscal 2009.
F - 24
NOTE 15: INCOME TAXES
The (provision) benefit for income taxes consists of the following:
|
|
|
|
|
|
|
|
|
|
|
|
|
|
|
Fiscal Year Ended June 30, |
|
|||||||
|
|
|
|
|
|||||||
|
|
|
2011 |
|
2010 |
|
2009 |
|
|||
|
|
|
|
|
|
|
|
|
|||
|
Current: |
|
|
|
|
|
|
|
|
|
|
|
Federal |
|
$ |
725 |
|
$ |
1,917 |
|
$ |
20 |
|
|
State |
|
|
(259 |
) |
|
(130 |
) |
|
(185 |
) |
|
Foreign |
|
|
(1,782 |
) |
|
(1,544 |
) |
|
(1,038 |
) |
|
|
|
|
|
|
|
|
|
|
|
|
|
|
|
|
(1,316 |
) |
|
243 |
|
|
(1,203 |
) |
|
|
|
|
|
|
|
|
|
|
|
|
|
Deferred: |
|
|
|
|
|
|
|
|
|
|
|
Federal |
|
|
— |
|
|
789 |
|
|
(18,277 |
) |
|
State |
|
|
— |
|
|
— |
|
|
(2,567 |
) |
|
Foreign |
|
|
— |
|
|
— |
|
|
(146 |
) |
|
|
|
|
|
|
|
|
|
|
|
|
|
|
|
|
— |
|
|
789 |
|
|
(20,990 |
) |
|
|
|
|
|
|
|
|
|
|
|
|
|
|
|
|
|
|
|
|
|
|
|
|
|
Total |
|
$ |
(1,316 |
) |
$ |
1,032 |
|
$ |
(22,193 |
) |
|
|
|
|
|
|
|
|
|
|
|
|
The income tax (expense) benefit for operations listed above were provided on the following pre-tax book income (loss) from continuing operations amounts:
|
|
|
|
|
|
|
|
|
|
|
|
|
|
|
Fiscal Year Ended June 30, |
|
|||||||
|
|
|
|
|
|||||||
|
|
|
2011 |
|
2010 |
|
2009 |
|
|||
|
|
|
|
|
|
|
|
|
|||
|
Earnings (loss) from operations - U.S. |
|
$ |
18,543 |
|
$ |
(7,883 |
) |
$ |
(39,402 |
) |
|
Earnings from foreign operations |
|
|
3,365 |
|
|
4,183 |
|
|
385 |
|
|
|
|
|
|
|
|
|
|
|
|
|
|
|
|
$ |
21,908 |
|
$ |
(3,700 |
) |
$ |
(39,017 |
) |
|
|
|
|
|
|
|
|
|
|
|
|
F - 25
The total income tax (expense) benefit differs from the amount computed by applying the applicable U.S. federal income tax rate of 35% in fiscal 2011, 2010, and 2009 to earnings from continuing operations before income taxes for the following reasons:
|
|
|
|
|
|
|
|
|
|
|
|
|
|
|
Fiscal Year Ended June 30, |
|
|||||||
|
|
|
|
|
|||||||
|
|
|
2011 |
|
2010 |
|
2009 |
|
|||
|
|
|
|
|
|
|
|
|
|||
|
Computed “expected tax (expense) benefit” |
|
$ |
(7,668 |
) |
$ |
1,295 |
|
$ |
13,656 |
|
|
(Increases) reductions in taxes resulting from: |
|
|
|
|
|
|
|
|
|
|
|
State taxes, net of federal income tax benefit |
|
|
(168 |
) |
|
(85 |
) |
|
(1,789 |
) |
|
Reversal of allowance for uncertain tax positions |
|
|
— |
|
|
1,209 |
|
|
— |
|
|
Refund claims relating to net operating loss (“NOL”) carrybacks and other credits |
|
|
— |
|
|
1,374 |
|
|
— |
|
|
Benefit related to gain on acquisition |
|
|
725 |
|
|
— |
|
|
— |
|
|
Permanent items |
|
|
(524 |
) |
|
(727 |
) |
|
(83 |
) |
|
Foreign tax differential |
|
|
399 |
|
|
88 |
|
|
935 |
|
|
Deferred tax asset valuation allowance and related adjustments to NOL |
|
|
5,920 |
|
|
(2,217 |
) |
|
(36,037 |
) |
|
Other, net |
|
|
— |
|
|
95 |
|
|
1,125 |
|
|
|
|
|
|
|
|
|
|
|
|
|
|
|
|
$ |
(1,316 |
) |
$ |
1,032 |
|
$ |
(22,193 |
) |
|
|
|
|
|
|
|
|
|
|
|
|
The tax effects of temporary differences that give rise to significant portions of the deferred tax assets and deferred tax liabilities as of June 30, 2011 and 2010 are presented below:
|
|
|
|
|
|
|
|
|
|
|
|
June 30, 2011 |
|
June 30, 2010 |
|
||
|
|
|
|
|
|
|
||
|
Deferred tax assets: |
|
|
|
|
|
|
|
|
Accounts receivable |
|
$ |
1,741 |
|
$ |
703 |
|
|
Accrued liabilities and other |
|
|
1,025 |
|
|
3,692 |
|
|
Inventory valuation |
|
|
3,979 |
|
|
4,918 |
|
|
Stock award compensation |
|
|
202 |
|
|
1,977 |
|
|
Intangible assets |
|
|
79 |
|
|
12 |
|
|
Federal, foreign and state net operating loss carryforwards and credits |
|
|
25,406 |
|
|
32,753 |
|
|
Contributions |
|
|
72 |
|
|
81 |
|
|
|
|
|
|
|
|
|
|
|
Deferred tax assets |
|
|
32,504 |
|
|
44,136 |
|
|
|
|
|
|
|
|
|
|
|
|
|
|
|
|
|
|
|
|
Deferred tax liabilities: |
|
|
|
|
|
|
|
|
Prepaid expenses |
|
|
— |
|
|
(276 |
) |
|
Property, plant and equipment |
|
|
(3,270 |
) |
|
(927 |
) |
|
|
|
|
|
|
|
|
|
|
Deferred tax liability |
|
|
(3,270 |
) |
|
(1,203 |
) |
|
|
|
|
|
|
|
|
|
|
|
|
|
|
|
|
|
|
|
Net deferred tax assets before valuation allowance |
|
|
29,234 |
|
|
42,933 |
|
|
Valuation allowance |
|
|
(29,179 |
) |
|
(42,933 |
) |
|
|
|
|
|
|
|
|
|
|
Net deferred tax asset |
|
$ |
55 |
|
$ |
— |
|
|
|
|
|
|
|
|
|
|
Management believes, based upon the uncertain and volatile market conditions and because the Company is in a cumulative pre-tax loss position over a three year-period, it is not more likely than not that the deferred tax assets, net of deferred tax liabilities, of $29,179 as of June 30, 2011 will be realized. In future periods, the allowance could be reduced based on future positive evidence indicating that it is more likely than not that a portion of the deferred tax assets will be realized.
F - 26
At June 30, 2011, our share of the cumulative undistributed earnings of foreign subsidiaries was $8,897. No provision has been made for U.S. or additional foreign taxes on the undistributed earnings of foreign subsidiaries because we intend to continue to reinvest these earnings. Determination of the amount of unrecognized deferred tax liability associated with these earnings is not practicable.
At June 30, 2011, we have federal, state, and foreign NOL carry forwards of approximately $44,343, $12,214, and $5,513, respectively, and various state and foreign tax credit carry forwards of $3,866 and $257. The federal NOL will expire from fiscal 2022 through fiscal 2030, while the state NOL and credits will expire from fiscal 2013 through fiscal 2030. The foreign NOL will begin to expire in fiscal 2028. We also have federal general business credit carry forwards of $5,621 and foreign tax credits of $213 which are available to reduce federal income taxes, if any, through 2029 and begin to expire in 2013. All deferred tax assets relating to the NOL’s and credits have been fully reserved in the valuation allowance since June 30, 2009.
Due to our NOL carry forwards, we have accrued no interest or penalties for any unrecognized tax benefits; however, our policy is to recognize interest related to unrecognized tax benefits in interest expense. Penalties, if incurred, would be recognized as a component of income tax expense. In the normal course of business, we provide for uncertain tax positions and adjust our unrecognized tax benefits accordingly. We do not anticipate any significant changes to our recognized tax benefits over the next twelve months.
The following table is a reconciliation of the beginning and ending balances of unrecognized tax benefits. If our unrecognized benefits were to become recognized in the future, the ending balance for each respective year would then impact our effective rate at the time which the unrecognized benefits are ultimately recognized.
|
|
|
|
|
|
|
Unrecognized tax benefit, June 30, 2008 |
|
$ |
1,872 |
|
|
Decreases - tax positions of current year |
|
|
(46 |
) |
|
|
|
|
|
|
|
Unrecognized tax benefit, June 30, 2009 |
|
$ |
1,826 |
|
|
Decreases - tax positions of prior years |
|
|
(1,826 |
) |
|
|
|
|
|
|
|
Unrecognized tax benefit, June 30, 2010 |
|
|
— |
|
|
Increases - tax positions of prior years |
|
|
855 |
|
|
|
|
|
|
|
|
Unrecognized tax benefit, June 30, 2011 |
|
$ |
855 |
|
|
|
|
|
|
|
We are subject to U.S. federal income tax as well as income tax in multiple state and foreign jurisdictions. We are no longer subject to U.S. federal income tax audit or tax adjustments for years prior to June 30, 2007, except to the extent we have NOLs and credits arising from any of those years. Those years are subject to audit at the time the NOL or credit is utilized. We are no longer subject to state and foreign income tax audit or tax adjustments for years prior to June 30, 2006.
F - 27
NOTE 16: SEGMENT REPORTING
Our business is organized into two operating divisions – Metrology Solutions (Metrology Solutions segment) and Optical Systems (Optical Systems segment). Consistent with our business structure, we reported our segments as Metrology and Optics. Our Metrology Solutions segment includes 3-Dimensional surface metrology products, precision positioning systems and custom engineered solutions. Zygo’s Optical Systems segment designs, develops and manufactures high precision optical components and electro-optical systems used in the semiconductor, defense, life-sciences and research markets. The chief operating decision-maker uses this information to allocate resources.
|
|
|
|
|
|
|
|
|
|
|
|
|
|
|
Fiscal Year Ended June 30, |
|
|||||||
|
|
|
|
|
|||||||
|
|
|
2011 |
|
2010 |
|
2009 |
|
|||
|
|
|
|
|
|
|
|
|
|||
|
Metrology Solutions |
|
|
|
|
|
|
|
|
|
|
|
Net revenues |
|
$ |
92,947 |
|
$ |
65,841 |
|
$ |
82,766 |
|
|
Gross profit |
|
|
50,913 |
|
|
33,652 |
|
|
28,427 |
|
|
Gross margin |
|
|
55 |
% |
|
51 |
% |
|
34 |
% |
|
|
|
|
|
|
|
|
|
|
|
|
|
Optical Systems |
|
|
|
|
|
|
|
|
|
|
|
Net revenues |
|
$ |
57,179 |
|
$ |
35,489 |
|
$ |
31,968 |
|
|
Gross profit |
|
|
19,880 |
|
|
8,317 |
|
|
4,006 |
|
|
Gross margin |
|
|
35 |
% |
|
23 |
% |
|
13 |
% |
|
|
|
|
|
|
|
|
|
|
|
|
|
Total |
|
|
|
|
|
|
|
|
|
|
|
Net revenues |
|
$ |
150,126 |
|
$ |
101,330 |
|
$ |
114,734 |
|
|
Gross profit |
|
|
70,793 |
|
|
41,969 |
|
|
32,433 |
|
|
Gross margin |
|
|
47 |
% |
|
41 |
% |
|
28 |
% |
Separate financial information by segment for total assets, capital expenditures and depreciation and amortization is not available and is not evaluated by the chief operating decision-maker.
Substantially all of our operating assets, depreciation and amortization are U.S. based. Revenues by geographic area based on shipping destination were as follows:
|
|
|
|
|
|
|
|
|
|
|
|
|
|
|
Fiscal Year Ended June 30, |
|
|||||||
|
|
|
|
|
|||||||
|
|
|
2011 |
|
2010 |
|
2009 |
|
|||
|
|
|
|
|
|
|
|
|
|||
|
|
|
|
|
|
|
|
|
|
|
|
|
Americas: |
|
$ |
81,710 |
|
$ |
54,066 |
|
$ |
55,456 |
|
|
Far East: |
|
|
|
|
|
|
|
|
|
|
|
Japan |
|
|
31,648 |
|
|
18,280 |
|
|
26,352 |
|
|
Pacific Rim |
|
|
18,785 |
|
|
15,376 |
|
|
19,415 |
|
|
|
|
|
|
|
|
|
|
|
|
|
|
Total Far East |
|
|
50,433 |
|
|
33,656 |
|
|
45,767 |
|
|
|
|
|
|
|
|
|
|
|
|
|
|
Europe |
|
|
17,983 |
|
|
13,608 |
|
|
13,511 |
|
|
|
|
|
|
|
|
|
|
|
|
|
|
Total |
|
$ |
150,126 |
|
$ |
101,330 |
|
$ |
114,734 |
|
|
|
|
|
|
|
|
|
|
|
|
|
NOTE 17: TRANSACTIONS WITH STOCKHOLDER
Sales to Canon, Inc., a stockholder representing approximately 7% ownership at June 30, 2011, and Canon Sales Co., Inc., a distributor of certain of our products in Japan and a subsidiary of Canon Inc. (collectively “Canon”), were $19,697 (13% of net revenues), $8,809 (9% of net revenues) and $16,229 (14% of net revenues), for the years ended June 30, 2011, 2010 and 2009, respectively. Substantially all of these revenues occurred in the Metrology segment. Selling prices of products sold to Canon are based, generally, on the normal terms given to distributors.
At June 30, 2011 and 2010, there were, in the aggregate, $2,572 and $667, respectively, of trade accounts receivable from Canon.
F - 28
NOTE 18: HEDGING ACTIVITIES
We enter into foreign currency forward contracts to reduce the impact of adverse fluctuations on earnings associated with foreign currency exchange rate changes. We do not enter into any derivative transactions for speculative purposes. These contracts are not designated as cash flow, fair value, or net investment hedges and therefore, are marked-to-market with changes in fair value recorded to earnings. These contracts are entered into for periods consistent with the currency transaction exposures, generally three to six months. Any gains and losses on the fair value of these contracts would largely offset corresponding losses and gains on the underlying transactions.
As of June 30, 2011, we had six foreign currency forward contracts outstanding with notional amounts aggregating to $3,060. Net unrealized losses recognized from foreign currency forward contracts for fiscal 2011, 2010 and 2009 was $12, $64 and $49, respectively, included in other income in the consolidated statements of operations. These losses are substantially offset by foreign exchange gains on intercompany balances recorded by our subsidiaries.
NOTE 19: QUARTERLY RESULTS (UNAUDITED)
The following table sets forth certain unaudited quarterly financial data:
|
|
|
|
|
|
|
|
|
|
|
|
|
|
|
|
|
|
For the Fiscal Year Ended June 30, 2011 |
|
||||||||||
|
|
|
|
|
||||||||||
|
|
|
September 30 |
|
December 31 |
|
March 31 |
|
June 30 |
|
||||
|
|
|
|
|
|
|
|
|
|
|
||||
|
Net revenues |
|
$ |
31,119 |
|
$ |
36,086 |
|
$ |
40,235 |
|
$ |
42,686 |
|
|
|
|
|
|
|
|
|
|
|
|
|
|
|
|
|
Gross profit |
|
$ |
14,203 |
|
$ |
16,894 |
|
$ |
18,864 |
|
$ |
20,832 |
|
|
|
|
|
|
|
|
|
|
|
|
|
|
|
|
|
Net earnings |
|
$ |
3,256 |
|
$ |
6,090 |
|
$ |
4,834 |
|
$ |
6,503 |
|
|
|
|
|
|
|
|
|
|
|
|
|
|
|
|
|
Net earnings from continuing operations attributable to Zygo Corporation |
|
$ |
2,637 |
|
$ |
5,774 |
|
$ |
4,473 |
|
$ |
6,104 |
|
|
|
|
|
|
|
|
|
|
|
|
|
|
|
|
|
Net earnings attributable to Zygo Corporation |
|
$ |
2,728 |
|
$ |
5,774 |
|
$ |
4,473 |
|
$ |
6,104 |
|
|
|
|
|
|
|
|
|
|
|
|
|
|
|
|
|
Net earnings attributable to Zygo Corporation per basic common share |
|
$ |
0.16 |
|
$ |
0.33 |
|
$ |
0.25 |
|
$ |
0.34 |
|
|
|
|
|
|
|
|
|
|
|
|
|
|
|
|
|
Net earnings attributable to Zygo Corporation per diluted common share |
|
$ |
0.16 |
|
$ |
0.32 |
|
$ |
0.24 |
|
$ |
0.33 |
|
|
|
|
|
|
|
|
|
|
|
|
|
|
|
|
|
|
|
|
|
|
|
|
|
|
|
|
|
|
|
|
|
|
For the Fiscal Year Ended June 30, 2010 |
|
||||||||||
|
|
|
|
|
||||||||||
|
|
|
September 30 |
|
December 31 |
|
March 31 |
|
June 30 |
|
||||
|
|
|
|
|
|
|
|
|
|
|
||||
|
Net revenues |
|
$ |
21,325 |
|
$ |
26,081 |
|
$ |
25,439 |
|
$ |
28,485 |
|
|
|
|
|
|
|
|
|
|
|
|
|
|
|
|
|
Gross profit |
|
$ |
7,174 |
|
$ |
10,953 |
|
$ |
11,477 |
|
$ |
12,365 |
|
|
|
|
|
|
|
|
|
|
|
|
|
|
|
|
|
Net earnings (loss) |
|
$ |
(5,655 |
) |
$ |
(1,592 |
) |
$ |
(2,464 |
) |
$ |
4,374 |
|
|
|
|
|
|
|
|
|
|
|
|
|
|
|
|
|
Net earnings (loss) from continuing operations attributable to Zygo Corporation |
|
$ |
(3,952 |
) |
$ |
(1,266 |
) |
$ |
(2,503 |
) |
$ |
4,096 |
|
|
|
|
|
|
|
|
|
|
|
|
|
|
|
|
|
Net earnings (loss) attributable to Zygo Corporation |
|
$ |
(5,787 |
) |
$ |
(1,905 |
) |
$ |
(2,696 |
) |
$ |
4,094 |
|
|
|
|
|
|
|
|
|
|
|
|
|
|
|
|
|
Net earnings (loss) attributable to Zygo Corporation per basic common share |
|
$ |
(0.34 |
) |
$ |
(0.11 |
) |
$ |
(0.16 |
) |
$ |
0.23 |
|
|
|
|
|
|
|
|
|
|
|
|
|
|
|
|
|
Net earnings (loss) attributable to Zygo Corporation per diluted common share |
|
$ |
(0.34 |
) |
$ |
(0.11 |
) |
$ |
(0.16 |
) |
$ |
0.23 |
|
|
|
|
|
|
|
|
|
|
|
|
|
|
|
|
F - 29
NOTE 20: DISCONTINUED OPERATIONS
During the quarter ended September 30, 2009, we determined to sell or otherwise close down the Singapore IC packaging metrology operations of our vision systems product line, included in our Metrology Solutions segment. As of September 30, 2009, operations had ceased at this location. The results of operations for the aforementioned operations are presented as discontinued operations in the Company’s Consolidated Financial Statements. The financial presentation and related footnotes for fiscal 2009 have been restated to show the comparable effects of the discontinued operations.
The following table summarizes the operating results of discontinued operations for the fiscal years ended June 30, 2011, 2010 and 2009:
|
|
|
|
|
|
|
|
|
|
|
|
|
|
|
Fiscal Year Ended June 30, |
|
|||||||
|
|
|
|
|
|||||||
|
|
|
2011 |
|
2010 |
|
2009 |
|
|||
|
|
|
|
|
|
|
|
|
|||
|
Net revenues |
|
$ |
— |
|
$ |
665 |
|
$ |
1,306 |
|
|
Cost of goods sold |
|
|
— |
|
|
268 |
|
|
2,271 |
|
|
|
|
|
|
|
|
|
|
|
|
|
|
Gross profit (loss) |
|
|
— |
|
|
397 |
|
|
(965 |
) |
|
Operating (income) expenses, and other |
|
|
(91 |
) |
|
3,066 |
|
|
459 |
|
|
Asset impairment |
|
|
— |
|
|
— |
|
|
2,483 |
|
|
|
|
|
|
|
|
|
|
|
|
|
|
Earnings (loss) before income taxes |
|
|
91 |
|
|
(2,669 |
) |
|
(3,907 |
) |
|
Income tax expense |
|
|
— |
|
|
— |
|
|
(152 |
) |
|
|
|
|
|
|
|
|
|
|
|
|
|
Earnings (loss) from discontinued operations, net of tax |
|
$ |
91 |
|
$ |
(2,669 |
) |
$ |
(4,059 |
) |
|
|
|
|
|
|
|
|
|
|
|
|
The following table sets forth the assets and liabilities of our discontinued operations included in the Consolidated Balance Sheets of the Company as of June 30, 2011 and 2010:
|
|
|
|
|
|
|
|
|
|
|
|
June 30, |
|
June
30, |
|
||
|
|
|
|
|
|
|
||
|
Receivables |
|
$ |
— |
|
$ |
— |
|
|
Other assets |
|
|
— |
|
|
17 |
|
|
|
|
|
|
|
|
|
|
|
Current assets of discontinued operations |
|
$ |
— |
|
$ |
17 |
|
|
|
|
|
|
|
|
|
|
|
|
|
|
|
|
|
|
|
|
Accounts payable |
|
$ |
— |
|
$ |
— |
|
|
Accrued expenses and other current liabilities |
|
|
281 |
|
|
287 |
|
|
|
|
|
|
|
|
|
|
|
Current liabilities of discontinued operations |
|
$ |
281 |
|
$ |
287 |
|
|
|
|
|
|
|
|
|
|
|
|
|
|
|
|
|
|
|
|
Other long-term liabilities |
|
$ |
— |
|
$ |
281 |
|
|
|
|
|
|
|
|
|
|
|
Long-term liabilities of discontinued operations |
|
$ |
— |
|
$ |
281 |
|
|
|
|
|
|
|
|
|
|
Liabilities remaining as of June 30, 2011 include amounts due on a non-compete agreement that will be paid in the next twelve months.
* * * * *
F - 30
ZYGO CORPORATION AND CONSOLIDATED SUBSIDIARY
SCHEDULE II - VALUATION AND QUALIFYING ACCOUNTS
Years ended June 30, 2011, 2010 and 2009
(Thousands of dollars)
|
|
|
|
|
|
|
|
|
|
|
|
|
|
|
|
Description |
|
Balance
at |
|
Provision |
|
Write-Offs
and |
|
Balance
at End |
|
||||
|
|
|
|
|
|
|
|
|
|
|
||||
|
|
|
|
|
|
|
|
|
|
|
|
|
|
|
|
Year Ended June 30, 2011 |
|
|
|
|
|
|
|
|
|
|
|
|
|
|
|
|
|
|
|
|
|
|
|
|
|
|
|
|
|
Allowance for doubtful accounts |
|
$ |
1,975 |
|
$ |
(299 |
) |
$ |
277 |
|
$ |
1,399 |
|
|
|
|
|
|
|
|
|
|
|
|
|
|
|
|
|
Valuation allowance on net deferred tax assets |
|
$ |
42,933 |
|
$ |
(5,920 |
) |
$ |
7,834 |
|
$ |
29,179 |
|
|
|
|
|
|
|
|
|
|
|
|
|
|
|
|
|
Year Ended June 30, 2010 |
|
|
|
|
|
|
|
|
|
|
|
|
|
|
|
|
|
|
|
|
|
|
|
|
|
|
|
|
|
Allowance for doubtful accounts |
|
$ |
2,550 |
|
$ |
(586 |
) |
$ |
(11 |
) |
$ |
1,975 |
|
|
|
|
|
|
|
|
|
|
|
|
|
|
|
|
|
Valuation allowance on net deferred tax assets |
|
$ |
39,015 |
|
$ |
(789 |
) |
$ |
(4,707 |
) |
$ |
42,933 |
|
|
|
|
|
|
|
|
|
|
|
|
|
|
|
|
|
Year Ended June 30, 2009 |
|
|
|
|
|
|
|
|
|
|
|
|
|
|
|
|
|
|
|
|
|
|
|
|
|
|
|
|
|
Allowance for doubtful accounts |
|
$ |
349 |
|
$ |
3,157 |
|
$ |
956 |
|
$ |
2,550 |
|
|
|
|
|
|
|
|
|
|
|
|
|
|
|
|
|
Valuation allowance on net deferred tax assets |
|
$ |
2,105 |
|
$ |
20,990 |
|
$ |
(15,920 |
) |
$ |
39,015 |
|
S - 1
EXHIBIT INDEX
|
|
|
|
|
EXHIBIT |
|
|
|
|
|
|
|
|
|
|
|
21 |
|
Subsidiaries of Registrant |
|
|
|
|
|
23.1 |
|
Consent of Independent Registered Public Accounting Firm |
|
|
|
|
|
31.1 |
|
Certification Pursuant to Rule 13a-14(a) or 15d-14(a) of the Securities Exchange Act of 1934, as adopted pursuant to Section 302 of the Sarbanes-Oxley Act of 2002 |
|
|
|
|
|
31.2 |
|
Certification Pursuant to Rule 13a-14(a) or 15d-14(a) of the Securities Exchange Act of 1934, as adopted pursuant to Section 302 of the Sarbanes-Oxley Act of 2002 |
|
|
|
|
|
32.1 |
|
Certification Pursuant to 18 U.S.C. Section 1350, as adopted pursuant to Section 906 of the Sarbanes-Oxley Act of 2002 |
|
|
|
|
|
32.2 |
|
Certification Pursuant to 18 U.S.C. Section 1350, as adopted pursuant to Section 906 of the Sarbanes-Oxley Act of 2002 |