Attached files
| file | filename |
|---|---|
| 8-K - FORM 8-K - SEALED AIR CORP/DE | y92647e8vk.htm |
| Investor Update September 2011 |
| Safe Harbor and Regulation G Statement This presentation contains forward-looking statements within the meaning of the Private Securities Litigation Reform Act of 1995. These forward-looking statements can be identified by such words as “anticipates,” “believes,” “plan,” “assumes,” “could,” “estimates,” “expects” and similar expressions. These statements include comments as to Sealed Air Corporation’s (“the Company”) beliefs and expectations as to future events and trends affecting the Company’s business or the successful outcome of the business combination and illustrative or pro forma combined results. Examples of such forward-looking statements may include, but are not limited to, statements about the benefits of the business combination transaction between the Company and Diversey, Inc. (“Diversey”), potential synergies and cost savings, the potential accretion of the transaction to the Company’s earnings, Adjusted EBITDA, and free cash flow, future financial and operating results, the expected timing of the completion of the transaction and the Company’s plans, objectives, expectations and intentions with respect to future operations, products and services. The following factors, among others, could cause actual results to differ materially from the anticipated results or other expectations expressed in the forward-looking statements: general business and economic conditions; the competitive environment; the failure to realize synergies and cost-savings from the transaction or delay in realization thereof; the businesses of Sealed Air and Diversey may not be combined successfully, or such combination may take longer, be more difficult, time-consuming or costly to accomplish than expected; and adverse effects of the merger on employee retention and on Sealed Air’s and Diversey’s business relationships with third parties, including key customers and distributors and the impact of purchase accounting adjustments on operating results. For more extensive information, see “Risk Factors” and “Cautionary Notice Regarding Forward-Looking Statements,” which appear in our most recent annual report on Form 10-K, as filed with the Securities and Exchange Commission, as may be updated by the Company’s quarterly reports on Form 10-Q or current reports on Form 8-K. While the Company may elect to update forward-looking statements at some point in the future, the Company specifically disclaims any obligation to do so, even if estimates change and, therefore, you should not rely on these forward-looking statements as representing our views as of any date subsequent to today. Our management uses non-U.S. GAAP financial measures to evaluate the Company’s performance, which exclude items we consider unusual or special items. We believe the use of such financial measures and information may be useful to investors. We believe that the use of non-U.S. GAAP measures helps investors to gain a better understanding of core operating results and future prospects, consistent with how management measures and forecasts the Company’s performance, especially when comparing such results to previous periods or forecasts. The non-U.S. GAAP financial measures we present may not be comparable with similarly-titled measures used by others. For important information on our use of non-U.S. GAAP financial measures and information, including reconciliations of such non-U.S. GAAP financial measures and information to comparable U.S. GAAP measures and information, please refer to the financial tables that appear later in this presentation. |
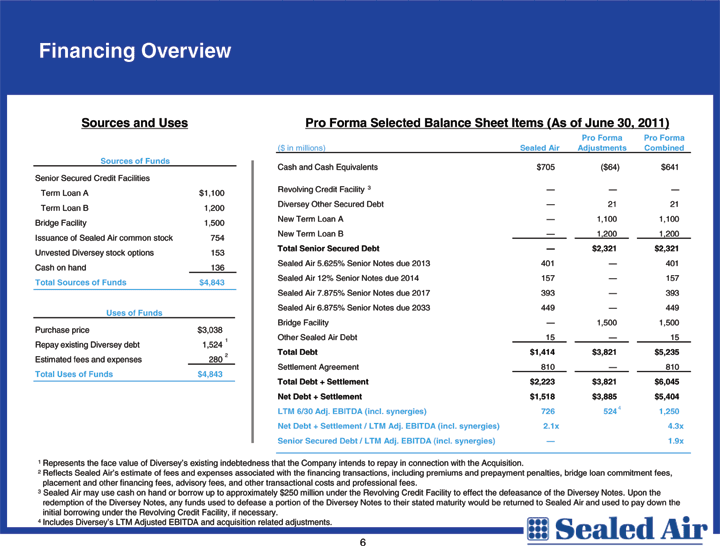
| Financing Overview Sources and Uses Pro Forma Selected Balance Sheet Items (As of June 30, 2011) Pro Forma Pro Forma ($ in millions) Sealed Air Adjustments Combined Sources of Funds Cash and Cash Equivalents $705 ($64) $641 Senior Secured Credit Facilities Term Loan A $1,100 Revolving Credit Facility 3 — — —Diversey Other Secured Debt — 21 21 Term Loan B 1,200 New Term Loan A — 1,100 1,100 Bridge Facility 1,500 New Term Loan B — 1,200 1,200 Issuance of Sealed Air common stock 754 Total Senior Secured Debt — $2,321 $2,321 Unvested Diversey stock options 153 Sealed Air 5.625% Senior Notes due 2013 401 — 401 Cash on hand 136 Sealed Air 12% Senior Notes due 2014 157 — 157 Total Sources of Funds $4,843 Sealed Air 7.875% Senior Notes due 2017 393 — 393 Sealed Air 6.875% Senior Notes due 2033 449 — 449 Uses of Funds Bridge Facility — 1,500 1,500 Purchase price $3,038 1 Other Sealed Air Debt 15 — 15 Repay existing Diversey debt 1,524 Total Debt $1,414 $3,821 $5,235 2 Estimated fees and expenses 280 Settlement Agreement 810 — 810 Total Uses of Funds $4,843 Total Debt + Settlement $2,223 $3,821 $6,045 Net Debt + Settlement $1,518 $3,885 $5,404 4 LTM 6/30 Adj. EBITDA (incl. synergies) 726 524 1,250 Net Debt + Settlement / LTM Adj. EBITDA (incl. synergies) 2.1x 4.3x Senior Secured Debt / LTM Adj. EBITDA (incl. synergies) — 1.9x 1 Represents the face value of Diversey’s existing indebtedness that the Company intends to repay in connection with the Acquisition. 2 Reflects Sealed Air’s estimate of fees and expenses associated with the financing transactions, including premiums and prepayment penalties, bridge loan commitment fees, placement and other financing fees, advisory fees, and other transactional costs and professional fees. 3 Sealed Air may use cash on hand or borrow up to approximately $250 million under the Revolving Credit Facility to effect the defeasance of the Diversey Notes. Upon the redemption of the Diversey Notes, any funds used to defease a portion of the Diversey Notes to their stated maturity would be returned to Sealed Air and used to pay down the initial borrowing under the Revolving Credit Facility, if necessary. 4 Includes Diversey’s LTM Adjusted EBITDA and acquisition related adjustments. |
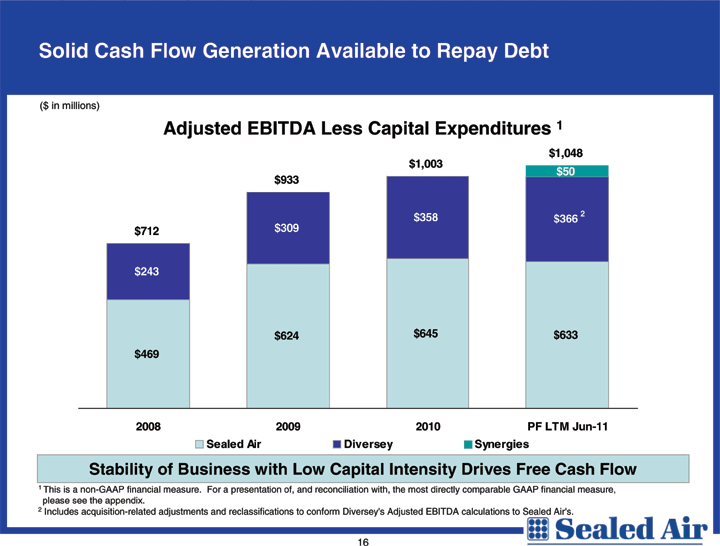
| Solid Cash Flow Generation Available to Repay Debt ($ in millions) Adjusted EBITDA Less Capital Expenditures 1 $1,048 $1,003 $50 $933 $358 2 $309 $366 $712 $243 $624 $645 $633 $469 2008 2009 2010 PF LTM Jun-11 Sealed Air Diversey Synergies Stability of Business with Low Capital Intensity Drives Free Cash Flow 1 This is a non-GAAP financial measure. For a presentation of, and reconciliation with, the most directly comparable GAAP financial measure, please see the appendix. 2 Includes acquisition-related adjustments and reclassifications to conform Diversey’s Adjusted EBITDA calculations to Sealed Air’s. |
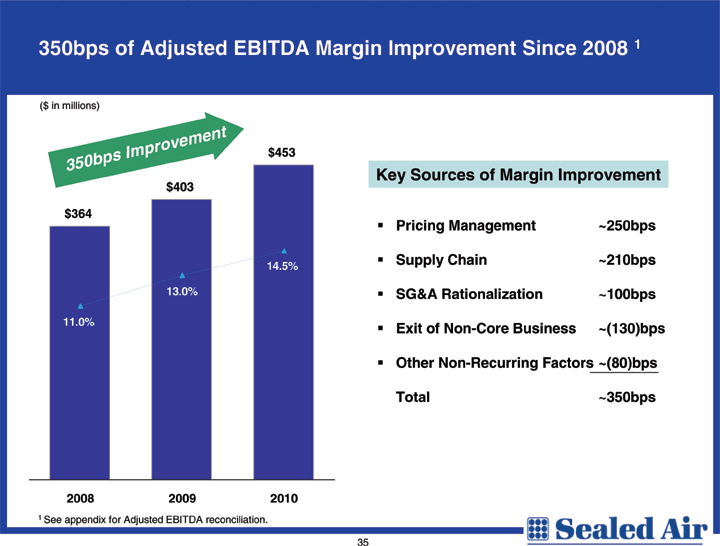
| 350bps of Adjusted EBITDA Margin Improvement Since 2008 1 ($ in millions) ent ovem Impr $453 0bps 35 Key Sources of Margin Improvement $403 $364 Pricing Management ~250bps Supply Chain ~210bps 14.5% 13.0% SG&A Rationalization ~100bps 11.0% Exit of Non-Core Business ~(130)bps Other Non-Recurring Factors ~(80)bps Total ~350bps 2008 2009 2010 1 See appendix for Adjusted EBITDA reconciliation. |
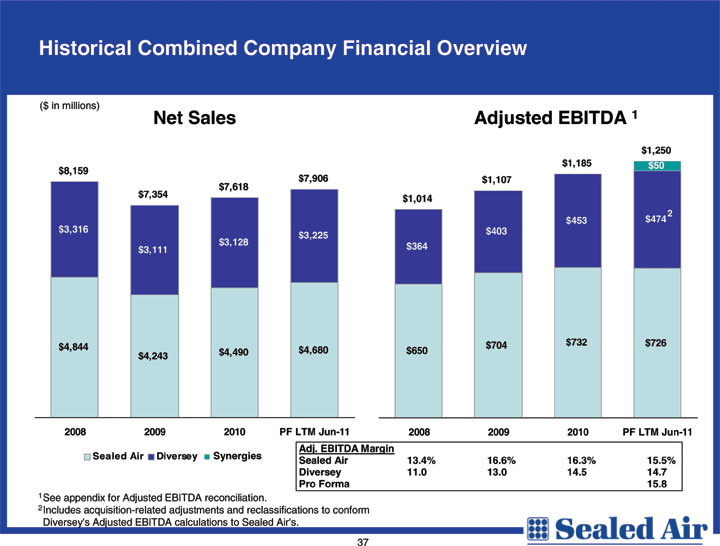
| Historical Combined Company Financial Overview ($ in millions) Net Sales Adjusted EBITDA 1 $1,250 $8,159 $1,185 $50 $7,906 $1,107 $7,354 $7,618 $1,014 2 $453 $474 $3,316 $403 $3,225 $3,128 $3,111 $364 $704 $732 $726 $4,844 $4,680 $650 $4,243 $4,490 2008 2009 2010 PF LTM Jun-11 2008 2009 2010 PF LTM Jun-11 Adj. EBITDA Margin Sealed Air Diversey Synergies Sealed Air 13.4% 16.6% 16.3% 15.5% Diversey 11.0 13.0 14.5 14.7 Pro Forma 15.8 1See appendix for Adjusted EBITDA reconciliation. 2Includes acquisition-related adjustments and reclassifications to conform Diversey’s Adjusted EBITDA calculations to Sealed Air’s. |
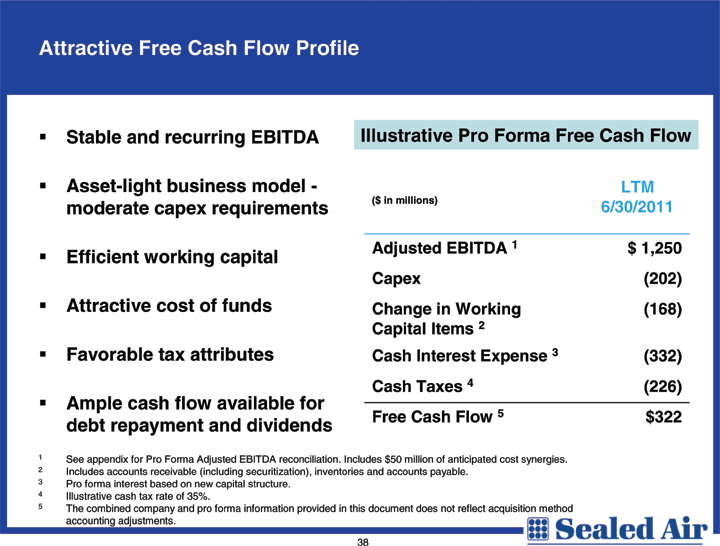
| Attractive Free Cash Flow Profile Stable and recurring EBITDA Illustrative Pro Forma Free Cash Flow Asset-light business model — LTM ($ in millions) 6/30/2011 moderate capex requirements Efficient working capital Adjusted EBITDA 1 $1,250 Capex (202) Attractive cost of funds Change in Working (168) Capital Items 2 Favorable tax attributes Cash Interest Expense 3 (332) Cash Taxes 4 (226) Ample cash flow available for debt repayment and dividends Free Cash Flow 5 $322 1 See appendix for Pro Forma Adjusted EBITDA reconciliation. Includes $50 million of anticipated cost synergies. 2 Includes accounts receivable (including securitization), inventories and accounts payable. 3 Pro forma interest based on new capital structure. 4 Illustrative cash tax rate of 35%. 5 The combined company and pro forma information provided in this document does not reflect acquisition method accounting adjustments. |
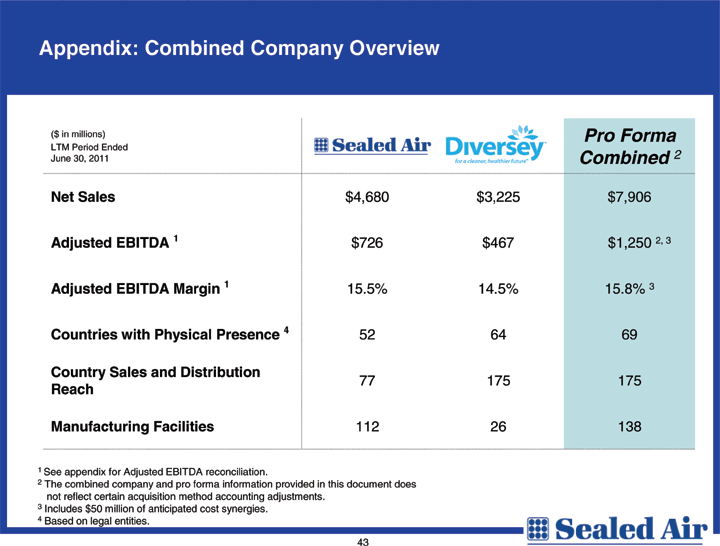
| Appendix: Combined Company Overview ($ in millions) Pro Forma LTM Period Ended June 30, 2011 Combined 2 Net Sales $4,680 $3,225 $7,906 Adjusted EBITDA 1 $726 $467 $1,250 2, 3 Adjusted EBITDA Margin 1 15.5% 14.5% 15.8% 3 Countries with Physical Presence 4 52 64 69 Country Sales and Distribution 77 175 175 Reach Manufacturing Facilities 112 26 138 1 See appendix for Adjusted EBITDA reconciliation. 2 The combined company and pro forma information provided in this document does not reflect certain acquisition method accounting adjustments. 3 Includes $50 million of anticipated cost synergies. 4 Based on legal entities. |
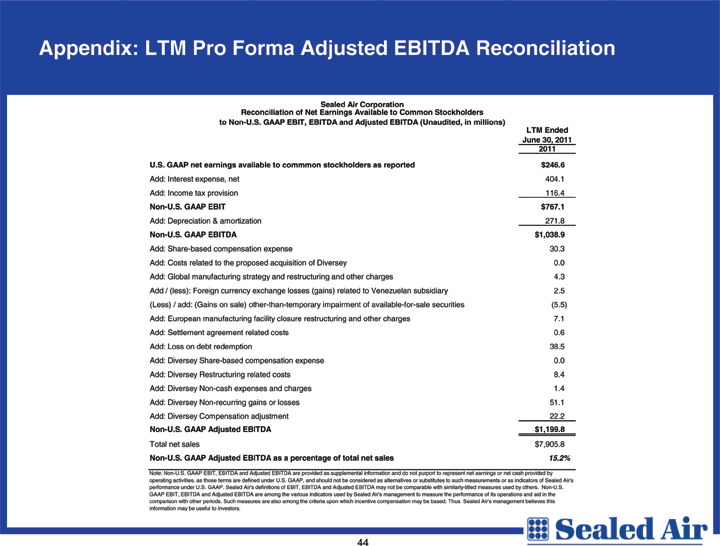
| Appendix: LTM Pro Forma Adjusted EBITDA Reconciliation Sealed Air Corporation Reconciliation of Net Earnings Available to Common Stockholders to Non-U.S. GAAP EBIT, EBITDA and Adjusted EBITDA (Unaudited, in millions) LTM Ended June 30, 2011 2011 U.S. GAAP net earnings available to commmon stockholders as reported $246.6 Add: Interest expense, net 404.1 Add: Income tax provision 116.4 Non-U.S. GAAP EBIT $767.1 Add: Depreciation & amortization 271.8 Non-U.S. GAAP EBITDA $1,038.9 Add: Share-based compensation expense 30.3 Add: Costs related to the proposed acquisition of Diversey 0.0 Add: Global manufacturing strategy and restructuring and other charges 4.3 Add / (less): Foreign currency exchange losses (gains) related to Venezuelan subsidiary 2.5 (Less) / add: (Gains on sale) other-than-temporary impairment of available-for-sale securities (5.5) Add: European manufacturing facility closure restructuring and other charges 7.1 Add: Settlement agreement related costs 0.6 Add: Loss on debt redemption 38.5 Add: Diversey Share-based compensation expense 0.0 Add: Diversey Restructuring related costs 8.4 Add: Diversey Non-cash expenses and charges 1.4 Add: Diversey Non-recurring gains or losses 51.1 Add: Diversey Compensation adjustment 22.2 Non-U.S. GAAP Adjusted EBITDA $1,199.8 Total net sales $7,905.8 Non-U.S. GAAP Adjusted EBITDA as a percentage of total net sales 15.2% Note: Non-U.S. GAAP EBIT, EBITDA and Adjusted EBITDA are provided as supplemental information and do not purport to represent net earnings or net cash provided by operating activities, as those terms are defined under U.S. GAAP, and should not be considered as alternatives or substitutes to such measurements or as indicators of Sealed Air’s performance under U.S. GAAP. Sealed Air’s definitions of EBIT, EBITDA and Adjusted EBITDA may not be comparable with similarly-titled measures used by others. Non-U.S. GAAP EBIT, EBITDA and Adjusted EBITDA are among the various indicators used by Sealed Air’s management to measure the performance of its operations and aid in the comparison with other periods. Such measures are also among the criteria upon which incentive compensation may be based. Thus Sealed Air’s management believes this information may be useful to investors. |
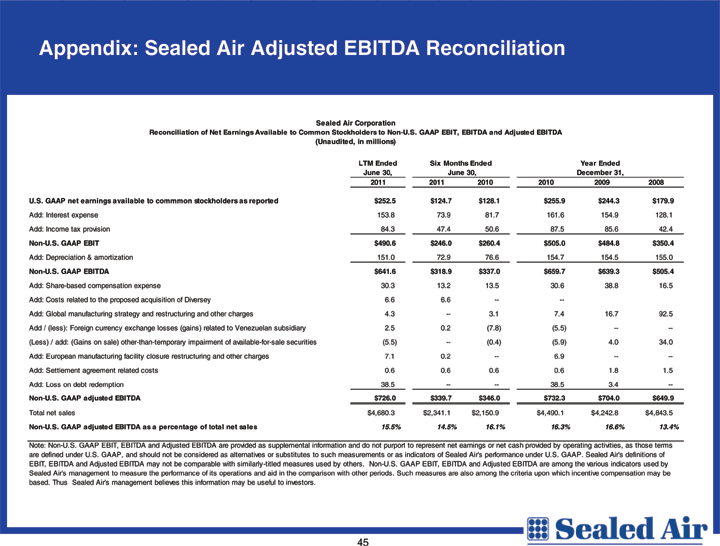
| Appendix: Sealed Air Adjusted EBITDA Reconciliation Sealed Air Corporation Reconciliation of Net Earnings Available to Common Stockholders to Non-U.S. GAAP EBIT, EBITDA and Adjusted EBITDA (Unaudited, in millions) LTM Ended Six Months Ended Year Ended June 30, June 30, December 31, 2011 2011 2010 2010 2009 2008 U.S. GAAP net earnings available to commmon stockholders as reported $252.5 $124.7 $128.1 $255.9 $244.3 $179.9 Add: Interest expense 153.8 73.9 81.7 161.6 154.9 128.1 Add: Income tax provision 84.3 47.4 50.6 87.5 85.6 42.4 Non-U.S. GAAP EBIT $490.6 $246.0 $260.4 $505.0 $484.8 $350.4 Add: Depreciation & amortization 151.0 72.9 76.6 154.7 154.5 155.0 Non-U.S. GAAP EBITDA $641.6 $318.9 $337.0 $659.7 $639.3 $505.4 Add: Share-based compensation expense 30.3 13.2 13.5 30.6 38.8 16.5 Add: Costs related to the proposed acquisition of Diversey 6.6 6.6 — —Add: Global manufacturing strategy and restructuring and other charges 4.3 — 3.1 7.4 16.7 92.5 Add / (less): Foreign currency exchange losses (gains) related to Venezuelan subsidiary 2.5 0.2 (7.8) (5.5) — —(Less) / add: (Gains on sale) other-than-temporary impairment of available-for-sale securities (5.5) — (0.4) (5.9) 4.0 34.0 Add: European manufacturing facility closure restructuring and other charges 7.1 0.2 — 6.9 — —Add: Settlement agreement related costs 0.6 0.6 0.6 0.6 1.8 1.5 Add: Loss on debt redemption 38.5 — — 38.5 3.4 — Non-U.S. GAAP adjusted EBITDA $726.0 $339.7 $346.0 $732.3 $704.0 $649.9 Total net sales $4,680.3 $2,341.1 $2,150.9 $4,490.1 $4,242.8 $4,843.5 Non-U.S. GAAP adjusted EBITDA as a percentage of total net sales 15.5% 14.5% 16.1% 16.3% 16.6% 13.4% Note: Non-U.S. GAAP EBIT, EBITDA and Adjusted EBITDA are provided as supplemental information and do not purport to represent net earnings or net cash provided by operating activities, as those terms are defined under U.S. GAAP, and should not be considered as alternatives or substitutes to such measurements or as indicators of Sealed Air’s performance under U.S. GAAP. Sealed Air’s definitions of EBIT, EBITDA and Adjusted EBITDA may not be comparable with similarly-titled measures used by others. Non-U.S. GAAP EBIT, EBITDA and Adjusted EBITDA are among the various indicators used by Sealed Air’s management to measure the performance of its operations and aid in the comparison with other periods. Such measures are also among the criteria upon which incentive compensation may be based. Thus Sealed Air’s management believes this information may be useful to investors. |
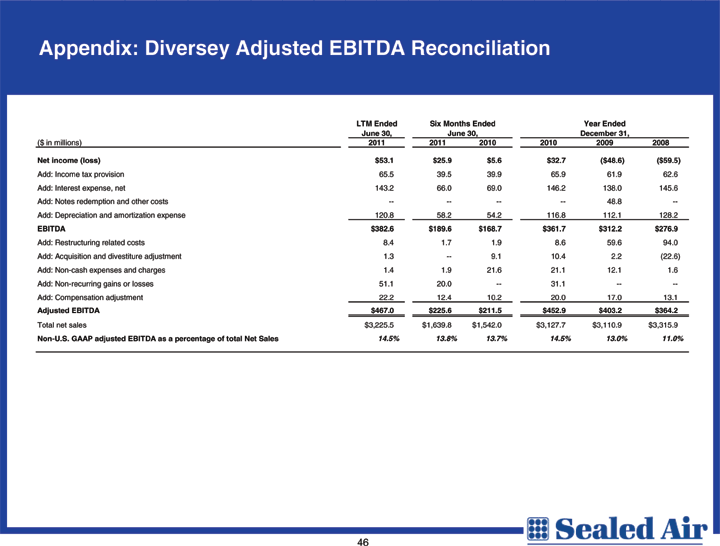
| Appendix: Diversey Adjusted EBITDA Reconciliation LTM Ended Six Months Ended Year Ended June 30, June 30, December 31, ($ in millions) 2011 2011 2010 2010 2009 2008 Net income (loss) $53.1 $25.9 $5.6 $32.7 ($48.6) ($59.5) Add: Income tax provision 65.5 39.5 39.9 65.9 61.9 62.6 Add: Interest expense, net 143.2 66.0 69.0 146.2 138.0 145.6 Add: Notes redemption and other costs — — — — 48.8 —Add: Depreciation and amortization expense 120.8 58.2 54.2 116.8 112.1 128.2 EBITDA $382.6 $189.6 $168.7 $361.7 $312.2 $276.9 Add: Restructuring related costs 8.4 1.7 1.9 8.6 59.6 94.0 Add: Acquisition and divestiture adjustment 1.3 — 9.1 10.4 2.2 (22.6) Add: Non-cash expenses and charges 1.4 1.9 21.6 21.1 12.1 1.6 Add: Non-recurring gains or losses 51.1 20.0 — 31.1 — — Add: Compensation adjustment 22.2 12.4 10.2 20.0 17.0 13.1 Adjusted EBITDA $467.0 $225.6 $211.5 $452.9 $403.2 $364.2 Total net sales $3,225.5 $1,639.8 $1,542.0 $3,127.7 $3,110.9 $3,315.9 Non-U.S. GAAP adjusted EBITDA as a percentage of total Net Sales 14.5% 13.8% 13.7% 14.5% 13.0% 11.0% |
