Attached files
| file | filename |
|---|---|
| EX-31.2 - EX-31.2 - HYPERDYNAMICS CORP | a11-26226_1ex31d2.htm |
| EX-32.1 - EX-32.1 - HYPERDYNAMICS CORP | a11-26226_1ex32d1.htm |
| EX-31.1 - EX-31.1 - HYPERDYNAMICS CORP | a11-26226_1ex31d1.htm |
| EX-32.2 - EX-32.2 - HYPERDYNAMICS CORP | a11-26226_1ex32d2.htm |
| EX-23.2 - EX-23.2 - HYPERDYNAMICS CORP | a11-26226_1ex23d2.htm |
| EX-23.1 - EX-23.1 - HYPERDYNAMICS CORP | a11-26226_1ex23d1.htm |
| EX-21.1 - EX-21.1 - HYPERDYNAMICS CORP | a11-26226_1ex21d1.htm |
| EX-3.1.5 - EX-3.1.5 - HYPERDYNAMICS CORP | a11-26226_1ex3d1d5.htm |
UNITED STATES
SECURITIES AND EXCHANGE COMMISSION
WASHINGTON, D.C. 20549
FORM 10-K
x ANNUAL REPORT UNDER SECTION 13 OR 15(D) OF THE SECURITIES EXCHANGE ACT OF 1934
For the fiscal year ended June 30, 2011
or
o TRANSITION REPORT UNDER SECTION 13 OR 15(D) OF THE SECURITIES EXCHANGE ACT OF 1934
For the transition period from to
Commission File Number 001-32490
HYPERDYNAMICS CORPORATION
(Exact name of registrant as specified in its charter)
|
DELAWARE |
|
87-0400335 |
|
(State or other jurisdiction |
|
(IRS Employer |
|
of incorporation or organization) |
|
Identification Number) |
12012 Wickchester Lane, #475
Houston, Texas 77079
(Address of principal executive offices, including zip code)
(713) 353-9400
(Issuer’s telephone number, including area code)
Securities registered under Section 12(b) of the Exchange Act:
|
Title of Each Class |
|
Name of Each Exchange on Which Registered |
|
Common Stock, $0.001 par value |
|
NYSE |
Indicate by check mark if the registrant is a well-known seasoned issuer, as defined in Rule 405 of the Securities Act x Yes o No
Indicate by check mark if the registrant is not required to file reports pursuant to Section 13 or Section 15(d) of the Act o Yes x No
Indicate by check mark whether the registrant (1) has filed all reports required to be filed by Section 13 or 15(d) of the Securities Exchange Act during the preceding 12 months (or for such shorter period that the registrant was required to file such reports), and (2) has been subject to such filing requirements for the past 90 days. x Yes o No
Indicate by check mark whether the registrant has submitted electronically and posted on its corporate Web site, if any, every Interactive Data File required to be submitted and posted pursuant to Rule 405 of Regulation S-T (§232.405 of this chapter) during the preceding 12 months (or for such shorter period that the registrant was required to submit and post such files). o Yes o No
Indicate by check mark if disclosure of delinquent filers pursuant to Item 405 of Regulation S-K is not contained in herein, and will not be contained, to the best of the registrant’s knowledge , in definitive proxy or information statements incorporated by reference in Part III of this Form 10-K or any amendment to this Form 10-K. o
Indicate by check mark whether the registrant is a large accelerated filer, an accelerated filer, a non-accelerated filer, or a smaller reporting company.
|
Large accelerated filer o |
|
Accelerated filer x |
|
|
|
|
|
Non-accelerated filer o |
|
Smaller reporting company x |
Indicate by check mark whether the registrant is a shell company (as defined in Rule 12-b-2 of the Exchange Act) o Yes x No
As of December 31, 2010, the aggregate market value of the registrant’s common stock held by non-affiliates of the registrant was $541,813,030 based on the closing sale price as reported on the NYSE Amex. We had 156,116,692 shares of common stock outstanding on September 9, 2011.
CAUTIONARY STATEMENT ON FORWARD-LOOKING INFORMATION
This Report contains “forward-looking statements” within the meaning of Section 27 A of the Securities Act of 1933, as amended, and Section 21 E of the Securities Exchange Act of 1934, as amended. Forward-looking statements include statements concerning plans, objectives, goals, strategies, expectations, future events or performance and underlying assumptions and other statements which are other than statements of historical facts. Forward-looking statements generally can be identified by the use of forward-looking terminology such as “may,” “will,” “expect,” “plan,” “project,” “anticipate,” “estimate,” “believe,” or “think.” Forward-looking statements involve risks and uncertainties which could cause actual results or outcomes to differ materially from those expressed in the forward-looking statements. We assume no duty to update or revise our forward-looking statements based on changes in plans or expectations or otherwise.
As used herein, references to “Hyperdynamics,” “Company,” “we,” “us,” and “our” refer to Hyperdynamics Corporation and our subsidiaries.
We are an independent oil and gas exploration company founded in 1996 with large prospects in offshore Republic of Guinea (“Guinea”) in Northwest Africa. We are currently engaged in the development of our rights to a Concession offshore Guinea (approximately 9,650 square miles) (the “Concession”), of which we are the operator and hold a 77% working interest. Our participant, Dana Petroleum plc (“Dana”), which is a wholly-owned subsidiary of the Korean National Oil Corporation, holds the remaining 23% working interest in the Concession. We have conducted 2-dimensional (“2-D”) and 3-dimensional (“3-D”) seismic surveys of a portion of the Concession. We plan to drill our first well in 2011, and a second well shortly thereafter. A new deep water 3-D seismic survey will be conducted for us that is expected to begin before the end of 2011.
Offshore Guinea is a vast frontier which we believe is dramatically underexplored compared to other countries along the coast of West Africa. Our Guinea prospects are centered in a virgin basin among multiple highly prospective trends/plays, which we believe hold great resource potential. In addition, we have recently established an office in London to review new prospects to further diversify our asset base, which may include acquiring producing properties.
Our rights to the Concession derive from a Hydrocarbon Production Sharing Contract that we entered into in 2006 with Guinea and modified by amendment in March 2010 (the “PSC”). The PSC was approved by the government of Guinea through the issuance of a Presidential Decree in May 2010. We believe we have established good relations with the government of Guinea and its political leaders.
We intend to diversify away from holding only a large concentrated position in Guinea, though we expect exploration offshore Guinea will remain our core focus. We intend to retain a majority interest in our Guinea Concession, but we may bring in an additional industry participant by selling an interest provided that suitable contractual arrangements can be made and our value expectations are met. We would expect a sale of an interest to include both a payment for the interest and a commitment to fund a portion of our exploratory program in the Concession. We intend to source new opportunities in international resource exploration and to grow by exploring opportunities to acquire producing assets that generate regular cash flow and other prospective assets that we believe hold significant potential.
Our principal executive offices are located at 12012 Wickchester Lane, #475, Houston, Texas 77079, and our telephone number is (713) 353-9400.
OPERATIONS IN THE REPUBLIC OF GUINEA
Production Sharing Contract
We have been conducting exploration work related to the area off the coast of Guinea since 2002. On September 22, 2006, we, acting through our wholly owned subsidiary, SCS, entered into the PSC with Guinea. Under that agreement, we were granted certain exclusive contractual rights by Guinea to explore and exploit offshore oil and gas reserves, if any, off the coast of Guinea. We refer to the rights granted to us by Guinea as the “Concession” and to the offshore area subject to the Concession as the “Contract Area.”
2009 Memorandum of Understanding
On September 11, 2009, we entered into a Memorandum of Understanding (MOU) with Guinea in which we agreed with the government to resolve certain issues related to the PSC. The MOU required negotiation between the parties concerning the terms and conditions of the provisions in the PSC to ensure that such terms were consistent with the Guinea Petroleum Code and usually applicable international standards and practices.
Amendment No.1 to PSC
On March 25, 2010, we entered into Amendment No. 1 to the PSC (the “PSC Amendment”) with Guinea. The PSC Amendment was signed by the Guinean Minister of Mines and Geology, Mahmoud Thiam; the Guinean Minister of Finances and Economy, Kerfala Yansane, and Ray
Leonard, President and Chief Executive Officer of Hyperdynamics and SCS. The PSC Amendment was entered into pursuant to the MOU. The PSC Amendment provides that the parties to the MOU have fully complied with the terms of the MOU.
The PSC Amendment clarified that we retained a Contract Area of approximately 9,650 square miles, which is approximately equivalent to 30% of the original Contract Area under the PSC, following a December 31, 2009 relinquishment of approximately 70% of the original Contract Area. The PSC Amendment requires that we relinquish an additional 25% of the retained Contract Area by September 2013. Under the terms of the PSC Amendment, the first exploration period ended and we entered into the second exploration period on September 21, 2010. The second exploration period runs until September 2013, may be renewed to September 2016 and may be extended for one additional year to allow the completion of a well in process and for two additional years to allow the completion of the appraisal of any discovery made. Under the PSC Amendment, we are required to drill an exploration well, which is to be commenced by the year-end 2011, to a minimum depth of 2,500 meters below seabed and to drill an additional exploration well, which is to be commenced by the end of September 2016, to a minimum depth of 2,500 meters below seabed. The PSC Amendment requires the expenditure of $15 million on each of the exploration wells ($30 million in the aggregate). We were also required to acquire a minimum of 2,000 square kilometers of 3D seismic data by September 2013 with a minimum expenditure of $12 million, which we fulfilled in fiscal 2011 by the PGS 3D Seismic Contract described below. Fulfillment of work obligations exempts us from expenditure obligations, and exploration work in excess of minimum work obligations for each exploration period may be carried forward to the following exploration period.
Under the PSC Amendment, Guinea may participate in development of any discovery at a participating interest of up to 15% of costs being carried for its share. The cost of that carry is to be recovered out of 62.5% of Guinea’s share of cost and profit oil. The PSC Amendment removed the right of first refusal held by us covering the relinquished acreage under the original PSC. The PSC Amendment clarified that only those eligible expenditures, which were made following the date the PSC was signed, on September 22, 2006, are eligible for cost recovery. We are required to establish an annual training budget of $200,000 for the benefit of Guinea’s oil industry personnel, and we are also obliged to pay an annual surface tax of $2.00 per square kilometer on our retained Concession acreage. The PSC Amendment also provides that should the Guinea government note material differences between provisions of the PSC Amendment and international standards or the Petroleum Code, the parties will renegotiate the relevant articles.
Presidential Decree
In May 2010, the government of Guinea issued a Presidential Decree approving the PSC, as amended by the PSC Amendment (referred to as the “PSC”).
Assignment of Participating Interest
On December 4, 2009, we entered into a Sale and Purchase Agreement (“SPA”) with Dana for Dana to acquire a 23% participating interest in the PSC. On January 28, 2010, we closed on the transaction with Dana, and we entered into an Assignment of Participating Interest (the “Assignment”) with Dana, a Deed of Assignment and Joint Operating Agreement (“JOA”). Pursuant to the Assignment, we assigned to Dana an undivided 23% of our participating interest in the contractual interests, rights, obligations and duties under the PSC. As required by the PSC, the Deed of Assignment was delivered as the necessary notice of the Assignment to be given to the Guinean government.
As part of the obligation to bear the proportionate share of costs, the SPA required Dana to make a cash payment to us upon closing the Assignment to Dana in the amount of $ 1.7 million for Dana’s pro-rata portion of accrued expenditures associated with our marine 2D seismic data acquisition program within the Contract Area. The $1.7 million payment was received by us on February 4, 2010 and was recorded as a reduction in the carrying value of our Concession.
The JOA appoints us as the operator for purposes of conducting oil and gas exploration and production activities within the retained Contract Area. We share operating costs of joint operations with Dana in proportion to the parties’ respective participating interests (Hyperdynamics, 77% and Dana, 23%). An operating committee and voting procedures are established in the JOA whereby managerial and technical representatives of Hyperdynamics and Dana make decisions regarding joint operations, exploration and appraisal of commercial discoveries, and the disposition of commercial production. The JOA places restrictions upon the transfer of the parties’ respective participating interests in the form of a right of first purchase that is triggered by a proposed transfer or certain changes in control of us or Dana.
In May 2010, we received an administrative order from the Ministry of Mines and Geology of Guinea, referred to as an arrêté, confirming the Guinea government’s approval of the assignment of a 23% participating interest in the PSC to Dana. On May 20, 2010, we received a payment of $19.6 million in cash from Dana as payment for the assigned 23% participating interest in the contractual interests, rights, obligations and duties under the PSC. We have subsequently received payments from Dana for its proportionate share of costs.
PGS Geophysical AS, Norway
On June 11, 2010, we entered into an Agreement for the Supply of Marine Seismic Data (“3D Seismic Contract”) with PGS Geophysical AS, Norway (“PGS”). Under the terms of the 3D Seismic Contract, PGS agreed to conduct the acquisition phase of a 3,635 square kilometer 3D seismic survey of the area that is subject to our rights, or concession, to explore and exploit offshore oil and gas reserves off the coast of
Guinea. The intended purpose of the 3D seismic survey was to obtain detailed imaging of the multiple prospects which were identified from our prior 2D seismic data acquisition over the Concession.
Under the terms of the 3D Seismic Contract, PGS agreed to carry out the survey in two separate portions that commenced in August 2010. The 3D Seismic Contract was initially for $21.0 million, including mobilization and demobilization expenses. The acquisition work was completed in December 2010, with a final cost under the 3D Seismic Contract of approximately $24.7 million, including mobilization and demobilization expenses. Our share of the cost was 77% of that amount, or approximately $19.0 million.
PGS Americas, Inc.
We contracted with PGS Americas, Inc. to process the data from the 3D seismic acquisition surveys. The seismic data processing contract was for $2.5 million. The processing work was completed in June 2011. The processing costs incurred as of June 30, 2011 amount to approximately $3,489,000 with our 77% share being approximately $2,686,000 and is capitalized in unevaluated oil and gas properties.
AGR Peak Well Management Limited
We have contracted with AGR Peak Well Management Limited (“AGR”) to manage our exploration drilling project in offshore Republic of Guinea. AGR will handle well construction project management services, logistics, tendering and contracting for materials as well as overall management responsibilities for the drilling program. The drilling project management contract, entered into on November 30, 2010, was for an estimated $6.8 million, of which we expect our 77% share to be $5.2 million of that amount. The costs incurred as of June 30, 2011 amount to approximately $1,022,000 with our 77% share being approximately $787,000 and is capitalized in unevaluated oil and gas properties.
We have advanced to AGR approximately $10.7 million on a gross basis, or approximately $8.2 million for our current 77% interest, for them to purchase on our behalf long lead items such as wellhead and drilling pipe. These items will be delivered to us prior to our commencing drilling on this well, which is expected to commence in the fourth quarter of 2011. Our well management company, AGR, signed a drilling contract with Jasper Drilling Private Limited (“Jasper”) for the provision of the drill ship Jasper Explorer for drilling in our Guinea Concession. The Jasper Explorer is a modern Pelican Class self-propelled drill ship capable of operating in water depths up to 5,000 feet. Conditions to the drilling contract include satisfactory HSEQ Audits of the drill ship, acceptance of equipment, personnel, and the delivery of the drill ship ready to drill between October 1, 2011 and December 15, 2011. The duration of the contract is the time required to drill two “firm wells” offshore Guinea.
Exploration Strategies and Work to Date
Our business plan incorporates a multi-channel approach to exploring and developing our Contract Area under the PSC. We plan to continue to develop and evaluate drilling targets and complete technical work and planning with Dana to implement drilling in the fourth quarter of 2011. Additionally, on July 15, 2011, we issued an Invitation to Tender for a 3-D seismic survey covering approximately 4,000 square kilometers on our Contract Area. Acquisition of the new 3-D survey was approved by the Guinea project’s Petroleum Operations Management Committee during its recent semi-annual meeting in Conakry, Guinea. The new deep water survey will be adjacent to our Survey A, acquired as a part of our initial 3,635-square-kilometer 3-D seismic survey in 2010. The new deep water 3-D survey will allow us to study Upper Cretaceous submarine fan structures along the Transform Margin trend of Guinea in Northwest Africa. We reached a tender agreement with a Company in August 2011 and plan to finalize the related contract soon. We expect that the survey will begin before the end of 2011. The Petroleum Operations Management Committee also approved a revised budget of $95 million for 2011. The revised budget includes the previously approved drilling of two exploration wells planned for the fourth quarter, as well as the new seismic survey.
From the inception of our involvement in Guinea beginning in 2002, we, in conjunction with certain key vendors, have accomplished critical exploration work including:
· a 1,000 kilometer 2D seismic data shoot, the processing of the seismic data acquired, and the evaluation of that data and data that had been acquired in the past;
· a 4,000 kilometer 2D seismic data shoot, the processing of the seismic data acquired, and the evaluation of that data and data that had been acquired in the past;
· acquisition and geochemical analysis of core samples from the Contract Area and a satellite seeps study;
· third party interpretation and analysis of our seismic data, performed by Petroleum Geo Services (PGS);
· reconnaissance within Guinea to evaluate drilling infrastructure, support services, and the operating environment;
· a 2,800 kilometer 2D seismic data shoot, the processing of the seismic data acquired, and the evaluation of that data and data that had been acquired in the past;
· an oil seep study performed by TDI Brooks; and
· a 10,400 kilometer 2D seismic data shoot, the processing of the seismic data acquired, and the evaluation of that data.
· a 3,635 square kilometer 3-D seismic data shoot, the processing of the seismic data acquired, and the evaluation of that data.
· contracting AGR to manage our exploration drilling project to handle well construction project management services, logistics, and tendering of materials as well as overall management responsibilities for the drilling program to commence in the fourth quarter of 2011.
Political Climate and Social Responsibility in Guinea
We established in Guinea, SCS Corporation Guinea SARL (“SCSG”), as a wholly owned subsidiary of SCS. SCSG’s results are included in SCS. SCSG maintains a visible in-country presence and conducts public relations programs to educate the Guinea people and its government about the importance of their petroleum resources and our role in helping Guinea realize the benefits from exploiting these resources. As part of the public relations program, SCSG makes donations to projects which improve conditions in villages, to non-governmental organizations, to schools, and to religious organizations in order to support these efforts as well as to cultivate positive public sentiment towards Hyperdynamics in Guinea. Guinea is an emerging democracy, and it has unique social, political, and economic challenges. Public opinion strongly influences the political decision-making process. Therefore, our public relations and social programs support a strategy to maintain a corporate image for us in Guinea.
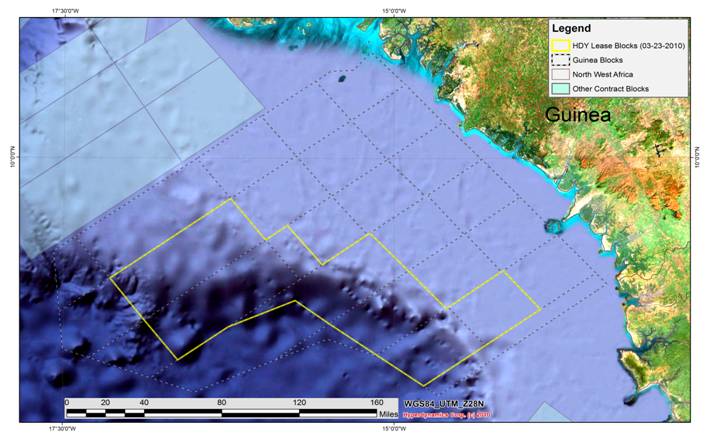
DESCRIPTION OF OIL AND GAS PROPERTIES
The Contract Area for the Concession is represented on the below map and consists of an area of approximately 9,650 square miles.
Sale of Oil and Gas Properties in 2009
In April 2009, we entered into a transaction to sell our oil and gas operations located in the United States, which consisted of working interests in several oil and gas properties in Northeast Louisiana. Due to the structure of the agreement, the transaction was accounted for as three separate sales. The first two sales were completed in May 2009, and included the sale of all of our working interests associated with proved
reserves. The third sale was completed in August 2009. We accounted for this as a discontinued operation. As a result of the sale of our oil and gas operations in the United States, at June 30, 2010 and 2011, we did not have, nor do we currently have, any proved reserves or producing properties or source of operating revenue and there is no assurance of when we will, if ever.
Reserves Reported To Other Agencies
We have not reported any estimates of proved or probable net oil or gas reserves to any federal authority or agency since July 1, 2008.
Production
The following table shows our annual sales volume, average sales prices per barrel of oil, and average production costs per barrel of oil for our last three fiscal years. Production costs are costs incurred to operate and maintain our wells and related equipment. Production costs include cost of labor, well service and repair, location maintenance, power and fuel, property taxes, and severance taxes.
As a result of the 2009 sale of our oil and gas operations located in the United States, we currently have no producing properties.
|
|
|
2011 |
|
2010 |
|
2009 |
| |||
|
United States |
|
|
|
|
|
|
| |||
|
Barrels of oil sold |
|
|
|
|
|
|
| |||
|
Gross |
|
— |
|
— |
|
55,446 |
| |||
|
Net |
|
— |
|
— |
|
34,770 |
| |||
|
Sales price per barrel |
|
$ |
— |
|
$ |
— |
|
$ |
68.94 |
|
|
|
|
|
|
|
|
|
| |||
|
Production cost per barrel |
|
$ |
— |
|
$ |
— |
|
$ |
38.28 |
|
Delivery Commitments
We currently have no existing contracts or agreements obligating us to provide a fixed or determinable quantity of oil or gas in the future.
Employees and Independent Contractors
As of September 9, 2011, we have 32 full time employees based in the United States, 2 full time employees in the United Kingdom and 8 full time employees in Guinea. Additionally, we use independent contractors in the United States and the United Kingdom to help manage fixed overhead expenses. No employees are represented by a union.
Competition
Many companies and individuals engage in drilling for gas and oil and there is competition for the most desirable prospects. We expect to encounter intense competition from other companies and other entities in the sale of our oil and gas. We could be competing with numerous oil and gas companies which may have financial resources significantly greater than ours.
Productive Wells and Acreage; Undeveloped Acreage
We currently do not have any productive oil or gas wells, and do not have any developed acres (i.e. acres spaced or assignable to productive wells). The following table sets forth undeveloped acreage that we held as of June 30, 2011:
|
|
|
Undeveloped Acreage (1)(2) |
| ||
|
|
|
Gross Acres |
|
Net Acres |
|
|
Foreign |
|
|
|
|
|
|
Offshore Guinea |
|
6,176,000 |
|
4,755,520 |
|
|
Total (3) |
|
6,176,000 |
|
4,755,520 |
|
(1) A gross acre is an acre in which a working interest is owned. A net acre is deemed to exist when the sum of fractional ownership working or participation interests in gross acres equals one. The number of net acres is the sum of the fractional working interests owned in gross acres expressed as whole numbers and fractions thereof. Undeveloped acreage is considered to be those leased acres on which wells have not been drilled or completed to a point that would permit the production of commercial quantities of crude oil and natural gas regardless of whether or not such acreage contains proved reserves.
(2) One square mile equals 640 acres. Our Contract Area is approximately 9,650 square miles. We have a 77% working interest in this contract area.
(3) The PSC requires that we relinquish 25% of the retained Contract Area by September 2013.
Drilling Activity
We drilled no exploratory or development wells for each of the years ended June 30, 2011, 2010, and 2009. An exploratory well is a well drilled to find and produce crude oil or natural gas in an unproved area, to find a new reservoir in a field previously found to be productive of crude oil or natural gas in another reservoir, or to extend a known reservoir. A development well is a well drilled within the proved area of a crude oil or natural gas reservoir to the depth of a stratigraphic horizon known to be productive.
Geographical Information
The following table sets out certain geographical information about our operations in Guinea:
|
|
|
June 30, |
|
June 30, |
|
June 30, |
| |||
|
|
|
2011 |
|
2010 |
|
2009 |
| |||
|
Long-lived assets related to Guinea |
|
$ |
36,716,000 |
|
$ |
339,000 |
|
$ |
7,764,000 |
|
Long-lived assets include our investment in the Concession offshore Guinea as well as fixed assets. The seismic data we have collected and our geological and geophysical work product are maintained in our offices in the United States. During the 2010 period, we sold a 23% interest in the Concession to Dana Petroleum. This sale was recognized in May 2010 and the $19.6 million proceeds received exceeded the amount of our investment in Guinea as of that date, resulting in the investment being reduced to zero, with a $2,955,000 gain being recognized. Investment in the Concession of $92,000 was incurred in June 2010 after the investment was reduced to zero in May 2010.
Cost of Compliance with Environmental Laws
Environmental laws have not materially hindered nor adversely affected our business. Capital expenditures relating to environmental control facilities have not been prohibitive to our operations. We believe we are in compliance with all applicable environmental laws.
Available Information
We are currently subject to the reporting requirements of the Securities Exchange Act of 1934, as amended (the “Exchange Act”). We file periodic reports, proxy materials and other information with the SEC. In addition, we expect to furnish stockholders with annual reports containing audited financial statements certified by our independent registered public accounting firm and interim reports containing unaudited financial information as may be necessary or desirable. We will provide without charge to each person who receives a copy of this report, upon written or oral request, a copy of any information that is incorporated by reference in this report (not including exhibits to the information that is incorporated by reference unless the exhibits are themselves specifically incorporated by reference). Such request should be directed to: Jason Davis, Secretary, Hyperdynamics Corporation, 12012 Wickchester Lane, #475, Houston, Texas 77079, voice: (713) 353-9400, fax: (713) 353-9421. Our website Internet address is www.hyperdynamics.com.
We provide free of charge on our website our annual report on Form 10-K, quarterly reports on Form 10-Q, current reports on Form 8-K, and amendments to those reports filed or furnished pursuant to Section 13(a) or 15(d) of the Exchange Act as soon as reasonably practicable.
Members of the public may read and copy any materials we file with the SEC at the SEC’s Public Reference Room at 100 F Street, NE, and Washington, DC 20549. Members of the public may obtain information on the operation of the Public Reference Room by calling the SEC at 1—800—SEC—0330. The Internet address of the Commission is www.sec.gov. That website contains reports, proxy and information statements and other information regarding issuers, like Hyperdynamics, that file electronically with the Commission. Visitors to the Commission’s website may access such information by searching the EDGAR database.
An investment in our common stock involves significant risks. Prior to making a decision about investing in common stock, and in consultation with your own financial and legal advisors, you should carefully consider, among other matters, the following risk factors. The risks and uncertainties described below are not the only ones facing us. Additional risks and uncertainties not presently known to us or that we currently consider immaterial may also inadvertently affect us. If any of the following risks occur, our business, financial condition or results of operations could be materially harmed.
Risks Relating to Our Business and the Industry in Which We Operate.
We depend on a single exploration asset.
The Concession is currently our single most important asset and constitutes all of our potential for the future generation of revenue. Our rights to the Concession are set forth in the PSC. We are required under the PSC to spud our first well no later than December 31, 2011, and to drill a minimum of one additional exploration well to a minimum depth of 2,500 meters below the seabed at a minimum cost of $15 million by September 21, 2016. The PSC has other work and additional obligations that we will need to perform to maintain compliance with the PSC. Failure to comply could subject us to risk of loss of the Concession. In addition, oil and natural gas operations in Africa may be subject to higher political and security risks than operations in the United States. Upon commencing operations at the Concession, any adverse development affecting our progress such as, but not limited to, the drilling and operational hazards described below, could result in damage to, or destruction of, any wells and producing facilities constructed on the Concession as well as damage to life. Although we may acquire producing assets to diversify our asset base, given that the Concession is currently our only major asset, any adverse development affecting it could have a material adverse effect on our financial position and results of operations.
We have no revenue producing assets, a history of losses, and negative cash flow that we expect to continue in the near term.
We have a history of losses, and our accumulated deficit at June 30, 2011 was $86.9 million. We plan to drill our first well in 2011, and a second well soon thereafter. We also expect to continue additional exploration activities, including new 3-D seismic surveys. We plan to expend considerable resources in the near term, and we expect that our negative cash flows will continue.
We have no proved reserves and our exploration program may not yield oil in commercial quantities or quality, or at all.
We have no proved reserves. We have identified leads based on seismic and geological information that indicates the potential presence of oil. However, the areas we decide to drill may not yield oil in commercial quantities or quality, or at all. Even when properly used and interpreted, 2-D and 3-D seismic data and visualization techniques are only tools used to assist geoscientists in identifying subsurface structures and hydrocarbon indicators and do not enable the interpreter to know whether hydrocarbons are, in fact, present in those structures. Accordingly, we do not know if any of our prospects will contain oil in sufficient quantities or quality to recover drilling and completion costs or to be economically viable. Even if oil is found in commercial quantities, construction costs of oil pipelines or floating production systems, as applicable, and transportation costs may prevent such leads from being economically viable. If our exploration efforts do not prove to be successful, our business, financial condition and results of operations will be materially adversely affected.
Offshore Guinea, the area of all of our exploration, appraisal and development efforts, has not yet proved to be an economically viable production area. We know of only one exploration well drilled in the area of our Concession, and that was a dry hole in 1977. Although there have been significant technological advancements in geophysical and petroleum science since 1977, and we have acquired significant 2-D and 3-D seismic data, exploration activities are subject to a high degree of risk, and there is no assurance of a commercially successful discovery or production in this region.
We do not have reserve reports for the Concession and our expectations as to oil and gas reserves are uncertain and may vary substantially from any actual production.
We do not have any reserve reports for the Concession. A reserve report is the estimated quantities of oil and gas based on reports prepared by third party reserve engineers. Reserve reporting is a subjective process of estimating underground accumulations of oil and natural gas that cannot be measured in an exact manner. Expectations as to oil and gas reserves are uncertain and may vary substantially from any actual production.
The PSC is subject to renegotiation under certain conditions, which may have an adverse impact upon our operations and profitability.
The PSC provides that should the Guinea government note material differences between provisions of the PSC and international standards or the Guinea Petroleum Code, the parties will renegotiate the relevant articles of the PSC. If the Guinea government identifies material differences between the PSC’s provisions and international standards or the Guinea Petroleum Code, there is no assurance that we will be able to negotiate an acceptable modification to the PSC. If the parties are not successful in renegotiating the relevant articles of the PSC, the parties may be required to submit the matter to international arbitration. There is no assurance that any arbitration would be successful or otherwise lead to articles that are more favorable to us than the present articles. Therefore, the results of such negotiations or arbitration could be unfavorable to us and, as a result, could have a material adverse effect on our business, financial position, results of operation and future cash flows.
We are highly dependent on our management team and consultants, and any failure to retain the services of such parties could adversely affect our ability to effectively manage our operations or successfully execute our business plan.
Our business is dependent on retaining the services of a small number of key personnel of the appropriate caliber as the business develops. Our success is, and will continue to be to a significant extent, dependent upon the expertise and experience of the directors, senior management and
certain key geoscientists, geologists, engineers and other professionals we engage. While we have entered into contractual arrangements with the aim of securing the services of the key management team, the retention of their services cannot be guaranteed. The loss of key members of our management team or other highly qualified technical professionals could adversely affect our ability to effectively manage our overall operations or successfully execute current or future business strategies. If any member of management or director were to leave our company, it may have a material adverse effect on our business, financial condition, results of operations and/or growth prospects.
Drilling wells is speculative and potentially hazardous. Actual costs may be more than our estimates, and may not result in any discoveries.
Exploring for and developing oil reserves involves a high degree of operational and financial risk, which precludes definitive statements as to the time required and costs involved in reaching certain objectives. The budgeted costs of drilling, completing and operating wells are often exceeded and can increase significantly when drilling costs rise due to a tightening in the supply of various types of oilfield equipment and related services.
Drilling may be unsuccessful for many reasons, including geological conditions, weather, cost overruns, equipment shortages and mechanical difficulties. Exploratory wells bear a much greater risk of loss than development wells. The successful drilling of an oil well may not be indicative of the potential for the development of a commercially viable field and will not necessarily result in a profit on investment. A variety of factors, both geological and market-related, can cause a well to become uneconomic or only marginally economic.
There are a variety of operating risks, including:
· blowouts, cratering and explosions;
· mechanical and equipment problems;
· uncontrolled flows of oil and gas or well fluids;
· fires;
· marine hazards with respect to offshore operations;
· formations with abnormal pressures;
· pollution and other environmental risks; and
· weather conditions and natural disasters.
Offshore operations are subject to a variety of operating risks particular to the marine environment, such as capsizing and collisions. Also, offshore operations are subject to damage or loss from adverse weather conditions. Any of these events could result in loss of human life, significant damage to property, environmental pollution, impairment of our operations and substantial losses.
Deepwater drilling generally requires more time and more advanced drilling technologies than exploration in shallower waters, involving a higher risk of equipment failure and usually higher drilling costs. In addition, there may be production risks of which we are currently unaware. If we participate in the development of new subsea infrastructure and use floating production systems to transport oil from producing wells, these operations may require substantial time for installation or encounter mechanical difficulties and equipment failures that could result in significant liabilities, cost overruns or delays. Furthermore, deepwater operations generally, and operations in West Africa in particular, lack the physical and oilfield service infrastructure present in other regions. As a result, a significant amount of time may elapse between a deepwater discovery and the marketing of the associated oil and natural gas, increasing both the financial and operational risks involved with these operations. Because of the lack and high cost of this infrastructure, further discoveries we may make in Guinea may never be economically producible.
We may not be able to meet our substantial capital requirements to conduct our operations or achieve our business plan.
Our business is capital intensive, and we must invest a significant amount in our activities. We intend to make substantial capital expenditures to find, develop and produce natural gas and oil reserves.
Additional capital could be obtained from a combination of funding sources. The current potential funding sources, and the potential adverse effects attributable thereto, include:
· offerings of equity, equity-linked and convertible debt securities, which would dilute the equity interests of our stockholders;
· sales or assignments of interests in the Concession and exploration program, which would reduce any future revenues from that program while at the same time offsetting potential expenditures;
· debt and convertible debt offerings, which would increase our leverage and add to our need for cash to service such debt and which could result in assets being pledged as collateral; and
· borrowings from financial institutions, which may subject us to certain restrictive covenants, including covenants restricting our ability to raise additional capital or pay dividends.
It is difficult to quantify the amount of financing we may need to fund our business plan in the longer term. The amount of funding we may need in the future depends on various factors such as:
· our financial position;
· the cost of exploration and drilling;
· the prevailing market price of natural gas and oil; and
· the lead time required to bring any discoveries to production.
Our ability to raise additional capital will depend on the results of operations and the status of various capital and industry markets at the time such additional capital is sought. Historically, we have been able to raise capital from equity sources to finance our activities, but there is no assurance that we will be able to do so in the future or on acceptable terms, if at all. Further, we currently have no operating revenue. While we have sufficient working capital for at least the next 12 months, additional capital will likely be required beyond this period. If we do not obtain capital resources in the future, we may not be able to meet the obligations under the PSC and thereby could be required to surrender the Concession. The Concession is our single most important asset and, although we are considering other opportunities, the loss of the Concession would significantly reduce our ability to eventually become a profit-generating company.
We also expect to continue to incur significant expenses over the next several years with our operations, including further 3-D seismic studies and exploratory drilling. We may not be able to raise or expend the capital necessary to undertake or complete future drilling programs or acquisition opportunities unless we raise additional funds through debt or equity financings, which may not be available on acceptable terms to us or at all. We may not be able to obtain debt or equity financing or enter into and complete additional strategic relationships with an industry partner to meet our capital requirements on acceptable terms, if at all. Further, our future cash flow from operations may not be sufficient for continued exploration, development or acquisition activities, and we may not be able to obtain the necessary funds from other sources.
New investors or commercial partners may require participation interests which could decrease future profitability.
Due to funding limitations or other factors, we may conduct exploration activities under agreements that provide investors or commercial partners with a participation interest in a particular property held by us. Under this type of arrangement, an investor or commercial partner would invest in specific property and receive a negotiated interest in that specific property. This could reduce the potential profitability of the remaining interest in the property and reduce our ability to control and manage the property. We expect that entering into these partnering relationships would entail transferring a portion of our interest in the Concession, or other properties that we may acquire in the future, to such partner.
We have no ability to control the prices that we may receive for oil or gas. Oil and gas prices are volatile, and a substantial or extended decline in prices could adversely affect our financial condition, liquidity, ability to obtain financing and future operating results.
We currently have no source of revenue. Our financial condition is based solely on our ability to sell equity or debt securities to investors, enter into an additional joint operating or similar strategic relationship with an industry partner, sell interests related to the Concession or borrow funds. We expect that entering into these joint operating or similar relationships would entail transferring a portion of our interest in the Concession to such partner. Such investors would consider the price of oil and gas in making an investment decision. Declines in oil and gas prices may adversely affect our financial condition, liquidity, ability to obtain financing and operating results. Low oil and gas prices also may reduce the amount of oil and gas that we could produce economically. Low oil and gas prices in the future could have a negative effect on our future financial results. Historically, oil and gas prices and markets have been volatile, with prices fluctuating widely, and they are likely to continue to be volatile. Prices for oil and gas are subject to wide fluctuations in response to relatively minor changes in supply and demand, market uncertainty and a variety of additional factors that are beyond our control. These factors include:
· the level of domestic and foreign supplies of oil;
· the level of consumer product demand;
· weather conditions and natural disasters;
· political conditions in oil producing regions throughout the world;
· the ability of the members of the Organization of Petroleum Exporting Countries to agree to and maintain oil production;
· speculation as to the future price of oil and natural gas and the speculative trading of oil and natural gas futures contracts;
· price and production controls;
· political and economic conditions, including embargoes in oil-producing countries or affecting other oil-producing activities, particularly in the Middle East, Africa, Russia and South America;
· the continued threat of terrorism and the impact of military and other action, including U.S. military operations in the Middle East;
· the level of global oil and natural gas exploration and production activity;
· the price of foreign oil imports;
· actions of governments;
· domestic and foreign governmental regulations;
· the price, availability and acceptance of alternative fuels;
· technological advances affecting energy consumption;
· global economic conditions; and
· the value of the U.S. dollar, the Euro and fluctuations in exchange rates generally.
These factors and the volatile nature of the energy markets make it impossible to predict oil and gas prices. Our inability to respond appropriately to changes in these factors could have a material adverse effect on our business plan, financial position, results of operations and future cash flows.
The unavailability or high cost of drilling rigs, equipment, supplies, personnel and oilfield services, as well as gathering systems and processing facilities, and our dependence on industry contractors generally, could adversely impact us.
We are dependent on industry contractors for the success of our oil and gas exploration projects. In particular, our drilling activity offshore of Guinea will require that we have access to offshore drilling rigs and contracts with experienced operators of such rigs. The availability and cost of drilling rigs and other equipment and services, and the skilled personnel required to operate those rigs and equipment is affected by the level and location of drilling activity around the world. An increase in drilling operations worldwide may reduce the availability and increase the cost to us of drilling rigs, other equipment and services, and appropriately experienced drilling contractors. The reduced availability of such equipment and services may delay our ability to discover reserves and higher costs for such equipment and services may increase our costs, both of which may have a material adverse effect on our business, results of operations and future cash flow. If we succeed in constructing oil wells, we may be required to shut them because access to pipelines, gathering systems or processing facilities may be limited or unavailable. If that were to occur, we would be unable to realize revenue from those wells until arrangements were made to deliver the production to market, which could cause a material adverse effect on our results of operations and financial condition.
We are exposed to the failure or non-performance of commercial counterparties.
Our operations will be dependent on certain third parties with whom we have commercial agreements (such as drilling project management contractors, drilling contractors and the parties responsible for transporting and/or storing our production) for our future exploration, development, production, sales or other activities. The efficiency, timeliness and quality of contract performance by third party providers are largely beyond our direct control. If one or more of these third parties fails to meet its contractual obligations to us, or if such services are temporarily or permanently unavailable (for example, as a result of technical problems or industrial action), or not available on commercially acceptable terms, we may experience a material adverse effect on our business, results of operations, financial condition and future cash flow. In addition, as a named party under the PSC, we could be held liable for the environmental, health and safety impacts arising out of the
activities of our drilling project management contractor or any other third party service provider contracted by us or on our behalf, which could have a material adverse effect on our business, results of operations and future cash flow.
Participants in the oil and gas industry are subject to numerous laws that can affect the cost, manner or feasibility of doing business.
Exploration and production activities in the oil and gas industry are subject to local laws and regulations. We may be required to make large expenditures to comply with governmental laws and regulations, particularly in respect of the following matters:
· licenses for drilling operations;
· tax increases, including retroactive claims;
· unitization of oil accumulations;
· local content requirements (including the mandatory use of local partners and vendors); and
· environmental requirements and obligations, including investigation and/or remediation activities.
Under these and other laws and regulations, we could be liable for personal injuries, property damage and other types of damages. Failure to comply with these laws and regulations also may result in the suspension or termination of our operations and subject us to administrative, civil and criminal penalties. Moreover, new laws and regulations may be enacted, and current laws and regulations could change or their interpretations could change, in ways that could substantially increase our costs. These risks may be higher in the developing countries in which we conduct our operations, where there could be a lack of clarity or lack of consistency in the application of these laws and regulations. Any resulting liabilities, penalties, suspensions or terminations could have a material adverse effect on our financial condition and results of operations.
Furthermore, the explosion and sinking in April 2010 of the Deepwater Horizon oil rig during operations on the Macondo exploration well in the Gulf of Mexico, and the resulting oil spill, may have increased certain of the risks faced by those drilling for oil in deepwater regions, including increased industry standards, governmental regulation and enforcement, and less favorable investor perception of the risk-adjusted benefits of deepwater offshore drilling.
The occurrence of any of these factors, or the continuation thereof, could have a material adverse effect on our business, financial position or future results of operations.
We may not be able to commercialize our interests in any natural gas produced from our Guinea Concession
The development of the market for natural gas in West Africa is in its early stages. Currently there is no infrastructure to transport and process natural gas on commercial terms in Guinea, and the expenses associated with constructing such infrastructure ourselves may not be commercially viable given local prices currently paid for natural gas. We will not receive any payment for this quantity of natural gas. Accordingly, there may be limited or no value derived from any natural gas produced from our Guinea Concession.
Our insurance coverage may be insufficient to cover losses, or we could be subject to uninsured liabilities which could materially affect our business, results of operations or financial condition.
There are circumstances where insurance will not cover the consequences of an event, or where we may become liable for costs incurred in events or incidents against which we either cannot insure or may elect not to have insured (whether on account of prohibitive premium costs or for other commercial reasons). Further, insurance covering certain matters (such as sovereign risk, terrorism and many environmental risks) may not be available to us. Moreover, we may be subject to large excess payments in the event a third party has a valid claim against us, and therefore may not be entitled to recover the full extent of our loss, or may decide that it is not economical to seek to do so. The realization of any significant liabilities in connection with our future activities could have a material adverse effect on our business, results of operations, financial condition and future cash flow.
There are risks associated with the drilling of oil and natural gas wells which could significantly reduce our revenues or cause substantial losses, impairing our future operating results. We may become subject to liability for pollution, blow-outs or other hazards, including those arising out of the activities of our third-party contractors. We intend to obtain insurance with respect to certain of these hazards, but such insurance likely will have limitations that may prevent us from recovering the full extent of such liabilities. The payment by us of such liabilities could reduce the funds available to us or could, in an extreme case, result in a total loss of our properties and assets. Moreover, oil and natural gas production operations are also subject to all the risks typically associated with such operations, including premature decline of reservoirs and the invasion of water into producing formations.
We have competition from other companies that have larger financial and other resources than we do, which puts us at a competitive disadvantage.
A large number of companies and individuals engage in drilling for gas and oil, and there is competition for the most desirable prospects. We are likely to face competition from international oil and gas companies, which already may have significant operations in a region, together with potential new entrants into such markets, any of which may have greater financial, technological and other resources than us. There is a high degree of competition for the discovery and acquisition of properties considered to have a commercial potential. We compete with other companies for the acquisition of oil and gas interests, as well as for the recruitment and retention of qualified employees and other personnel.
There can be no assurance that we will be able to continue to compete effectively with other existing oil and gas companies, or any new entrants to the industry. Any failure by us to compete effectively could have a material adverse effect on our business, results of operations, financial condition and future cash flow.
We may incur a variety of costs to engage in future acquisitions, and the anticipated benefits of those acquisitions may never be realized.
As a part of our business strategy, we may make acquisitions of, or significant investments in, other assets, particularly those that would allow us to produce oil and natural gas and generate revenue to fund our exploration activities, although no acquisitions or investments are currently pending. Any future acquisitions would be accompanied by risks such as:
· diversion of our management’s attention from ongoing business concerns;
· our potential inability to maximize our financial and strategic position through the successful development of the asset or assets acquired;
· impairment of our relationship with our existing employees if we cannot hire employees to staff any new operations and our existing employees are required to staff both old and new operations; and
· maintenance of uniform standards, controls, procedures and policies.
We cannot guarantee that we will be able to successfully integrate any business, products, technologies or personnel that we might acquire in the future, and our failure to do so could harm our business.
Risks Relating to Operating in Guinea
Geopolitical instability where we operate subjects us to political, economic and other uncertainties.
We conduct business in Guinea, which is in a region of the world where there have been recent civil wars, revolutions, coup d’etats and internecine conflicts. There is the risk of political violence and increased social tension in Guinea as a result of the past political upheaval, and there is a risk of civil unrest, crime and labor unrest at times. For example, in September 2009, the military government intervened to stop pro-democracy rallies, resulting in a number of civilian deaths and casualties. This led to the African Union, United States and European Union imposing sanctions upon the former government. A successful mediation organized by the international community (African Union, United States and European Union) between the opposition and the military junta resulted in the appointment of a Prime Minister of Guinea from the opposition. In 2010 democratic elections were held, and a president was elected and inaugurated. While these developments indicate that the political situation in Guinea is improving, external or internal political forces potentially could create a political or military climate that might cause a change in political leadership, the outbreak of hostilities, or civil unrest. Such uncertainties could result in our having to cease our Guinea operations and result in the loss or delay of our rights under the PSC.
Further, we face political and economic risks and other uncertainties with respect to our operations, which may include, among other things:
· loss of future revenue, property and equipment, as a result of hazards such as expropriation, war, acts of terrorism, insurrection and other political risks;
· increases in taxes and governmental royalties;
· unilateral renegotiation or cancellation of contracts by governmental entities;
· difficulties enforcing our rights against a governmental agency because of the doctrine of sovereign immunity and foreign sovereignty over international operations;
· changes in laws and policies governing operations of foreign-based companies; and
· currency restrictions and exchange rate fluctuations.
Our operations in Guinea also may be adversely affected by laws and policies of the United States affecting foreign trade and taxation. Realization of any of these factors could have a material adverse effect on our business, financial condition, results of operations and/or growth prospects.
Guinea’s political uncertainties could adversely affect our rights under the Concession or obligations under the PSC.
Guinea has faced and continues to face political, economic and social uncertainties which are beyond our control. Maintaining a good working relationship with the Guinea government is important because the Concession is granted under the terms of the PSC, with the Guinea government. In June 2010, a democratic election was held that identified two main candidates for a run-off election that was held on November 7, 2010. On December 21, 2010, President Alpha Conde was inaugurated. The newly-elected government has replaced the transitional government. Although we believe that our management has a positive working relationship with the new Guinea government, we cannot predict future political events and changing relationships. Political instability, substantial changes in government laws, policies or officials, and attitudes of officials toward us could have a material adverse effect on our business, financial position, results of operations and future cash flow.
We operate in Guinea, a country where corrupt behavior exists that could impair our ability to do business in the future or result in significant fines or penalties.
We operate in Guinea, a country where governmental corruption has been known to exist. There is a risk of violating either the US Foreign Corrupt Practices Act, laws or legislation promulgated pursuant to the 1997 OECD Convention on Combating Bribery of Foreign Public Officials in International Business Transactions or other applicable anti-corruption regulations that generally prohibit the making of improper payments to foreign officials for the purpose of obtaining or keeping business. In addition, the future success of our Guinea operations may be adversely affected by risks associated with international activities, including economic and labor conditions, political instability, risk of war, expropriation, terrorism, renegotiation or modification of existing contracts, tax laws and changes in exchange rates.
We are subject to governmental regulations, the cost of compliance with which may have an adverse effect on our financial condition, results of operations and future cash flow.
Oil and gas operations in Guinea will be subject to government regulation and to interruption or termination by governmental authorities on account of ecological and other considerations. It is impossible to predict future government proposals that might be enacted into law, future interpretation of existing laws or future amendments to the Guinea Petroleum Code or any other laws, or the effect those new or amended laws or changes in interpretation of existing laws might have on us. Restrictions on oil and gas activities, such as production restrictions, price controls, tax increases and pollution and environmental controls may have a material adverse effect on our financial condition, results of operations and future cash flows.
Political, social and economic conditions in Guinea may adversely affect our business, results of operation, financial condition and future cash flow.
As all of our potential revenue generating assets are currently located in Guinea, our operations are dependant on the economic and political conditions prevailing in Guinea. Accordingly, we are subject to the risks associated with conducting business in and with a foreign country, including the risks of changes in the country’s laws and policies (including those relating to taxation, royalties, acquisitions, disposals, imports and exports, currency, environmental protection, management of natural resources, exploration and development of mines, labor and safety standards, and historical and cultural preservation). The costs associated with compliance with these laws and regulations are substantial, and possible future laws and regulations as well as changes to existing laws and regulations could impose additional costs on us, require us to incur additional capital expenditures and/or impose restrictions on or suspensions of our operations and delays in the development of our assets.
Further, these laws and regulations may allow government authorities and private parties to bring legal claims based on damages to property and injury to persons resulting from the environmental, health and safety impacts of our past and current operations and could lead to the imposition of substantial fines, penalties or other civil or criminal sanctions. If material, these compliance costs, claims or fines could have a material adverse effect on our business, results of operations, financial condition and/or growth prospects.
In addition, Guinea has high levels of unemployment, poverty and crime. These problems have, in part, hindered investments in Guinea, prompted emigration of skilled workers and affected economic growth negatively. While it is difficult to predict the effect of these problems on businesses operating in Guinea or the Guinea government’s efforts to solve them, these problems, or the solutions proposed, could have a material adverse effect on our business, results of operations, financial condition and/or growth prospects.
The legal and judicial system in Guinea is relatively undeveloped and subject to frequent changes, and we may be exposed to similar risks if we operate in certain other jurisdictions.
Guinea has a less developed legal and judicial system than more established economies which could result in risks such as: (i) effective legal redress in the courts of such jurisdictions, whether in respect of a breach of contract, law or regulation, or in an ownership dispute, being more difficult to obtain; (ii) a higher degree of discretion on the part of Governmental authorities who may be susceptible to corruption; (iii) the lack of judicial or administrative guidance on interpreting applicable rules and regulations; (iv) inconsistencies or conflicts between and within various laws, regulations, decrees, orders and resolutions; or (v) relative inexperience of the judiciary and courts in such matters. In Guinea and certain other jurisdictions, the commitment of local business people, government officials and agencies and the judicial system to abide by legal requirements and negotiated agreements may be more uncertain, creating particular concerns with respect to the Concession or other licenses, permits or approvals required by us for the operation of our business, which may be susceptible to revision or cancellation, and legal redress may be uncertain or delayed. There can be no assurance that joint ventures, licenses, license applications or other legal arrangements will not be adversely affected by the actions of government authorities or others, and the effectiveness of and enforcement of such arrangements in these jurisdictions cannot be assured.
Risks Relating to Our Common Stock
The price of our common stock historically has been volatile. This volatility may affect the price at which you could sell your common stock, and the sale of substantial amounts of our common stock could adversely affect the price of our common stock.
The closing price for our common stock has varied between a high of $7.40 on January 13, 2011 and a low of $0.99 on July 23, 2010 in the fiscal year ended on June 30, 2011. This volatility may affect the price at which an investor could sell the common stock, and the sale of substantial amounts of our common stock could adversely affect the price of our common stock. Our stock price is likely to continue to be volatile and subject to significant price and volume fluctuations in response to market and other factors, including the other factors discussed in “— Risks Relating to Our Business and the Industry in Which We Operate”; variations in our quarterly operating results from our expectations or those of securities analysts or investors; downward revisions in securities analysts’ estimates; and announcement by us or our competitors of significant acquisitions, strategic partnerships, joint ventures or capital commitments.
We may issue additional shares of common stock in the future, which could adversely affect the market price of our shares and cause dilution to existing stockholders.
We may issue additional shares of our common stock in the future which could adversely affect the market price of our shares. Significant sales of shares of our common stock by major stockholders, or the public perception that an offering or sale may occur also could have an adverse effect on the market price of shares of our common stock. Issuance of additional shares of common stock will dilute the percentage ownership interest of the existing stockholders, and may dilute the book value per share of our shares of common stock held by existing stockholders.
Sales of substantial amounts of shares of our common stock in the public market could harm the market price of the shares of common stock.
The sale of substantial amounts of shares of our common stock (including shares issuable upon exercise of outstanding options and warrants to purchase shares) may cause substantial fluctuations in the price of shares of our common stock. Because investors may be more reluctant to purchase shares of our common stock following substantial sales or issuances, the sale of shares in an offering could impair our ability to raise capital in the near term.
We have identified material weaknesses in our internal controls for the year ended June 30, 2011, and if we fail to adequately remediate, we may be unable to accurately report our financial results in the future and the market price of our shares may be adversely affected.
We and our independent registered public accounting firm, in connection with the audit of our internal control over financial reporting, for the fiscal year ended June 30, 2011, have identified certain control deficiencies resulting from the lack of effective detective and monitoring controls being designed within internal control over financial reporting. Such deficiencies related to oversight and review of information as prepared or received from external service providers covering marketable securities, income taxes and equity awards and over the presentation of the financial statements and the application of certain accounting principles. In addition, we identified certain control deficiencies in our general computer control environment, resulting from the lack of effective controls around the areas of approval and review of information technology changes and system security, including the enforcement of segregation of duties and appropriate user access restrictions. We plan to take measures to remedy these weaknesses. A failure to address any control deficiency could result in inaccuracies in our financial statements and could also impair our ability to comply with applicable financial reporting requirements. As a result, our business and the market price of our shares may be adversely affected.
Delaware law and our charter documents may impede or discourage a takeover, which could adversely impact the market price of our shares.
We are a Delaware corporation, and the anti-takeover provisions of Delaware law impose various impediments to the ability of a third party to acquire control of us, even if a change in control would be beneficial to our existing stockholders. Certain provisions of Delaware law and our certificate of incorporation and bylaws could impede a merger, takeover or other business combination involving us or discourage a potential acquirer from making a tender offer for our common stock, which, under certain circumstances, could reduce the market price of our common stock.
Item 1B. Unresolved Staff Comments
None.
Information on Oil and Gas Properties is included in Item 1. Business above in this Annual Report on Form 10-K.
Our executive and administrative offices are located at 12012 Wickchester Lane, Suite 475, Houston, Texas 77079 where we lease 14,673 square feet of space pursuant to a lease agreement with a 60 month term.
The lease agreement is for 60 months beginning on March 1, 2010, the date we took possession of the property. We are obligated to make the following base rental payments: (i) $0.00 per month during months 1 — 9; (ii) $17,472 per month during months 10 — 12; (iii) $17,957 per month during months 13 — 24; (iv) $19,413 per month during months 25 — 36; (v) $21,354 per month during months 37 — 48; and (vi) $24,266 per month during months 49 — 60.
During the fourth quarter of fiscal 2011, the lease was amended to include additional square footage. Under the amended lease agreement, we are obligated to make the following additional rental payments: (i) $4,537.50 per month from the date the expansion is complete through January 31, 2012; (ii) $4,663.54 per month from February 1, 2012 through January 31, 2013; (iii) $4,789.58 per month from February 1, 2013 through January 31, 2014; and (iv) $4,915.63 per month from February 1, 2015 through January 31, 2016. We expect to complete the expansion and begin making lease payments during the first quarter of fiscal 2012.
In addition to the base rent, we are also responsible for the pro-rata share (10.664%) of excess operating expenses in connection with the property. We also paid a security deposit of $50,000 at the time of execution of the lease agreement of which $35,000 is expected to be refunded at the end of February 2012, subject to certain conditions.
From time to time, we and our subsidiaries are involved in business disputes. We are unable to predict the outcome of such matters when they arise. Currently pending proceedings, in our opinion, will not have a material adverse effect upon our consolidated financial statements.
Item 4. Submission of Matters to a Vote of Securities Holders
None.
Item 5. Market for Registrant’s Common Equity, Related Shareholder Matters and Issuer Purchases of Equity Securities
Price Range of Common Stock
Shares of our common stock, for the periods presented below, were traded on the NYSE Amex (formerly known as the American Stock Exchange). The following table sets forth the quarterly high and low sales prices per share for our common stock, as reported by the NYSE Amex. Our common stock began trading on the NYSE on July 11, 2011 under our same ticker symbol, “HDY.”
|
|
|
High |
|
Low |
| ||
|
Fiscal 2011: |
|
|
|
|
| ||
|
Fourth Quarter |
|
$ |
4.75 |
|
$ |
3.18 |
|
|
Third Quarter |
|
7.40 |
|
3.91 |
| ||
|
Second Quarter |
|
5.21 |
|
2.26 |
| ||
|
First Quarter |
|
2.49 |
|
0.99 |
| ||
|
|
|
|
|
|
| ||
|
Fiscal 2010: |
|
|
|
|
| ||
|
Fourth Quarter |
|
$ |
1.65 |
|
$ |
0.92 |
|
|
Third Quarter |
|
1.42 |
|
0.65 |
| ||
|
Second Quarter |
|
1.85 |
|
0.79 |
| ||
|
First Quarter |
|
1.92 |
|
0.38 |
| ||
On September 9, 2011, the last price for our common stock as reported by the NYSE was 4.23 per share and there were approximately 191 stockholders of record of the common stock.
Dividends
We have not paid, and we do not currently intend to pay in the foreseeable future, cash dividends on our common stock. The current policy of our Board of Directors is to retain all earnings, if any, to provide funds for operation and expansion of our business. The declaration of dividends, if any, will be subject to the discretion of the Board of Directors, which may consider such factors as our results of operations, financial condition, capital needs and acquisition strategy, among others.
Equity Compensation Plan Information
The following table gives aggregate information under all equity compensation plans of Hyperdynamics as of June 30, 2011.
Equity Compensation Plan Information
|
|
|
Number of Securities |
|
Weighted-Average |
|
Number of Securities |
| |
|
Plan Category |
|
A |
|
B |
|
C |
| |
|
Equity compensation plans approved by security holders |
|
9,274,854 |
|
$ |
1.85 |
|
1,069,480 |
|
|
Equity compensation plans not approved by security holders |
|
N/A |
|
N/A |
|
N/A |
| |
|
Total |
|
9,274,854 |
|
$ |
1.85 |
|
1,069,480 |
|
The Stock and Stock Option Plan (the “1997 Plan”) of Hyperdynamics was adopted May 7, 1997 and amended on December 3, 2001, on January 21, 2005, and on February 20, 2008. The total number of shares authorized under the Plan, as amended, was 14,000,000. The Board terminated the 1997 Plan effective upon approval of the 2010 Plan by our stockholders as discussed below.
Our 2008 Restricted Stock Award Plan (the “2008 Plan”) was adopted on February 20, 2008. The total number of shares authorized under the 2008 Plan was 3,000,000. The Board terminated the 2008 Plan effective upon approval of the 2010 Plan by our stockholders as discussed below.
On February 18, 2010, at our annual meeting of stockholders, the stockholders approved the 2010 Equity Incentive Plan (the “2010 Plan”). In conjunction with the approval of the 2010 Plan at the annual meeting, the 1997 Plan and 2008 Plan were terminated as of February 18, 2010.
The 2010 Plan provides for the grants of shares of common stock, restricted stock units or incentive stock options and/or nonqualified stock options to purchase our common stock to selected employees, directors, officers, agents, consultants, attorneys, vendors and advisors. Shares of common stock, options, or restricted stock can only be granted under this plan within 10 years from the effective date of February 18, 2010. A maximum of 5,000,000 shares are issuable under the 2010 Plan.
The 2010 Plan provides a means to attract and retain the services of participants and also to provide added incentive to such persons by encouraging stock ownership in us. Plan grants are administered by the Compensation Committee, which has substantial discretion to determine which persons, amounts, time, price, exercise terms and restrictions, if any.
The following table provides a reconciliation of the securities remaining available for issuance as of June 30, 2011 under the 2010 Plan:
|
|
|
2010 Plan |
|
|
Shares available for issuance, June 30, 2010 |
|
3,851,000 |
|
|
Stock options granted |
|
(2,906,520 |
) |
|
Previously issued shares cancelled or expired |
|
125,000 |
|
|
Shares available for issuance, June 30, 2011 |
|
1,069,480 |
|
The purpose of the Plan is to further our interest, and the interest of our subsidiaries and our stockholders by providing incentives in the form of stock or stock options to key employees, consultants, directors, and vendors who contribute materially to our success and profitability. We believe that our future success will depend in part on our continued ability to attract and retain highly qualified personnel as employees, independent consultants, and directors. The issuance of stock and grants of options will recognize and reward outstanding individual performances and contributions and will give such persons a proprietary interest in us, thus enhancing their personal interest in our continued success and progress. We pay wages, salaries, and consulting rates that we believe are competitive. We use the 2010 Plan to augment our compensation packages.
Item 6. Selected Financial Data
|
(In thousands, except earnings per |
|
Year ended June 30, |
| |||||||||||||
|
share data) |
|
2011 |
|
2010 |
|
2009 |
|
2008 |
|
2007 |
| |||||
|
Revenue |
|
$ |
— |
|
$ |
— |
|
$ |
— |
|
$ |
— |
|
$ |
— |
|
|
Loss from operations |
|
$ |
(10,869 |
) |
$ |
(8,048 |
) |
$ |
(6,083 |
) |
$ |
(7,971 |
) |
$ |
(10,233 |
) |
|
Net loss |
|
$ |
(11,238 |
) |
$ |
(8,009 |
) |
$ |
(8,883 |
) |
$ |
(9,505 |
) |
$ |
(23,199 |
) |
|
Basic income (loss) per common share |
|
$ |
(0.09 |
) |
$ |
(0.09 |
) |
$ |
(0.15 |
) |
$ |
(0.17 |
) |
$ |
(0.49 |
) |
|
Diluted income (loss) per common share |
|
$ |
(0.09 |
) |
$ |
(0.09 |
) |
$ |
(0.15 |
) |
$ |
(0.17 |
) |
$ |
(0.49 |
) |
|
Weighted Average Shares Outstanding |
|
125,998 |
|
85,914 |
|
61,845 |
|
56,331 |
|
47,723 |
| |||||
|
|
|
|
|
|
|
|
|
|
|
|
| |||||
|
Cash |
|
$ |
79,889 |
|
$ |
26,040 |
|
$ |
1,360 |
|
$ |
1,480 |
|
$ |
618 |
|
|
Oil and Gas Properties |
|
$ |
36,200 |
|
$ |
92 |
|
$ |
7,663 |
|
$ |
7,314 |
|
$ |
4,279 |
|
|
Total Assets |
|
$ |
192,683 |
|
$ |
27,220 |
|
$ |
9,440 |
|
$ |
12,950 |
|
$ |
11,480 |
|
|
Long-Term Liabilities |
|
$ |
138 |
|
$ |
653 |
|
$ |
1,735 |
|
$ |
2,019 |
|
$ |
133 |
|
|
Shareholder’s Equity |
|
$ |
189,429 |
|
$ |
21,526 |
|
$ |
4,254 |
|
$ |
6,673 |
|
$ |
8,726 |
|
Item 7. Management’s Discussion and Analysis of Financial Condition and Results of Operations
Overview
Our corporate mission is to provide energy for the future by exploring for, developing new, and re-establishing pre-existing sources of energy worldwide. We are currently exploring for oil and gas offshore Guinea, Northwest Africa. We intend to continue acquiring, exploring and developing oil and gas properties on a global basis. At this time, we have no source of operating revenue and there is no assurance when we will, if ever. We have no operating cash flows and require substantial additional funds, through additional participants, securities offerings, or through other means, to fulfill our long-term business plans.
Our operating plan within the next 12 months includes the following:
· Drilling and evaluating the data from two exploratory wells in our Concession offshore Guinea in the fourth quarter of 2011 after completing technical work and planning with Dana. If we add other PSC participants, we would expect to include the assignment of a portion of our interest in the Concession to such participants.
· Acquire, process, and interpret a new 3-D seismic survey covering approximately 4,000 square kilometers on our Contract Area. The new deep water survey will be adjacent to our Survey A, where we acquired our initial 3,635-square-kilometer 3-D seismic survey in 2010. The new deep water 3-D survey will allow us to study Upper Cretaceous submarine fan structures along the Transform Margin trend of Guinea in Northwest Africa. We reached a tender agreement with a company regarding this contract in August 2011 and plan to finalize the contract soon. We expect that the survey will begin before the end of 2011.
Assignment of Participating Interest
On December 4, 2009, we entered into a Sale and Purchase Agreement (“SPA”) with Dana for Dana to acquire a 23% participation interest in the PSC. On January 28, 2010, we closed on the transaction with Dana, and we entered into an Assignment of Participating Interest (the “Assignment”) with Dana, a Deed of Assignment and Joint Operating Agreement (JOA). Pursuant to the Assignment, we assigned to Dana an undivided 23% of our participating interest in the contractual interests, rights, obligations and duties under the PSC. As required by the PSC, the Deed of Assignment was delivered as the necessary notice of the Assignment to be given to the Guinean government.
The JOA appoints us as the operator for purposes of conducting oil and gas exploration and production activities within the retained Contract Area. We share operating costs of joint operations with Dana in proportion to the parties’ respective participating interests (Hyperdynamics, 77%; Dana, 23%). An operating committee and voting procedures are established in the JOA whereby managerial and technical representatives of Hyperdynamics and Dana make decisions regarding joint operations, exploration and appraisal of commercial discoveries, and the disposition of commercial production. The JOA places restrictions upon the transfer of the parties’ respective participating interests in the form of a right of first purchase that is triggered by a proposed transfer or certain changes in control of us or Dana.
As part of the obligation to bear the proportionate share of costs, the SPA required Dana to make a cash payment to us upon closing the assignment of the 23% participating interest to Dana in the amount of $ 1.7 million for Dana’s pro-rata portion of accrued expenditures associated with our marine 2D seismic data acquisition program within the Contract Area. The $1.7 million payment was received by us on February 4, 2010 and was recorded as a reduction in the carrying value of our Concession.
In May 2010, we received an administrative order from the Ministry of Mines and Geology of Guinea, referred to as an arrêté, confirming the Guinea government’s approval of the assignment of a 23% participating interest in the PSC to Dana. On May 20, 2010, we received a payment of $19.6 million in cash from Dana, which was recorded as a reduction in the carrying value of our Guinea Concession, as payment for the assigned 23% participating interest in the contractual interests, rights, obligations and duties under the PSC.
Sources of financing during the year ended June 30, 2011
On November 3, 2010, we entered into a Stock Purchase Agreement with two institutional funds under management of affiliates of BlackRock (collectively, the “Investors”) pursuant to which the Investors agreed to purchase an aggregate of 15,000,000 shares of our common stock at a purchase price of $2.00 per share in a private placement. At closing, we received approximately $29.9 million, net of offering costs.
On March 25, 2011, we entered into an underwriting agreement providing for the offer and sale in a firm commitment underwritten offering of 25,000,000 shares of our common stock at a price to the public of $5.00 per share ($4.75 per share net of underwriting discount but before deducting transaction expenses). In addition, we granted to the Underwriter a 45-day option to purchase up to 3,750,000 additional shares of common stock from us at the offering price, less underwriting discounts and commissions. On March 25, 2011, the Underwriter exercised its option with respect to all 3,750,000 shares.
Closing of the sale of the shares of common stock, including the 3,750,000 shares purchased pursuant to exercise of the option by the Underwriter, was held on March 30, 2011. The Company received net proceeds, after underwriting discounts and commissions, and other transaction expenses, of approximately $136.1 million.
During fiscal 2011, 858,613 options were exercised for total gross proceeds of $905,481. The options were exercised at prices ranging from $0.24 to $2.00.
During fiscal 2011, 6,164,213 warrants were exercised for total gross proceeds of $7,709,290. The warrants were exercised at prices ranging from $0.98 to $1.58.
Analysis of changes in financial position
Our current assets increased by $110,421,000, from $26,395,000 on June 30, 2010 to $136,816,000 on June 30, 2011. The increase in current assets is due to the sources of financing described above, which lead to an increase in our cash account from $26,040,000 at June 30, 2010, to
$79,889,000 at June 30, 2011, and an increase in short term investments to $55,368,000 at June 30, 2011. We held no investments at June 30, 2010.
Our long-term assets increased $55,042,000, from $825,000 on June 30, 2010, to $55,867,000 on June 30, 2011. This increase was primarily due to our 3D seismic acquisition and processing and expenditures for long lead items necessary to prepare for drilling our first well. Additionally, the increase can be attributed to an increase in long term restricted cash to $18,300,000 at June 30, 2011 as compared to no long-term restricted cash at June 30, 2010. Upon receipt of the $19.6 million from Dana in May 2010, we reduced our investment in unevaluated oil and gas properties in Guinea to zero, with the remainder of the proceeds being recorded as a gain on the sale of this participation interest. Therefore our investment in unevaluated oil and gas properties in Guinea at June 30, 2010 was $92,000 which represents capitalized costs incurred in June 2010.
Our current liabilities decreased $1,924,000, from $5,041,000 on June 30, 2010 to $3,116,000 on June 30, 2011. The main factor in the decrease is accounts payable and accrued expenses, which decreased from $3,859,000 at June 30, 2010, to $3,116,000 at June 30, 2011. Accounts payable at June 30, 2011, included amounts payable related primarily to our investments in our Concession and corporate activities. The decrease in accounts payable is due to a decrease in accrued employee bonus expense resulting from the timing of bonus payments. Additionally, the decrease in current liabilities can be attributed to a decrease in dividends payable and short term notes payable as these two liabilities totaling $532,000 were settled in 2011.
Our long-term liabilities decreased from $653,000 at June 30, 2010, to $138,000 at June 30, 2011, due primarily to the $583,000 of warrant derivative liability that was on the balance sheet at June 30, 2010 being converted into common shares during 2011. This derivative liability related to the issuance of warrants which had an adjustment provision applicable to the exercise price that adjusted the exercise price downward in the event we issued common stock, stock warrants, stock options or convertible debt with a stock price, exercise price or conversion price lower than the recipient’s exercise price, originally $2.00 per share.
Results of Operations
Based on the factors discussed below the net loss attributable to common shareholders for the year ended June 30, 2011, increased $3,228,000, or 40%, to a net loss of $11,238,000, or $ 0.09 per share in the 2011 period from a net loss of $8,009,000, or $0.09 per share in the 2010 period.
The net loss attributable to common shareholders for the year ended June 30, 2010, decreased $874,000, or 10%, to a net loss of $8,009,000, or $0.09 per share in the 2010 period from a net loss of $8,883,000, or $0.15 per share in the 2009 period. The net loss attributable to common shareholders in the 2010 period includes income from discontinued operations of $765,000. The net loss attributable to common shareholders in the 2009 period includes income from discontinued operations of $406,000 and a provision for preferred stock dividends of $97,000.
Reportable segments
We have one reportable segment: our international operations in Guinea conducted through our subsidiary SCS. SCS is engaged in oil and gas exploration activities pertaining to offshore Guinea. During the year ended June 30, 2009, our domestic operations were discontinued, and as of August 2009, all the assets associated with HYD, which was our domestic subsidiary that held certain properties located in Louisiana, have been sold.
Results of Operations
Comparison for Fiscal Year 2011 and 2010
Revenues. There were no revenues for the years ended June 30, 2011 and 2010. We have focused on the acquisition and interpretation of seismic data for our Concession offshore Guinea.
Depreciation. Depreciation increased 126%, or $197,000 due to additional depreciation associated with assets placed in service in 2011. Depreciation expense was $353,000 and $156,000 in the years ended June 30, 2011 and 2010, respectively.
Selling, General and Administrative Expenses. Our selling, general and administrative expenses were $10,516,000 and $10,847,000 for the years ended June 30, 2011 and 2010, respectively. This represents an decrease of 3%, or $331,000.
Loss from Operations. Our loss from operations increased $2,821,000 from $8,048,000 in 2010 to $10,869,000 in 2011. During the 2010 period, we recognized a $2,955,000 gain on sale of a participation interest in unevaluated oil and gas properties resulting from the 23% participation interest in our Concession being assigned to Dana. This gain was recognized in May 2010 and represented the excess of the $19.6 million proceeds received over the amount of our investment in the Concession as of that date.
Other income (expense). Other income (expense) totaled $(369,000) and $(726,000) for the years ended June 30, 2011 and 2010, respectively. In 2011, we recognized a non-cash loss on the derivative liability related to the YA Global warrants of $771,000, all of which related to the exercise of warrants classified as derivative liabilities. In 2010, we recognized a non-cash gain on the derivative liability of $279,000, $327,000 of which was unrealized gain on the change in fair value of the liability and $48,000 loss which was related to the exercise of warrants classified as derivative liabilities. Interest income (expense) was $402,000 for the 2011 period, versus ($707,000) for the 2010 period. The higher interest income in 2011 was primarily attributable to the interest income on short term investments on hand during the fourth quarter. The lower interest expense in 2011 is primarily due to the early conversion of convertible debentures outstanding during the fiscal 2010 period and the expensing of the associated debt discount and we recognized a loss on extinguishment of the remaining convertible debenture balance of ($298,000), primarily attributable to the expensing of the remaining discount associated with these debentures.
Loss from Continuing Operations. Based on the items discussed above, our loss from continuing operations increased by 28%, or $2,464,000, from $8,774,000 in the year ended June 30, 2010 to $11,238,000 for the year ended June 30, 2011.
Discontinued Operations. There were no discontinued operations for the 2011 period, while there was a gain of $765,000 for the 2010 period.
Comparison for Fiscal Year 2010 and 2009
Revenues. There were no revenues for the years ended June 30, 2010 and 2009. We have focused on the acquisition and interpretation of seismic data for our concession in Guinea.
Depreciation. Depreciation increased 16%, or $22,000 due to additional depreciation associated with assets placed in service in 2010. Depreciation expense was $156,000 and $134,000 in the years ended June 30, 2010 and 2009, respectively.
Selling, General and Administrative Expenses. Our selling, general and administrative expenses were $10,847,000 and $5,949,000 for the years ended June 30, 2010 and 2009, respectively. This represents an increase of 82%, or $4,898,000. The increase was primarily employee related costs, which include salaries, bonuses and stock based compensation related to options granted to new employees and others.
Loss from Operations. Our loss from operations increased $1,965,000 from $6,083,000 in 2009 to $8,048,000 in 2010. The increase was the result of the increase in selling, general and administrative expenses discussed above, which was partially offset by the gain on the sale of a participating interest. During the 2010 period, we recognized a $2,955,000 gain on sale of a participation interest in unevaluated oil and gas properties resulting from the 23% participation interest in our Concession being assigned to Dana. This gain was recognized in May 2010 and represented the excess of the $19.6 million proceeds received over the amount of our investment in the Concession as of that date.
Other income (expense). Other income (expense) totaled $(726,000) and ($3,109,000) for the years ended June 30, 2010 and 2009, respectively. During 2010, we recognized a non-cash gain on the derivative liability related to the YA Global warrants of $279,000, $327,000 of which was unrealized gain on the change in fair value of the liability, partially offset by a $48,000 loss which was related to the exercise of warrants classified as derivative liabilities. No such gains were recognized in the 2009 period. Interest expense was ($707,000) for the 2010 period, versus ($2,530,000) for the 2009 period. The higher interest expense in the 2009 was primarily attributable to the early conversion of convertible debentures outstanding during the period and the expensing of the associated debt discount. During the 2010 period, we recognized a loss on extinguishment of the remaining convertible debenture balance of ($298,000), primarily attributable to the expensing of the remaining discount associated with these debentures, versus a loss of ($579,000) in the 2009 period, primarily attributable to the early extinguishment of the YA Global debenture that resulted in a loss of ($635,000), that was partially offset by a gain on settlement of a debt obligation for less than the accrued amount.
Loss from Continuing Operations. Based on the items discussed above, our loss from continuing operations decreased by 5%, or $418,000, from $9,192,000 in the year ended June 30, 2009 to $8,774,000 for the year ended June 30, 2010.
Discontinued Operations. Discontinued operations generated income of $765,000 for the 2010 period and income of $406,000 for the 2009 period.
Liquidity and Capital Resources
Capital Resource Considerations
We did not have revenues from operations in the years ended June 30, 2011 or 2010. Since June 30, 2010, we have raised (i) $8.6 million from warrants and stock option exercises, (ii) $29.9 million from the sale of common stock to funds managed by BlackRock on November 3, 2010, and (iii) $136.2 million from the sale of common stock in a public offering completed on March 30, 2011. As a result, we believe we have adequate capital resources to meet our working capital requirements for the next twelve months, including drilling our two exploratory wells and acquiring a new deep water 3-D seismic survey.
You should carefully consider the risks described in this Annual Report on Form 10-K for the fiscal year ended June 30, 2011 in evaluating our company. We will require substantial additional funding to drill additional wells in offshore Guinea, either from capital raised, sales of participation interests, or through other means.
Liquidity
On June 30, 2011, we had $79,889,000 in cash and $3,254,000 in liabilities. The liabilities include current liabilities of $3,116,000 and long-term liabilities of $138,000. Net cash used in operating activities for continuing operations for the year ended June 30, 2011 was $11,785,000 compared to $6,888,000 for the year ended June 30, 2010. Cash used by investing activities for continuing operations for the year ended June 30, 2011 was $108,820,000 compared to $10,309,000 provided by investing activities in the year ended June 30, 2010. There was net cash provided by financing activities for the year ended June 30, 2011 of $174,454,000 while net cash of $20,454,000 was provided by financing activities during the year ended June 30, 2010.
Contractual Commitments and Obligations
Our subsidiary, SCS, has $350,000 remaining of a contingent note payable due to the former owners of SCS Corporation’s assets. It is payable in our common stock and it is payable only if SCS has net income in any given quarter. If SCS experiences net income in a quarter, 25% of the income will be paid against the note, until the contingency is satisfied.
Disclosure of Contractual Obligations as of June 30, 2011
|
|
|
Payments due by period ($thousands) |
| |||||||||||||
|
Contractual Obligations |
|
Total |
|
Less than 1 |
|
1-3 years |
|
3-5 years |
|
More than 5 |
| |||||
|
Installment Obligations |
|
$ |
— |
|
$ |
— |
|
$ |
— |
|
$ |
— |
|
$ |
— |
|
|
|
|
|
|
|
|
|
|
|
|
|
| |||||
|
Operating Lease Obligations |
|
1,315 |
|
406 |
|
681 |
|
228 |
|
— |
| |||||
|
|
|
|
|
|
|
|
|
|
|
|
| |||||
|
Total (1) |
|
$ |
1,315 |
|
406 |
|
681 |
|
228 |
|
$ |
— |
| |||
(1) We are subject to certain commitments under the PSC as discussed above.
CRITICAL ACCOUNTING POLICIES
We account for oil and natural gas producing activities using the full cost method of accounting as prescribed by the United States Securities and Exchange Commission (SEC). Accordingly, all costs incurred in the acquisition, exploration, and development of proved oil and natural gas properties, including the costs of abandoned properties, dry holes, geophysical costs, and annual lease rentals are capitalized. All general and administrative corporate costs unrelated to drilling activities are expensed as incurred. Sales or other dispositions of oil and natural gas properties are accounted for as adjustments to capitalized costs, with no gain or loss recorded unless the ratio of cost to proved reserves would significantly change, or to the extent that the sale proceeds exceed our capitalized costs. Depletion of evaluated oil and natural gas properties is computed on the units of production method based on proved reserves. The net capitalized costs of proved oil and natural gas properties are subject to a full cost ceiling limitation in which the costs are not allowed to exceed their related estimated future net revenues discounted at 10%, net of tax considerations. In accordance with SEC release 33-8995, prices based on the preceding 12-months’ average price based on closing prices on the first day of each month, or prices defined by existing contractual arrangements, are used in deriving future net revenues discounted at 10%, net of tax. The application of the full cost method of accounting for oil and gas properties generally results in higher capitalized costs and higher depreciation, depletion and amortization rates compared to the successful efforts method of accounting for oil and gas properties.
Costs Excluded
Costs associated with unevaluated properties are excluded from the full cost pool until we have made a determination as to the existence of proved reserves. We review our unevaluated properties at the end of each quarter to determine whether the costs incurred should be transferred to the full cost pool and thereby subject to amortization.
We assess all items classified as unevaluated property on a quarterly basis for possible impairment or reduction in value. We assess properties on an individual basis or as a group if properties are individually insignificant. The assessment includes consideration of the following factors, among others: intent to drill; remaining lease term; geological and geophysical evaluations; drilling results and activity; the assignment of proved reserves; and the economic viability of development if proved reserves are assigned. We assess our unevaluated properties on a country-by-country basis. During any period in which these factors indicate an impairment, the cumulative drilling costs incurred to date for
such property and all or a portion of the associated leasehold costs are transferred to the full cost pool and are then subject to amortization. However, if proved reserves have not yet been established in a full cost pool, these costs are charged against earnings. For international operations where a reserve base has not yet been established, an impairment requiring a charge to earnings may be indicated through evaluation of drilling results, relinquishing drilling rights or other information.
Impairment
At June, 30, 2011, we had $36,200,000 of capitalized costs associated with our Guinea operations. Based on an impairment analysis performed by management and the completion of work requirements under the PSC, no impairment of these assets was indicated at June 30, 2011.
Environmental Obligations and Other Contingencies
Management makes judgments and estimates in accordance with applicable accounting rules when it establishes reserves for environmental remediation, litigation and other contingent matters. Provisions for such matters are charged to expense when it is probable that a liability has been incurred and reasonable estimates of the liability can be made. Estimates of environmental liabilities are based on a variety of matters, including, but not limited to, the stage of investigation, the stage of the remedial design, evaluation of existing remediation technologies, and presently enacted laws and regulations. In future periods, a number of factors could significantly change our estimate of environmental remediation costs, such as changes in laws and regulations, or changes in their interpretation or administration, revisions to the remedial design, unanticipated construction problems, identification of additional areas or volumes of contaminated soil and groundwater, and changes in costs of labor, equipment and technology. Consequently, it is not possible for management to reliably estimate the amount and timing of all future expenditures related to environmental or other contingent matters and actual costs may vary significantly from our estimates.
Fair Value of our debt and equity transactions
Many of our various debt and equity transactions require us to determine the fair value of a debt or equity instrument in order to properly record the transaction in our financial statements. Fair value is generally determined by applying widely acceptable valuation models, (e.g., the Black Scholes and binomial lattice valuation models) using the trading price of the underlying instrument or by comparison to instruments with comparable maturities and terms.
Share-Based Compensation
We follow ASC 718 which requires recognition in the financial statements of the cost of employee services received in exchange for an award of equity instruments over the period the employee is required to perform the services in exchange for the award (presumptively the vesting period). ASC 718 also requires measurement of the cost of employee services received in exchange for an award based on the grant-date fair value of the award. We account for non-employee share-based awards based upon the provisions of ASC 505-50, “Equity-Based Payments to Non-Employees.”
Item 7A. Quantitative and Qualitative Disclosures About Market Risk
Our functional currency is the US dollar. We have some foreign currency exchange rate risk resulting from our in-country offices in Guinea and the United Kingdom. US dollars are accepted in Guinea and many of our purchases and purchase obligations, such as our office lease in Guinea, are denominated in US dollars. However, our costs for labor, supplies, and fuel could increase if the Guinea Franc or the Pound Sterling significantly appreciates against the US dollar. We do not hedge the exposure to currency rate changes.
Item 8. Financial Statements and Supplementary Data
The Financial Statements and Supplementary Data information required hereunder is included in this report as set forth in the “Index to Financial Statements” on page F-1.
HYPERDYNAMICS CORPORATION
Index to Financial Statements
TABLE OF CONTENTS
REPORT OF MANAGEMENT ON INTERNAL CONTROL OVER FINANCIAL REPORTING
Management of Hyperdynamics Corporation (the “Company” or “our”), including the Company’s Chief Executive Officer and Chief Financial Officer, is responsible for establishing and maintaining adequate internal control over financial reporting for the Company as defined in Rules 13a-15(f) and 15d-15(f) under the Securities Exchange Act of 1934. The Company’s internal control system was designed to provide reasonable assurance to the Company’s management and board of directors regarding the reliability of financial reporting and the preparation of financial statements for external purposes in accordance with accounting principles generally accepted in the United States.
Internal control over financial reporting includes the controls themselves, monitoring (including internal auditing practices), and actions taken to correct deficiencies as identified.
Internal control over financial reporting has inherent limitations and may not prevent or detect misstatements. The design of an internal control system is also based in part upon assumptions and judgments made by management about the likelihood of future events, and there can be no assurance that an internal control will be effective under all potential future conditions. Therefore, even those systems determined to be effective can provide only reasonable, not absolute, assurance with respect to the financial statement preparation and presentation. Further, because of changes in conditions, the effectiveness of internal control over financial reporting may vary over time.
Management assessed the effectiveness of the Company’s internal control over financial reporting as of June 30, 2011. In making this assessment, management used the criteria for internal control over financial reporting described in Internal Control — Integrated Framework by the Committee of Sponsoring Organizations of the Treadway Commission (“COSO”). Management’s assessment included an evaluation of the design of the Company’s internal control over financial reporting and testing of the operating effectiveness of its internal control over financial reporting. Management reviewed the results of its assessment with the Audit Committee of the Company’s Board of Directors.
We have identified certain control deficiencies resulting from the lack of effective detective and monitoring controls being designed within internal control over financial reporting. Such deficiencies related to oversight and review of information as prepared or received from external service providers covering marketable securities, income taxes and equity awards and over the presentation of certain accounting principles. These conditions were manifested in a number of adjustments to the financial statements and related disclosures, and there is more than a remote likelihood that a material misstatement of the financial statements would not have been prevented or detected. The combination of these deficiencies represents a material weakness in our internal controls over financial reporting.
In addition we identified certain control deficiencies in our general computer control environment, resulting from the lack of effective controls around the areas of approval and review of information technology changes and system security, including the enforcement of segregation of duties and appropriate user access restrictions. The combination of these deficiencies represents a material weakness in our internal controls over financial reporting.
As a result of these material weaknesses, we concluded that our internal controls over financial reporting were not effective as of June 30, 2011. A material weakness is a deficiency or combination of deficiencies, in internal control over financial reporting, such that there is a reasonable possibility that a material misstatement of our annual or interim financial statements will not be prevented or detected and corrected on a timely basis.
Deloitte & Touche LLP, the Company’s independent registered public accounting firm, has issued an attestation report on the effectiveness on the Company’s internal control over financial reporting as of June 30, 2011 which is included in Item 8. Consolidated Financial Statements and Supplementary Data.
|
/s/ RAY LEONARD |
|
/s/ PAUL REINBOLT |
|
Ray Leonard |
|
Paul Reinbolt |
REPORT OF INDEPENDENT REGISTERED PUBLIC ACCOUNTING FIRM
To the Board of Directors and Shareholders of
Hyperdynamics Corporation
Houston, Texas
We have audited Hyperdynamics Corporation’s (the "Company's") internal control over financial reporting as of June 30, 2011, based on criteria established in Internal Control — Integrated Framework issued by the Committee of Sponsoring Organizations of the Treadway Commission. The Company's management is responsible for maintaining effective internal control over financial reporting and for its assessment of the effectiveness of internal control over financial reporting, included in the accompanying Report of Management on Internal Control Over Financial Reporting. Our responsibility is to express an opinion on the Company's internal control over financial reporting based on our audit.
We conducted our audit in accordance with the standards of the Public Company Accounting Oversight Board (United States). Those standards require that we plan and perform the audit to obtain reasonable assurance about whether effective internal control over financial reporting was maintained in all material respects. Our audit included obtaining an understanding of internal control over financial reporting, assessing the risk that a material weakness exists, testing and evaluating the design and operating effectiveness of internal control based on that risk, and performing such other procedures as we considered necessary in the circumstances. We believe that our audit provides a reasonable basis for our opinion.
A company's internal control over financial reporting is a process designed by, or under the supervision of, the company's principal executive and principal financial officers, or persons performing similar functions, and effected by the company's board of directors, management, and other personnel to provide reasonable assurance regarding the reliability of financial reporting and the preparation of financial statements for external purposes in accordance with generally accepted accounting principles. A company's internal control over financial reporting includes those policies and procedures that (1) pertain to the maintenance of records that, in reasonable detail, accurately and fairly reflect the transactions and dispositions of the assets of the company; (2) provide reasonable assurance that transactions are recorded as necessary to permit preparation of financial statements in accordance with generally accepted accounting principles, and that receipts and expenditures of the company are being made only in accordance with authorizations of management and directors of the company; and (3) provide reasonable assurance regarding prevention or timely detection of unauthorized acquisition, use, or disposition of the company's assets that could have a material effect on the financial statements.
Because of the inherent limitations of internal control over financial reporting, including the possibility of collusion or improper management override of controls, material misstatements due to error or fraud may not be prevented or detected on a timely basis. Also, projections of any evaluation of the effectiveness of the internal control over financial reporting to future periods are subject to the risk that the controls may become inadequate because of changes in conditions, or that the degree of compliance with the policies or procedures may deteriorate.
A material weakness is a deficiency, or a combination of deficiencies, in internal control over financial reporting, such that there is a reasonable possibility that a material misstatement of the company’s annual or interim financial statements will not be prevented or detected on a timely basis. Management’s assessment identified certain control deficiencies resulting from the lack of effective detective and monitoring controls being designed within internal control over financial reporting. Such deficiencies related to oversight and review of information as prepared or received from external service providers covering marketable securities, income taxes and equity awards and over the presentation of the financial statements and the application of certain accounting principles. These conditions were manifested in a number of adjustments to the financial statements and related disclosures and there is more than a remote likelihood that a material misstatement of the financial statements would not have been prevented or detected. The combination of these deficiencies represents a material weakness in the Company’s internal controls over financial reporting. In addition, Management’s assessment identified certain control deficiencies in the Company’s general computer control environment, resulting from the lack of effective controls around the areas of approval and review of information technology changes and system security, including the enforcement of segregation of duties and appropriate user access restrictions. The combination of these deficiencies represents a material weakness in the Company’s internal controls over financial reporting. These material weaknesses were considered in determining the nature, timing, and extent of audit tests applied in our audit of the consolidated financial statements as of and for the year ended June 30, 2011, of the Company and this report does not affect our report on such financial statements.
In our opinion, because of the effect of the material weaknesses identified above on the achievement of the objectives of the control criteria, the Company has not maintained effective internal control over financial reporting as of June 30, 2011, based on the criteria established in Internal Control — Integrated Framework issued by the Committee of Sponsoring Organizations of the Treadway Commission.
We have also audited, in accordance with the standards of the Public Company Accounting Oversight Board (United States), the consolidated financial statements as of and for the year ended June 30, 2011, of the Company and our report dated September 13, 2011 expressed an unqualified opinion on those financial statements.
/s/Deloitte & Touche LLP
Houston, Texas
September 13, 2011
REPORT OF INDEPENDENT REGISTERED PUBLIC ACCOUNTING FIRM
To the Board of Directors and Shareholders of
Hyperdynamics Corporation
Houston, Texas
We have audited the accompanying consolidated balance sheets of Hyperdynamics Corporation (the "Company") as of June 30, 2011, and the related consolidated statements of operations, shareholders' equity and comprehensive income, and cash flows for the year then ended. These financial statements are the responsibility of the Company's management. Our responsibility is to express an opinion on these financial statements based on our audit. The financial statements of the Company for the year ended June 30, 2010 were audited by other auditors whose report, dated September 28, 2010, expressed an unqualified opinion on those statements.
We conducted our audit in accordance with the standards of the Public Company Accounting Oversight Board (United States). Those standards require that we plan and perform the audit to obtain reasonable assurance about whether the financial statements are free of material misstatement. An audit includes examining, on a test basis, evidence supporting the amounts and disclosures in the financial statements. An audit also includes assessing the accounting principles used and significant estimates made by management, as well as evaluating the overall financial statement presentation. We believe that our audits provide a reasonable basis for our opinion.
In our opinion, such consolidated financial statements present fairly, in all material respects, the financial position of Hyperdynamics Corporation as of June 30, 2011 and the results of their operations and their cash flows for the year then ended, in conformity with accounting principles generally accepted in the United States of America.
We have also audited, in accordance with the standards of the Public Company Accounting Oversight Board (United States), the Company's internal control over financial reporting as of June 30, 2011, based on the criteria established in Internal Control—Integrated Framework issued by the Committee of Sponsoring Organizations of the Treadway Commission and our report dated September 13, 2011 expressed an adverse opinion on the Company's internal control over financial reporting because of material weaknesses.
/s/ Deloitte & Touche LLP
Houston, Texas
September 13, 2011
REPORT OF INDEPENDENT REGISTERED PUBLIC ACCOUNTING FIRM
To the Board of Directors and Shareholders
Hyperdynamics Corporation
Houston, Texas
We have audited the accompanying consolidated balance sheet of Hyperdynamics Corporation as of June 30, 2010, and the related consolidated statements of operations, shareholders' equity and cash flows for the years ended June 30, 2010 and 2009. These consolidated financial statements are the responsibility of the Company's management. Our responsibility is to express an opinion on these consolidated financial statements based on our audits.
We conducted our audits in accordance with auditing standards of the Public Company Accounting Oversight Board (United States). Those standards require that we plan and perform the audits to obtain reasonable assurance about whether the financial statements are free of material misstatement. The Company is not required to have, nor were we engaged to perform, an audit of its internal control over financial reporting for the years ended June 30, 2010 and 2009. Our audits included consideration of internal control over financial reporting as a basis for designing audit procedures that are appropriate in the circumstances, but not for the purpose of expressing an opinion on the effectiveness of the Company's internal control over financial reporting. Accordingly, we express no such opinion. An audit also includes examining, on a test basis, evidence supporting the amounts and disclosures in the financial statements, assessing the accounting principles used and significant estimates made by management, as well as evaluating the overall financial statement presentation. We believe that our audits provide a reasonable basis for our opinion.
In our opinion, the consolidated financial statements referred to above present fairly, in all material respects, the consolidated financial position of Hyperdynamics Corporation as of June 30, 2010, and the results of their operations and their cash flows for the years ended June 30, 2010 and 2009, in conformity with accounting principles generally accepted in the United States of America.
/s/ GBH CPAs, PC
GBH CPAs, PC
www.gbhcpas.com
Houston, Texas
September 28, 2010
HYPERDYNAMICS CORPORATION
(In Thousands, Except Number of Shares and Per Share Amounts)
|
|
|
June 30, |
| ||||
|
|
|
2011 |
|
2010 |
| ||
|
ASSETS |
|
|
|
|
| ||
|
Current assets: |
|
|
|
|
| ||
|
Cash and cash equivalents |
|
$ |
79,889 |
|
$ |
26,040 |
|
|
Available-for-sale securities |
|
55,368 |
|
— |
| ||
|
Accounts receivable — joint interest |
|
708 |
|
150 |
| ||
|
Prepaid expenses |
|
702 |
|
205 |
| ||
|
Other current assets |
|
149 |
|
— |
| ||
|
Total current assets |
|
136,816 |
|
26,395 |
| ||
|
Property and equipment, net of accumulated depreciation of $798 and $445 |
|
1,336 |
|
664 |
| ||
|
Oil and gas properties: |
|
|
|
|
| ||
|
Unevaluated properties excluded from amortization |
|
36,200 |
|
92 |
| ||
|
Restricted Cash |
|
18,300 |
|
— |
| ||
|
Deposits |
|
31 |
|
69 |
| ||
|
Total assets |
|
$ |
192,683 |
|
$ |
27,220 |
|
|
|
|
|
|
|
| ||
|
LIABILITIES AND SHAREHOLDERS’ EQUITY |
|
|
|
|
| ||
|
Current liabilities: |
|
|
|
|
| ||
|
Accounts payable and accrued expenses |
|
3,116 |
|
3,859 |
| ||
|
Accounts payable - seismic data |
|
— |
|
650 |
| ||
|
Dividends payable |
|
— |
|
372 |
| ||
|
Short-term notes payable and current portion of long-term debt, net of discount of $0 and $0 |
|
— |
|
160 |
| ||
|
Total current liabilities |
|
3,116 |
|
5,041 |
| ||
|
|
|
|
|
|
| ||
|
Warrant derivative liability |
|
— |
|
583 |
| ||
|
Deferred rent |
|
138 |
|
70 |
| ||
|
Total liabilities |
|
3,254 |
|
5,694 |
| ||
|
|
|
|
|
|
| ||
|
Commitments and contingencies (Note 13) |
|
— |
|
— |
| ||
|
|
|
|
|
|
| ||
|
Shareholders’ equity: |
|
|
|
|
| ||
|
Convertible preferred stock, par value $0.001; stated value $1,000; 20,000,000 authorized |
|
|
|
|
| ||
|
Series A — 3,000 shares issued and 0 shares outstanding |
|
— |
|
— |
| ||
|
Series B - 2,725 shares issued and 0 and 2,406 shares outstanding |
|
— |
|
— |
| ||
|
Common stock, $0.001 par value, 250,000,000 shares authorized; 155,792,524 and 104,227,199 shares issued and outstanding |
|
156 |
|
104 |
| ||
|
Additional paid-in capital |
|
276,484 |
|
97,046 |
| ||
|
Accumulated other comprehensive income |
|
(349 |
) |
— |
| ||
|
Accumulated deficit |
|
(86,862 |
) |
(75,624 |
) | ||
|
Total shareholders’ equity |
|
189,429 |
|
21,526 |
| ||
|
Total liabilities and shareholders’ equity |
|
$ |
192,683 |
|
$ |
27,220 |
|
The accompanying notes are an integral part of these consolidated financial statements.
HYPERDYNAMICS CORPORATION
CONSOLIDATED STATEMENTS OF OPERATIONS
(In Thousands, Except Number of Shares and Per Share Amounts)
|
|
|
Year Ended June 30, |
| |||||||
|
|
|
2011 |
|
2010 |
|
2009 |
| |||
|
Costs and expenses: |
|
|
|
|
|
|
| |||
|
Depreciation |
|
$ |
353 |
|
$ |
156 |
|
$ |
134 |
|
|
Selling, general and administrative |
|
10,516 |
|
10,847 |
|
5,949 |
| |||
|
Total costs and expenses |
|
10,869 |
|
11,003 |
|
6,083 |
| |||
|
Gain on sale of interest in unevaluated oil and gas properties |
|
— |
|
2,955 |
|
— |
| |||
|
Loss from operations |
|
(10,869 |
) |
(8,048 |
) |
(6,083 |
) | |||
|
Other income (expense): |
|
|
|
|
|
|
| |||
|
Gain (Loss) on warrant derivative liability |
|
(771 |
) |
279 |
|
— |
| |||
|
Interest income (expense), net |
|
402 |
|
(707 |
) |
(2,530 |
) | |||
|
Loss on settlement of debt |
|
— |
|
(298 |
) |
(579 |
) | |||
|
Total other income (expense) |
|
(369 |
) |
(726 |
) |
(3,109 |
) | |||
|
Loss from continuing operations |
|
(11,238 |
) |
(8,774 |
) |
(9,192 |
) | |||
|
Income from discontinued operations, net of tax (including gain on sale of $765 in 2010 and gain on sale of $2,259 and impairment of $2,303, in 2009) |
|
— |
|
765 |
|
406 |
| |||
|
Net loss |
|
(11,238 |
) |
(8,009 |
) |
(8,786 |
) | |||
|
Preferred stock dividend to related party |
|
— |
|
— |
|
(97 |
) | |||
|
Net loss attributable to common shareholders |
|
$ |
(11,238 |
) |
$ |
(8,009 |
) |
$ |
(8,883 |
) |
|
|
|
|
|
|
|
|
| |||
|
Basic and diluted income (loss) per common share |
|
|
|
|
|
|
| |||
|
From continuing operations |
|
$ |
(0.09 |
) |
$ |
(0.10 |
) |
$ |
(0.15 |
) |
|
From discontinued operations |
|
$ |
0.00 |
|
$ |
0.01 |
|
$ |
0.00 |
|
|
Net loss attributable to common shareholders |
|
$ |
(0.09 |
) |
$ |
(0.09 |
) |
$ |
(0.15 |
) |
|
|
|
|
|
|
|
|
| |||
|
Weighted average shares outstanding — basic and diluted |
|
125,997,638 |
|
85,913,956 |
|
61,845,036 |
| |||
The accompanying notes are an integral part of these consolidated financial statements.
HYPERDYNAMICS CORPORATION
CONSOLIDATED STATEMENTS OF SHAREHOLDERS’ EQUITY AND COMPREHENSIVE INCOME
(In Thousands, Except Number of Shares)
|
|
|
Series A Preferred |
|
Series B Preferred |
|
Common Stock |
|
Additional Paid- |
|
Accumulated |
|
Other |
|
|
| |||||||||||||
|
|
|
Shares |
|
Amount |
|
Shares |
|
Amount |
|
Shares |
|
Amount |
|
in Capital |
|
Deficit |
|
Income |
|
Total |
| |||||||
|
Balance, June 30, 2008 |
|
1,945 |
|
$ |
— |
|
2,446 |
|
$ |
— |
|
59,339,481 |
|
$ |
59 |
|
$ |
65,443 |
|
$ |
(58,829 |
) |
— |
|
$ |
6,673 |
| |
|
Common stock issued for: |
|
|
|
|
|
|
|
|
|
|
|
|
|
|
|
|
|
|
|
|
| |||||||
|
Services |
|
— |
|
— |
|
— |
|
— |
|
2,185,448 |
|
2 |
|
1,555 |
|
— |
|
— |
|
1,557 |
| |||||||
|
Deferred financing costs |
|
— |
|
— |
|
— |
|
— |
|
66,000 |
|
— |
|
103 |
|
— |
|
— |
|
103 |
| |||||||
|
Conversion of debentures |
|
— |
|
— |
|
— |
|
— |
|
2,250,000 |
|
2 |
|
2,036 |
|
— |
|
— |
|
2,038 |
| |||||||
|
Preferred stock dividends |
|
— |
|
— |
|
— |
|
— |
|
21,884 |
|
— |
|
7 |
|
— |
|
— |
|
7 |
| |||||||
|
Conversion of Series B Preferred Stock and accrued dividends |
|
— |
|
— |
|
(40 |
) |
— |
|
300,000 |
|
1 |
|
(1 |
) |
— |
|
— |
|
— |
| |||||||
|
Issuance of warrants |
|
— |
|
— |
|
— |
|
— |
|
— |
|
— |
|
1,886 |
|
— |
|
— |
|
1,886 |
| |||||||
|
Discount on convertible debt |
|
— |
|
— |
|
— |
|
— |
|
— |
|
— |
|
486 |
|
— |
|
— |
|
486 |
| |||||||
|
Discount related to modification of convertible debt |
|
— |
|
— |
|
— |
|
— |
|
— |
|
— |
|
106 |
|
— |
|
— |
|
106 |
| |||||||
|
Amortization of fair value of stock options |
|
— |
|
— |
|
— |
|
— |
|
— |
|
— |
|
281 |
|
— |
|
— |
|
281 |
| |||||||
|
Warrant repricings: |
|
|
|
|
|
|
|
|
|
|
|
|
|
|
|
|
|
|
|
|
| |||||||
|
Deemed Dividend |
|
— |
|
— |
|
— |
|
— |
|
— |
|
— |
|
(29 |
) |
— |
|
— |
|
(29 |
) | |||||||
|
Deemed Dividend |
|
— |
|
— |
|
— |
|
— |
|
— |
|
— |
|
29 |
|
|
|
— |
|
29 |
| |||||||
|
Preferred stock dividends to related party |
|
— |
|
— |
|
— |
|
— |
|
— |
|
— |
|
(97 |
) |
— |
|
— |
|
(97 |
) | |||||||
|
Net loss |
|
|
|
|
|
|
|
|
|
|
|
|
|
|
|
(8,786 |
) |
— |
|
(8,786 |
) | |||||||
|
Balance, June 30, 2009 |
|
1,945 |
|
$ |
— |
|
2,406 |
|
$ |
— |
|
64,162,813 |
|
$ |
64 |
|
$ |
71,805 |
|
$ |
(67,615 |
) |
— |
|
$ |
4,254 |
| |
|
|
|
|
|
|
|
|
|
|
|
|
|
|
|
|
|
|
|
|
|
|
| |||||||
|
Cumulative effect of reclassification of warrants as a derivative under ASC 815 |
|
— |
|
— |
|
— |
|
— |
|
— |
|
— |
|
(1,585 |
) |
— |
|
— |
|
(1,585 |
) | |||||||
|
Balance at July 1, 2009, as adjusted |
|
1,945 |
|
— |
|
2,406 |
|
— |
|
64,162,813 |
|
64 |
|
70,220 |
|
(67,615 |
) |
— |
|
2,669 |
| |||||||
|
Common stock issued for: |
|
|
|
|
|
|
|
|
|
|
|
|
|
|
|
|
|
|
|
|
| |||||||
|
Services |
|
— |
|
— |
|
— |
|
— |
|
442,049 |
|
— |
|
324 |
|
— |
|
— |
|
324 |
| |||||||
|
Conversion of Series B Preferred Stock |
|
— |
|
— |
|
(2,406 |
) |
— |
|
15,822,222 |
|
16 |
|
(16 |
) |
— |
|
— |
|
— |
| |||||||
|
Conversion of debentures |
|
— |
|
— |
|
— |
|
— |
|
1,949,411 |
|
2 |
|
1,294 |
|
— |
|
— |
|
1,296 |
| |||||||
|
Cash |
|
— |
|
— |
|
— |
|
— |
|
16,878,096 |
|
17 |
|
17,183 |
|
— |
|
— |
|
17,200 |
| |||||||
|
Exercise of warrants |
|
— |
|
— |
|
— |
|
— |
|
4,646,465 |
|
5 |
|
4,409 |
|
— |
|
— |
|
4,414 |
| |||||||
|
Cashless Exercise of options |
|
— |
|
— |
|
— |
|
— |
|
124,653 |
|
— |
|
— |
|
— |
|
— |
|
— |
| |||||||
|
Cashless Exercise of warrants classified as a derivative |
|
— |
|
— |
|
— |
|
— |
|
201,490 |
|
— |
|
723 |
|
— |
|
— |
|
723 |
| |||||||
|
Amortization of fair value of stock options |
|
— |
|
— |
|
— |
|
|
|
— |
|
— |
|
1,579 |
|
— |
|
— |
|
1,579 |
| |||||||
|
Discount related to modification of convertible debt |
|
— |
|
— |
|
— |
|
— |
|
— |
|
— |
|
1,172 |
|
— |
|
— |
|
1,172 |
| |||||||
|
Warrant repricing charged to interest expense |
|
— |
|
— |
|
— |
|
— |
|
— |
|
— |
|
158 |
|
— |
|
— |
|
158 |
| |||||||
|
Warrant repricing |
|
|
|
|
|
|
|
|
|
|
|
|
|
|
|
|
|
|
|
|
| |||||||
|
Deemed dividend |
|
— |
|
— |
|
— |
|
— |
|
— |
|
— |
|
322 |
|
— |
|
— |
|
322 |
| |||||||
|
Deemed dividend |
|
— |
|
— |
|
— |
|
— |
|
— |
|
— |
|
(322 |
) |
— |
|
— |
|
(322 |
) | |||||||
|
Net loss |
|
— |
|
— |
|
— |
|
— |
|
— |
|
— |
|
— |
|
(8,009 |
) |
— |
|
(8,009 |
) | |||||||
|
|
|
|
|
|
|
|
|
|
|
|
|
|
|
|
|
|
|
|
|
|
| |||||||
|
Balance, June 30, 2010 |
|
1,945 |
|
$ |
— |
|
— |
|
$ |
— |
|
104,227,199 |
|
$ |
104 |
|
$ |
97,046 |
|
$ |
(75,624 |
) |
$ |
— |
|
$ |
21,526 |
|
|
|
|
|
|
|
|
|
|
|
|
|
|
|
|
|
|
|
|
|
|
|
| |||||||
|
Net loss |
|
— |
|
— |
|
— |
|
— |
|
— |
|
— |
|
— |
|
(11,238 |
) |
— |
|
(11,238 |
) | |||||||
|
Unrealized Gain (Loss) on available-for-sale securities |
|
— |
|
— |
|
— |
|
— |
|
— |
|
— |
|
— |
|
— |
|
(349 |
) |
(349 |
) | |||||||
|
Total Comprehensive Loss |
|
|
|
|
|
|
|
|
|
|
|
|
|
|
|
|
|
|
|
(11,587 |
) | |||||||
|
Common stock issued for: |
|
|
|
|
|
|
|
|
|
|
|
|
|
|
|
|
|
|
|
|
| |||||||
|
Cash |
|
— |
|
— |
|
— |
|
— |
|
43,750,000 |
|
44 |
|
165,955 |
|
— |
|
— |
|
165,999 |
| |||||||
|
Exercise of warrants |
|
— |
|
— |
|
— |
|
— |
|
6,339,927 |
|
6 |
|
7,703 |
|
— |
|
— |
|
7,709 |
| |||||||
|
Exercise of options |
|
— |
|
— |
|
— |
|
— |
|
858,613 |
|
1 |
|
905 |
|
— |
|
— |
|
906 |
| |||||||
|
Cashless exercise of warrants classified as a derivative |
|
— |
|
— |
|
— |
|
— |
|
384,848 |
|
1 |
|
1,353 |
|
— |
|
— |
|
1,354 |
| |||||||
|
Series A settlement |
|
(1,945 |
) |
— |
|
— |
|
— |
|
231,937 |
|
— |
|
1,183 |
|
— |
|
— |
|
1,183 |
| |||||||
|
Settlement charge |
|
— |
|
— |
|
— |
|
— |
|
— |
|
— |
|
(811 |
) |
— |
|
— |
|
(811 |
) | |||||||
|
Amortization of fair value of stock options |
|
— |
|
— |
|
— |
|
— |
|
— |
|
— |
|
3,150 |
|
— |
|
— |
|
3,150 |
| |||||||
|
Balance, June 30, 2011 |
|
— |
|
$ |
— |
|
— |
|
$ |
— |
|
155,792,524 |
|
$ |
156 |
|
$ |
276,484 |
|
$ |
(86,862 |
) |
$ |
(349 |
) |
$ |
189,429 |
|
The accompanying notes are an integral part of these consolidated financial statements.
HYPERDYNAMICS CORPORATION
CONSOLIDATED STATEMENTS OF CASH FLOWS
(In Thousands)
|
|
|
Years Ended June 30, |
| |||||||
|
|
|
2011 |
|
2010 |
|
2009 |
| |||
|
CASH FLOWS FROM OPERATING ACTIVITIES: |
|
|
|
|
|
|
| |||
|
Net loss |
|
$ |
(11,238 |
) |
$ |
(8,009 |
) |
$ |
(8,786 |
) |
|
Income from discontinued operations |
|
— |
|
(765 |
) |
(406 |
) | |||
|
Adjustments to reconcile net loss to net cash used in operating activities: |
|
|
|
|
|
|
| |||
|
Depreciation, depletion and amortization |
|
353 |
|
156 |
|
134 |
| |||
|
Common stock issued for services |
|
— |
|
143 |
|
1,097 |
| |||
|
Stock based compensation |
|
2,176 |
|
1,579 |
|
281 |
| |||
|
Variable share issuance obligation |
|
— |
|
(374 |
) |
553 |
| |||
|
Loss on settlement of debt |
|
— |
|
298 |
|
579 |
| |||
|
Gain on sale of oil and gas properties |
|
— |
|
(2,955 |
) |
— |
| |||
|
Gain (Loss) on warrant derivative liability |
|
771 |
|
(279 |
) |
— |
| |||
|
Interest accreted to debt principal |
|
— |
|
342 |
|
1,614 |
| |||
|
Repricing of warrants |
|
— |
|
158 |
|
— |
| |||
|
(Gain) loss on disposition of assets |
|
— |
|
32 |
|
(11 |
) | |||
|
Amortization of discount and financing costs on debt |
|
— |
|
144 |
|
708 |
| |||
|
Changes in operating assets and liabilities: |
|
|
|
|
|
|
| |||
|
Advances to Joint Interest Partner |
|
(558 |
) |
— |
|
— |
| |||
|
Accounts receivable |
|
— |
|
(150 |
) |
— |
| |||
|
Prepaid expenses and other current assets |
|
(497 |
) |
122 |
|
206 |
| |||
|
Other assets |
|
(111 |
) |
(58 |
) |
— |
| |||
|
Accounts payable and accrued expenses |
|
(2,746 |
) |
2,714 |
|
(1,060 |
) | |||
|
Deferred rent |
|
68 |
|
14 |
|
(17 |
) | |||
|
Cash used in operating activities — continuing operations |
|
(11,782 |
) |
(6,888 |
) |
(5,108 |
) | |||
|
Cash provided by (used in) operating activities — discontinued operations |
|
— |
|
(76 |
) |
1,177 |
| |||
|
Net cash used in operating activities |
|
(11,782 |
) |
(6,964 |
) |
(3,931 |
) | |||
|
|
|
|
|
|
|
|
| |||
|
CASH FLOWS FROM INVESTING ACTIVITIES: |
|
|
|
|
|
|
| |||
|
Purchase of property and equipment |
|
(1,025 |
) |
(651 |
) |
(5 |
) | |||
|
Investment in unevaluated oil and gas properties |
|
(33,781 |
) |
(14,041 |
) |
(227 |
) | |||
|
Increase in restricted cash |
|
(18,300 |
) |
— |
|
— |
| |||
|
Proceeds from sale of interest in unevaluated oil and gas properties |
|
— |
|
25,001 |
|
— |
| |||
|
Proceeds from the sale of assets |
|
— |
|
— |
|
32 |
| |||
|
Purchase of short-term investments |
|
(55,717 |
) |
— |
|
— |
| |||
|
Cash provided by (used in) investing activities — continuing operations |
|
(108,823 |
) |
10,309 |
|
(200 |
) | |||
|
Cash provided by investing activities — discontinued operations |
|
— |
|
881 |
|
1,739 |
| |||
|
Net cash provided (used) by investing activities |
|
(108,823 |
) |
11,190 |
|
1,539 |
| |||
|
|
|
|
|
|
|
|
| |||
|
CASH FLOWS FROM FINANCING ACTIVITIES: |
|
|
|
|
|
|
| |||
|
Proceeds from issuance of stock and warrants, net of offering costs of $7,751 and $1,285 |
|
165,999 |
|
17,200 |
|
— |
| |||
|
Proceeds from exercise of options |
|
906 |
|
— |
|
— |
| |||
|
Proceeds from exercise of warrants |
|
7,709 |
|
4,414 |
|
— |
| |||
|
Proceeds from convertible debt |
|
— |
|
— |
|
5,000 |
| |||
|
Placement fees on convertible debentures |
|
— |
|
— |
|
(300 |
) | |||
|
Financing costs deducted from convertible debentures |
|
— |
|
— |
|
(30 |
) | |||
|
Prepayment penalty on notes payable |
|
— |
|
— |
|
(271 |
) | |||
|
Payments of dividends payable — related party |
|
— |
|
(430 |
) |
— |
| |||
|
Payments on notes payable and installment debt |
|
(160 |
) |
(730 |
) |
(2,117 |
) | |||
|
Cash provided by financing activities — continuing operations |
|
174,454 |
|
20,454 |
|
2,282 |
| |||
|
Cash used in financing activities — discontinued operations |
|
— |
|
— |
|
(10 |
) | |||
|
Net cash provided by financing activities |
|
174,454 |
|
20,454 |
|
2,272 |
| |||
|
|
|
|
|
|
|
|
| |||
|
(DECREASE) INCREASE IN CASH AND CASH EQUIVALENTS |
|
53,849 |
|
24,680 |
|
(120 |
) | |||
|
CASH AND CASH EQUIVALENTS AT BEGINNING OF YEAR |
|
26,040 |
|
1,360 |
|
1,480 |
| |||
|
CASH AND CASH EQUIVALENTS AT END OF YEAR |
|
$ |
79,889 |
|
$ |
26,040 |
|
$ |
1,360 |
|
The accompanying notes are an integral part of these consolidated financial statements.
|
SUPPLEMENTAL DISCLOSURES: |
|
|
|
|
|
|
| |||
|
Interest paid in cash |
|
$ |
10 |
|
$ |
69 |
|
$ |
473 |
|
|
Income taxes paid in cash |
|
$ |
— |
|
$ |
— |
|
$ |
— |
|
|
|
|
|
|
|
|
|
| |||
|
NON-CASH INVESTING and FINANCING TRANSACTIONS |
|
|
|
|
|
|
| |||
|
|
|
|
|
|
|
|
| |||
|
Common stock issued for accounts payable |
|
$ |
— |
|
$ |
— |
|
$ |
321 |
|
|
Common stock issued to settle variable share obligation |
|
— |
|
181 |
|
— |
| |||
|
Payment of preferred stock dividends in common shares |
|
— |
|
— |
|
7 |
| |||
|
Common stock issued for oil and gas properties |
|
— |
|
— |
|
40 |
| |||
|
Common stock issued for prepaid legal services |
|
— |
|
— |
|
99 |
| |||
|
Stock issued for deferred financing costs |
|
— |
|
— |
|
103 |
| |||
|
Deemed dividend attributable to repriced warrants originally issued with purchase of common stock |
|
— |
|
322 |
|
— |
| |||
|
Discount on modified debt attributable to repriced warrants |
|
— |
|
— |
|
106 |
| |||
|
Debt discount on convertible debt |
|
— |
|
— |
|
2,372 |
| |||
|
Conversion of notes payable to common stock, net of discount |
|
— |
|
— |
|
2,038 |
| |||
|
Asset retirement obligation transferred as part of sale of assets |
|
— |
|
18 |
|
783 |
| |||
|
Accounts payable for oil and gas property |
|
1,353 |
|
434 |
|
82 |
| |||
|
Note payable for prepaid insurance |
|
— |
|
275 |
|
32 |
| |||
|
Accrued and unpaid dividend to related parties |
|
— |
|
— |
|
97 |
| |||
|
Conversion of Series B Preferred Stock into Common Stock |
|
— |
|
16 |
|
— |
| |||
|
Fair value of warrant modifications |
|
— |
|
480 |
|
— |
| |||
|
Relative fair value of warrants issued in connection with equity offerings |
|
— |
|
3,839 |
|
— |
| |||
|
Conversion of debt, net of discount of $1,116 |
|
— |
|
1,294 |
|
— |
| |||
|
Discount of convertible debt modification |
|
— |
|
1,172 |
|
— |
| |||
|
Exercise of warrants classified as a derivative |
|
1,354 |
|
723 |
|
— |
| |||
|
Reclassification of warrants as a derivative under ASC 815 |
|
— |
|
1,585 |
|
— |
| |||
|
Common stock issued for Series A settlement |
|
372 |
|
— |
|
— |
| |||
The accompanying notes are an integral part of these consolidated financial statements.
HYPERDYNAMICS CORPORATION
NOTES TO CONSOLIDATED FINANCIAL STATEMENTS
1. ORGANIZATION AND SIGNIFICANT ACCOUNTING POLICIES
Nature of business
Hyperdynamics Corporation (“Hyperdynamics,” the “Company,” “we,” and “our”) is a Delaware corporation formed in March 1996. Hyperdynamics has three wholly-owned subsidiaries, SCS Corporation (SCS), HYD Resources Corporation (HYD) and Hyperdynamics Oil & Gas Limited. Through SCS and its wholly-owned subsidiary, SCS Corporation Guinea SARL (SCSG), which is a Guinea limited liability company formed under the laws of the Republic of Guinea (“Guinea”) located in Conakry, Guinea, Hyperdynamics focuses on oil and gas exploration offshore the coast of West Africa. Our exploration efforts are pursuant to a Hydrocarbon Production Sharing Contract, as amended (the “PSC”). We refer to the rights granted under the PSC as the “Concession.” SCS began operations in oil and gas exploration, seismic data acquisition, processing, and interpretation in late fiscal 2002. In April 2004, Hyperdynamics acquired HYD, and in January 2005, HYD acquired Trendsetter Production Company (Trendsetter), an oil and gas operator in Louisiana that had been under common ownership with HYD. Trendsetter operated all of our domestic oil and gas assets until the sale of those assets in 2009. Trendsetter was sold on June 30, 2011. Hyperdynamics Oil & Gas Limited was formed in February 2011in the United Kingdom to support business development activities.
Principles of Consolidation
The accompanying consolidated financial statements include the accounts of Hyperdynamics and its wholly-owned subsidiaries. All significant intercompany accounts and transactions have been eliminated in consolidation. The financial statements have been prepared in accordance with accounting principles generally accepted in the United States and the rules of the Securities and Exchange Commission (“SEC”). Certain amounts have been reclassified to present our sale of domestic oil and gas properties as discontinued operations. See Note 3, Sales of Oil and Gas Properties, Assets Held for Sale and Discontinued Operations, for further discussion.
Use of Estimates
The preparation of the consolidated financial statements in conformity with accounting principles generally accepted in the United States requires management to make estimates and assumptions that affect the reported amounts of assets, liabilities and expenses at the balance sheet date and for the period then ended. Actual results could differ from these estimates.
Cash and cash equivalents
Cash equivalents are highly liquid investments with an original maturity of three months or less.
The Company maintains its cash in bank deposit accounts which, at times, exceed the federally insured limits. Accounts are guaranteed by the FDIC up to $250,000 in 2011 and in 2010, respectively. At June 30, 2011, the Company had approximately $78,032,000 in excess of FDIC limits. The Company has not experienced any losses in such accounts.
Restricted cash
Included in restricted cash is $18,300,000 held in escrow with Chase bank relating to our drilling contract with AGR Peak Well Management Ltd (“AGR”). Under the terms of the drilling contract, we will fund the escrow account for the sole purpose of funding our drilling project as overseen by AGR. As work is performed and invoiced, AGR will submit draw documents to us and funds will be released under the terms of the agreement.
Joint interest receivable and allowance for doubtful accounts
The Company establishes provisions for losses on accounts receivable if it determines that it will not collect all or part of the outstanding balance. Accounts receivable are written down to reflect management’s best estimate or realizability based upon known specific analysis, historical experience, and other currently available evidence of the net collectible amount. There is no allowance for doubtful accounts as of June 30, 2011 or 2010. At June 30, 2011, all of our accounts receivable balance was related to joint interest billings to Dana Petroleum (E&P) Limited (“Dana”), which owns a 23% participating interest in our Guinea Concession.
Securities classified as available-for-sale and held to maturity
Management determines the appropriate classification of debt securities at the time of purchase and reevaluates such designation as of each balance sheet date. Marketable equity securities and debt securities not classified as held-to maturity are classified as available-for-sale.
Available-for-sale securities are carried at fair value, with unrealized gains and losses, net of tax, reported in other comprehensive income. Realized gains and losses, and declines in value deemed to be other-than-temporary, are included in earnings.
Debt securities are classified as held to maturity when the Company has the positive intent and the ability to hold the securities to maturity. Held-to-maturity securities are stated at amortized cost, adjusted for amortization of premiums and accretion of discounts to maturity computed under the effective interest method. Such amortization is included in earnings. Interest on securities classified as held-to maturity is included in earnings.
The cost of securities sold is based on the specific identification method. Interest and dividends on securities classified as available-for-sale are included in earnings.
Oil and Gas Properties
Full Cost Method
We account for oil and natural gas producing activities using the full cost method of accounting as prescribed by the United States Securities and Exchange Commission (SEC). Accordingly, all costs incurred in the acquisition, exploration, and development of proved oil and natural gas properties, including the costs of abandoned properties, dry holes, geophysical costs and annual lease rentals are capitalized. All general and administrative corporate costs unrelated to drilling activities are expensed as incurred. Sales or other dispositions of oil and natural gas properties are accounted for as adjustments to capitalized costs, with no gain or loss recorded unless the ratio of capitalized costs to proved reserves would significantly change, or to the extent that the sale proceeds exceed our capitalized costs. Depletion of evaluated oil and natural gas properties would be computed on the units of production method based on proved reserves. The net capitalized costs of proved oil and natural gas properties are subject to quarterly impairment tests.
Costs Excluded
Costs associated with unevaluated properties are excluded from the full cost pool until we have made a determination as to the existence of proved reserves. We review our unevaluated properties at the end of each quarter to determine whether the costs incurred should be transferred to the full cost pool and thereby subject to amortization.
We assess all items classified as unevaluated property on a quarterly basis for possible impairment or reduction in value. We assess properties on an individual basis or as a group if properties are individually insignificant. The assessment includes consideration of the following factors, among others: intent to drill; remaining lease term under our concession; geological and geophysical evaluations; drilling results and activity; the assignment of proved reserves; and the economic viability of development if proved reserves are assigned. We assess our unevaluated properties on a country-by-country basis. During any period in which these factors indicate an impairment, the adjustment is recorded through earnings of the period.
Property and Equipment, other than Oil and Gas
Property and equipment are stated on the basis of historical cost less accumulated depreciation. Depreciation is provided using the straight-line method over the estimated useful lives of the assets, generally three to five years.
Provision for Impairments of Long-lived Assets
Long-lived assets are reviewed for impairment annually or whenever events or changes in circumstances indicate that the carrying amount of an asset may not be recoverable. Impairment loss recognized is the excess of the carrying amount over the fair value of the asset. Any impairment charge is recorded through current period earnings. We recognized no impairment charges in the years ended June 30, 2011, 2010 or 2009, respectively.
Deferred Rent
Accounting principles generally accepted in the United States require rent expense to be recognized on a straight-line basis over the lease term. Rent holidays, rent concessions, rent escalation clauses and certain other lease provisions are recorded on a straight-line basis over the lease term (including one renewal option period if renewal is reasonably assured based on the imposition of an economic penalty for failure to exercise the renewal option). The difference between the rent due under the stated lease agreement compared to that of the straight-line basis is recorded as deferred rent. The short-term portion is the portion which is scheduled to reverse within twelve months of the balance sheet date and it is included in accounts payable and accrued expenses. At the beginning of our office lease, we received a free rent period, which began in March 2010 and will end in November 2010. During the free rent period from March 2010 to November 30, 2010, we recorded $140,000 of deferred rent, which is being amortized over the life of the lease.
Income Taxes
We account for income taxes in accordance with ASC 740, “Income Taxes,” which requires the recognition of deferred tax assets and liabilities for the expected future tax consequences of temporary difference between the tax and financial reporting basis of assets and liabilities and for loss and credit carryforwards. Valuation allowances are provided when recovery of deferred tax assets is not considered likely.
Tax benefits are recognized only for tax positions that are more likely than not to be sustained upon examination by tax authorities. The amount recognized is measured as the largest amount of benefit that is greater than 50 percent likely to be realized upon ultimate settlement. Unrecognized tax benefits are tax benefits claimed in our tax returns that do not meet these recognition and measurement standards. For the year ended June, 30, 2011 the Company has no unrecognized tax benefits.
Our policy is to recognize potential interest and penalties accrued related to unrecognized tax benefits within income tax expense. For the years ended June 30, 2011, 2010 and 2009, we did not recognize any interest or penalties in our consolidated statement of operations, nor did we have any interest or penalties accrued on our consolidated balance sheet at June 30, 2011 and 2010 relating to unrecognized benefits.
The tax years 2006-2010 remain open to examination for federal income tax purposes and by the other major taxing jurisdictions to which we are subject.
Stock-Based Compensation
ASC 718, “Compensation-Stock Compensation” requires recognition in the financial statements of the cost of employee services received in exchange for an award of equity instruments over the period the employee is required to perform the services in exchange for the award (presumptively the vesting period). We measure the cost of employee services received in exchange for an award based on the grant-date fair value of the award. We account for non-employee share-based awards based upon ASC 505-50, “Equity-Based Payments to Non-Employees.”
Earnings Per Share
Basic loss per common share has been computed by dividing net loss by the weighted average number of shares of common stock outstanding during each period and after any preferred stock dividend requirements. In period of earnings, diluted earnings per common share are calculated by dividing net income available to common shareholders by weighted-average common shares outstanding during the period plus weighted-average dilutive potential common shares. Diluted earnings per share calculations assume, as of the beginning of the period, exercise of stock options and warrants using the treasury stock method. Convertible securities are included in the calculation during the time period they are outstanding using the if-converted method.
All potential dilutive securities, including potentially dilutive options, warrants and convertible securities, if any, were excluded from the computation of dilutive net loss per common share for the years ended June 30, 2011, 2010 and 2009, respectively, as their effects are antidilutive due to our net loss for those periods.
Stock options to purchase approximately 9.3 million common shares at an average exercise price of $1.85 and warrants to purchase approximately 3.9 million shares of common stock at an average exercise price of $1.26 were outstanding at June 30, 2011. Using the treasury stock method, had we had net income, approximately 3.7 million common shares attributable to our outstanding stock options and 2.7 million common shares attributable to our outstanding warrants to purchase common shares would have been included in the fully diluted earnings per share calculation for the year ended June 30, 2011.
Stock options to purchase approximately 8.0 million common shares at an average exercise price of $0.91 and warrants to purchase approximately 11.1 million common shares at an average exercise price of $1.25 were outstanding at June 30, 2010. Using the treasury stock method, had we had net income, approximately 0.9 million common shares attributable to our then outstanding stock options and 0.6 million common shares attributable to our then outstanding warrants would have been included in the fully diluted earnings per share calculation for the year period ended June 30, 2010.
Stock options to purchase approximately 2.2 million common shares at an average exercise price of $3.27 and warrants to purchase approximately 10.3 million common shares at an average exercise price of $1.99 were outstanding at June 30, 2009. Using the treasury stock method, had we had net income, approximately 0.02 million common shares attributable to our then outstanding stock options and 0.03 million common shares attributable to our then outstanding warrants would have been included in the fully diluted earnings per share calculation for the year period ended June 30, 2009.
Contingencies
We are subject to legal proceedings, claims and liabilities which arise in the ordinary course of business. We accrue for losses associated with legal claims when such losses are probable and can be reasonably estimated. These accruals are adjusted as additional information becomes
available or circumstances change. Legal fees are charged to expense as they are incurred. See Note 13, Commitments and Contingencies, for more information on legal proceedings.
Accumulated Other Comprehensive Income, net of tax
We follow the provisions of ASC 220, Comprehensive Income, which establishes standards for reporting comprehensive income. In addition to net income, comprehensive income or loss includes all changes to equity during a period, except those resulting from investments and distributions to the owners of the Company. At June 30, 2011, we had a balance in “Accumulated other comprehensive loss, net of income tax” on the accompanying balance sheet of $0.3 million. The components of accumulated other comprehensive loss and related tax effects for 2011 were as follows (in thousands):
|
|
|
Gross |
|
Tax Effect |
|
Net of Tax |
| |||
|
|
|
|
|
|
|
|
| |||
|
Accumulated other comprehensive loss at June 30, 2010 |
|
$ |
— |
|
$ |
— |
|
$ |
— |
|
|
Change in fair value of available-for-sale securities |
|
349 |
|
— |
|
349 |
| |||
|
Accumulated other comprehensive loss at June 30, 2011 |
|
$ |
349 |
|
$ |
— |
|
$ |
349 |
|
Total comprehensive loss was $11.6 million in fiscal year 2011.
Financial instruments
The accounting standards (ASC 820, Fair Value Measurements and Disclosures) regarding fair value of financial instruments and related fair value measurements define fair value, establish a three-level valuation hierarchy for disclosures of fair value measurement, and enhance disclosure requirements for fair value measures.
The three levels are defined as follows:
|
· |
Level 1 - inputs to the valuation methodology are quoted prices (unadjusted) for identical assets or liabilities in active markets. |
|
|
|
|
· |
Level 2 - inputs to the valuation methodology include quoted prices for similar assets and liabilities in active markets, and inputs that are observable for the asset or liability, either directly or indirectly, for substantially the full term of the financial instrument. |
|
|
|
|
· |
Level 3 - inputs to the valuation methodology are unobservable and significant to the fair value measurement. |
Financial assets and liabilities are classified in their entirety based on the lowest level of input that is significant to the fair value measurement. As of June 30, 2011, we held investments which were classified as available for sale securities and therefore must be recorded at their fair value at each reporting date. Available-for-sale investments, which consist entirely of Corporate Debt securities, are valued at the closing price reported in the active market in which the debt is traded.
Additionally, we have determined that certain warrants outstanding during the periods covered by these financial statements qualified as derivative financial instruments under the provisions of FASB ASC Topic No. 815-40, Derivatives and Hedging — Contracts in an Entity’s Own Stock. These warrant agreements included provisions designed to protect holders from a decline in the stock price (‘down-round’ provision) by reducing the exercise price in the event we issue equity shares at a price lower than the exercise price of the warrants. As a result of this down-round provision, the exercise price of these warrants could be modified based upon a variable that is not an input to the fair value of a ‘fixed-for-fixed’ option as defined under FASB ASC Topic No. 815-40 and consequently, these warrants must be treated as a liability and recorded at fair value at each reporting date.
The fair value of these warrants was determined using a lattice model, with any change in fair value during the period recorded in earnings as “Other income (expense) — Gain (loss) on warrant derivative liability.” As a result, the derivative warrant liability was carried on the balance sheet at its fair value.
Significant Level 3 inputs used to calculate the fair value of the warrants include the stock price on the valuation date, expected volatility, risk-free interest rate and management’s assumptions regarding the likelihood of a future repricing of these warrants pursuant to the down-round provision.
The following table sets forth by level within the fair value hierarchy, our financial assets and liabilities (in thousands) that were accounted for at fair value on a recurring basis as of June 30, 2011:
|
|
|
Carrying |
|
Fair Value Measurement at June 30, 2011 |
| ||||||||
|
|
|
June 30, 2011 |
|
Level 1 |
|
Level 2 |
|
Level 3 |
| ||||
|
Assets: |
|
|
|
|
|
|
|
|
| ||||
|
Available-for-sale securities |
|
$ |
55,368 |
|
$ |
55,368 |
|
$ |
— |
|
$ |
— |
|
|
Liabilities: |
|
|
|
|
|
|
|
|
| ||||
|
Warrant derivative liability |
|
$ |
— |
|
$ |
— |
|
$ |
— |
|
$ |
— |
|
The following table sets forth the changes in the fair value measurement of our Level 3 warrant derivative liability:
|
Beginning balance — July 1, 2010 |
|
$ |
583 |
|
|
|
|
|
| |
|
Change in fair value of derivative liability |
|
771 |
| |
|
|
|
|
| |
|
Reduced for warrants exercised and reclassified to additional paid-in capital |
|
(1,354 |
) | |
|
|
|
|
| |
|
Balance at June 30, 2011 |
|
$ |
— |
|
The $771,000 change in fair value during the year ended June 30, 2011, was recorded as an increase to the derivative liability and as a non-cash loss in our statement of operations. For the year ended June 30, 2010, we incurred a $279,000 non-cash gain.
All of the remaining warrants underlying this derivative liability were exercised in October 2010. At June 30, 2011, there is no remaining derivative liability balance.
See discussion of changes in the fair value of available-for-sale securities within Note 6.
Recently issued or adopted accounting pronouncements
Recently issued or adopted accounting pronouncements are not expected to have, or did not have, a material impact on our financial position or results from operations.
Subsequent Events
The Company evaluated all subsequent events from June 30, 2011 through the date of this issuance of the financial statements.
2. CORRECTIONS OF IMMATERIAL ERRORS
During the fourth quarter of fiscal year 2011, we identified certain errors in our previously issued financial statements pertaining to the income statement classification of a gain on the sale of an interest in unevaluated oil and gas properties in our fiscal year 2010, our status as an Exploration Stage company and the related disclosure which began on July 1, 2009 and within our deferred tax disclosure. We evaluated the materiality of the errors from both a qualitative and a quantitative perspective and concluded that these errors are immaterial to our previously issued consolidated financial statements. We have corrected the consolidated financial statements presented herein to reflect the correction of these errors.
The gain on sale of interest in unevaluated oil and gas interest in the amount of $2.955 million was previously reported as other income within our income statement and now has been correctly classified as operating income within our income statement. This has resulted in previously reported Loss from operations of $11.003 million and Total other income (expense) of $2.229 million being corrected to Loss from operations of $8.048 million and Total other income (expense) of $(0.726) million. Loss from continuing operations and net loss remains unchanged.
With the sale of all of the Company’s domestic producing oil and gas assets, we entered the fiscal year beginning July 1, 2009 with no proved oil and gas reserves and no longer had any revenue stream. As a result, our Guinean Concession represented our only remaining operating asset. We concluded in fiscal 2010, based on ASC 915 “Accounting and Reporting by Development Stage Enterprises,” that we had therefore reentered the Exploration stage effective July 1, 2009. For Financial Reporting purposes, we followed the guidance to reflect disclosure requirements for entities in the “Development Stage” which included a balance sheet, including any cumulative net losses reported with a descriptive caption such as “deficit accumulated after reentering the exploration stage” in the stockholders’ equity section, an income statement, cash flow statement and statement of stockholders’ equity showing cumulative amounts from the date of reentry into the exploration stage. We have
since concluded that because we remained in the same principal business, as an oil and gas company, that the guidance within ASC 915 does not apply to operating companies and accordingly we have removed the additional financial disclosures discussed above. This has resulted in previously reported Accumulated deficit of $67.625 million and Deficit accumulated after reentering the exploration stage of $8.009 million being corrected to reflect the total Accumulated deficit as of $75.624 million. Total equity remains unchanged.
The corrections related to deferred income tax balances are as follows:
|
|
|
As previously |
|
Increase |
|
As corrected |
| |||
|
(in thousands) |
|
2010 |
|
(decrease) |
|
2010 |
| |||
|
Deferred tax assets: |
|
|
|
|
|
|
| |||
|
Net operating loss carryforwards |
|
$ |
16,713 |
|
$ |
557 |
|
$ |
17,270 |
|
|
Stock compensation |
|
— |
|
1,891 |
|
1,891 |
| |||
|
Other |
|
— |
|
20 |
|
20 |
| |||
|
Total deferred tax assets |
|
16,713 |
|
2,468 |
|
19,181 |
| |||
|
Deferred tax liability: |
|
|
|
|
|
|
| |||
|
Depreciation |
|
— |
|
— |
|
— |
| |||
|
Total Deferred tax liabilities |
|
— |
|
— |
|
— |
| |||
|
Valuation allowance for deferred tax assets |
|
(16,713 |
) |
(2,468 |
) |
(19,181 |
) | |||
|
Net deferred tax asset |
|
$ |
— |
|
— |
|
$ |
— |
| |
The error was the result of an incorrect calculation of our net operating loss carryforwards as of June 30, 2010 as well as a failure to disclose the deferred tax balances associated with stock compensation and other immaterial temporary differences. The June 30, 2010 deferred tax balances have been corrected within Note 10 to the consolidated financial statements. The error in our previously disclosed deferred tax balances did not impact our consolidated balance sheets or statements of operations given the change in deferred tax balances was fully offset by a change in the valuation allowance.
3. SALES OF OIL AND GAS PROPERTIES, ASSETS HELD FOR SALE AND DISCONTINUED OPERATIONS
On April 1, 2009, management executed a contract to sell the working interest in all of its domestic oil and gas properties in a transaction that was accounted for as three sales. The liabilities associated with the working interest in the oil and gas properties, asset retirement obligations were transferred with the assets. The transaction was completed during August 2009. The Company received scheduled payments of $1,030,000 and $820,000 during May 2009. The final payment of $820,000 was received in August 2009.
These assets, which were associated with HYD Resources, our domestic business segment, are a disposal group and constitute a component of the entity with distinguishable cash flows. Accordingly, these assets and cash flows and results of operations associated with these assets are classified as discontinued operations in the accompanying consolidated statements of operations, consolidated balance sheets, and consolidated statements of cash flows for all periods presented.
Assets held for sale as of June 30, 2009 consisted of land and a building in Trout, Louisiana, and working interests in our remaining domestic oil and gas properties. The remaining properties were sold in August 2009. The following assets and liabilities have been segregated and classified as assets held for sale and liabilities associated with assets held for sale, as appropriate, in the consolidated balance sheets as of June 30, 2011, 2010 and 2009. The amounts presented below do not include cash, or payables, which will be retained by Hyperdynamics.
|
|
|
June 30, |
| |
|
(in thousands) |
|
2009 |
| |
|
|
|
|
| |
|
Assets held for sale |
|
|
| |
|
Land and building, net of accumulated depreciation of $7,000 |
|
$ |
43 |
|
|
Oil and gas equipment |
|
|
| |
|
Oil and Gas Properties, net of impairment of $576,000 |
|
102 |
| |
|
Assets held for sale and discontinued operations |
|
$ |
145 |
|
|
|
|
|
| |
|
Liabilities related to assets held for sale and discontinued operations |
|
|
| |
|
Asset retirement obligations |
|
$ |
18 |
|
The following summarized financial information for the years ended June 30, 2011, 2010 and 2009 relates to the assets held for sale and has been reported as discontinued operations for all periods presented.
|
|
|
Year ended June 30, |
| ||||
|
(in thousands) |
|
2010 |
|
2009 |
| ||
|
Revenues |
|
$ |
— |
|
$ |
2,397 |
|
|
Costs and Expenses: |
|
|
|
|
| ||
|
Lease operating costs |
|
— |
|
(1,331 |
) | ||
|
Depreciation, depletion, and amortization |
|
— |
|
(527 |
) | ||
|
Accretion |
|
— |
|
(71 |
) | ||
|
Impairment and other expenses |
|
— |
|
(2,303 |
) | ||
|
Gain on settlement of debt |
|
— |
|
144 |
| ||
|
Other expenses |
|
— |
|
(162 |
) | ||
|
Gain on sale of discontinued operations |
|
765 |
|
2,259 |
| ||
|
Income from discontinued operations |
|
$ |
765 |
|
$ |
406 |
|
4. PROPERTY AND EQUIPMENT
A summary of property and equipment as of June 30, 2011 and 2010 is as follows:
|
|
|
|
|
June 30, |
| ||||
|
(in thousands) |
|
Useful Life |
|
2011 |
|
2010 |
| ||
|
Computer equipment and software |
|
3 years |
|
$ |
1,092 |
|
$ |
415 |
|
|
Office equipment and furniture |
|
5 years |
|
455 |
|
224 |
| ||
|
Vehicles |
|
3 years |
|
282 |
|
200 |
| ||
|
|
|
|
|
|
|
|
| ||
|
Leasehold improvements |
|
3 years |
|
305 |
|
270 |
| ||
|
|
|
|
|
|
|
|
| ||
|
Total Cost |
|
|
|
2,134 |
|
1,109 |
| ||
|
Less - Accumulated depreciation |
|
|
|
(798 |
) |
(445 |
) | ||
|
|
|
|
|
$ |
1,336 |
|
$ |
664 |
|
We review assets for impairment whenever events or changes in circumstances indicate that the carrying amount of an asset may not be recoverable. As of June 30, 2011 and 2010, there were no impairments of property and equipment.
5. INVESTMENT IN OIL AND GAS PROPERTIES
Investment in oil and gas properties consists of our Guinea concession in offshore West Africa. We own a 77% participating interest in our Guinea Concession.
Excluded Costs
Hyperdynamics excludes capitalized costs of unevaluated oil and gas properties from amortization. Currently, geological and geophysical information pertaining to the Guinea concession is being collected and evaluated and no reserves have been attributed to this concession. The net costs associated with such unproved properties of $36,200,000 and $92,000 as of June 30, 2011 and 2010, respectively, are excluded from amounts subject to amortization. The majority of the evaluation activities are expected to be completed within the next year. As of June 30, 2011, based on our impairment review and our intent to continue evaluation activities, there was no impairment indicated for our excluded costs.
During the year ended June 30, 2011, we incurred $26,882,000 of geological and geophysical costs, primarily related to our 3D seismic acquisition and processing work which commenced in August 2010, and we incurred $9,226,000 of other exploration costs for our Guinea Concession during the year ended June 30, 2011, primarily related to the purchase of long lead tangible drilling items such as wellheads and tubular items to prepare for the drilling of our first well expected to commence in the fourth quarter of this calendar year. Internal costs incurred that are directly identified with exploration, development, and acquisition activities undertaken by us for our own account, and which are not related to production, general corporate overhead, or similar activities, are capitalized. For the year ended June 30, 2011, we capitalized $4,001,000 of such costs. Internal costs eligible for capitalization for periods prior to July 1, 2010 were not significant.
We incurred $15,417,000 of geological and geophysical costs for our Guinea Concession during the year ended June 30, 2010. In May 2010, upon obtaining the Republic of Guinea Presidential decree for the amended PSC and an arrête that officially allowed Dana to participate in the PSC, Dana paid us a cash purchase price of $19.6 million for their 23% participation interest. We recorded the $19.6 million received from Dana as a reduction in the carrying value of our Guinea Concession and, after reducing our investment to zero, we recognized a gain of
$2,955,000, which represented the excess of the $19.6 million over our net remaining investment in the Guinea Concession as of the date the funds were received. Subsequent to reducing our investment in the Guinea Concession to zero, we incurred $92,000 of additional costs, which represent the carrying value at June 30, 2010.
Guinea Concession
We have been conducting exploration work related to the area off the coast of Guinea since 2002. On September 22, 2006, we, acting through SCS, entered into the PSC with Guinea. Under that agreement, we were granted certain exclusive contractual rights by Guinea to explore and exploit offshore oil and gas reserves, if any, off the coast of Guinea. We are conducting our current work in Guinea under the PSC, as amended on March 25, 2010.
The PSC Amendment clarified that we retained a Contract Area of approximately 9,650 square miles, which is approximately equivalent to 30% of the original Contract Area under the PSC, following a December 31, 2009 relinquishment of approximately 70% of the original Contract Area. The PSC Amendment requires that we relinquish an additional 25% of the retained Contract Area by September 30, 2013. Under the terms of the PSC Amendment, the first exploration period ended and the Company entered into the second exploration period on September 21, 2010. The second exploration period runs until September 2013, may be renewed to September 2016 and may be extended for one (1) additional year to allow the completion of a well in process and for two (2) additional years to allow the completion of the appraisal of any discovery made. Under the PSC Amendment, we are required to drill an exploration well, which is to be commenced by the year-end 2011, to a minimum depth of 2,500 meters below seabed and to drill an additional exploration well, which is to be commenced by the end of September 2016, to a minimum depth of 2,500 meters below seabed. The PSC Amendment requires the expenditure of $15 million on each of the exploration wells ($30 million in the aggregate). We are also required to acquire a minimum of 2,000 square kilometers of 3D seismic by September 2013 with a minimum expenditure of $12 million. Fulfillment of work obligations exempts us from expenditure obligations and exploration work in excess of minimum work obligations for each exploration period may be carried forward to the following exploration period.
Under the PSC Amendment, Guinea may participate in development of any discovery at a participating interest of up to 15% of costs being carried for its share. The cost of that carry is to be recovered out of 62.5% of Guinea’s share of cost and profit oil. The PSC Amendment removed the right of first refusal held by us covering the relinquished acreage under the original PSC. The PSC Amendment clarified that only those eligible expenditures, which were made following the date the PSC was signed, on September 22, 2006, are eligible for cost recovery. We are required to establish an annual training budget of $200,000 for the benefit of Guinea’s oil industry personnel, and we are also obliged to pay an annual surface tax of $2.00 per square kilometer on our retained Concession acreage. The PSC Amendment also provides that should the Guinea government note material differences between provisions of the PSC Amendment and international standards or the Petroleum Code, the parties will renegotiate the relevant articles.
Under the PSC and PSC Amendment our Guinea Concession is subject to a 10% royalty interest to Guinea. Of the remaining 90% of the first production, we will receive 75% of the revenue for recovery of the cost of operations, and Guinea will receive 25%.
After recovery cost of operations, revenue will be split as outlined in the table below:
|
Daily production (b/d) |
|
Guinea Share |
|
HDY Share |
|
|
From 0 to 2,000 |
|
25 |
% |
75 |
% |
|
From 2,001 to 5,000 |
|
30 |
% |
70 |
% |
|
From 5,001 to 100,000 |
|
41 |
% |
59 |
% |
|
Over 100,001 |
|
60 |
% |
40 |
% |
The Guinea Government may elect to take a 15% working interest in any exploitation area.
In May 2010, the government of Guinea issued a Presidential Decree approving the PSC, as amended.
Assignment of Participating Interest
On December 4, 2009, we entered into a Sale and Purchase Agreement (“SPA”) with Dana Petroleum (E&P) Limited (“Dana”) for Dana to acquire a 23% participating interest in the PSC. On January 28, 2010, the Company closed on the transaction with Dana assigning it a minority interest in our Concession offshore Guinea. In connection with the closing of the transaction, we entered into an Assignment of Participating Interest (the “Assignment”) with Dana, a Deed of Assignment and Joint Operating Agreement (“JOA”). Pursuant to the Assignment, we assigned to Dana an undivided 23% of our participating interest in the contractual interests, rights, obligations and duties under the PSC. As required by the PSC, the Deed of Assignment was delivered as the necessary notice of the Assignment to be given to the Ministry of Mines, Energy and Hydraulics of Guinea.
As part of the obligation to bear the proportionate share of costs, the SPA required Dana to make a cash payment to us upon closing the assignment of the 23% participating interest to Dana in the amount of $ 1.7 million for Dana’s pro-rata portion of accrued expenditures
associated with our marine 2D seismic data acquisition program within the Contract Area. The $1.7 million payment was received by us on February 4, 2010 and was recorded as a reduction in the carrying value of our Concession.
The Operating Agreement appoints us as the operator for purposes of conducting oil and gas exploration and production activities within the retained Contract Area. We share operating costs of joint operations with Dana in proportion to the parties’ respective participating interests (Hyperdynamics, 77% and Dana, 23%). An operating committee and voting procedures are established in the JOA whereby managerial and technical representatives of the Company and Dana make decisions regarding joint operations, exploration and appraisal of commercial discoveries, and the disposition of commercial production. The JOA places restrictions upon the transfer of the parties’ respective participating interests in the form of a right of first purchase that is triggered by a proposed transfer or certain changes in control of us or Dana.
In May 2010, we received an administrative order from the Ministry of Mines and Geology of Guinea, referred to as an arrêté, confirming the Guinea government’s approval of the assignment of a 23% participating interest in the PSC, as amended, to Dana. On May 20, 2010, we received a payment of $19.6 million in cash from Dana as payment for the assigned 23% participating interest in the contractual interests, rights, obligations and duties under the PSC, as amended.
PGS Geophysical AS, Norway
On June 11, 2010, we entered into an Agreement for the Supply of Marine Seismic Data (“3D Seismic Contract”) with PGS Geophysical AS, Norway (“PGS”). Under the terms of the 3D Seismic Contract, PGS agreed to conduct the acquisition phase of a 3,635 square kilometer 3D seismic survey of the area that is subject to our rights, or concession, to explore and exploit offshore oil and gas reserves off the coast of Guinea. The intended purpose of the 3D seismic survey was to obtain detailed imaging of the multiple prospects which were identified from our prior 2D seismic data acquisition over the concession.
Under the terms of the 3D Seismic Contract, PGS agreed to carry out the survey in two separate portions that commenced in August 2010. The 3D Seismic Contract was initially for $21.0 million, including mobilization and demobilization expenses. The acquisition work was completed in December 2010, with a final cost under the 3D Seismic Contract of approximately $24.7 million, including mobilization and demobilization expenses. Our share of the cost was 77% of that amount, or approximately $19.0 million.
PGS Americas, Inc.
We contracted with PGS Americas, Inc. to process the data from the 3D seismic acquisition surveys. The seismic data processing contract was for $2.5 million. The processing work was completed in June 2011. The processing costs incurred as of June 30, 2011 amount to approximately $3,489,000 with our 77% share being approximately $2,686,000 and is capitalized in unevaluated oil and gas properties.
AGR Peak Well Management Limited
We have contracted with AGR Peak Well Management Limited (“AGR”) to manage our exploration drilling project in offshore Republic of Guinea. AGR will handle well construction project management services, logistics, tendering and contracting of materials as well as overall management responsibilities for the drilling program. The drilling project management contract, entered into on November 30, 2010, was for an estimated $6.8 million, of which we expect our 77% share to be $5.2 million of that amount. The costs incurred as of June 30, 2011 amount to $1,022,000 with our 77% share being $787,000 and is capitalized in unevaluated oil and gas properties. We have advanced to AGR $10.7 million on a gross basis, or $8.2 million for our current 77% interest, for them to purchase on our behalf long lead items such as wellhead and drilling pipe. These items will be delivered to us prior to our commencing drilling on this well, which is expected to commence in the second quarter of fiscal year 2012.
6. INVESTMENTS
The following is a summary of available-for-sale securities as of June 30, 2011:
|
(in thousands) |
|
Amortized Cost |
|
Unrealized gains |
|
Fair Value |
| |||
|
US corporate debt securities |
|
$ |
55,717 |
|
$ |
(349 |
) |
$ |
55,368 |
|
|
Total debt securities |
|
55,717 |
|
(349 |
) |
55,368 |
| |||
|
Equity securities |
|
— |
|
— |
|
— |
| |||
|
Total available-for-sale |
|
$ |
55,717 |
|
$ |
(349 |
) |
$ |
55,368 |
|
No available for sale securities were on hand as of June 30, 2010. The Company had no securities classified as held-to-maturity as of June 30, 2011 or June 30, 2010. All $55.4 million in debt securities on hand as of June 30, 2011 will mature within one year or less. The securities were purchased a premium with a yield to maturity of approximately 0.5%. If held to their maturity in second half of fiscal 2012 the interest income over the period held will exceed the mark-to-market loss reported for the period held.
At each reporting date, the Company performs an evaluation of debt and equity securities to determine if the unrealized losses are other-than-temporary. As of June 30, 2011 no other-than-temporary impairment losses have been recorded with regard to securities on hand as of June 30, 2011.
7. ACCOUNTS PAYABLE AND ACCRUED EXPENSES
Accounts payable and accrued expenses as of June 30, 2011 and 2010 include the following:
|
(in thousands) |
|
2011 |
|
2010 |
| ||
|
Accounts payable — Trade |
|
$ |
2,228 |
|
$ |
2,061 |
|
|
Accrued payroll and bonus |
|
364 |
|
1,362 |
| ||
|
Accrued — Other |
|
524 |
|
436 |
| ||
|
|
|
$ |
3,116 |
|
$ |
3,859 |
|
8. SHORT-TERM NOTES PAYABLE AND LONG-TERM DEBT
Short-term notes payable and long-term debt as of June 30, 2010 consists of the following:
|
(in thousands) |
|
2010 |
| |
|
|
|
|
| |
|
Installment notes payable |
|
$ |
160 |
|
|
Convertible debentures: |
|
|
| |
|
Gross |
|
— |
| |
|
Unamortized discount |
|
— |
| |
|
Net |
|
— |
| |
|
Total short term notes payable and long- term debt |
|
160 |
| |
|
Less: current portion |
|
(160 |
) | |
|
Long- term notes payable, net of discount |
|
$ |
— |
|
Installment notes payable
During the year ended June 30, 2010, Hyperdynamics financed an insurance policy for an aggregate amount of $178,000, with a down payment of $18,000. As of June 30, 2010, the net amount outstanding on these notes was $160,000. The notes were payable over nine months from inception in installments of approximately $18,000 per month and accordingly for the year ended June 30, 2011, payments of the remaining $160,000 were made. As of June 30, 2011, we have no such debt.
Convertible Debentures
On September 12, 2008, Hyperdynamics sold $5,000,000 convertible debentures, convertible at $2.25 per share, to an investor in a registered direct offering. Placement costs totaled $403,000, resulting in net cash proceeds of $4,670,000. The investor also received warrants to purchase 1,111,111 shares of common stock at $3.00 per share (“Series A”) and warrants to purchase 1,111,111 shares of common stock at $2.75 per share (“Series B”). The fair value of the warrants was $1,886,000, which was recorded as a discount on the convertible note. The warrants also contained beneficial conversions features with a fair value of $486,000, which was recorded as a discount on the convertible note.
During October 2008, the above investor converted $563,000 of debenture principal to common stock, resulting in the issuance of 250,000 shares of common stock and payment of cash of $89,000 for a portion of the associated make whole interest. The remaining make whole interest of $133,000 associated with these conversions was added to the debenture principal in November 2008 as discussed below.
In conjunction with the November 20, 2008 extinguishment discussed below, the investor converted $1,440,000 of the convertible debt ($3,254,000 of debenture principal, net of unamortized discount of $1,814,000 into 1,972,222 shares of common stock which was recognized as additional paid in capital. Also, on March 31, 2009, an additional $46,000 of principal was converted to 27,778 shares of common stock which was immediately recognized as additional paid in capital. On November 20, 2008, Hyperdynamics entered into an amendment agreement with the same debenture investor. The agreement reduced the conversion price of the convertible debentures to $1.65 per share, reduced the exercise price of the 2,424,243 warrants issued during May 2008 to $2 per share, and reduced the exercise price of the 1,111,111 Series A and Series B warrants each issued during September 2008 to $2.25 per share and $2.50 per share, respectively. The amendment also
provided a new interest payment option, payment in kind, by which interest, including any ‘make whole’ interest due, could be added to the outstanding principal amount of the Debenture.
The amendment resulted in a substantial modification of terms of the debt. Accordingly, Hyperdynamics recognized the amendment as an extinguishment of debt (the “2008 Extinguishment”) which provides that the fair value of the assets given to the investor to refund the existing debt was compared with the carrying value of the existing debt and a gain or loss be recognized. A gain on extinguishment of $56,000 was recognized in the year ended June 30, 2009. As a result of the 2008 Extinguishment, the post modification debt was recorded at its fair value of $1,963,000, which was determined based upon the value of the conversion feature in the debenture using the Company’s stock price on November 20, 2008 of $0.73 per share. The resulting debt discount of $2,474,000, which represented the difference between the stated principal amount of $4,438,000 and the fair value of the post modification debt and the fair value of the warrants of $106,000 that were repriced as part of the debt modification, was to be amortized as interest expense over the term of the convertible debentures. The post modification debt had an effective interest rate of 29% per annum.
On November 12, 2009, we entered into a Securities Purchase Agreement with the convertible debenture holder. Pursuant to the Securities Purchase Agreement and the terms of the convertible debenture, the conversion price of the convertible debenture was reduced from $1.65 per share to $0.95 per share, subject to no further adjustment other than for stock splits and stock dividends. Pursuant to FASB ASC Topic No. 470-20, “Debt with Conversion and Other Options,” we determined the reduction in the conversion price resulted in the recognition of a contingent beneficial conversion feature. The intrinsic value of the contingent beneficial conversion feature was $1,172,000, which was treated as additional discount on the outstanding convertible debenture balance of $1,590,000 on November 12, 2009.
During the year ended June 30, 2010, based upon the conversion prices of $1.65 and $0.95 per share, the convertible debenture investor converted a total principal amount, including interest accreted to principal, of $1,296,000 (net of a discount of $1,116,000) into 1,949,411 shares of our common stock. We paid approximately $525,000 to retire the remaining outstanding convertible debenture amount. We recognized a loss of approximately $298,000 for the year June 30, 2010, which represents the difference between the remaining convertible debenture amount outstanding, net of the unamortized discount associated with the contingent beneficial conversion feature discussed above, and the payoff amount. The beneficial conversion feature did not have any intrinsic value at the time the convertible debenture was paid off.
9. WARRANT DERIVATIVE LIABILITY
Effective July 1, 2009, we adopted FASB ASC Topic No. 815-40 (formerly EITF 07-05) which defines determining whether an instrument (or embedded feature) is indexed to an entity’s own stock. This guidance specifies that a contract that would otherwise meet the definition of a derivative but is both (a) indexed to our own stock and (b) classified in stockholders’ equity in the statement of financial position, would not be considered a derivative financial instrument and provides a new two-step model to be applied in determining whether a financial instrument or an embedded feature is indexed to an issuer’s own stock and thus able to qualify for the scope exception.
As a result of this adoption, certain warrants previously treated as equity pursuant to the derivative treatment exemption are no longer afforded equity treatment because these warrants have an adjustment provision applicable to the exercise price that adjusted the exercise price downward in the event we subsequently issued common stock, stock warrants, stock options or convertible debt with a stock price, exercise price or conversion price lower than YA Global’s exercise price, originally $2.00 per share. As a result, the warrants are not considered indexed to our stock, and as such, all future changes in the fair value of these warrants will be recognized currently in earnings in our consolidated statement of operations under the caption “Other income (expense) — Gain (loss) on warrant derivative liability” until such time as the warrants are exercised or expire.
The exercise price of certain warrants issued to YA Global Investments, LP (“YA Global”), which were completely exercised prior to December 31, 2010, were subject to adjustment in the event we subsequently issue common stock, stock warrants, stock options or convertible debt with a stock price, exercise price or conversion price lower than YA Global’s exercise price, originally $2.00 per share. If these provisions had triggered, YA Global would have received warrants to purchase additional shares of common stock and a reduction in the exercise price of all their warrants.
As such, effective July 1, 2009, we reclassified from additional paid-in capital, as a cumulative effect adjustment, $1,585,000 to Warrant Derivative Liability to recognize the fair value of the YA Global Warrants as if these warrants had been treated as a derivative liability since their issuance in February 2008.
In November 2009, the YA Global warrants, then totaling 666,666 were reset to an exercise price of $0.95 and into a total number of shares of 1,157,894. In December 2009, these warrants, then totaling 1,157,894 were reset to an exercise price of $0.90 and into 1,222,222 shares.
In April 2010, YA Global exercised 520,000 of these warrants on a cashless basis. This reduced the derivative liability by $722,000 and increased additional paid-in capital by the same amount. The fair value of the YA Global Warrants was $583,000 on June 30, 2010. We recognized a loss of $279,000 related to the change in the fair market value of these warrants during the year ended June 30, 2010.
In September 2010, YA Global exercised 468,611 of these warrants on a cashless basis. This reduced the derivative liability by $705,000 and increased additional paid-in capital by the same amount. During the three months ended September 30, 2010, we recognized a $771,000 non-cash loss related to the remaining YA Global warrants.
In October 2010, YA Global exercised its remaining warrants into 161,608 shares of stock on a cashless basis. As a result, we reduced the remaining derivative liability by $649,000 and increased additional paid-in capital by the same amount. No warrant derivative liability exists as of June 30, 2011.
These common stock purchase warrants do not trade in an active securities market, and as such, we estimate the fair value of these warrants using a Lattice Model using the following assumptions:
|
|
|
June 30, 2010 |
|
July 1, 2009 |
|
|
Annual dividend yield |
|
0.00 |
|
0.00 |
|
|
Expected life (years) |
|
2.61 |
|
3.61 |
|
|
Risk-free interest rate |
|
1.45 |
% |
1.40 |
|
|
Expected volatility |
|
133 |
% |
442 |
% |
|
Probability of below exercise price issuance |
|
10 |
% |
10 |
% |
Expected volatility is based on historical volatility of our common stock. The expected life is based on the remaining term of the warrants. The risk-free interest rate is based on U.S. Treasury securities according to the remaining term of the warrants. The expected dividend yield was based on our current and expected dividend policy. The Lattice Model includes our assessment of the likelihood of a future issuance of equity at a price lower than the current exercise price of the warrants.
10. INCOME TAXES
Federal Income taxes are not due since Hyperdynamics has had losses since inception. Hyperdynamics has net operating loss carryforwards of approximately $59,111,000 at June 30, 2011. Components of deferred tax assets as of June 30, 2011 and 2010 are as follows:
|
(in thousands) |
|
2011 |
|
2010 |
| ||
|
Deferred tax assets: |
|
|
|
|
| ||
|
Net operating loss carryforward |
|
$ |
20,689 |
|
$ |
17,270 |
|
|
Stock compensation |
|
1,951 |
|
1,891 |
| ||
|
Other |
|
12 |
|
20 |
| ||
|
Total deferred tax assets |
|
22,652 |
|
19,181 |
| ||
|
Deferred tax liability: |
|
|
|
|
| ||
|
Depreciation |
|
165 |
|
— |
| ||
|
Total Deferred tax liabilities |
|
165 |
|
|
| ||
|
Valuation allowance for deferred tax assets |
|
(22,487 |
) |
(19,181 |
) | ||
|
Net deferred tax asset |
|
$ |
— |
|
$ |
— |
|
The deferred tax asset generated by the loss carry-forward has been fully reserved due to the uncertainty that the Company will be able to realize the benefit from it.
Internal Revenue Code Section 382 restricts the ability to use these carryforwards whenever an ownership change, as defined, occurs. Hyperdynamics incurred such an ownership change on January 14, 1998 and again on June 30, 2001. As a result of the first ownership change, Hyperdynamics’ use of net operating losses as of January 14, 1998, of $949,000, are restricted to $151,000 per year. The availability of losses from that date through June 30, 2001 of $3,313,000 are restricted to $784,000 per year. Losses in fiscal 2002 and beyond are not restricted. The net operating loss carryforwards expire from 2018 to 2029.
The difference between the statutory tax rates and our effective tax rate is due to the valuation allowance applied against our deferred tax assets generated by net operating losses. A reconciliation of the actual taxes to the U.S. statutory tax rate for the years ended June 30, 2011, 2010 and 2009 is as follows:
|
(in thousands) |
|
2011 |
|
2010 |
|
2009 |
| |||
|
Income tax benefit at the statutory federal rate (35%) |
|
$ |
(3,933 |
) |
$ |
(2,803 |
) |
$ |
(3,125 |
) |
|
Increase resulting from nondeductible stock compensation |
|
(515 |
) |
— |
|
— |
| |||
|
Decrease resulting from nontaxable gain on derivative liability |
|
270 |
|
(98 |
) |
— |
| |||
|
Other, net |
|
14 |
|
— |
|
— |
| |||
|
Change in valuation |
|
4,164 |
|
2,901 |
|
3,125 |
| |||
|
Net |
|
$ |
— |
|
$ |
— |
|
$ |
— |
|
11. SHAREHOLDERS’ EQUITY
Series A Preferred Stock
In January 2000, we issued 3,000 shares of Series A Convertible Preferred Stock for net proceeds of $2,604,190. The stated value is $1,000 per share and par value is $0.001. This series is non-voting and has a dividend rate of 4%, payable at conversion in either cash or shares of common stock, at Hyperdynamics’ option. During 2000 and 2001, 1,055 shares were converted to common stock. As a result, 1,945 shares remained outstanding at June 30, 2010. By terms of the original agreement, the preferred shares are convertible into Hyperdynamics’ common stock at a price equivalent to the lower of the trading price when purchased of $5.25 or 80% of the current 5-day trading average. All or any of the stock may be converted at any time at the holder’s option. According to the terms of the agreement, all preferred shares outstanding as of January 30, 2002 were to be automatically converted to common stock. If the Series A stock had been converted at that time, approximately 4,862,000 shares of common stock would have been issued. This conversion did not occur because of legal claims filed by both the Series A shareholders and Hyperdynamics against each other.
Since the outcome was not known and no conversion had been effected, Hyperdynamics continued to accrue dividends on the 1,945 shares through September 30, 2004. Management evaluated the accrual as of September 30, 2004 and determined the accrual should be discontinued. Management reevaluates the accrual periodically and considers the current accrual to be adequate to cover the liability, if any, pursuant to the lawsuit.
On December 30, 2010, we entered into a settlement agreement pursuant to which we issued 239,437 shares of our common stock in connection with the conversion of 1,945 outstanding shares of Series A Preferred Stock. As part of the settlement, we were relieved of any Series A Preferred Stock dividend payments, two former officers agreed to the cancellation of an aggregate of 100,000 warrants which had an exercise price of $4.00 and 7,500 shares of our common stock were surrendered to us. As a result of this agreement, we were not required to issue the full amount of convertible securities under the terms of the Series A Preferred and we did not have to pay $372,000 of dividends we previously accrued as payable which represents accruals through September 30, 2004. See further discussion of the outcome of the lawsuit described in Note 13.
Series B Preferred Stockholders
On May 31, 2001, we issued 2,725 shares of Series B Convertible Preferred Stock in connection with the acquisition of SCS Corporation. Series B stockholders are related parties. The stated value is $1,000 per share and the par value is $0.001. Each Series B share may vote 7,408 common shares for a total of 20,186,800 votes. The shares are convertible to common stock at the lesser of $0.135 or 50% of the current 5- day average trading price. Management evaluated the conversion feature of these preferred shares under ASC 815, Derivatives and Hedging, to determine whether the instruments contained the characteristics of a liability. Because these preferred shares were held by family members of our then Chief Executive Officer, who had agreed not to convert the stock at values lower than $0.135, management concluded that the conversion of these shares was within the control of management and was not considered a derivative liability under ASC 815.
Series B stockholders are entitled to a 4% cumulative dividend on the stated value, which is payable only upon conversion of the preferred stock. Dividends may be paid in stock or cash at Hyperdynamics’ option. In the year ended 2009, dividends of $97,000 were accrued. The resulting balance in accrued dividends was $434,000 as of June 30, 2009.
On September 29, 2009, we entered into the Series B Agreement with the holders of all of our Series B preferred stock in which the Series B holders (i) converted all of their shares of Series B preferred stock into approximately 15,822,222 shares of common stock, (ii) agreed to the cancellation of warrants to purchase 1,000,000 shares of common stock, (iii) agreed to donate, pursuant to a specified schedule, 2,000,000 shares of common stock, issued upon conversion of the Series B preferred stock, and warrants to purchase 1,000,000 shares of common stock, to the American Friends of Guinea, a charitable organization that provides support to the people of Guinea, and (iv) agreed to be subject to a nine month lock-up of the 15,822,222 million shares of common stock received in connection with the conversion of the Series B preferred stock, and any shares that may be received upon exercise of their warrants. The common stock received upon conversion represented a reduction of 2,000,000 shares that otherwise would have been issuable under the original terms of the Series B preferred stock.
Under the terms of the Series B Agreement, if we completed an equity or debt financing in the future of $10,000,000 or more, we also agreed to (i) pay a previously owed dividend in the aggregate amount of $430,000 to the Series B holders and (ii) subject to market conditions, release from the lock-up provision described above, up to 1,000,000 shares of common stock received in connection with the Series B preferred stock
conversion in order to allow for resale by the Series B holders. On April 23, 2010, following our April 20, 2010 registered direct offering, $430,000 was paid to the Series B holders.
Common Stock issuances
Year ended June 30, 2011
For exercise of options for cash:
During the year ended June 30, 2011, 858,613 options were exercised for total gross proceeds of $905,481. The options were exercised at prices ranging from $0.24 to $2.00.
For exercise of warrants for cash:
During the year ended June 30, 2011, 6,164,213 warrants were exercised for total gross proceeds of $7,709,290. The warrants were exercised at prices ranging from $0.98 to $1.58.
For cashless exercise of warrants:
During the year ended June 30, 2011, we issued 384,848 and 175,714 shares of common stock to YA Global and Kent Watts respectively upon the cashless exercise of warrants to purchase 702,222 and 240,000 shares of common stock respectively.
For cash:
On November 3, 2010, we entered into a Stock Purchase Agreement with two institutional funds under management of affiliates of BlackRock (collectively, the “Investors”) pursuant to which the Investors agreed to purchase an aggregate of 15,000,000 shares of our common stock at a purchase price of $2.00 per share in a private placement. At closing, we received approximately $29.9 million, net of offering costs.
On March 25, 2011, we entered into an underwriting agreement providing for the offer and sale in a firm commitment underwritten offering of 25,000,000 shares of our common stock at a price to the public of $5.00 per share ($4.75 per share net of underwriting discount but before deducting transaction expenses). In addition, we granted to the Underwriter a 45-day option to purchase up to 3,750,000 additional shares of common stock from us at the offering price, less underwriting discounts and commissions. On March 25, 2011, the Underwriter exercised its option with respect to all 3,750,000 shares.
Closing of the sale of the shares of common stock, including the 3,750,000 shares purchased pursuant to exercise of the option by the Underwriter, was held on March 30, 2011. The Company received net proceeds, after underwriting discounts and commissions, and other transaction expenses, of approximately $136.1 million.
Issuance of common stock in Series A settlement:
On December 30, 2010, we entered into a litigation settlement whereby we issued 239,437 shares of our common stock. See Note 13.
Year ended June 30, 2010
Series B Preferred Stockholders
Prior to the conversion of our Series B preferred stock on September 29, 2009, the Series B stockholders were entitled to a 4% cumulative dividend on the stated value, which was payable only upon conversion of the preferred stock. Dividends were to be paid in stock or cash at Hyperdynamics’ option.
On September 29, 2009, we entered into the Series B Agreement with the holders of all of our Series B preferred stock in which the Series B holders (i) converted all of their shares of Series B preferred stock into approximately 15,822,222 shares of common stock, (ii) agreed to the cancellation of warrants to purchase 1,000,000 shares of common stock, (iii) agreed to donate, pursuant to a specified schedule, 2,000,000 shares of common stock, issued upon conversion of the Series B preferred stock, and warrants to purchase 1,000,000 shares of common stock, to the American Friends of Guinea, a charitable organization that provides support to the people of Guinea, and (iv) agreed to be subject to a nine month lock-up of the 15,822,222 million shares of common stock received in connection with the conversion of the Series B preferred stock, and any shares that may be received upon exercise of their warrants. The common stock received upon conversion represented a reduction of 2,000,000 shares that otherwise would have been issuable under the original terms of the Series B preferred stock.
Under the terms of the Series B Agreement, if we completed an equity or debt financing in the future of $10,000,000 or more, we also agreed to (i) pay a previously owed dividend in the aggregate amount of $430,000 to the Series B holders and (ii) subject to market conditions, release from the lock-up provision described above, up to 1,000,000 shares of common stock received in connection with the Series B preferred stock
conversion in order to allow for resale by the Series B holders. On April 23, 2010, following our April 20, 2010 registered direct offering, $430,000 was paid to the Series B holders for previously owed dividends.
The Series B Agreement was terminated as a result of the Letter Agreements discussed above.
For exercise of warrants for cash:
During the fiscal year ended June 30, 2010, Enable exercised all warrants to purchase 4,646,465 shares of common stock at an exercise price of $0.95 for total gross proceeds of $4,414,142.
For cashless exercise of options:
During the year ended June 30, 2010, we issued 124,653 shares of common stock upon the cashless exercise of stock options to purchase 220,000 shares of common stock.
For cashless exercise of warrants:
During the year ended June 30, 2010, we issued 201,490 shares of common stock to YA Global upon the cashless exercise of warrants to purchase 520,000 shares of common stock.
For conversion of convertible debenture:
During the year ended June 30, 2010, based upon the conversion prices of $1.65 and $0.95 per share, the convertible debenture investor converted a total principal amount, including interest accreted to principal, of $1,296,000 (net of a discount of $1,116,000) into 1,949,411 shares of our common stock.
CommonStock Issuances:
During year ended June 30, 2010, the Company issued 442,049 shares of common stock from its Stock and Stock Option plan to employees, directors and consultants for services valued at $324,000. The shares were valued using the market close price on the date of grant. On November 12, 2009, we entered into a Shares Purchase Agreement with Enable Growth Partners, L.P. (“Enable”), which held certain securities that were previously issued by us. Pursuant to the Shares Purchase Agreement, we issued to Enable 1,578,948 shares of our common stock, par value $0.001 per share. The aggregate net proceeds from the offering, after deducting offering expenses was approximately $1,485,000. The offering closed on November 17, 2009.
On December 3, 2009, the Company entered into a Securities Purchase Agreement pursuant to which the Company agreed to sell an aggregate of 7,222,223 shares of its common stock and warrants to purchase a total of 3,250,000 shares of its common stock to institutional investors for gross proceeds of approximately $6.5 million. The net proceeds to the Company from the offering, after deducting placement agent fees and the Company’s offering expenses, were approximately $6,045,000. The placement agent also received warrants to purchase 144,444 shares of common stock as additional compensation. The purchase price of a share of common stock and fractional warrant was $0.90 with the warrants priced at $0.98. Subject to certain ownership limitations, the warrants were exercisable 181 days following the closing date of the offering and expire four years following the initial exercise date at an exercise price of $0.98. The offering closed on December 7, 2009.
On April 20, 2010, the Company entered into a securities purchase agreement pursuant to which the Company agreed to sell an aggregate of 8,076,925 shares of our common stock and warrants to purchase a total of 2,826,923 shares of our common stock to institutional investors for gross proceeds of approximately $10.5 million. The net proceeds to us from the offering, after deducting placement agent fees and our offering expenses, were approximately $9,670,000. The purchase price of a share of common stock and warrant was $1.30. Subject to certain ownership limitations, the warrants are exercisable 181 days following the closing date of the offering. Warrants to purchase 807,692 shares of common stock expire one year following the initial exercise date. Warrants to purchase 2,019,231 shares of common stock expire five years following the initial exercise date. The warrants have an exercise price of $1.58. The exercise price of the warrants is subject to adjustment in the case of stock splits, stock dividends, combinations of shares and similar recapitalization transactions. See Note 12 for additional information.
Year ended June 30, 2009
Common Stock Issuances:
During the year ended June 30, 2009, Hyperdynamics issued 2,185,448 shares of common stock for services rendered by consultants, employees, and independent members of the board of directors with a total value of $1,557,000. Services were valued using the market close price on the date of grant.
During the year ended June 30, 2009, Hyperdynamics issued 66,000 shares for the payment of deferred financing costs related to the issuance of the convertible debentures. The shares were valued at $103,000 based on the closing market price on the date of grant.
During the year ended June 30, 2009, holders of the convertible debentures elected to convert debentures in the principal amount of $3,862,000 into 2,250,000 shares of common stock. The conversion of the debentures accelerated the amortization of discounts of $1,824,000, resulting in the shares issued being valued at the net amount of $2,038,000.
In July 2008, we entered an agreement with an international law firm to support our 2006 PSC for services to be provided from July 2008 through March 2009. The agreement required that we issue a combination of our common stock and cash as payment for services of approximately $700,000. The contract also provided for a true-up six months after the date any shares were issued and upon final settlement. Under the true-up provision, the law firm was entitled to receive additional shares if the market value of our common stock declined in value prior to full payment of the obligations. The true up provision constituted an obligation to issue a variable number of shares based upon a fixed monetary value (the “variable share issuance obligation”). All issuances of our common stock were recorded at the fair value of the shares at the date of grant. During the year ended June 30, 2009 we issued 350,000 shares of our common stock valued at $543,000 as an initial payment under the agreement.
For preferred stock dividends:
During the year ended June 30, 2009, Hyperdynamics issued 21,884 shares of common stock for the payment of accrued preferred stock dividends.
Employee stock options
During the year ended June 30, 2011, we granted options to purchase 2,907,000 shares of common stock to our employees and directors. The compensation expense associated with employee stock options during the year ended June 30, 2011 was $2,176,000. Stock compensation capitalized was $974,000 for the year ended June 30, 2011. During the year ended June 30, 2010, we granted options to purchase 7,514,000 shares of common stock to our employees and directors. The compensation expense associated with employee stock options during the year ended June 30, 2010 was $1,579,000. During the year ended June 30, 2009, we granted options to purchase 870,000 shares of common stock to our employees and directors. The compensation expense associated with employee stock options during the year ended June 30, 2009 was $281,000. See Note 12 for additional information.
Other items affecting equity
In July 2008, Hyperdynamics entered into a contract for 2D seismic work offshore Guinea. The contract provided for Hyperdynamics to issue 2,500,000 shares of common stock to the vendor as a deposit. The value ascribed to the stock by the parties in the contract was $6.00 per share. The 2,500,000 shares were issued during August 2008 and delivered to the vendor during October 2008. The contract provided that the stock may be sold to pay invoices after the seismic work began. Any proceeds from the sale of this stock would be applied by the direction of us to any legitimate outstanding invoices. Should we elect to pay cash for the seismic work, any remaining unsold stock will be returned to us. Because there was no performance commitment, there was no accounting recognition of the stock issued for the year ended June 30, 2010 and 2009, in accordance with EITF 00-18 governing share-based payment to non-employees. As a result, these shares were not shown as issued in the accompanying financial statements. We paid cash for this entire work program, and the entire 2,500,000 share stock certificate was returned to us in August 2010.
12. STOCK OPTIONS AND WARRANTS
On February 18, 2010, at our annual meeting of stockholders, the board of directors and stockholders approved the 2010 Equity Incentive Plan (the “2010 Plan”). Prior to the 2010 stockholder meeting, we had two stock award plans: the Stock and Stock Option Plan, which was adopted in 1997 (“1997 Plan”) and the 2008 Restricted Stock Award Plan (“2008 Plan”). In conjunction with the approval of the 2010 Plan at the annual meeting, the 1997 Plan and 2008 Plan were terminated as of February 18, 2010.
The 2010 Plan provides for the grants of shares of common stock, restricted stock or incentive stock options and/or nonqualified stock options to purchase our common stock to selected employees, directors, officers, agents, consultants, attorneys, vendors and advisors of ours’ or of any parent or subsidiary thereof. Shares of common stock, options, or restricted stock can only be granted under this plan within 10 years from the effective date of February 18, 2010. A maximum of 5,000,000 shares are issuable under the 2010 Plan and at June 30, 2011, 1,069,000 shares remained available for issuance.
The 2010 Plan provides a means to attract and retain the services of participants and also to provide added incentive to such persons by encouraging stock ownership in the Company. Plan grants are administered by the Compensation Committee, who have substantial discretion to determine which persons, amounts, time, price, exercise terms, and restrictions, if any.
Additionally, from time to time, we issue non-compensatory warrants, such as warrants issued to investors.
The fair value of non-market based options or warrants are estimated using the Black-Scholes valuation model. For market based options, the fair value was estimated using a Black-Scholes option pricing model with inputs adjusted for the probability of the vesting criteria being met and the median expected term for each grant as determined by utilizing a Monte Carlo simulation. Expected volatility is based solely on historical volatility of our common stock over the period commensurate with the expected term of the stock options. We rely solely on historical volatility as we do not have traded options. The expected term calculation for stock options is based on the simplified method as described in the Securities and Exchange Commission Staff Accounting Bulletin number 107. We use this method because we do not have sufficient historical information on exercise patterns to develop a model for expected term. The risk-free interest rate is based on the U. S.
Treasury yield in effect at the time of grant for an instrument with a maturity that is commensurate with the expected term of the stock options. The dividend yield rate of zero is based on the fact that we have never paid cash dividends on our common stock and we do not intend to pay cash dividends on our common stock.
2008 Restricted Stock Award Plan
During the years ended June 30, 2011 and 2010 no options or warrants were issued under the plan.
1997 Stock and Stock Option Plan
Options granted to employees and directors:
The following table provides information about options under this plan during the years ended June 30:
|
|
|
2011 |
|
2010 |
|
2009 |
| |||
|
Number of options granted |
|
— |
|
6,465,000 |
|
870,000 |
| |||
|
Compensation expense recognized |
|
$ |
650,991 |
|
$ |
1,501,132 |
|
$ |
281,000 |
|
|
Compensation cost capitalized |
|
76,617 |
|
— |
|
— |
| |||
|
Weighted average fair value of options outstanding |
|
$ |
0.40 |
|
$ |
0.45 |
|
$ |
0.24 |
|
The following table details the significant assumptions used to compute the fair market values of employee and director stock options granted during the years ended June 30:
|
|
|
2011 |
|
2010 |
|
2009 |
|
|
Risk-free interest rate |
|
— |
|
0.37 - 3.58 |
% |
0.40 – 2.63 |
% |
|
Dividend yield |
|
— |
|
0 |
% |
0 |
% |
|
Volatility factor |
|
— |
|
113 - 178 |
% |
89 – 118 |
% |
|
Expected life (years) |
|
— |
|
0.4 – 5.0 |
|
1 – 2.5 |
|
2010 Stock Option Plan
Options granted to employees and directors:
With the approval of the 2010 Plan at the annual meeting, this plan was effective as of February 18, 2010. The following table provides information about options during the year ended June 30:
|
|
|
2011 |
|
2010 |
| ||
|
Number of options granted |
|
2,906,000 |
|
1,149,000 |
| ||
|
Compensation expense recognized |
|
$ |
1,524,634 |
|
$ |
77,660 |
|
|
Compensation cost capitalized |
|
897,113 |
|
— |
| ||
|
Weighted average fair value of options outstanding |
|
$ |
2.62 |
|
$ |
0.85 |
|
The following table details the significant assumptions used to compute the fair market values of employee and director stock options granted during the year ended June 30:
|
|
|
2011 |
|
2010 |
|
|
Risk-free interest rate |
|
1.11-2.68 |
|
0.17 - 2.75 |
% |
|
Dividend yield |
|
0 |
% |
0 |
% |
|
Volatility factor |
|
91-146 |
% |
58 - 165 |
% |
|
Expected life (years) |
|
0.9-6.0 |
|
0.23 – 5.0 |
|
Summary information regarding employee stock options issued and outstanding under all plans as of June 30, 2011 is as follows:
|
|
|
Options |
|
Weighted |
|
Aggregate intrinsic |
|
Weighted |
| ||
|
Outstanding at year ended June 30, 2008 |
|
2,238,696 |
|
$ |
3.45 |
|
$ |
320,000 |
|
1.79 |
|
|
Granted |
|
870,000 |
|
1.07 |
|
|
|
|
| ||
|
Exercised |
|
— |
|
— |
|
|
|
|
| ||
|
Expired |
|
(888,989 |
) |
1.57 |
|
|
|
|
| ||
|
Outstanding at year ended June 30, 2009 |
|
2,219,707 |
|
3.27 |
|
45,375 |
|
1.76 |
| ||
|
Granted |
|
7,614,000 |
|
0.83 |
|
|
|
|
| ||
|
Exercised |
|
(220,000 |
) |
0.63 |
|
|
|
|
| ||
|
Forfeited |
|
(130,000 |
) |
2.05 |
|
|
|
|
| ||
|
Expired |
|
(1,434,947 |
) |
4.10 |
|
|
|
|
| ||
|
Outstanding at year ended June 30, 2010 |
|
8,048,760 |
|
$ |
0.91 |
|
$ |
2,589,600 |
|
6.20 |
|
|
Granted |
|
2,906,520 |
|
4.15 |
|
|
|
|
| ||
|
Exercised |
|
(858,613 |
) |
1.10 |
|
|
|
|
| ||
|
Forfeited |
|
(438,053 |
) |
0.90 |
|
|
|
|
| ||
|
Expired |
|
(383,760 |
) |
2.24 |
|
|
|
|
| ||
|
Options outstanding at year ended June 30, 2011 |
|
9,274,854 |
|
$ |
1.85 |
|
$ |
23,558,086 |
|
5.65 |
|
|
Options exercisable at year ended June 30, 2011 |
|
3,266,500 |
|
$ |
1.08 |
|
$ |
10,529,575 |
|
4.15 |
|
Options outstanding and exercisable as of June 30, 2011
|
Exercise Price |
|
Outstanding |
|
Remaining Life |
|
Exercisable Number of Shares |
| |
|
$ |
0.01 – 0.49 |
|
85,000 |
|
1 year |
|
85,000 |
|
|
$ |
0.01 – 0.49 |
|
3,550,000 |
|
3 years |
|
1,227,500 |
|
|
$ |
0.50 – 1.00 |
|
60,000 |
|
1 year |
|
60,000 |
|
|
$ |
0.50 – 1.00 |
|
443,334 |
|
3 years |
|
216,667 |
|
|
$ |
1.00 – 1.49 |
|
720,000 |
|
3 years |
|
640,000 |
|
|
$ |
1.00 – 1.49 |
|
914,000 |
|
9 years |
|
377,000 |
|
|
$ |
1.50 – 1.99 |
|
551,000 |
|
3 years |
|
260,333 |
|
|
$ |
2.00 - 3.00 |
|
120,000 |
|
1 year or less |
|
120,000 |
|
|
$ |
2.00 – 3.00 |
|
280,000 |
|
9 years |
|
140,000 |
|
|
$ |
3.00 – 4.00 |
|
536,000 |
|
9 years |
|
140,000 |
|
|
$ |
4.00 – 5.00 |
|
1,585,520 |
|
9 years |
|
— |
|
|
$ |
5.00 – 6.00 |
|
310,000 |
|
9 years |
|
— |
|
|
$ |
6.00 – 7.00 |
|
30,000 |
|
9 years |
|
— |
|
|
$ |
7.00 – 8.00 |
|
90,000 |
|
9 years |
|
— |
|
|
|
|
9,274,854 |
|
|
|
3,266,500 |
| |
Options outstanding and exercisable as of June 30, 2010
|
Exercise Price |
|
Outstanding |
|
Remaining Life |
|
Exercisable |
| |
|
$ |
0.01 – 0.99 |
|
75,000 |
|
1 year or less |
|
75,000 |
|
|
0.01 – 0.99 |
|
100,000 |
|
1 year |
|
100,000 |
| |
|
0.01 – 0.99 |
|
85,000 |
|
2 years |
|
85,000 |
| |
|
0.01 – 0.99 |
|
200,000 |
|
3 years |
|
100,000 |
| |
|
0.01 – 0.99 |
|
1,850,000 |
|
4 years |
|
750,000 |
| |
|
0.01 – 0.99 |
|
480,000 |
|
6 years |
|
— |
| |
|
0.01 – 0.99 |
|
810,000 |
|
7 years |
|
— |
| |
|
0.01 – 0.99 |
|
1,200,000 |
|
11 years |
|
— |
| |
|
1.00 – 1.49 |
|
105,000 |
|
1 year or less |
|
105,000 |
| |
|
1.00 – 1.49 |
|
100,000 |
|
1 year |
|
— |
| |
|
1.00 – 1.49 |
|
920,000 |
|
4 years |
|
800,000 |
| |
|
1.00 – 1.49 |
|
680,000 |
|
9 years |
|
— |
| |
|
1.00 – 1.49 |
|
294,000 |
|
10 years |
|
— |
| |
|
1.50 – 1.99 |
|
30,000 |
|
1 year or less |
|
30,000 |
| |
|
1.50 – 1.99 |
|
611,000 |
|
4 years |
|
50,000 |
| |
|
2.00 - $2.49 |
|
120,000 |
|
1 year or less |
|
120,000 |
| |
|
2.00 - $2.49 |
|
235,000 |
|
1 year |
|
235,000 |
| |
|
2.50 - $3.00 |
|
88,760 |
|
1 year or less |
|
88,760 |
| |
|
3.00 - $3.50 |
|
65,000 |
|
1 year or less |
|
65,000 |
| |
|
|
|
8,048,760 |
|
|
|
2,603,760 |
| |
At June 30, 2011, there was $10,079,405 of unrecognized compensation costs related to non-vested share based compensation arrangements granted to employees under the plans.
During 2011, a total of 1,906,000 options, with a weighted average grant date fair value of $1.22 per share, vested in accordance with the underlying agreements. Unvested options at June 30, 2011 totaled 6,008,000 with a weighted average grant date fair value and exercise price of $2.27, an amortization period of two to three years and a weighted average remaining life of 8.91 years.
Warrants
During the years ended June 30, 2011, 2010 and 2009, we did not grant any warrants to consultants.
Warrant activity during the years ended June 30, 2011, 2010 and 2009:
Year ended June 30, 2011:
During the fiscal year ended June 30, 2011, holders of warrants exercised an aggregate of 7,106,000 warrants with exercise prices ranging from $0.98 to $1.58 per share for total proceeds to us of $7,709,000, and 100,000 warrants held by Michael Watts with a weighted average price of $4.00 were cancelled during the year. Additionally, YA Global exercised the remaining 702,222 of its warrants on a cashless basis and received 384,848 shares of our common stock.
Year ended June 30, 2010:
The holders of all of our Series B preferred stock agreed to the cancellation of warrants to purchase 1,000,000 shares of the Company’s common stock.
As a result of the offerings in November and December 2009, outstanding YA Global warrants to purchase 666,666 shares of common stock at an exercise price of $1.65 were amended to increase the number of underlying shares of common stock to 1,222,222 and decrease the exercise price to $0.90 per share. These warrants are included in the warrant derivative liability. The change in value of the warrants as a result of the amendment is reflected in the valuation of the derivative as of June 30, 2010.
As a result of the equity transaction in November 2009, the exercise price of 2,424,243 warrants held by Enable and previously granted as part of an equity purchase, was reduced from $2.00 per share to $0.95 subject to no further adjustment other than for stock splits and stock dividends. The modification resulted in a deemed dividend of $322,000 which was calculated as the difference in the fair value of the warrants immediately before and after the modification using the Black-Scholes option pricing model. The following table details the significant assumptions used to compute the fair market value of the warrant modification:
|
|
|
Before |
|
After |
|
|
Risk-free interest rate |
|
2.63 |
% |
2.63 |
% |
|
Dividend yield |
|
0 |
% |
0 |
% |
|
Volatility factor |
|
127 |
% |
127 |
% |
|
Remaining term (years) |
|
5.49 |
|
5.49 |
|
As a result of the equity transaction in November 2009, the exercise price of warrants held by Enable and previously granted as part of the convertible debenture transaction discussed in Note 11, was reduced from $2.50 to $0.95 per share for 1,111,111 warrants, and from $2.25 to $0.95 per share for 1,111,111 warrants, subject to no further adjustment other than for stock splits and stock dividends. This modification resulted in an increased fair value of $158,000, which has been treated as additional interest expense and which was calculated as the difference in the fair value of the warrants immediately before and after the modification using the Black-Scholes option pricing model. The following table details the significant assumptions used to compute the fair market value of the warrant modification:
|
|
|
Before |
|
After |
|
|
Risk-free interest rate |
|
2.63 |
% |
2.63 |
% |
|
Dividend yield |
|
0 |
% |
0 |
% |
|
Volatility factor |
|
125 |
% |
125 |
% |
|
Remaining term (years) |
|
5.80 |
|
5.80 |
|
During the fiscal year ended June 30, 2010, Enable exercised all 4,646,465 warrants for a total $4,414,142.
As a result of the equity transaction in December 2009, the Company issued warrants to purchase a total of 3,250,000 shares of its common stock to institutional investors. The placement agent in the transaction received 144,444 warrants. The warrants have an exercise price of $0.98 per share a term of four years from the date they become exercisable and are exercisable 181 days following the close of the transaction. The exercise price of the warrants may be adjusted in the case of stock splits, stock dividends or combinations of shares, or in the event the Company issues rights, options or warrants to all holders of the Company’s common stock with an exercise or purchase price less than the volume weighted average price of the Company’s shares on the record date. The warrants issued to the investors and the placement agent had a relative fair value of $1,572,000 and $70,000, respectively. The relative fair value of the 7,222,223 shares issued in the transaction was $4,403,000 based upon the market price on the transaction date. The fair value of the warrants was determined using the Black-Scholes option pricing model. The following table details the significant assumptions used to compute the fair market value of the warrant modification:
|
Risk-free interest rate |
|
2.14 |
% |
|
Dividend yield |
|
0 |
% |
|
Volatility factor |
|
118 |
% |
|
Expected term (years) |
|
4.5 |
|
On April 20, 2010, the Company entered into a securities purchase agreement pursuant to which the Company agreed to sell an aggregate of 8,076,925 shares of its common stock and warrants to purchase a total of 2,826,923 shares of its common stock to institutional investors for gross proceeds of approximately $10.5 million. The placement agent in the transaction received 161,539 warrants. The purchase price of a share of common stock and warrant was $1.30. Subject to certain ownership limitations, the warrants are exercisable 181 days following the closing date of the offering. Warrants to purchase 807,692 shares of common stock expire one year following the initial exercise date. Warrants to purchase 2,019,231 shares of common stock expire five years following the initial exercise date. The warrants will have an exercise price of $1.58. The exercise price of the warrants is subject to adjustment in the case of stock splits, stock dividends, combinations of shares and similar recapitalization transactions. The warrants issued to the investors and the placement agent had a relative fair value of $442,000 and $1,755,000, respectively. The relative fair value of the 8,076,925 shares issued in the transaction was $8,303,000 based upon the market price on the transaction date. The fair value of the warrants was determined using the Black-Scholes option pricing model. The following table details the significant assumptions used to compute the fair market value of the warrant modification:
|
Risk-free interest rate |
|
0.41 |
% |
2.49 |
% |
|
Dividend yield |
|
0 |
% |
0 |
% |
|
Volatility factor |
|
118 |
% |
118 |
% |
|
Expected term (years) |
|
1.5 |
|
5.5 |
|
Year ended June 30, 2009:
In September 2008, we issued warrants to purchase 1,111,111 shares of common stock at $3.00 per share and warrants to purchase 1,111,111 shares of common stock at $2.75 per share in conjunction with the issuance of $5,000,000 of convertible debentures. (See Note 9)
The investors in the convertible debentures previously received 2,424,243 warrants to purchase common stock with an exercise price of $3.27 per share as part of a registered direct offering of our common stock completed in May 2008. The provisions of the warrants include a reduction in the exercise price in the event stock or convertible securities were issued with a lower exercise price. In September 2008, by agreement with the investors, the exercise price of the warrants was reduced from $3.27 to $3.00. The modification resulted in a deemed dividend of $29,000, which was calculated using the Black-Scholes method. The following table details the significant assumptions used to compute the fair market value of the modification to these warrants:
|
|
|
Before |
|
After |
|
|
Risk-free interest rate |
|
3.45 |
% |
3.45 |
% |
|
Dividend yield |
|
0 |
% |
0 |
% |
|
Volatility factor |
|
111.88 |
% |
111.88 |
% |
|
Remaining term (years) |
|
6.7 |
|
6.7 |
|
On November 20, 2008, Hyperdynamics entered into an amendment agreement with the same warrant holder. The agreement reduced the exercise price of the 2,424,243 warrants issued during May 2008 to $2 per share. The modification resulted in a fair value of $75,000, which was calculated using the Black-Scholes method. The following table details the significant assumptions used to compute the fair market value of the modification to these warrants:
|
|
|
Before |
|
After |
|
|
Risk-free interest rate |
|
2.43 |
% |
2.43 |
% |
|
Dividend yield |
|
0 |
% |
0 |
% |
|
Volatility factor |
|
111.62 |
% |
111.62 |
% |
|
Remaining term (years) |
|
6.47 |
|
6.47 |
|
Pursuant to the agreement, the price of the warrants, originally issued in September 2008, was also reduced from $2.75 and $3.00 to $2.25 and $2.50, respectively. The modification resulted in a fair value of $31,000, which was calculated using the Black-Scholes method. The following table details the significant assumptions used to compute the fair market value of the warrant modification:
|
|
|
Before |
|
After |
|
|
Risk-free interest rate |
|
2.43 |
% |
2.43 |
% |
|
Dividend yield |
|
0 |
% |
0 |
% |
|
Volatility factor |
|
112.32 |
% |
112.32 |
% |
|
Remaining term (years) |
|
6.78 |
|
6.78 |
|
The total fair value of these warrant modifications of $106,000 was included in the discount on the post modification debt further described in Note 9 above, with the offsetting credit recorded as additional paid in capital.
Summary information regarding common stock warrants issued and outstanding as of June 30, 2011 is as follows:
|
|
|
Warrants |
|
Weighted |
|
Aggregate |
|
Weighted |
| ||
|
Outstanding at year ended June 30, 2008 |
|
11,717,692 |
|
$ |
2.54 |
|
$ |
346,000 |
|
4.42 |
|
|
|
|
|
|
|
|
|
|
|
| ||
|
Granted |
|
2,222,222 |
|
2.56 |
|
|
|
|
| ||
|
Exercised |
|
— |
|
— |
|
|
|
|
| ||
|
Expired |
|
(3,596,783 |
) |
2.84 |
|
|
|
|
| ||
|
Outstanding at year ended June 30, 2009 |
|
10,343,131 |
|
$ |
1.99 |
|
$ |
45,375 |
|
5.59 |
|
|
|
|
|
|
|
|
|
|
|
| ||
|
Granted |
|
6,938,462 |
|
$ |
1.16 |
|
|
|
|
| |
|
Exercised |
|
(5,166,465 |
) |
0.94 |
|
|
|
|
| ||
|
Expired |
|
(1,050,000 |
) |
4.05 |
|
|
|
|
| ||
|
Outstanding at year ended June 30, 2010 |
|
11,065,128 |
|
$ |
1.25 |
|
$ |
1,168,000 |
|
3.93 |
|
|
Granted |
|
— |
|
$ |
— |
|
$ |
|
|
|
|
|
Exercised |
|
(7,106,435 |
) |
1.20 |
|
|
|
|
| ||
|
Expired |
|
(100,000 |
) |
4.00 |
|
|
|
|
| ||
|
Outstanding at year ended June 30, 2011 |
|
3,858,693 |
|
$ |
1.26 |
|
$ |
11,737,345 |
|
3.03 |
|
Warrants outstanding and exercisable as of June 30, 2011
|
Exercise |
|
Outstanding |
|
Remaining |
|
Exercisable |
| |
|
$ |
0.90 |
|
3,240,000 |
|
3 years |
|
3,240,000 |
|
|
0.98 |
|
10,833 |
|
3 years |
|
10,833 |
| |
|
1.58 |
|
207,860 |
|
4 years |
|
207,860 |
| |
|
4.00 |
|
400,000 |
|
3 years |
|
400,000 |
| |
|
|
|
3,858,693 |
|
|
|
3,858,693 |
| |
Warrants outstanding and exercisable as of June 30, 2010
|
Exercise |
|
Outstanding Shares |
|
Remaining |
|
Exercisable |
| |
|
$ |
0.90 |
|
702,222 |
|
3 years |
|
702,222 |
|
|
0.90 |
|
3,480,000 |
|
4 years |
|
3,480,000 |
| |
|
0.98 |
|
3,394,444 |
|
4 years |
|
3,394,444 |
| |
|
1.58 |
|
807,693 |
|
1 years |
|
— |
| |
|
1.58 |
|
2,180,769 |
|
5 years |
|
— |
| |
|
4.00 |
|
500,000 |
|
4 years |
|
500,000 |
| |
|
|
|
11,065,128 |
|
|
|
8,076,666 |
| |
The outstanding warrants had an intrinsic value of $11,737,345 at June 30, 2011. All of the 3,858,693 warrants outstanding at June 30, 2011 are exercisable.
13. COMMITMENTS AND CONTINGENCIES
LITIGATION AND OTHER LEGAL MATTERS
From time to time, we and our subsidiaries are involved in business disputes that may occur in the ordinary course of business. We are unable to predict the outcome of such matters when they arise. Other than disputes currently disclosed under litigation, we are unaware of any other disputes that exist and do not believe that the ultimate resolution of such matters would have a material adverse effect on our financial statements.
Wellington Lawsuit
On April 9, 2001, we were named as a defendant in a lawsuit styled Wellington, LLC vs. Hyperdynamics Corporation et al. Civil Action# 18811-NC, The Court of Chancery of Delaware. The Plaintiff claimed that we did not carry out conversion of Series A preferred stock to common stock. On August 9, 2002, Plaintiff, Defendant, and their respective counsels executed an “Agreement for Transfer of Claims in Delaware Action to Georgia.” Subsequently, the lawsuit was moved in its entirety to Atlanta, Georgia to be litigated under the lawsuit discussed below. Under the agreement, the Plaintiff in the Delaware action, Wellington, LLC. would become the Defendant in Atlanta. During the fiscal year ended June 30, 2004, the Court of Chancery of Delaware dismissed the Delaware case.
On November 5, 2001, we filed a lawsuit styled Hyperdynamics Corporation, Plaintiff, v. J.P. Carey Securities, Inc., J.P. Carey Asset Management LLC, Joseph C. Canouse, John C. Canouse, James P. Canouse, Jeffrey Canouse, Southridge Capital Management LLC, Stephen Hicks a/k/a Steve Hicks, Thomson Kernaghan & Co., Limited, Mark Valentine, Talya Davies, Cache Capital (United States), L.P., Carpe Diem, Carpe Diem LTD., Wellington, LLC, Minglewood Capital, LLC, Falcon Securities, LTD, Navigator Management LTD., David Sims, and Citco Trustees (Cayman) Limited, Defendants; and Wellington LLC, Counterclaim/Third-Party Plaintiff, v. Hyperdynamics Corporation, a Delaware corporation, Kent Watts, Michael Watts, Robert Hill, Harry J. Briers, DJX, Ltd., a Belize corporation, and Does 1-10, Counterclaim/Third-Party Defendants, Civil Action File No. 2001CV44988, In The Superior Court of Fulton County, State of Georgia. Counterclaims were filed against us in this case.
The counterclaimants alleged that Hyperdynamics and its Officers and Directors breached their fiduciary duties to shareholders and committed other tortuous acts.
On December 30, 2010, we entered into a settlement agreement pursuant to which we issued 239,437 shares of our common stock in connection with the conversion of 1,945 outstanding shares of Series A Preferred Stock. As part of the settlement, we were relieved of any Series A Preferred Stock dividend payments, two former officers agreed to the cancellation of an aggregate of 100,000 warrants which had an exercise price of $4.00 and 7,500 shares of our common stock were surrendered to us. As a result of this agreement, we were not required to issue the full amount of convertible securities under the terms of the Series A Preferred and we did not have to pay $372,000 of dividends we previously accrued as payable. The common shares, based upon the stock price at the settlement date, had a fair market value of $1,183,000. The exchange of those common shares for the conversion of the Series A Preferred Stock, the elimination of the corresponding dividend payable, and the cancellation of 100,000 warrants and 7,500 shares of our common stock was a capital transaction and no gain or loss was recorded. We recorded $1,183,000 to additional paid-in capital, with a corresponding charge to additional paid-in capital of $811,000, which represented the difference between the fair market value of the common shares issued for settlement and the elimination of the accrued dividend payable related to the Series A Preferred Stock, resulting in a net credit to additional paid-in capital of $372,000.
Ashley and Wilburn Lawsuits
Trendsetter Production Company was named in two separate lawsuits, Raymond Thomas et al v. Ashley Investment et al and Wilburn L. Atkins and Malcolm L. Mason Jr. vs. BP America Production et al, Nos. 38,839 and 41,913-B, respectively, “C”, 5th Judicial District Court, Parish of Richland, State of Louisiana. These cases were environmental cleanup cases involving wells operated by Trendsetter prior to our acquisition of Trendsetter. In May 2011, we entered into a settlement agreement to which we paid $20,000 to settle this claim and received a court order dismissing the case. On June 30, 2011, we sold Trendsetter Production Company to Good Day Production, LLC for $20,000. The Company does not anticipate any additional liabilities relating to Trendsetter Production Company due to this sale.
COMMITMENTS AND CONTINGENCIES
Contingent notes payable
Our subsidiary, SCS, has $350,000 remaining of a contingent note payable due to the former owners of SCS Corporation’s assets. It is payable in our common stock and it is payable only if SCS has net income in any given quarter. If SCS experiences net income in a quarter, 25% of the income will be paid against the note, until the contingency is satisfied.
AGR Peak Well Management Limited
We have contracted with AGR Peak Well Management Limited (“AGR”) to manage our exploration drilling project in offshore Republic of Guinea. AGR will handle well construction project management services, logistics, and tendering of materials as well as overall management responsibilities for the drilling program. The drilling project management contract, entered into on November 30, 2010, was for an estimated $6.8 million, of which we expect our 77% share to be $5.2 million of that amount. In the event we terminate this contract, AGR would invoice us for services carried out to date and for any commitments made on behalf of us, including termination fees. In the event we terminate this contract without cause and we enter into direct contracts for the drilling rig, vessels or third party services previously held by AGR, we would then reimburse AGR cancellation fees of $500,000. The costs incurred as of June 30, 2011 amount to $1,022,000 with our 77% share being $787,000 and is capitalized in unevaluated oil and gas properties. We have advanced to AGR $10.7 million on a gross basis, or $8.2 million for
our current 77% interest, for them to purchase on our behalf long lead items such as wellhead and drilling pipe. These items will be delivered to us prior to our commencing drilling on this well.
Operating Leases
We lease office space under long-term operating leases with varying terms. Most of the operating leases contain renewal and purchase options. We expect that in the normal course of business, the majority of operating leases will be renewed or replaced by other leases.
The following is a schedule by years of minimum future rental payments required under operating leases that have initial or remaining noncancellable lease terms in excess of one year as of June 30, 2011:
|
Years ending June 30: |
|
|
| |
|
2012 |
|
406 |
| |
|
2013 |
|
335 |
| |
|
2014 |
|
346 |
| |
|
2015 |
|
228 |
| |
|
2016 |
|
— |
| |
|
Total minimum payments required |
|
$ |
1,315 |
|
Rent expense included in net loss from operations for the years ended June 30, 2011, 2010, and 2009 was $295,000, $154,000 and $125,000, respectively.
14. QUARTERLY RESULTS (UNAUDITED)
Shown below are selected unaudited quarter data for the years ended June 30, 2011 and 2010 (in thousands, except per share data):
|
2011: |
|
First Quarter |
|
Second Quarter |
|
Third Quarter |
|
Fourth Quarter |
| ||||
|
|
|
|
|
|
|
|
|
|
| ||||
|
Depreciation |
|
$ |
70 |
|
$ |
71 |
|
$ |
100 |
|
$ |
112 |
|
|
Selling, general and administrative |
|
2,049 |
|
3,218 |
|
2,571 |
|
2,678 |
| ||||
|
Total costs and expense |
|
2,119 |
|
3,289 |
|
2,671 |
|
2,790 |
| ||||
|
Loss from operations |
|
(2,119 |
) |
(3,289 |
) |
(2,671 |
) |
(2,790 |
) | ||||
|
Income from discontinued operations |
|
— |
|
— |
|
— |
|
— |
| ||||
|
Net income (loss) |
|
(2,883 |
) |
(3,282 |
) |
(2,638 |
) |
(2,435 |
) | ||||
|
Basic and diluted income (loss) per common share: |
|
|
|
|
|
|
|
|
| ||||
|
From continuing operations |
|
$ |
(0.03 |
) |
$ |
(0.03 |
) |
$ |
(0.02 |
) |
$ |
(0.02 |
) |
|
From discontinued operations |
|
0.00 |
|
0.00 |
|
0.00 |
|
0.00 |
| ||||
|
Net loss attributable to common shareholders |
|
(0.03 |
) |
(0.03 |
) |
(0.02 |
) |
(0.02 |
) | ||||
|
|
|
|
|
|
|
|
|
|
| ||||
|
2010: |
|
First Quarter |
|
Second Quarter |
|
Third Quarter |
|
Fourth Quarter |
| ||||
|
|
|
|
|
|
|
|
|
|
| ||||
|
Depreciation |
|
$ |
30 |
|
$ |
29 |
|
$ |
34 |
|
$ |
63 |
|
|
Selling, general and administrative |
|
2,388 |
|
3,038 |
|
2,434 |
|
2,987 |
| ||||
|
Total costs and expense |
|
2,418 |
|
3,067 |
|
2,468 |
|
3,050 |
| ||||
|
Loss from operations |
|
(2,418 |
) |
(3,067 |
) |
(2,468 |
) |
(95 |
) | ||||
|
Income from discontinued operations |
|
768 |
|
(3 |
) |
— |
|
— |
| ||||
|
Net income (loss) |
|
(1,944 |
) |
(4,271 |
) |
(2,105 |
) |
311 |
| ||||
|
Basic and diluted income (loss) per common share: |
|
|
|
|
|
|
|
|
| ||||
|
From continuing operations |
|
(0.04 |
) |
(0.05 |
) |
(0.02 |
) |
0.00 |
| ||||
|
From discontinued operations |
|
0.01 |
|
0.00 |
|
0.00 |
|
0.00 |
| ||||
|
Net loss attributable to common shareholders |
|
$ |
(0.03 |
) |
$ |
(0.05 |
) |
$ |
(0.02 |
) |
$ |
0.00 |
|
The sum of the individual quarterly net income (loss) per share amounts may not agree with year-to-date net income (loss) per share as each quarterly computation is based on the weighted average number of common shares outstanding during that period. In addition, certain potentially dilutive securities were not included in certain of the quarterly computations of diluted net income (loss) per share because to do so would have been antidilutive.
15. SUPPLEMENTAL OIL AND GAS INFORMATION (UNAUDITED)
In December 2008 the SEC announced revisions to its regulations on oil and gas reporting. In January 2010, the Financial Accounting Standards Board issued an accounting standards update which was intended to harmonize the accounting literature with the SEC’s new regulations.
Future cash flows for 2010 would be computed by applying average price for the year to the year-end quantities of proved reserves. The 2010 average price for the year would be calculated using the twelve month period prior to the ending date of the period covered by the report, determined as an unweighted arithmetic average of the first day of the month price for each month within such period. The Company had no proved reserves in 2010. Future cash flows for 2009 were computed by applying the year end price to the year-end quantities of proved reserves.
The following estimates of reserve quantities and related standardized measure of discounted net cash flows are estimates only, and are not intended to reflect realizable values or fair market values of the Hyperdynamics’ reserves. Hyperdynamics emphasizes that reserve estimates are inherently imprecise and that estimates of new discoveries are more imprecise than producing oil and gas properties. Additionally, the price of oil has been very volatile and downward changes in prices can significantly affect quantities that are economically recoverable. Accordingly, these estimates are expected to change as future information becomes available and these changes may be significant.
Proved reserves are estimated reserves of crude oil and natural gas that geological and engineering data demonstrate with reasonable certainty to be recoverable in future years from known reservoirs under existing economic and operating conditions. Proved developed reserves are those expected to be recovered through existing wells, equipment and operating methods.
The standardized measure of discounted future net cash flows as of June 30, 2009 was computed by applying year-end prices of oil and gas (with consideration of price changes only to the extent provided by contractual arrangements) to the estimated future production of proved oil and gas reserves, less estimated future expenditures (based on year-end costs) to be incurred in developing and producing the proved reserves, less estimated future income tax expenses. The estimated future net cash flows are then discounted using a rate of 10% per year to reflect the estimated timing of the future cash flows.
Capitalized Costs Related to Oil and Gas Activities
Aggregate capitalized costs relating to the Hyperdynamics’ crude oil and natural gas producing activities, including asset retirement costs and related accumulated depreciation, depletion & amortization are shown below:
|
|
|
United |
|
Republic of |
|
|
| |||
|
(in thousands) |
|
States |
|
Guinea |
|
Total |
| |||
|
|
|
|
|
|
|
|
| |||
|
June 30, 2011 |
|
|
|
|
|
|
| |||
|
Unproved properties |
|
$ |
— |
|
$ |
36,200 |
|
$ |
36,200 |
|
|
Proved properties |
|
— |
|
— |
|
— |
| |||
|
Oilfield equipment |
|
— |
|
— |
|
— |
| |||
|
|
|
— |
|
36,200 |
|
36,200 |
| |||
|
Less accumulated DD&A |
|
— |
|
— |
|
— |
| |||
|
Net capitalized costs |
|
$ |
— |
|
$ |
36,200 |
|
$ |
36,200 |
|
|
|
|
|
|
|
|
|
| |||
|
June 30, 2010 |
|
|
|
|
|
|
| |||
|
Unproved properties |
|
$ |
— |
|
$ |
92 |
|
$ |
92 |
|
|
Proved properties |
|
— |
|
— |
|
— |
| |||
|
Oilfield equipment |
|
— |
|
— |
|
— |
| |||
|
|
|
— |
|
92 |
|
92 |
| |||
|
Less accumulated DD&A |
|
— |
|
— |
|
— |
| |||
|
Net capitalized costs |
|
$ |
— |
|
$ |
92 |
|
$ |
92 |
|
|
|
|
|
|
|
|
|
| |||
|
June 30, 2009 |
|
|
|
|
|
|
| |||
|
Unproved properties |
|
$ |
— |
|
$ |
7,663 |
|
$ |
7,663 |
|
|
Proved properties |
|
— |
|
— |
|
— |
| |||
|
Oilfield equipment |
|
— |
|
— |
|
— |
| |||
|
|
|
— |
|
7,663 |
|
7,663 |
| |||
|
Less accumulated DD&A |
|
— |
|
— |
|
— |
| |||
|
Net capitalized costs |
|
$ |
— |
|
$ |
7,663 |
|
$ |
7,663 |
|
Costs Incurred in Oil and Gas Activities
Costs incurred in connection with Hyperdynamics’ crude oil and natural gas acquisition, exploration and development activities are shown below:
|
|
|
United |
|
Republic of |
|
|
| |||
|
(in thousands) |
|
States |
|
Guinea |
|
Total |
| |||
|
|
|
|
|
|
|
|
| |||
|
June 30, 2011 |
|
|
|
|
|
|
| |||
|
Property acquisition: |
|
|
|
|
|
|
| |||
|
Unproved |
|
$ |
— |
|
$ |
9,226 |
|
$ |
9,226 |
|
|
Proved |
|
— |
|
— |
|
— |
| |||
|
Exploration |
|
— |
|
26,882 |
|
26,882 |
| |||
|
Development |
|
— |
|
— |
|
— |
| |||
|
Total costs incurred |
|
$ |
|
|
$ |
36,108 |
|
$ |
36,108 |
|
|
|
|
|
|
|
|
|
| |||
|
June 30, 2010 |
|
|
|
|
|
|
| |||
|
Property acquisition: |
|
|
|
|
|
|
| |||
|
Unproved |
|
$ |
— |
|
$ |
185 |
|
$ |
185 |
|
|
Proved |
|
— |
|
— |
|
— |
| |||
|
Exploration |
|
— |
|
15,232 |
|
15,232 |
| |||
|
Development |
|
— |
|
— |
|
— |
| |||
|
Total costs incurred |
|
$ |
— |
|
$ |
15,417 |
|
$ |
15,417 |
|
|
|
|
|
|
|
|
|
| |||
|
June 30, 2009 |
|
|
|
|
|
|
| |||
|
Property acquisition: |
|
|
|
|
|
|
| |||
|
Unproved |
|
$ |
— |
|
$ |
— |
|
$ |
— |
|
|
Proved |
|
— |
|
— |
|
— |
| |||
|
Exploration |
|
— |
|
349 |
|
349 |
| |||
|
Development |
|
78 |
|
— |
|
78 |
| |||
|
Total costs incurred |
|
$ |
78 |
|
$ |
349 |
|
$ |
427 |
|
Results of Operations for Producing Activities
The following schedule includes only the revenues from the production and sale of gas, oil, condensate and NGLs. The income tax expense is calculated by applying the current statutory tax rates to the revenues after deducting costs, which include DD&A allowances, after giving effect to permanent differences. Due to significant net operating loss carryforwards related to producing activities, income taxes have not been provided at June 30, 2009. The results of operations exclude general office overhead and interest expense attributable to oil and gas activities. We sold our domestic producing activities in 2009 and have no such activity for the years ended June 30, 2011 or 2010.
|
(in thousands) |
|
2009 |
| |
|
|
|
|
| |
|
Net revenues from production |
|
$ |
2,397 |
|
|
Production costs: |
|
|
| |
|
Oil and gas operating |
|
1,123 |
| |
|
Other taxes |
|
208 |
| |
|
Total production costs |
|
1,331 |
| |
|
|
|
|
| |
|
Depreciation, depletion and amortization |
|
598 |
| |
|
Impairment of oil and gas properties |
|
2,303 |
| |
|
Total costs |
|
4,232 |
| |
|
|
|
|
| |
|
Income (loss) before income taxes |
|
(1,835 |
) | |
|
Income tax expense |
|
— |
| |
|
|
|
|
| |
|
Results of operations |
|
$ |
(1,835 |
) |
|
|
|
|
| |
|
DD&A rate per net equivalent barrel |
|
$ |
17.20 |
|
|
|
|
|
| |
|
DD&A and impairment rate per net equivalent barrel |
|
$ |
83.43 |
|
Proved Reserves
We do not hold any proved reserves as of June 30, 2011 and 2010.
Standardized Measure of Discounted Future Net Cash Flows Relating to Proved Oil and Gas Reserves
Sources of Changes in Discounted Future Net Cash Flows
We hold no proved reserves as of June 30, 2011, 2010 or 2009. Principal changes in the aggregate standardized measure of discounted future net cash flows attributable to the Hyperdynamics’ proved crude oil reserves at year end June 30, 2009 are set forth in the table below.
|
|
|
2009 |
| |
|
|
|
|
| |
|
Standardized measure of discounted future net cash flows at the beginning of the year |
|
$ |
8,842,000 |
|
|
|
|
|
| |
|
Net changes in prices and production costs |
|
— |
| |
|
Changes in estimated future development costs |
|
— |
| |
|
Sales of oil and gas, net of production costs |
|
(1,066,000 |
) | |
|
Extensions, discoveries and improved recovery less related costs |
|
— |
| |
|
Purchases (sales) of minerals in place |
|
(7,776,000 |
) | |
|
Revisions of previous quantity estimates |
|
— |
| |
|
Previously estimated development costs incurred |
|
— |
| |
|
Net change in income taxes |
|
— |
| |
|
Accretion of discount |
|
— |
| |
|
|
|
|
| |
|
Standardized measure of discounted future net cash flows at the end of the year |
|
$ |
— |
|
Item 9. Changes in and Disagreements with Accountants on Accounting and Financial Disclosure
On June 15, 2011, we discharged our former certifying accountant, GBH CPAs, PC. During the past two fiscal years, there were no adverse opinions or disclaimers of opinion, or qualifications or modifications as to uncertainty, audit scope, or accounting principles by GBH CPAs, PC in those reports. The decision to change accountants was approved by our audit committee of the board of directors. During the two fiscal years and during the interim period commencing on July 1, 2010 and ending on June 15, 2011, preceding the discharge of GBH CPAs, PC as our principal accountants, there were no disagreements with GBH CPAs, PC, whether or not resolved, on any matter of accounting principles or practices, financial statement disclosure, or auditing scope or procedure, which, if not resolved to GBH CPAs, PC’s satisfaction, would have caused it to make reference to the subject matter of the disagreement(s) in connection with its report. GBH CPAs, PC did not advise us: (A) that internal controls necessary to develop reliable financial statements did not exist; or (B) that information had come to its attention which made it unwilling to rely on management’s representations, or unwilling to be associated with the financial statements prepared by management; or (C) that the scope of the audit should have been expanded significantly, or that information had come to its that it concluded would, or if further investigated might, (i) materially impact the fairness or reliability of a previously issued audit report or the underlying financial statements, or the financial statements issued or to be issued covering the fiscal period(s) subsequent to the date of the most recent audited financial statements (including information that might prevent the issuance of an unqualified audit report), and (ii) cause it to be unwilling to rely on management’s representations or be associated with our financial statements; or (D)(1) that information had come to its attention that it had concluded materially impacts the fairness or reliability of either: (i) a previously issued audit report or the underling financial statements, or (ii) the financial statements issued or to be issued covering the fiscal period(s) subsequent to the date of the most recent financial statements covered by an audit report (including information that, unless resolved to GBH CPAs, PC’s satisfaction, would prevent it from rendering an unqualified audit report on those financial statements), and (2) that there were any issues that had not be resolved to GBH CPAs, PC’s satisfaction prior to its dismissal.
On June 15, 2011, we engaged Deloitte & Touche to be our new certifying accountant. During the two fiscal years and during the interim period commencing on July 1, 2010 and ending on June 15, 2011, preceding the appointment of Deloitte & Touche LLP as our principal accountants, we did not consult with Deloitte & Touche LLP regarding: the application of accounting principles to a specific completed or contemplated transaction, or the type of audit opinion that might be rendered on our financial statements and neither written or oral advice was provided that was an important factor considered by us in reaching a decision as to the accounting, auditing or financial reporting issue.
We provided the disclosure contained herein to GBH CPAs, PC, which provided a letter addressed to the Commission stating whether it agrees with the statements made by us and, if not, stating the respects in which it does not agree. That letter was filed as Exhibit 16.1 to our Form 8-K filed with the Commission on June 17, 2011.
Item 9A. Controls and Procedures
We conducted an evaluation under the supervision and with the participation of our management, including our Chief Executive Officer and Chief Financial Officer, of the effectiveness of the design and operation of our disclosure controls and procedures. The term “disclosure controls and procedures,” as defined in Rules 13a-15(e) and 15d-15(e) under the Exchange Act, means controls and other procedures of a company that are designed to ensure that information required to be disclosed by the company in the reports it files or submits under the Exchange Act is recorded, processed, summarized and reported, within the time periods specified in the Commission’s rules and forms. Disclosure controls and procedures also include, without limitation, controls and procedures designed to ensure that information required to be disclosed by a company in the reports that it files or submits under the Exchange Act is accumulated and communicated to the company’s management, including its principal executive and principal financial officers, or persons performing similar functions, as appropriate to allow timely decisions regarding required disclosure.
We have identified certain control deficiencies resulting from the lack of effective detective and monitoring controls being designed within internal control over financial reporting. Such deficiencies related to oversight and review of information as prepared or received from external service providers covering marketable securities, income taxes and equity awards and over the presentation of certain accounting principles. These conditions were manifested in a number of adjustments to the financial statements and related disclosures, and there is more than a remote likelihood that a material misstatement of the financial statements would not have been prevented or detected. The combination of these deficiencies represents a material weakness in our internal controls over financial reporting.
In addition we identified certain control deficiencies in our general computer control environment, resulting from the lack of effective controls around the areas of approval and review of information technology changes and system security, including the enforcement of segregation of duties and appropriate user access restrictions. The combination of these deficiencies represents a material weakness in our internal controls over financial reporting.
As a result of these material weaknesses, we concluded that our disclosure controls and procedures were not effective as of June 30, 2011. A material weakness is a deficiency or combination of deficiencies, in internal control over financial reporting, such that there is a reasonable possibility that a material misstatement of our annual or interim financial statements will not be prevented or detected and corrected on a timely basis.
None.
Item 10. Directors, Executive Officers and Corporate Governance.
Board of Directors
The following table sets forth each of our Directors’ name, age, and positions and offices with us. The expiration of each of their current terms as our directors expires at the next annual meeting of our stockholders. There is no family relationship between or among any of the Directors and our Executive Officers. Board vacancies are filled by a majority vote of the Board. We have an Audit Committee, a Compensation Committee, a Nominating and Corporate Governance Committee and a Government Relations Committee.
|
Name |
|
Position |
|
Age |
|
|
|
|
|
|
|
Ray Leonard |
|
Director, CEO and President |
|
58 |
|
|
|
|
|
|
|
Robert A. Solberg * |
|
Director and Non-Executive Chairman |
|
65 |
|
|
|
|
|
|
|
Herman Cohen * |
|
Director |
|
79 |
|
|
|
|
|
|
|
William O. Strange * |
|
Director |
|
68 |
|
|
|
|
|
|
|
Lord David Owen * |
|
Director |
|
73 |
|
|
|
|
|
|
|
Fred Zeidman * |
|
Director |
|
65 |
* Independent Director
Ray Leonard was appointed to the Board of Directors and was appointed CEO and President in July 2009. Mr. Leonard most recently served as the Vice President of Eurasia & Exploration for the newly formed Kuwait Energy Company from December 2006 to June 2009. From January 2005 to November 2006, Mr. Leonard served as the Senior Vice President of International Exploration and Production of MOL Plc. Mr. Leonard also served as Vice President of Exploration & New Ventures for YUKOS, Russia’s second largest oil company, based in Moscow, Russia from February 2001 to December 2004. Prior to joining YUKOS, Leonard held the title of Vice President of Exploration with First International Oil from June 1998 to January 2001. Previously, Mr. Leonard spent 19 years with Amoco, where he began as a geologist and was promoted to the executive level as Vice President of Resource Acquisitions. During his tenure at Amoco, he held a three-year assignment as Division Geologist in West Africa. Mr. Leonard holds a Master of Arts in Geology from the University of Texas-Austin and a Bachelor of Science in Geosciences from the University of Arizona.
In addition to the professional and education background and experience described above, the following experience, qualifications, attributes and/or skills led the Board to conclude that Mr. Leonard should serve as a director:
Leadership Experience — Mr. Leonard has held numerous roles in key executive management over his career including the Vice President of Exploration for YUKOS and First International Oil, and Senior Vice President of Exploration and Production for MOL.
Industry Experience — Mr. Leonard has worked in the Oil & Gas industry his entire career in various Exploration and Production companies and has presented in numerous international forums on world oil reserves and future industry trends.
Robert A. Solberg was appointed to the Board of Directors in August 2009 and serves as non-executive Chairman of the Board. He was the president of Texaco Inc.’s Worldwide Development division from 1998 until his retirement in 2002. Prior to 1998, Mr. Solberg held senior management positions at Texaco, Inc. for operations in the U.S., the Middle East, Asia, Latin America, West Africa and Europe. Mr. Solberg retired in July 2010 after serving as a director and the non-executive chairman of Scorpion Offshore, an offshore drilling company that was traded on the Oslo, Norway stock exchange. Mr. Solberg is also a director and equity participant in JDR Cables Ltd, a privately owned company which supplies custom subsea connection equipment and power cables. Mr. Solberg is a licensed petroleum engineer, and he holds a B.S Degree in Civil Engineering—University of North Dakota (1969).
In addition to the professional and education background and experience described above, the following experience, qualifications, attributes and/or skills led the Board to conclude that Mr. Solberg should serve as a director:
Leadership Experience — Mr. Solberg has held various key executive positions with public companies such as the president of Texaco Inc.’s Worldwide Development division and the chairman of Scorpion Offshore.
Industry Experience — Mr. Solberg has worked in the Oil & Gas industry his entire career in various Exploration and Production companies
Herman Cohen was appointed to the Board of Directors in July 2009. Mr. Cohen has been the owner of Cohen & Woods International since 1998. At Cohen & Woods International, Mr. Cohen specializes in providing strategic planning services to African governments and companies doing business in Africa. Mr. Cohen also served as a Senior Advisor to the Global Coalition for Africa from 1993-1998 under contract to the World Bank. Previous to his position at the World Bank, Mr. Cohen served in the U.S. Foreign Service from 1955-1993. During his diplomatic career, Mr. Cohen served as the U.S. Ambassador to Senegal and Gambia from 1977 to 1980, and from 1989 to 1993 Mr. Cohen served as assistant secretary of state for African Affairs under President George H.W. Bush.
In addition to the professional and education background and experience described above, the following experience, qualifications, attributes and/or skills led the Board to conclude that Mr. Cohen should serve as a director:
Leadership Experience — Mr. Cohen has held numerous responsible roles in the US Government including the American Ambassador to Senegal and the U.S. assistant secretary of state for African Affairs.
William O. Strange was appointed to the Board of Directors in November 2010. Mr. Strange was an audit partner with Deloitte & Touche LLP prior to his retirement in May 2005. He joined the international accounting firm in 1964 and became a partner in 1976. During his 41 years with Deloitte & Touche LLP he specialized in audits of SEC registrants for a variety of publicly traded energy clients in exploration and production, petrochemicals, pipelines and oil services. Since 2005 he has been engaged in independent financial and accounting consulting services. Mr. Strange is a graduate of the University of Oklahoma and lives in Houston. He is on the Finance and Audit Committee of the Presbytery of the New Covenant, the governing body for Presbyterian Churches in the Gulf Coast area. He has served as the President of the Petroleum Club of Houston and as a member of the Major Cases Committee of the Texas State Board of Public Accountancy.
In addition to the professional and education background and experience described above, the following experience, qualifications, attributes and/or skills led the Board to conclude that Mr. Strange should serve as a director:
Leadership Experience — Mr. Strange worked over 41 years for Deloitte & Touche LLP, including 29 years as an audit partner. While at Deloitte & Touche LLP, most of his clients were in the energy industry, including many exploration and production companies and he spent the vast majority of his time working on clients which reported to the SEC. He has also lived overseas and understands foreign operations.
Financial Experience — In addition to his over 41 years at Deloitte & Touche LLP, Mr. Strange was considered a Senior Technical Partner at Deloitte & Touche LLP. He has extensive knowledge of energy industry economics and business methods. He has worked with more than 20 audit committees of public company clients and understands the best practices of audit committees.
Lord David Owen was appointed to the Board of Directors in September 2009. Since 2002, Lord Owen has been the non-executive chairman of Europe Steel, Ltd., and from 1996 to April 2011, the non-executive director of US Healthcare, Abbott Laboratories, Inc. (NYSE: ABT). He was also the chairman of YUKOS International U.K. B.V., part of the former Russian oil company, YUKOS, from 2002 until 2005. Prior to that, he was Executive Chairman of Global Natural Energy Ltd, a metals trading company with interests in gasoline stations in the United Kingdom. Lord Owen was also a member of the advisory board of Terra Firma Capital Partners from 2004 until 2008. He served as a Member of the British Parliament for 26 years and is currently a Member of the House of Lords. In Government Lord Owen was appointed to a number of posts in the British Government including Navy Minister, Health Minister and from 1977 to 1979 British Secretary of State for Foreign and Commonwealth Affairs. During that time he was heavily involved in diplomatic activity in both South and West Africa. Lord Owen was the opposition Labor Party spokesman on Energy from 1979 until 1980. He co-founded the British Social Democratic Party in 1981 and served as its leader from 1983 until 1990. From 1992-95 he was the EU peace negotiator in the former Yugoslavia.
In addition to the professional and education background and experience described above, the following experience, qualifications, attributes and/or skills led the Board to conclude that Lord Owen should serve as a director:
Leadership Experience — Lord Owen has held numerous responsible roles in the British Government and international roles. He also has served on various boards of public companies.
Fred Zeidman was appointed to our Board of Directors in December 2009. Mr. Zeidman has been Chairman of the Board since April 2009 and a director since August 2008 for SulphCo Inc., a publicly traded crude oil field technology oil service company. Since March 2009, Mr. Zeidman has been a Senior Director for Governmental Affairs at Ogilvy Government Relations in Washington D.C. In March 2008, Mr. Zeidman was appointed the Interim President of Nova Biosource Fuels, Inc. (“Nova”), a publicly traded biodiesel technology company, and has served in that position until the company’s acquisition in November 2009 and as a Nova director since June 2007. From August 2009 through November 2009, Mr. Zeidman was appointed Chief Restructuring Officer for Transmeridian Exploration, Inc. and served in that position until its sale in Nov. 2009. Mr. Zeidman has been Bankruptcy Trustee of Aremis Soft Corp since 2004. Mr. Zeidman has served as Vice Chairman of Corporate Strategies, Inc. since July 2004. Mr. Zeidman has served as Chairman of the University of Texas Health Science System since October 2010. Mr. Zeidman served as Chairman of the United States Holocaust Memorial Council from March 2002 through Sept. 2010. Mr. Zeidman was on the board of Compact Power, Inc., an energy storage systems company from November 2007 to November 2009. Mr. Zeidman has served on the board of Prosperity Bank for 26 years. He also served as CEO, President and Chairman of the Board of
Seitel Inc., an oil field services company, from June 2002 to February 2007. Mr. Zeidman served as a Managing Director of the law firm Greenberg Traurig, LLP from July 2003 to December 2008. Mr. Zeidman holds a Bachelor’s degree from Washington University in St. Louis and a Masters in Business Administration degree from New York University.
In addition to the professional and education background and experience described above, the following experience, qualifications, attributes and/or skills led the Board to conclude that Mr. Zeidman should serve as a director:
Leadership Experience — Mr. Zeidman has served in numerous roles of executive and directorship responsibility including serving on the board of Prosperity Bank for 26 years and acting as Chairman of the United States Holocaust Memorial Council.
Financial Experience — Mr. Zeidman has a Masters in Business Administration degree and was the Chief Restructuring Officer for Transmeridian Exploration.
Executive officers
Paul C. Reinbolt, 55, became our Executive Vice President and Chief Financial Officer in August 2011. He has over 30 years of previous experience with Marathon Oil Corporation in various management positions in finance, treasury and accounting. Mr. Reinbolt was appointed Vice President, Finance and Treasurer of Marathon Oil Corporation effective January 2002. Mr. Reinbolt holds a Bachelor of Science degree in accounting and a Master of Business Administration degree in finance from Miami University in Oxford, Ohio. He is on the Board of Directors of Oil Investment Corporation Ltd. and Oil Casualty Investment Corporation Ltd. He also serves as a member of the Business Advisory Council for the Farmer School of Business at Miami University.
Jason D. Davis, 39, became our Chief Financial Officer, Principal Accounting Officer and Corporate Secretary in July 2009. In August 2010, Mr. Davis stepped down as the Chief Financial Officer. He currently serves as the Principal Accounting Officer, Vice President of Finance, Secretary and Treasurer. Mr. Davis is a licensed certified public accountant and has served in various financial positions for several companies including the Assistant Controller at Isolagen, Inc (AMEX: ILE) from March 2004 to August 2005, the Manager of SEC Reporting at Texas Genco, LLC from August 2005 to June 2006, and the Controller at Particle Drilling Technologies, Inc. (PDRT.PK) from June 2006 to June 2009. Mr. Davis also served as the interim Chief Financial Officer for Particle Drilling Technologies, Inc. from January 2009 to June 2009. Mr. Davis was an accountant with Deloitte & Touche LLP after obtaining his BBA in Accountancy and Taxation from the University of Houston in 1997 until 2003.
Michael Palmer, 55, became our Vice President of Operations in May 2010 and in March 2011 was promoted to Senior Vice President of Operations. Mr. Palmer has been working for 30 years in operations and production as a production engineer and manager after graduating from the University of Washington with a degree in Chemical Engineering. He started in the oil industry as a production engineer with Amoco Production Company in 1980 in Powell, Wyoming. During his 19 years with Amoco he worked on various oil projects around the world including the US, Gabon, and Russia. Subsequently he went to work for Nations Energy Company for 9 years initially as the head of the Kazakhstan operation before taking over their Azerbaijan project. Michael was named as one of the top 21 oilmen in Kazakhstan during their first 10 years of existence. Prior to coming to work for Hyperdynamics, Michael was the Chief Operating Officer for SIPC (Syria) in Damascus.
Board Meetings During Fiscal Year 2011
The Board of Directors held 17 meetings during the fiscal year ended June 30, 2011.
Board Committees
Committee Assignments
The table below reflects the composition of the committees of the Board.
|
Name of Director |
|
Audit |
|
Compensation |
|
Nominating and |
|
Government |
|
Robert A. Solberg* |
|
Member |
|
Chairman |
|
Chairman |
|
|
|
William O. Strange |
|
Chairman |
|
Member |
|
Member |
|
|
|
Hon. Lord David Owen |
|
|
|
|
|
Member |
|
Member |
|
Fred Zeidman |
|
Member |
|
Member |
|
Member |
|
|
|
Herman Cohen |
|
|
|
|
|
Member |
|
Chairman |
* Chairman of the Board.
The audit committee of the Company reviews the adequacy of systems and procedures for preparing the financial statements and the suitability of internal financial controls. The audit committee also reviews and approves the scope and performance of the Company’s independent registered public accounting firm. As of June 30, 2011, the members of our Audit Committee consisted of Messrs. Zeidman, Solberg and Strange. All committee members are independent. Mr. Strange is the chairman of the Audit Committee and financial expert based on his experience at Deloitte and Touche LLP. The Audit Committee has a written charter, which was included in our proxy statement filed on March 3, 2009. The audit committee reviews and assesses the adequacy of the Audit Committee charter annually. During the year ended June 30, 2011, the Audit Committee met three times.
As of June 30, 2011, the members of our Compensation Committee consisted of Messrs. Solberg, Zeidman and Strange. Mr. Solberg is the chairman of the Compensation Committee. All committee members are independent. During the year ended June 30, 2011, the Compensation Committee met three times. The Compensation Committee has a written charter, which was included in our proxy statement filed on March 3, 2009.
As of June 30, 2011, the members of our Nominating and Corporate Governance Committee consisted of Messrs. Solberg, Owen, Zeidman, Strange and Cohen. Mr. Solberg is the chairman of the Nomination and Corporate Governance Committee. All committee members are independent. During the year ended June 30, 2011, the Nomination and Corporate Governance Committee met one time. Though neither the Board of Directors nor the Nominating and Corporate Governance Committee has a formal policy concerning diversity, the Board of Directors value diversity on the Board and believes diversity should be considered in the director identification and nominating process.
Our Government Relations Committee was formed in 2009 and its members are Messrs. Cohen, Leonard and Owen. All committee members are independent. Mr. Cohen is the chairman of the Government Relations Committee. During the year ended June 30, 2011, the Governmental Relations Committee did not meet. The Governmental Relations Committee does not have a charter.
Board Leadership Structure and Risk Oversight
Board of Directors Leadership Structure. Our Board of Directors has no fixed policy with respect to the separation of the offices of Chairman of the Board of Directors and Chief Executive Officer. Our Board retains the discretion to make this determination on a case-by-case basis from time to time as it deems to be in the best interests of the Company and our stockholders at any given time. The Board currently believes that separating the positions of CEO and Chairman is the best structure to fit the Company’s needs. This structure ensures a greater role for the independent directors in the oversight of the Company and active participation of the independent directors in setting agendas and establishing priorities and procedures for the work of the Board. As described above, each of the Board’s three committees are comprised entirely of independent directors. The Board also believes that this structure is preferred by a significant number of the Company’s stockholders.
Board of Directors Risk Oversight. The Board’s role in the Company’s risk oversight process includes receiving regular reports from members of senior management on areas of material risk to the Company, including operational, financial, legal and regulatory, and strategic and reputational risks. The full Board (or the appropriate committee in the case of risks that are under the purview of a particular committee) receives these reports from the appropriate “risk owner” within the organization to enable it to understand our risk identification, risk management and risk mitigation strategies. When a committee receives the report, the Chairman of the relevant committee reports on the discussion to the full Board during the next Board meeting. This enables the Board and its committees to coordinate the risk oversight role, particularly with respect to risk interrelationships.
Audit Committee Report
The Audit Committee has reviewed and discussed the audited financial statements with management. The Audit Committee has discussed with the independent auditors the matters required to be discussed by SAS 90 (Codification of Statements on Auditing Standards, AU § 380), as may be modified or supplemented. The Audit Committee has received the written disclosures and the letter from the independent accountants required by the applicable requirements of the Public Company Accounting Oversight Board regarding the independent accountant’s
communications with the Audit Committee concerning independence, as may be modified or supplemented, and has discussed with the independent accountant the independent accountant’s independence. Based on the review and discussions, the Audit Committee recommended to the Board of Directors that the audited financial statements be included in the Company’s Annual Report on Form 10-K for the fiscal year ended June 30, 2011.
|
|
Members of the Audit Committee: |
|
|
|
|
|
|
|
/s/ Robert A. Solberg |
|
|
|
/s/ Fred Zeidman |
|
|
|
/s/ William O. Strange |
|
Section 16(A) Beneficial Ownership Reporting compliance
Section 16(a) of the Securities Exchange Act requires our executive officers and directors, and persons who own more than 10% of our common stock, to file reports regarding ownership of, and transactions in, our securities with the Securities and Exchange Commission and to provide us with copies of those filings. Based solely on our review of the copies of such forms received by us, or written representations from certain reporting persons, we believe that during fiscal year ended June 30, 2011, all filing requirements applicable to its officers, directors and greater than 10% beneficial owners were complied with except for the following late filings: (a) Mr. Roger Friedberger was late filing one Form 4 with respect to one transaction, which was subsequently reported on a Form 4; (b) Lord Owen was late filing one Form 4 with respect to one transaction which was subsequently reported on one Form 4; (c) Mike Palmer was late filing one Form 3 and one Form 4 which were subsequently reported on those forms.
Code of Ethics
We have adopted a Code of Ethics that applies to principal executive officer, principal financial officer, principal accounting officer or controller, or persons performing similar functions, which was filed on Form 10-KSB/A on May 16, 2005. We will provide without charge a copy of our Code of Ethics upon request. Such request should be directed in writing to: Jason Davis, Secretary, Hyperdynamics Corporation, 12012 Wickchester Lane, Suite 475 Houston, TX 77079, voice: (713) 353-9400, fax: (713) 353-9421. Our Web site is www.hyperdynamics.com.
Item 11. Executive Compensation.
Compensation Discussion and Analysis
Our compensation discussion and analysis for the fiscal year ended June 30, 2011 discusses the compensation for our Named Executive Officers (“NEO’s”) who are reflected in the Summary Compensation Table below and consist of our Chief Executive Officer, Principal Financial Officer, and our other executive officer. In this compensation discussion and analysis, the terms “we” and “our” refer to Hyperdynamics Corporation, and not the Compensation Committee.
Compensation Objectives and Elements
What are the objectives of our executive officer compensation program?
The objectives of the Compensation Committee of the Board of Directors in determining executive compensation are to (1) attract and retain key individuals who are important to the continued success of Hyperdynamics, and (2) provide strong financial incentives, at reasonable cost to the shareholders, for senior management to enhance the value of the shareholders’ investment.
What is our executive officer compensation program designed to reward?
Our compensation program is designed to reward individuals for the achievement of our business goals and to foster continuity of management by encouraging key individuals to maintain long-term careers with Hyperdynamics.
What are the elements of our executive officer compensation program and why do we provide each element?
The elements of compensation that the Compensation Committee uses to accomplish these objectives include base salaries, bonus, and long term incentives in the form of stock and stock options. We also provide perquisites to certain executives and health and insurance to all employees. The elements of compensation that we offer help us to attract and retain our officers. The specific purpose of each element is outlined below.
Base Salaries
We provide fixed annual base salaries as consideration for each individual’s performance of his or her job duties. Salaries are set based on level of responsibility, skills, knowledge, experience, and contribution to Hyperdynamics’ business.
Bonus
Bonuses may be awarded as part of annual salary and it is a component of variable compensation. Bonuses are based on goals and objectives that each employee must meet during the fiscal year. Each employee is given a target bonus percentage and the Compensation Committee and the full board of directors determine the awarded bonuses, if any.
Long-term Incentives
We provide long-term incentives in the form of stock and stock options; customarily stock options. Long-term incentives are a component of variable compensation because the amount of income ultimately earned is dependent upon and varies with Hyperdynamics’ common stock price over the term of the option. The stock option awards tie a portion of executive compensation to the stock price and accordingly the financial results of the company. Hyperdynamics does not use a formula to determine stock and stock option awards to executives. Stock option awards are not designed to be tied to yearly results. Hyperdynamics views stock option awards as a means to encourage equity ownership by executives and thus to generally align the interests of the executives with the shareholders.
Hyperdynamics’ 2010 Equity Incentive Plan (the “Plan”) authorizes the Compensation Committee to grant stock options, restricted stock, and stock registered under a Form S-8 registration statement to officers and other key employees. The Compensation Committee implements this authority by awarding stock options designed to align the interests of all senior executives to those of shareholders. This is accomplished by awarding stock options, which rise in value based upon the market price rise of Hyperdynamics’ common stock, on a systematic basis.
We report the estimated fair value of our stock option grants, as determined for accounting purposes in accordance with ASC 718, using either the Black-Scholes option pricing model or a Monte Carlo model, in the Summary Compensation Table and the Grants of Plan-Based Awards table. The amount reflected for accounting purposes does not reflect whether the executive has or will realize a financial benefit from the awards. Because stock option awards are made at a price equal to or above the market price on the date of grant, stock options have no intrinsic value at the time of grant. We believe the potential appreciation of the option awards over the stock price provide motivation to executives.
Perquisites
Perquisites are determined on a case-by-case basis and currently, no executive officer receives such perquisites. Two former officers during fiscal year 2010 did receive perquisites and include the following:
In accordance with his negotiated employment agreement, Harry Briers was provided a company car. Kent Watts (former CEO, President and Director) was provided a company car pursuant to his employment agreement that terminated on July 1, 2009 pursuant to its terms.
How do we determine the amount for each element of executive officer compensation?
Our policy is to provide compensation packages that are competitively reasonable and appropriate for our business needs. We consider such factors as competitive compensation packages as negotiated with our officers; evaluations of the CEO and other executive officers; achievement of performance goals and milestones as additional motivation for certain executives; officers’ ability to work in relationships that foster teamwork among our executive officers; officers’ individual skills and expertise, and labor market conditions. We do not, at this time, engage a third-party compensation consultant.
During the fiscal years ended June 30, 2009, 2010, and 2011, total executive compensation consists of base salary, bonuses and option awards. Generally, the option awards for executives negotiated in the executive’s contract, with an exercise price based on the market price on the grant date. Option awards are also granted to employees on a case by case basis throughout the year. Because of the simplicity of the compensation package, there is very little interaction between decisions about the individual elements of compensation.
The following table reflects each named officer’s base salary and option package for the fiscal year ended June 30, 2011:
|
|
|
Base salary |
|
% of CEO |
|
Options |
|
% of CEO |
| |
|
Ray Leonard, President and CEO |
|
$ |
330,000 |
|
100 |
% |
— |
|
100 |
% |
|
Jason Davis, Vice President Finance and Treasurer |
|
220,000 |
|
67 |
% |
100,000 |
|
n/a |
% | |
|
Michael Palmer, Senior Vice President of Operations |
|
220,000 |
|
67 |
% |
120,000 |
|
n/a |
% | |
Administration of Executive Compensation
The Compensation Committee reviews and approves corporate goals and objectives relevant to compensation of the CEO, evaluates the CEO’s performance and sets his compensation. The Compensation Committee also reviews the CEO’s recommendations for and sets the salaries and bonuses of other key officers and employees.
CEO involvement in compensation decisions
The CEO makes recommendations to the Compensation Committee concerning the employment packages of all subordinate officers. Neither the CEO nor any other company officer or employee attends periodic executive sessions of the Compensation Committee.
How compensation or amounts realizable from prior compensation are considered
The amount of past compensation generally does not affect current year considerations because bonuses and long term incentives are awarded for each individual fiscal year’s job performance.
Tax considerations
The company’s compensation plans are designed generally to ensure full tax deductibility of compensation paid under the plans. This includes compliance with Section 162(m) of the Internal Revenue Code, which limits the company’s tax deduction for an executive’s compensation to $1 million unless certain conditions are met. For fiscal year ended June 30, 2011 the full amount of all compensation provided to all executives was tax deductible to the company.
Timing, grant date, and exercise price for stock option awards
Our policy is to award stock options upon hiring of the employee and on a case by case basis throughout the year. Stock option exercise prices are the closing price on the date of grant. We also have made certain awards based on the completion of performance criteria.
Analysis of variations in individual NEO’s compensation
Each NEO’s compensation is detailed in the Compensation Tables. Each NEO’s contract is described under the caption Agreements with Executives and Officers.
Employment Agreements with Current CEO and our former Principal Financial Officer
As more fully described below in “Agreements with Executives and Officers,” in July 2009, the Compensation Committee approved employment agreements with Ray Leonard, our current CEO and President, and Jason Davis, our former Principal Financial Officer.
COMPENSATION TABLES
The following tables show salaries, bonuses, incentive awards, retirement benefits and other compensation relating to fiscal years ended June 30, 2011 and 2010 for the Chief Executive Officer, Principal Financial Officer, and our other executive officers. Columns for which there was no compensation have been omitted.
SUMMARY COMPENSATION TABLE
|
Name |
|
|
|
|
|
Stock |
|
Option |
|
Bonus |
|
All Other |
|
|
|
|
Position |
|
Year |
|
Salary |
|
($) (d) |
|
Awards |
|
($) (f) |
|
Compensation |
|
Total |
|
|
|
|
|
|
|
|
|
|
|
|
|
|
|
|
|
|
|
Ray Leonard, President and CEO |
|
2011 |
|
330,000 |
|
— |
|
— |
|
594,000 |
|
17,626 |
|
941,626 |
|
|
|
|
2010 |
|
251,788 |
|
— |
|
1,229,649 |
|
522,500 |
|
7,055 |
|
2,010,992 |
|
|
|
|
|
|
|
|
|
|
|
|
|
|
|
|
|
|
|
Jason Davis, Former Principal Financial Officer |
|
2011 |
|
210,000 |
|
— |
|
371,663 |
|
160,000 |
|
16,226 |
|
757,889 |
|
|
|
|
2010 |
|
193,125 |
|
— |
|
301,681 |
|
125,531 |
|
8,944 |
|
629,281 |
|
|
|
|
|
|
|
|
|
|
|
|
|
|
|
|
|
|
|
Michael Palmer, Senior Vice President of Operations |
|
2011 |
|
210,000 |
|
— |
|
424,105 |
|
190,000 |
|
28,362 |
|
852,467 |
|
(1) Columns (d) and (e): Reflects the grant date fair value, computed in accordance with FASB ASC Topic 718, for option awards granted in fiscal year 2011. For a description of the assumptions used for purposes of determining grant date fair value, see Note 12 to the Financial Statements included in this Annual Report on Form 10-K for the year ended June 30, 2011.
(2) Column (f): Payments made on bonus pay-out in July 2011.
(3) Colum (g): Payments made for perquisites that include relocation expense, and company matches of the 401(k) plan.
Bonuses and Stock Awards
The following tables show cash and stock awards made to the named executives in fiscal year 2011, their outstanding equity awards at the end of fiscal year 2011.
GRANTS OF PLAN-BASED AWARDS IN FISCAL YEAR 2011
|
|
|
|
|
|
|
|
|
|
|
Under Non-Equity Incentive Plan Awards |
| ||||||||
|
|
|
|
|
|
|
|
|
|
|
|
|
All Other Option Awards: |
|
|
| ||||
|
Name |
|
Action Date |
|
Grant Date (3) |
|
Threshold |
|
Target |
|
Maximum |
|
Number of |
|
Exercise or |
|
Grant Date Fair |
| ||
|
(a) |
|
(b) |
|
(b) |
|
($) (c) |
|
($) (d) |
|
($) (e) |
|
(#)(f) |
|
($/Share) (g) |
|
($) (h) |
| ||
|
Ray Leonard |
|
|
|
|
|
|
|
|
|
|
|
— |
|
$ |
— |
|
$ |
— |
|
|
Jason Davis |
|
2/15/2011 |
|
2/15/2011 |
|
|
|
|
|
|
|
20,000 |
|
5.03 |
|
84,153 |
| ||
|
Jason Davis |
|
6/30/2011 |
|
6/30/2011 |
|
|
|
|
|
|
|
80,000 |
|
4.30 |
|
287,511 |
| ||
|
Michael Palmer |
|
5/18/2011 |
|
5/18/2011 |
|
|
|
|
|
|
|
25,000 |
|
3.96 |
|
82,686 |
| ||
|
Michael Palmer |
|
6/30/2011 |
|
6/30/2011 |
|
|
|
|
|
|
|
95,000 |
|
4.30 |
|
341,419 |
| ||
As described in the Current Report on Form 8-K with the Securities and Exchange Commission on October 16, 2009, on October 12, 2009, the Board of Directors approved an amendment to Mr. Davis’ employment agreement, that modified the quarterly option grant provisions under his employment agreement. Instead of making future quarterly option grants (following October 2009), the Board of Directors elected to grant Mr. Davis an option to purchase 161,000 shares of common stock. The grant was made pursuant to the Plan. Mr. Davis’ option has an exercise price of $1.61, which was the closing price of our common stock on October 9, 2009 or the trading date immediately preceding the date of grant, a term for five years from the date of grant, and will vest 33% on anniversary date during each of the three years following the grant date.
OUTSTANDING EQUITY AWARDS AT 2011 FISCAL YEAR-END
|
Name |
|
No. of Securities |
|
No. of Securities |
|
Option |
|
Option |
|
No. of |
|
Market |
|
|
(a) |
|
(#)(b) (3) |
|
(#)(c) |
|
(d) |
|
(e) |
|
(#)(f) |
|
($)(g) |
|
|
|
|
|
|
|
|
|
|
|
|
|
|
|
|
|
Ray Leonard |
|
1,177,500 |
|
|
|
0.49 |
|
7/22/2014 |
|
|
|
|
|
|
Ray Leonard |
|
|
|
2,322,500 |
|
0.49 |
|
7/22/2014 |
|
|
|
|
|
|
Jason Davis |
|
45,000 |
|
|
|
0.42 |
|
7/1/2012 |
|
|
|
|
|
|
Jason Davis |
|
53,667 |
|
|
|
1.61 |
|
10/9/2014 |
|
|
|
|
|
|
Jason Davis |
|
|
|
107,333 |
|
1.61 |
|
10/9/2014 |
|
|
|
|
|
|
Jason Davis |
|
100,000 |
|
|
|
0.90 |
|
1/8/2015 |
|
|
|
|
|
|
Jason Davis |
|
|
|
20,000 |
|
5.03 |
|
2/15/2021 |
|
|
|
|
|
|
Jason Davis |
|
|
|
80,000 |
|
4.30 |
|
6/30/2021 |
|
|
|
|
|
|
Michael Palmer |
|
66,667 |
|
|
|
1.06 |
|
5/17/2020 |
|
|
|
|
|
|
Michael Palmer |
|
|
|
133,333 |
|
1.06 |
|
5/17/2020 |
|
|
|
|
|
|
Michael Palmer |
|
|
|
25,000 |
|
3.96 |
|
5/18/2021 |
|
|
|
|
|
|
Michael Palmer |
|
|
|
95,000 |
|
4.30 |
|
6/30/2021 |
|
|
|
|
|
OPTION EXERCISES AND STOCK VESTED DURING FISCAL YEAR 2011
|
Name |
|
No. of |
|
Value Realized |
|
No. of |
|
Value |
|
|
(a) |
|
(#) |
|
($) |
|
(#) |
|
($) |
|
|
|
|
|
|
|
|
|
|
|
|
|
Michael Palmer (1) |
|
100,000 |
|
398,000 |
|
— |
|
— |
|
|
Roger Friedberger (2) |
|
152,000 |
|
480,125 |
|
— |
|
— |
|
(1) Mr. Palmer exercised 100,000 options on January 3, 2011.
(2) Mr. Friedberger exrcised 22,500 options on September 7, 2010; 10,000 options on September 27, 2010; 30,000 options on October 14, 2010; and 90,000 options on February 17, 2011.
Agreements with Current Executives and Officers
Paul Reinbolt, our Chief Financial Officer, entered into an employment agreement effective August 8, 2011. This agreement has a three year term. He will receive an annual base salary of $250,000, increasing to $275,000 upon the completion of six months of employment. He also will be eligible for annual adjustments in the form of increases to his base salary. In addition to his base salary, he will receive a cash award opportunity with a target amount of 50% of his base salary and maximum amount of 100% of the base salary, subject to such other terms, conditions and restrictions as may be established by our board of directors or compensation committee. He will receive stock options in an amount equal to 50% of the number of dollars of the cash award. In other words, if the cash award is $200,000, he will receive an award of
100,000 incentive stock options. The stock options will have an exercise price equal to the fair market value of our common stock on the date of grant, with one-third of these options vesting on each anniversary of the date of grant, and expiring five years after issuance and otherwise governed by the terms of our stock plan under which they were granted.
Effective August 8, 2011, an award of an option to purchase 400,000 shares of our common stock under our 2010 Equity Incentive Plan (the “Plan”) was made to Mr. Reinbolt at an exercise price of $3.24, with 50% of the amount vesting on the first day of the month occurring one year thereafter, and the remaining 50% of the amount vesting on the first day of the month occurring two years thereafter. The options have a five year term. Of this 400,000 share option grant, options to purchase 200,000 shares will immediately vest if we terminate his employment without cause, which solely for purposes of that provision includes financial impropriety or an intentional act materially injuring us. On August 8, 2011, an award of an option to purchase an additional 400,000 shares of our common stock under our Plan was made to Mr. Reinbolt at an exercise price of $3.24, with 50% of these options vesting if and when our stock price closes at $9 per share for five consecutive trading days, and with the remaining 50% vesting if and when our stock price reaches a closing price of $12 per share for five consecutive trading days. These options have a five year term.
The Employment Agreement with Mr. Reinbolt may be earlier terminated by us in the event of his death or inability to perform, or for cause, including material breach of his duties. Mr. Reinbolt may terminate the Employment Agreement for good reason, including a material reduction in his reporting responsibilities or a change of more than 75 miles in the location of his principal place of employment. Either we or Mr. Reinbolt may terminate the Employment Agreement without cause or without good reason. If we terminate Mr. Reinbolt without cause, or if Mr. Reinbolt terminates for good reason, then Mr. Reinbolt will be entitled to receive one year’s base salary, his bonus award at the target level for the performance period in effect on the employment termination date, and full vesting of all stock option and restricted stock awards held by him with a twelve month period to exercise (or the expiration of the award term, if that occurs sooner).
If Mr. Reinbolt’s employment is terminated during the two year period following a change of control for any reason other than death, inability to perform, or cause, or by him for good reason, and our stock price is above $9.00 per share, then he will be entitled to receive a lump-sum amount equivalent to one year’s base salary plus his bonus award at the target level for the performance period in effect on the employment termination date, and he will have full vesting of all stock option and restricted stock awards held by him with a twelve month period to exercise (or the expiration of the award term, if that occurs sooner). The lump sum payment is to be made on the 60th business day after the employment termination date. If our stock price is between $7.50 and $9.00, then he will receive the payments and benefits stated above, but the cash payment will be reduced by 50%. In addition to the foregoing payments and benefits related to a change in control, if Mr. Reinbolt chooses to continue coverage under our health plan in accordance with COBRA, then we will reimburse him during the 18 month period following termination for the difference between the total amount of the COBRA premiums for the same coverage as in effect on termination that are actually paid by him and the total monthly amount of the same premiums charged to active senior executives of ours for health insurance coverage. The Employment Agreement also includes provisions for safeguarding of our confidential information and non-solicitation activities during employment and for a two year period subsequent to termination.
Jason Davis, our Chief Accounting Officer, entered into an employment agreement effective as of July 1, 2009. This agreement has a two-year term that is automatically extended for successive one-year periods following the end of the initial two-year term unless otherwise terminated by delivery of written notice by either party no less than two months prior to the first day of any one-year extension period. The agreement provides that Mr. Davis will serve as our Chief Financial Officer and Principal Accounting Officer. Under the terms of the agreement, Mr. Davis would receive an annual base salary of $185,000, which may be further increased at the sole discretion of the Compensation Committee. This annual base salary was increased to $200,000 effective January 1, 2010. Mr. Davis’ salary could be paid $92,500 per year in cash plus $92,500 payable in common stock under a 10b5-1 plan. The Company has opted to pay all base salary in cash. Mr. Davis is also eligible to receive performance bonus(es) as determined and agreed to from time to time by the Chief Executive Officer and the Board of Directors. Mr. Davis will also be eligible to participate, in the sole discretion of the Compensation Committee, in any long-term incentive arrangements we make available to our executive officers from time to time. In connection with his hiring, we granted Mr. Davis an option to purchase 45,000 shares of our common stock at an exercise price of $0.42 which immediately vested and expire three years after issuance. Under his employment agreement, Mr. Davis was eligible to receive quarterly option grant to purchase 23,000 shares of our common stock. On October 12, 2009, the Board of Directors approved an amendment to Mr. Davis’ employment agreement that modified the foregoing quarterly option grant provisions under his employment agreement. Instead of making future quarterly option grants (following October 2009), the Board of Directors elected to grant Mr. Davis an option to purchase 161,000 shares of common stock. The option has an exercise price of $1.61, which was the closing price of our common stock on October 9, 2009 or the trading date immediately preceding the date of grant, a term for five years from the date of grant, and will vest 33% on the anniversary date during each of the three years following the grant date. Finally, Mr. Davis will receive certain perquisites, including reimbursement in accordance with our standard policies and procedures of business and business-related business expenses and dues and fees to industry and professional organizations, two weeks of paid vacation each calendar year, and participation by Mr. Davis and his spouse and dependents in all benefits, plans and programs available to our executive employees.
We entered into an employment agreement with Ray Leonard, our current CEO, President and Director effective as of July 22, 2009, as amended, effective December 11, 2009. This agreement has a three-year term that is automatically extended for successive one-year periods following the end of the initial two-year term unless otherwise terminated by delivery of written notice by either party no less than two months prior to the first day of any one-year extension period. The agreement provides that Mr. Leonard will serve as our President and Chief Executive Officer. Under the terms of the agreement, the base salary on the effective date of the employment agreement was $180,000. Mr. Leonard’s base salary increased to $330,000, effective January 1, 2010. The base salary is subject to annual adjustments, at the discretion of the Board, but in no event
shall the Company pay Mr. Leonard a base salary less than that set forth above, or any increased base salary later in effect, without the consent of Mr. Leonard.
In connection with his hiring in July 2009, we granted Mr. Leonard an option to purchase 500,000 shares of our common stock at an exercise price of $0.49 which immediately vested. Mr. Leonard was also granted options to purchase 300,000 shares of our common stock at an exercise price of $0.49 that vests on a monthly basis over five years. Both of these options will expire five years after issuance. In addition to the foregoing equity award grants discussed above, under his employment agreement, we will annually award Mr. Leonard additional grants based on achieving longer term performance metrics that will be developed by Mr. Leonard and reviewed and approved by the Board and/or the Compensation Committee as further discussed below.
A stock option award will be made for the following three cumulative net cash to the Company equity capital money raising transactions beginning from the date first written above:
When $8 million cumulative is raised, the award is 210,000 stock options.
When $20 million cumulative is raised, the award is 390,000 stock options.
When $30 million cumulative is raised, the award is 600,000 stock options.
All awards vest 1/36 per month over a three-year period from the trigger event. The Performance Option-Grant Awards options shall have a five year life, and the exercise price shall be $0.49.
A stock option incentive will be made based on achieving the following share price thresholds:
|
$2.00/share |
|
90,000 stock options |
|
|
$3.00/share |
|
210,000 stock options |
|
|
$5.00/share |
|
600,000 stock options |
|
|
$9.00/share |
|
1,200,000 stock options |
|
All awards vest 1/36 per month over a three-year period from the trigger event. The Performance Option-Grant Awards options shall have a five year life, and the exercise price shall be $0.49. For awards related to the $2.00 and $3.00 share price, the stock option is earned if the closing price of the shares trade at or above the target price for 15 consecutive trading days. For awards related to the $5.00 and $9.00 share price, the stock option is earned if the closing price of the shares trade at or above the target price for 5 consecutive trading days.
Beginning with the effective date of the employee agreement, and on an annual basis, Mr. Leonard will participate in any incentive compensation plan (“ICP”) applicable to Mr. Leonard’s position, as may be adopted by the Company from time to time and in accordance with the terms of such plan(s). Mr. Leonard’s target award opportunity under the ICP will be 100% of his base salary with a threshold of 50% and a 200% maximum, and shall be subject to such other terms, conditions and restrictions as may be established by the Board or the Compensation Committee. Annually, Mr. Leonard will develop a proposed set of current year performance metrics that are subject to review and approval by the Board and/or the Compensation Committee. Metrics are as follows:
(i) 100% when industry presentation package is completed; 1,000 square kilometers of 3D is acquired; and a net cash to the Company an aggregate of $15,000,000 in new cash equity capital is raised beginning from the date first written above.
(ii) 200% when all items above are achieved plus either a net cash to the Company an aggregate of $25,000,000 of new cash equity capital is raised, or, a joint venture agreement related to the Company’s 2006 Production Sharing Agreement with the Republic of Guinea is executed.
Finally, Mr. Leonard will receive certain perquisites, including reimbursement in accordance with our standard policies and procedures of business and business-related business expenses and dues and fees to industry and professional organizations, two weeks of paid vacation each calendar year, and participation by Mr. Leonard and his spouse and dependents in all benefits, plans and programs available to our executive employees.
Current Director Compensation
The following table describes the current compensation arrangements in effect for independent directors for the next fiscal year.
|
Director |
|
Quarterly fees |
|
Options |
| |
|
Robert Solberg |
|
$ |
19,500 |
|
40,000 |
(1) |
|
William Strange |
|
$ |
19,000 |
|
40,000 |
(1) |
|
Herman Cohen |
|
$ |
17,500 |
|
40,000 |
(1) |
|
Lord David Owen |
|
$ |
15,000 |
|
40,000 |
(1) |
|
Fred Zeidman |
|
$ |
16,500 |
|
40,000 |
(1) |
|
|
|
|
|
|
| |
(1) 40,000 options to purchase common stock were granted on July 6, 2011 that will vest 50% on July 6, 2012 and 50% on July 6, 2013.
DIRECTOR COMPENSATION
|
|
|
Fees |
|
Stock |
|
Option |
|
All Other |
|
Total |
|
|
Name |
|
($) |
|
($) |
|
($) |
|
($) |
|
($) |
|
|
Ray Leonard (1) |
|
— |
|
— |
|
— |
|
— |
|
— |
|
|
|
|
|
|
|
|
|
|
|
|
|
|
|
Robert A. Solberg |
|
70,500 |
|
— |
|
65,217 |
(2) |
— |
|
135,717 |
|
|
William O. Strange |
|
40,907 |
|
— |
|
123,515 |
(3) |
— |
|
164,422 |
|
|
Roger Friedberger (former Director) |
|
38,000 |
|
— |
|
57,544 |
(4) |
— |
|
95,544 |
|
|
|
|
|
|
|
|
|
|
|
|
|
|
|
Fred Zeidman |
|
55,500 |
|
— |
|
53,708 |
(5) |
— |
|
109,208 |
|
|
Lord David Owen |
|
52,500 |
|
— |
|
47,954 |
(6) |
— |
|
100,454 |
|
|
Herman Cohen |
|
62,500 |
|
— |
|
57,544 |
(7) |
— |
|
120,044 |
|
|
|
|
|
|
|
|
|
|
|
|
|
|
(1) We do not provide additional compensation to employees that also serve as directors for their service on the Board of Directors. All compensation paid to Mr. Leonard is reflected above in the Summary Compensation Table.
(2) During the year ended June 30, 2011, Mr. Solberg received five year options to purchase 68,000 shares of common stock. The options vest 50% on June 30, 2011 and 50% on June 30, 2012and have an exercise price of $1.09 based on the market value of the stock on the date of grant.
(3) During the year ended June 30, 2011, Mr. Strange received five year options to purchase 50,000 shares of common stock. The options vest 50% on November 17, 2011 and 50% on November 17, 2012 and have an exercise price of $2.88
(4) During the year ended June 30, 2011, Mr. Friedberger received five year options to purchase 60,000 shares of common stock. The options vest50% on June 30, 2011 and 50% on June 30, 2012 and have an exercise price of $1.09.
(5) During the year ended June 30, 2011, Mr. Zeidman received five year options to purchase 56,000 shares of common stock. The options vest 50% on June 30, 2011 and 50% on June 30, 2012and have an exercise price of $1.09 based on the market value of the stock on the date of grant.
(6) During the year ended June 30, 2011, Mr. Owen received five year options to purchase 50,000 shares of common stock. The options vest 50% on June 30, 2011 and 50% on June 30, 2012and have an exercise price of $1.09 based on the market value of the stock on the date of grant.
(7) During the year ended June 30, 2011, Mr. Cohen received five year options to purchase 60,000 shares of common stock. The options vest 50% on June 30, 2011 and 50% on June 30, 2012and have an exercise price of $1.09 based on the market value of the stock on the date of grant.
In connection with the commencement of Ray Leonard’s employment with us as our Chief Executive Officer and President in July 2009, as more fully described above in “Agreements with Executives and Officers,” on July 22, 2009, our Board of Directors appointed Mr. Leonard to serve as a member of our Board of Directors. Mr. Leonard does not receive compensation for service on our Board of Directors in addition to his compensation as Chief Executive Officer and President.
On June 30, 2011, the Board of Directors modified the structure by which we compensate our independent directors for service as members of our Board. Each of our independent directors will be compensated for his service on our Board of Directors under the structure below The new compensation arrangements which became effective July 1, 2011, consist of the following:
· Cash compensation consisting of quarterly payments, as applicable, of: (i) $11,000 for services as a director, (ii) $5,000 for service as the chairman of the Audit Committee and Government Relations Committee, (iii) $2,500 for service as a member of the Audit Committee or Government Relations Committee, (iv) $1,500 for service as a member of the Compensation Committee or Nomination Committee, and (v) $3,000 for service as the chairman of the Compensation Committee and Nomination Committee.
· An annual grant, pursuant to a stock incentive plan, of options to purchase shares of our common stock. The options are to be granted on or about July 1st of each year, have an exercise price equal to the closing price of our common stock on the day prior to the grant date, vest 50% on the first anniversary of the grant date and vest the remaining 50% on the second anniversary of the grant date. The options will have a 5 year term.
Director Option Grants
On June 30, 2010, the Board made the annual grant (referenced above) of options to our directors as reflected in the table below. The grants were made pursuant to the 2010 Equity Incentive Plan. Each option has an exercise price of $1.09, which was the closing price of our common stock on June 30, 2010 or the trading date immediately preceding the date of grant, a term for five years from the date of grant, and vest 50% on June 30, 2011 and 50% on June 30, 2012. The following table sets forth the number of shares of our common stock underlying the options granted to each of our independent directors on June 30, 2010:
|
Name of Director |
|
Shares of Common Stock |
|
Robert A. Solberg |
|
68,000 |
|
Roger D. Friedberger (former Director) |
|
60,000 |
|
William O. Strange |
|
— |
|
Fred Zeidman |
|
56,000 |
|
Herman Cohen |
|
60,000 |
|
Hon. Lord David Owen |
|
50,000 |
Compensation Committee Interlocks and Insider Participation
No executive officer of Hyperdynamics served as a member of the board of directors of any other public company during the year ended June 30, 2011. No member of the Compensation Committee serves as an executive officer of any other public company during the year ended June 30, 2011. No interlocking relationship exists between the members of our Compensation Committee and the board of directors or compensation committee of any other company.
Compensation Committee Report
The Compensation Committee, consisting of Messrs. Solberg, Strange and Zeidman, is responsible for establishing and administering the executive compensation programs of Hyperdynamics. The Compensation Committee of Hyperdynamics has reviewed and discussed the Compensation Discussion and Analysis required by Item 402(b) of Regulation S-K with management and, based on such review and discussions, the Compensation Committee recommended to the Board that the Compensation Discussion and Analysis be included in this Annual Report.
|
|
THE COMPENSATION COMMITTEE |
|
|
|
|
|
|
|
/s/ Robert Solberg |
|
|
|
/s/ William Strange |
|
|
|
/s/ Fred Zeidman |
|
Item 12. Security Ownership of Certain Beneficial Owners and Management and Related Stockholder Matters.
Equity Compensation Plan Information
The following table gives aggregate information under all equity compensation plans of Hyperdynamics as of June 30, 2011.
Equity Compensation Plan Information
|
|
|
Number of |
|
Weighted- |
|
Number of |
|
|
Plan Category |
|
A |
|
B |
|
C |
|
|
Equity compensation plans approved by security holders |
|
9,274,854 |
|
1.85 |
|
1,069,480 |
|
|
Equity compensation plans not approved by security holders |
|
— |
|
— |
|
— |
|
|
Total |
|
9,274,854 |
|
1.85 |
|
1,069,480 |
|
The Stock and Stock Option Plan (the “1997 Plan”) of Hyperdynamics was adopted May 7, 1997 and amended on December 3, 2001, on January 21, 2005, and on February 20, 2008. The total number of shares authorized under the Plan, as amended, was 14,000,000. The Board terminated the 1997 Plan effective upon approval of the 2010 Plan by our shareholders as discussed below.
Shareholders approved the adoption of the 2008 Restricted Stock Award Plan (the “2008 Plan”) at Hyperdynamics’ Annual Meeting on February 20, 2008. The total number of shares authorized under the 2008 Plan was 3,000,000. The Board terminated the 2008 Plan effective upon approval of the 2010 Plan by our shareholders as discussed below.
On February 18, 2010, at our annual meeting of stockholders, the board of directors and stockholders approved the 2010 Equity Incentive Plan (the “2010 Plan”). In conjunction with the approval of the 2010 Plan at the annual meeting, the 1997 Plan and 2008 Plan were terminated as of February 18, 2010. The 2010 Plan provides for the grants of shares of common stock or incentive stock options and/or nonqualified stock options to purchase our common stock or restricted stock to selected employees, directors, officers, agents, consultants, attorneys, vendors and advisors of ours’ or of any parent or subsidiary thereof. Shares of common stock, options, or restricted stock can only be granted under this plan within 10 years from the effective date of February 18, 2010. A maximum of 5,000,000 shares are issuable under the 2010 Plan.
The 2010 Plan provides a means to attract and retain the services of participants and also to provide added incentive to such persons by encouraging stock ownership in the Company. Plan grants are administered by the Compensation Committee, who has substantial discretion to determine which persons, amounts, time, price, exercise terms and restrictions, if any.
The following table provides a reconciliation of the securities remaining available for issuance as of June 30, 2011 under the Plans.
|
|
|
2010 Plan |
|
|
Shares available for issuance, June 30, 2010 |
|
3,851,000 |
|
|
Increase in shares issuable |
|
— |
|
|
Stock options issued |
|
(2,906,520 |
) |
|
Previously issued shares cancelled or expired |
|
125,000 |
|
|
Plan termination of remaining unissued shares |
|
— |
|
|
Shares available for issuance, June 30, 2011 |
|
1,069,480 |
|
The purpose of the Plans are to further our interest, and the interest of our subsidiaries and our stockholders by providing incentives in the form of stock or stock options to key employees, consultants, directors, and vendors who contribute materially to our success and profitability. We believe that our future success will depend in part on our continued ability to attract and retain highly qualified personnel as employees, independent consultants, and attorneys. The issuance of stock and grants of options and warrants will recognize and reward outstanding individual performances and contributions and will give such persons a proprietary interest in us, thus enhancing their personal interest in our continued success and progress. We pay wages, salaries, and consulting rates that we believe are competitive. We use the 2010 Plan to augment our compensation packages.
Security ownership of certain beneficial owners and management
The following table sets forth certain information with respect to the beneficial ownership of shares of Common Stock by (1) each person known to us that owns beneficially more than 5% of the outstanding shares of Common Stock, (2) each of our Directors, (3) each of our Executive Officers, and (4) all of our Executive Officers and Directors as a group. At September 9, 2011, we had 156,116,692 shares of common stock outstanding. Beneficial ownership is determined in accordance with Rule 13d-3 under the Securities Exchange Act of 1934. In computing the number of shares beneficially owned by a person or group and the percentage ownership of that person or group, shares of our Common Stock subject to options currently exercisable or exercisable within 60 days after September 9, 2011 are deemed outstanding, but are not deemed outstanding for purposes of computing the percentage ownership of any other person. The address of each Director & Officer named in the below table is c/o Hyperdynamics Corporation, 12012 Wickchester Lane, Suite 475 Houston, TX 77079.
|
Name and Address of Beneficial Owner |
|
Number of |
|
Percent of |
|
|
|
|
|
|
|
|
|
BlackRock, Inc |
|
24,529,000 |
(1) |
15.7 |
% |
|
|
|
|
|
|
|
|
|
|
|
|
|
|
|
Ray Leonard |
|
1,474,833 |
(2) |
1.0 |
|
|
|
|
|
|
|
|
|
Robert A. Solberg |
|
530,600 |
(3) |
* |
|
|
|
|
|
|
|
|
|
Lord David Owen |
|
489,660 |
(4) |
* |
|
|
|
|
|
|
|
|
|
Herman Cohen |
|
91,000 |
(5) |
* |
|
|
|
|
|
|
|
|
|
Fred Zeidman |
|
78,000 |
(6) |
* |
|
|
|
|
|
|
|
|
|
William O. Strange |
|
15,000 |
(7) |
|
|
|
|
|
|
|
|
|
|
Jason Davis |
|
306,000 |
(8) |
* |
|
|
|
|
|
|
|
|
|
|
|
|
|
|
|
|
Michael Palmer |
|
129,467 |
(9) |
* |
|
|
|
|
|
|
|
|
|
Paul Reinbolt |
|
— |
(10) |
* |
|
|
|
|
|
|
|
|
|
Directors and Executive Officers as a group (8 persons) |
|
3,114,560 |
|
2.0 |
|
* Less than 1%
(1) Based on the total of Schedules 13F filed for the period ended June 30, 2011. The address of BlackRock, Inc. is 55 East 52nd Street, New York, NY 10055.
(2) This amount includes: 419,000 shares of common stock and options to purchase 1,055,833 shares of common stock
(3) This amount includes: 146,600 shares of common stock and options to purchase 384,000 shares of common stock.
(4) This amount includes: 364,660 shares of common stock and options to purchase 125,000 shares of common stock.
(5) This amount includes: 31,000 shares of common stock and options to purchase 60,000 shares of common stock.
(6) This amount includes options to purchase 78,000 shares of common stock.
(7) This amount includes 15,000 shares of common stock.
(8) This amount includes options to purchase 306,000 shares of common stock.
(9) This amount includes: 129,467 shares of common stock.
(10) Paul Reinbolt does not own any shares of common stock
Item 13. Certain Relationships and Related Transactions, and Director Independence.
We have a conflict of interest policy governing transactions involving related parties. In accordance with the policy, transactions involving related parties must be pre-approved by the Audit Committee, which is comprised of independent directors.
We did not enter into any transactions involving amounts in excess of $120,000 (or 1% of the average of our total assets for the last two years), excluding employment relationships, with related parties since July 1, 2010, the beginning of the last fiscal year.
Series B Preferred Stock
On September 29, 2009, subsequent to fiscal year 2009, we entered into an agreement (the “Series B Agreement”) with the holders of all of our Series B preferred stock in which the Series B holders (i) converted all of their shares of Series B preferred stock into approximately 15,822,222 shares of common stock, (ii) agreed to the cancellation of warrants to purchase 1,000,000 shares of common stock, (iii) agreed to donate, pursuant to a specified schedule, 2,000,000 shares of common stock, issued upon conversion of the Series B preferred stock, and warrants to purchase 1,000,000 shares of common stock, to the American Friends of Guinea, a charitable organization that provides support to the people of Guinea, and (iv) agreed to be subject to a nine month lock-up of the 15,822,222 shares of common stock received in connection with the conversion of the Series B preferred stock, and any shares that may be received upon exercise of their warrants. The common stock received upon conversion represented a reduction of 2,000,000 shares that otherwise would have been issuable under the original terms of the Series B preferred stock.
Under the terms of the Series B Agreement, if we complete an equity or debt financing in the future of $10,000,000 or more, we also agreed to (i) pay a previously owed dividend in the aggregate amount of approximately $430,000 to the Series B holders and (ii) subject to market conditions, release from the lock-up provision described above, up to 1,000,000 shares of common stock received in connection with the Series B preferred stock conversion in order to allow for resale by the Series B holders.
Director Independence
Our common stock is listed on the NYSE. We use SEC Rule 10A-3 and the NYSE definition of Independent Director in determining whether a Director is independent in the capacity of Director and in the capacity as a member of a board committee. In determining Director independence, we have not relied on any exemptions from any rule’s definition of independence. In addition to the requirements of SEC Rule 10A-3 under the Securities Exchange Act of 1934, the NYSE rules provide that “Independent Director” means a person other than an executive officer or employee of the company.
Directors serving on our audit committee must also comply with additional NYSE requirements as follows:
(a) The Director must not have participated in the preparation of our financial statements or any current subsidiary at any time during the past three years; and
(b) The Director is able to read and understand fundamental financial statements, including our balance sheet, income statement, and cash flow statement.
We currently have a total of six directors, five of whom are Independent Directors. Our Independent Directors are: Fred Zeidman, William O. Strange, Robert A. Solberg, Herman Cohen and Lord David Owen.
Item 14. Principal Accounting Fees and Services
Audit Fees
Our former Certifying Accountant: GBH CPAs, billed us in the aggregate amount of $163,965 and $145,308 for the fiscal years ended June 30, 2011 and 2010, for professional services related to: their reviews of our unaudited quarterly financial statements included in our Form 10-Qs and registration statements (there were no Sarbanes-Oxley 404 attest services for the fiscal year ended June 30, 2010).
Our current Certifying Accountant: Deloitte & Touche LLP, billed us in the aggregate amount of $130,000 for the fiscal year ended June 30, 2011, for professional services related to their audit of our annual financial statements in our Form 10K and Sarbanes-Oxley 404 attest services for the fiscal year ended June 30, 2011.
Audit-Related Fees
Our former Certifying Accountant: GBH CPAs, billed us $21,315 for professional services rendered for assurance and related services that were reasonably related to the performance of audit or review of the Company’s financial statements for the fiscal year ended June 30, 2011.
Tax Fees
Malone & Bailey, PC billed us in the aggregate amount of $18,630 and $27,840 professional services rendered for tax related services for the fiscal year ended June 30, 2011 and 2010, respectively.
All Other Fees
Former Certifying Accountant: GBH CPAs, did not perform, and accordingly did not bill us for, professional services rendered for any other services for the fiscal year ended June 30, 2011.
Current Certifying Accountant: Deloitte & Touche LLP did not perform, and accordingly did not bill us for, professional services rendered for any other services for the fiscal years ended June 30, 2011 and 2010.
Audit Committee Pre-Approval
Our Audit Committee Charter provides that either (i) the Audit Committee shall pre-approve all auditing and non-auditing services of the independent auditor, subject to deminimus exceptions for other than audit, review or attest services that are approved by the Audit Committee prior to completion of the audit; or (ii) the engagement of the independent auditor be entered into pursuant to pre-approved policies and procedures established by the Audit Committee, provided that the policies and procedures are detailed as to the particular services and the Audit Committee is informed of each service. The Audit Committee pre-approved 100% of GBH CPAs and Deloitte & Touche LLP fees, respectively, for audit services in year 2011, 2010 and 2009. Fees for audit-related services performed by GBH CPAs and Deloitte & Touche LLP fees in fiscal years 2011, 2010 and 2009 were not recognized by us at the time of the engagement to be non-audit services. Except as indicated above, there were no fees other than audit fees for years 2011, 2010 and 2009, and the auditors engaged performed all the services described above with their full time permanent employees.
Item 15 Exhibits, Financial Statement Schedules
(A)
|
Exhibit |
|
Description |
|
|
|
|
|
3.1.1 |
|
Certificate of Incorporation (1) |
|
|
|
|
|
3.1.2 |
|
Certificate of Amendment of Certificate of Incorporation, dated January 21, 1997 (1) |
|
|
|
|
|
3.1.3 |
|
Certificate of Amendment of Certificate of Incorporation, dated September 20, 1999 (1) |
|
|
|
|
|
3.1.4 |
|
Certificate of Amendment of Certificate of Incorporation, dated December 22, 2003 (1) |
|
|
|
|
|
3.1.5 |
|
Certificate of Amendment of Certificate of Incorporation, dated March 11, 2011 (2) |
|
|
|
|
|
3.1.5 |
|
Series B Certificate of Designation (5) |
|
|
|
|
|
3.2 |
|
Amended and Restated By-laws (23) |
|
|
|
|
|
4.1 |
|
Form of Common Stock Certificate (3) |
|
|
|
|
|
4.2 |
|
Warrant issued to Trendsetter Investors, LLC on June 12, 2007 (4) |
|
|
|
|
|
10.1 |
|
Hydrocarbon Production Sharing Contract (PSA) between SCS Corporation and the Republic of Guinea, dated September 22, 2006 (6) |
|
|
|
|
|
10.2 |
|
Amendment No. 1 to the Hydrocarbons Production Sharing Contract between SCS Corporation and the Republic of Guinea, dated March 25, 2010 (11) |
|
|
|
|
|
10.3* |
|
Employment Agreement between Hyperdynamics and Jason D. Davis, dated June 17, 2009 (8) |
|
|
|
|
|
10.4* |
|
Amendment No. 1 to the Employment Agreement between Hyperdynamics Corporation and Jason D. Davis, dated October 16, 2009 (20) |
|
|
|
|
|
10.5* |
|
Employment Agreement between Hyperdynamics and Ray Leonard, dated July 22, 2009 (9) |
|
|
|
|
|
10.6* |
|
Amendment No. 1 to Employment Agreement between Hyperdynamics Corporation and Ray Leonard, dated December 11, 2009 (15) |
|
|
|
|
|
10.7 |
|
Sale and Purchase Agreement between Hyperdynamics Corporation and Dana Petroleum (E&P) Limited, effective as of December 4, 2009 (12) |
|
|
|
|
|
10.8 |
|
Letter Agreement between Hyperdynamics Corporation and Dana Petroleum (E&P) Limited, dated December 2, 2009 (12) |
|
|
|
|
|
10.9 |
|
Operating Agreement between SCS Corporation and Dana Petroleum (E&P) Limited, dated January 28, 2010 (16) |
|
|
|
|
|
10.10 |
|
Lease Agreement between Hyperdynamics Corporation and Parkway Properties LP, dated December 29, 2009 (17) |
|
|
|
|
|
10.11 |
|
Memorandum of Understanding between the Government of the Republic of Guinea and SCS Corporation, dated September 11, 2009 (English translation) (7) |
|
|
|
|
|
10.14 |
|
Marine 2D Seismic Data Acquisition Services Agreement between Hyperdynamics Corporation and Bergen Oilfield Services AS of Norway, dated September 29, 2009 (18) |
|
|
|
|
|
10.15 |
|
3D Seismic Contract between PGS Geophysical AS, Norway and Hyperdynamics Corporation, dated June 11, 2010 (21) |
|
|
|
|
|
10.17* |
|
2010 Equity Incentive Plan (10) |
|
|
|
|
|
10.18* |
|
Form of Incentive Stock Option Agreement (10) |
|
|
|
|
|
10.19* |
|
Form of Non-Qualified Stock Option Agreement (10) |
|
|
|
|
|
10.20* |
|
Form of Restricted Stock Agreement (10) |
|
10.21 |
|
Master Service Agreement for Geophysical Data Processing Services between SCS Corporation and PGS Data Processing, Inc., dated July 2, 2010 (21) |
|
|
|
|
|
10.22 |
|
Supplemental Agreement No. 1 to Master Service Agreement between SCS Corporation and PGS Data Processing, Inc., dated July 2, 2010 (21) |
|
|
|
|
|
10.23 |
|
Form of Stock Purchase Agreement, dated November 3, 2010 among Hyperdynamics Corporation and the Investors (22) |
|
|
|
|
|
10.24 |
|
Form of Registration Rights Agreement, dated November 3, 2010 among Hyperdynamics Corporation and the Investors (22) |
|
|
|
|
|
10.25 |
|
Contract Number: AGR/C105/10 between SCS Corporation and AGR Peak Well Management Limited for Provision of Well Construction Management Services, including LOGIC General Conditions as Appendix I (13) |
|
|
|
|
|
10.26 |
|
Employment Agreement between Hyperdynamics and Paul C. Reinbolt effective August 8, 2011 (24) |
|
|
|
|
|
14.1 |
|
Code of Ethics (1) |
|
|
|
|
|
21.1** |
|
List of Subsidiaries |
|
|
|
|
|
23.1** |
|
Consent of Independent Registered Public Accounting Firm–Deloitte & Touche LLP |
|
|
|
|
|
23.2** |
|
Consent of Independent Registered Public Accounting Firm–GBH CPAs, PC |
|
|
|
|
|
31.1** |
|
Certification of Chief Executive Officer of Hyperdynamics Corporation required by Rule 13a-14(a) of the Securities Exchange Act of 1934, as adopted pursuant to Section 302 of the Sarbanes-Oxley Act of 2002 |
|
|
|
|
|
31.2** |
|
Certification of Chief Financial Officer of Hyperdynamics Corporation required by Rule 13a-14(a) of the Securities Exchange Act of 1934, as adopted pursuant to Section 302 of the Sarbanes-Oxley Act of 2002 |
|
|
|
|
|
32.1** |
|
Certification of Chief Executive Officer of Hyperdynamics Corporation pursuant to Section 906 of the Sarbanes-Oxley Act of 2002 and Section 1350 of Chapter 63 of Title 18 of the United States Code (18 U.S.C. 1350) |
|
|
|
|
|
32.2** |
|
Certification of Principal Financial Officer of Hyperdynamics Corporation pursuant to Section 906 of the Sarbanes-Oxley Act of 2002 and Section 1350 of Chapter 63 of Title 18 of the United States Code (18 U.S.C. 1350) |
|
* |
Management contracts or compensatory plans or arrangements. |
|
** |
Filed herewith. |
|
(1) |
Incorporated by reference to Form 10-KSB/A filed May 16, 2005. |
|
(2) |
Incorporated by reference to Schedule 14A filed January 11, 2011 and filed herewith. |
|
(3) |
Incorporated by reference to Form S-1 filed January 12, 2006, as amended. |
|
(4) |
Incorporated by reference to Form 8-K filed June 18, 2007. |
|
(5) |
Incorporated by reference to Form 8-K filed June 15, 2001. |
|
(6) |
Incorporated by reference to Form 8-K filed September 28, 2006. |
|
(7) |
Incorporated by reference to Form 8-K filed September 15, 2009. |
|
(8) |
Incorporated by reference to Form 8-K filed July 6, 2009. |
|
(9) |
Incorporated by reference to Form 8-K filed July 23, 2009. |
|
(10) |
Incorporated by reference to Form S-8 filed June 14, 2010. |
|
(11) |
Incorporated by reference to Form 8-K, dated March 31, 2010. |
|
(12) |
Incorporated by reference to Form 8-K, filed December 7, 2009. |
|
(13) |
Incorporated by reference to Form 8-K filed December 6, 2010. |
|
(14) |
Intentionally omitted. |
|
(15) |
Incorporated by reference to Form 8-K, dated December 11, 2009. |
|
(16) |
Incorporated by reference to Form 8-K, dated January 29, 2010. |
|
(17) |
Incorporated by reference to Form 8-K, dated January 6, 2010. |
|
(18) |
Incorporated by reference to Form 8-K filed October 2, 2009. |
|
(19) |
Intentionally omitted. |
|
(20) |
Incorporated by reference to Form 8-K filed on October 16, 2009. |
|
(21) |
Incorporated by reference to Form 10-K filed on September 28, 2010. |
|
(22) |
Incorporated by reference to Form 8-K filed on November 4, 2010. |
|
(23) |
Incorporated by reference to Form 8-K filed on August 24, 2011. |
|
(24) |
Incorporated by reference to Form 8-K filed on July 8, 2011. |
(B)
FINANCIAL STATEMENT SCHEDULES
The financial statement schedules required by this item are set forth in the notes to our financial statements set forth on [page 31] and F-1.
Pursuant to the requirements of Section 13 or 15(d) of the Securities Exchange Act of 1934, the Registrant has duly caused this report to be signed on its behalf by the undersigned, thereunto duly authorized.
|
|
|
HYPERDYNAMICS CORPORATION |
|
|
|
|
|
|
|
|
|
September 13, 2011 |
|
/s/ Ray Leonard |
|
|
|
|
|
Ray Leonard |
|
|
|
|
|
President, CEO and Director |
|
|
Pursuant to the requirements of the Securities Exchange Act of 1934, this report has been signed below by the following persons on behalf of the registrant and in the capacities and on the dates indicated.
|
September 13, 2011 |
|
/s/ Robert A. Solberg |
|
|
|
|
|
Robert A. Solberg |
|
|
|
|
|
Non-Executive Chairman and Director |
|
|
|
|
|
|
|
|
|
|
|
|
|
|
|
September 13, 2011 |
|
/s/ Ray Leonard |
|
|
|
|
|
Ray Leonard |
|
|
|
|
|
President, CEO and Director |
|
|
|
|
|
|
|
|
|
|
|
|
|
|
|
September 13, 2011 |
|
/s/ William Strange |
|
|
|
|
|
William Strange |
|
|
|
|
|
Director |
|
|
|
|
|
|
|
|
|
|
|
|
|
|
|
September 13, 2011 |
|
/s/ Fred Zeidman |
|
|
|
|
|
Fred Zeidman |
|
|
|
|
|
Director |
|
|
|
|
|
|
|
|
|
|
|
|
|
|
|
September 13, 2011 |
|
/s/ David Owen |
|
|
|
|
|
David Owen |
|
|
|
|
|
Director |
|
|
|
|
|
|
|
|
|
|
|
|
|
|
|
September 13, 2011 |
|
/s/ Herman Cohen |
|
|
|
|
|
Herman Cohen |
|
|
|
|
|
Director |
|
|
|
|
|
|
|
|
|
|
|
|
|
|
|
September 13, 2011 |
|
/s/ Paul Reinbolt |
|
|
|
|
|
Paul Reinbolt |
|
|
|
|
|
Executive Vice President and Chief Financial Officer | ||
|
|
|
|
|
|
|
|
|
|
|
|
|
September 13, 2011 |
|
/s/ Jason Davis |
|
|
|
|
|
Jason Davis |
|
|
|
|
|
Vice President and Principal Accounting Officer | ||
EXHIBIT INDEX
|
Exhibit |
|
Description |
|
|
|
|
|
3.1.1 |
|
Certificate of Incorporation (1) |
|
|
|
|
|
3.1.2 |
|
Certificate of Amendment of Certificate of Incorporation, dated January 21, 1997 (1) |
|
|
|
|
|
3.1.3 |
|
Certificate of Amendment of Certificate of Incorporation, dated September 20, 1999 (1) |
|
|
|
|
|
3.1.4 |
|
Certificate of Amendment of Certificate of Incorporation, dated December 22, 2003 (1) |
|
|
|
|
|
3.1.5 |
|
Certificate of Amendment of Certificate of Incorporation, dated March 11, 2011 (2) |
|
|
|
|
|
3.1.6 |
|
Series B Certificate of Designation (5) |
|
|
|
|
|
3.2 |
|
Amended and Restated By-laws (23) |
|
|
|
|
|
4.1 |
|
Form of Common Stock Certificate (3) |
|
|
|
|
|
4.2 |
|
Warrant issued to Trendsetter Investors, LLC on June 12, 2007 (4) |
|
|
|
|
|
10.1 |
|
Hydrocarbon Production Sharing Contract (PSA) between SCS Corporation and the Republic of Guinea, dated September 22, 2006 (6) |
|
|
|
|
|
10.2 |
|
Amendment No. 1 to the Hydrocarbons Production Sharing Contract between SCS Corporation and the Republic of Guinea, dated March 25, 2010 (11) |
|
|
|
|
|
10.3* |
|
Employment Agreement between Hyperdynamics and Jason D. Davis, dated June 17, 2009 (8) |
|
|
|
|
|
10.4* |
|
Amendment No. 1 to the Employment Agreement between Hyperdynamics Corporation and Jason D. Davis, dated October 16, 2009 (20) |
|
|
|
|
|
10.5* |
|
Employment Agreement between Hyperdynamics and Ray Leonard, dated July 22, 2009 (9) |
|
|
|
|
|
10.6* |
|
Amendment No. 1 to Employment Agreement between Hyperdynamics Corporation and Ray Leonard, dated December 11, 2009 (15) |
|
|
|
|
|
10.7 |
|
Sale and Purchase Agreement between Hyperdynamics Corporation and Dana Petroleum (E&P) Limited, effective as of December 4, 2009 (12) |
|
|
|
|
|
10.8 |
|
Letter Agreement between Hyperdynamics Corporation and Dana Petroleum (E&P) Limited, dated December 2, 2009 (12) |
|
|
|
|
|
10.9 |
|
Operating Agreement between SCS Corporation and Dana Petroleum (E&P) Limited, dated January 28, 2010 (16) |
|
|
|
|
|
10.10 |
|
Lease Agreement between Hyperdynamics Corporation and Parkway Properties LP, dated December 29, 2009 (17) |
|
|
|
|
|
10.11 |
|
Memorandum of Understanding between the Government of the Republic of Guinea and SCS Corporation, dated September 11, 2009 (English translation) (7) |
|
|
|
|
|
10.14 |
|
Marine 2D Seismic Data Acquisition Services Agreement between Hyperdynamics Corporation and Bergen Oilfield Services AS of Norway, dated September 29, 2009 (18) |
|
|
|
|
|
10.15 |
|
3D Seismic Contract between PGS Geophysical AS, Norway and Hyperdynamics Corporation, dated June 11, 2010 (21) |
|
|
|
|
|
10.17* |
|
2010 Equity Incentive Plan (10) |
|
|
|
|
|
10.18* |
|
Form of Incentive Stock Option Agreement (10) |
|
|
|
|
|
10.19* |
|
Form of Non-Qualified Stock Option Agreement (10) |
|
|
|
|
|
10.20* |
|
Form of Restricted Stock Agreement (10) |
|
10.21 |
|
Master Service Agreement for Geophysical Data Processing Services between SCS Corporation and PGS Data Processing, Inc., dated July 2, 2010 (21) |
|
|
|
|
|
10.22 |
|
Supplemental Agreement No. 1 to Master Service Agreement between SCS Corporation and PGS Data Processing, Inc., dated July 2, 2010 (21) |
|
|
|
|
|
10.23 |
|
Form of Stock Purchase Agreement, dated November 3, 2010 among Hyperdynamics Corporation and the Investors (22) |
|
|
|
|
|
10.24 |
|
Form of Registration Rights Agreement, dated November 3, 2010 among Hyperdynamics Corporation and the Investors (22) |
|
|
|
|
|
10.25 |
|
Contract Number: AGR/C105/10 between SCS Corporation and AGR Peak Well Management Limited for Provision of Well Construction Management Services, including LOGIC General Conditions as Appendix I (13) |
|
|
|
|
|
10.26 |
|
Employment Agreement between Hyperdynamics and Paul C. Reinbolt effective August 8, 2011 (24) |
|
|
|
|
|
14.1 |
|
Code of Ethics (1) |
|
|
|
|
|
21.1** |
|
List of Subsidiaries |
|
|
|
|
|
23.1** |
|
Consent of Independent Registered Public Accounting Firm–Deloitte & Touche LLP |
|
|
|
|
|
23.2** |
|
Consent of Independent Registered Public Accounting Firm–GBH CPAs PC |
|
|
|
|
|
31.1** |
|
Certification of Chief Executive Officer of Hyperdynamics Corporation required by Rule 13a-14(a) of the Securities Exchange Act of 1934, as adopted pursuant to Section 302 of the Sarbanes-Oxley Act of 2002 |
|
|
|
|
|
31.2** |
|
Certification of Chief Financial Officer of Hyperdynamics Corporation required by Rule 13a-14(a) of the Securities Exchange Act of 1934, as adopted pursuant to Section 302 of the Sarbanes-Oxley Act of 2002 |
|
|
|
|
|
32.1** |
|
Certification of Chief Executive Officer of Hyperdynamics Corporation pursuant to Section 906 of the Sarbanes-Oxley Act of 2002 and Section 1350 of Chapter 63 of Title 18 of the United States Code (18 U.S.C. 1350) |
|
|
|
|
|
32.2** |
|
Certification of Principal Financial Officer of Hyperdynamics Corporation pursuant to Section 906 of the Sarbanes-Oxley Act of 2002 and Section 1350 of Chapter 63 of Title 18 of the United States Code (18 U.S.C. 1350) |
|
* |
Management contracts or compensatory plans or arrangements. |
|
** |
Filed herewith. |
|
(1) |
Incorporated by reference to Form 10-KSB/A filed May 16, 2005. |
|
(2) |
Incorporated by reference to Schedule 14A filed January 11, 2011 and filed herewith. |
|
(3) |
Incorporated by reference to Form S-1 filed January 12, 2006, as amended. |
|
(4) |
Incorporated by reference to Form 8-K filed June 18, 2007. |
|
(5) |
Incorporated by reference to Form 8-K filed June 15, 2001. |
|
(6) |
Incorporated by reference to Form 8-K filed September 28, 2006. |
|
(7) |
Incorporated by reference to Form 8-K filed September 15, 2009. |
|
(8) |
Incorporated by reference to Form 8-K filed July 6, 2009. |
|
(9) |
Incorporated by reference to Form 8-K filed July 23, 2009. |
|
(10) |
Incorporated by reference to Form S-8 filed June 14, 2010. |
|
(11) |
Incorporated by reference to Form 8-K, dated March 31, 2010. |
|
(12) |
Incorporated by reference to Form 8-K, filed December 7, 2009. |
|
(13) |
Incorporated by reference to Form 8-K filed December 6, 2010. |
|
(14) |
Intentionally omitted. |
|
(15) |
Incorporated by reference to Form 8-K, dated December 11, 2009. |
|
(16) |
Incorporated by reference to Form 8-K, dated January 29, 2010. |
|
(17) |
Incorporated by reference to Form 8-K, dated January 6, 2010. |
|
(18) |
Incorporated by reference to Form 8-K filed October 2, 2009. |
|
(19) |
Intentionally Omitted. |
|
(20) |
Incorporated by reference to Form 8-K filed on October 16, 2009. |
|
(21) |
Incorporated by reference to Form 10-K filed on September 28, 2010. |
|
(22) |
Incorporated by reference to Form 8-K filed on November 4, 2010. |
|
(23) |
Incorporated by reference to Form 8-K filed on August 24, 2011. |
|
(24) |
Incorporated by reference to Form 8-K filed on July 8, 2011. |