Attached files
| file | filename |
|---|---|
| 8-K - FORM 8-K - UNITED AIRLINES, INC. | d231262d8k.htm |
 Deutsche Bank Airline
Equity Conference
United Continental
Holdings, Inc.
September 13, 2011
Exhibit 99.1 |
 Jeff
Smisek President & Chief Executive Officer
United Continental Holdings, Inc. |
| Safe
Harbor Statement 3
3
Certain statements included in this presentation are forward-looking and thus reflect our current
expectations and beliefs with respect to certain current and future events and financial
performance. Such forward-looking statements are and will be subject to many risks and
uncertainties relating to our operations and business environment that may cause actual results to differ materially
from any future results expressed or implied in such forward-looking statements. Words such as
“expects,” “will,” “plans,” “anticipates,”
“indicates,” “believes,” “forecast,” “guidance,” “outlook” and similar expressions are intended to identify forward-
looking statements. Additionally, forward-looking statements include statements which do not
relate solely to historical facts, such as statements which identify uncertainties or trends,
discuss the possible future effects of current known trends or uncertainties, or which indicate
that the future effects of known trends or uncertainties cannot be predicted, guaranteed or
assured. All forward-looking statements in this presentation are based upon information available to
us on the date of this presentation. We undertake no obligation to publicly update or revise any
forward-looking statement, whether as a result of new information, future events, changed
circumstances or otherwise, except as required by applicable law. Our actual results could differ
materially from these forward-looking statements due to numerous factors including, without limitation, the following: our
ability to comply with the terms of our various financing arrangements; the costs and availability of
financing; our ability to maintain adequate liquidity; our ability to execute our operational
plans; our ability to control our costs, including realizing benefits from our resource
optimization efforts, cost reduction initiatives and fleet replacement programs; our ability to utilize our
net operating losses; our ability to attract and retain customers; demand for transportation in the
markets in which we operate; an outbreak of a disease that affects travel demand or travel
behavior; demand for travel and the impact that global economic conditions have on customer
travel patterns; excessive taxation and the inability to offset future taxable income; general economic
conditions (including interest rates, foreign currency exchange rates, investment or credit market
conditions, crude oil prices, costs of aviation fuel and energy refining capacity in relevant
markets); our ability to cost-effectively hedge against increases in the price of aviation
fuel; any potential realized or unrealized gains or losses related to fuel or currency hedging programs; the
effects of any hostilities, act of war or terrorist attack; the ability of other air carriers with whom
we have alliances or partnerships to provide the services contemplated by the respective
arrangements with such carriers; the costs and availability of aviation and other insurance; the
costs associated with security measures and practices; industry consolidation or changes in airline alliances;
competitive pressures on pricing and on demand; our capacity decisions and the capacity decisions of our
competitors; U.S. or foreign governmental legislation, regulation and other actions (including
open skies agreements); labor costs; our ability to maintain satisfactory labor relations and the
results of the collective bargaining agreement process with our union groups; any disruptions to
operations due to any potential actions by our labor groups; weather conditions; the possibility that expected
merger synergies will not be realized or will not be realized within the expected time period; and other
risks and uncertainties set forth under Item 1A., Risk Factors of the Company’s Annual
Report on Form 10-K, as well as other risks and uncertainties set forth from time to time in
the reports we file with the SEC. Consequently, forward-looking statements should not be regarded as
representations or warranties by us that such matters will be realized. |
 Building the world’s leading airline
Driving towards sufficient, sustained profitability
4
•
Global network
•
Industry leading financials
•
Capacity discipline
•
Product investment
•
Integration
•
Working together |
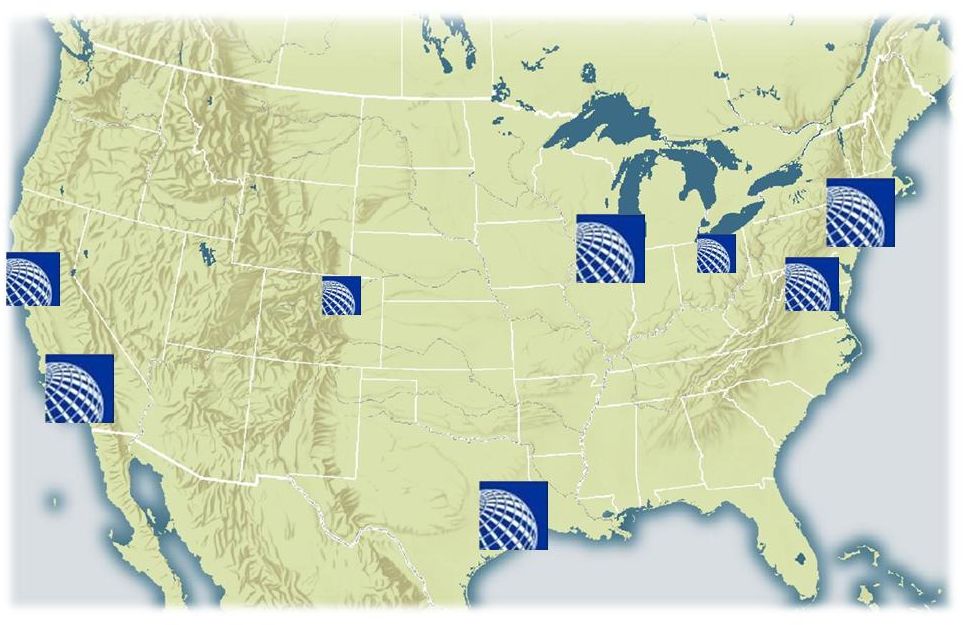 Hubs
in 4 largest U.S. cities Source: U.S. Census Bureau
|
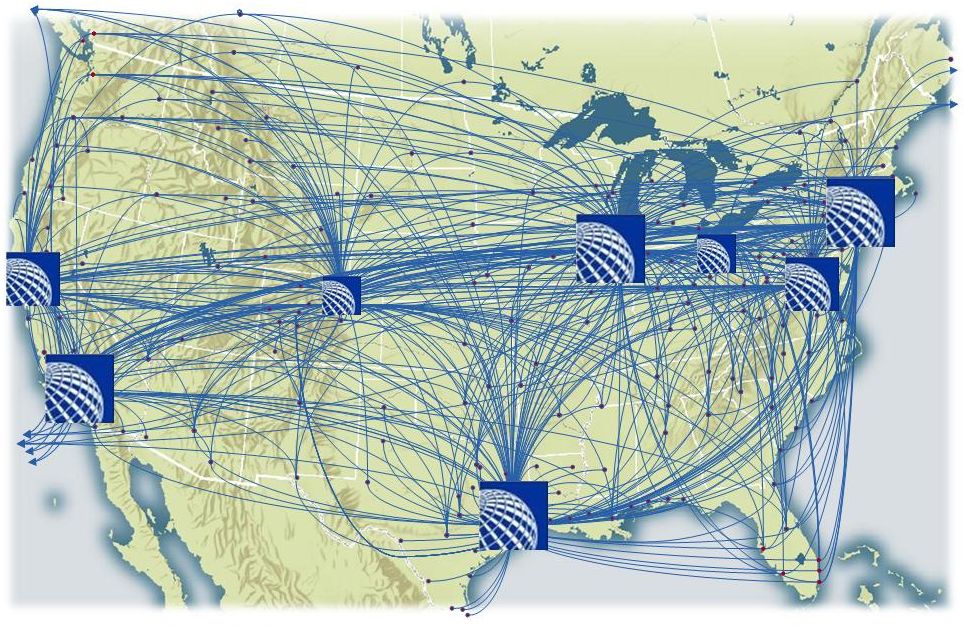 Serving the most destinations in the U.S. |
 Merger
created global network with unsurpassed scope |
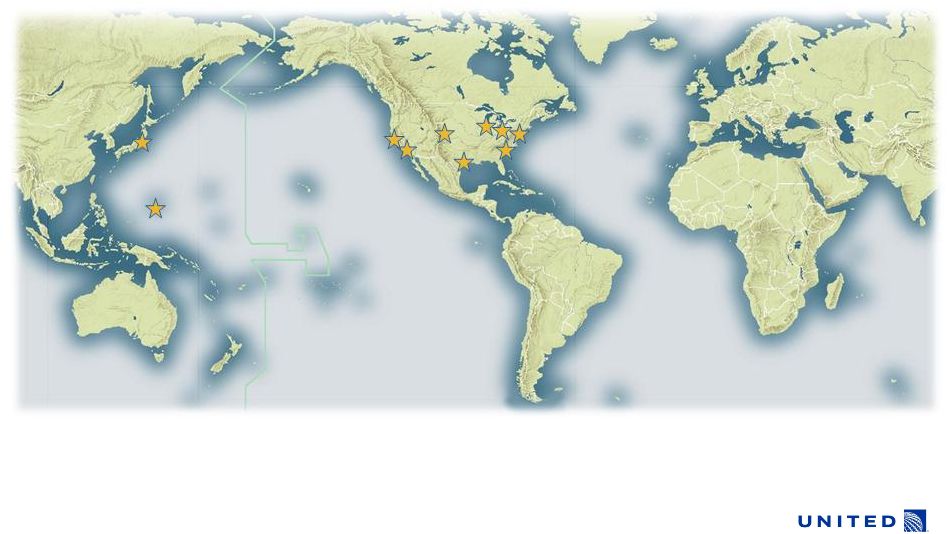
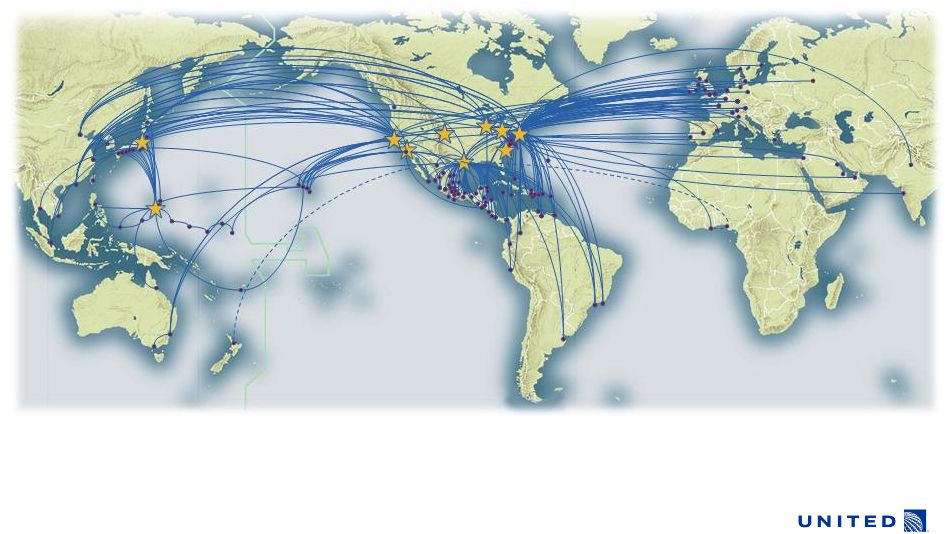 Merger
created global network with unsurpassed scope |
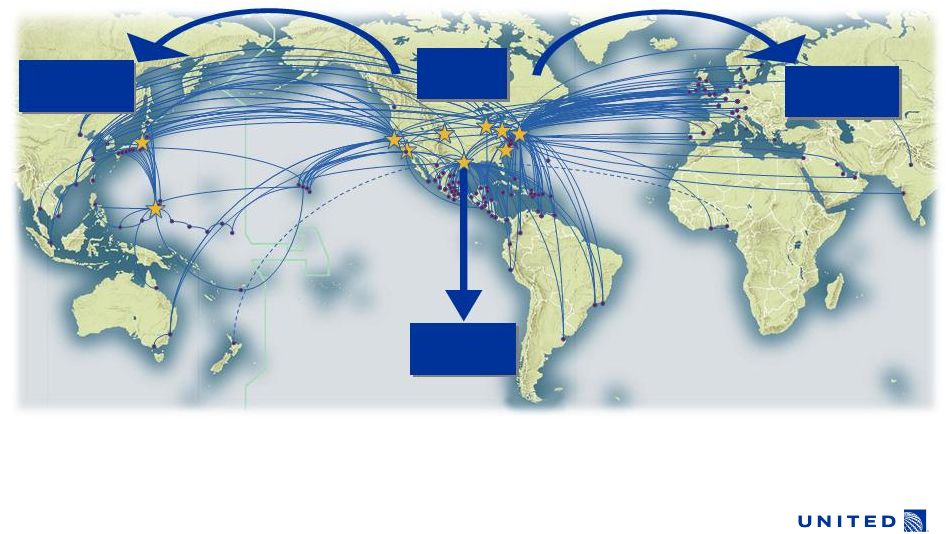 Serving the right markets, with the right assets
#1 across the
Pacific
#2 to Latin
America
#1 in US /
Canada
Rankings by ASMs as of TME 4Q10
Source: Earnings releases and SEC filings.
#2 across the
Atlantic |
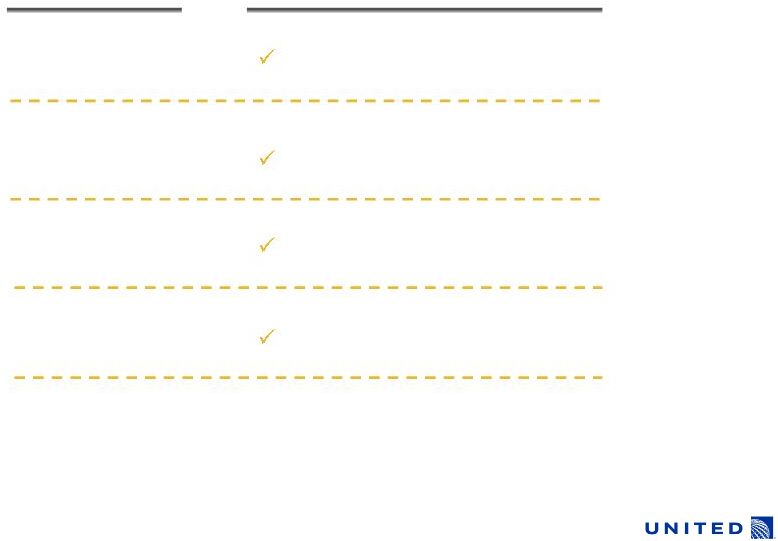 United is generating industry leading results
10
Leads network carriers
Revenue
Leads network carriers
Pre-tax
Margin
Leads network carriers
Liquidity
Exceeded cost of capital
ROIC
Metric
Result
Period: TME 2Q 2011
Industry defined as U.S. global carriers |
 United
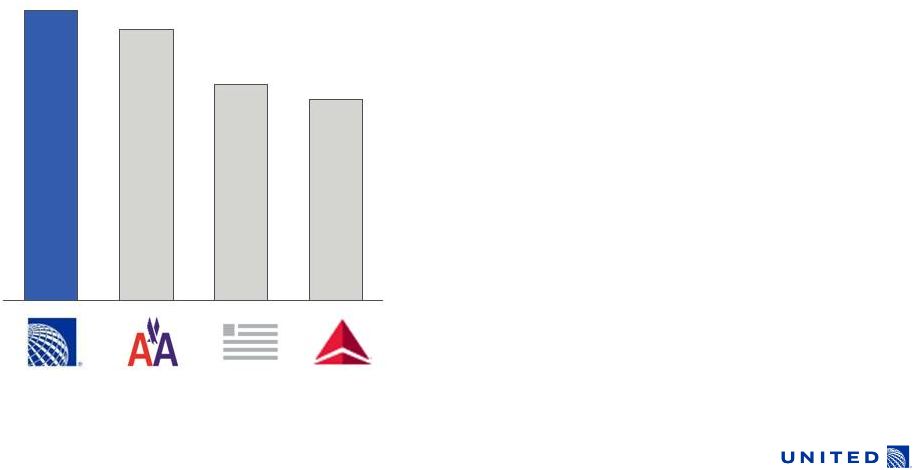
leads U.S. network carriers in unit revenue and margin Pre-tax
Margin 2
(TME 2Q 2011)
1. Consolidated PRASM numbers for carriers other than UAL adjusted for length of
haul versus UAL’s length of haul 2. Excludes special, one-time items
and non-cash MTM hedge gains/losses. See non-GAAP reconciliation in Appendix A; UAL results prior
to 4Q 2010 pro forma.
Source: Earnings releases and SEC filings.
-2.8%
2.1%
3.2%
4.2%
Unit Passenger Revenue
1
Growth
(TME 2Q 2011)
9.7%
8.1%
6.8%
12.4%
11 |
 Committed to strengthening the balance sheet
1.
Net debt includes capitalized operating leases.
Note: Change in Debt, Capital Leases for the period 10/1/2010 through 6/30/2011;
Debt and Capital Lease prepayments for the period 10/1/2010 through
7/21/2011. Source: Earnings releases and SEC filings.
Liquidity as % of Revenue
(TME 2Q 2011)
16.7%
17.9%
22.4%
24.0%
Since closing the merger on Oct. 1, 2010:
•
Made $2.4B of debt and capital lease
payments
•
Prepaid more than $480M of debt
12
•
$1.8B of unencumbered assets, half
of which are §1110 aircraft •
$1.5B of scheduled debt payments
in 2012
|
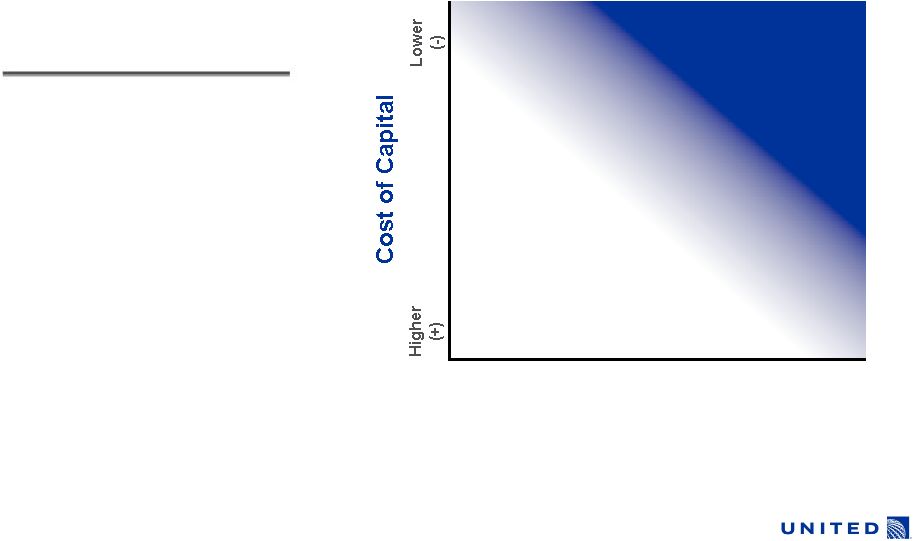 Focused on generating returns that exceed our cost of
capital over the business cycle
Return on Invested Capital
Lower
(-)
Higher
(+)
Economic
Value Added
UAL
2010
UAL
2007
UAL
2006-2010
UAL
TME 2Q11
Fleet
Strategy
Network / Route
Analysis
ROIC imbedded in
business decisions
Product
Investment
13 |
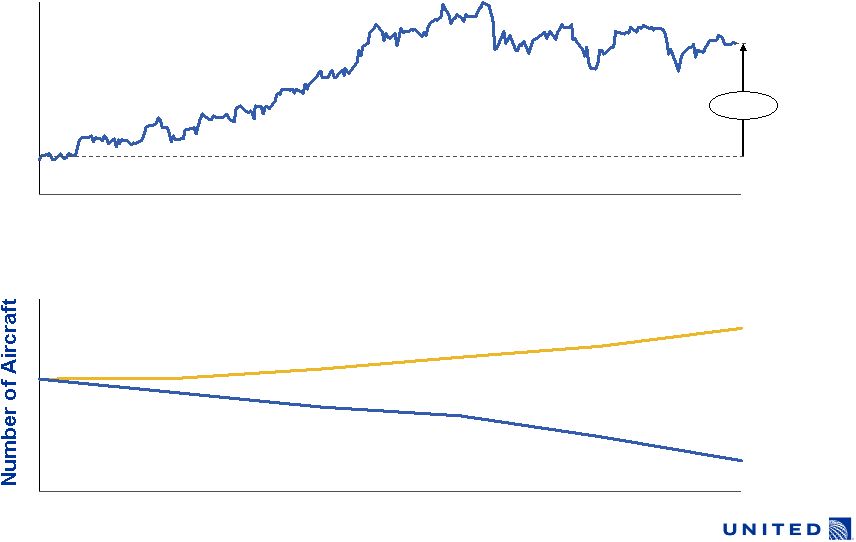 Flexible fleet permits adjustments for fuel prices
14
Mainline Fleet Flexibility
Maximum
Retirements
Maximum
Options
2010
2015E
Jet-A Fuel Prices LTM
~45%
Sept.
2010
Sept.
2011 |
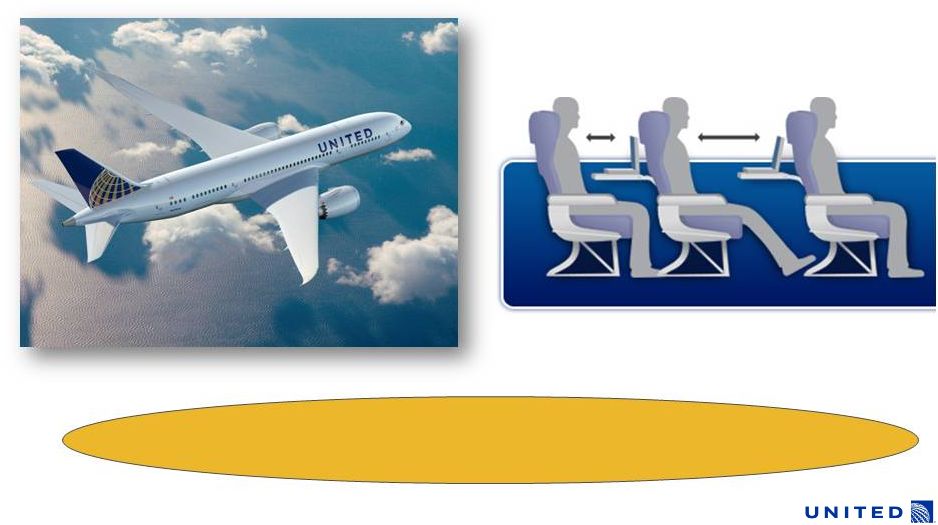 Expect 2012 consolidated capacity to be flat
Reduce domestic capacity while growing international with delivery of 6
B787 Dreamliners
Expect to take delivery of 25 new, fuel efficient aircraft in 2012
19 B737-900ER & 6 B787
15
Installing EconomyPlus on Continental
Aircraft in 2012
Up to 5 more inches of space in coach |
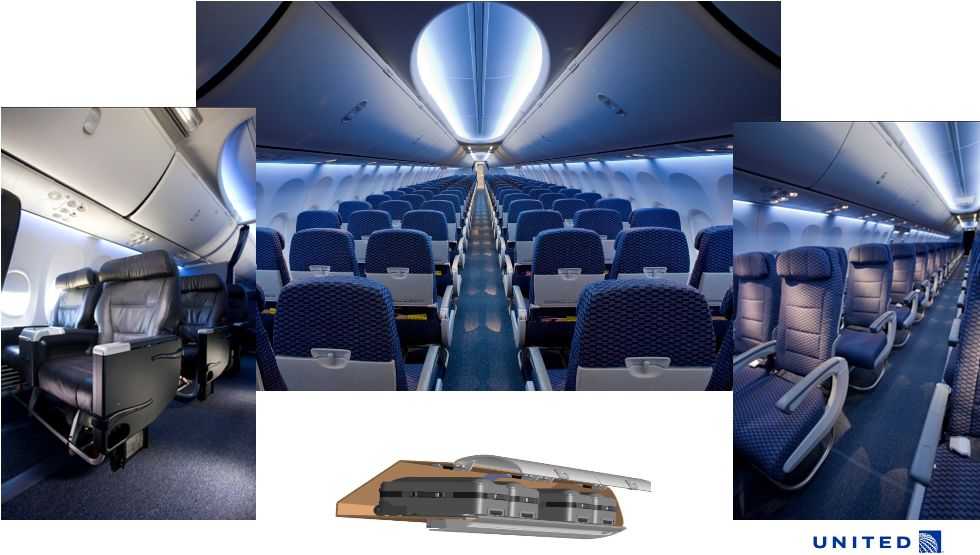 Refreshing aircraft interiors…
Boeing Sky Interior
Nearly doubling capacity of Airbus
overhead bins
16 |
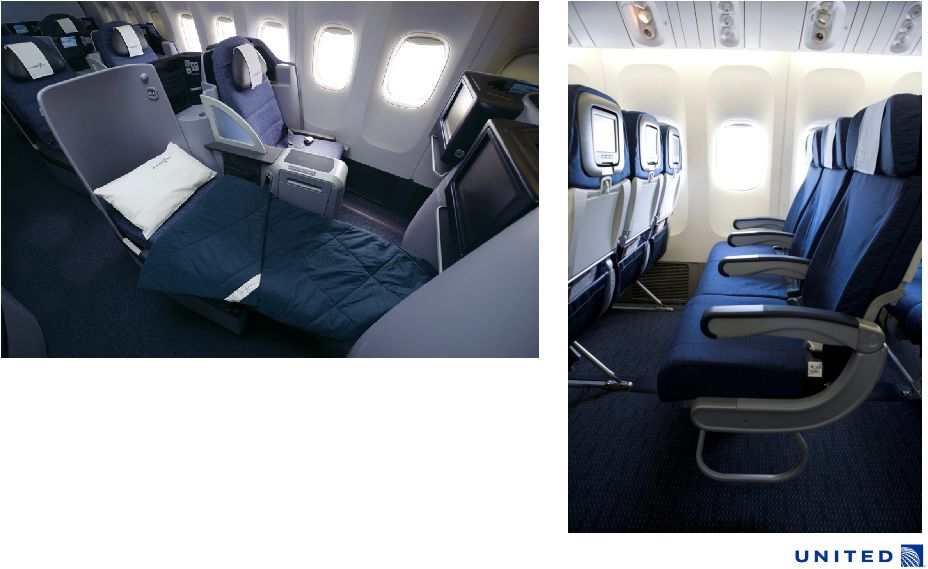 …investing in better seats…
17
•
Flat bed seats in international premium cabins
•
Full refresh of p.s. transcontinental fleet
•
Expanding EconomyPlus to Continental fleet |
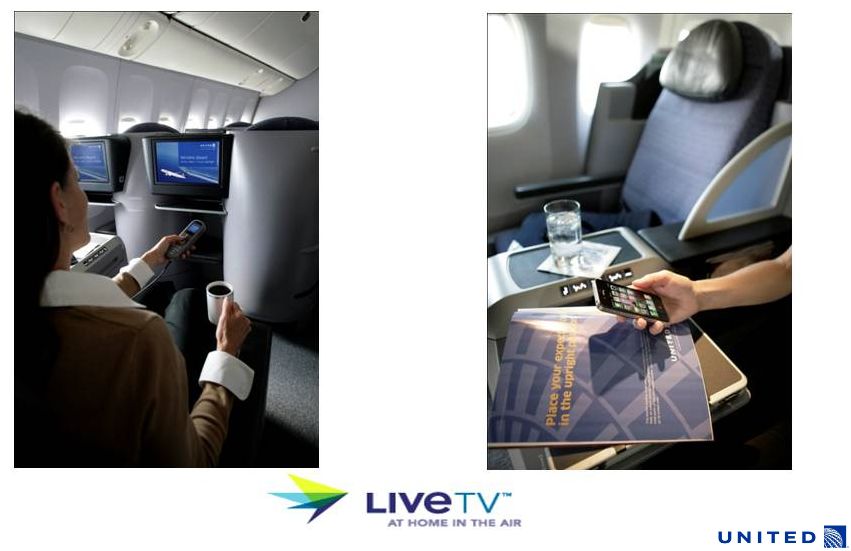 …redefining United’s inflight entertainment experience.
18
WiFi & Wireless Streaming Video
In seat entertainment |
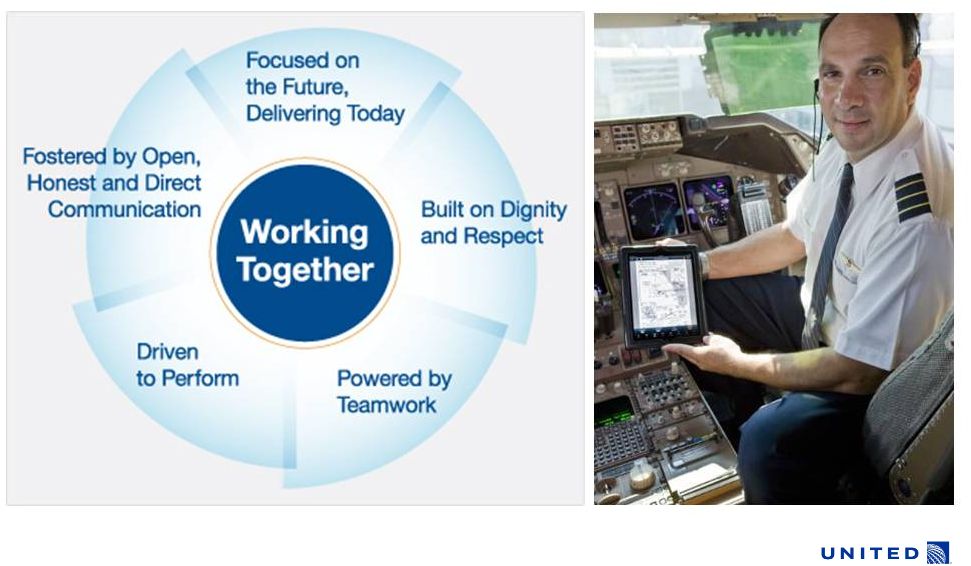 Working Together
19 |
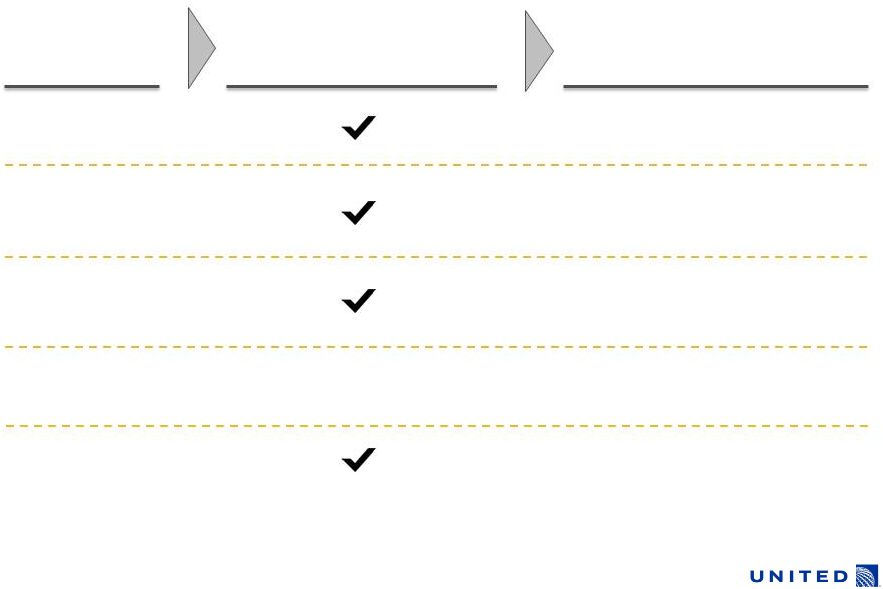 20
Working Together
Work
Group
Flight
Attendants
Mechanics
Passenger
Service Agents
Determine Union
Representation
Bargaining
Pilots
Ramp Agents
In joint negotiations
Election not yet
requested by IAM
S-CO: No bargaining required
S-UA: In negotiations
S-CO: Agreement
S-UA: In negotiations
S-CO: Agreement
S-UA: In negotiations
S-CO: Agreement
S-UA: In negotiations
Joint negotiations upcoming
Joint negotiations upcoming
Joint negotiations upcoming |
 21
Merger progressing
On track to achieve 25% of synergies in 2011
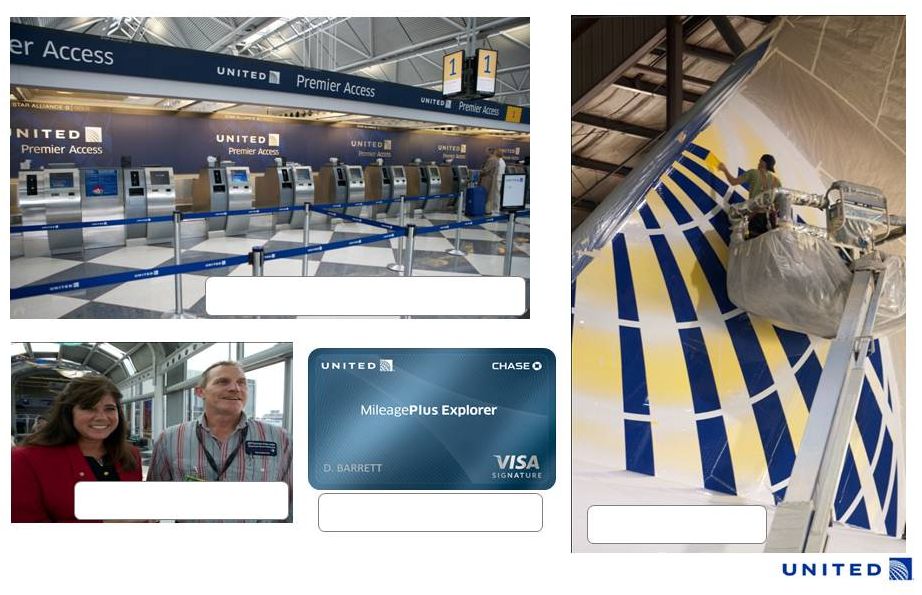
Co-branded Credit Card
Management Team
New Livery
Airport Co-location & Branding |
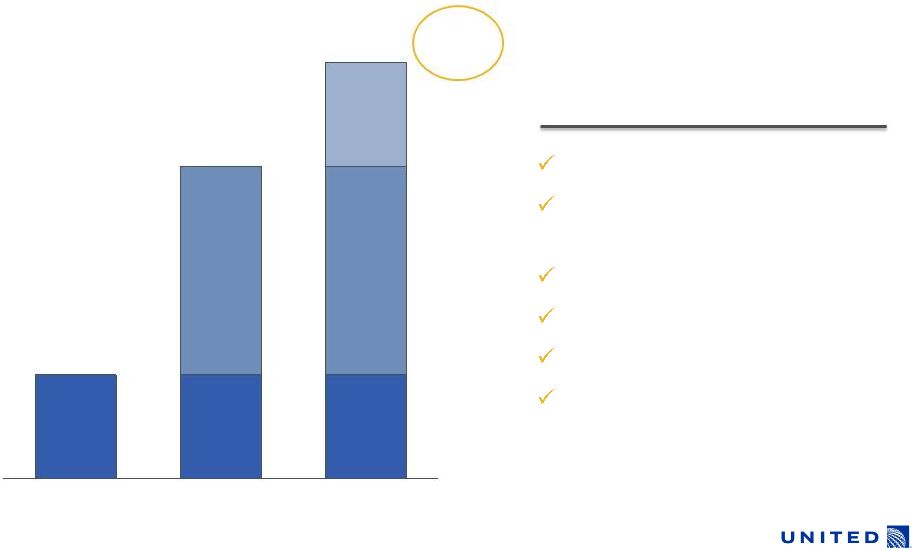 Have
captured more than $130M in synergies year-to-date On
track
to
achieve
25%
of
$1.0
–
1.2B
run
rate
synergies
in
2011
2011 Integration Success
$1.0B -
1.2B
Cross-fleeting
Completed 1/3 of airport co-
locations system-wide
Insurance
Prescription benefits
In-flight magazine
Rebranded hubs: ORD, SFO,
CLE, DEN
75%
100%
2011
2012
2013
25%
22 |
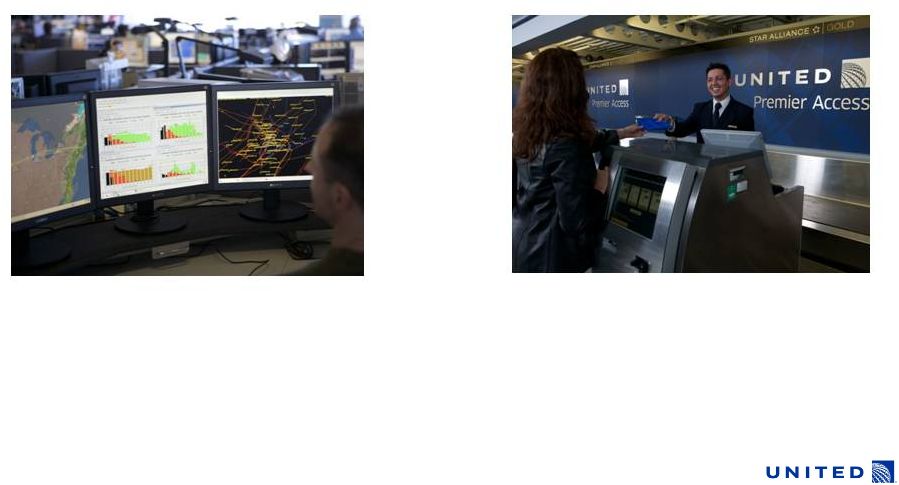 23
2012 synergy capture enabled by integration and technology
FAA Certification:
Single Operating Certificate
Technology:
Passenger Service System
Expected by year-end 2011
Expected first quarter 2012
Enables:
Enables:
•
Marketing and selling all flights
with single code
•
Joint operations once JCBAs
in place
•
Common check-in process •
Aircraft and gate optimization •
Selling ancillary products •
Single loyalty
program |
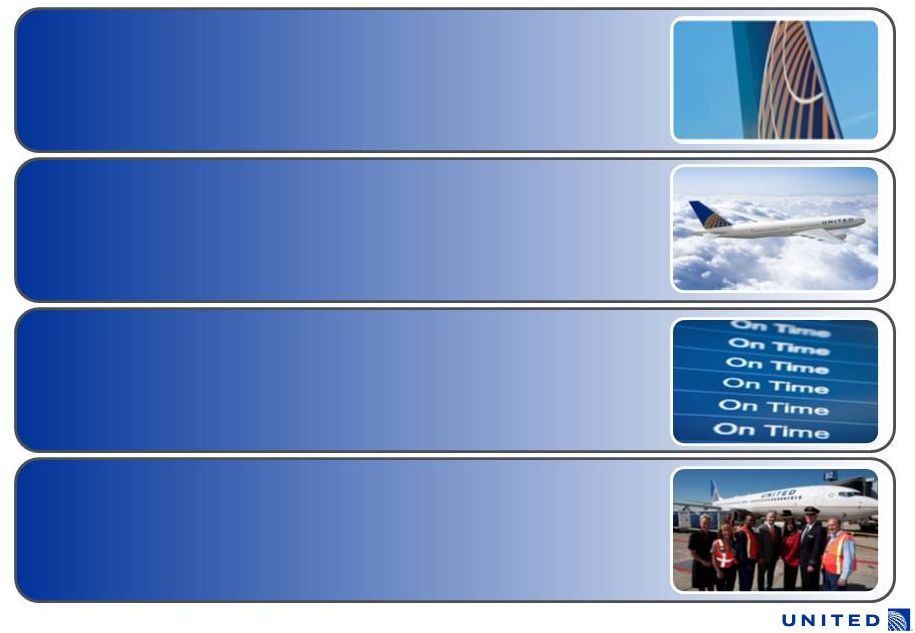 United –
the world’s leading airline
24
Fly to Win
Make Reliability a Reality
Working Together
Fund the Future |
 United Continental Holdings, Inc. |
 26
Appendix A
Non-GAAP Financial Reconciliation
Note: UAL 3Q 2010 results pro forma.
Twelve Months Ended
(In $M)
6/30/2011
Pre-tax Margin
Earnings / (Loss) before income taxes
$857
Add: Special items
645
Adjusted pre-tax Income (Loss)
$1,502
Total operating revenue
$35,829
Less: Special Items
(107)
Adjusted total operating revenue
$35,722
Adjusted pre-tax margin
4.2% |